Embed Size (px)
Citation preview

';'; -' " DPYELECTRICAL/MECHANICAL
RESEARCH PROGRAM
TECHNICAL REPORT HL-90-1
FORMED SUCTION INTAKE APPROACHAPPURTENANCE GEOMETRY
L by
B. P. Fletcher0
Hydraulics Laboratory
DEPARTMENT OF THE ARMYWaterways Experiment Station, Corps of Engineers
C) 3909 Halls Ferry Road, Vicksburg, Mississippi 39180-6199
4w".
February 1990Final Report
Approved For Public Release, Distribution Unlimited
"HYL)HAULICSH k SPrepared tor DEPARTMENT OF It-; ARMY
US Army Corps of EngineersWashington, DC 20314-1000
LABORATORY Under WoM it N0c 16*tJ~d ., W it N,' 31'-1 .-

Dezjt'sy , is report w no coanger nee.ded. Do not rtrt to) the: or ginator.
The findorgs ia this report are not to be construed as an official
De pattrtent of the Army vpost n7n Lniess so desirntediby other authorrzed documents.
The! contents of this repotrt art- not to he used fur
ad ~s'fl9 )! WCatiOn, or promotional purposes.C;oat air of trade, riraflrrr does rot onlstrtter an'If C:,i cr nctrlnrsement ofr approval of the uise of
stjh Conrrr ci' P odfucts.
Unclassi fied
SECURITY CL.ASSI FICA 7iON- OF Th-S PAGi
Fon,, AisprovedREPORT DOCUMENTATION PAGE Ome N. 07" 18
Ia. REPORT SECURITY CLASSIFICATION lb. RESTRICTIVE MARKINGSunc lass ifijed
2a. SECURITY CLASSIFICATION AUTHORITY 3. DISTRIBUTION /AVAILABILITY OF REPORT
2b. DECL.ASSIFICATION /DOWNGRADING SCHEDULE Approved for public release;distribution unlimited.
4. PERFORMING ORGANIZATION REPORT NUMBER(S) 5. MONITORING ORGANIZATION REPORT NUMBER(S)
Technical Report HL-90-16a. NAME OF PERFORMING ORGANIZATION 6b. OFFICE SYMBOL 7a. NAME OF MONITORING ORGANIZATION
IUSAE.'ES, HydraulicS (if appiecable)
Labo rat or v I ________________________
F,:. AOORFSS (City, a r.a !', 7b. ADDRESS (City, State, and ZIP Code)
Ba, NAA-E OF FUNDINGiSPONSORING 8b. OFFICE SYMBO0L 9. PROCUREMENT INSTRUMENT IDENTIFICATION NUMBERORGANIZATION (if applicable)
8c. ADORESS (City, State, a ZIP Code) 10. SOURCE OF FUNDING NUMBERS ~RpcPROGRAM PROJECT ITASK IWORK UNIT
Washington, DC 20314-1000 ELMN NO1O ACCESSION NO.
11. TITLE (Include Socurity Classncationj
f'ormed Suction Intake Approach Appurtenance Geometry12. PERSONAL AUTHOR(S)
Fletcher, B. P.13&. TYPE OF REPORT 13b. TIME COVERED 14. DATE OF REPORT (Yeaj.A4WuntdY) JIS. PAGE COUNT
Final report FROMM4 19TO~~bj98 February 1990 45___16. SUPPLEMENTARY NOTATION
Available from National Technical Information Service, 5285 Port. Royal Road, Springfield,VA 22161.
17 COSATI CODES M8 SUBJECT TERMS (Continue on reverse it necessary andy identity by block number)'iELD GROUP SUB-ROUP -,Approach flow, Sump-
Pump bay, Vortices. ,
Pump intake ' (
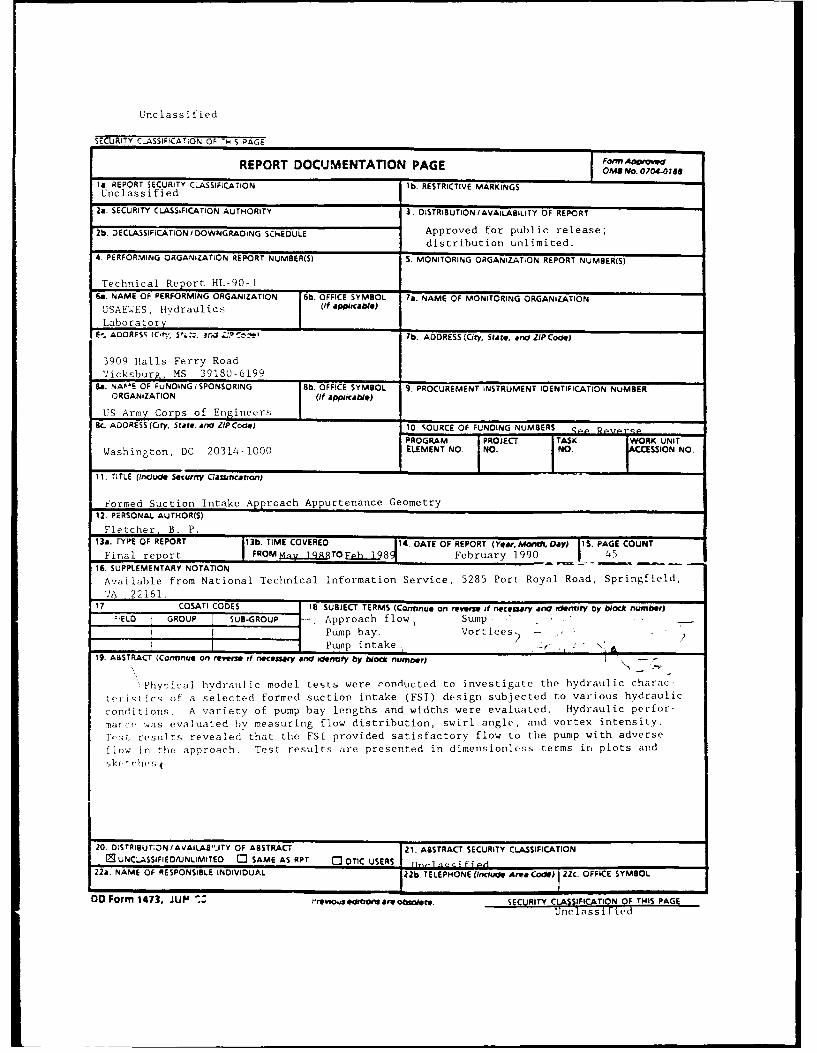
19. ABSTRACT (Cotmnu* on reverse it necessary and ioentity by block numb.,)
~Phy, ical hydraul ic model tests were conducted to investigate the hydraulic charac-t~r~iso eetdfre uto nae(FSI) design subjected to various hydraulic
conditions. A variety of pump bay lengths and widths were evaluated. Hydraulic perfor-
mar-:e wais evaluated by measuring flow distribution, swirl angle, and vortex intensity.Trns results revealed that the FSI provided satisfactory flow to the pump with adversefiow in the approach. Test results are presonted in dimensionless terms it! plots and
skc- chf s(
20. DISTRIBUT;C)N/AIIAILAB'IJTY OF ABSTRACT 21. ABSTRACT SECURITY CLASSIFICATION0 UNCLASSIFIEDIU.NLIMItTED 03 SAME AS RPT C3 DTIC USERS I- iP
22a. NAME OF RESPONSIBLE INDIVIDUAL 22b. TELEPHONE (Inclufe Area Code) 22C. OFFICE SYMBOL
OD Form 1473, JUPJ lrevto.s eimonae obsolete. SECURITY CLASIFICA TION OF THIS PAGE
Inc rassIfI d

Unclassified,ECURITY r'AS,jCAT:0N Op~l 7'&7
10. WORK UNIT ACCESSION NO. (Continued).
Funding provided by the Electrical/Mechanical research progrPm Work Unit No. 31166,sponsored by the Headquarters, US Army Corps of Engineers.
UnclassifiedhEcu ir CLASiIFIcArION pF T ,i PAGE

PREFACE
The mudel investigation reported herein was authorized under the
Electrical/Mechanical research program sponsored by the Headquarters, US Army
Corps of Engineers (USACE), under Work Unit No. 31166, "Pump Station Inflow-
Discharge Hydraulics." Messrs. Mohan Singh and Bob Pletka were USACE
Technical Monitors.
The study was conducted during the period May 1988 to February 1989 in
the US Army Engineer Watcrways Experiment Station (WES) Hydraulics Laboratory
(HL) under the direction of Messrs. F. A. Herrmann, Jr., Chief, HL, and R. A.
Sager, Assistant Chief, HL, and under the general supervision of Messrs. G. A.
Pickering, Chief, Structures Division, and N. R. Oswalt, Chief, Spillways and
Channels Branch. Technical instrumentation support was provided by Messrs. H.
Greer, J. Ables, and A. Morton of the Instrimentation Services Division, WES.
The project engineer for the study was Mr. B. P. Fletcher, assisted by Messrs.
R. B. Bryant and J. R. Rucker, Jr., all of the Spillways and Channels Branch.
This report was prepared by Mr. Fletcher.
During the course of the study, Messrs. Singh, Pletka, and S. Powell of
USACE; L. Holman and J. McCormick of the US Army Engineer Division (USAED),
Lower Mississippi Valley/Mississippi Piver Commission; C. Thomas of USAED,
Ohio River; J. Luther of USAED, St. Louis, and B. Moentenich of USAED, North
Pacific, participated as advisory board members and visited WES to discuss the
program and results of the investigation.
Commander and Director of WES during preparation of this report was
COL Larry B. Fulton, EN. Technical Director was Dr. Robert W. Whalin.
11 :-C i1;
AU1
.5.

CONTENTS
Page
PREFACE .................................................................... 1
CONVERSION FACTORS, NON-SI TO SI (METRIC) UNITS OF MEASUREMENT ......... 3
Part I: INTRODUCTION ................................................... 4
Background .......................................................Purpose and Scope of Research ........................................ 4
Part II: MODEL AND EVALUATION PROCEDURES ................................. 5
Test Facilities ....................................................... 5Evaluation Techniques ............................................... 7
Typical Test .......................................................... 8
Part III: TESTS AND RESULTS .............................................. 10
Effects of Vortices on Flow Distribution ........................... 10
Effects of Submergence on Flow Distribution ...................... 10
Approach Flow from 0, 45, and 90 Degrees ........................... 11
Part IV: RESULTS AND DISCUSSION ......................................... 13
Tables 1-3
Plates 1-23
2

CONVERSION FACTORS, NON-SI TO SI (METRIC)UNITS OF MEASUREMENT
Non-SI units of measurement used in this report can be converted to SI
(metric) units as follows:
Multiply By To Obtain
degrees (angle) 0.01745329 radians
feet 0.3048 metres
inches 2.54 centimetres
3

FORMED SUCTION INTAKE APPROACH APPURTENANCE GEOMETRY
PART I: INTRODUCTION
Background
1. This research is an extension of tests conducted in the s;ite-
specific model of the sump for the Yazoo Backwater Pumping Station.* In the
model of the Yazoo pumping station sump a selected formed suction intake (FSI)
design was investigated. The investigation indicated that the FSI design
would provide satisfactory hydraulic performance for all anticipated flow
conditions.
2. The research presented herein was initiated following numerous re-
quests for guidance on how the appurtenance geometry (pump bay width and/or
length) to the FSI could be varied relative to the direction of flow approach-
ing a pumping station sump, discharge, and submergence.
Purpose and Scope of Research
3. The purpose of this research was to develop criteria needed for the
design of the pump bay width and length relative to direction of approach
flow, discharge, and submergence. The objective of the tests was accomplished
by investigating each of the five variables independently by holding four
variables constant while varying one until adverse hydraulic performance
occurred.
4. The study was conducted in a flume that permitted simulation of
various hydraulic conditions and pump bay geometries. The limiting values
were determined by flow distribution and stability in the pump intake and the
intensity of surface vortices.
Bobby P. Fletcher. "Yazoo Backwater Pumping Station Sump, West-Central
Mississippi; Hydraulic Model Investigation" (in preparation), US ArmyEngineer Waterways Experiment Station, Vicksburg, MS.
4

PART I: MODEL AND EVALUATION PROCEDURES
Test Facilities
5. The investigation was conducted in a flune 45 ft* long, 35 ft wid,-,
and 4 ft deep. A sketch of the test facility including the location of tle
FSI is shown in Figure 1. A sketch and a photograph of the FSI used ini tA
tests are shown ini Plate 1 and Figure 2, respectively. The dimensiozs of
FSI, discharge, submergence, pump bay width, and pup bay length, are p,
s~i~ed in the plates in terms of the throat (ptunp column) diameter d IL.
muiax:rlmun discharge Q simulated in the model was equivalent to a diimuii- ioii-
less value Q/ igd 5 of 2.9, where g is the acceleration due to gr-avit,'.
Flow through the FSI was provided by centrifugal pumps. A weir was con-
structed across the upstream end of the flume to provide evenly distributed
40'
POCK BAFFLE
31r
A _-_ - - -f __S _A
PLAN
VALVE PUMPS A FLOWMETERm' ~ 0= tj,.-- n. mo.."' el.- --W I- 0 4_.,a- 'IT---
SECTION A-A
Figure 1. FSI study flume
* A table of factors for converting non-SI units of measurement to SI
(metric) units is presented on page 3.
5

IMPACT TUBES impact tubes
Figure 2. FSI with impact tubes
return flow from the pumps. An 8-in. rock baffle wall was constructed across
the flume to baffle the return flow. The wooden flume was designed to facil-
itate simulation of various approach flow geometries. The sump sidewalls,
FSI, and pump column were constructed of transparent plastic to permit ob-
servation of subsurface currents and turbulence. Water used in the operation
of the model was supplied by pumps, and discharges were measured by means of
magnetic flowmeters. Steel rails set to grade provided reference planes for
measuring devices. Wacer-surface elevations were obtained by staff gages.
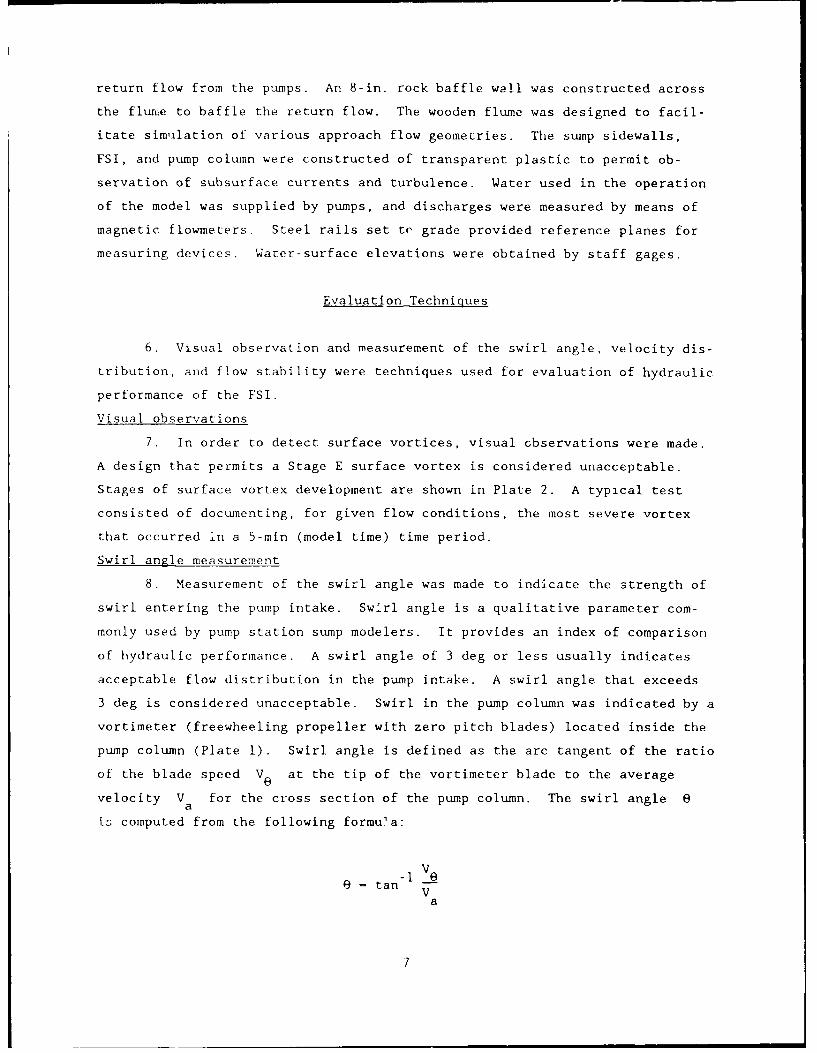
Evaluation Techniques
6. Visual observation and measurement of the swirl angle, velocity dis-
tribution, and flow stability were techniques used for evaluation of hydraulic
performance of the FSI.
Visual observations
7. In order to detect surface vortices, visual observations were made.
A design that permits a Stage E surface vortex is considered unacceptable.
Stages of surface vortex development are shown in Plate 2. A typical test
consisted of documenting, for given flow conditions, the most severe vortex
that occurred in a 5-min (model time) time period.
Swirl angle measurement
8. Measurement of the swirl angle was made to indicate the strength of
swirl entering the pump intake. Swirl angle is a qualitative parameter com-
monly used by pump station sump modelers. It provides an index of comparison
of hydraulic performance. A swirl angle of 3 deg or less usually indicates
acceptable flow distribution in the pump intake. A swirl angle that exceeds
3 deg is considered unacceptable. Swirl in the pump column was indicated by a
vortimeter (freewheeling propeller with zero pitch blades) located inside the
pump column (Plate 1). Swirl angle is defined as the arc tangent of the ratio
of the blade speed V at the tip of the vortimeter blade to the average
velocity V for the cross section of the pump column. The swirl angle ea
is computed from the following formu'a:
E tan -V
a

where
V8 - dn
V - d
a A
and
n - revolutions per second of the vortimeter
Q - pump discharge, cfs
A - cross-sectional area of the pump colLn, ft2
Velocity and flow measurement
9. Velocity distribution and flow stability in the pump column were
measured by impact tubes located as shown in Plate 1. A deviation in the
ratio of the average measured velocity at a point to the average computed
velocity in the cross section of 10 percent or greater was considered unaccep-
table. Four piezometers were located around the periphery of the pump column
(Plate 1) to measure an average static pressure at this location. Impact
tubes (copper tubes with 1/8-in. ID) were installed with their tips in the
same plane as the four piezometers to measure the total pressure at 25 various
points (Plate 3 and Figure 2) in the pump column. The head differential
between the total pressure at each point in tha pump column and the average
static pressure provides a velocity at each point in the pump column. This
was measured by means of 25 individual electronic pressure differential cells.
The differential cells were connected to a data acquisition system capable of
collecting data for various lengths of time and sampling at various rates.
The data acquisition system was also capable of analyzing the data and
providing the deviation ir. velocity ratio for each probe in the same time
frame that the maximum instantaneous velocity ratio deviation for any single
probe occurred. The magnitude of the maximum velocity deviation that should
be considered unacceptable has not been established.
Typical Test
10. A typical test to measure velocity distribution in the pump column
consisted of stabilizing the water-surface elevation and discharge through the
8

pump prior to collecting data. Data were collected for 1 min (model time),
and each of the 25 differential pressure cells was sampled at a rate of 100
samples per second. The average and maximum velocities detected by each of
the differential cells during the minute of data collection were divided by
the theoretical average velocity in the cross section. The ratio (measured/
computed) of the average velocities and ratio (measured/computed) of the
velocities at all points that occurred in the same time frame of the maximum
velocity deviation ratio anywhere in the cross section were tabulated and
plotted by a computer as contour lines of equal velocity ratios. The ratio of
the average velocities and the ratio of the velocities that occurred in the
same time frame of the maximum velocity deviation were used as parameters for
evaluating flow conditions, because the average velocity was an indicator of
flow distribution and the maximum velocity ratio deviation was sensitive to a
change in flow distribution and stability.
9

PART III: TESTS AND RESULTS
Effects of Vortices on Flow Distribution
11. Initial tests were conducted to determine how the velocity distri-
bution in the pump intake is affected by surface vortices. Velocity distribu-
tion was measured during various stages of vortex development (Plate 2).
Average velocity ratio distribution with a Stage D vortex is illustrated by
the contour line in Plate 4. This condition is considered satisfactory as the
deviation of the average velocity ratio depicted by the contour lines does not
exceed 10 percent. The velocity distribution that occurred during the period
of maximum deviation in velocity is shown in Plate 5. A time-history plot of
one of the probes (channel 11) is shown as Test 1 in Plate 6. This time-
history plot reflects a stable condition. Average velocity ratio distribution
with a Stage E vortex is shown in Plate 7. Although the plot of average
velocity ratio distribution is satisfactory, the plot of maximum velocity
ratio deviation (Plate 8) shows a severe velocity differential at 2.10 sec.
Also, the presence of a vortex at 2.1 sec was confirmed by _ time-history plot
of channel 11 (Plate 6, Test 2) and by visual observations. Various other
flow conditions were investigated, and the test results revealed that only the
Stage E vortex (sustained air-entraining vortex) had an adverse effect on the
velocity distribution or flow stability in the pump intake. Therefore, other
stages of vortex development (A, B, C, and D) were considered to have no
ddvecb effect on flow distribution or flow stability in the pump intake.
Effects of Submergence on Flow Distribution
12. Tests were conducted to investigate the effects of a low sub-
mergence, S - 0.94d , on velocity distribution and flow stability where S
is the vertical distance from the invert of the roof curve to the water-
surface elevation (Plate 1) and d is the top diameter of the cone
(Plate 1). Average velocity distribution with a Stage D vortex is shown by
the contour lines in Plate 9. The maximum velocity deviation is shown in
Plate 10, and time-history plots of channels I and 7 are shown in Plate 11. A
comparison of Plates 9, 10, and 11 with the plots obtained at a higher sub-
mergence (Plates 4, 5, and 6) indicates that the lower submergence has no
10

significant effect on the average velocity distribution, but does slightly
increaq the deviation in velocity. Results of additional tests conducted at
a low submergence (S = 0.94d) and a higher flow rate (Q - 2.47 gd5) indi-
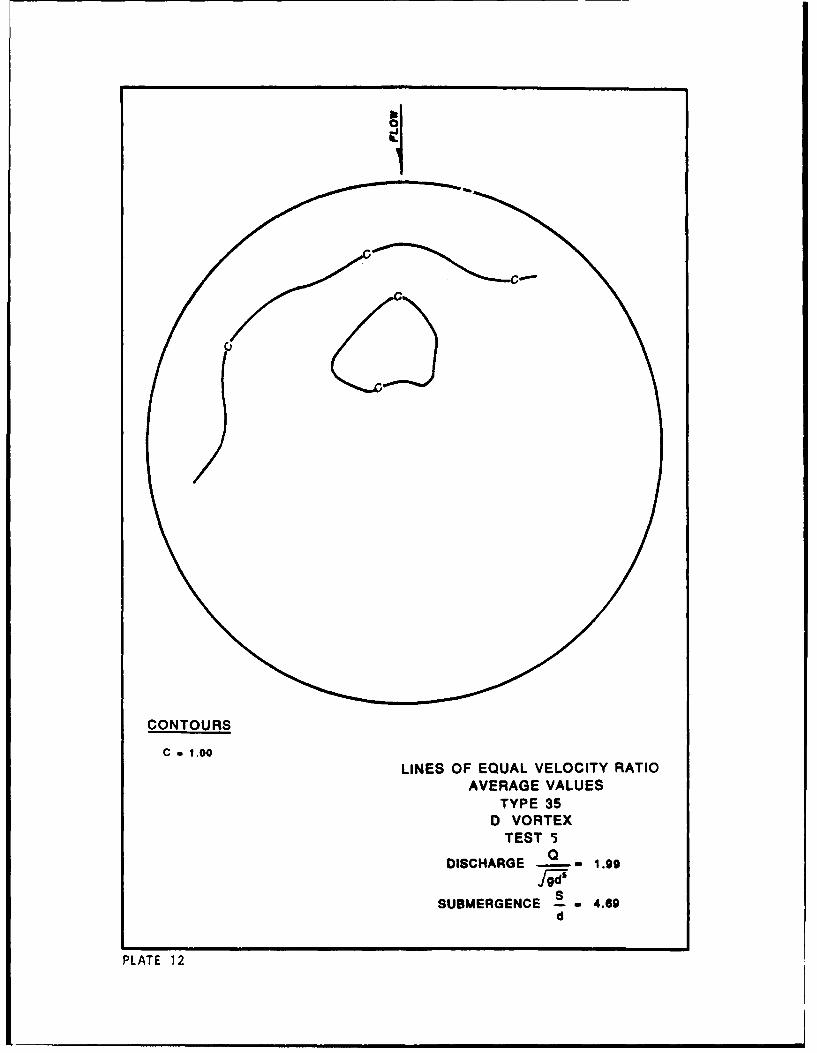
cated satisfactory flow distribution. TesL results conducted to investigate
flow distribution with a higher submergence (S - 4.69d) are presented in
Plates 12 and 13. Plate 12 shows the average distribution, and Plate 13 shows
the maximum velocity deviation. Satisfactory zest results were also obtained
with a higher submergence and a lower discharge (Q - 0.97 \/gd5 )as shown in
Plate 14. Tests ccnducted at various submergences revealed that flow dis-
tribution and stability were satisfactory for submergences equal to or greater
than 0.94d
Approach Flow from 0. 45, and 90 Degrees
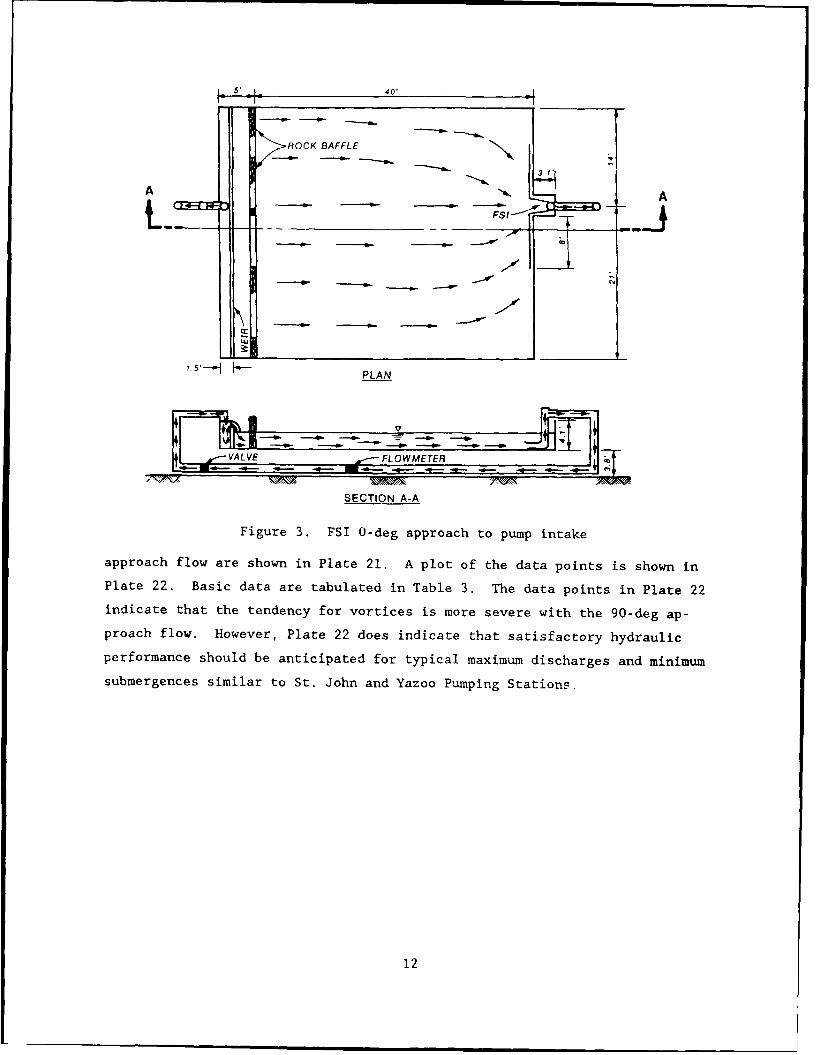
13. Tests were conducted with the flow approaching the pump bay at
angles with the longitudinal center line of the pump bay of 0, 45, and 90 deg.
A typical approach flow current pattern with an angle of 0 deg is shown in
Figure 3. The 12 approach configurations tested (types 1-12) with the 0-deg
approach flow are shown in Plate 15. A dimensionless plot of the discharge
parameter Q/\/gd 5 versus the critical submergence parameter Sc/d is shown
in Plate 16. The data points on the plot (Plate 16) show the hydraulic con-
ditions that produce critical submergence and discharge. Critical submergence
is defined as the submergence S that generates incipient Stage E vortices.
The basic data -e tab'ulated in Table 1. Plate 16 also shows anticipated
minimum submergences and maximum flow rates per pump for two proposed typical
pump stations (Yazoo and St. Johns). The data points in Plate 16 generally
indicate satisfactory hydraulic performance for typical hydraulic conditions
regardless of the pump bay width W or length L with flow approaching the
sump at an angle of 0 deg. Measured swirl angles were satisfactory and did
not exceed a value of 0.5 deg for any of the designs tested.
14. Typical current patterns generated by a 45-deg approach flow pat-
tern are shown in Plate 17. The 12 approach configurations tested (types 13-
24) with a 45-deg approach flow are shown in Plate 18. A plot of the data
points is shown in Plate 19. Basic data are tabulated in Table 2.
15. Current patterns generated by a 90-deg approach flow are shown in
Plate 20. The 12 approach configurations tested (types 25-36) with a 90-deg
11
1 - 5 ". 40' _ _
ROCK BAFFLE
A A
-..-..._.N
PLA N
VALVE FLOWMETER
SECTION A-A
Figure 3. FSI 0-deg approach to pump intake
approach flow are shown in Plate 21. A plot of the data points is shown in
Plate 22. Basic data are tabulated in Table 3. The data points in Plate 22
indicate that the tendency for vortices is more severe with the 90-deg ap-
proach flow. However, Plate 22 does indicate that satisfactory hydraulic
performance should be anticipated for typical maximum discharges and minimum
submergences similar to St. John and Yazoo Pumping Stations
12

PART IV: RESULTS AND DISCUSSION
16. Results of this research to define the limitations and to identify
advantages of the FSI subjected to five pumping station variables (discharge,
submergence, pump bay width, pump bay length, and angle of approach) are sig-
nificant for future Corps pumping station designs. Future Corps pumping sta-
tions designed with an appropriate FSI have the potential for cost savings due
to the enhanced hydraulic performance without the typical long straight ap-
proach channel and pump bay walls. Adequate hydraulic performance was ob-
tained for flows approaching the pump bay at angles of 0 to 90 deg with the
Yazoo type FSI. This indicates that the previous extensive approach channel
straightening and expensive pump bay divider walls can be reduced in length
and/or omitted for new FSI-equipped pumping stations. Also the FSI may be
considered for retrofitting for existing pumping stations experiencing
hydraulic problems.
17. The test results indicate that the FSI design presented in this
report (Plate 1) will provide satisfactory hydraulic performance for dis-
charges equal to or less than a value of 1.99 \gd5 , submergences equal
to or greater than a value of 0.94d , bay widths equal to or wider than a
value of 2.28d , pump bay length equal to or longer than a value of Od , and
approach flow angle to the pump bay of equal to or less than 90 deg. It
should be noted that this guidance is appropriate only for the FSI design
shown in Plate 1. Site-specific tests have demonstrated that changing one or
more of the internal dimensions may adversely affect the performance of the
FSI.
18. Due to inquiries from Corps Districts about varying the internal
geometry of the FSI, research is in progress to investigate the hydraulic
limits of its internal geometry. Variables to be evaluated include sidewall
and roof flare, roof curve, invert curve, and cone angle.
13

Table 1
Critical Submergence and Discharge for O-deg Approach Flow Angle
FSI Sc L W VortexType \/gd5 d d d Stage
1 2.9 0.94 0 2.28 D1.69 C2.44 C3.19 B3.94 B4.69 B
2 2.3 0.94 3 D2.3 1.692.5 2.442.9 3.192.9 3.942.9 4.69
3 1.9 0.94 62.6 1.692.9 2.442.9 3.19
3.944.69 4 C
4 0.94 0 2.55 B1.67 D
2.44 D3.19 B3.94 B
4.69 B
5 2.0 0.94 3 D2.9 1.69
2.443.19
3.944.69
6 2.0 0.942.5 1.692.9 2.442.9 3.192.9 3.942.9 4.69
(Continued)

Table 1 (Concluded)
_SI Sc L W Vortex____ d d d Stage
7 2.7 0.94 0 3.15 D2.9 1.69 D
2.44 D
3.19 B3.94 B4.69 1B
8 1.9 0.94 3 D2.9 1.69
2.44
3.19
3.944.69
1.9 0.942.9 1.69
2.44
3.193.94
4.69
10 0.94 0 3.92 B1.69 D2.44 B3.19 B3.94 B4.69 B
11 2.3 0.94 3 D2.9 1.69
2.44
3.19
3.944.69
12 1.9 0.94 62.9 1.69
2.443.19 C3.94 C4.69 D

Table 2
Critical Submergence and Discharge for 45-deg Approach Flow Angle
FSI __q L W VortexVgd d d d Staze
13 1.0 0.94 0 2.28 D1.4 1.69 D2.9 2.44 B2.9 3.19 D2.9 3.942.9 4.69
14 1.0 0.94 31.4 1.692.1 2.442.1 3.191.6 3.941.8 4.69
15 1.3 0.942.4 1.692.9 2.442.9 3.192.1 3.942.9 4.69
16 1.9 0.94 0 2.551.5 1.672.9 2.44 C2.9 3.19 C2.9 3.94 B2.9 4.69 B
17 1.8 0.94 3 D2.0 1.691.6 2.441.4 3.191.6 3.942.3 4.69
18 2.0 0.94 6 2.552.6 1.692.7 2.442.0 3.19
2.6 3.942.5 4.69
(Continued)

Table 2 (Concluded)
FSI Sc L W VortexTy e d d d Stage
19 1.7 0.94 0 3.15 D2.9 1.69 D
2.44 B3.19 B3.94 B4.69 1A
20 1.8 0.94 3 D2.7 1.691.7 2.442.0 3.192.1 3.942.3 4.69
21 1.9 0.94 62.3 1.691.8 2.442.2 3.192-3 3.942.3 4.69
48 2.0 0.94 0 3.922.9 1.69
2.44 C3.19 C3.94 B4.69 B
47 2.0 0.94 3 D2.5 1.692.6 2.442.1 3.192.6 3.942.9 4.69
40 1.9 0.94 62.9 1.692.2 2.442.5 3.192.9 3.942.9 4.69

Table 3
Critical Submergence and Discharge for 90-deg Approach Flow Angle
cSI 0 SC L W Vortex
Type d d d Stage
25 1.5 0.94 0 2.28 D1.2 1.691.2 2.441.3 3.192.0 3.942.9 4.69
26 1.7 0.942.2 1.692.4 2.442.9 3.192.0 3.942.9 4.69
27 1.8 0.94 61.1 1.690.9 2.441.1 3.191.2 3.941.9 4.69
28 1.9 0.94 0 2.551.4 1.671.2 2.441.5 3.191.0 3.941.8 4.69
29 1.9 0.94 32.1 1.692.4 2.442.9 3.192.0 3.942.1 4.69
30 1.8 0.942.2 1.692.7 2.441.9 3.192.0 3.942.2 4.69
(Continued)

Table 3 (Concluded)
FSI S L w VortexT_ e d d d Stage
31 1.9 0.94 0 3.15 D1.0 1.691.2 2.441.6 3.191.7 3.942.1 4.69
32 1.9 0.94 32.9 1.692.9 2.442.0 3.191.6 3.941.6 4.69
33 1.4 0.941.8 1.691.1 2.441.8 3.192.7 3.942.3 4.69
34 2.2 0.94 0 3.921.4 1.691.3 2.441.6 3.191.4 3.941.9 4.69
35 2.6 0.942.9 1.692.9 2.441.3 3.191.5 3.941.3 4.69
36 1.6 0.941.8 1.691.9 2.442.2 3.192.2 3.942.6 4.69

70 1.13dd
VOR TIMETER
BREASTWALL L 0.77d 3d
CCON
SECT CU.-C -
S CUEPLR 1 .
°" ~gdS r
I 1.45d
3.30d
SECTION C-C
FORMED SUCTION INTAKE
PLATE

STAGE 0 - NO VORTEX
STAGE A
STAGE B
0
STAGE C
STAGE D
STAGE D
FORMED SUCTION INLETSTAGES IN SURFACE
VORTEX DEVELOPMFNT
PLATE 2

d
isc 0 1 .. I6
0 7
50006
013 00 7.
0 r 19 0
025 lp0
0 0
0
IMPACT0TUBES
10
PIEZOMETER
PLAN
PIEZOMETERS ANDIMPACT TUBES
PLATE 3

p
N
LINES OF EQUAL VELOCITY RATIOAVERAGE VALUES
TYPE 34D VORTEX
TEST 1CONTOURS DISCHARGE- 9 -- 1.99
p = 1.00 SUBMERGENCE .- 3.19=1.10 d
PLATE 14

o
B
LINES OF EQUAL VELOCITY RATIO
MAXIMUM DEVIATION VALUESBETWEEN 54.15 AND 54.29 SEC
CONTOURS TYPE 34
8 = 0.10 D VORTEXc = 0.20 TEST 1D = 0.30E = 0.40 QF = 0.50 DISCHARGE -- = 1.99
gds
SUBMERGENCE 2.= 3.19d
PLATE 5

TEST 1 CHANNEL 11 AVERAGE 0.9991 .75 1 1 1 1 I
1.705
-0.25
D VORTEX
0 50 TEST 1
-1.25I I I I I0 6.0 12.0 18.0 24.0 30.0 36.0 42.0 48.0 54.0 60.0
0
w
TEST 2 CHANNEL 11 AVERAGE 0.980o 1.75
Z
1.00 401w0N0 f
-0.25
-0.50 -E VORTEXTEST 2
-1.25 I I I I0 6.0 12.0 18.0 24.(' 30.0 36.0 42.0 48.0 54.0 60.0
TIME, SECONDS
TIME-HISTORYD AND E VORTEX
TEST 1 AND 2
DISCHARGE - 1.99gd
SUBMERGENCE - . 3.19d
PLATE 6

0
LINES OF EQUAL VELOCITY RATIOAVERAGE VALUES
TYPE 34E VORTEX
TEST 2CONTOURS a
DISCHARGE = 1.990 = 0.90 gd s
P = 1.00 So = 1.10 SUBMERGENCE S - 3.19
d
PLATE 7

CONTOURS
A = 0.00B = 0.10C = 0.20D = 0.30E = 0.40
F= = 0.50 LINES OF EQUAL VELOCITY RATIOG = 0.60 MAXIMUM DEVIATION VALUESH = 0.70 BETWEEN 2.10 AND 2.18 SECI ,, 0.80 TYPE 34
J 0 .90 E VORTEXK = 1.00L = 1.10 TEST 2
C . 0.20Q
M - .20DISCHARGE , .99N = 1.30
O = 0.90P = 1.00 SUBMERGENCE S D 3.19
j~~ . 0.9.19OTE
L - 1.10 d
PLATE 8

p
0 0
LINES OF EQUAL VELOCITY RATIOAVERAGE VALUES
TYPE 34D VORTEX
TEST 3a
CONTOURS DISCHARGE - 1.99
0 = 0.90 J g d
P 1.00 SUBMERGENCE 0.940 = 1.10 d
PLATE 9

LINES OF EQUAL VELOCITY RATIOCONTOURS MAXIMUM DEVIATION VALUES
B . 0.10 BETWEEN 2.17 AND 2.29 SECC 0.20 TYPE 34D 0.30 D VORTEX
E 0.40 TEST 3F . 0.50G -0.60 DISCHARGE 0H a 0.70 D A - 1.99I 0.80
SUBMERGENCEAS 0.94d
PLATE 10

TEST 3 CHANNEL 1 AVERAGE 0.936
-1.75 i I I I I I I I
1.00- lm .k
-0.25
O -0.50 -
-12
0 6.0 12.0 18.0 24.0 30.0 36.0 42.0 48.0 54.0 60.0
0-J
Luw
0
TEST 3 CHANNEL 7 AVERAGE 0.9661.75
z
-0.25
-0.50
-1.25 1
0 6.0 12.0 18.0 24.0 30.0 36.0 42.0 48.0 54.0 60.0
TIME, SECONDS
TIME-HISTORYD VORTEX
TEST 30
DISCHARGE a 1.99
SSUBMERGENCE -. - 0.94
d
PLATE 1
C)
CONTOURS
C = 1.00
LINES OF EQUAL VELOCITY RATIOAVERAGE VALUES
TYPE 35D VORTEX
TEST 5
DISCHARGE -2 - 1.99
SUBMERGENCE .- - 4.69d
PLATE 12

E
Q
AA A
A E B
CONTOURS
A = 0.00e = 0.10C = 0,20D = 0.30E = 0.40F = 0.50G = 0.60H = 0.70 LINES OF EQUAL VELOCITY RATIOI = 0.80 MAXIMUM DEVIATION VALUES
J= 0.90 BETWEEN 47.96 AND 48.03 SECTYPE 35
D VORTEXTEST 5
0DISCHARGE - , 1.99
SSUBMERGENCE - - 4.69
d
PLATE 13

CONTOURS
C . 1.00
LINES OF EQUAL VELOCITY RATIOAVERAGE VALUES
TYPE 35D VORTEX
TEST 6a
DISCHARGE - - 0.97
SSUBMERGENCE - - 4.69
d
PLATE 14

2.26
(BAY WIDTH)
0. W!c r.~C uL j ( LUJ c L" d
Q.~ '-~
L =Od. BAY LENGTH
2.26
0 2. 'o In 0
0. V- N N 0
L=3dBYLNT
L 3 d, BAY LENGTH
2.2TPE611
0-E APOCHFO
FS1PAT 15E 11

3.0
* A
2.0
1.0
MINSUBMERGENCE
0 1.0 2.0 3.0 4.0 5.0 6.0
DESIGNS TESTEDBAY LENGTH BAY WIDTH FOR
CONFIGURATIONOd 3d 6d 1 THROUGH 12
0 1 2 0 3 2.28d@ 4 A U 6 2.55d
* 7 A Q 9 9 3.15d(b10 ii (1 12 3.92d
ScCRITICAL SUBMERGENCE -
dVS
DISCHARGE FgINCIPIENT STAGE E VORTICES
O-DEG APPROACH FLOW
PLATE 16

0uLJ-
< <LL 0
>- LI) (L
DH(AC
<LL
Ito
f ~~N L f 1 JfI1-~~1 0_______
PLATE 17

W - 3.15d ___
TYPE 19
W -2.55d -. b4
TYPE 16 rL>..
L = d, BAY LENGTH
NN
Lu uj UjcyQ AC to L d
63d
L 3 d BAY LENGTH
FS2TPE2 1-2
45DE APROC FLOWu
PLT C18 . t Q oC

3.0
&
A&A
• & EA A
A 6 0
0
0*
2.0 - oh
* A"
-YZO
0 1 1 1 1
0 1.0 2.0 3.0 4.0 5.0Sc/d
DESIGNS TESTED BAY WIDTH FORBAY LENGTH CONFIGURATION
Od 3d 6d 13 THROUGH 24 Sc0 13 A 14 0 15 2.28d CRITICAL SUBMERGENCE -0 le A 17 • lS 2.55d d0 19 A 20 l9 21 3.16d VSM 22 & 23 a] 24 3.92d 0
DISCHARGE /INCIPIENT STAGE E VORTICES
45-DEG APPROACH FLOW
PLATE 19

w
LA. o
.tL z
JIo
LLc.4-
a
tO'
i t tt
"/ I ii/'
( I~i!
PLATE 20

00L
LZ Cd BAY LEGT
90DG PROC FO
PLTE2

3.0
ha A a
•l go
0 &
0
0 0 0
""U
o.o -o1.0
YAZO 0AX DISCHARGE
,ST. JOHNS
MINSUBMERGENCE
o I I I I I
0 1.0 2.0 3.0 4.0 5.0 6.0
Sc/d
DESIGNS TESTED BAY WIDTH FORBAY LENGTH CONFIGURATION
Od 3d 6d 25 THROUGH 360 25 626 0 27 2.28d@ 28 A 29 8 30 2.55d0 31 A 32 9 33 3.15d0 34 & 35 0 36 3.92d
ScCRITICAL SUBMERGENCE -
dVS
0DISCHARGE f
INCIPIENT STAGE E VORTICES90-DEG APPROACH FLOW
PLATE 22