Embed Size (px)
Citation preview
EUB/AGS Geo-Note 2002-08
Static Water Levels and Completion Details of Nested Piezometers in the Quaternary-Tertiary(?) Succession, Athabasca Oil Sands (In Situ) Area, Alberta

Static Water Levels and Completion Details of Nested Piezometers in the Quaternary-Tertiary (?) Succession, Athabasca Oil Sands (In Situ) Area, AlbertaT.G. Lemay and G. Jean
Alberta Geological Survey
December 2002

©Her Majesty the Queen in Right of Alberta, 2002
The Alberta Energy and Utilities Board/Alberta Geological Survey (EUB/AGS) and its employees andcontractors make no warranty, guarantee or representation, express or implied, or assume any legalliability regarding the correctness, accuracy, completeness, or reliability of this publication. Any digitaldata and software supplied with this publication are subject to the licence conditions (specified in'Licence Agreement for Digital Products'). The data are supplied on the understanding that they are forthe sole use of the licensee and will not be redistributed in any form, in whole or in part, to third parties.Any references to proprietary software in the documentation, and/or any use of proprietary data formatsin this release, do not constitute endorsement by the EUB/AGS of any manufacturer's product.
If this product is an EUB/AGS Special Report, the information is provided as received from theauthor and has not been edited for conformity to EUB/AGS standards.
When using information from this publication in other publications or presentations, dueacknowledgment should be given to the EUB/AGS. The following reference format is recommended:
Lemay, T.G. and Jean, G. (2002): Static water levels and completion details of nested piezometers in theQuaternary-Tertiary (?) succession, Athabasca Oil Sands (in situ) Area, Alberta; Alberta Energy andUtilities Board, EUB/AGS Geo-Note 2002-08.
Published December 2002 by:Alberta Energy and Utilities BoardAlberta Geological Survey4th Floor, Twin Atria Building4999 – 98th AvenueEdmonton, AlbertaT6B 2X3
Tel: (780) 422-3767 (Information Sales)Fax: (780) 422-1918
Web site: www.ags.gov.ab.ca
EUB/AGS Geo-Note 2002-08 (December 2002) • ii
ContentsAcknowledgments ......................................................................................................................................ivAbstract........................................................................................................................................................v1 Introduction ..........................................................................................................................................12 Study Area ............................................................................................................................................13 Test Hole Details, Piezometer Completion and Water-Level Information ....................................1
3.1 Site WR 99-1 ..................................................................................................................................13.2 Site WEPA 00-1 ..............................................................................................................................43.3 Site WEPA 00-3 ..............................................................................................................................4
4 Comment on Vertical Gradients at the Piezometer Sites ................................................................45 Conclusions ..........................................................................................................................................4
TablesTable 1 Monthly water level elevations in metres above sea level, November 2000 –
November 2001 ............................................................................................................................7Table 2 Calculated Vertical Gradients......................................................................................................15
Figures
Figure 1 Study area map ..........................................................................................................................2Figure 2 Location map of AGS piezometers ..........................................................................................3Figure 3 Water-table well-construction details: WR 99-1-8(WT) ..........................................................5Figure 4 Piezometer-construction details: WR 99-1-230 ........................................................................6Figure 5 Water-table construction details: WEPA 00-1-15(WT) ............................................................8Figure 6 Piezometer-construction details: WEPA 00-1-41......................................................................9Figure 7 Piezometer-construction details: WEPA 00-1-76....................................................................10Figure 8 Piezometer-construction details: WEPA 00-1-120 ..................................................................11Figure 9 Water-table construction details: WEPA 00-3-17(WT) ..........................................................12Figure 10 Piezometer-construction details: WEPA 00-3-79....................................................................13Figure 11 Piezometer-construction details: WEPA 00-3-158..................................................................14
EUB/AGS Geo-Note 2002-08 (December 2002) • iii
AcknowledgmentsTest hole drilling and piezometer installation were funded jointly by the Government of Alberta, throughthe Energy and Utilities Board, and by the Government of Canada, through the Ministry of WesternEconomic Diversification under the Western Economic Partnership Agreement. This Geo-Note is one ina series of Geo-Notes detailing the results of the work completed as part of this project.
The stratigraphic test holes were drilled by the Layne Christiansen Company and by McAuley DrillingLtd. The piezometer installations were completed by Elk Point Drilling Corp.
EUB/AGS Geo-Note 2002-08 (December 2002) • iv
Abstract
The Alberta Geological Survey (AGS) completed the installation of nine piezometers in 2000. Thepiezometers were completed within both Quaternary drift aquifers and a Quaternary-Tertiary buriedchannel aquifer. Water levels were measured within these piezometers. The results of thesemeasurements indicate that, at all three sites, vertical hydraulic gradients are downwards. At one of thesites (WEPA 00-1), the calculated vertical gradients between three of the nested piezometers are small.This may indicate that the three stratigraphically distinct aquifers monitored by these piezometers maybe part of a larger, vertically connected aquifer system, even though they are separated by interveningtill packages.
EUB/AGS Geo-Note 2002-08 (December 2002) • v

1 Introduction
Between 1999 and 2001, the Alberta Geological Survey conducted a groundwater-sampling program innortheastern Alberta. The purpose was to document baseline groundwater conditions in advance of oilsands development in the area. This project was jointly funded by the Government of Alberta, throughthe Energy and Utilities Board, and by the Government of Canada, through the Ministry of WesternEconomic Diversification under the Western Economic Partnership Agreement. This Geo-Note is one ina series of Geo-Notes detailing the results of the work completed as part of this project.
Much of the area of investigation is sparsely populated and, as such, water well and stratigraphicinformation is difficult to obtain for these areas. To fully understand and characterize the Quaternary andQuaternary-Tertiary hydrogeological systems in northeastern Alberta, several stratigraphic test holeswere drilled by the AGS. Detailed stratigraphic and chemical analyses were performed on the collectedcore material. These analyses are reported in other Geo-Notes of this series. Subsequently, ninepiezometers were installed to various depths at three of these sites to characterize water chemistry andcapture water-level information from selected aquifers. The purpose of this document is to providepiezometer completion details and document water levels measured in each piezometer at various timesbetween November 2000 and November 2001. Official driller’s reports for each piezometer are on filewith Alberta Environment.
2 Study Area
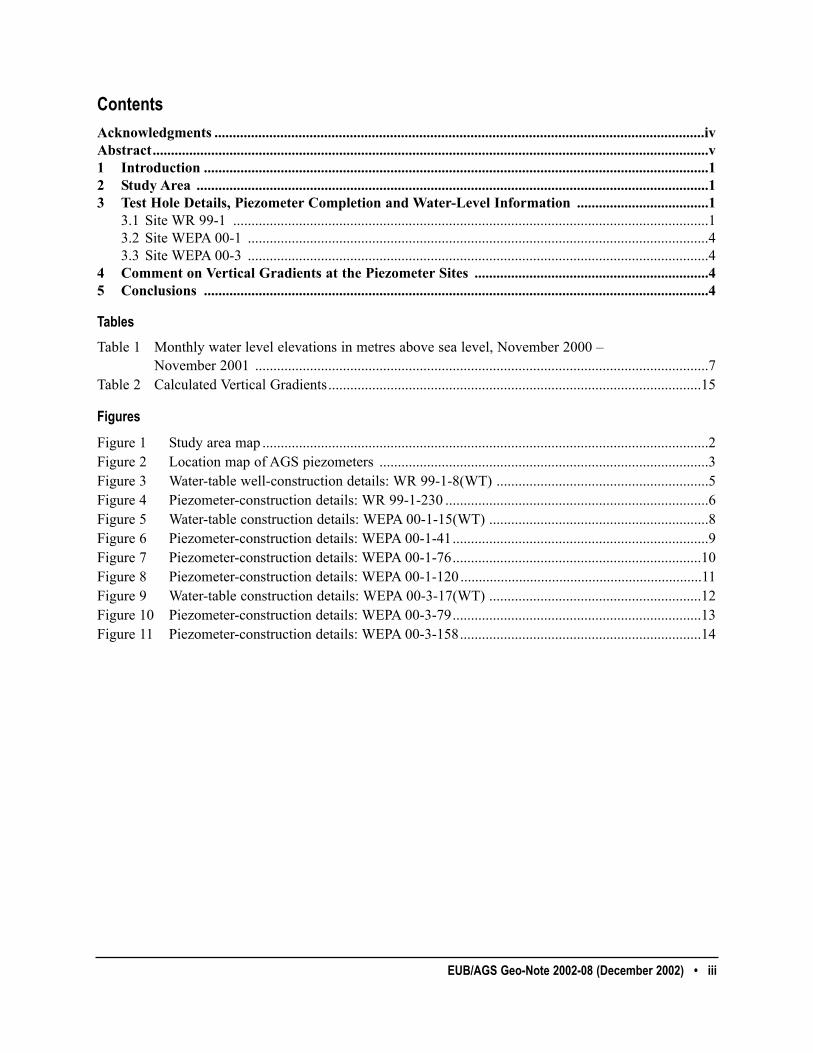
The study area is located in the northeastern portion of Alberta. It is bounded on the west by theAthabasca River, to the north by the Athabasca and Clearwater rivers, to the east by the Alberta-Saskatchewan provincial border and to the south by the Mostoos Uplands (Figure 1). This areaencompasses the southeast portion of the EUB-designated Athabasca Oil Sands Area.
3 Test Hole Details, Piezometer Completion and Water-Level Information
Latitude, longitude and elevation values were determined using the Locus GPS instrument system byAshtech Precision Products Limited. One receiver was located over a point of known coordinates, suchas an Alberta Survey Control Marker (ASCM), and a second receiver was located at the top of thepiezometer’s casing. GPS positions are referenced to the WGS84 ellipsoid and modelled against theearth-fixed X, Y, Z Cartesian coordinate system. Ground elevation was established using a steel tape tomeasure from the top of the casing to ground level.
Water levels were measured using an electric water level tape. For each piezometer, the depth of waterfrom the top of the casing is recorded. The elevation of the water level is determined by subtracting themeasured depth to water value, and the height of the casing above ground surface from the top of casingelevation determined during surveying.
3.1 Site WR 99-1
Stratigraphic test hole WR 99-1 was drilled in December 1999 to a depth of 253.7 m. The test hole siteis located approximately 45 km north of Wandering River, Alberta (Figure 2). In November 2000, twopiezometers were installed at this site, WR 99-1-8(WT) and WR 99-1-230. WR 99-1-8(WT) wascompleted within the Quaternary drift. WR 99-1-230 was completed within a Quaternary-Tertiary buriedchannel aquifer of the Wiau Channel. Completion diagrams for the two piezometers are presented in
EUB/AGS Geo-Note 2002-08 (December 2002) • 1
Figure 1. Study area location map.
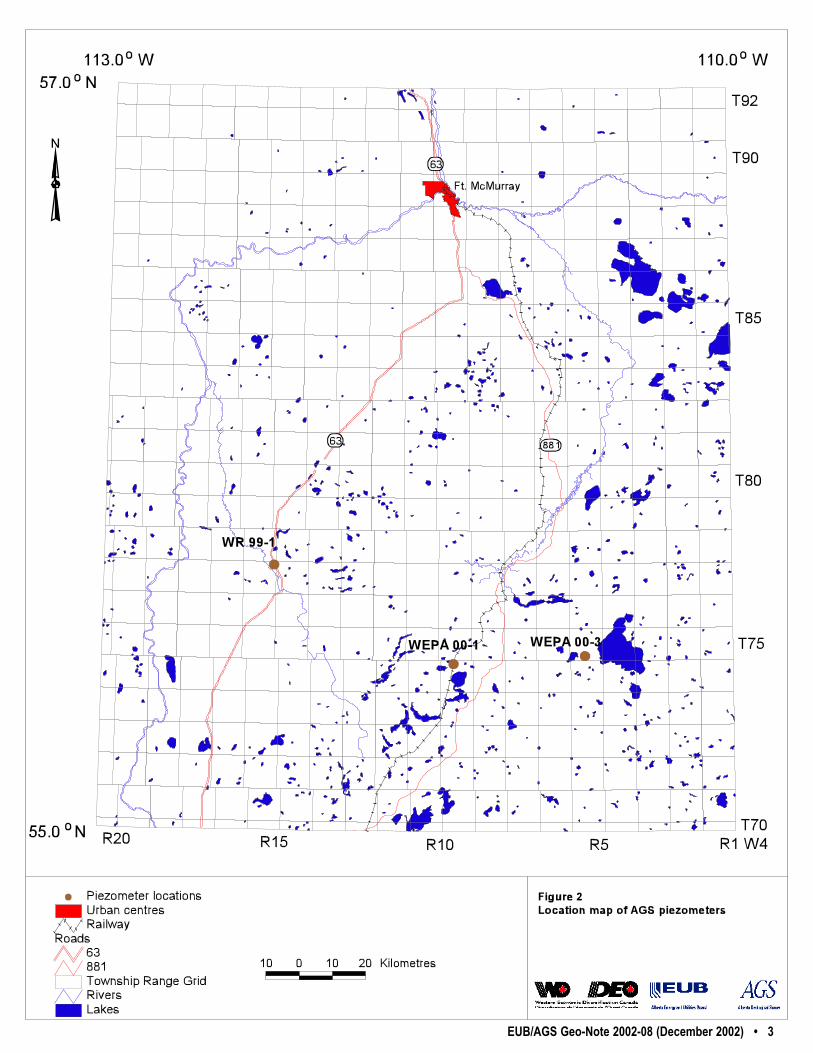
EUB/AGS Geo-Note 2002-08 (December 2002) • 3
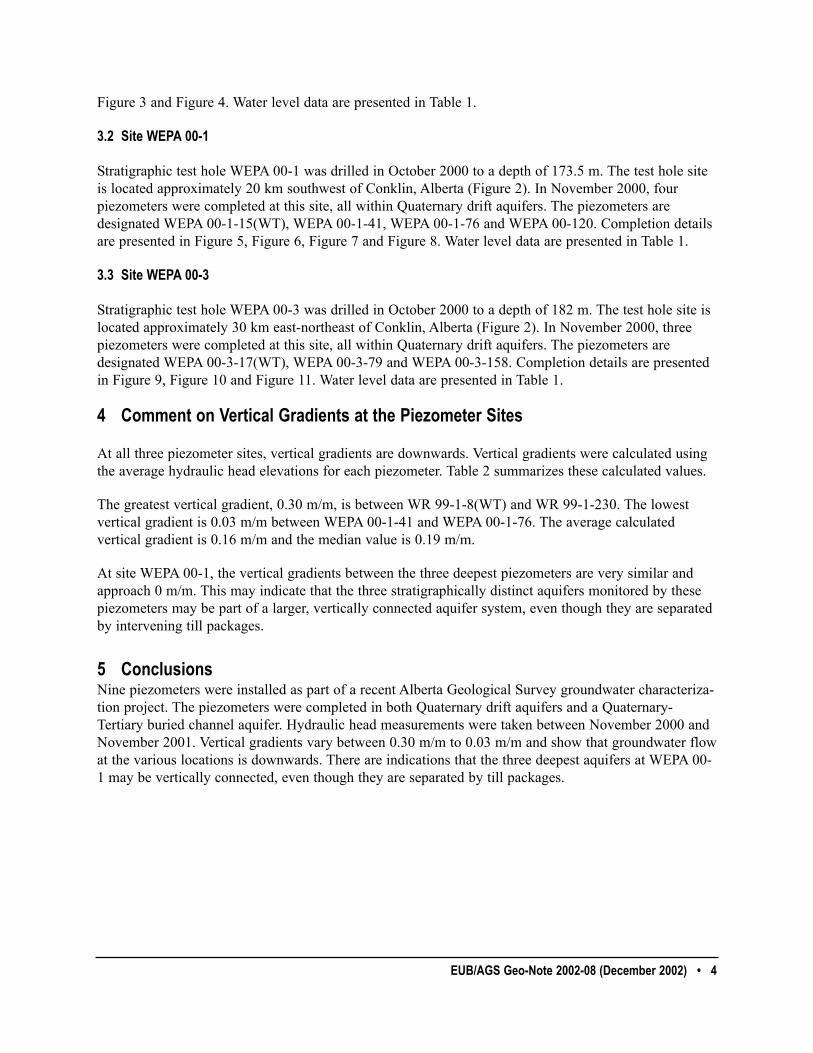
Figure 3 and Figure 4. Water level data are presented in Table 1.
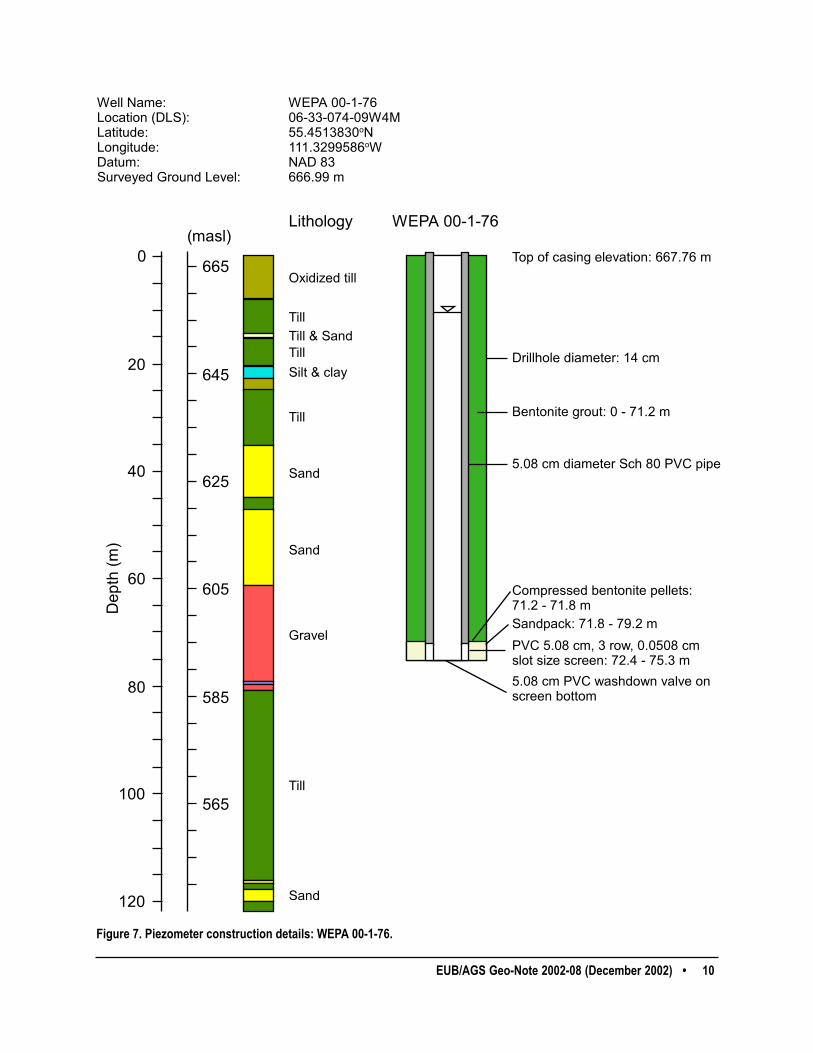
3.2 Site WEPA 00-1
Stratigraphic test hole WEPA 00-1 was drilled in October 2000 to a depth of 173.5 m. The test hole siteis located approximately 20 km southwest of Conklin, Alberta (Figure 2). In November 2000, fourpiezometers were completed at this site, all within Quaternary drift aquifers. The piezometers aredesignated WEPA 00-1-15(WT), WEPA 00-1-41, WEPA 00-1-76 and WEPA 00-120. Completion detailsare presented in Figure 5, Figure 6, Figure 7 and Figure 8. Water level data are presented in Table 1.
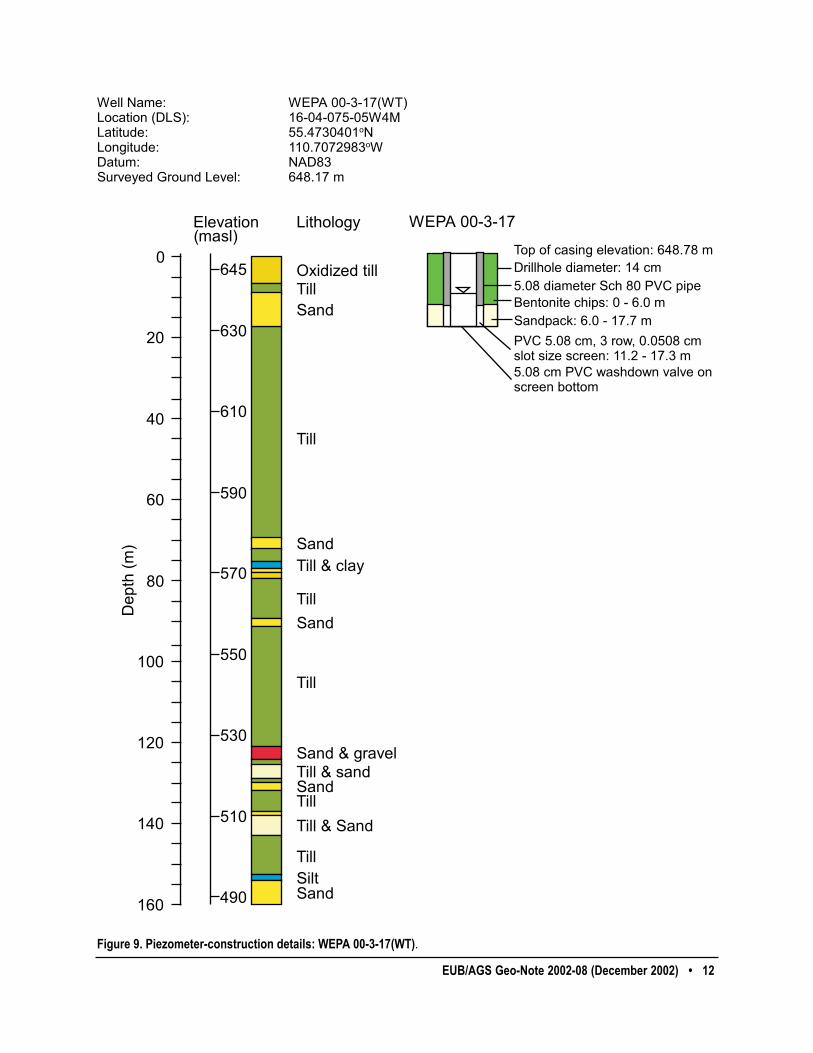
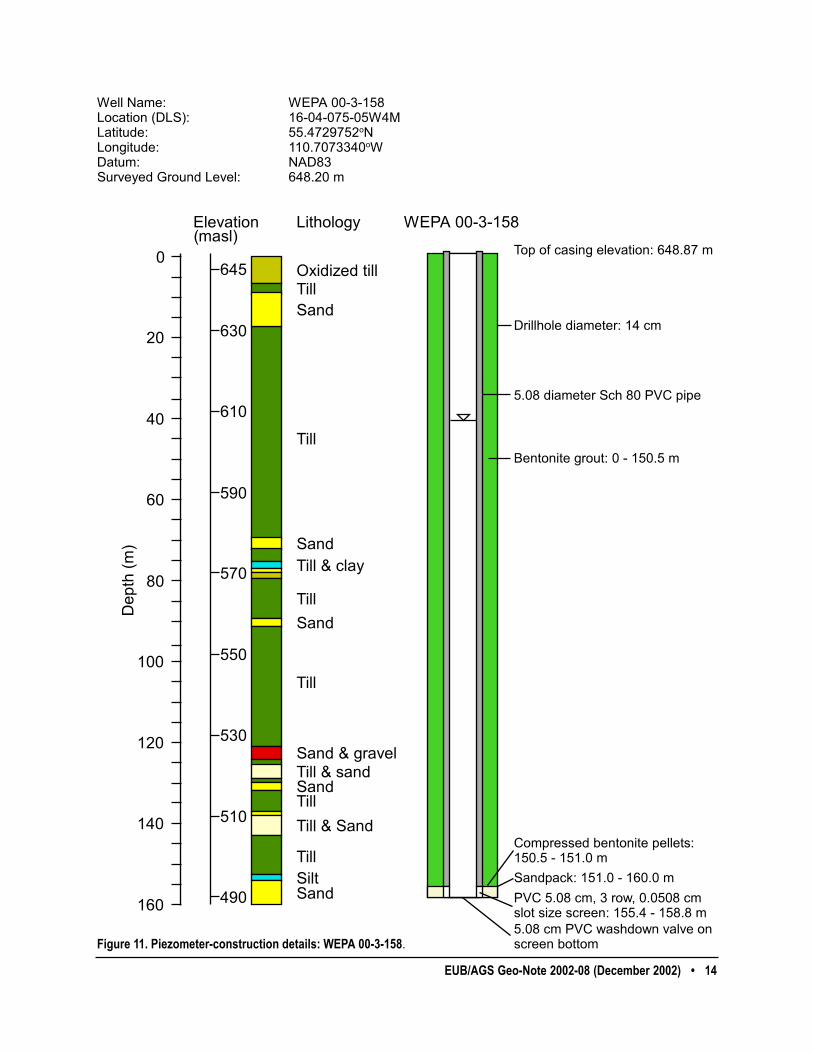
3.3 Site WEPA 00-3
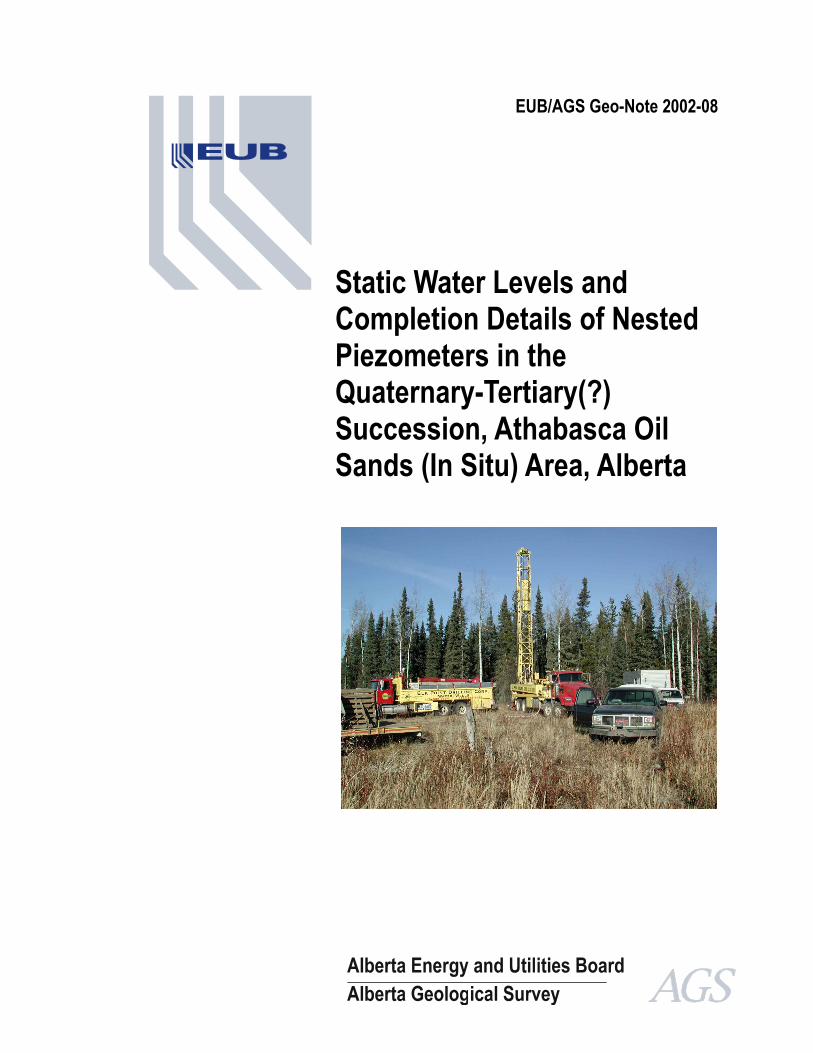
Stratigraphic test hole WEPA 00-3 was drilled in October 2000 to a depth of 182 m. The test hole site islocated approximately 30 km east-northeast of Conklin, Alberta (Figure 2). In November 2000, threepiezometers were completed at this site, all within Quaternary drift aquifers. The piezometers aredesignated WEPA 00-3-17(WT), WEPA 00-3-79 and WEPA 00-3-158. Completion details are presentedin Figure 9, Figure 10 and Figure 11. Water level data are presented in Table 1.
4 Comment on Vertical Gradients at the Piezometer Sites
At all three piezometer sites, vertical gradients are downwards. Vertical gradients were calculated usingthe average hydraulic head elevations for each piezometer. Table 2 summarizes these calculated values.
The greatest vertical gradient, 0.30 m/m, is between WR 99-1-8(WT) and WR 99-1-230. The lowestvertical gradient is 0.03 m/m between WEPA 00-1-41 and WEPA 00-1-76. The average calculatedvertical gradient is 0.16 m/m and the median value is 0.19 m/m.
At site WEPA 00-1, the vertical gradients between the three deepest piezometers are very similar andapproach 0 m/m. This may indicate that the three stratigraphically distinct aquifers monitored by thesepiezometers may be part of a larger, vertically connected aquifer system, even though they are separatedby intervening till packages.
5 ConclusionsNine piezometers were installed as part of a recent Alberta Geological Survey groundwater characteriza-tion project. The piezometers were completed in both Quaternary drift aquifers and a Quaternary-Tertiary buried channel aquifer. Hydraulic head measurements were taken between November 2000 andNovember 2001. Vertical gradients vary between 0.30 m/m to 0.03 m/m and show that groundwater flowat the various locations is downwards. There are indications that the three deepest aquifers at WEPA 00-1 may be vertically connected, even though they are separated by till packages.
EUB/AGS Geo-Note 2002-08 (December 2002) • 44

�������� ������� ������
������
���
���
���
���
���
���
���
���
���
���
���
�������������������
!���
��
�������"��
!�����
!���
�� �� �� !���
#�� �� ����$����
�������"�� ������
��
#��
�� ����$����
�� ���"��
�� ���������"��
��
%$����
��
�� ����$����
&��������
�
'�
��
��
(�
���
�'�
���
���
�(�
'��
''�
'��
)����*���+ ),��-�-(�)!��"������&��+ ��-��-��-��)�����. �+ ��/��������*����. �+ ��'/�(�(�'��)&��.�+ *0&(��.$�� � �%$�. �����+ ���/����
������������� ����������������������������������������
!����1�"�������������+����/����&$�������� ������$+����"�2�������"����+���-��/����/�(�"�� ������$��"��(��34#������� ��"5+��/��-�(/���34#��/�(�"�����$�6���/���(�"��������7���"$��+��/��-(/'���/�(�"��34#�6��� �6���������"$���8�����
),���-�-(
EUB/AGS Geo-Note 2002-08 (December 2002) • 5

�������� ������� ������
������
���
���
���
���
���
���
���
���
���
���
���
�������������������
!���
��
�������"��
!�����
!���
�� �� �� !���
#�� �� ����$����
�������"�� ������
��
#��
�� ����$����
�� ���"��
�� ���������"��
��
%$����
��
�� ����$����
&��������
�
'�
��
��
(�
���
�'�
���
���
�(�
'��
''�
'��
)*���+�+'��
)����,���- )*��+�+'���"������&��- ��+��+��+��)�����. �- ��/��������,����. �- ��'/�(����(�)&��.�- ,0&(��.$�� � �%$�. �����- ���/����
!����1�"�������������-����/����
&$�������� ������$-����"�
�/�(�"�� ������$��"��(��23#�����
4��������$�.�-���+�'''/���
�� ��"5-�'''/��+�'��/(��23#��/�(�"�����$�6���/���(�"��������7���"$��-�''�/��+�'��/����/�(�"��23#�6��� �6���������"$���8�����
������������� �������������������������������������
EUB/AGS Geo-Note 2002-08 (December 2002) • 6
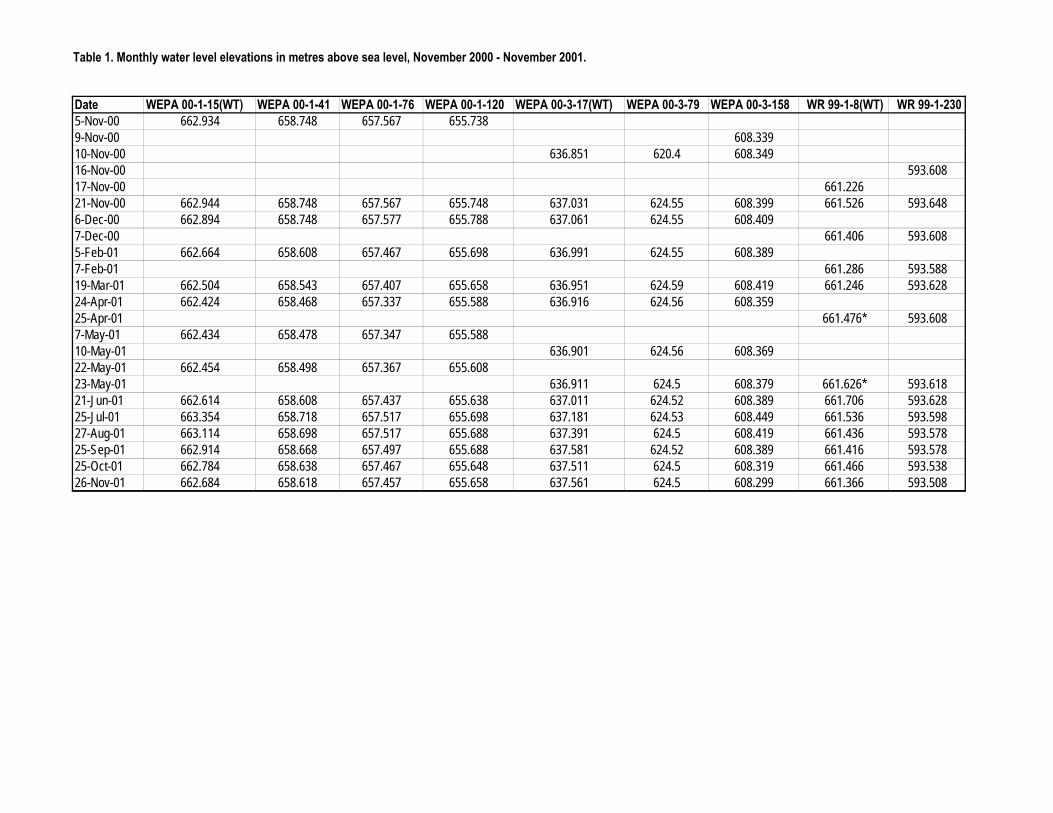
Table 1. Monthly water level elevations in metres above sea level, November 2000 - November 2001.
Date WEPA 00-1-15(WT) WEPA 00-1-41 WEPA 00-1-76 WEPA 00-1-120 WEPA 00-3-17(WT) WEPA 00-3-79 WEPA 00-3-158 WR 99-1-8(WT) WR 99-1-2305-Nov-00 662.934 658.748 657.567 655.7389-Nov-00 608.33910-Nov-00 636.851 620.4 608.34916-Nov-00 593.60817-Nov-00 661.22621-Nov-00 662.944 658.748 657.567 655.748 637.031 624.55 608.399 661.526 593.6486-Dec-00 662.894 658.748 657.577 655.788 637.061 624.55 608.4097-Dec-00 661.406 593.6085-Feb-01 662.664 658.608 657.467 655.698 636.991 624.55 608.3897-Feb-01 661.286 593.58819-Mar-01 662.504 658.543 657.407 655.658 636.951 624.59 608.419 661.246 593.62824-Apr-01 662.424 658.468 657.337 655.588 636.916 624.56 608.35925-Apr-01 661.476* 593.6087-May-01 662.434 658.478 657.347 655.58810-May-01 636.901 624.56 608.36922-May-01 662.454 658.498 657.367 655.60823-May-01 636.911 624.5 608.379 661.626* 593.61821-Jun-01 662.614 658.608 657.437 655.638 637.011 624.52 608.389 661.706 593.62825-Jul-01 663.354 658.718 657.517 655.698 637.181 624.53 608.449 661.536 593.59827-Aug-01 663.114 658.698 657.517 655.688 637.391 624.5 608.419 661.436 593.57825-Sep-01 662.914 658.668 657.497 655.688 637.581 624.52 608.389 661.416 593.57825-Oct-01 662.784 658.638 657.467 655.648 637.511 624.5 608.319 661.466 593.53826-Nov-01 662.684 658.618 657.457 655.658 637.561 624.5 608.299 661.366 593.508

�������� ������� ������
���
���
���
���
���
���
�������������
����
����������
����
������� ��
����
���
���
!"����
����
���
#�$������
�
��
��
��
��
%��
%��
������������� �������������������������������������������
��$��&� �������������'���()����#"���������������"'�%�� �
*������� ��$�'���+�()���
�)��� ���������"�� �����,-.�$�$�
���$� /'��)0�+�%�)����
,-.��)��� �1�0�"�21��)����� ������������ "��'�3)0��+�%�)�����)��� ��,-.�2�����2��������� "���4�����
5����6���'� 5�,7���+%+%��5��� ������#��' ��+00+�(�+�35�8����9��' ��)��%�%���6����9��' %%%)0�3�0%0�5#��9�' 67#��0�9"�� ���!"�9������' ���)�0��
.��$"������4�������$������'()(�+��)0��
5�,7���+%+%�
EUB/AGS Geo-Note 2002-08 (December 2002) • 8
�������� ������� ������
���
���
���
���
���
���
�������������
����
����������
����
������� ��
����
���
���
!"����
����
���
#�$������
�
��
��
��
��
%��
%��
������������� �������������������������������������1.
��$��&� �������������'���()((��
#"���������������"'�%�� �
*��������"�+�'���,�-�)���
�)��� ���������"�� �����./0�$�$�
���$� 1'�-�)��,��%)���
./0��)��� �2�-�"�32��)����� ������������ "��'�-()4�,��%)���
�)��� ��./0�3�����3��������� "���5�����
6����7���'� 6�.8���,%,�%� ������#��' ��,--,�(�,�46�9����+��' ��)��%-(���7����+��' %%%)-�4�����6#��+�' 78#��-�+"�� ���!"�+������' ��()�%��
6�.8���,%,�%
0��$"������5�������$������'-�)��,�-�)���
EUB/AGS Geo-Note 2002-08 (December 2002) • 9
�������� ������� ������
���
���
���
���
���
���
�������������
����
����������
����
������� ��
����
���
���
!"����
����
���
#�$������
�
��
��
��
��
%��
%��
&�'(���)%)*�
������������� ��������������������������������������
��$��+� �������������,���*-*���
#"���������������",�%�� �
.��������"�/�,���)�*%-���
�-��� ���������"�� �����'01�$�$�
���$� 2,�*%-��)�*3-���
'01��-��� �4�5�"�64��-����� ������������ "��,�*�-��)�*�-5��
�-��� ��'01�6�����6��������� "���7�����
&����8���,� &�'(���)%)*�� ������#��, ��)55)�*�)�3&�9����/��, ��-��%5�5��8����/��, %%%-5�33����&#��/�, 8(#��5�/"�� ���!"�/������, ���-33��
1��$"������7�������$������,*%-��)�*%-���
EUB/AGS Geo-Note 2002-08 (December 2002) • 110

�������� ������� ������
���
���
���
���
���
���
�������������
����
����������
����
������� ��
����
���
���
!"����
����
���
#�$������
�
��
��
��
��
%��
%��
&�'(���)%)%��
��$��*� �������������+���,-����
#"���������������"+�%�� �
.��������"�/�+���)�%%�-0��
�-��� ���������"�� �����'12�$�$�
���$� 3+�%%�-0�)�%�%-4��
'12��-��� �5�0�"�65��-����� ������������ "��+�%%,-0�)�%��-0��
�-��� ��'12�6�����6��������� "���7�����
&����8���+� &�'(���)%)%��� ������#��+ ��)00)�,�)�4&�9����/��+ ��-��%0,���8����/��+ %%%-0�4��4,�&#��/�+ 8(#��0�/"�� ���!"�/������+ ���-4���
������������� ���������������������������������������
EUB/AGS Geo-Note 2002-08 (December 2002) • 111
�������� ������� ������
���
���
���
���
���
���
���
���
���
�����������������
��
����
��
�����!�"��
����
��
����
���!��#���������!���� ������
�����!� ��
����
��� ��
$�%������
���
���
�&�
���
'�
��
��
&�
�
(�)*���+�+��
������������� ����������������������������������������� �
(����,���- (�)*���+�+���(���"������$ �- ��+��+���+��(�.����/��- ��0��������,����/��- ���0���&�'��($��/�- ,*$'� /#�� ���1#�/������- ��'0����
��%��2�"�������������-���'0�'��
$#���������������#-����"�
�0�'��������#� "��'��)34�%�%�
5�������"��%�-���+��0���
��%�"6-��0��+���0���
)34��0�'�"�7���#�87��0���'�"������������"#��-���0&�+���0���
�0�'�"��)34�8�����8���������"#���9�����
EUB/AGS Geo-Note 2002-08 (December 2002) • 12

�������� ������� ������
���
���
���
���
���
���
���
���
���
�����������������
��
����
��
�����!�"��
����
��
����
���!��#���������!���� ������
�����!� ��
����
��� ��
$�%������
���
���
�&�
���
'�
��
��
&�
�
(�)*���+�+��
������������� ������� �������� ���������������������
(����,���- (�)*���+�+���"������$ �- ��+��+���+��(�.����/��- ��0������'�,����/��- ���0�����'��($��/�- ,*$'� /#�� ���1#�/������- ��'0&���
��%��2�"�������������-���'0'���
$#���������������#-����"�
�0�'��������#� "��'��)34�%�%�
5��������#�/�-���+���0���
4��%#������6�������%������-��0��+���0���
��%�"7-���0��+�'�0���
)34��0�'�"�8���#�98��0���'�"������������"#��-���0��+���0���
�0�'�"��)34�9�����9���������"#���6�����
EUB/AGS Geo-Note 2002-08 (December 2002) • 13
�������� ������� ������
���
���
���
���
���
���
���
���
���
�����������������
��
����
��
�����!�"��
����
��
����
���!��#���������!���� ������
�����!� ��
����
��� ��
$�%������
���
���
�&�
���
'�
��
��
&�
�
(�)*���+�+��'
�������������� ����������������������������������������
(����,���- (�)*���+�+��'�"������$ �- ��+��+���+��(�.����/��- ��0��&���&�,����/��- ���0��������($��/�- ,*$'� /#�� ���1#�/������- ��'0&���
��%��2�"�������������-���'0'���
$#���������������#-����"�
�0�'��������#� "��'��)34�%�%�
5��������#�/�-���+����0���
4��%#������6�������%������-���0��+����0���
��%�"7-����0��+����0���
)34��0�'�"�8���#�98��0���'�"������������"#��-����0��+���'0'��
�0�'�"��)34�9�����9���������"#���6�����
EUB/AGS Geo-Note 2002-08 (December 2002) • 14

EUB/AGS Geo-Note 2002-08 (December 2002) • 15
Table 2. Calculated vertical gradients.
Interval Calculated
Vertical Gradient (m/m)
Top Piezometer Bottom Piezometer
0.30 WR 99-1-8 WR 99-1-230 0.20 WEPA 00-1-15 WEPA 00-1-14 0.03 WEPA 00-1-41 WEPA 00-1-76 0.04 WEPA 00-1-76 WEPA 00-1-120 0.22 WEPA 00-3-17 WEPA 00-1-79 0.19 WEPA 00-3-79 WEPA 00-3-158