Embed Size (px)
Citation preview
Waterway benefits valuation & economic assessments
Background
1 Principles
2 Economic welfare analysis- Waterways in Wales case study
3 Economic impact analysis- Kennet & Avon Canal case study
-4 Sustainability (Quality of Life) indicators- - Droitwich Canal case study
Principles
Appraisals & evaluations
Used to forecast / evaluate change against a baseline
Measurement of absolute change in people‘s quality of life:
Economic welfare analysis / Sustainability indicators
Measure of spatial impacts Economic impact analysis
Welfare analysisIntroduction
Used to compare between alternatives
Alternative may be Do Nothing
Need to consider counterfactual scenario
Cost – benefit analysis
Monetarisation of benefits
Multi-criteria analysis
Welfare analysisEcosystems services approach
Provisioning servicesProducts / services provided by the ecosystem
Transport – cost savingsWater supplyRenewable energyProperty premium valueVolunteering
Welfare analysisEcosystems services approach
Regulating servicesBenefits obtained through the regulation of ecosystems processes
Carbon savings – transport & renewable energyDrainage, water conveyance & flood protectionWater regulation and pollution dilutionWater quality
Welfare analysisEcosystems services approach
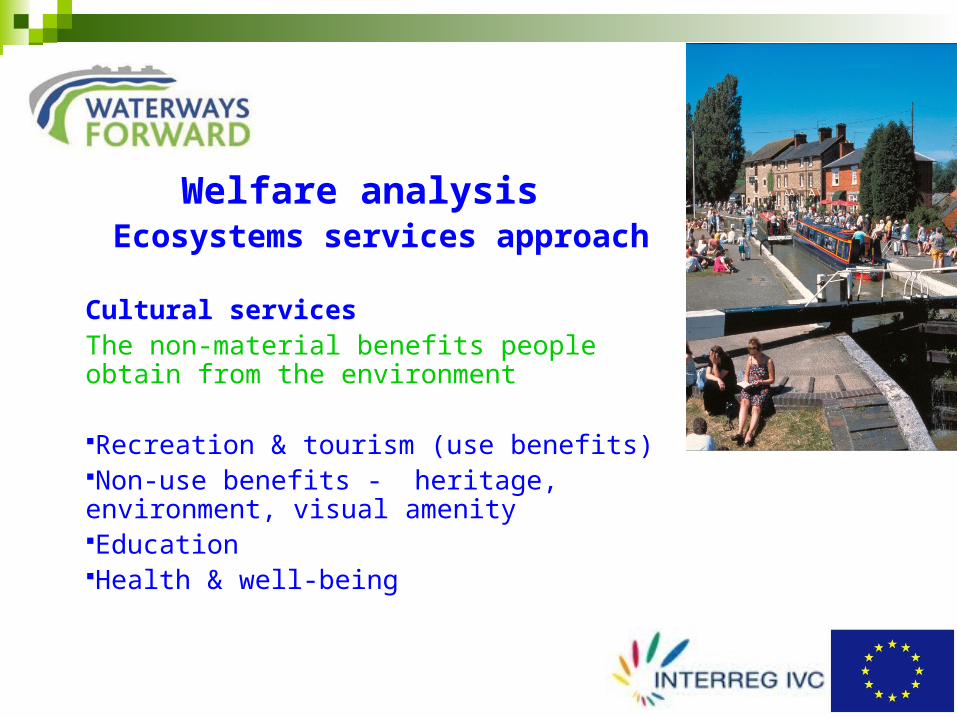
Cultural servicesThe non-material benefits people obtain from the environment
Recreation & tourism (use benefits)Non-use benefits - heritage, environment, visual amenityEducationHealth & well-being
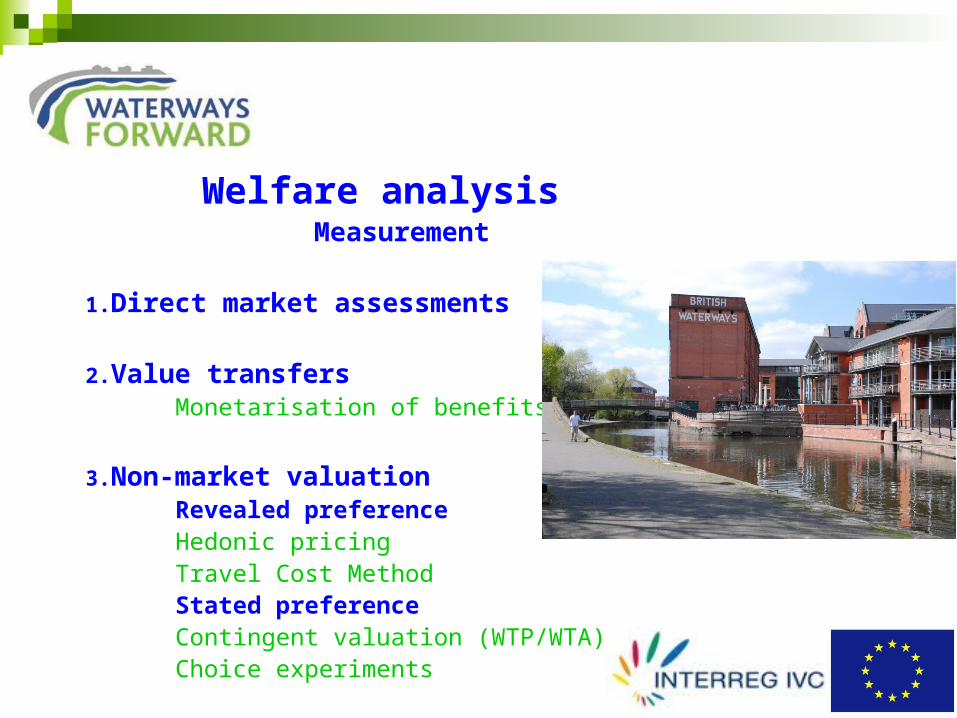
Welfare analysisMeasurement
1.Direct market assessments
2.Value transfersMonetarisation of benefits
3.Non-market valuationRevealed preferenceHedonic pricingTravel Cost MethodStated preferenceContingent valuation (WTP/WTA)Choice experiments
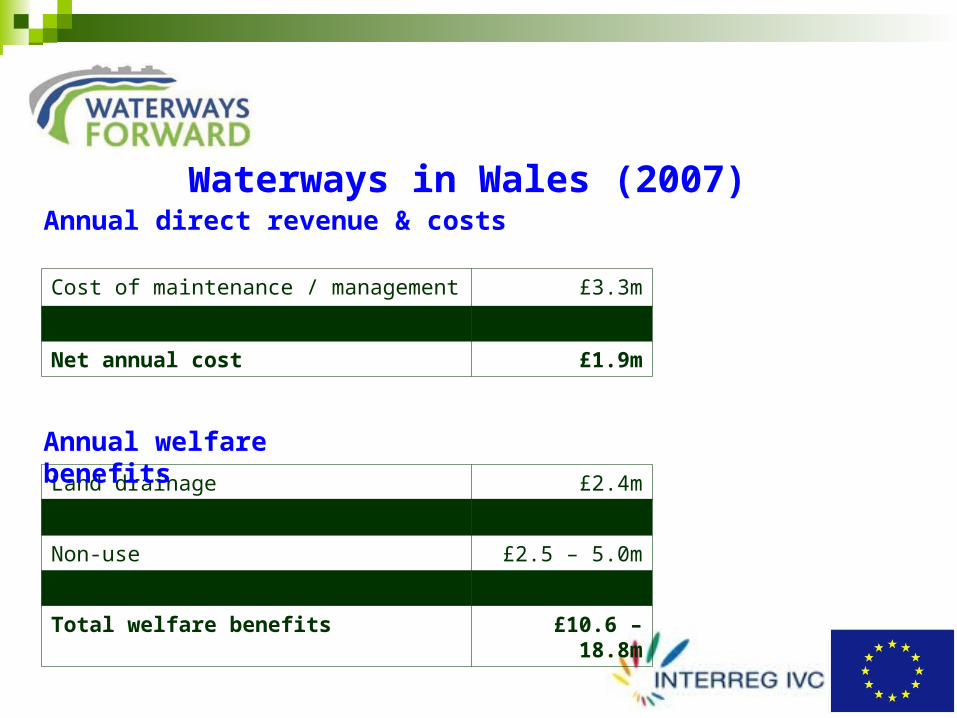
Waterways in Wales (2007)Annual direct revenue & costs
Cost of maintenance / management £3.3m
Income £1.4m
Net annual cost £1.9m
Land drainage £2.4m
Recreation / tourism £5.7 – 8.2m
Non-use £2.5 – 5.0m
Health & well-being £0.0 – 3.2m
Total welfare benefits £10.6 – 18.8m
Annual welfare benefits
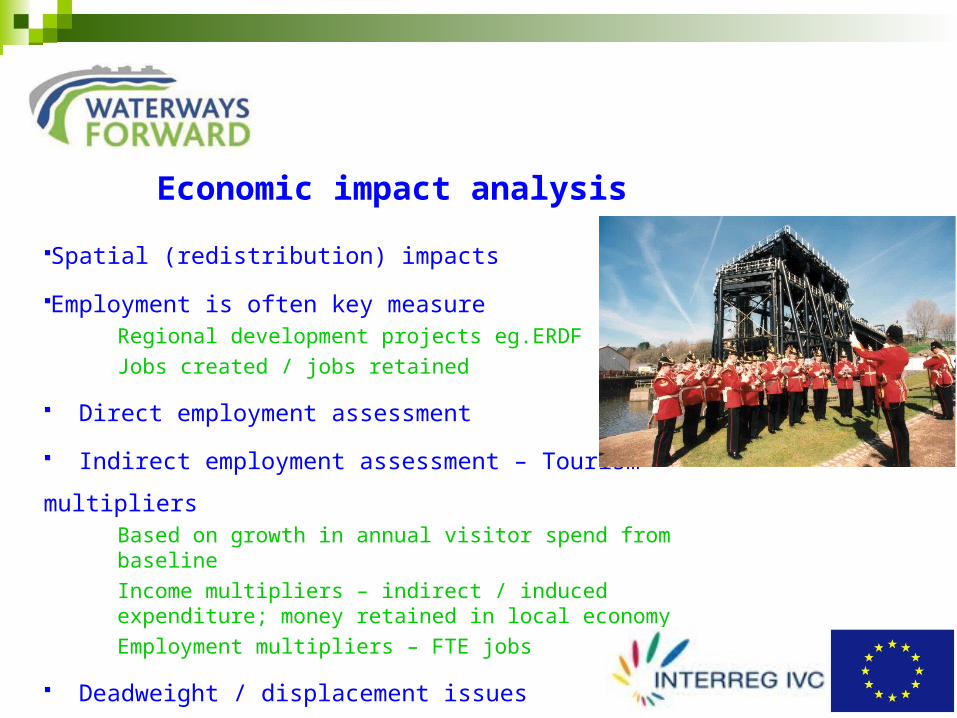
Economic impact analysis
Spatial (redistribution) impacts
Employment is often key measureRegional development projects eg.ERDF
Jobs created / jobs retained
Direct employment assessment
Indirect employment assessment – Tourism multipliersBased on growth in annual visitor spend from baseline
Income multipliers – indirect / induced expenditure; money retained in local economy
Employment multipliers – FTE jobs
Deadweight / displacement issues
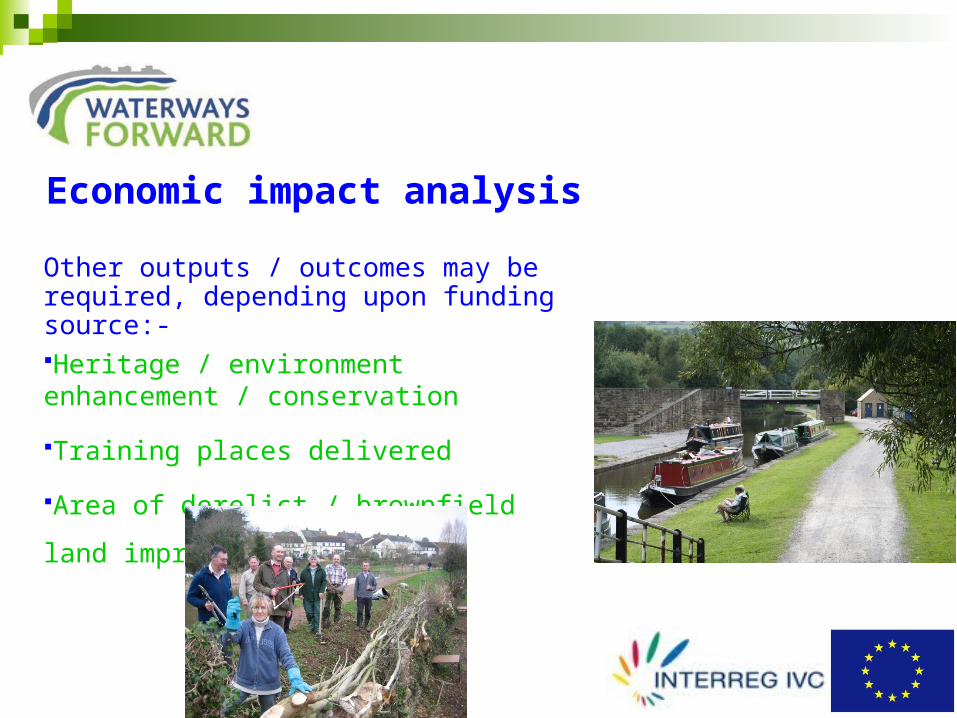
Economic impact analysis
Other outputs / outcomes may be required, depending upon funding source:-Heritage / environment enhancement / conservation
Training places delivered
Area of derelict / brownfield land improved
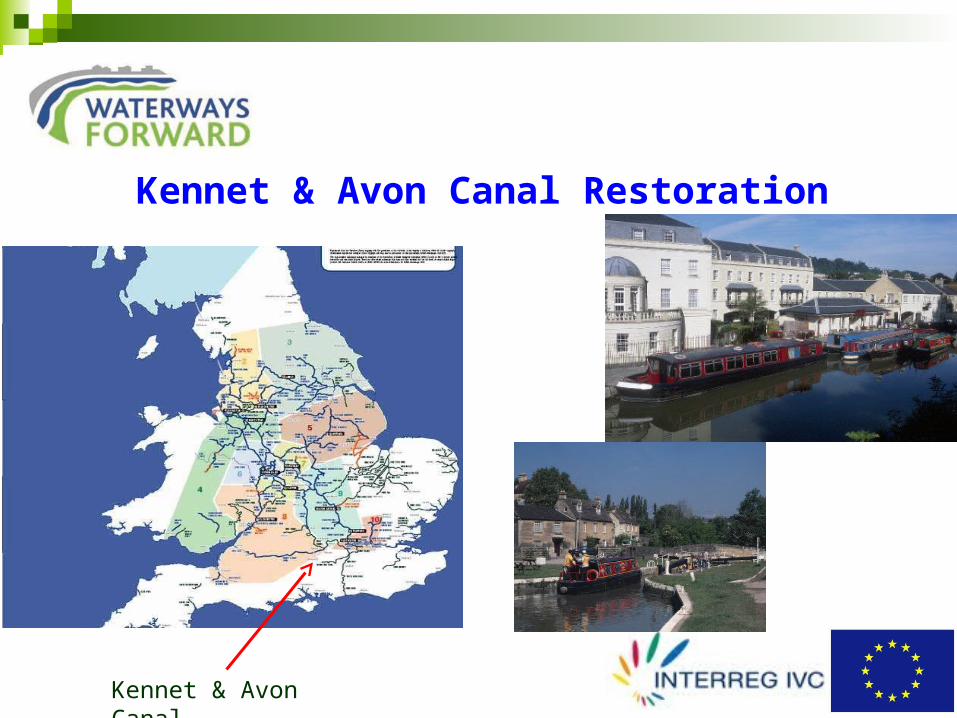
Kennet & Avon Canal Restoration
Kennet & Avon Canal
Kennet & Avon Canal Restoration140 km-long waterway, linking R.Thames with Bristol
Opened 1810
Closed to through navigation 1955Gradual re-opening over next 30 years through partnership comprising British Waterways, local authorities, canal trust & association of canal businesses
Re-opened 1990. However re-opening not sustainable in long-term€44m Heritage Lottery-funded scheme approved 1996 to secure the canal‘s long-term future
Canal officially re-opened 2003
Evaluation programme. Latest 2009
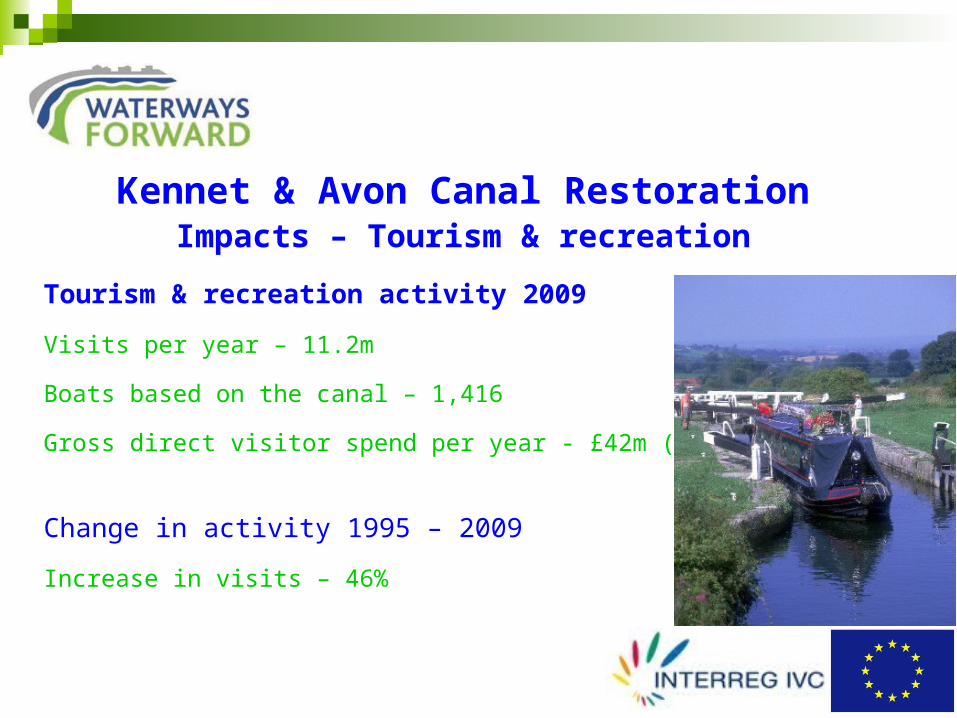
Kennet & Avon Canal RestorationImpacts – Tourism & recreation
Tourism & recreation activity 2009
Visits per year – 11.2m
Boats based on the canal – 1,416
Gross direct visitor spend per year - £42m (€49m)
Change in activity 1995 – 2009
Increase in visits – 46%
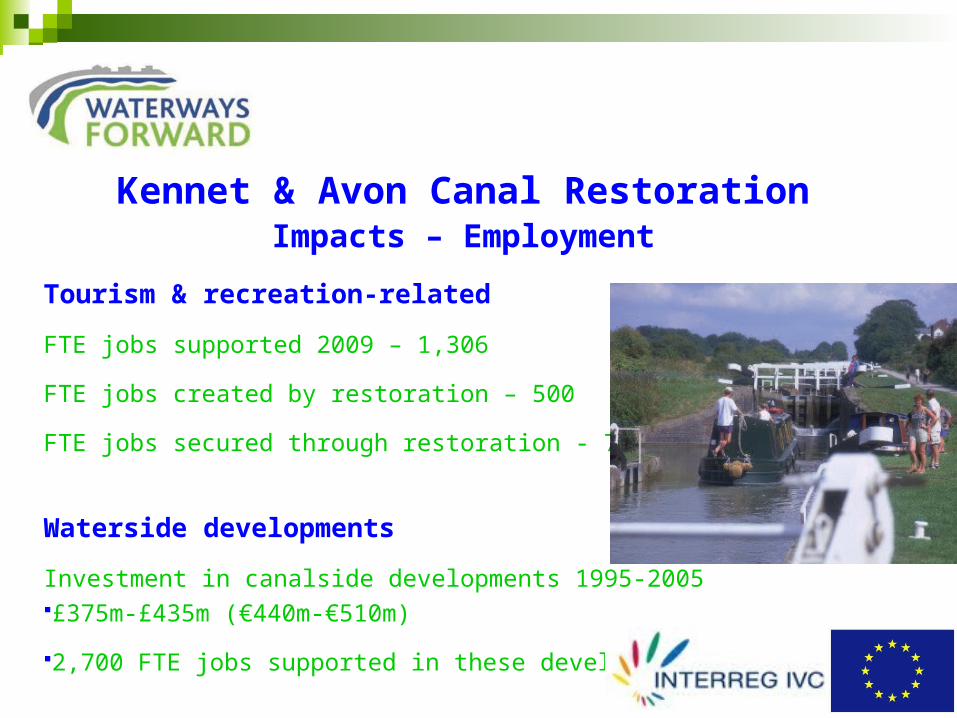
Kennet & Avon Canal RestorationImpacts – Employment
Tourism & recreation-related
FTE jobs supported 2009 – 1,306
FTE jobs created by restoration – 500
FTE jobs secured through restoration - 700
Waterside developments
Investment in canalside developments 1995-2005 £375m-£435m (€440m-€510m)
2,700 FTE jobs supported in these developments
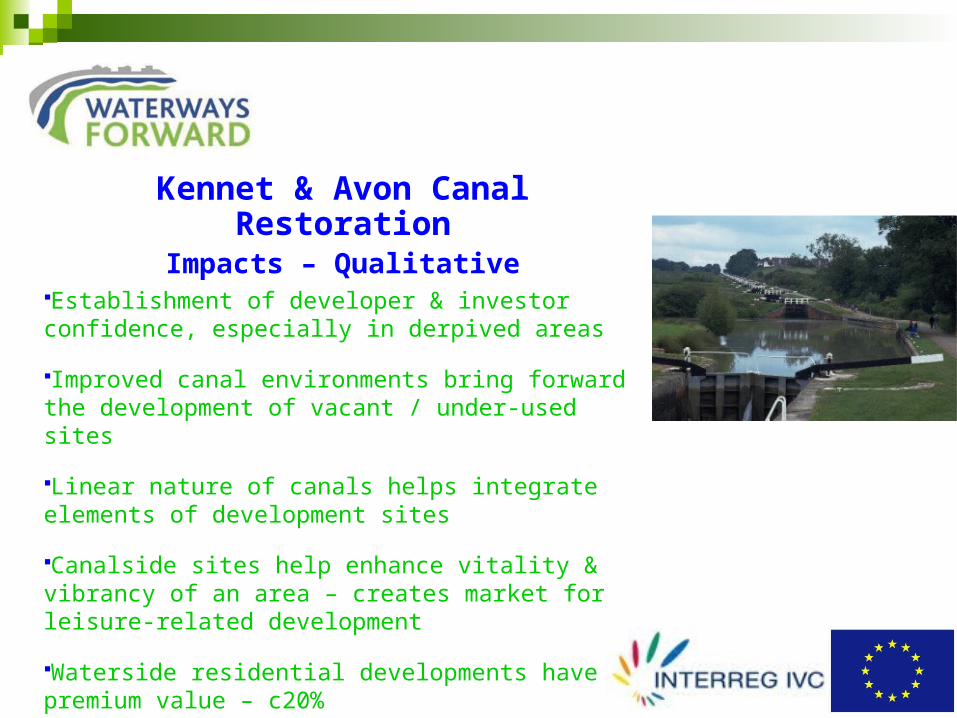
Kennet & Avon Canal RestorationImpacts – Qualitative
Establishment of developer & investor confidence, especially in derpived areas
Improved canal environments bring forward the development of vacant / under-used sites
Linear nature of canals helps integrate elements of development sites
Canalside sites help enhance vitality & vibrancy of an area – creates market for leisure-related development
Waterside residential developments have premium value – c20%
Sustainability (QoL) IndicatorsBrings together welfare & economic impact assessments into a single framework
Related to sustainability priorities (eg. In England – National Quality of Life Count indicators)
Indicators may be monetarised, other quantitative, qualitative, physical or descriptive
Drives the monitoring & evaluation framework for a project
Helps resolve conflicting priorities
Process and result indicators
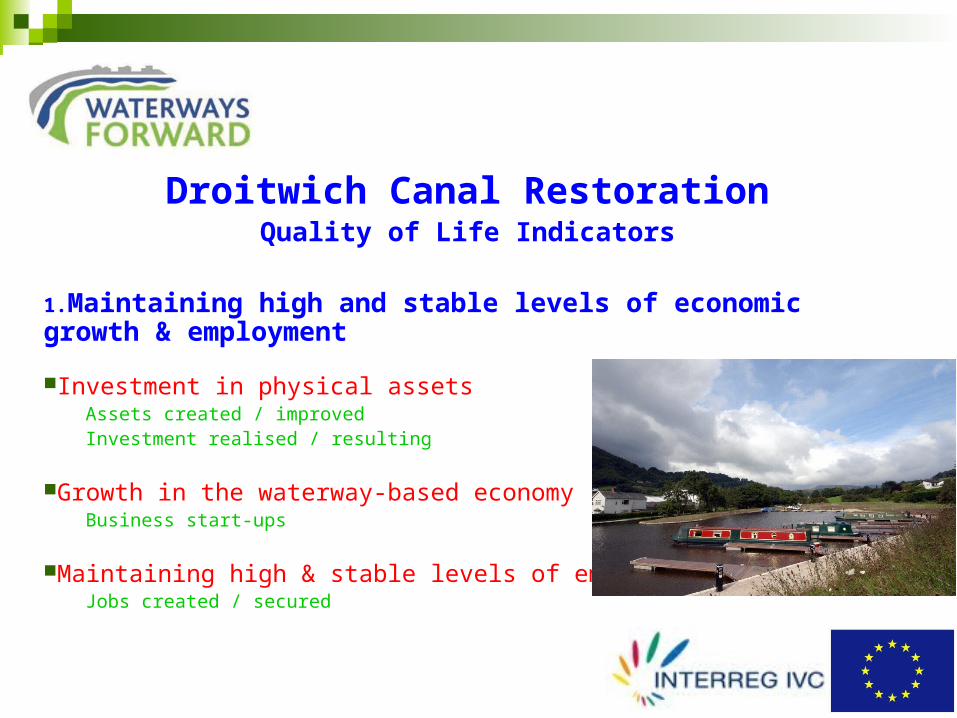
Droitwich Canal RestorationQuality of Life Indicators
1.Maintaining high and stable levels of economic growth & employment
Investment in physical assetsAssets created / improvedInvestment realised / resulting
Growth in the waterway-based economyBusiness start-ups
Maintaining high & stable levels of employmentJobs created / secured
Droitwich Canal RestorationQuality of Life Indicators
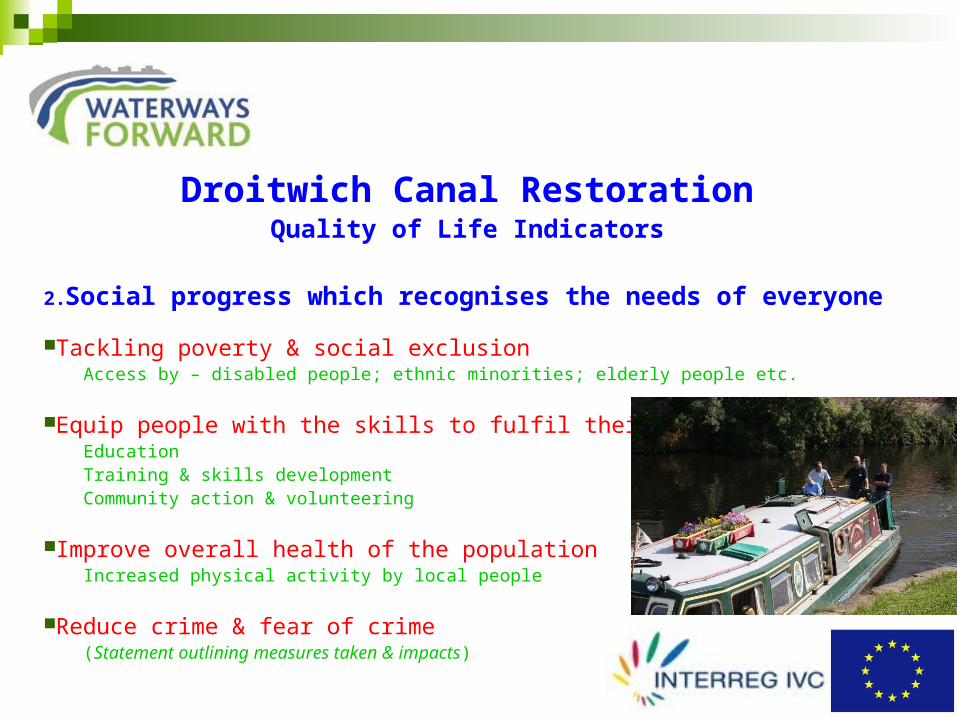
2.Social progress which recognises the needs of everyone
Tackling poverty & social exclusionAccess by – disabled people; ethnic minorities; elderly people etc.
Equip people with the skills to fulfil their potentialEducationTraining & skills developmentCommunity action & volunteering
Improve overall health of the populationIncreased physical activity by local people
Reduce crime & fear of crime(Statement outlining measures taken & impacts)
Droitwich Canal RestorationQuality of Life Indicators
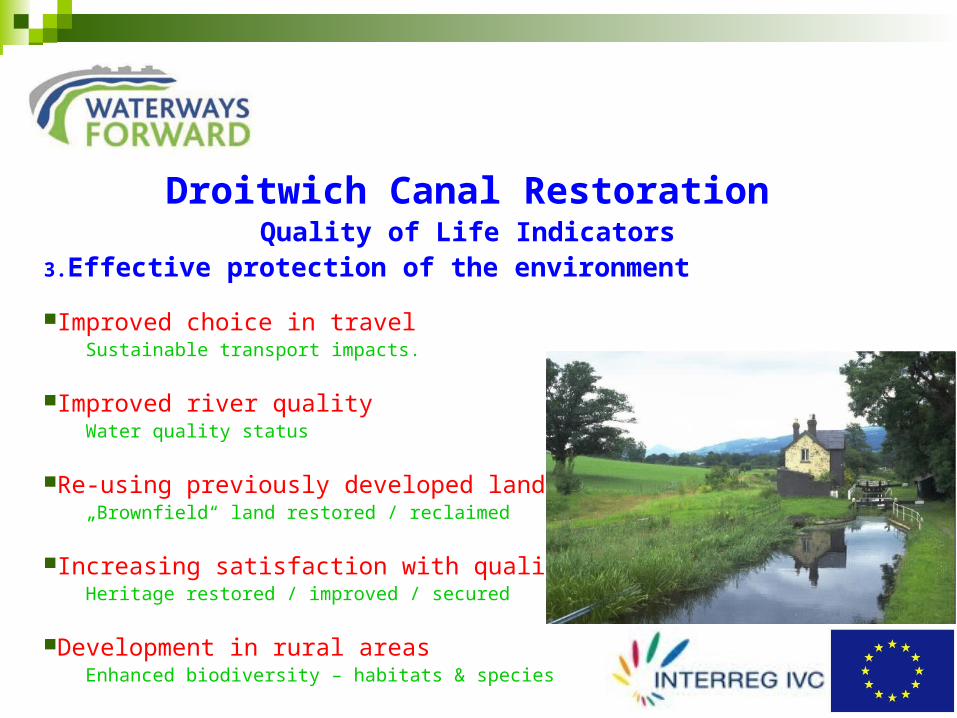
3.Effective protection of the environment
Improved choice in travelSustainable transport impacts.
Improved river qualityWater quality status
Re-using previously developed land„Brownfield“ land restored / reclaimed
Increasing satisfaction with quality of lifeHeritage restored / improved / secured
Development in rural areasEnhanced biodiversity – habitats & species
Droitwich Canal RestorationQuality of Life Indicators
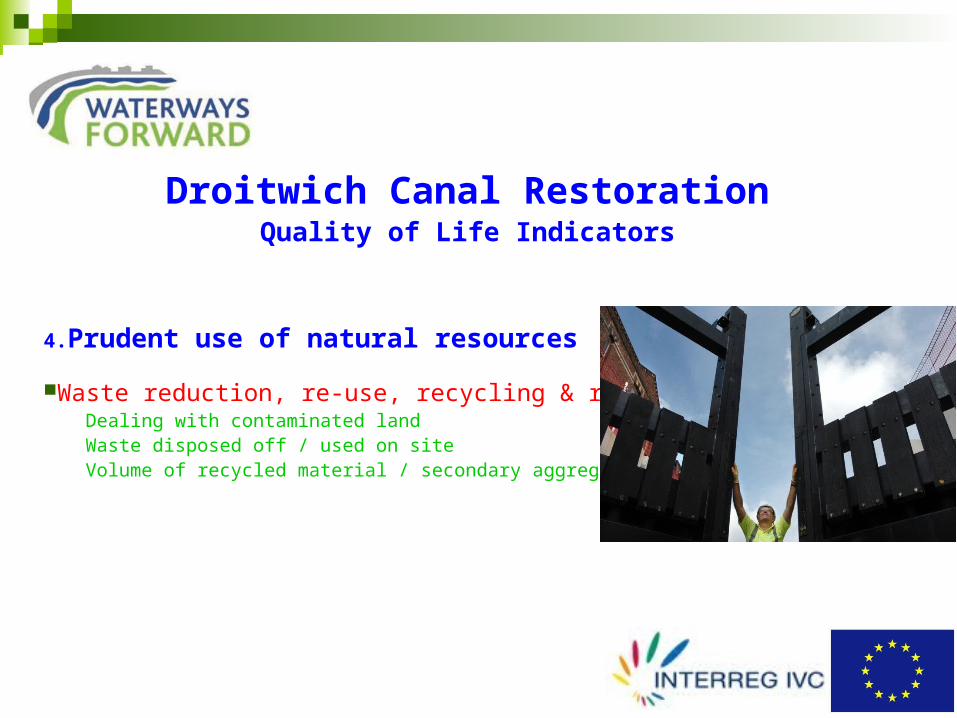
4.Prudent use of natural resources
Waste reduction, re-use, recycling & recoveryDealing with contaminated landWaste disposed off / used on siteVolume of recycled material / secondary aggregates used


![Woodlands Waterway Hotel & Convention Center Marriott · 2020-06-12 · [Type text] Woodlands Waterway Hotel & Convention Center Marriott WOODLANDS WATERWAY MARRIOTT 1601 Lake Robbins](https://img.pdfslide.us/doc/110x75/5f1dd2abf40d40013c6e4fdb/woodlands-waterway-hotel-convention-center-2020-06-12-type-text-woodlands.jpg)