Embed Size (px)
Citation preview
Watershed Modeling and GIS Applications
Jeff ArnoldARS- Temple, Texas
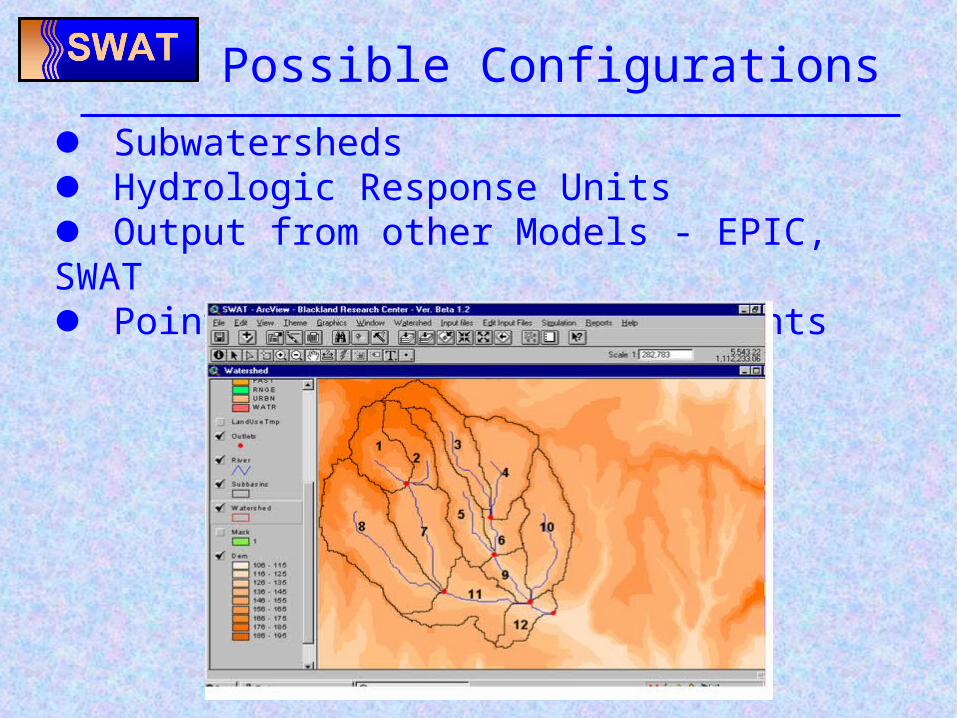
Subwatersheds Hydrologic Response Units Output from other Models - EPIC, SWAT Point Sources - Treatment Plants
Possible Configurations
Stream Delineation
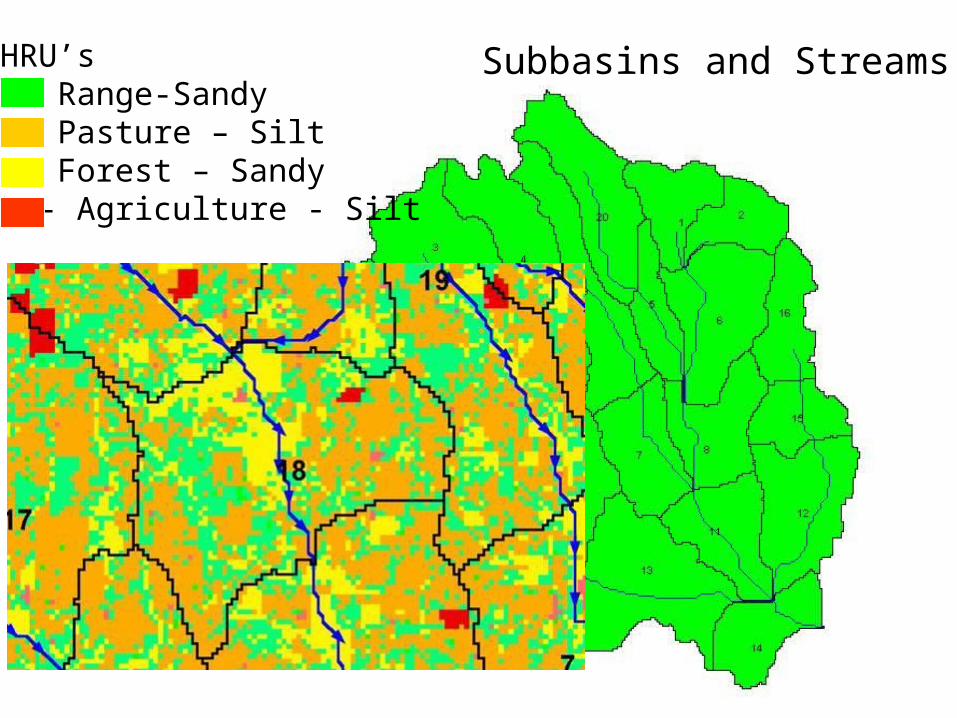
Subbasins and Streams HRU’s28% Range-Sandy51% Pasture – Silt16% Forest – Sandy4% - Agriculture - Silt
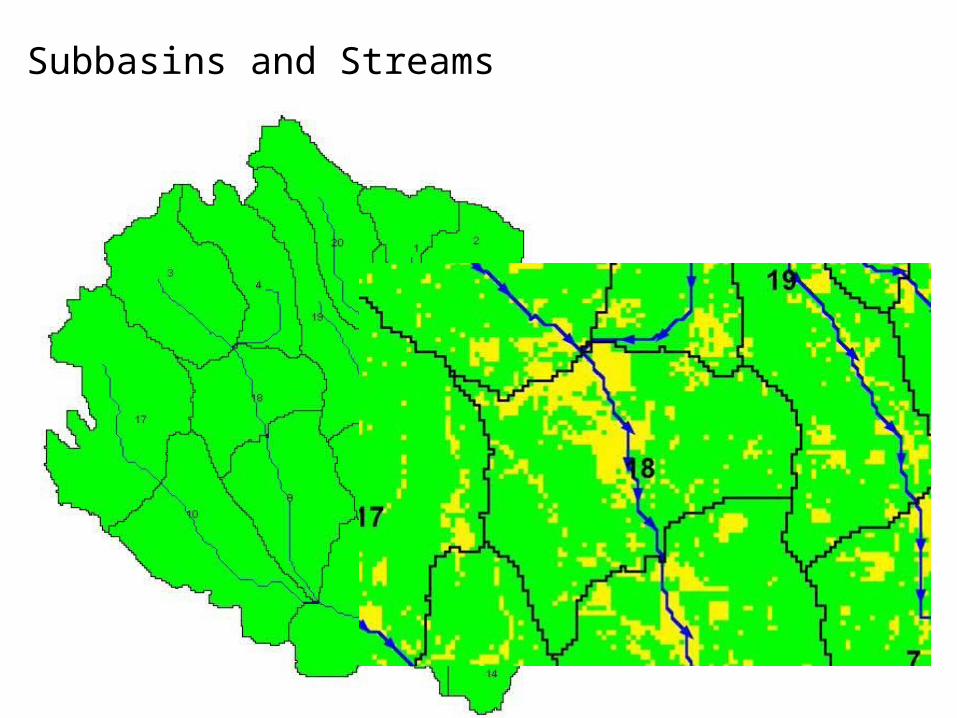
Subbasins and Streams
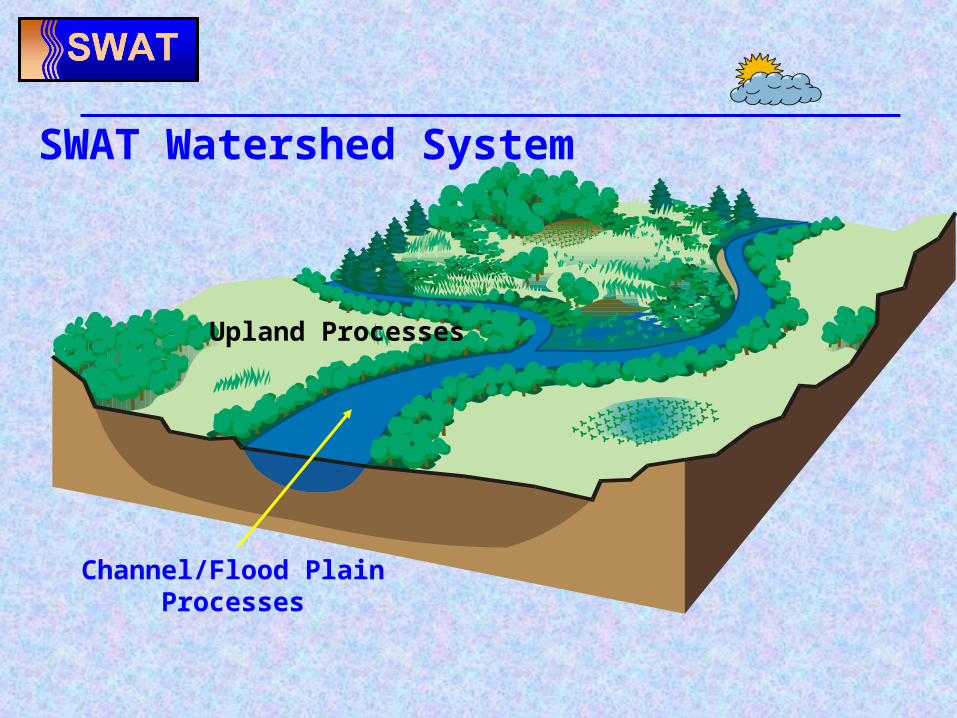
Upland Processes
SWAT Watershed System
Channel/Flood PlainProcesses
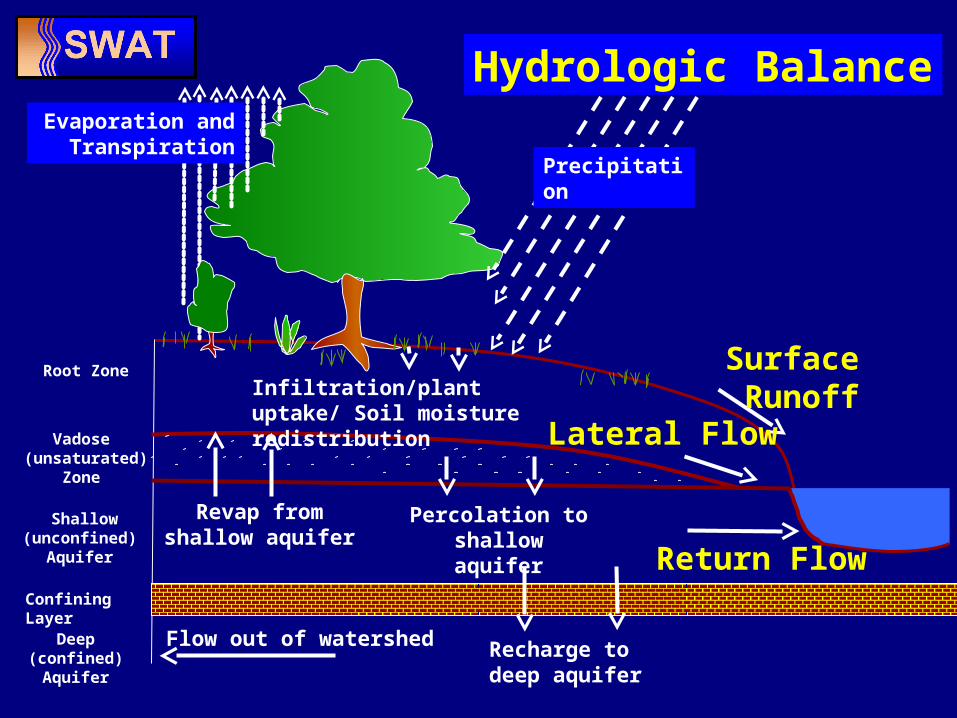
Root Zone
Shallow (unconfined)
Aquifer
Vadose (unsaturated)
Zone
Confining Layer
Deep (confined) Aquifer
Precipitation
Evaporation and Transpiration
Infiltration/plant uptake/ Soil moisture redistribution
Surface Runoff
Lateral Flow
Return Flow
Revap from shallow aquifer
Percolation to shallow aquifer
Recharge to deep aquifer
Flow out of watershed
Hydrologic Balance
Root Zone
Shallow (unconfined)
Aquifer
Vadose (unsaturated)
Zone
Confining Layer
Deep (confined) Aquifer
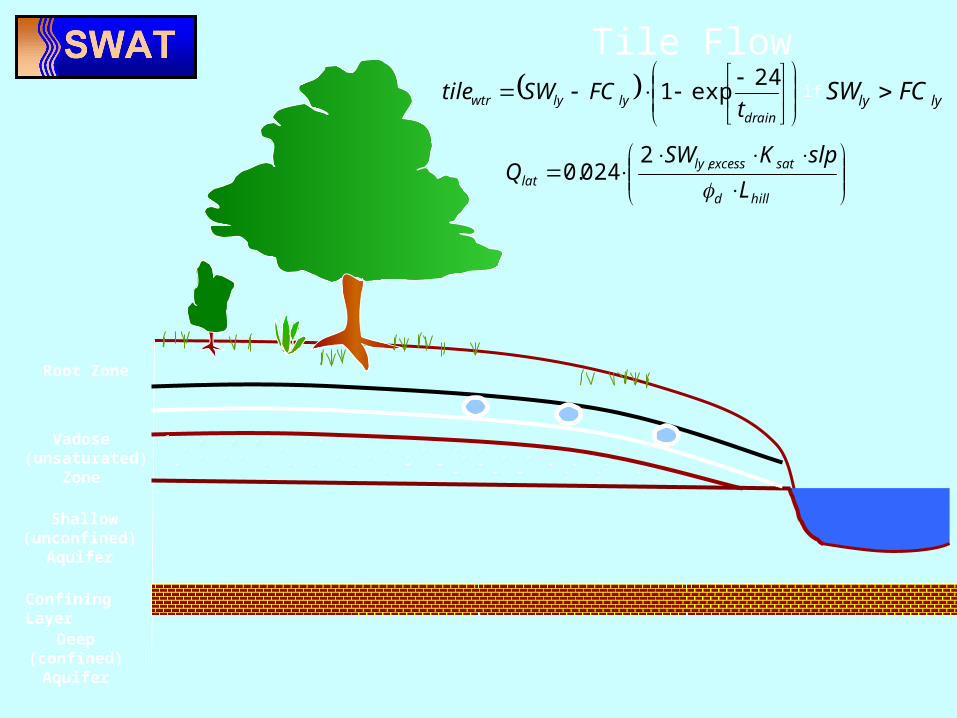
drainlylywtr t
FCSWtile24
exp1 lyly FCSW if
hilld
satexcesslylat L
slpKSWQ
,2
024.0
Tile Flow
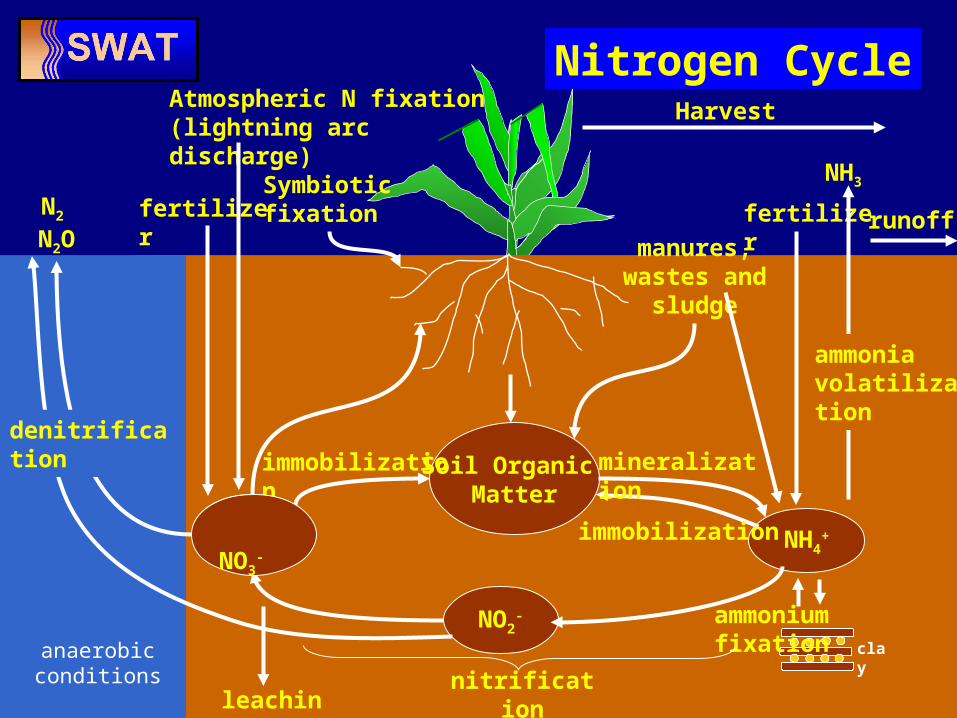
NO3- NH4
+
Soil Organic Matter
NO2-
manures, wastes and
sludge
ammonium fixation clay
mineralization
immobilization
nitrification
immobilization
Symbiotic fixation
NO3
-
anaerobicconditions
N2
N2O
NH3
Atmospheric N fixation (lightning arc discharge)
leaching
fertilizer fertilizer
Harvest
Nitrogen Cycle
denitrification
ammonia volatilization
runoff
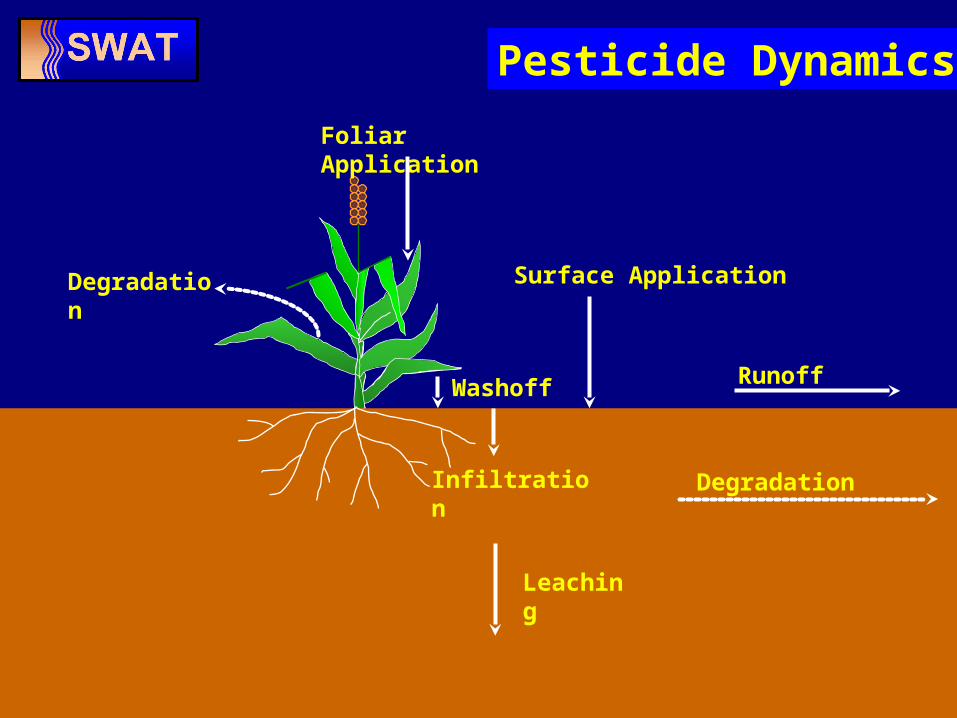
Pesticide Dynamics
Foliar Application
Degradation
Washoff
Infiltration
Leaching
Runoff
Surface Application
Degradation
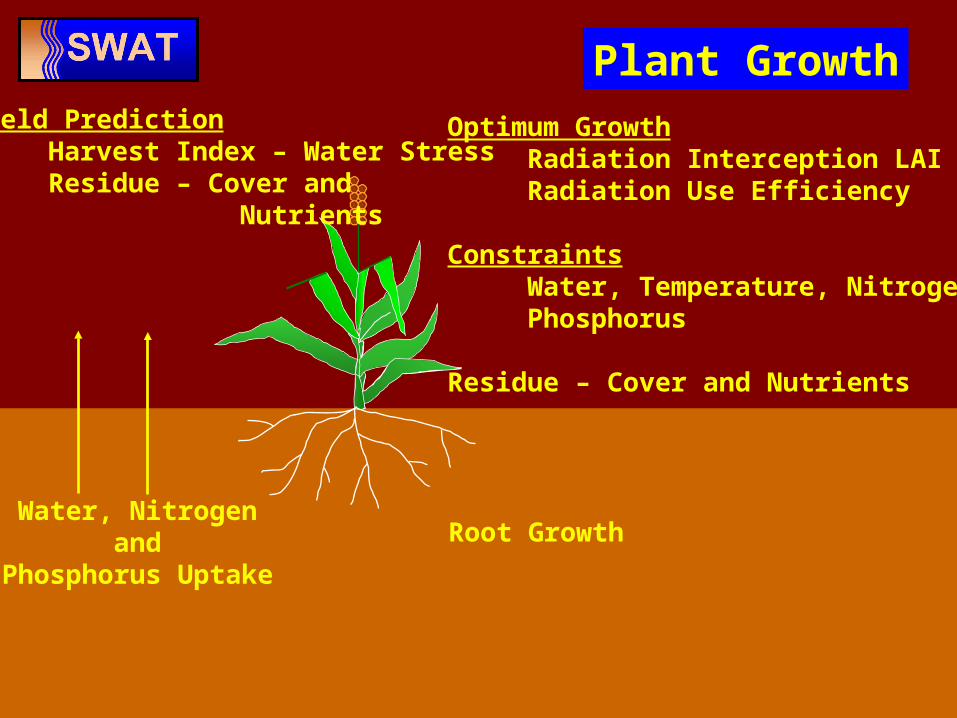
Water, Nitrogenand
Phosphorus Uptake
Plant GrowthOptimum Growth Radiation Interception LAI Radiation Use Efficiency
Constraints Water, Temperature, Nitrogen, Phosphorus
Residue – Cover and Nutrients
Yield Prediction Harvest Index – Water Stress Residue – Cover and Nutrients
Root Growth
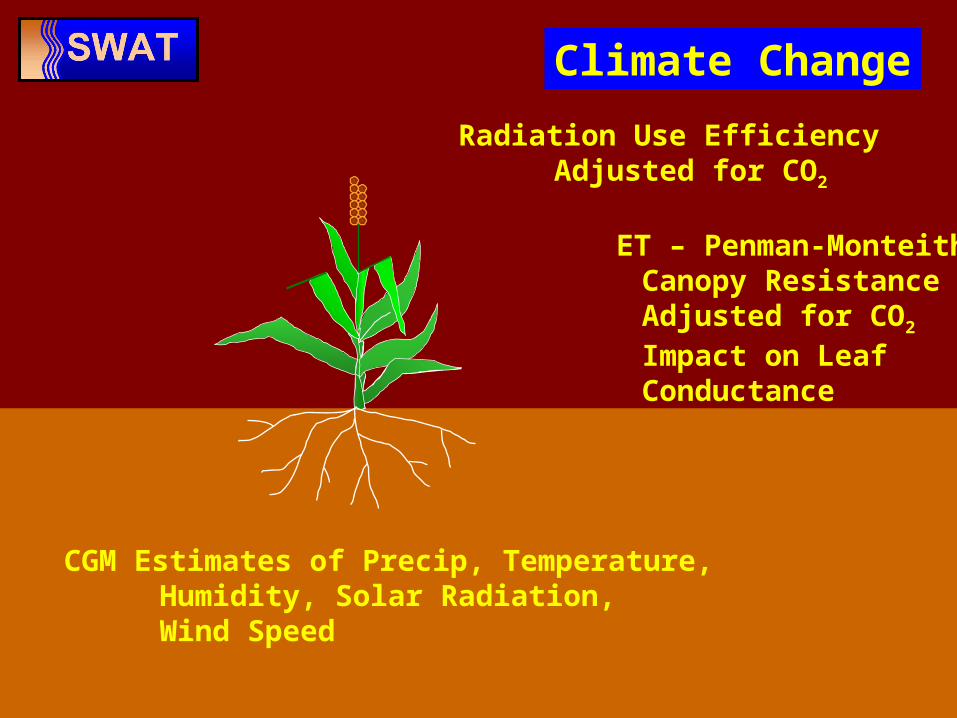
Climate Change
Radiation Use EfficiencyAdjusted for CO2
ET – Penman-Monteith Canopy Resistance Adjusted for CO2
Impact on Leaf Conductance
CGM Estimates of Precip, Temperature, Humidity, Solar Radiation,Wind Speed
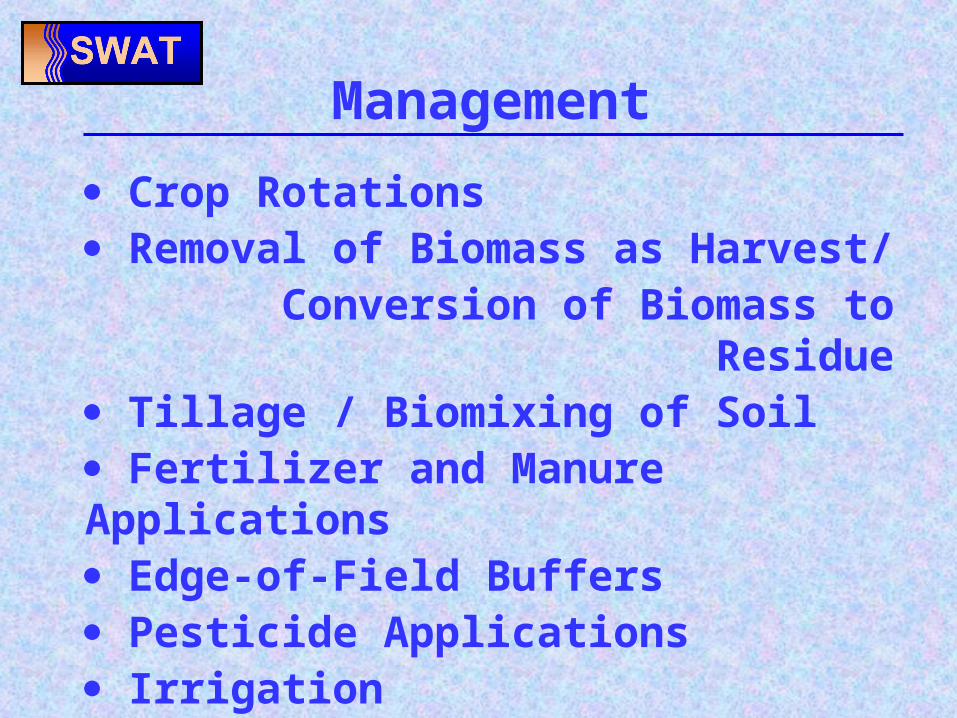
Crop Rotations Removal of Biomass as Harvest/
Conversion of Biomass to Residue
Tillage / Biomixing of Soil Fertilizer and Manure Applications Edge-of-Field Buffers Pesticide Applications Irrigation Water Impoundment (Wetlands, Rice)
Management
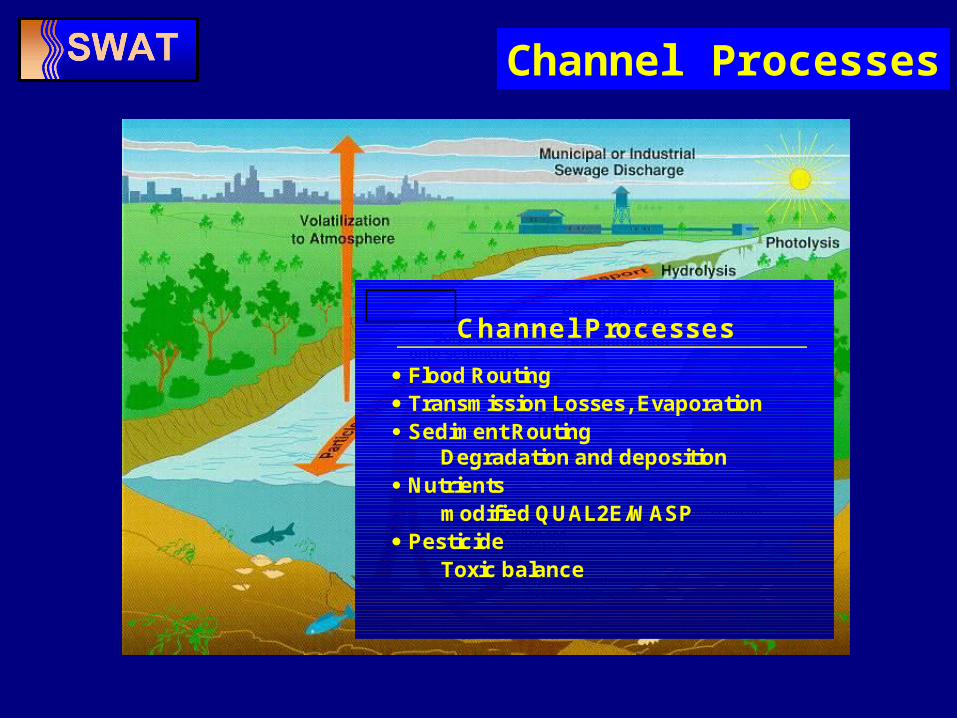
Channel Processes
Channel Processes
Flood Routing Transmission Losses, Evaporation Sediment Routing
Degradation and deposition Nutrients
modified QUAL2E/WASP Pesticide
Toxic balance
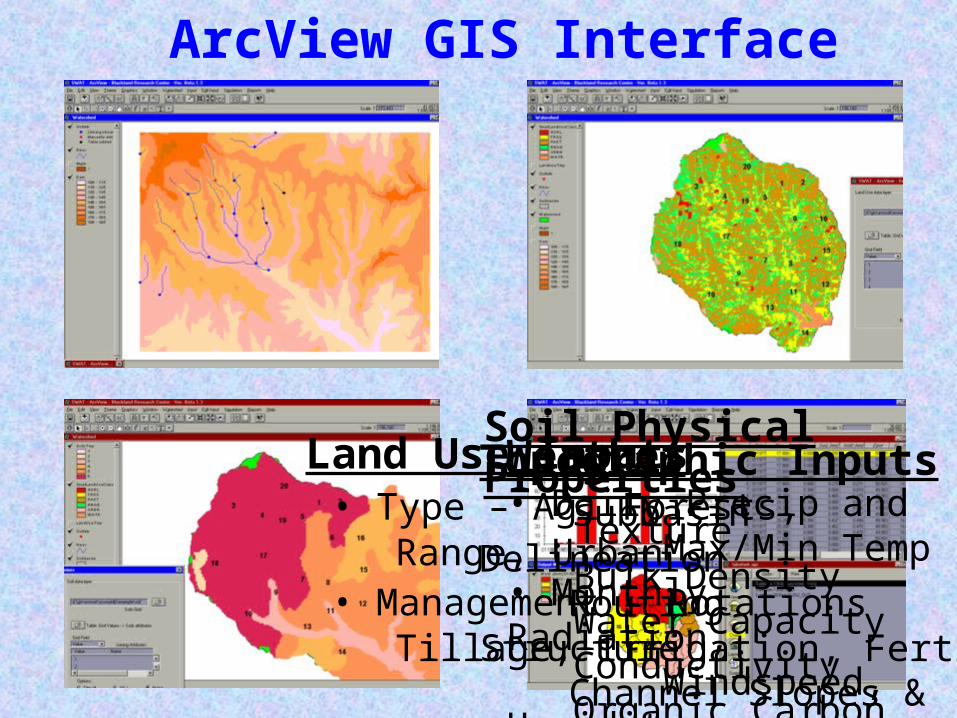
ArcView GIS Interface
Topographic Inputs Subbasin Delineation Routing Structure Channel Slopes & Lengths Overland Slopes & Lengths
Land Use Inputs • Type – Ag, Forests, Range, Urban • Management – Rotations Tillage, Irrigation, Fertilizer
Soil Physical Properties Texture Bulk Density Water Capacity Conductivity Organic Carbon
Weather• Daily Precip and Max/Min Temp• Monthly Radiation, Windspeed, Humidity
US EPA – Watershed Assessments NRCS – National Conservation Assessments
Climate Change Water Supply – Irrigation Management
Need for Models in the U.S.
No Waters Listed< 5%5-10%10-25%> 25%
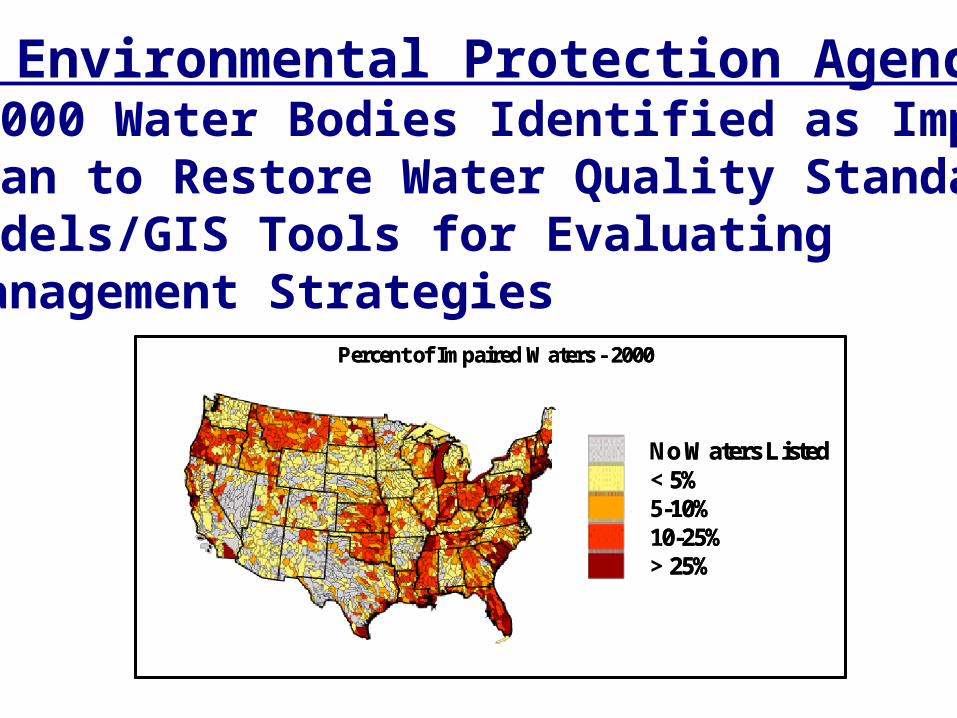
Percent of Impaired Waters - 2000
No Waters Listed< 5%5-10%10-25%> 25%
Percent of Impaired Waters - 2000
U.S. Environmental Protection Agency• 15,000 Water Bodies Identified as Impaired• Plan to Restore Water Quality Standards• Models/GIS Tools for Evaluating
Management Strategies
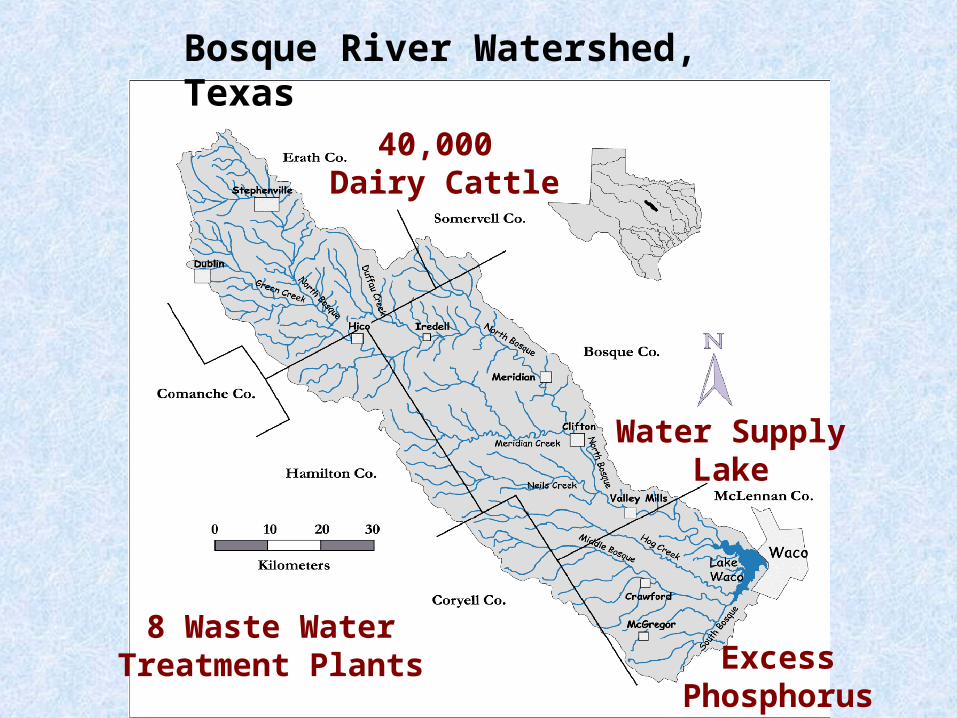
Bosque River Watershed, Texas
8 Waste WaterTreatment Plants
40,000 Dairy Cattle
Water SupplyLake
ExcessPhosphorus
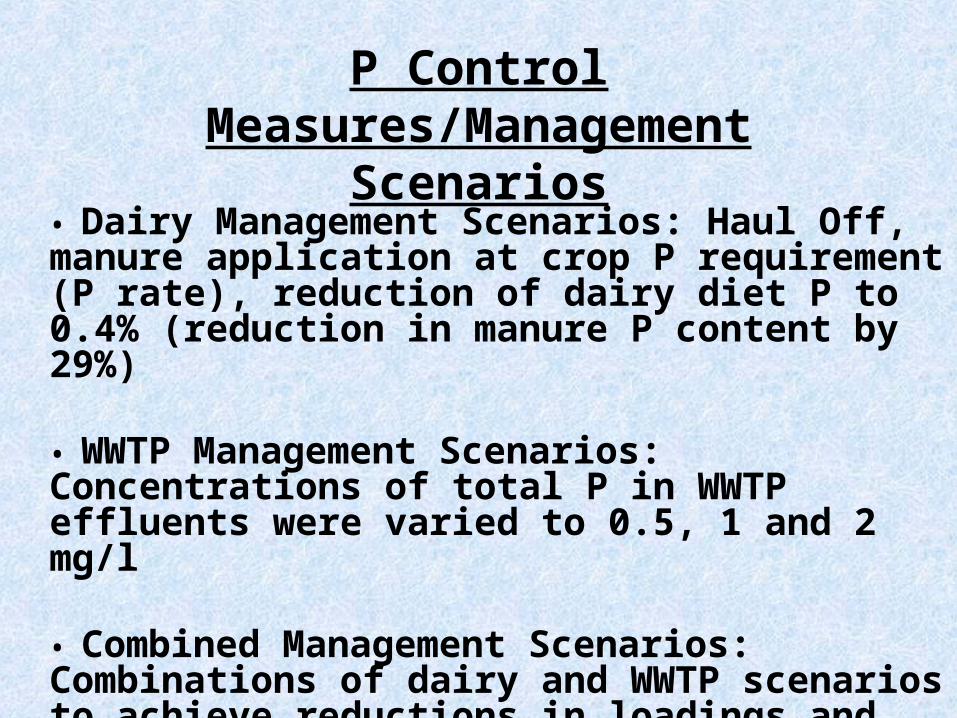
P Control Measures/Management
Scenarios• Dairy Management Scenarios: Haul Off, manure application at crop P requirement (P rate), reduction of dairy diet P to 0.4% (reduction in manure P content by 29%)
• WWTP Management Scenarios: Concentrations of total P in WWTP effluents were varied to 0.5, 1 and 2 mg/l
• Combined Management Scenarios: Combinations of dairy and WWTP scenarios to achieve reductions in loadings and concentrations
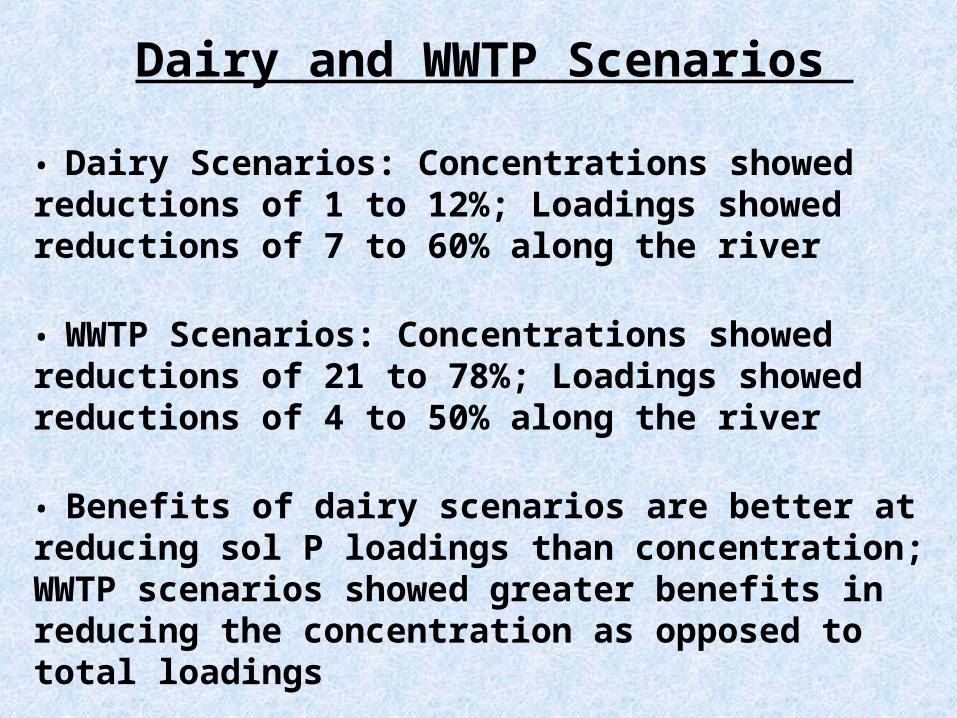
• Dairy Scenarios: Concentrations showed reductions of 1 to 12%; Loadings showed reductions of 7 to 60% along the river
• WWTP Scenarios: Concentrations showed reductions of 21 to 78%; Loadings showed reductions of 4 to 50% along the river
• Benefits of dairy scenarios are better at reducing sol P loadings than concentration; WWTP scenarios showed greater benefits in reducing the concentration as opposed to total loadings
Dairy and WWTP Scenarios
National Assessment ofConservation Programs
• Conservation Tillage Systems• Buffers and Grass Waterways• Manure and Fertilizer
Management
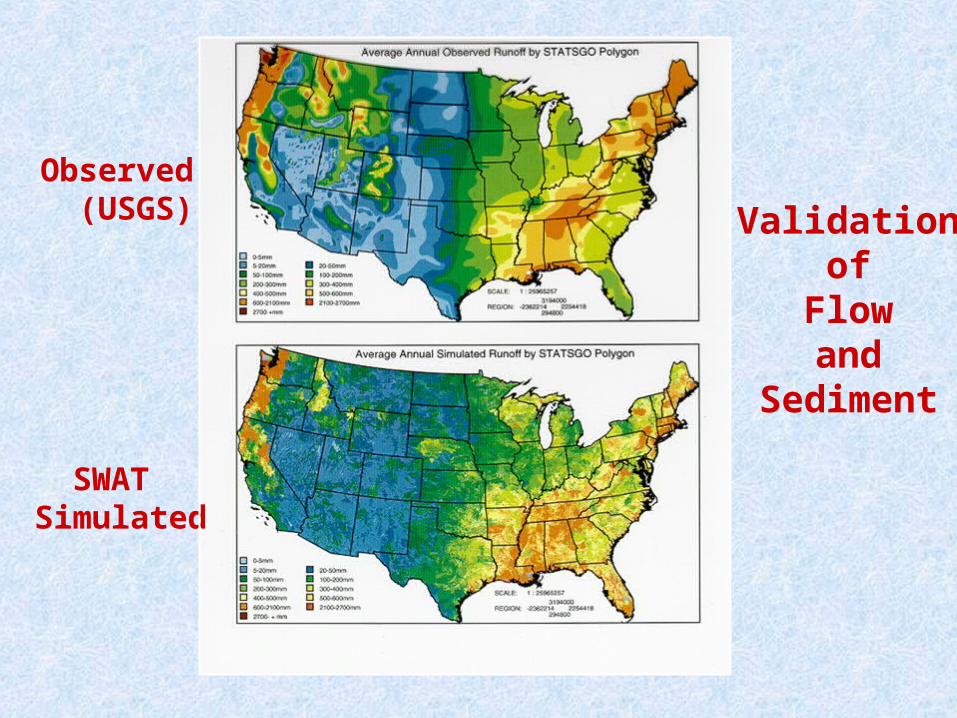
Observed (USGS)
SWATSimulated
Validationof
Flowand
Sediment
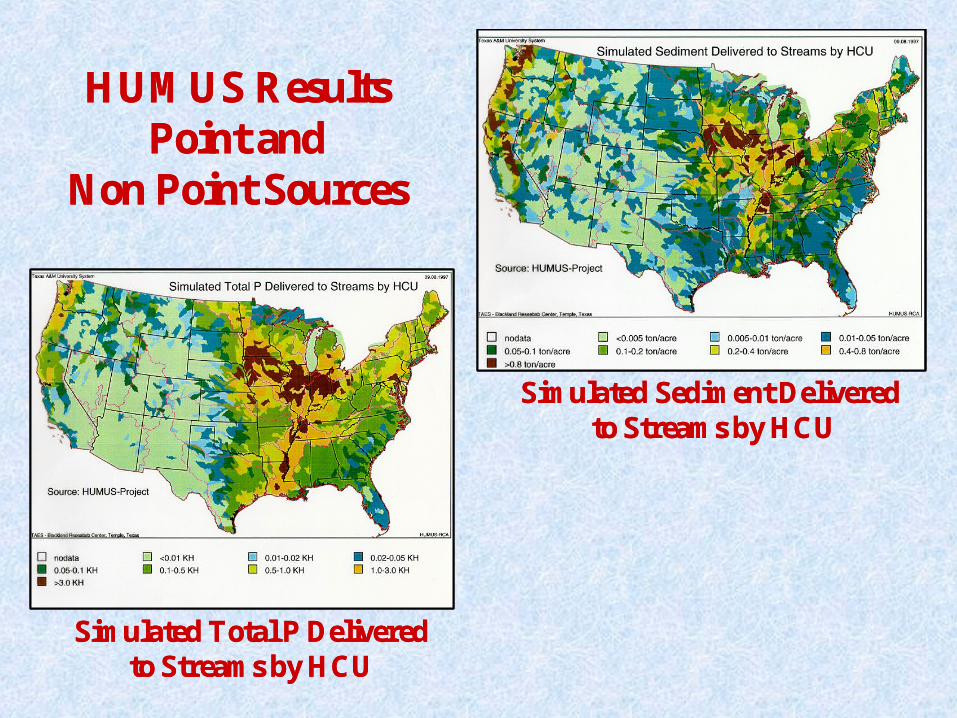
Simulated Total P Deliveredto Streams by HCU
Simulated Sediment Deliveredto Streams by HCU
HUMUS ResultsPoint and
Non Point Sources
Simulated Total P Deliveredto Streams by HCU
Simulated Sediment Deliveredto Streams by HCU
HUMUS ResultsPoint and
Non Point Sources
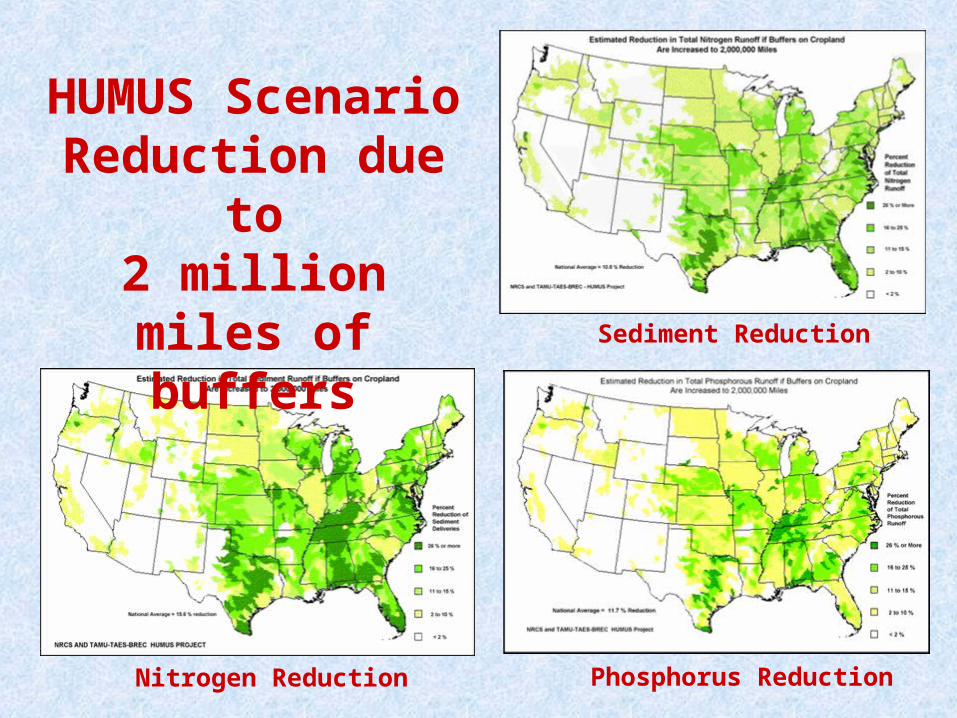
HUMUS ScenarioReduction due to2 million miles of
buffersSediment Reduction
Phosphorus ReductionNitrogen Reduction
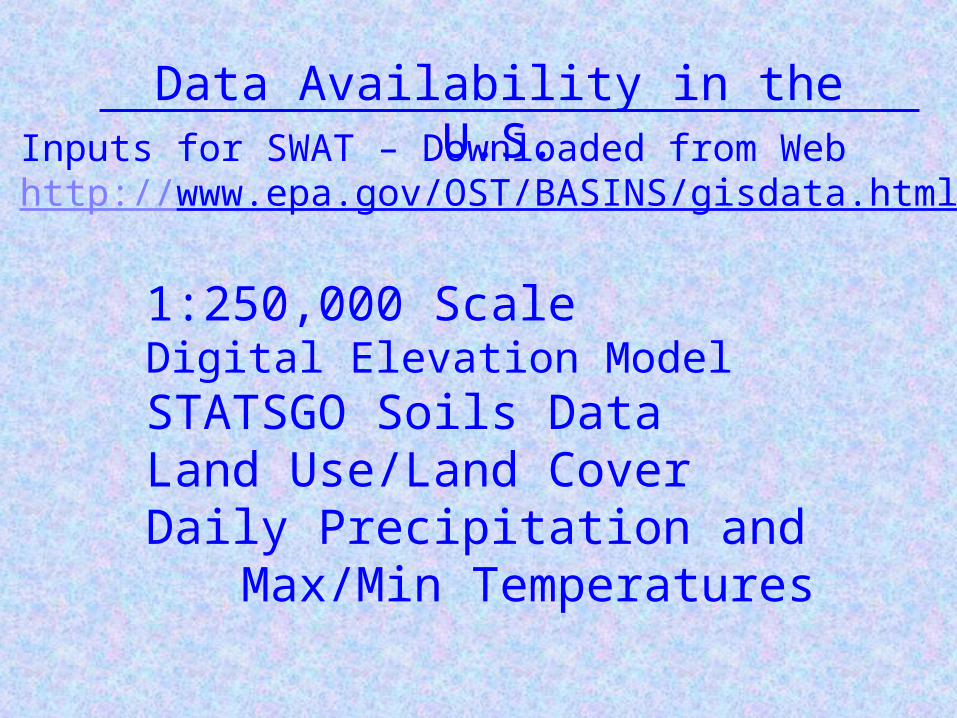
Data Availability in the U.S.Inputs for SWAT – Downloaded from Webhttp://www.epa.gov/OST/BASINS/gisdata.html
1:250,000 ScaleDigital Elevation ModelSTATSGO Soils DataLand Use/Land CoverDaily Precipitation and
Max/Min Temperatures
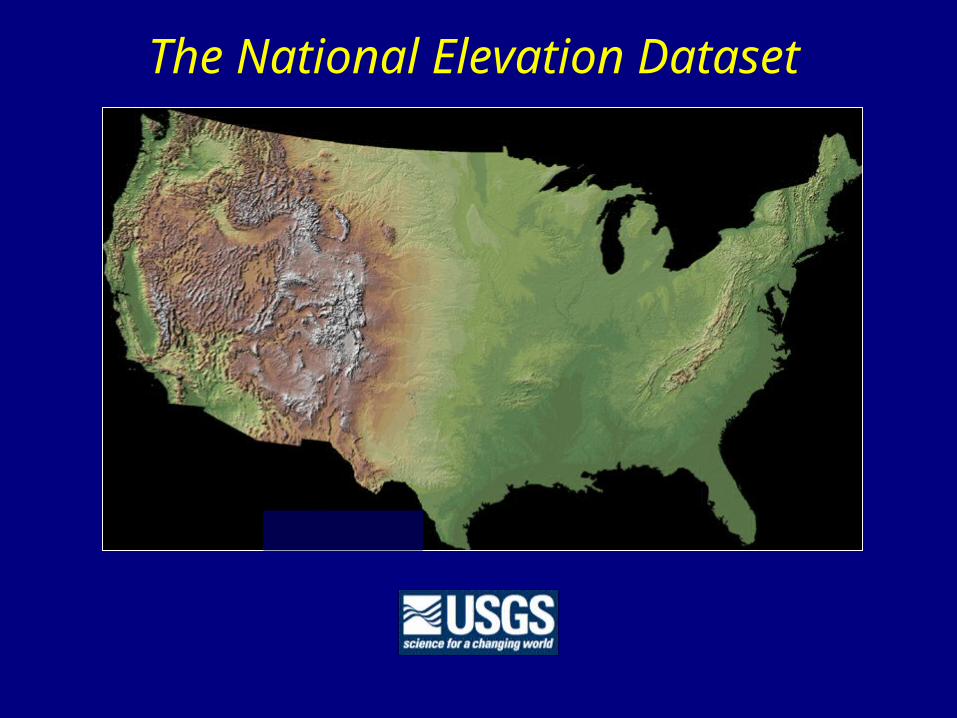
The National Elevation Dataset
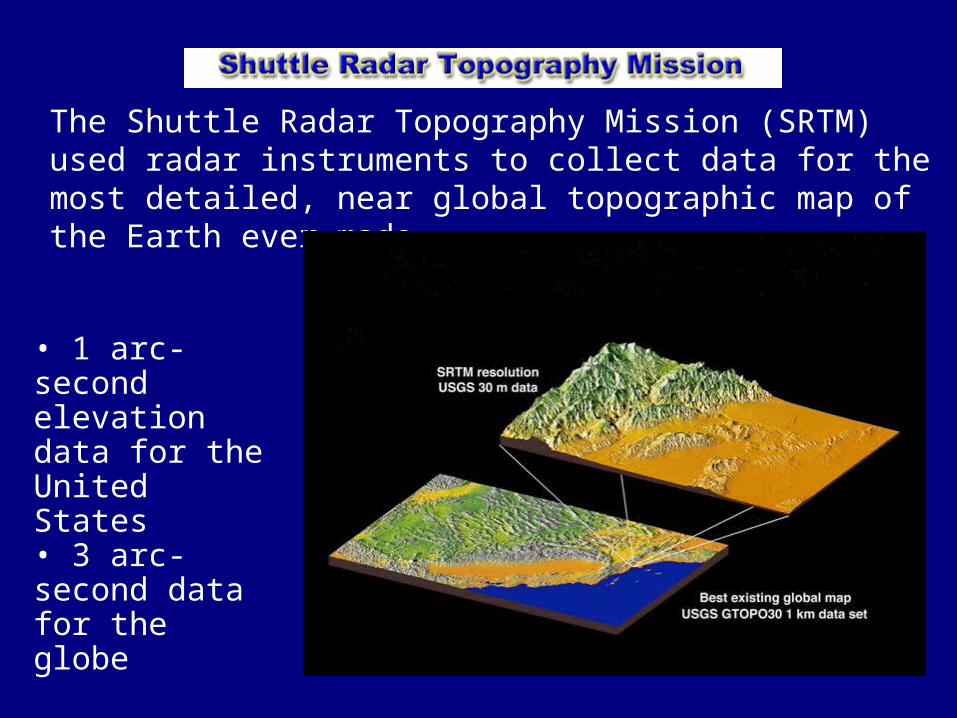
The Shuttle Radar Topography Mission (SRTM) used radar instruments to collect data for the most detailed, near global topographic map of the Earth ever made
• 1 arc-second elevation data for the United States• 3 arc-second data for the globe
1-arc second (30 meter) SRTM data postings of the continental United States can now be obtained in two ways via the USGS EDC Seamless Distribution System:
http://seamless.usgs.gov/
• Electronic Download
• Media (CD)
Updated 21 May 2003
USGS is now distributing elevation data from SRTM for South America and North America - 90m resolution
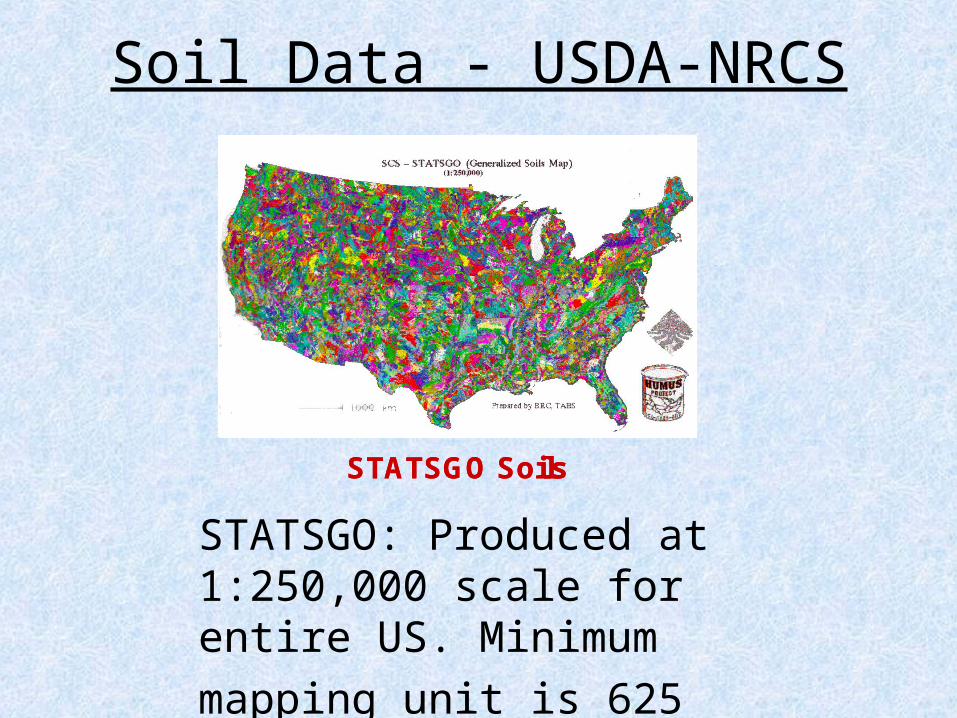
STATSGO SoilsSTATSGO SoilsSTATSGO Soils
STATSGO: Produced at 1:250,000 scale for entire US. Minimum
mapping unit is 625 hectares.
Soil Data - USDA-NRCS
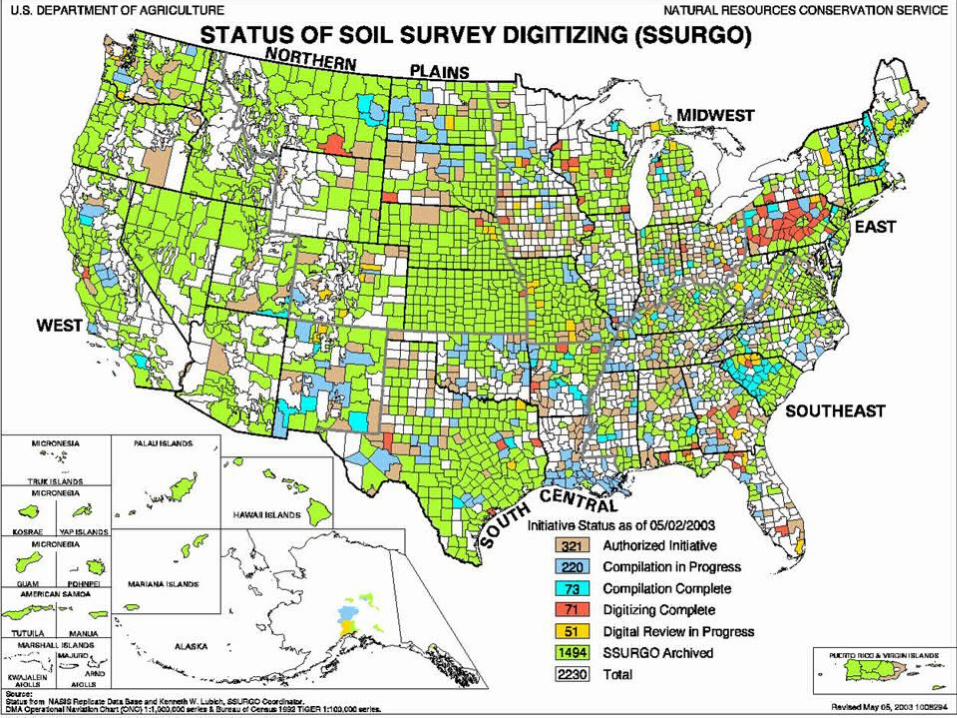
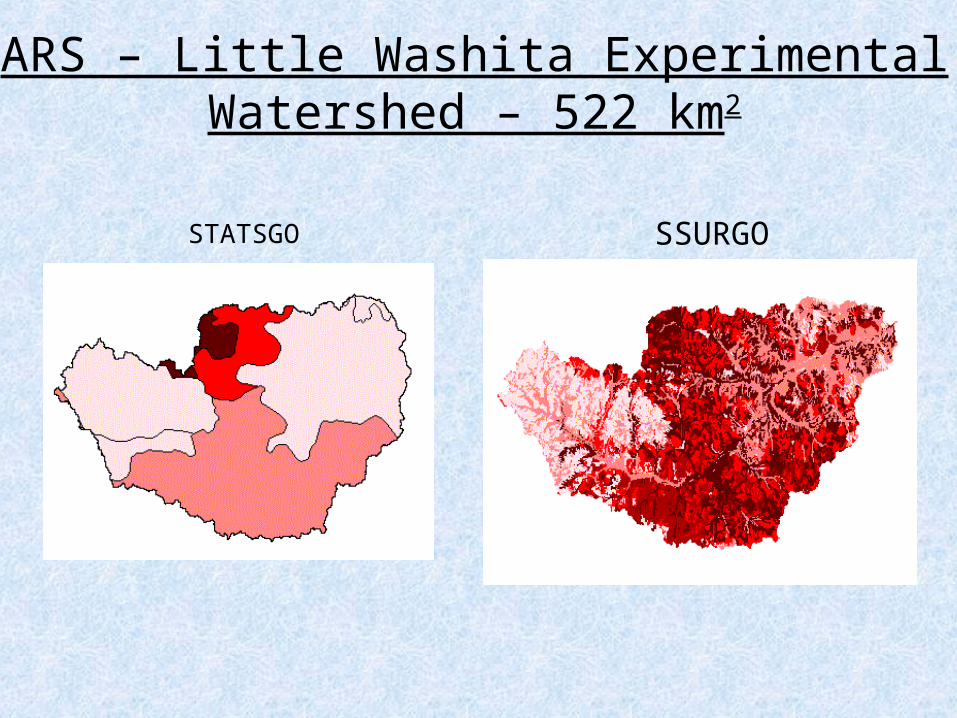
STATSGO SSURGO
ARS – Little Washita ExperimentalWatershed – 522 km2
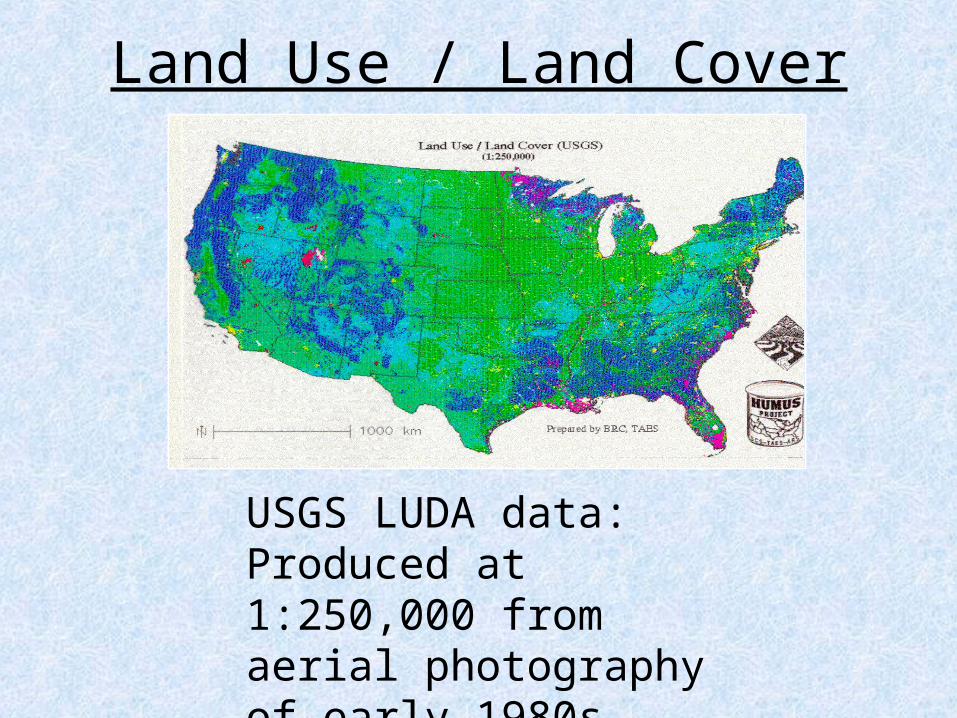
Land Use / Land Cover
USGS LUDA data: Produced at 1:250,000 from aerial photography of early 1980s.
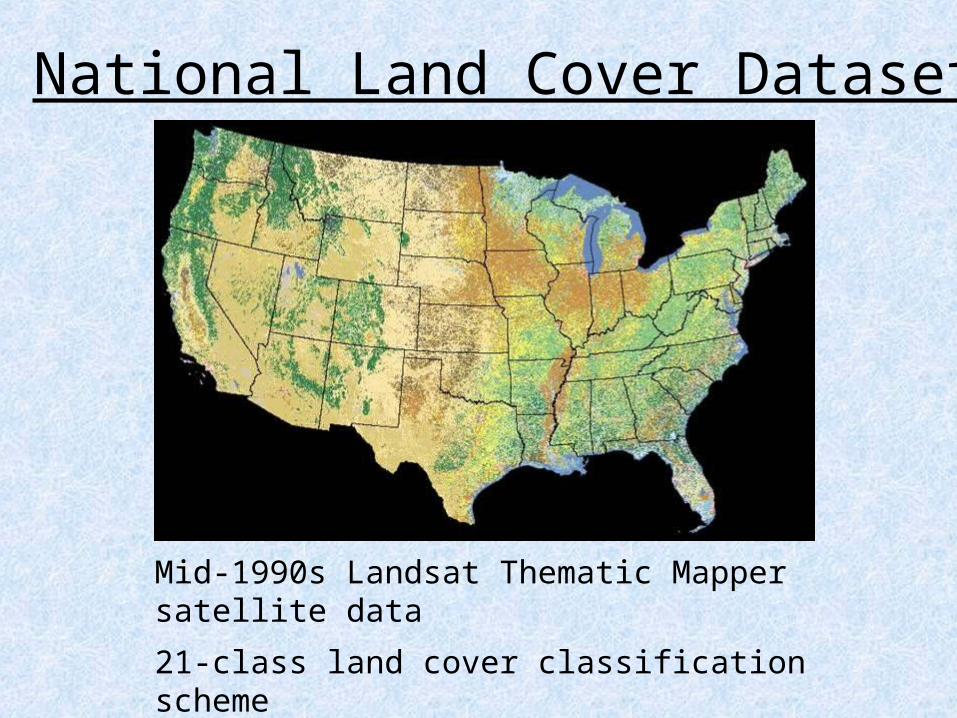
National Land Cover Dataset
Mid-1990s Landsat Thematic Mapper satellite data
21-class land cover classification scheme
30 meter spatial resolution
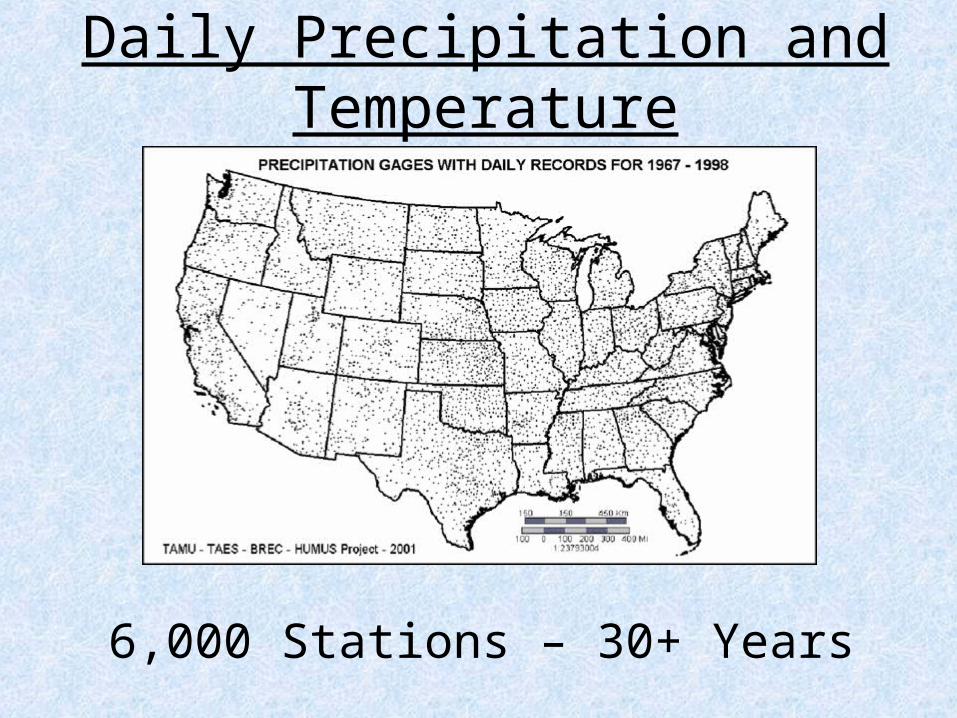
Daily Precipitation and Temperature
6,000 Stations – 30+ Years
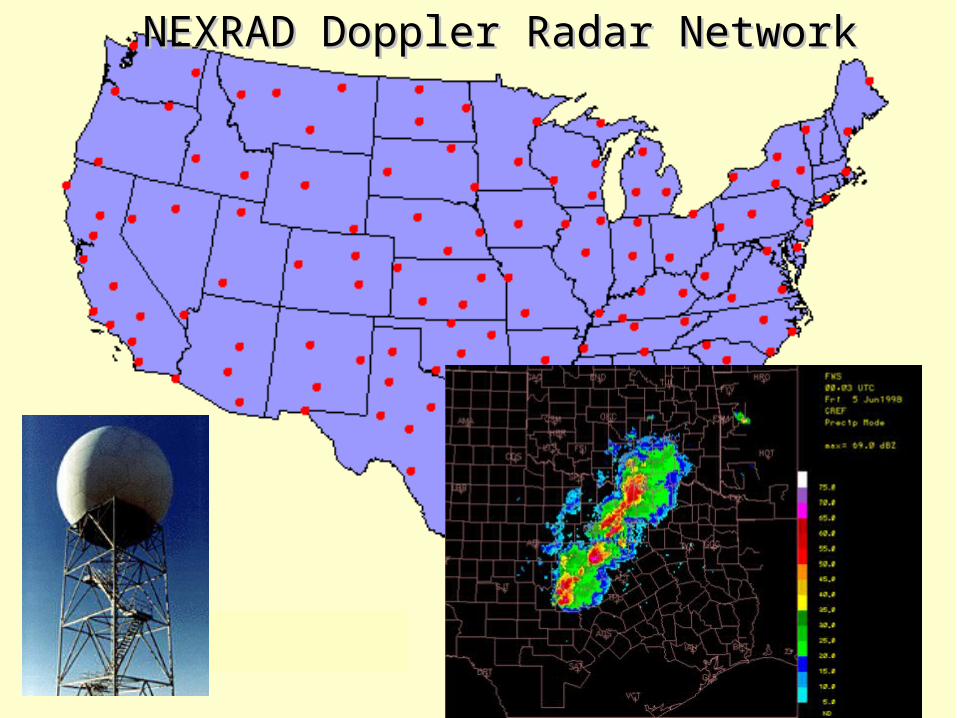
NEXRAD Doppler Radar NetworkNEXRAD Doppler Radar Network
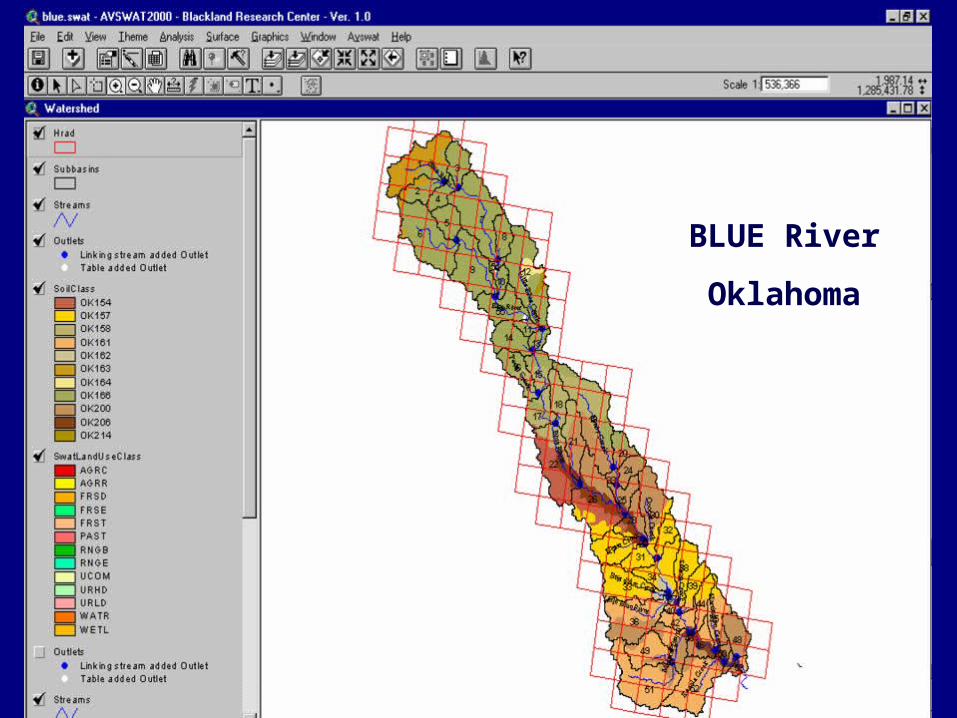
BLUE River
Oklahoma
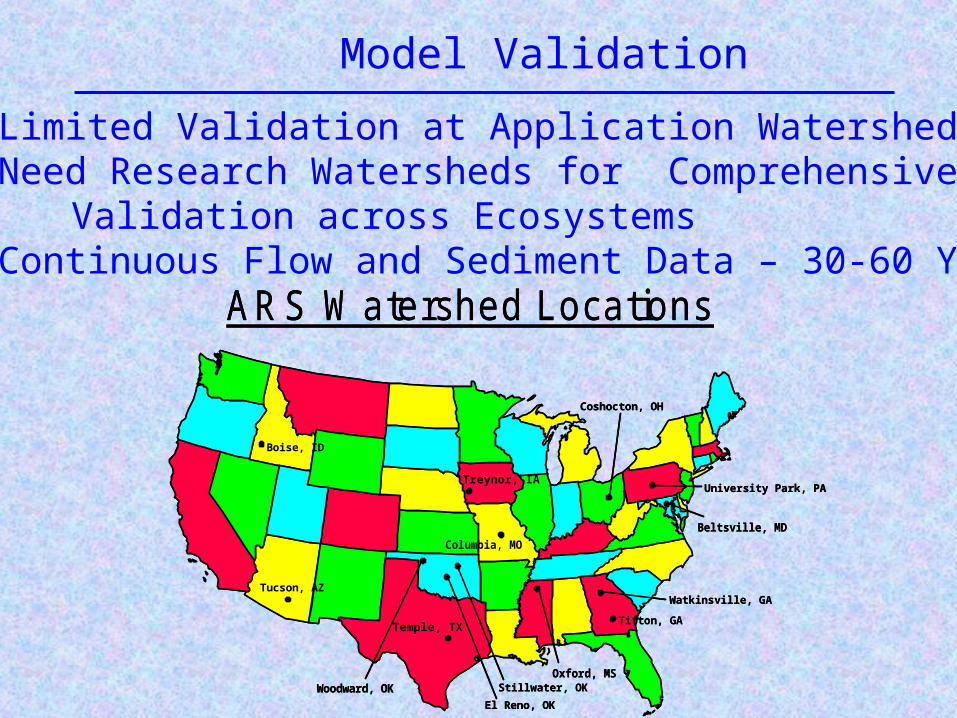
Model Validation
• Limited Validation at Application Watersheds• Need Research Watersheds for Comprehensive
Validation across Ecosystems• Continuous Flow and Sediment Data – 30-60 Yrs
Temple, TX
Boise, ID
Coshocton, OH
El Reno, OK
Oxford, MSStillwater, OK
Tifton, GA
Treynor, IA
Tucson, AZ
University Park, PA
Watkinsville, GA
Woodward, OK
Columbia, MOBeltsville, MD
AR S W atershed Locations
Temple, TX
Boise, ID
Coshocton, OH
El Reno, OK
Oxford, MSStillwater, OK
Tifton, GA
Treynor, IA
Tucson, AZ
University Park, PA
Watkinsville, GA
Woodward, OK
Columbia, MOBeltsville, MD
AR S W atershed Locations
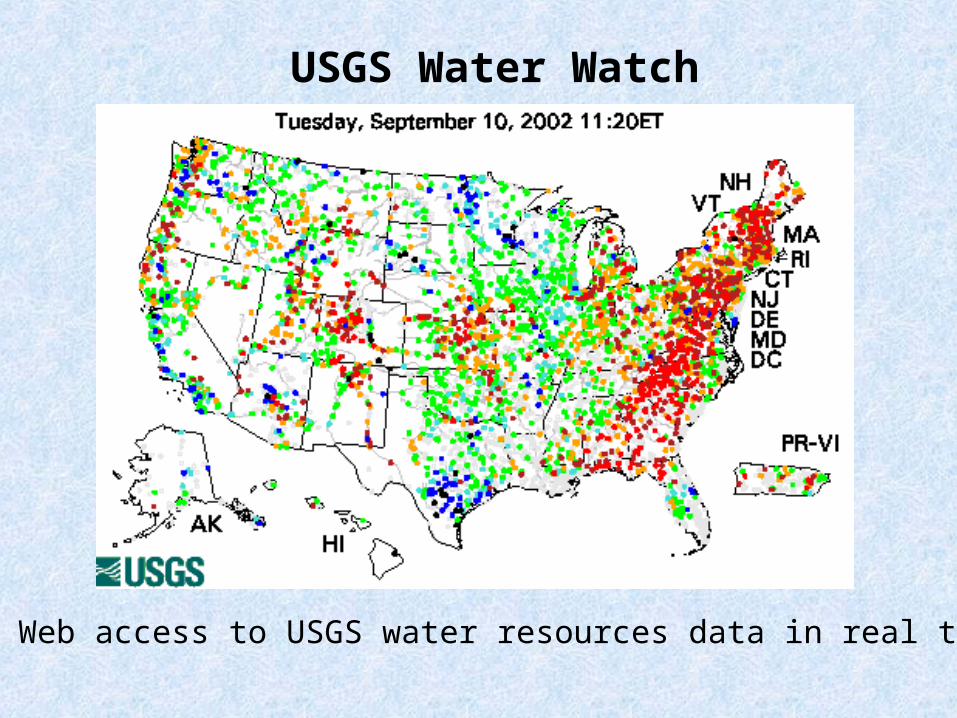
USGS Water Watch
Web access to USGS water resources data in real time
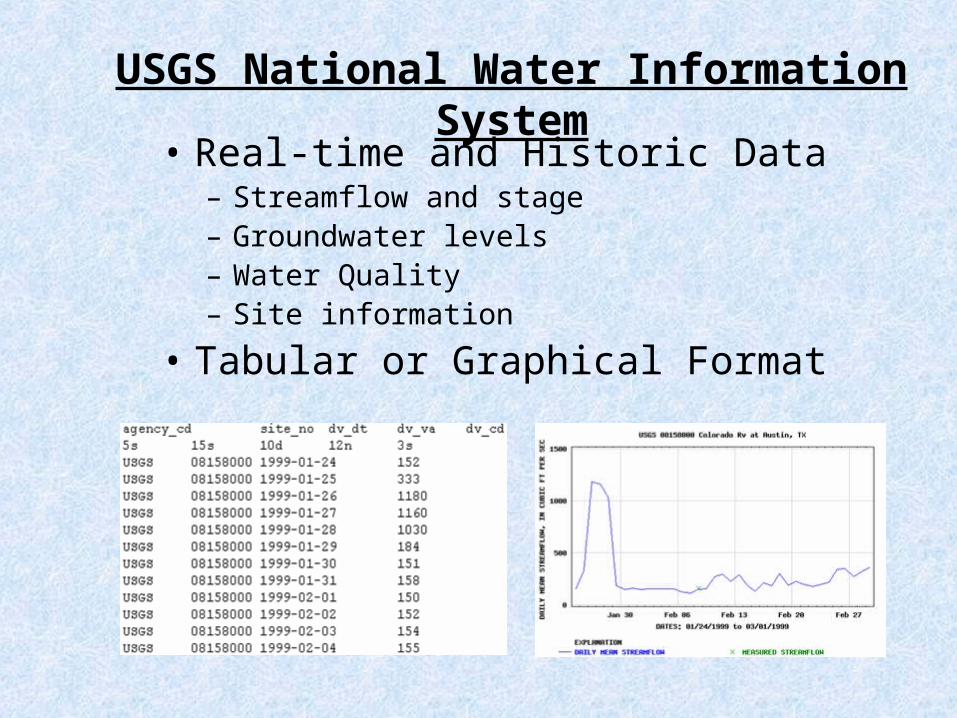
USGS National Water Information System• Real-time and Historic Data
– Streamflow and stage– Groundwater levels– Water Quality– Site information
• Tabular or Graphical Format
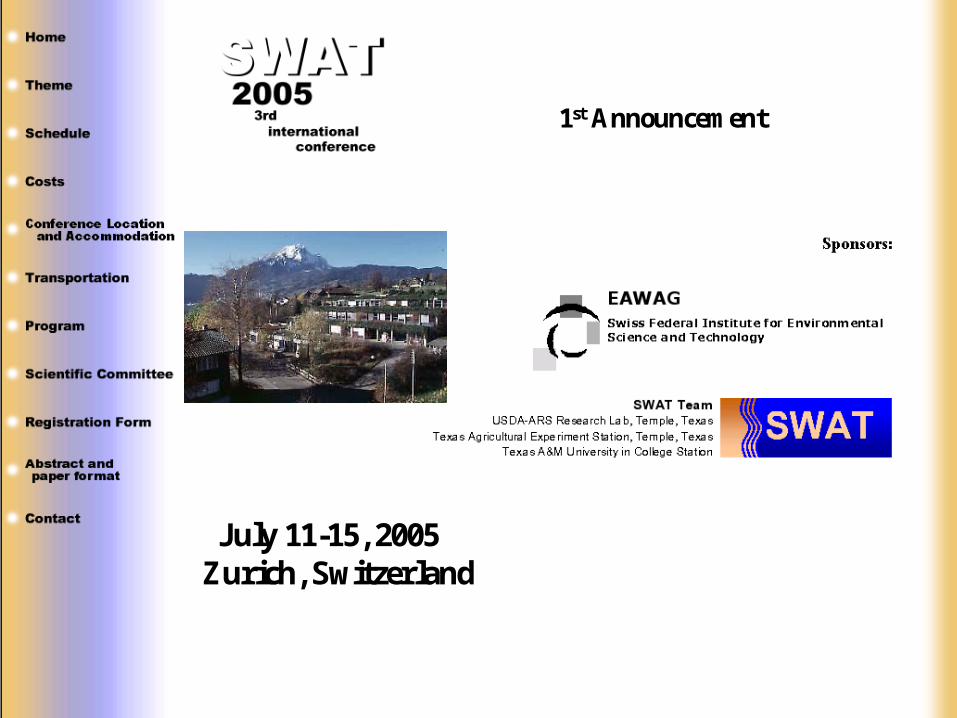
1st Announcement
July 11-15, 2005Zurich, Switzerland
1st Announcement
July 11-15, 2005Zurich, Switzerland


![ARS 1 a2192138zars.htm ARS - Shareholder Forum · 27/04/2009 · 4/28/2009 6:00:37 AM] ARS 1 …](https://img.pdfslide.us/doc/110x75/5fc243b316b6033a7174f1c7/ars-1-ars-shareholder-forum-27042009-4282009-60037-am-ars-1-.jpg)


![GRL Research Watershed Wildfire · GRL Research Watershed Wildfire USDA-PA-ARS-GRL El Reno, OKlahoma Research Watershed WildFire Map [4/1/2017] 04 April 2017](https://img.pdfslide.us/doc/110x75/5f790a867e2fde0bff435362/grl-research-watershed-wildfire-grl-research-watershed-wildfire-usda-pa-ars-grl.jpg)