Embed Size (px)
Citation preview

DRAFT Watershed Restoration Plan for
Pearly Pond, Rindge NH
November 12, 2014
NH Dept. of Environmental Services Pearly Pond Management Advisory Council
Town of Rindge Franklin Pierce University
Comprehensive Environmental Inc.
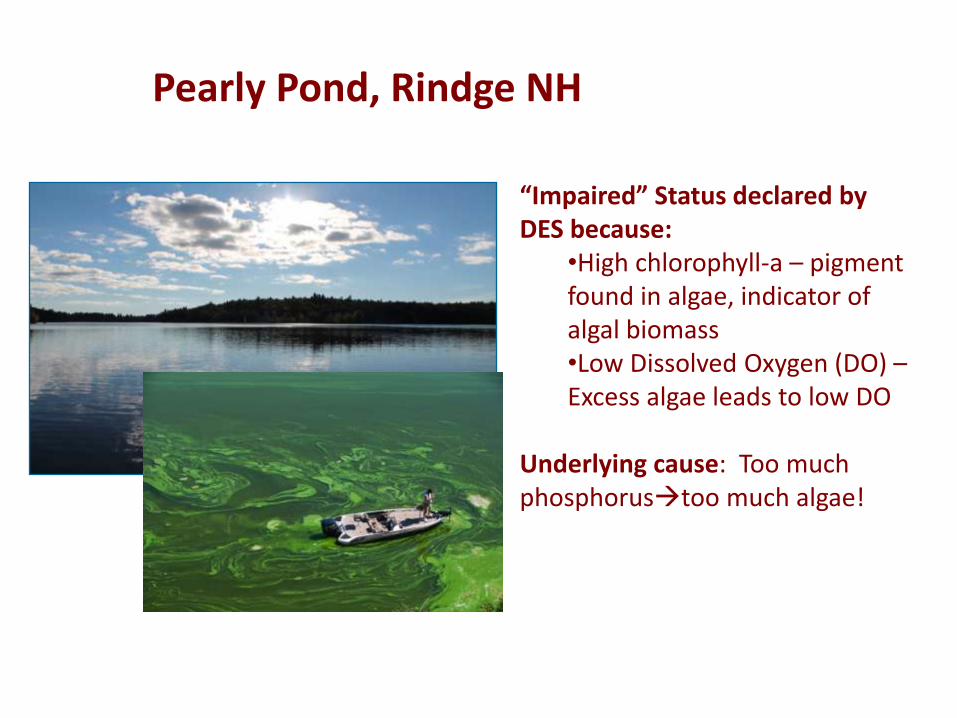
Pearly Pond, Rindge NH
“Impaired” Status declared by DES because:
•High chlorophyll-a – pigment found in algae, indicator of algal biomass •Low Dissolved Oxygen (DO) – Excess algae leads to low DO
Underlying cause: Too much phosphorustoo much algae!
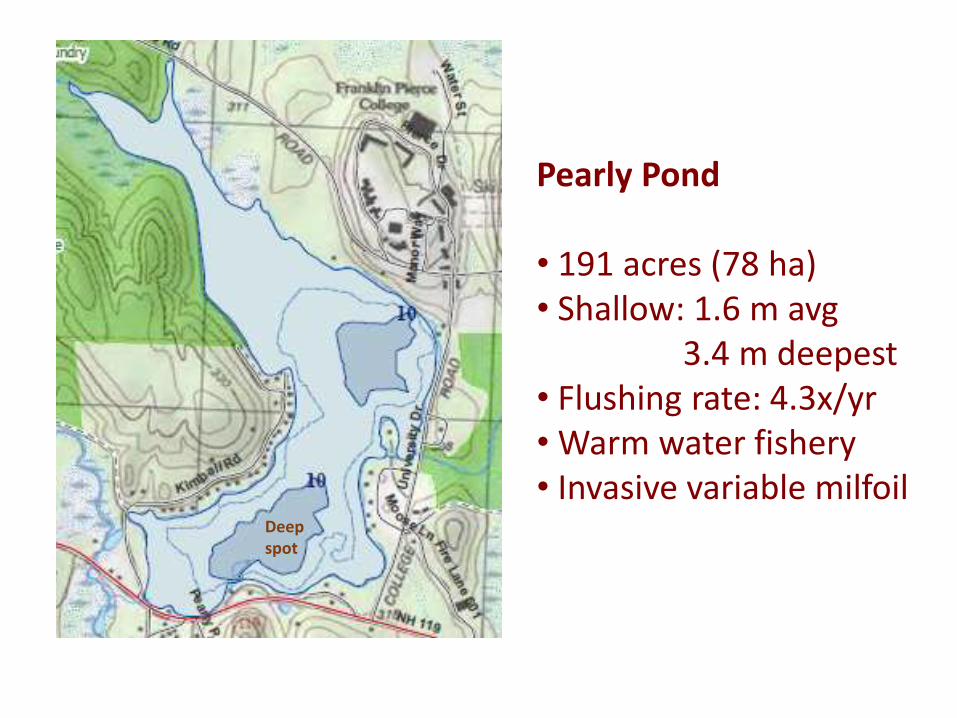
Pearly Pond • 191 acres (78 ha) • Shallow: 1.6 m avg 3.4 m deepest • Flushing rate: 4.3x/yr • Warm water fishery • Invasive variable milfoil
Deep spot
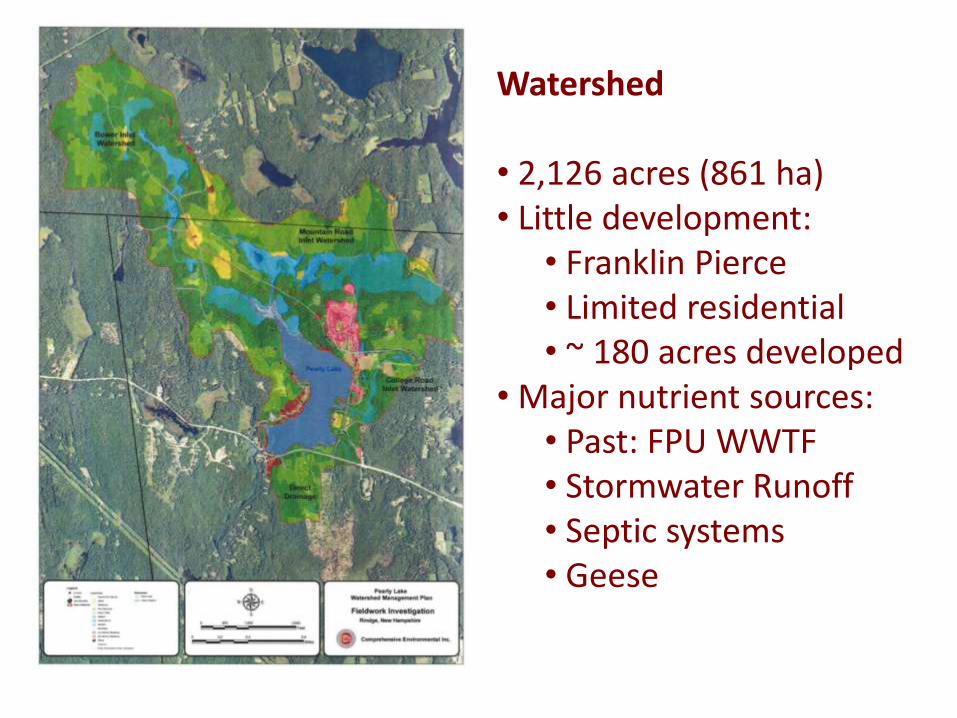
Watershed • 2,126 acres (861 ha) • Little development:
• Franklin Pierce • Limited residential • ~ 180 acres developed
• Major nutrient sources: • Past: FPU WWTF • Stormwater Runoff • Septic systems • Geese
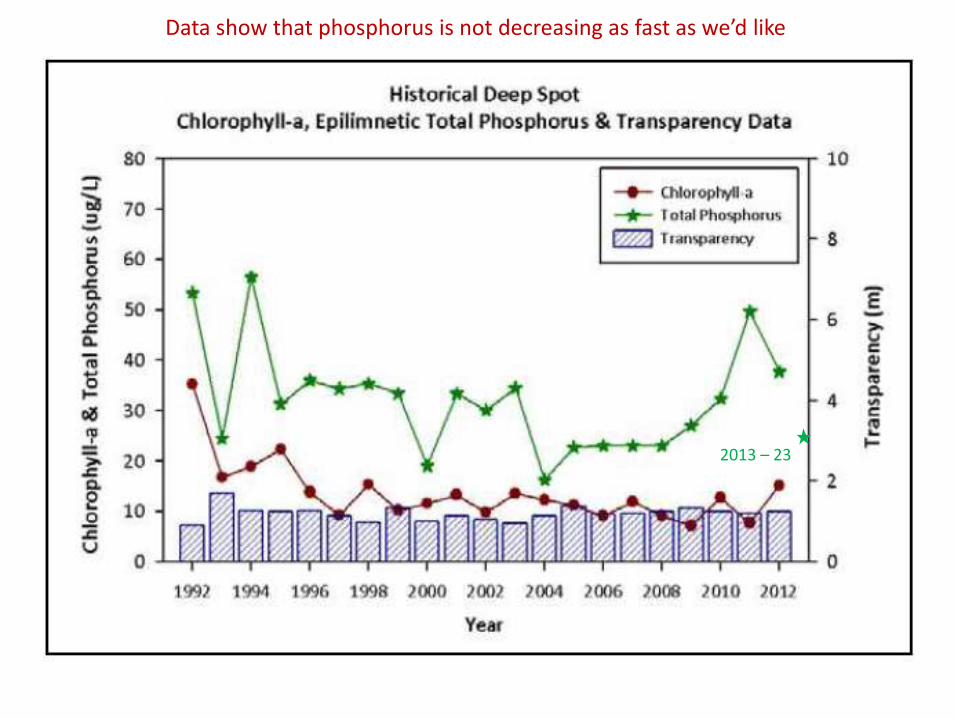
2013 – 23
Data show that phosphorus is not decreasing as fast as we’d like
1. Reduce phosphorus levels to the level that would eliminate harmful algae blooms
2. Use model to identify sources, possible solutions
3. Work with stakeholders to write management plan to prioritize solutions
When plan is done: Submit grant to put the plan into action!
Project Goals
• ENSR-LRM Model – Land-use export coefficient model
• Land use, septic system data collected via maps, surveys, ground-truthing, landowner contact
• Inputs predict phosphorus load, water load, and phosphorus concentrations in streams and pond
• Calibrated to 2009-2013 water quality data
• 2009 marks end of WWTF discharge to wetlands – redirected to rapid infiltration basins (RIBs)
Model Overview
Model Overview
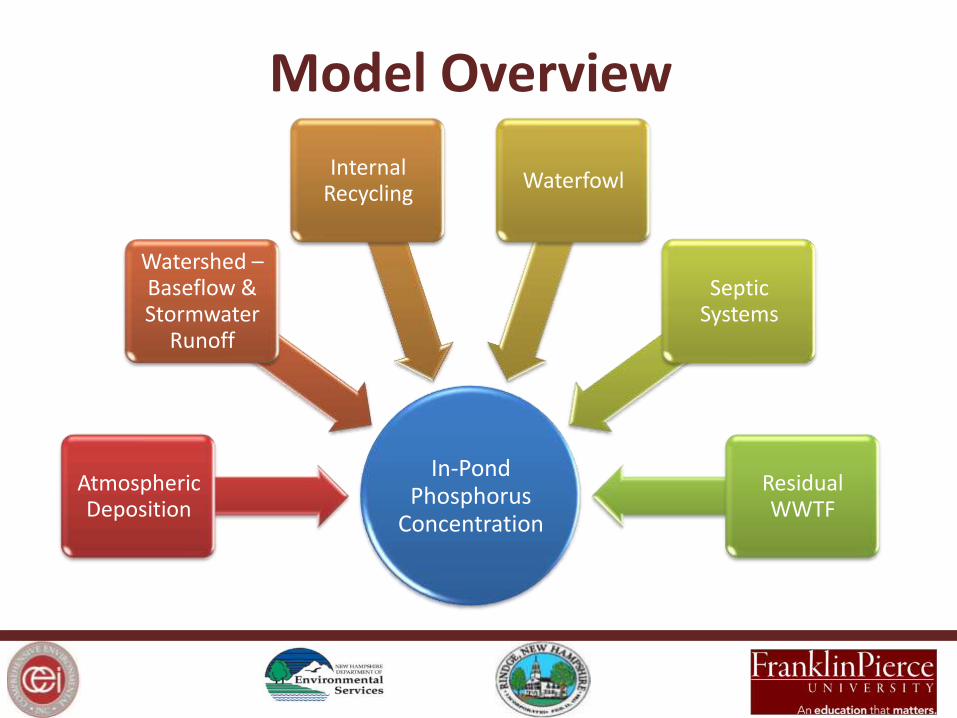
In-Pond Phosphorus
Concentration
Atmospheric Deposition
Watershed – Baseflow & Stormwater
Runoff
Internal Recycling
Waterfowl
Septic Systems
Residual WWTF
Unique to Pearly Pond
– WQ indicates high background phosphorus in baseflow
– Residual phosphorus load from historic WWTF discharge to wetlands
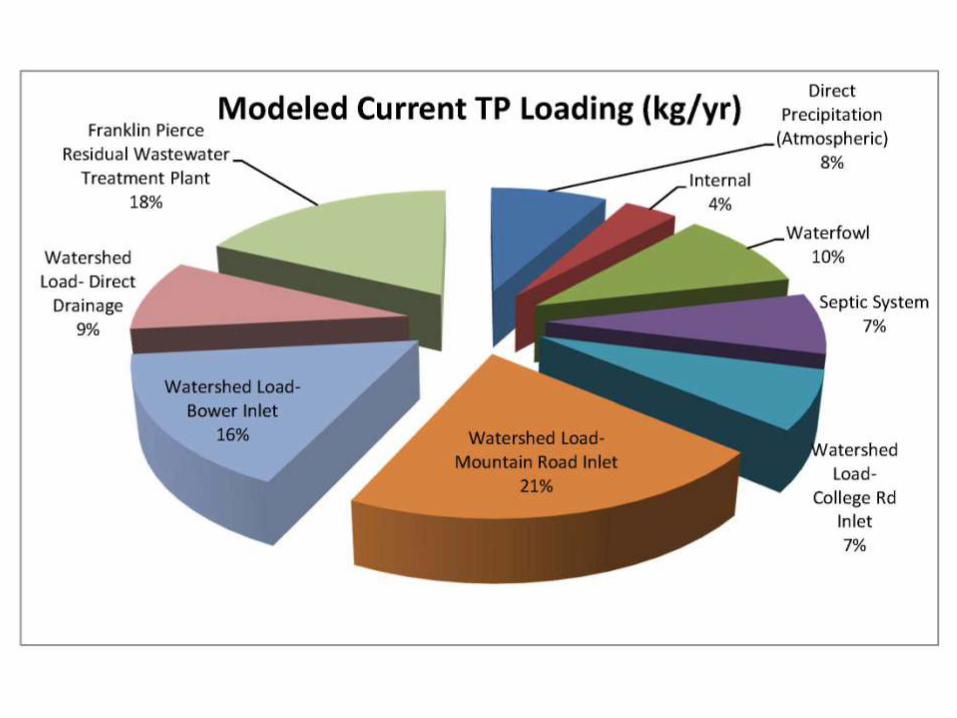
– Stormwater surface runoff and NPS pollution contributes 45% of the total phosphorus load
– Estimated loading of 240 kg/yr of phosphorus to the lake (Approx. eight 5 gallon buckets)
Model Results
• Based on high phosphorus levels in Bower Inlet (pristine subwatershed), background TP in-pond anticipated to be 17 ppb.
• To reduce TP levels to 13 ppb, would require reducing natural inputs of TP, and would cost more than $2.6 million to reduce.
• According to the NHDES 2009 report, there are unimpaired lakes that have TP levels as high as 27.5 ppb, and 25% of the unimpaired lakes are higher than 11.0 ppb.
• Pearly Pond appears to be naturally somewhat eutrophic, and may be one of those lakes which can achieve unimpaired status and avoid harmful algae blooms with a TP level as high as 17 ppb.
Water Quality Goal: 17 ppb
• Investigate impact of internal TP loading
– Fall and winter sampling
• Investigate natural background TP loading
– Long-term monitoring – tributaries, groundwater, wetlands, soils
Further Studies
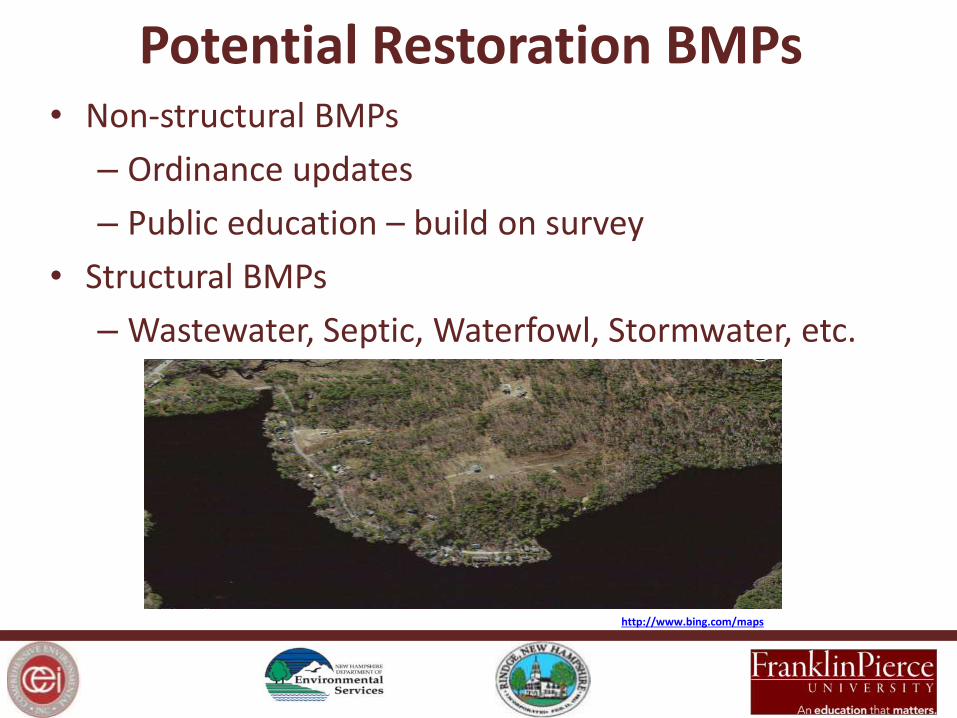
• Non-structural BMPs
– Ordinance updates
– Public education – build on survey
• Structural BMPs
– Wastewater, Septic, Waterfowl, Stormwater, etc.
Potential Restoration BMPs
http://www.bing.com/maps
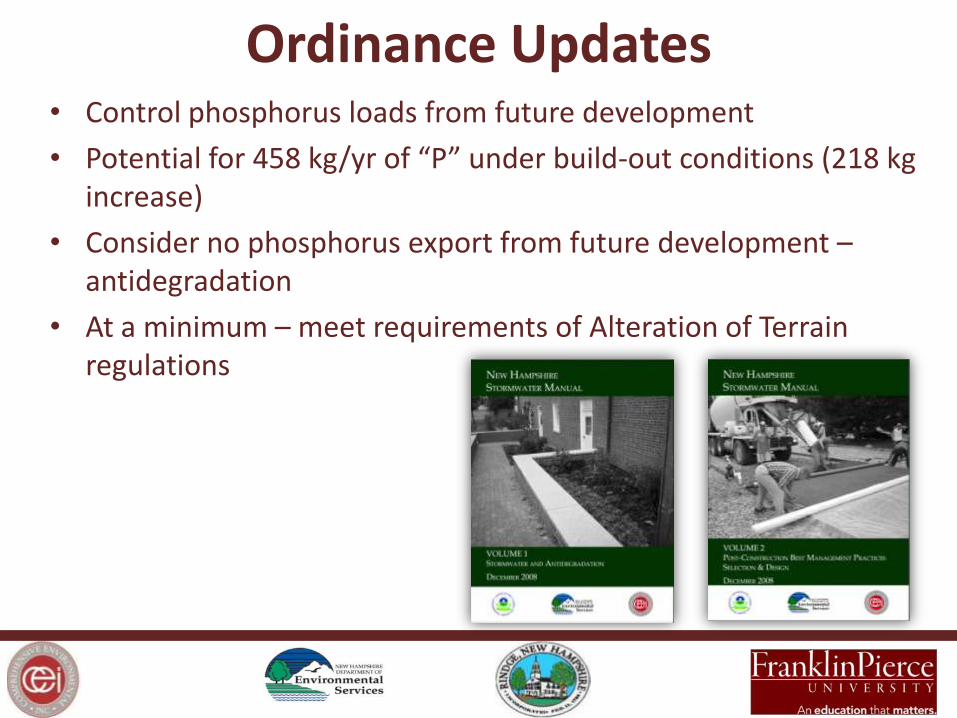
• Control phosphorus loads from future development
• Potential for 458 kg/yr of “P” under build-out conditions (218 kg increase)
• Consider no phosphorus export from future development – antidegradation
• At a minimum – meet requirements of Alteration of Terrain regulations
Ordinance Updates

Public Education – Resident Survey Results
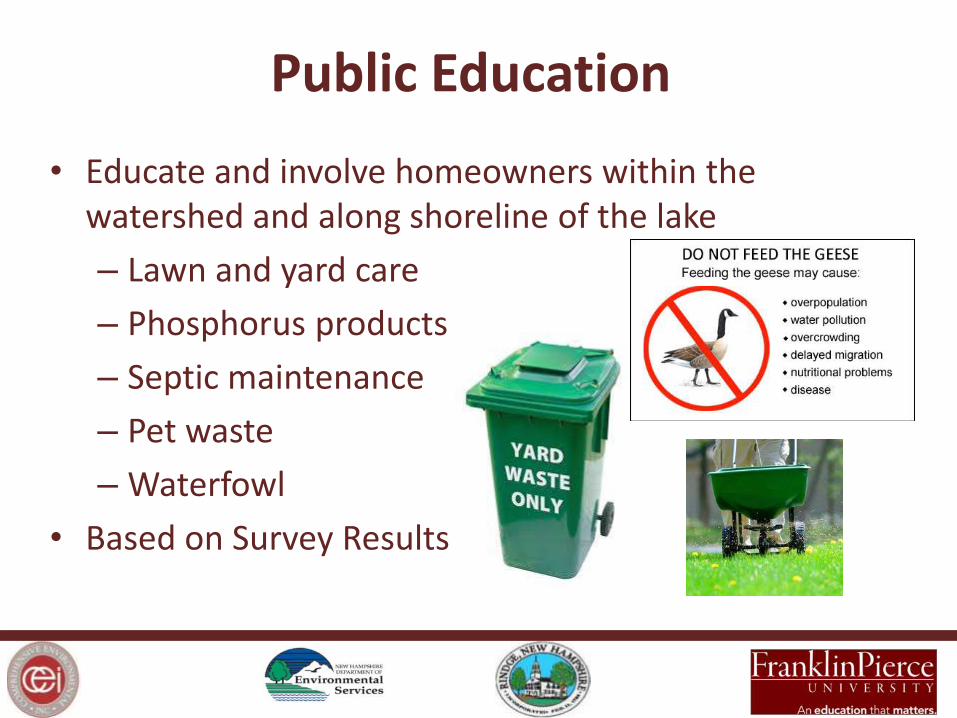
• Educate and involve homeowners within the watershed and along shoreline of the lake
– Lawn and yard care
– Phosphorus products
– Septic maintenance
– Pet waste
– Waterfowl
• Based on Survey Results
Public Education
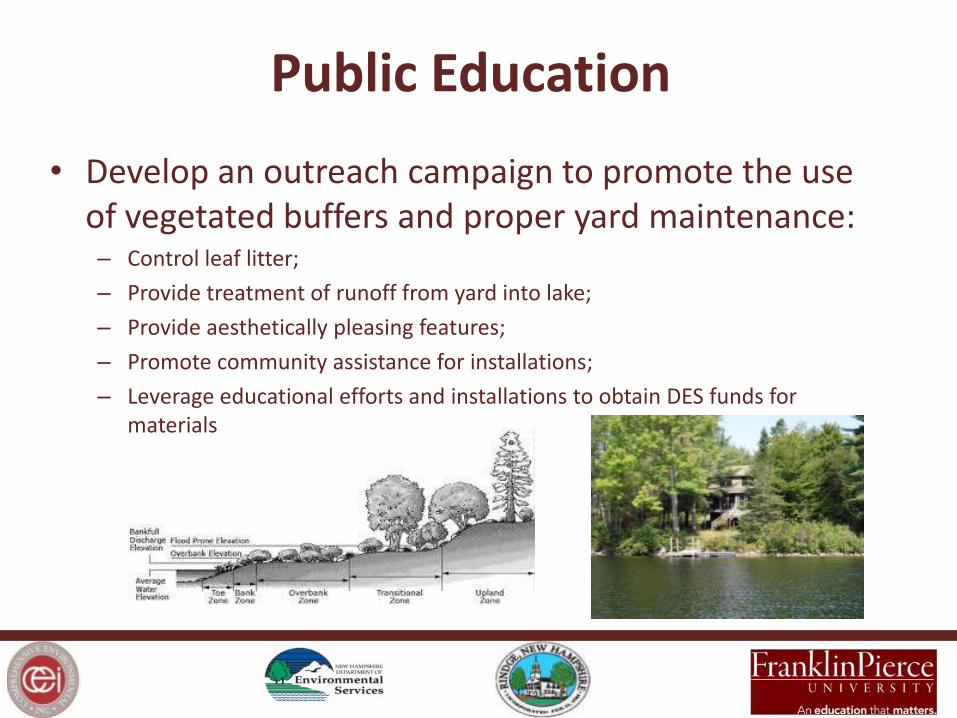
• Develop an outreach campaign to promote the use of vegetated buffers and proper yard maintenance: – Control leaf litter;
– Provide treatment of runoff from yard into lake;
– Provide aesthetically pleasing features;
– Promote community assistance for installations;
– Leverage educational efforts and installations to obtain DES funds for materials
Public Education
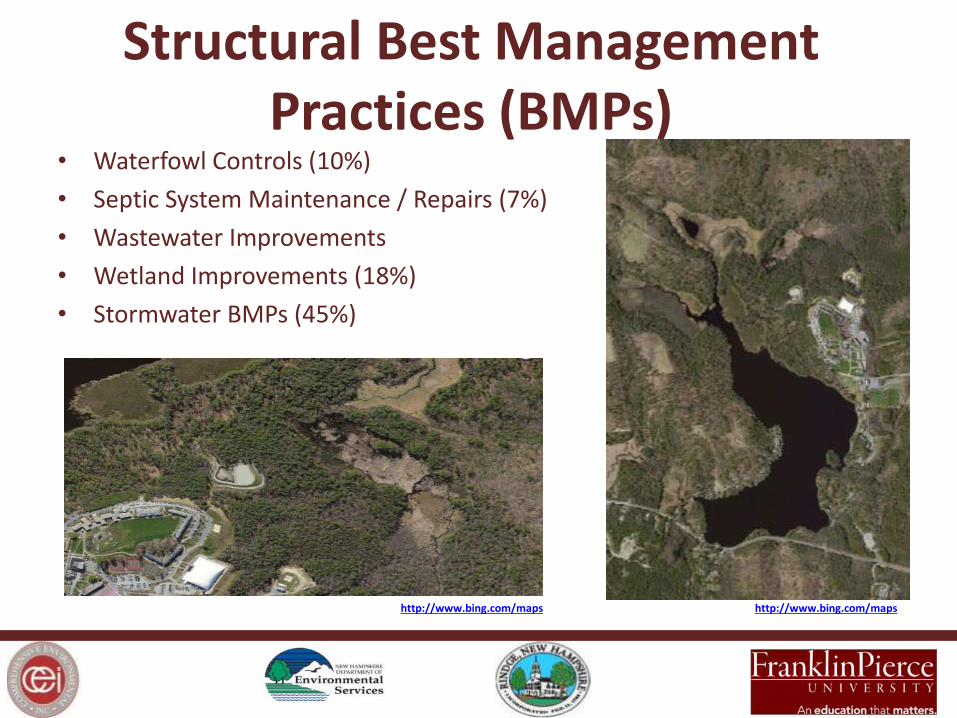
• Waterfowl Controls (10%)
• Septic System Maintenance / Repairs (7%)
• Wastewater Improvements
• Wetland Improvements (18%)
• Stormwater BMPs (45%)
Structural Best Management Practices (BMPs)
http://www.bing.com/maps
http://www.bing.com/maps
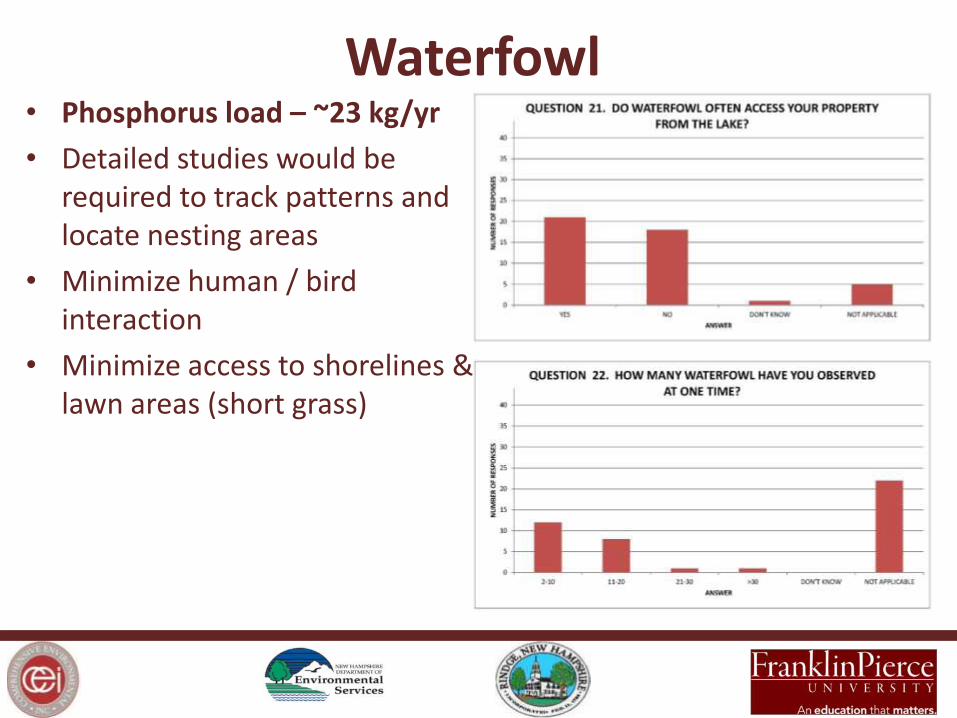
• Phosphorus load – ~23 kg/yr
• Detailed studies would be required to track patterns and locate nesting areas
• Minimize human / bird interaction
• Minimize access to shorelines & lawn areas (short grass)
Waterfowl
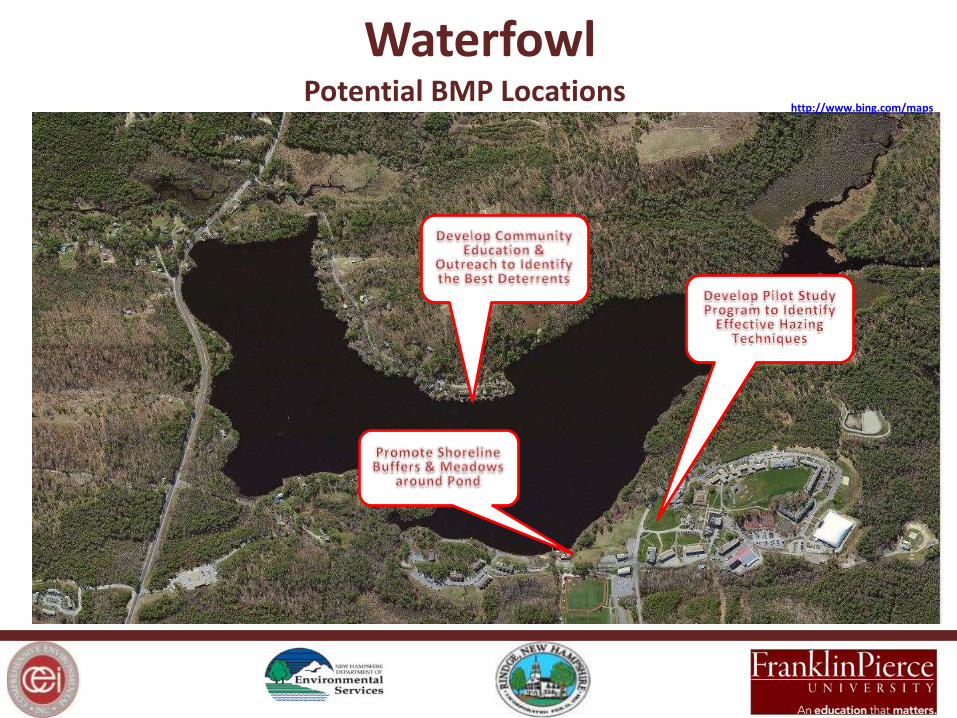
Waterfowl Potential BMP Locations
http://www.bing.com/maps
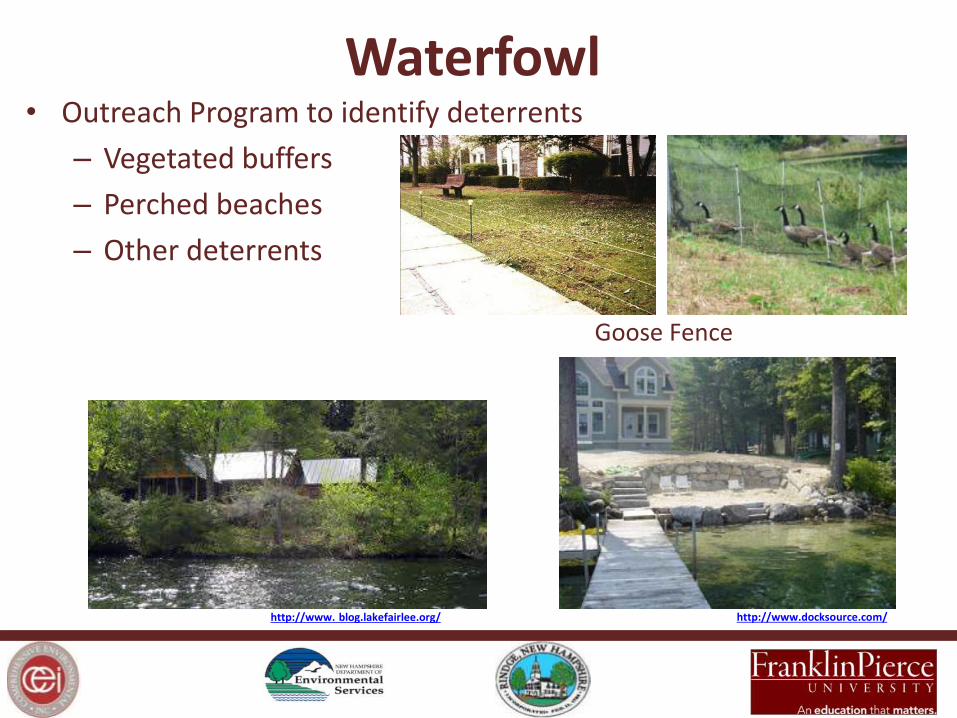
• Outreach Program to identify deterrents
– Vegetated buffers
– Perched beaches
– Other deterrents
Waterfowl
http://www.docksource.com/
http://www. blog.lakefairlee.org/
Goose Fence
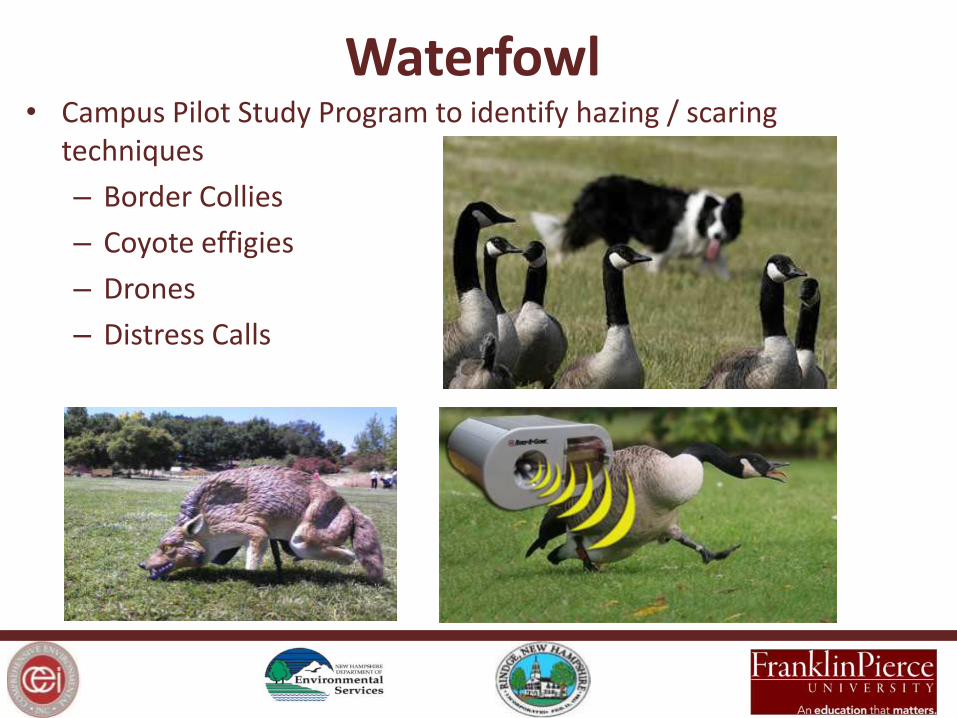
• Campus Pilot Study Program to identify hazing / scaring techniques
– Border Collies
– Coyote effigies
– Drones
– Distress Calls
Waterfowl
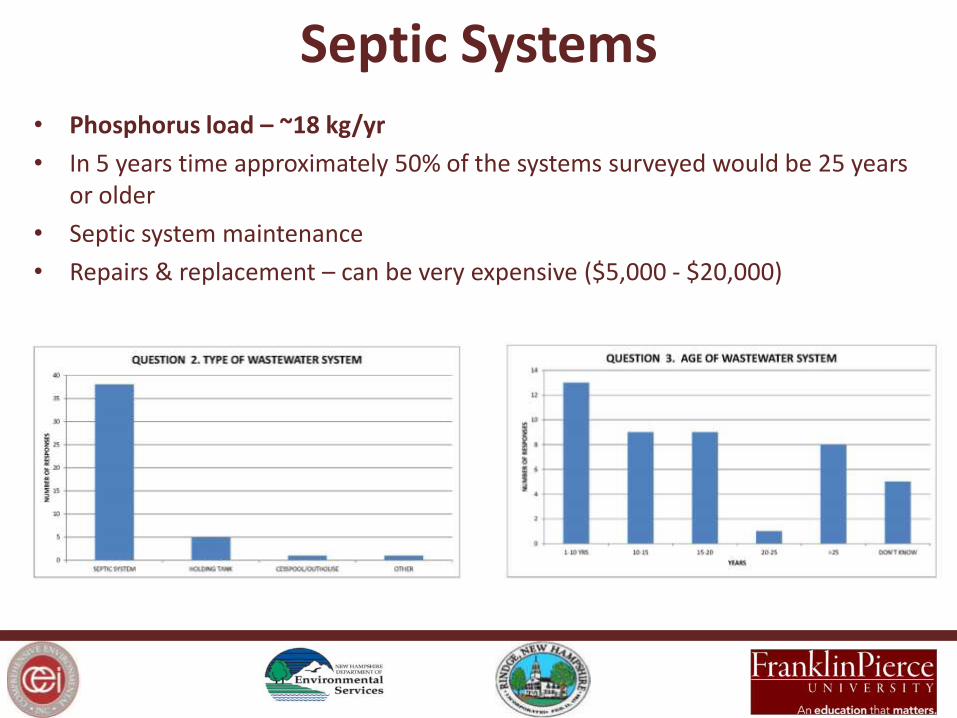
• Phosphorus load – ~18 kg/yr
• In 5 years time approximately 50% of the systems surveyed would be 25 years or older
• Septic system maintenance
• Repairs & replacement – can be very expensive ($5,000 - $20,000)
Septic Systems
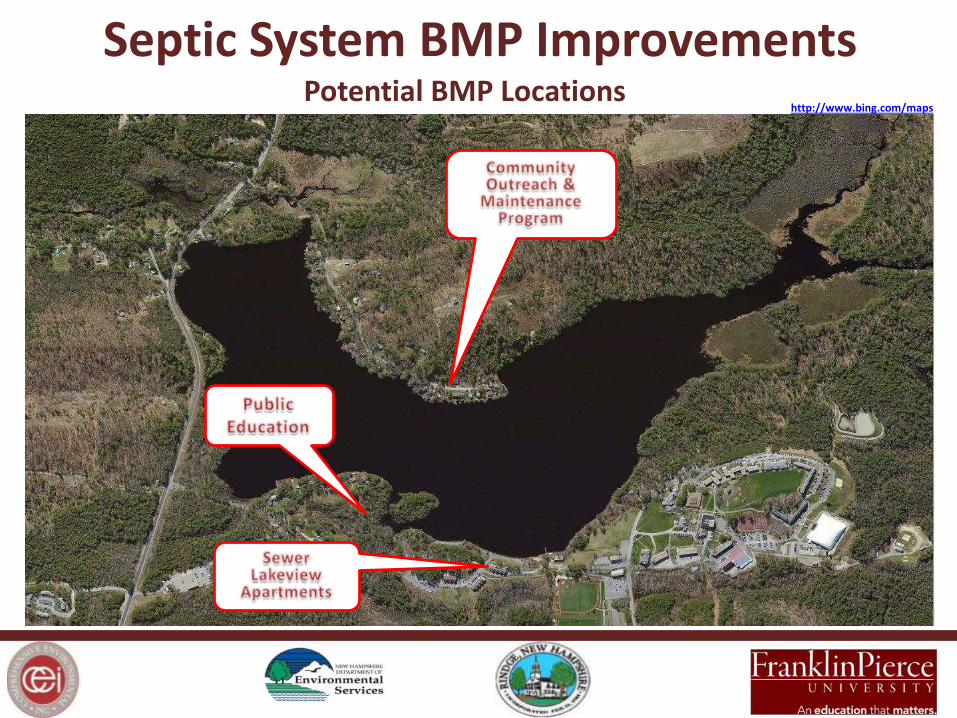
Septic System BMP Improvements Potential BMP Locations
http://www.bing.com/maps
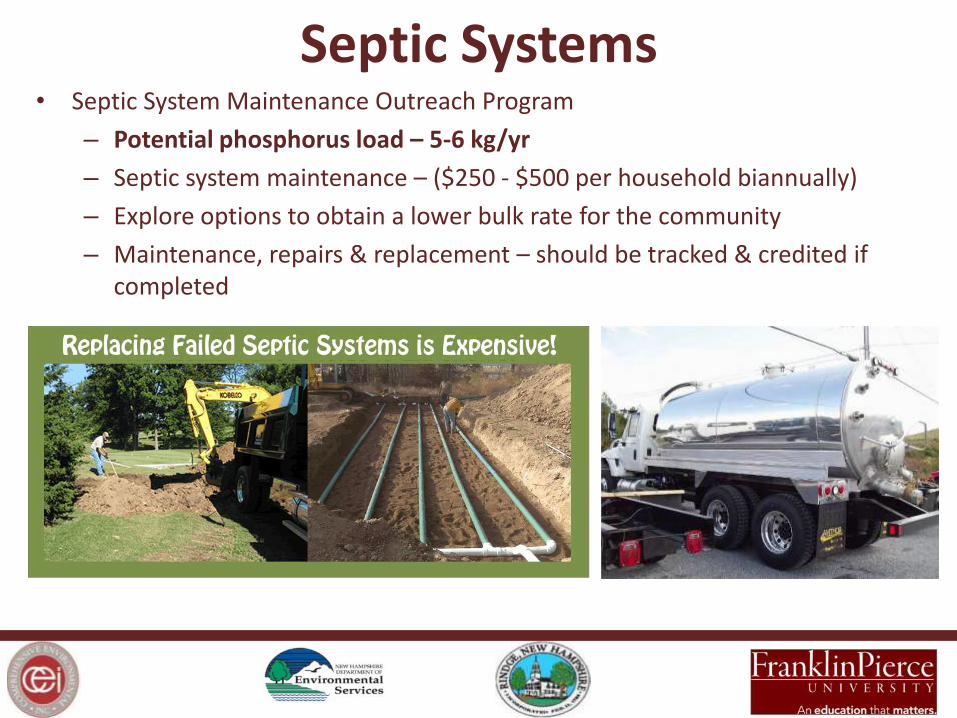
• Septic System Maintenance Outreach Program
– Potential phosphorus load – 5-6 kg/yr
– Septic system maintenance – ($250 - $500 per household biannually)
– Explore options to obtain a lower bulk rate for the community
– Maintenance, repairs & replacement – should be tracked & credited if completed
Septic Systems
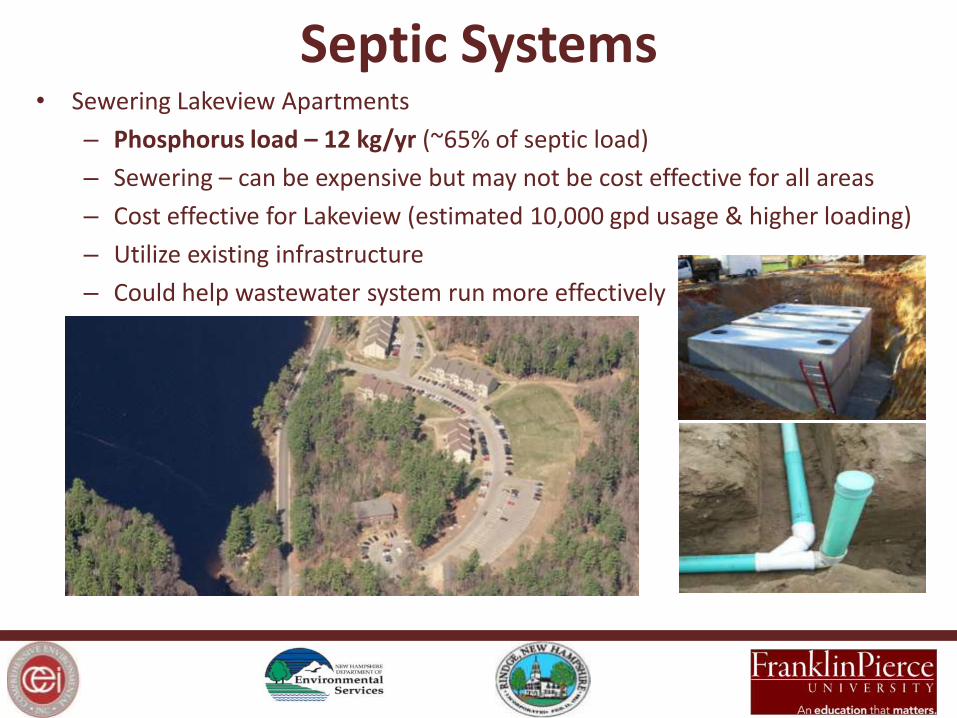
• Sewering Lakeview Apartments
– Phosphorus load – 12 kg/yr (~65% of septic load)
– Sewering – can be expensive but may not be cost effective for all areas
– Cost effective for Lakeview (estimated 10,000 gpd usage & higher loading)
– Utilize existing infrastructure
– Could help wastewater system run more effectively
Septic Systems
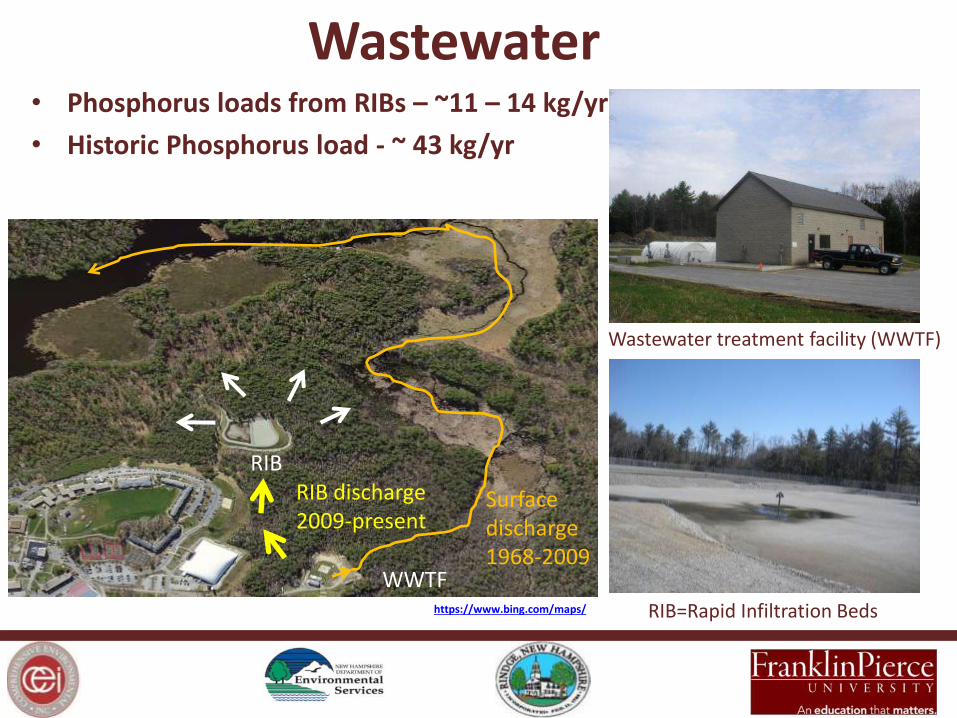
RIB=Rapid Infiltration Beds
Wastewater treatment facility (WWTF)
RIB
WWTF
Surface discharge 1968-2009
Wastewater
RIB discharge 2009-present
https://www.bing.com/maps/
• Phosphorus loads from RIBs – ~11 – 14 kg/yr
• Historic Phosphorus load - ~ 43 kg/yr
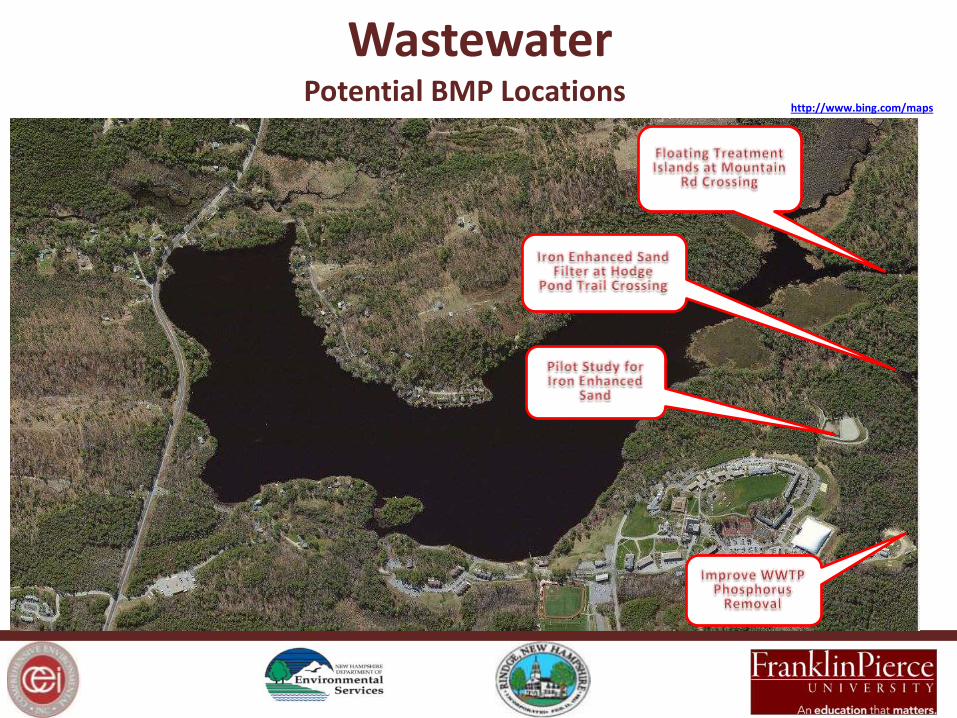
Wastewater Potential BMP Locations
http://www.bing.com/maps
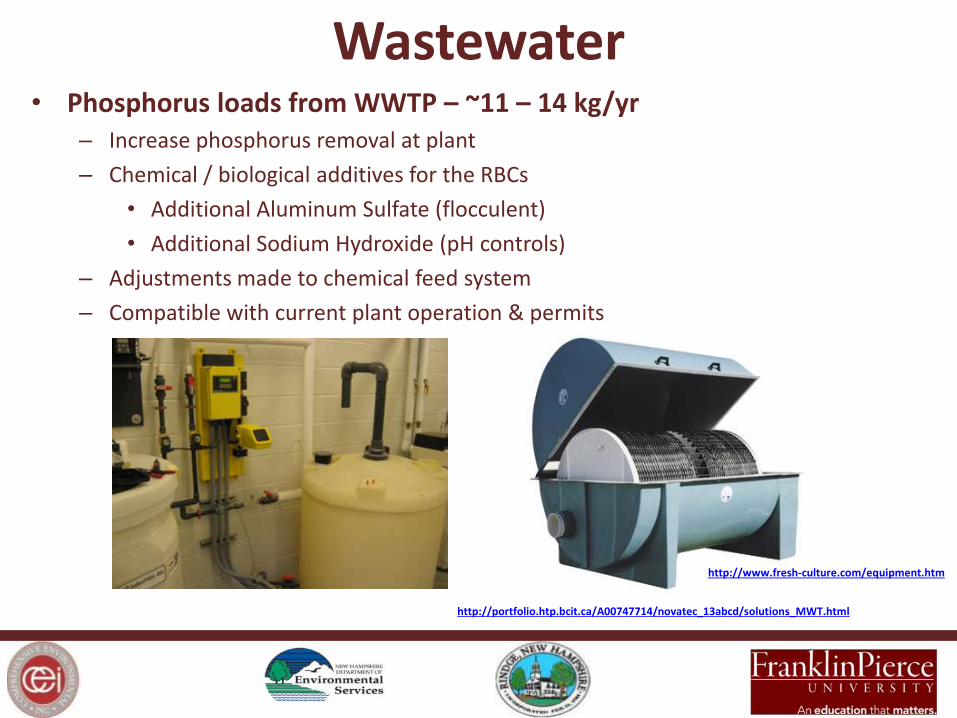
• Phosphorus loads from WWTP – ~11 – 14 kg/yr – Increase phosphorus removal at plant
– Chemical / biological additives for the RBCs
• Additional Aluminum Sulfate (flocculent)
• Additional Sodium Hydroxide (pH controls)
– Adjustments made to chemical feed system
– Compatible with current plant operation & permits
Wastewater
http://www.fresh-culture.com/equipment.htm
http://portfolio.htp.bcit.ca/A00747714/novatec_13abcd/solutions_MWT.html
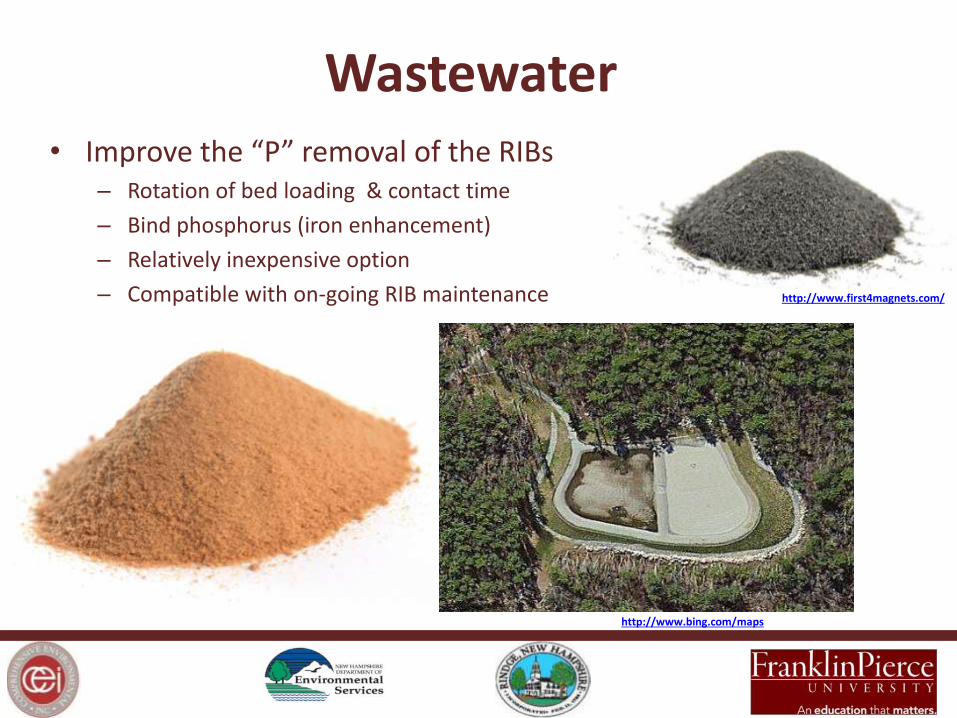
• Improve the “P” removal of the RIBs – Rotation of bed loading & contact time
– Bind phosphorus (iron enhancement)
– Relatively inexpensive option
– Compatible with on-going RIB maintenance
Wastewater
http://www.bing.com/maps
http://www.first4magnets.com/
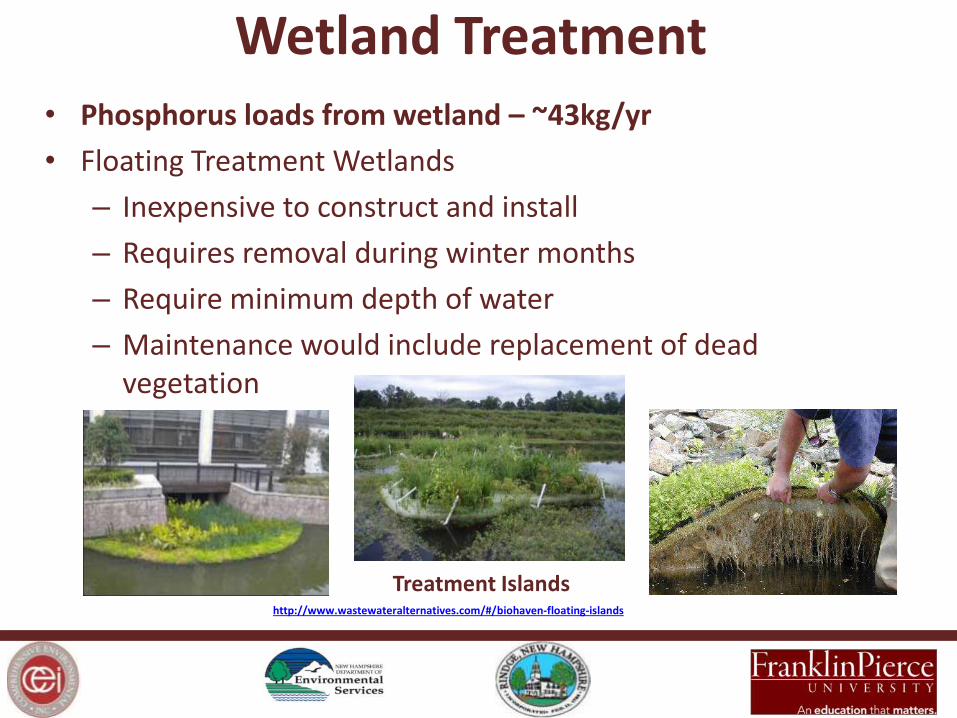
• Phosphorus loads from wetland – ~43kg/yr
• Floating Treatment Wetlands
– Inexpensive to construct and install
– Requires removal during winter months
– Require minimum depth of water
– Maintenance would include replacement of dead vegetation
Wetland Treatment
Treatment Islands http://www.wastewateralternatives.com/#/biohaven-floating-islands
Wetland Treatment
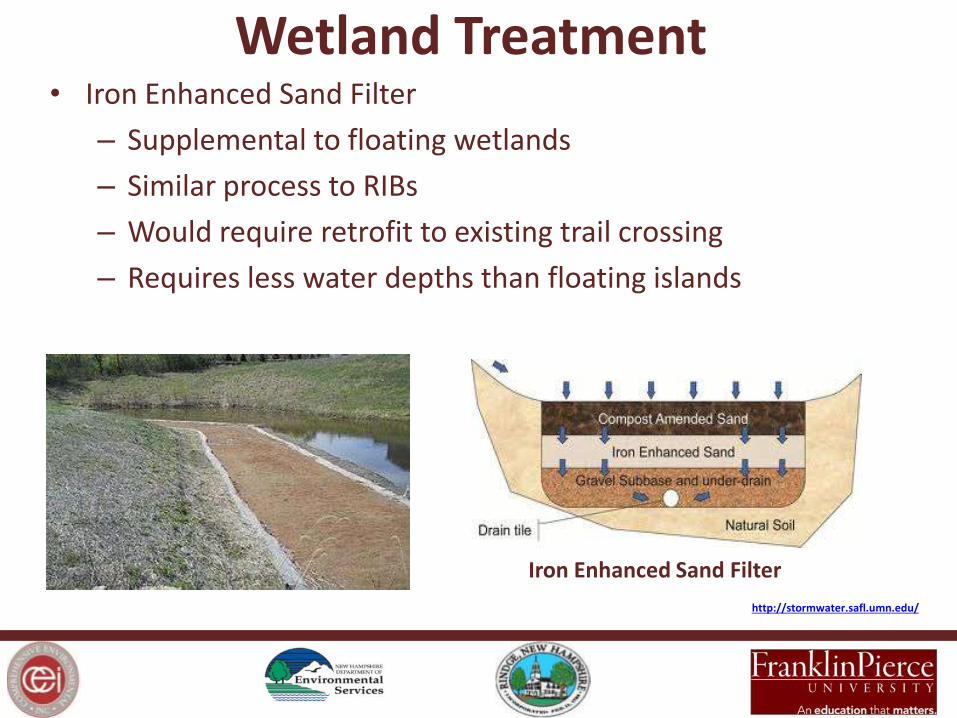
Iron Enhanced Sand Filter
http://stormwater.safl.umn.edu/
• Iron Enhanced Sand Filter
– Supplemental to floating wetlands
– Similar process to RIBs
– Would require retrofit to existing trail crossing
– Requires less water depths than floating islands
Stormwater BMP Evaluation
Field Work Plan & Site Selection
1) Visited all Roadway Crossings with Tributaries
2) Reviewed Roadways and Drainage
3) Visited Sites with Watershed Residents and Steering Committee
4) Investigated FPU Campus Drainage
Phosphorus is carried to the lake via stormwater runoff ~ 105 kg/yr
• Fertilizers
• Erosion
• Roadways / parking areas
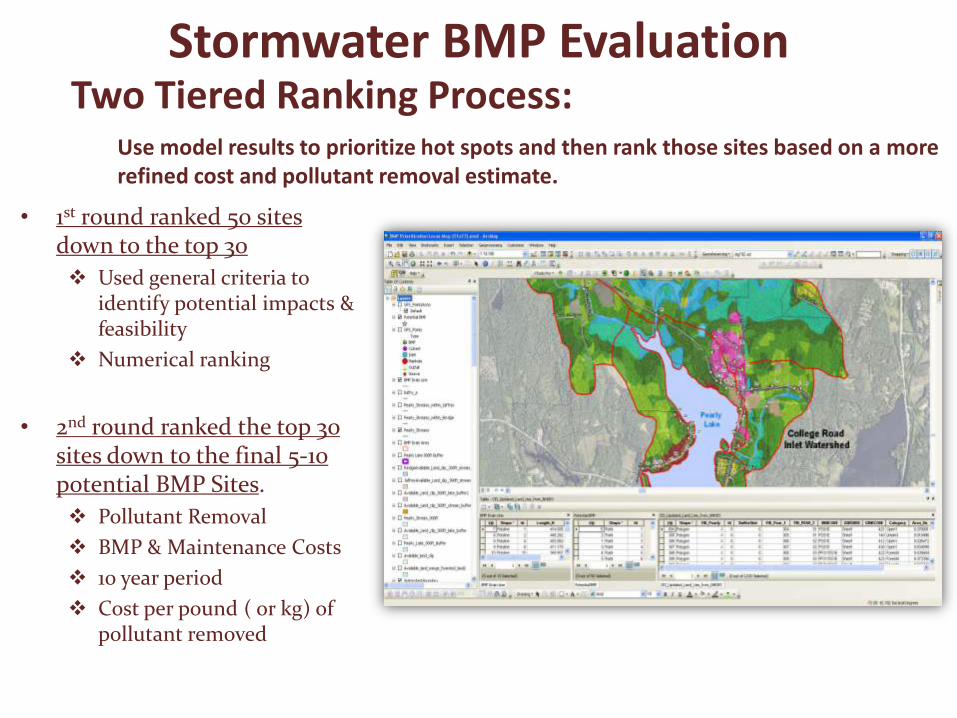
Two Tiered Ranking Process:
Use model results to prioritize hot spots and then rank those sites based on a more refined cost and pollutant removal estimate.
• 1st round ranked 50 sites down to the top 30
Used general criteria to identify potential impacts & feasibility
Numerical ranking
• 2nd round ranked the top 30 sites down to the final 5-10 potential BMP Sites.
Pollutant Removal
BMP & Maintenance Costs
10 year period
Cost per pound ( or kg) of pollutant removed
Stormwater BMP Evaluation
• Ranking Results
– Stormwater BMPs could treat approx. 120 acres of the 185 developed acres (~6% of entire watershed)
– Top 10 BMPs could reduce “P” by 15-20 kg per year (2/3 of 5 gallon bucket)
– 20 kg of “P” is ~ 20% of the annual “P” loading attributed to stormwater runoff (105 kg /yr)
– Stormwater maintenance & public education can help
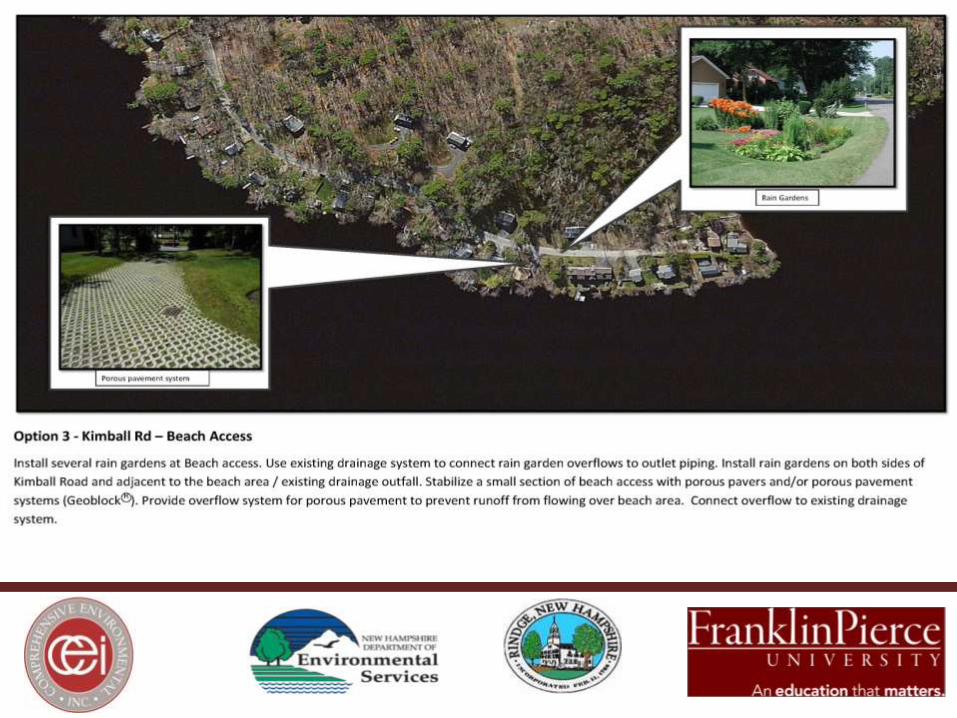
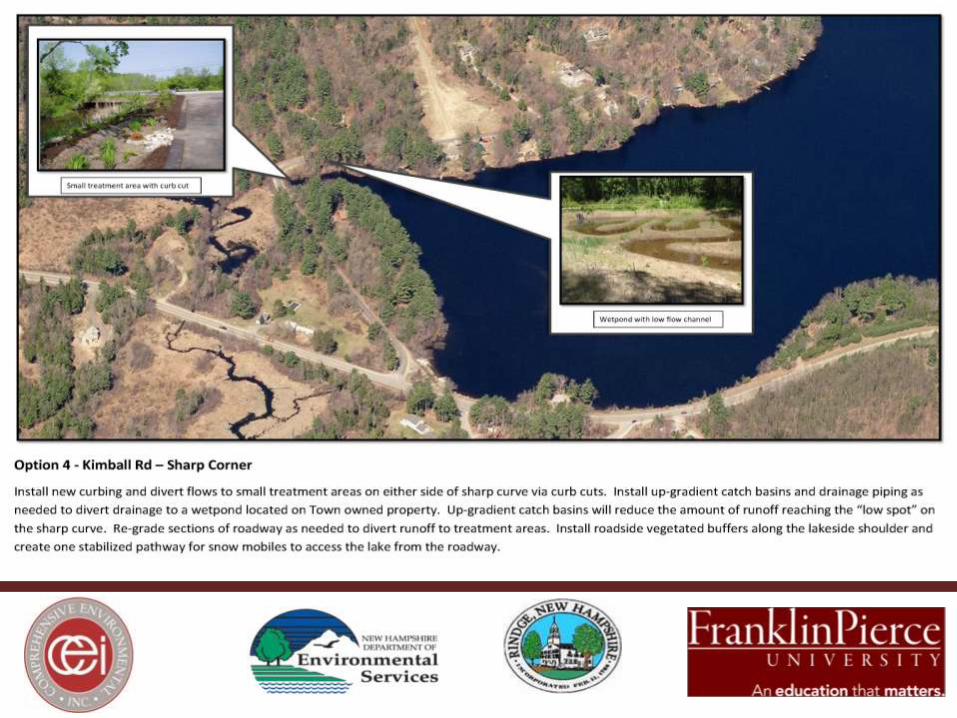
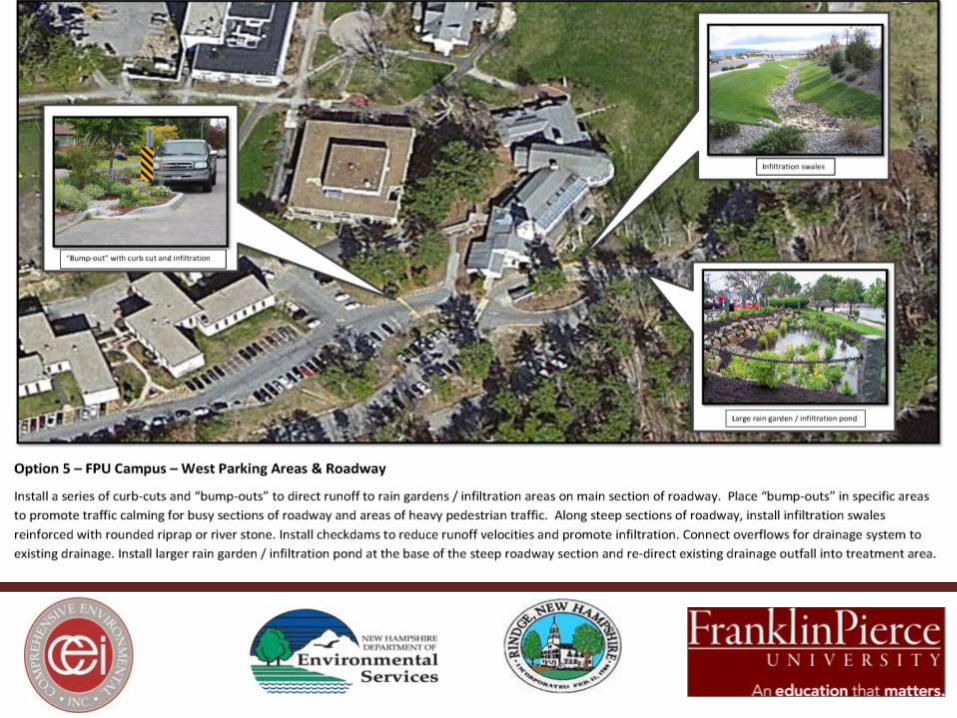
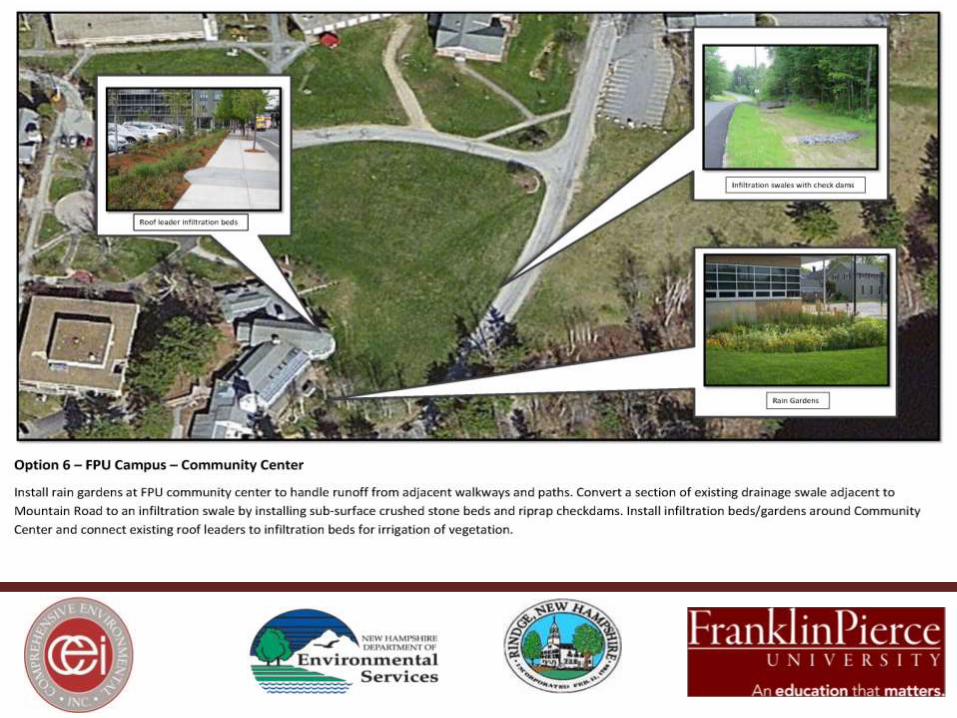
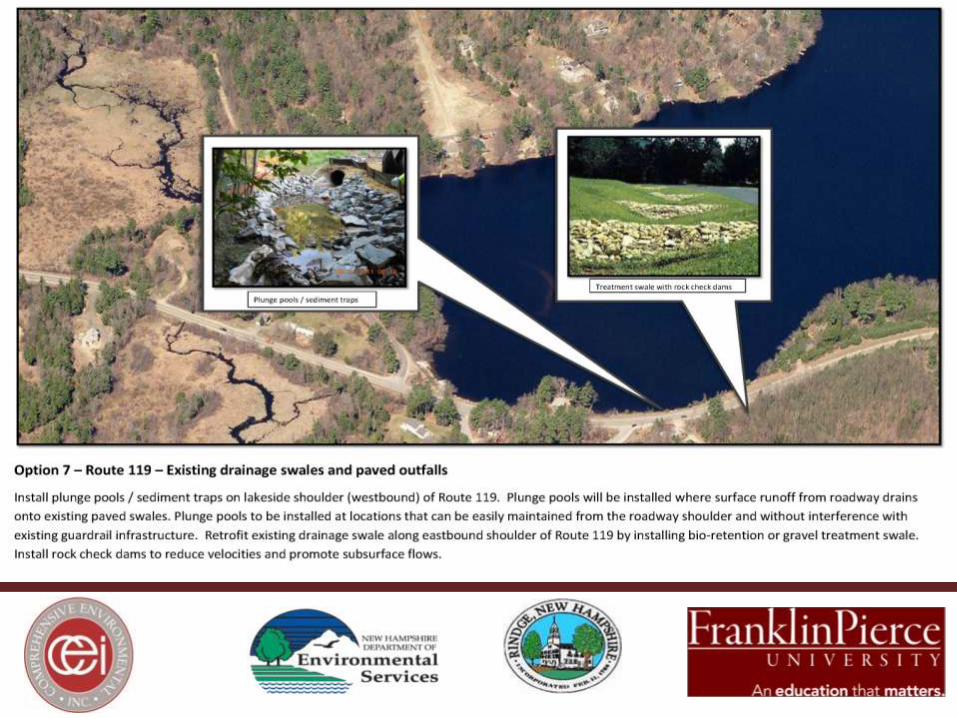
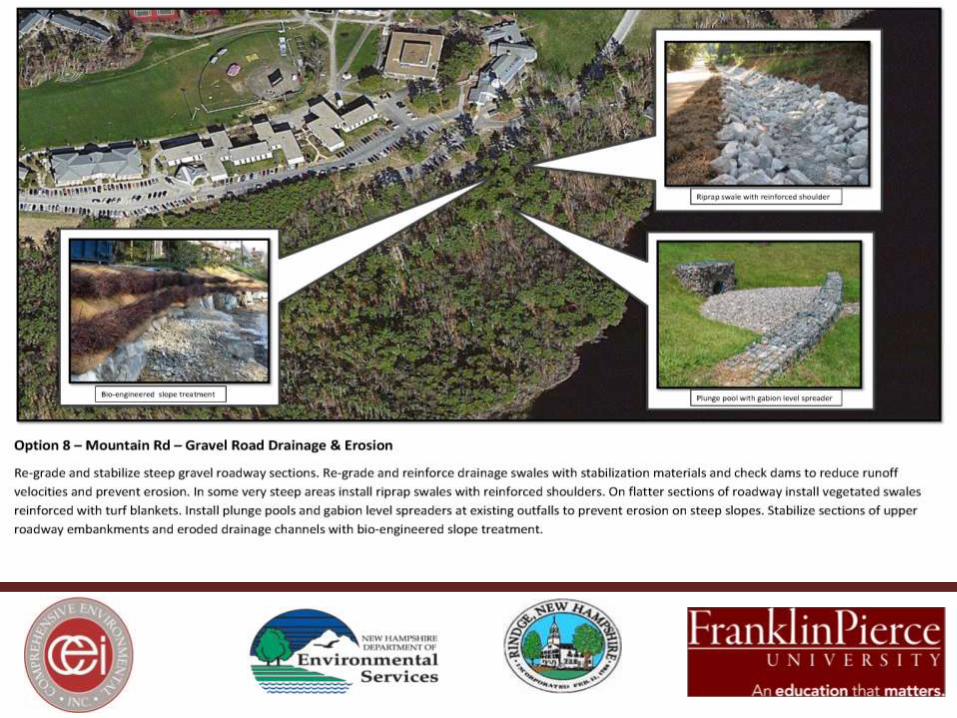
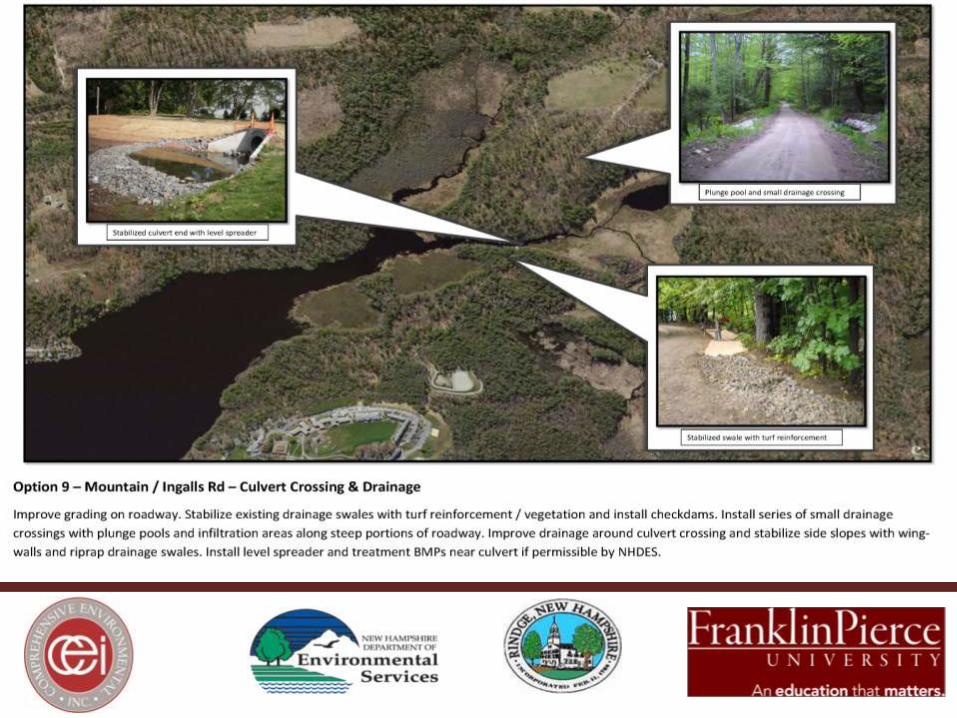
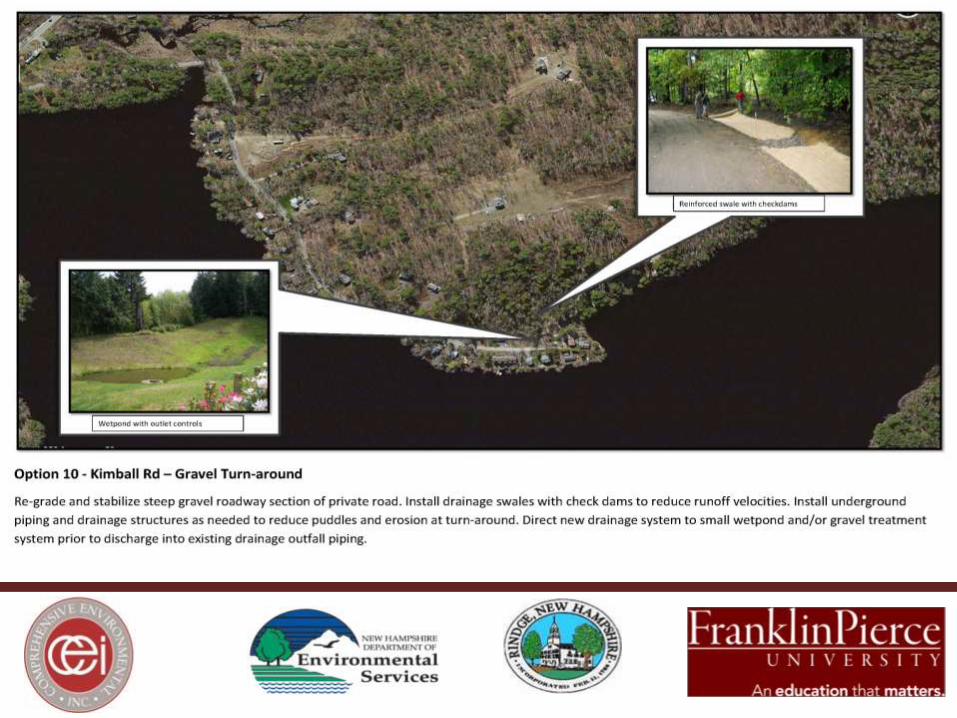
Stormwater BMP Evaluation
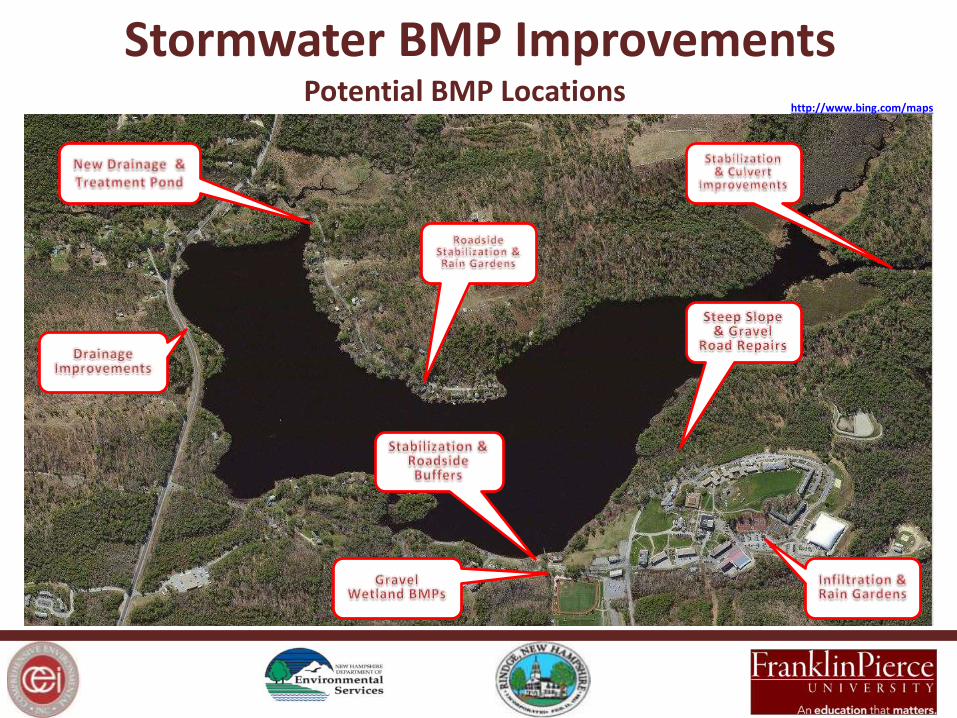
Stormwater BMP Improvements Potential BMP Locations
http://www.bing.com/maps

Questions?