Embed Size (px)
Citation preview

Watershed Level Response of Brook Trout Populations to Catastrophic Flooding from
Tropical Storm Lee
Jonathan Niles, John Panas, Sam Silknetter
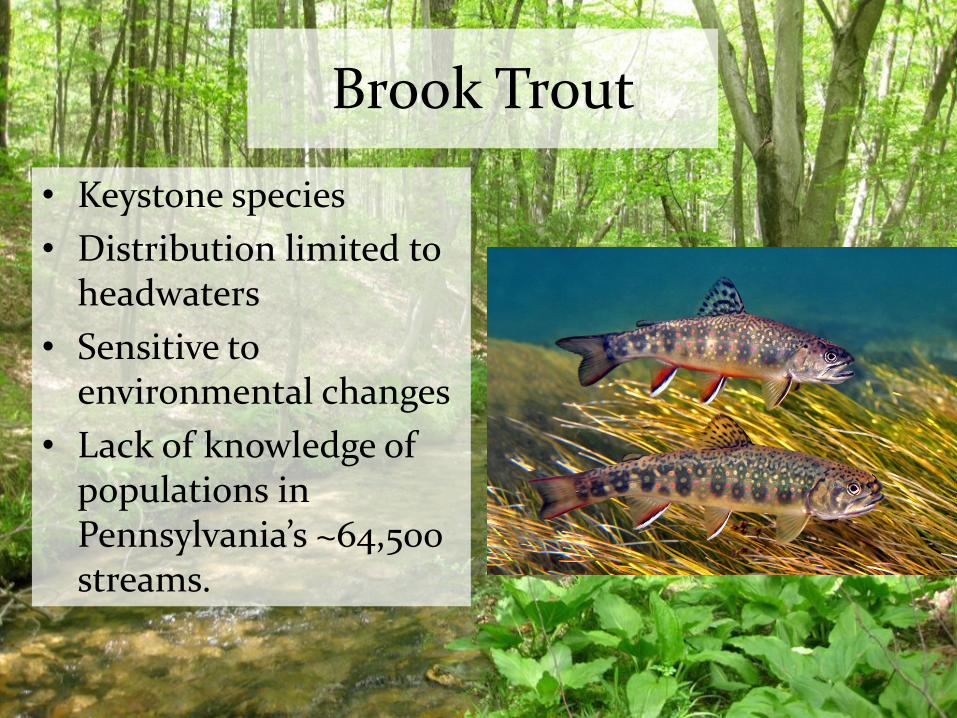
Brook Trout
• Keystone species
• Distribution limited to headwaters
• Sensitive to environmental changes
• Lack of knowledge of populations in Pennsylvania’s ~64,500 streams.

Summer 2011
Worked with PFBC to document trout populations 82 previously unassessed tributaries to Loyalsock Creek
Volunteers from LCWA
Collected trout population data, trout weights, trout diets, and benthic macroinvertebrate samples
Recorded baseline data for 82 streams
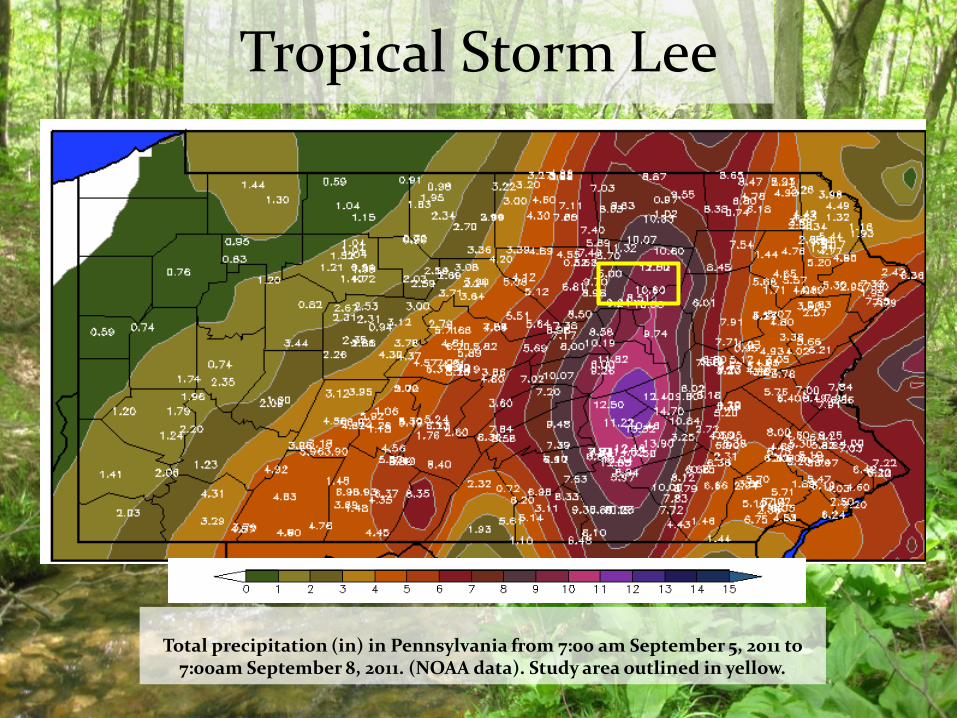
Tropical Storm Lee
Total precipitation (in) in Pennsylvania from 7:00 am September 5, 2011 to
7:00am September 8, 2011. (NOAA data). Study area outlined in yellow.
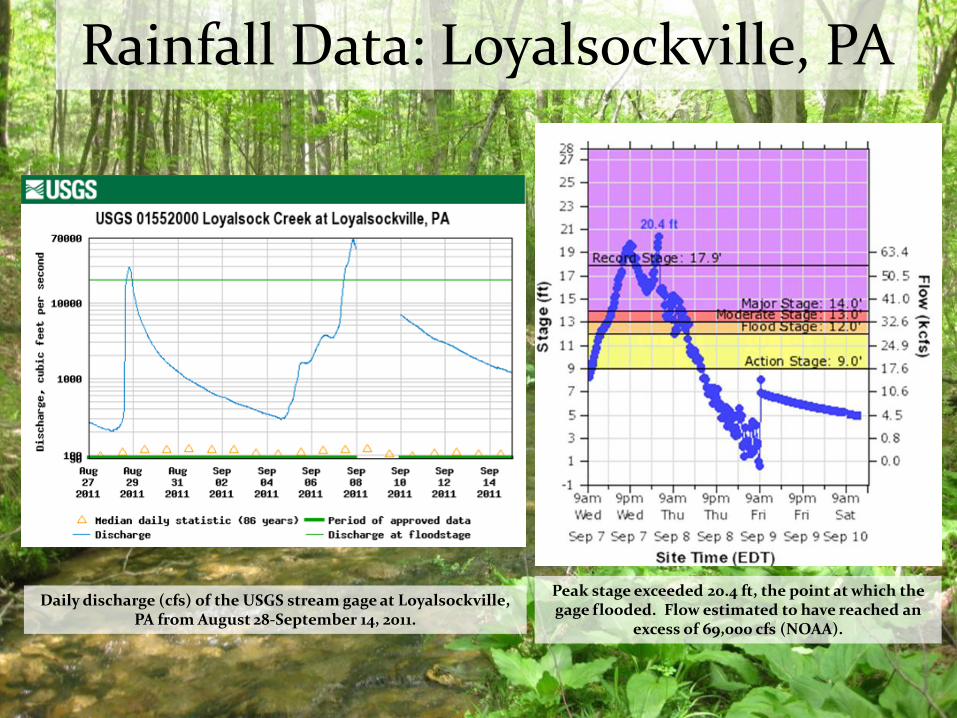
Rainfall Data: Loyalsockville, PA
Peak stage exceeded 20.4 ft, the point at which the gage flooded. Flow estimated to have reached an
excess of 69,000 cfs (NOAA).
Daily discharge (cfs) of the USGS stream gage at Loyalsockville, PA from August 28-September 14, 2011.

Photo: Williamsport Sun Gazette
Photo: Williamsport P.D.

Research opportunity
• Unique opportunity to observe population response across a watershed to natural stochastic event
• Pre-flood data recorded less than 3 months prior
• Re-sampled for trout in early Oct. 2011 in 5 streams
– Lick, Rock, Mill, Streby, and Yellow Runs
– Trout populations severely depressed
– Streams scoured and redirected

Comparison of trout populations from summer 2011 and our resampling in October after Tropical Storm Lee.
Comparison of Trout Population Estimates

Introduction
• Few studies of short-term stochastic events on salmonid populations
• Catastrophic flooding may remove year classes and reduce standing crops (Elwood and Waters 1969)
• Population recovery may take 3-5 years. Densities can exceed pre-flood within 5 years (Roghair et al. 2002, Roghair and Dolloff 2005)

Questions
• How long will recolonization take? (If at all)
• Will population estimates and densities exceed pre-flood levels?
• Will population age structures be altered?
• How long until populations are able to restabilize?

Methods
• 30 sites
• 1st and 2nd order streams
• 100 m length
• Triple pass collection
• Total length (mm)
• Weight (g)
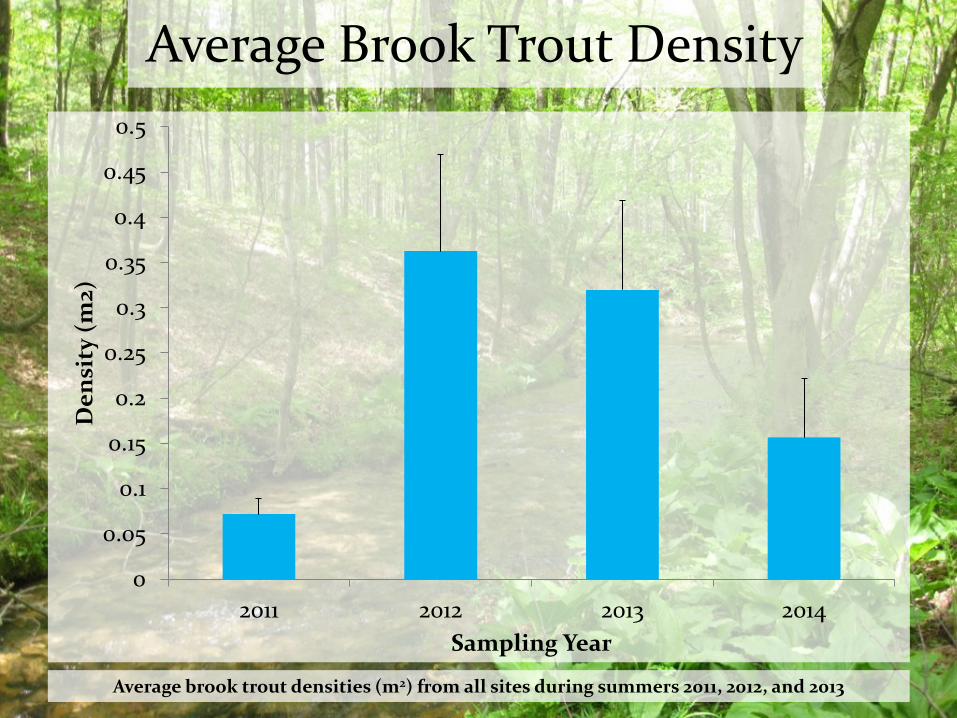
Average Brook Trout Density
Average brook trout densities (m2) from all sites during summers 2011, 2012, and 2013
0
0.05
0.1
0.15
0.2
0.25
0.3
0.35
0.4
0.45
0.5
2011 2012 2013 2014
De
nsi
ty (
m2)
Sampling Year

Brook Trout Density
Brook trout density (m2) from all 30 sites during summers 2011, 2012, and 2013
0
0.2
0.4
0.6
0.8
1
1.2
1.4
2010 2011 2012 2013 2014
De
nsi
ty (
m2)
Samping Year
2011
2012
2013
2014

Average Population Estimates
Average population estimates: all brook trout, young of the year brook trout, and adult brook trout from all sites during summers 2011, 2012, and 2013
0
20
40
60
80
100
120
2011 2012 2013 2014
Ave
rag
e P
op
ula
tio
n E
stim
ate
Sampling Year
Total
YoY
Age 1+

0
10
20
30
40
50
60
70
80
90
100
Fre
qu
en
cy
Total Length (mm)
Size distribution and frequency of brook trout from all sites 2011 pre-flood. Brook Trout Frequency: Age-0 (97), Age-1 (185), Age-2 (124), Ages 3-5 (77)
2011 Brook Trout Size Structure

0
100
200
300
400
500
600
700
800
900
Fre
qu
en
cy
Total Length (mm)
Size distribution and frequency of brook trout from all sites 2012 post-flood. Brook Trout Frequency: Age-0 (2153), Age-1 (39), Age-2 (37), Ages 3-5 (90)
2012 Brook Trout Size Structure
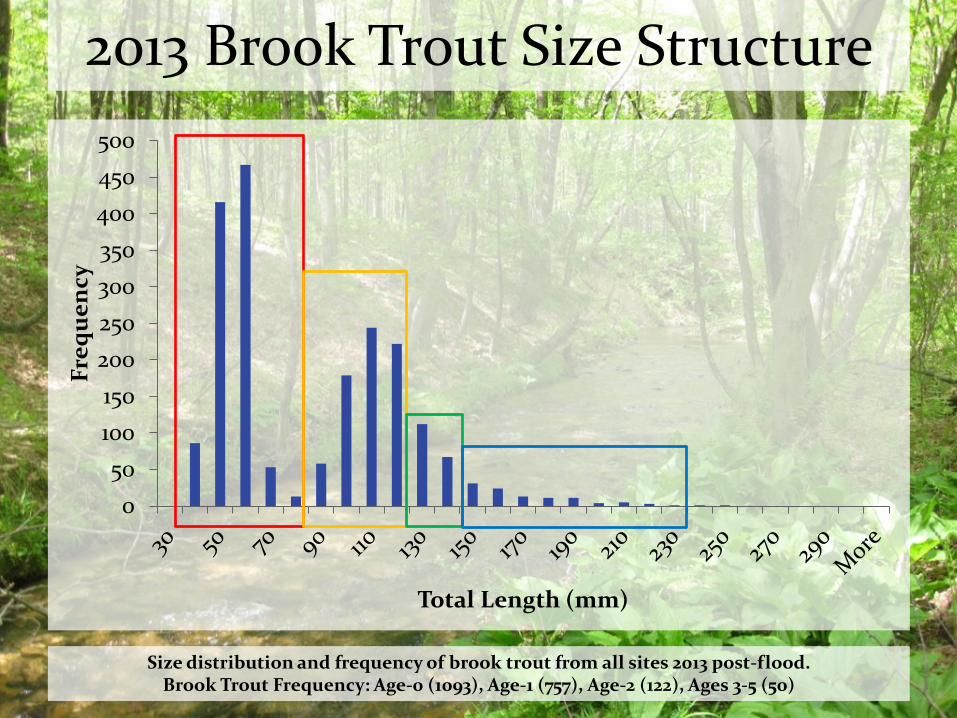
2013 Brook Trout Size Structure
0
50
100
150
200
250
300
350
400
450
500
Fre
qu
en
cy
Total Length (mm)
Size distribution and frequency of brook trout from all sites 2013 post-flood. Brook Trout Frequency: Age-0 (1093), Age-1 (757), Age-2 (122), Ages 3-5 (50)

0
50
100
150
200
250
300
350
400
450
500
Fre
qu
en
cy
Total Length (mm)
2014 Brook Trout Size Structure
Size distribution and frequency of brook trout from all sites 2014 post-flood. Brook Trout Frequency: Age-0 (513), Age-1 (646), Age-2 (132), Ages 3-5 (91)

Mill Creek 2011 Size Structure
0
10
20
30
40
50
60
70 30
40
50
60
70
80
90
100
110
120
130
140
150
160
170
180
190
200
210
220
230
Mo
re
Fre
qu
en
cy
Total Length (mm)
Size distribution and frequency of brook trout from Mill Run 2011 pre-flood. Brook Trout Frequency: Age-0 (0), Age-1 (3), Age-2 (10), Ages 3-5 (5)

Mill Creek 2012 Brook Trout Size Structure
0
10
20
30
40
50
60
70 30
40
50
60
70
80
90
100
110
120
130
140
150
160
170
180
190
200
210
220
230
Mo
re
Fre
qu
en
cy
Total Length (mm)
Size distribution and frequency of brook trout from Mill Run 2012 post-flood. Brook Trout Frequency: Age-0 (98), Age-1 (0), Age-2 (0), Ages 3-5 (12)

Mill Creek 2013 Brook Trout Size Structure
0
10
20
30
40
50
60
70 30
40
50
60
70
80
90
100
110
120
130
140
150
160
170
180
190
200
210
220
230
Mo
re
Fre
qu
en
cy
Total Length (mm)
Size distribution and frequency of brook trout from Mill Run 2013 post-flood. Brook Trout Frequency: Age-0 (105), Age-1 (32), Age-2 (20), Ages 3-5 (10)

0
10
20
30
40
50
60
70
Fre
qu
en
cy
Total Length (mm)
Mill Creek 2014 Brook Trout Size Structure
Size distribution and frequency of brook trout from Mill Run 2014 post-flood. Brook Trout Frequency: Age-0 (80), Age-1 (25), Age-2 (7), Ages 3-5 (6)

Conclusions
• Flooding had an impact on fish less than 150 mm in size.
• In most cases, brook trout were able to immediately recolonize stream reaches
• Age structures greatly altered and susceptible – Age 0-1 brook trout nearly eliminated across all sites
– Some age 2-4 trout were able to survive and spawn fall 2011
• Summers 2012 and 2013 population estimates and densities drastically exceeded pre-flood levels
• Compensatory recruitment evident 2012
– Age-0 class recruited into age-1 year class in 2013
• Population restabilization beginning 2013

Future Work
• 4th year post flood data collection on sites
• Further statistical analysis
• BMI samples
• Brook trout diet samples
Acknowledgements
Other Undergraduate Students
Andy Anthony
Dan Isenberg
Desmond Edwards
Jeremy Gurbatow
Caleb Currens
• Steve Szoke
• Loyalsock Creek Watershed Association
• Degenstein Foundation
• Cora Brooks Foundation

Questions?