Embed Size (px)
Citation preview
Watershed-based microbial source tracking study: From implementation and solutions to
research and method evaluation
byNancy M. White
UNC Coastal Studies Institute
Manteo, North Carolina2006 USDA-CSREES National Water Conference
February 5-9, 2006San Antonio Marriott Rivercenter
San Antonio, TX
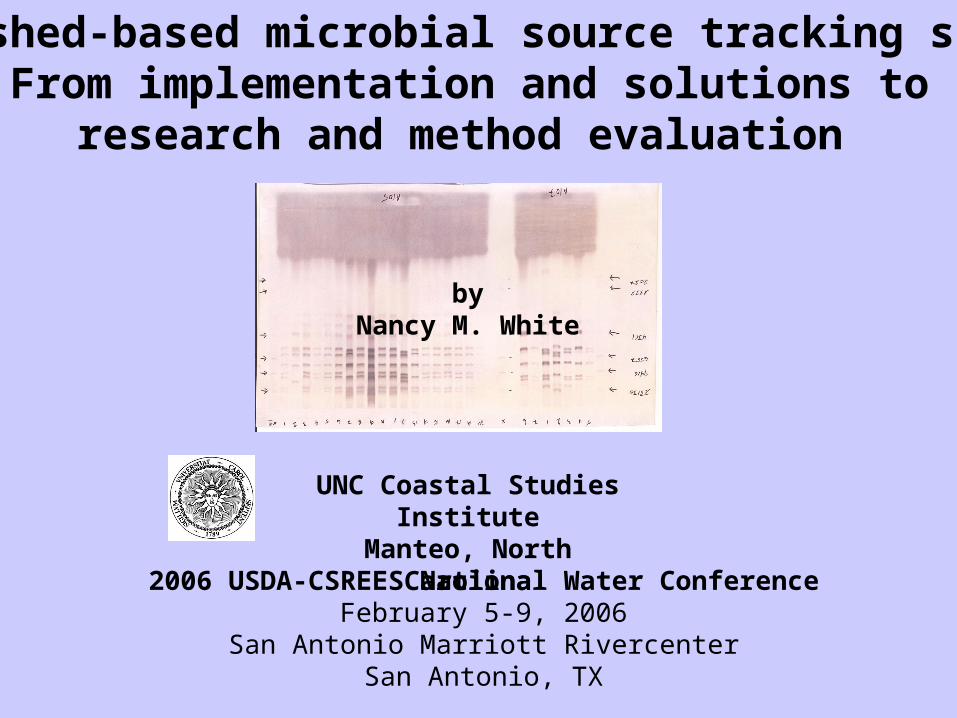
Cooperators and Participants UNC Coastal Studies Institute UNC-Institute of Marine SciencesNCSU CMASTNC Division of Health, Shellfish Sanitation Program Duke Marine LaboratoryNCSU Water Quality Group NOAA/NOS Center for Coastal Environmental
Health and Bimolecular Research Carteret Craven Electric CooperativeJumping Run Creek Watershed CitizensCroatan National Forest Open Grounds FarmUSDA-CSREESNCDENR Division of Water Quality, 319 ProgramNC Clean Water Management Trust FundNC Wetland Restoration Program
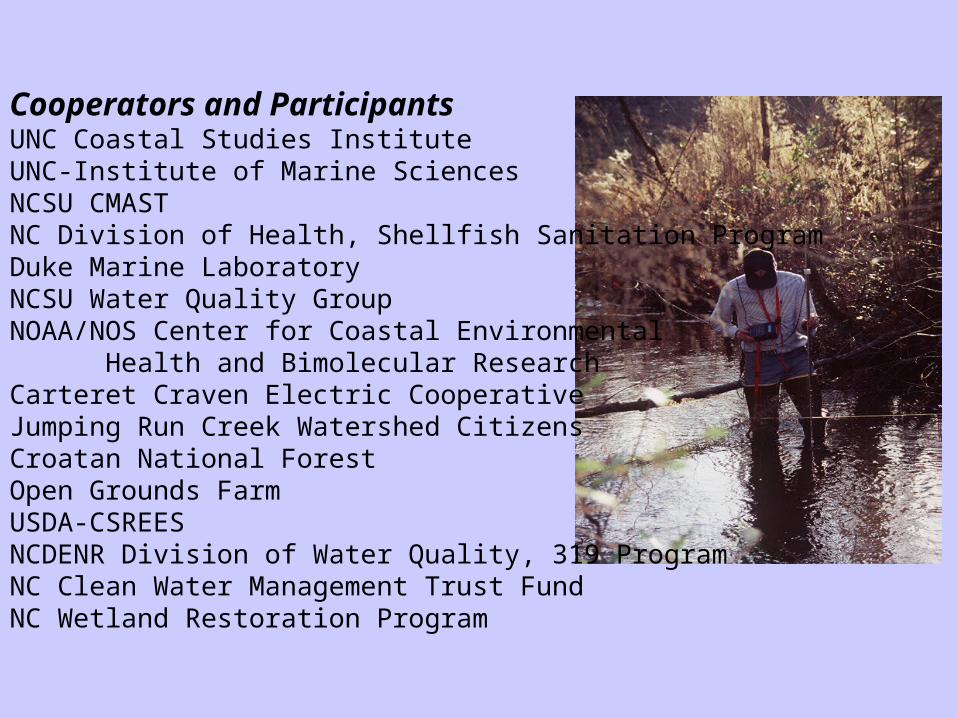
Pamlico Sound
Neuse River Estuary
Jumping RunCreek
Cape Hatteras/Outer Banks
Open Grounds Farm
Croatan NationalForrest
APESRegion
Bogue Sound
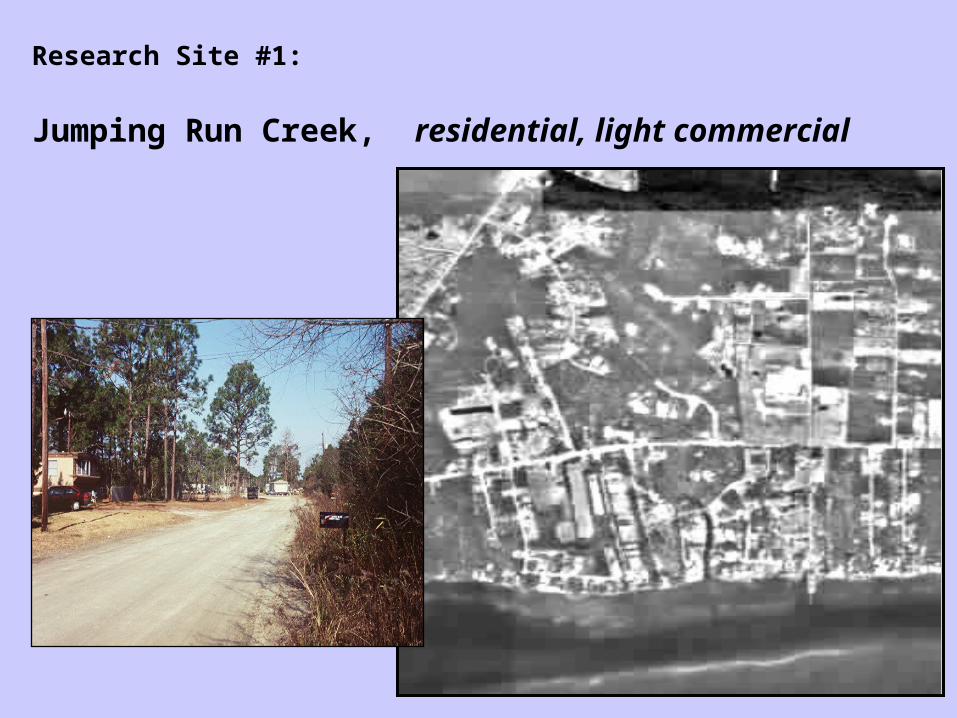
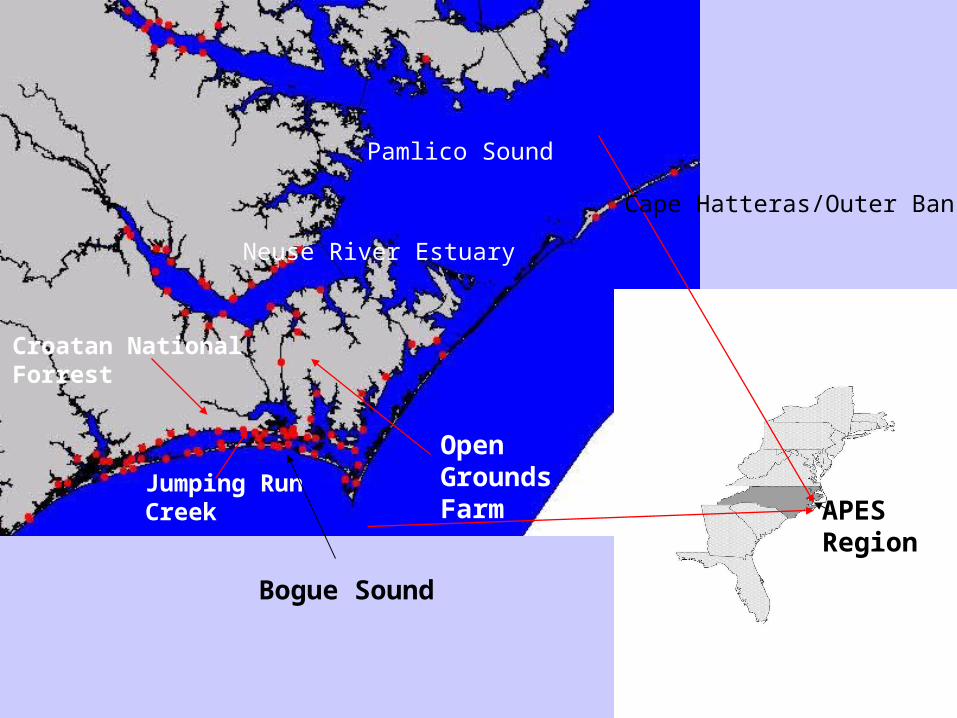
Research Site #1:
Jumping Run Creek, residential, light commercial
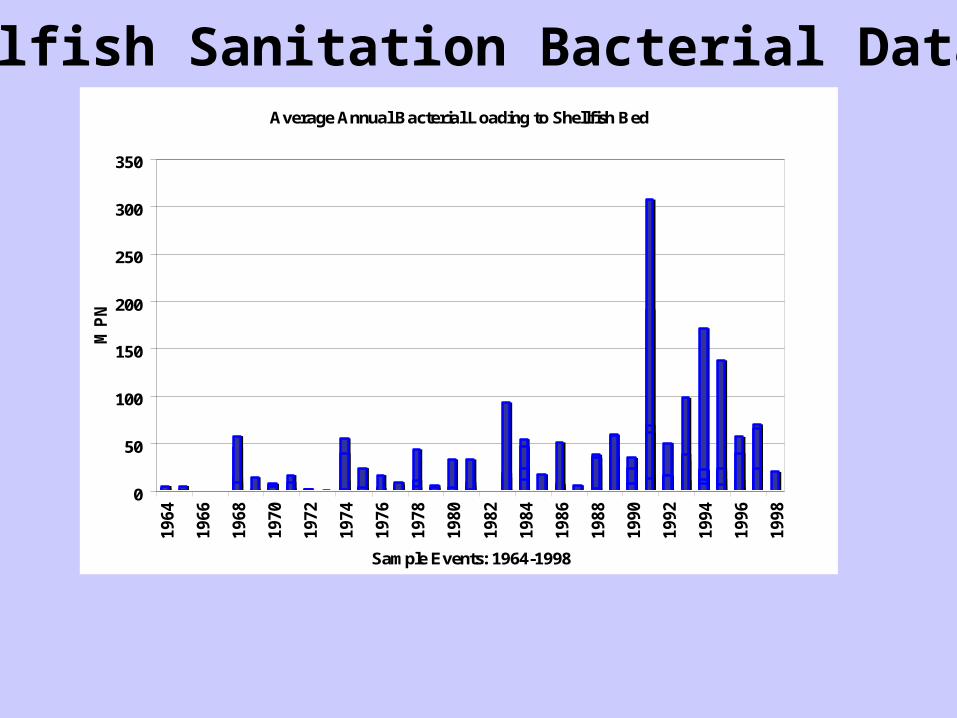
Shellfish Sanitation Bacterial DatabaseAverage Annual Bacterial Loading to Shellfish Bed
0
50
100
150
200
250
300
3501
96
4
19
66
19
68
19
70
19
72
19
74
19
76
19
78
19
80
19
82
19
84
19
86
19
88
19
90
19
92
19
94
19
96
19
98
Sample Events: 1964-1998
MP
N
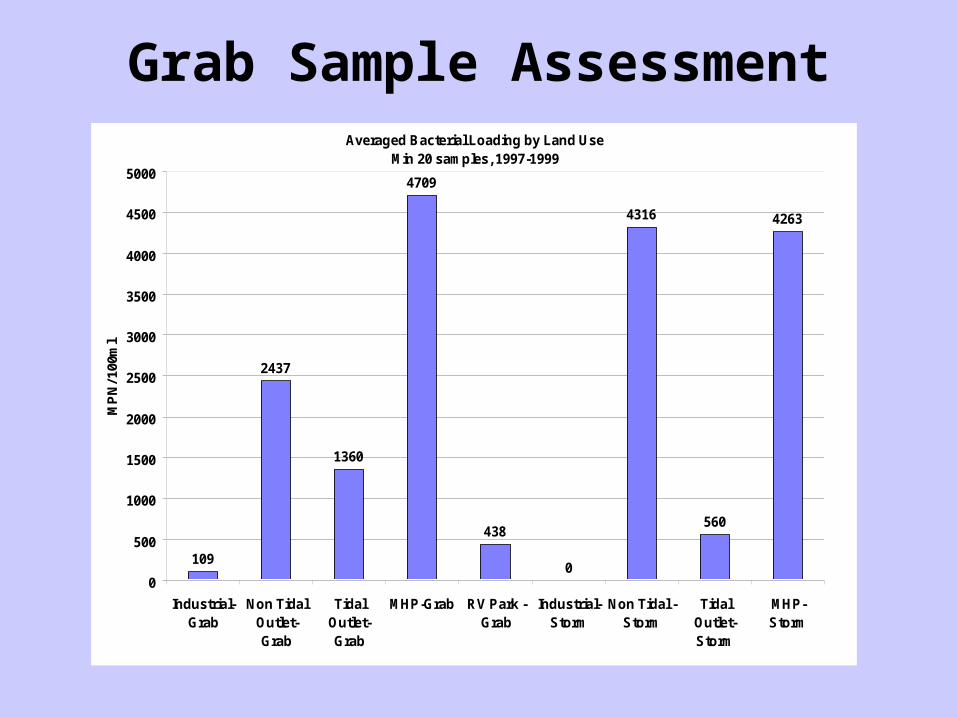
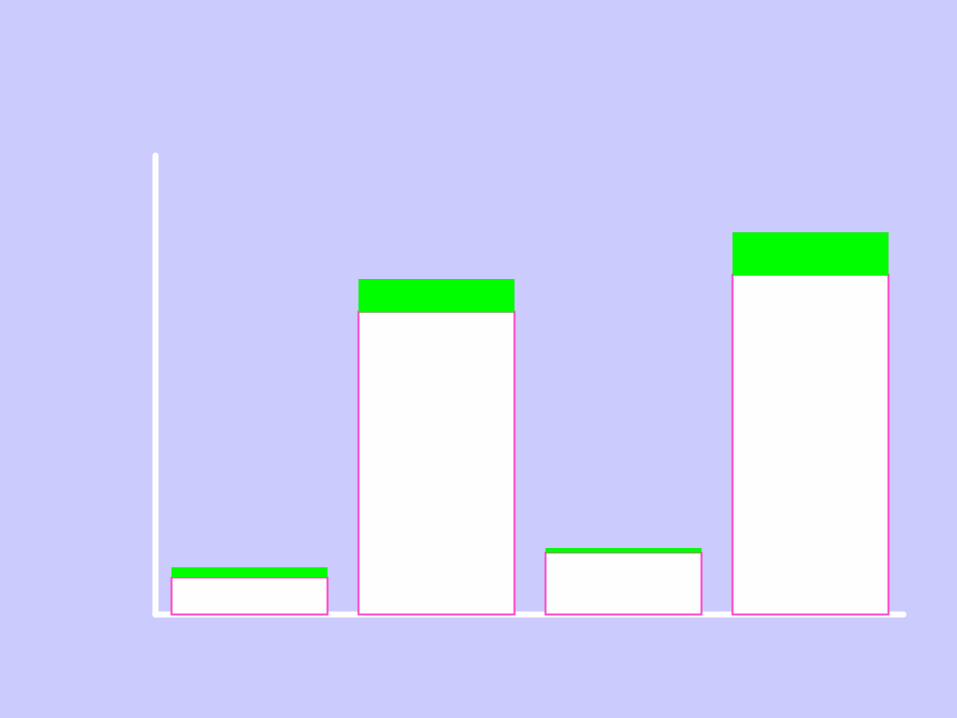
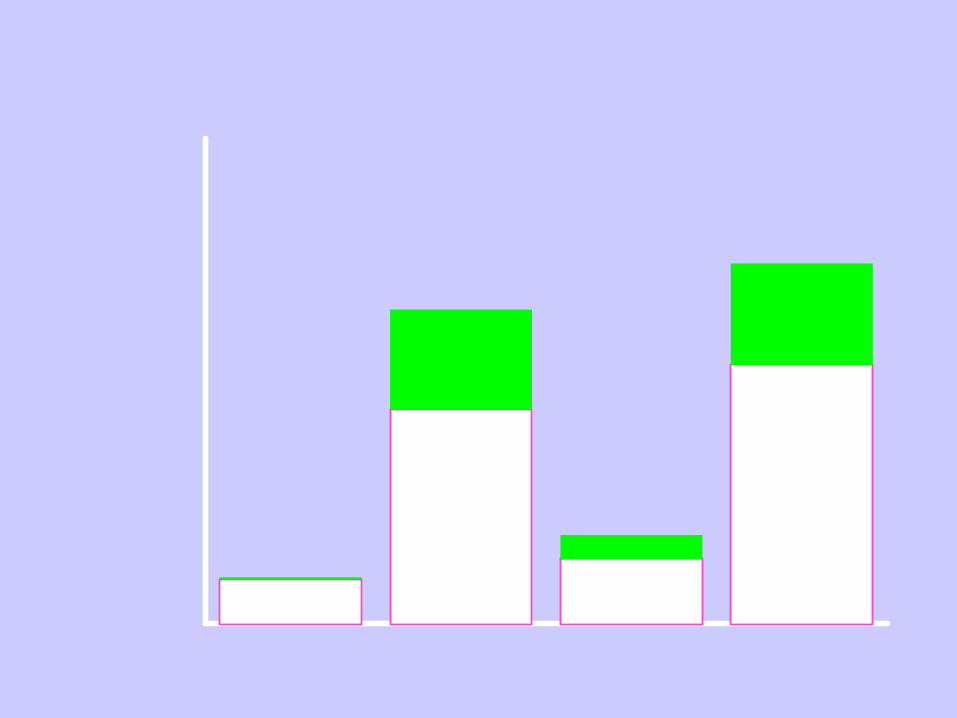
Averaged Bacterial Loading by Land UseMin 20 samples, 1997-1999
109
2437
1360
4709
438
0
4316
560
4263
0
500
1000
1500
2000
2500
3000
3500
4000
4500
5000
Industrial-Grab
Non TidalOutlet-Grab
TidalOutlet-Grab
MHP-Grab RV Park -Grab
Industrial-Storm
Non Tidal -Storm
TidalOutlet-Storm
MHP-Storm
MP
N/ 1
00m
l
Grab Sample Assessment
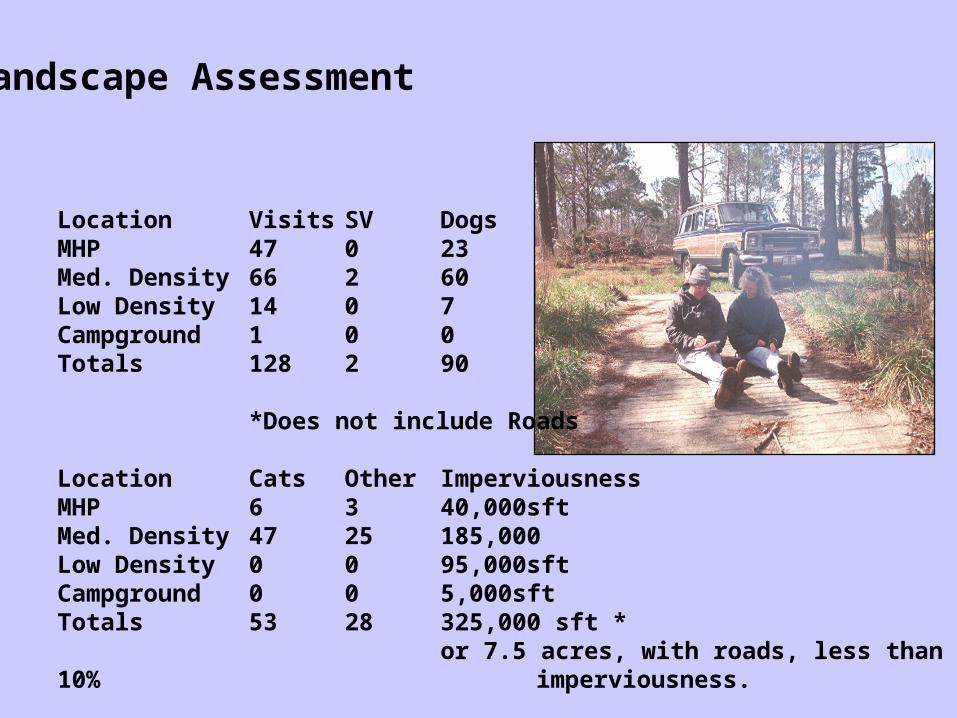
Landscape Assessment
Location Visits SV DogsMHP 47 0 23Med. Density 66 2 60Low Density 14 0 7Campground 1 0 0Totals 128 2 90
*Does not include Roads
Location Cats Other ImperviousnessMHP 6 3 40,000sftMed. Density 47 25 185,000Low Density 0 0 95,000sftCampground 0 0 5,000sftTotals 53 28 325,000 sft *
or 7.5 acres, with roads, less than 10% imperviousness.
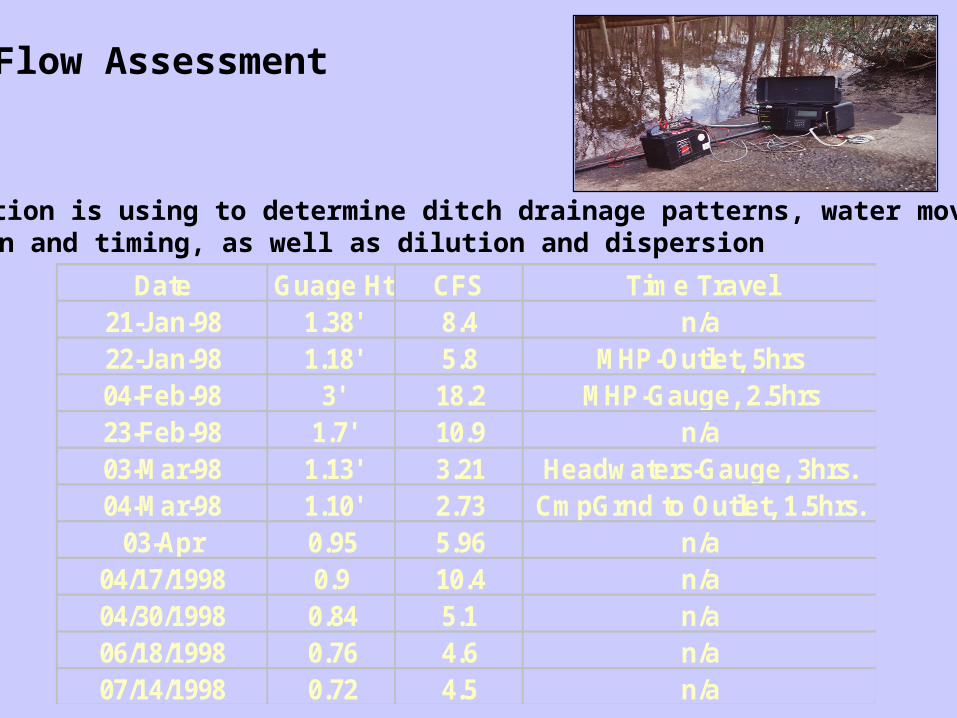
Flow Assessment
Date Guage Ht CFS Time Travel21-Jan-98 1.38' 8.4 n/a22-Jan-98 1.18' 5.8 MHP-Outlet, 5hrs04-Feb-98 3' 18.2 MHP-Gauge, 2.5hrs23-Feb-98 1.7' 10.9 n/a03-Mar-98 1.13' 3.21 Headwaters-Gauge, 3hrs.04-Mar-98 1.10' 2.73 CmpGrnd to Outlet, 1.5hrs.
03-Apr 0.95 5.96 n/a04/17/1998 0.9 10.4 n/a04/30/1998 0.84 5.1 n/a06/18/1998 0.76 4.6 n/a07/14/1998 0.72 4.5 n/a
Information is using to determine ditch drainage patterns, water movement direction and timing, as well as dilution and dispersion
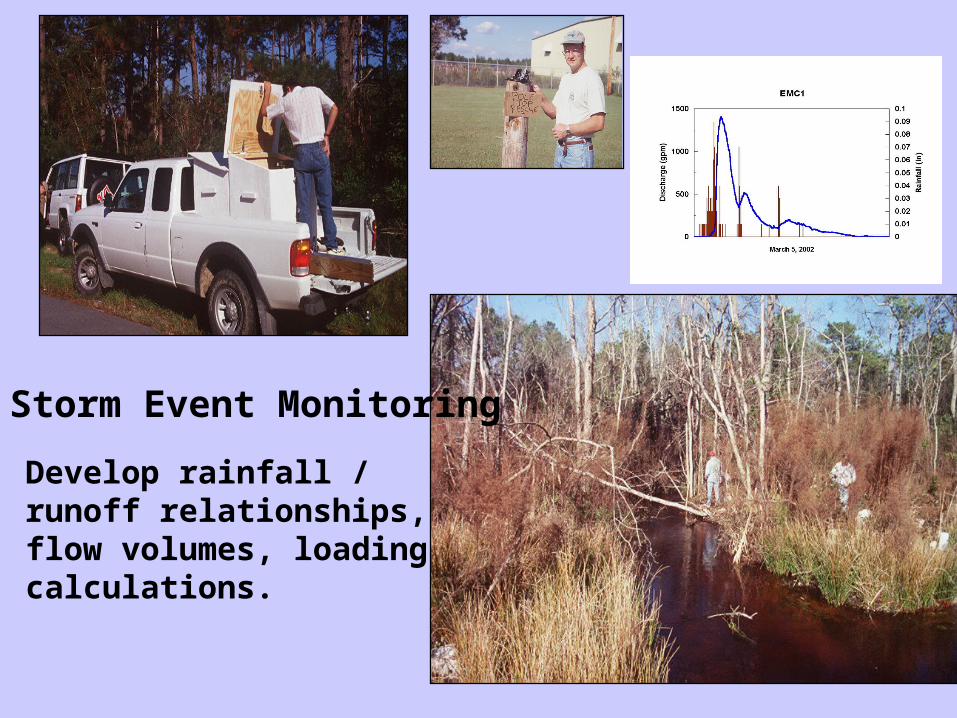
Storm Event Monitoring
Develop rainfall / runoff relationships, flow volumes, loading calculations.
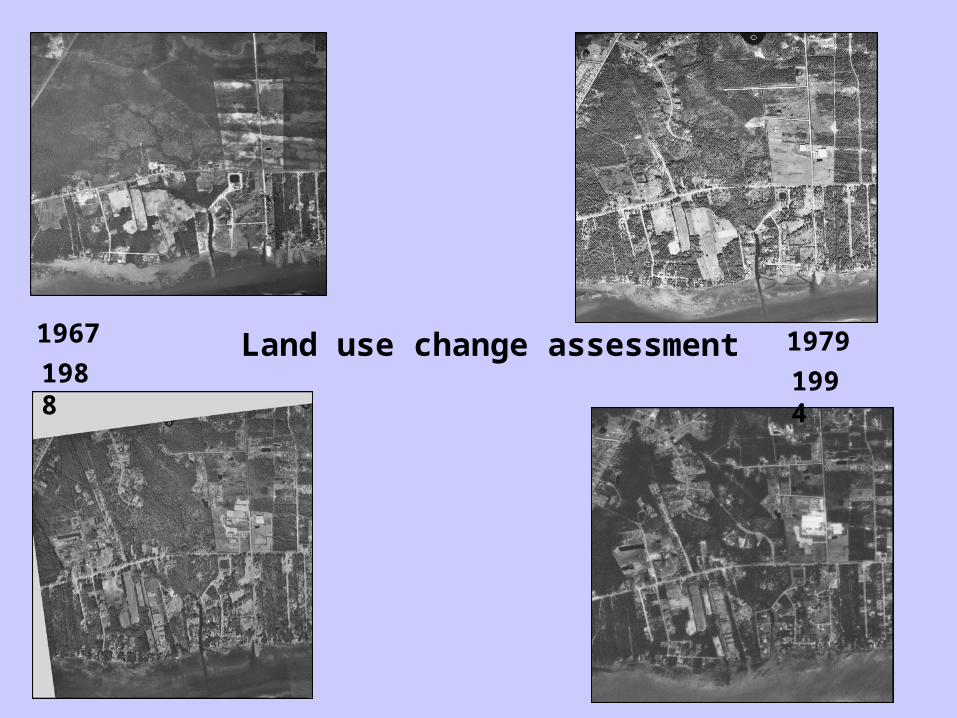
1967 19791988 1994
Land use change assessment
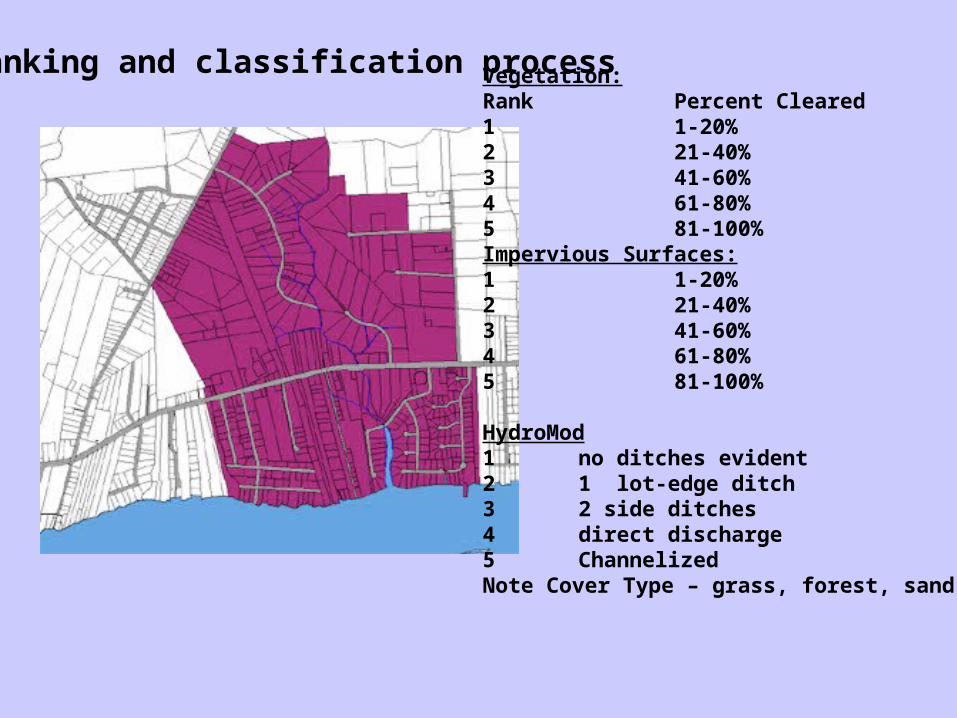
Vegetation: Rank Percent Cleared1 1-20%2 21-40%3 41-60%4 61-80%5 81-100%Impervious Surfaces:1 1-20%2 21-40%3 41-60%4 61-80%5 81-100%
HydroMod1 no ditches evident2 1 lot-edge ditch3 2 side ditches4 direct discharge5 ChannelizedNote Cover Type – grass, forest, sand.
Ranking and classification process
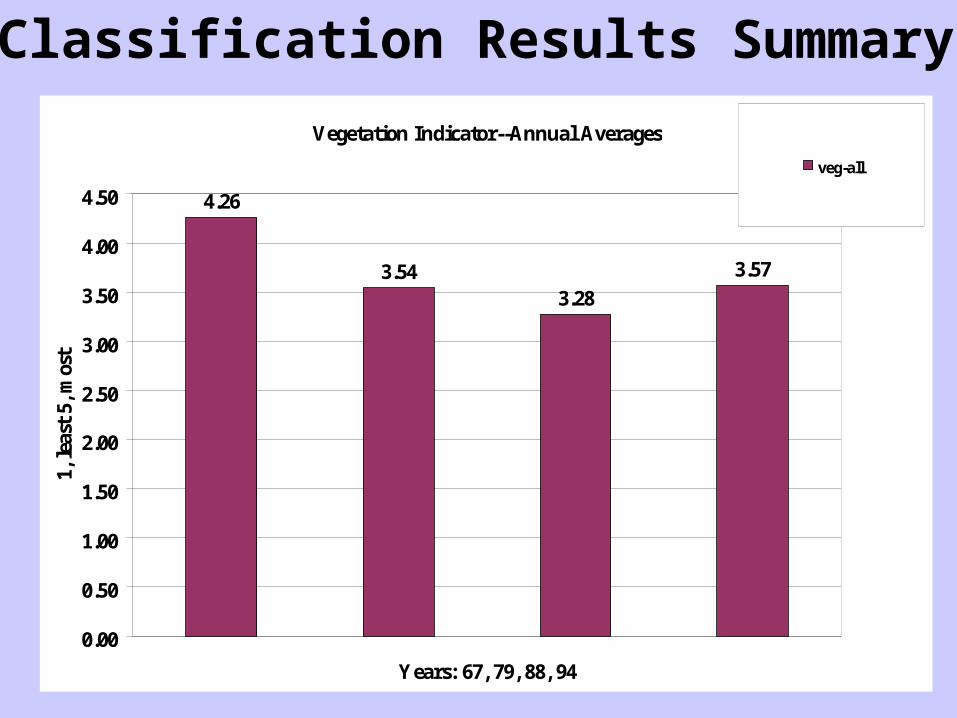
Vegetation Indicator--Annual Averages
4.26
3.543.28
3.57
0.00
0.50
1.00
1.50
2.00
2.50
3.00
3.50
4.00
4.50
Years: 67, 79, 88, 94
1, le
ast
5, m
ost
veg-all
Classification Results Summary
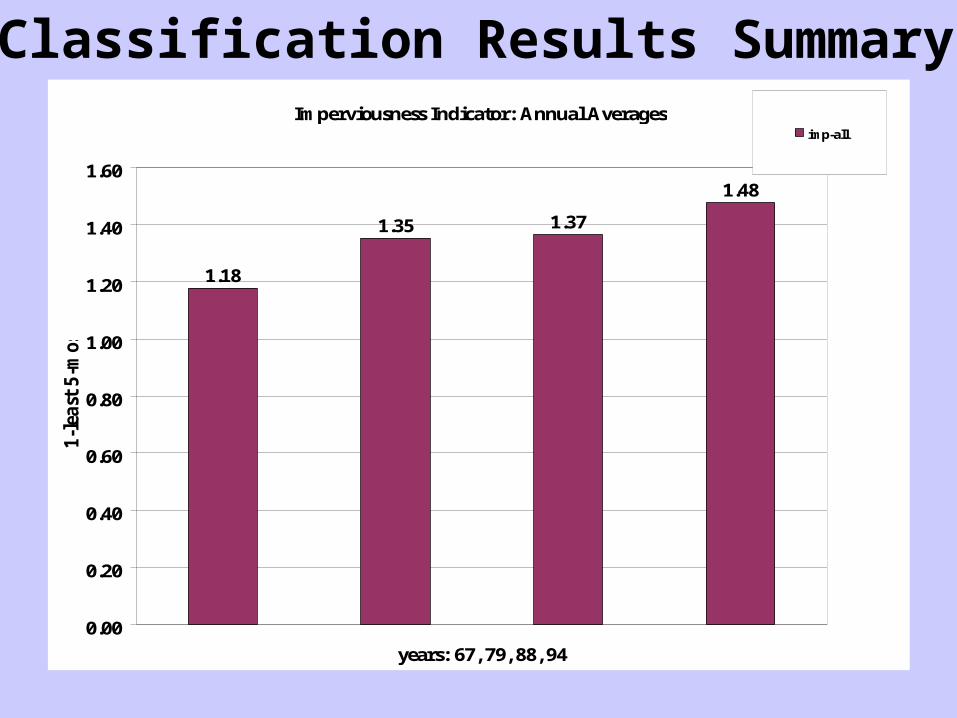
Classification Results SummaryImperviousness Indicator: Annual Averages
1.18
1.35 1.37
1.48
0.00
0.20
0.40
0.60
0.80
1.00
1.20
1.40
1.60
years: 67, 79, 88, 94
1-l
east
5-m
ost
imp-all
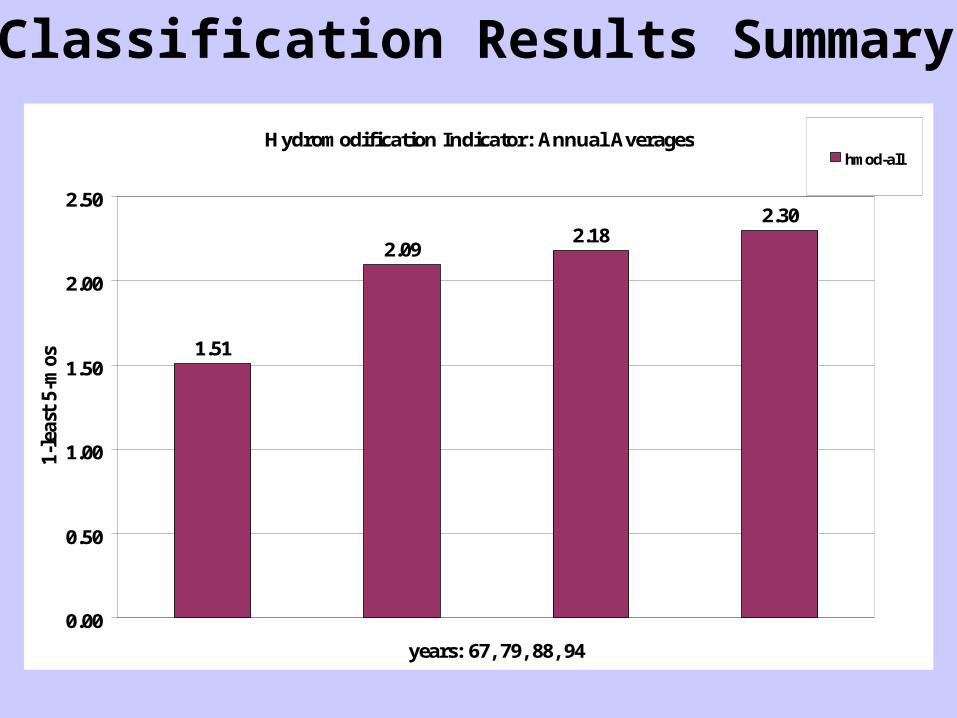
Classification Results Summary
Hydromodification Indicator: Annual Averages
1.51
2.092.18
2.30
0.00
0.50
1.00
1.50
2.00
2.50
years: 67, 79, 88, 94
1-le
ast
5-m
ost
hmod-all
J1 J2 J4 HY J1 J2 J4 HY J1 J2 J4 HY0
50
100
150
Lo
ad (
kg)
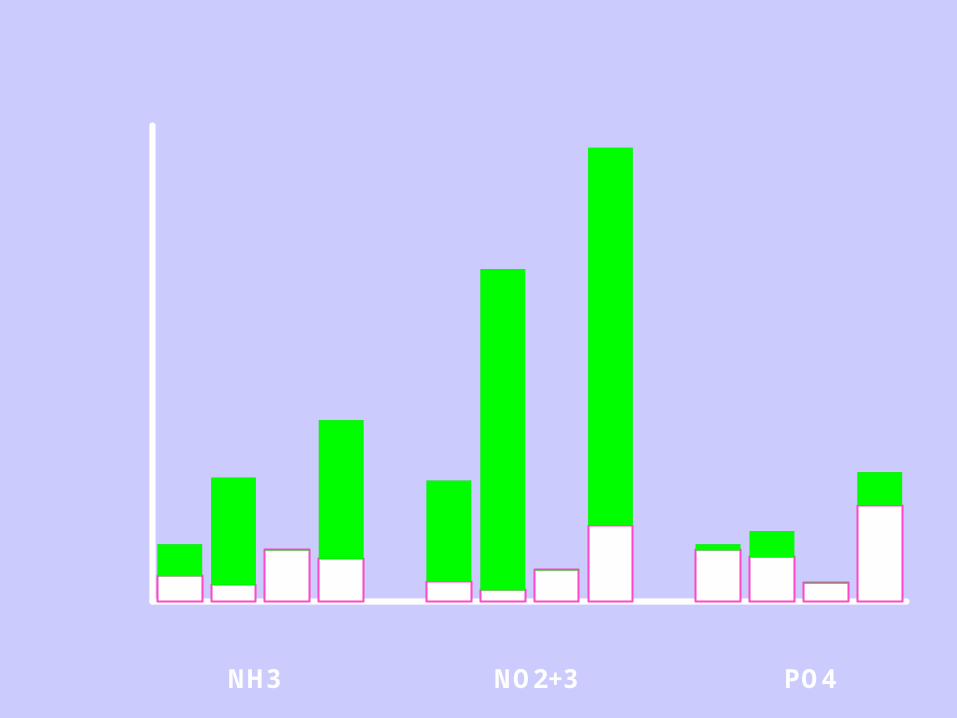
Nonstorm
Storm
Loads from 9/5/99-6/5/00
NH3 NO2+3 PO4
J1 J2 J4 HY
0
5
10
15
20
25
30
TS
S L
oad
(1,
000
kg)
Nonstorm Storm
Loads from 9/5/99-6/5/00
J1 J2 J4 HY0
5
10
15
20
25
30F
ec
al
Co
lifo
rm (
1,0
00
,00
0,0
00
mp
n)
Nonstorm Storm
Loads for 9/5/99-6/5/2000
Integrated Event and MST Monitoring
• Added farm and forest sample sites
• Added a variety of MST methods—ARA, ribotyping, and QPCR using Enterococci speciation and Bacteroides sp. (R. Noble)
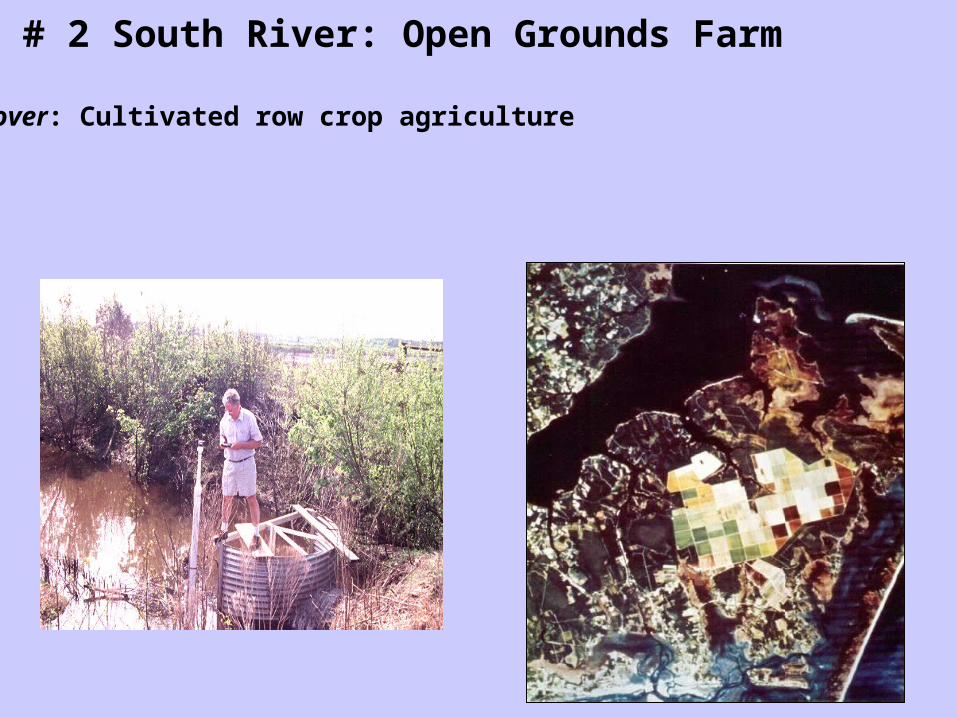
Site # 2 South River: Open Grounds Farm
Land cover: Cultivated row crop agriculture
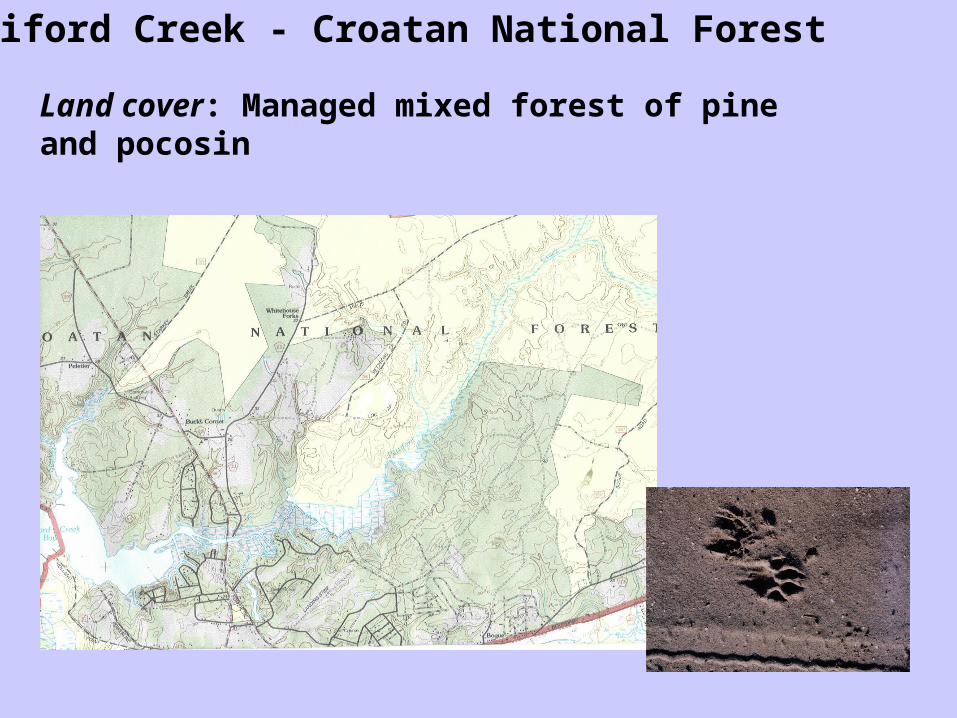
Pettiford Creek - Croatan National Forest
Land cover: Managed mixed forest of pine and pocosin
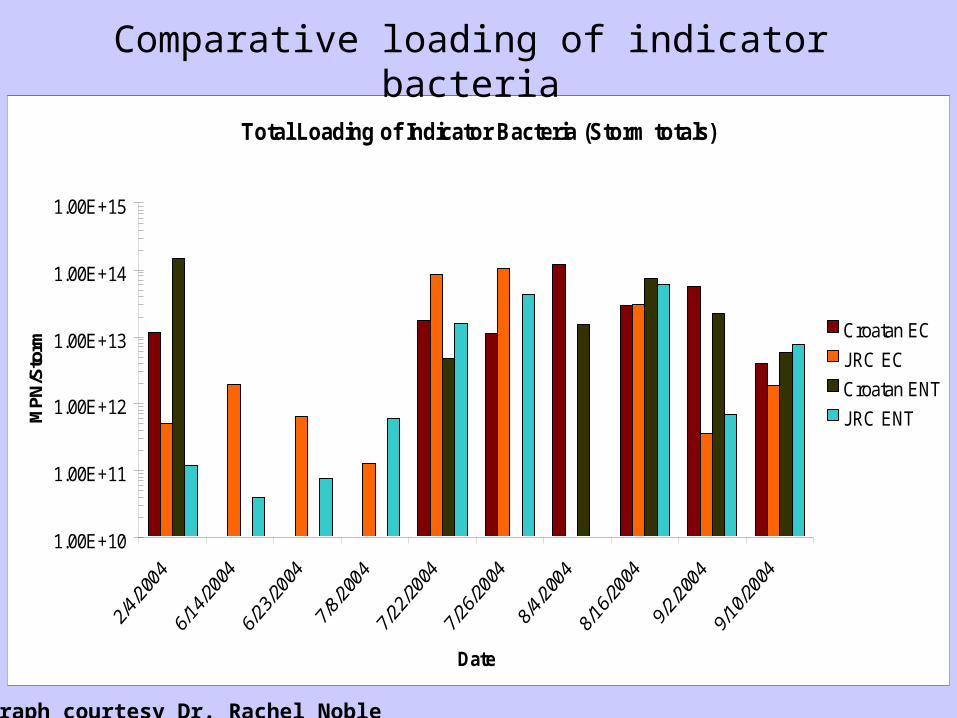
Total Loading of Indicator Bacteria (Storm totals)
1.00E+10
1.00E+11
1.00E+12
1.00E+13
1.00E+14
1.00E+15
Date
MP
N/S
torm
Croatan EC
JRC EC
Croatan ENT
JRC ENT
Comparative loading of indicator bacteria
Graph courtesy Dr. Rachel Noble
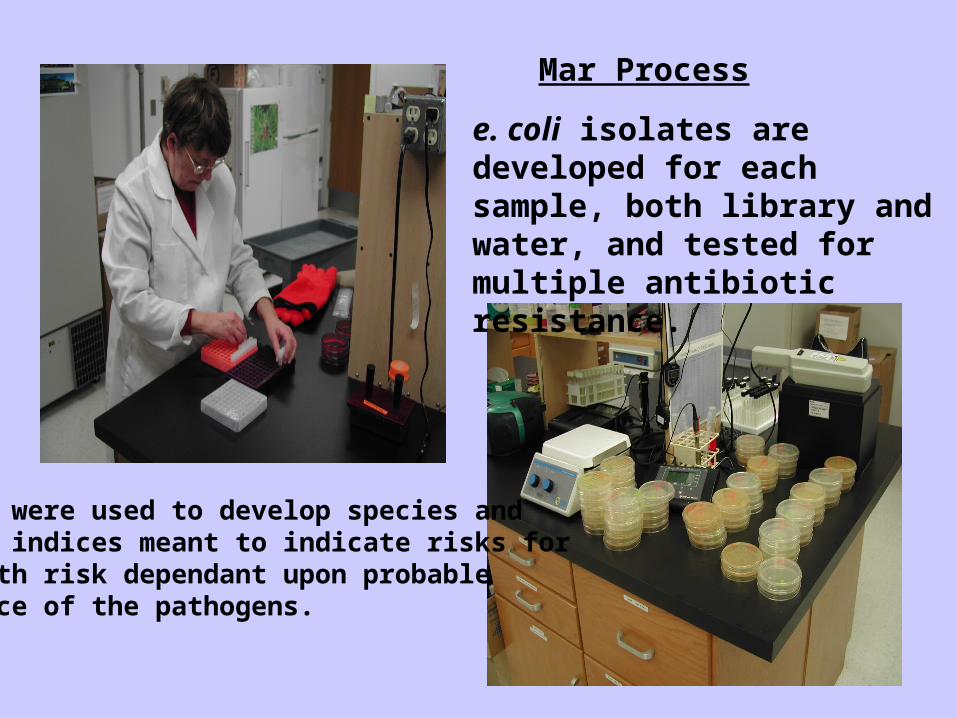
Mar Process
e. coli isolates are developed for each sample, both library and water, and tested for multiple antibiotic resistance.
Data were used to develop species and site indices meant to indicate risks for health risk dependant upon probablesource of the pathogens.
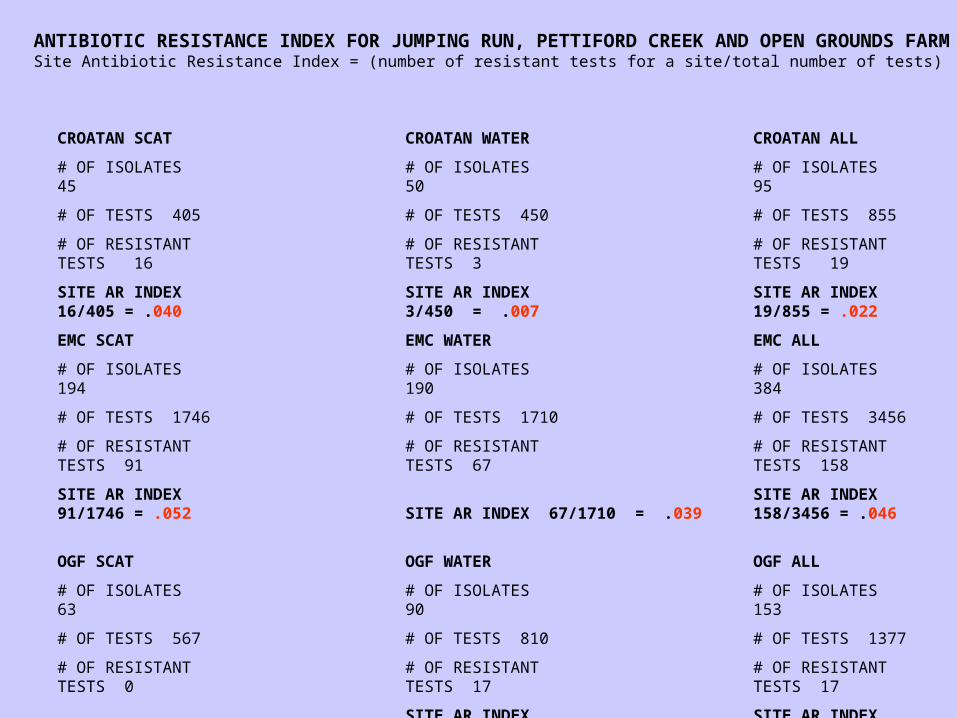
ANTIBIOTIC RESISTANCE INDEX FOR JUMPING RUN, PETTIFORD CREEK AND OPEN GROUNDS FARMSite Antibiotic Resistance Index = (number of resistant tests for a site/total number of tests)
CROATAN SCAT CROATAN WATER CROATAN ALL
# OF ISOLATES 45 # OF ISOLATES 50 # OF ISOLATES 95
# OF TESTS 405 # OF TESTS 450 # OF TESTS 855
# OF RESISTANT TESTS 16
# OF RESISTANT TESTS 3
# OF RESISTANT TESTS 19
SITE AR INDEX 16/405 = .040
SITE AR INDEX 3/450 = .007
SITE AR INDEX 19/855 = .022
EMC SCAT EMC WATER EMC ALL
# OF ISOLATES 194 # OF ISOLATES 190 # OF ISOLATES 384
# OF TESTS 1746 # OF TESTS 1710 # OF TESTS 3456
# OF RESISTANT TESTS 91
# OF RESISTANT TESTS 67
# OF RESISTANT TESTS 158
SITE AR INDEX 91/1746 = .052 SITE AR INDEX 67/1710 = .039
SITE AR INDEX 158/3456 = .046
OGF SCAT OGF WATER OGF ALL
# OF ISOLATES 63 # OF ISOLATES 90 # OF ISOLATES 153
# OF TESTS 567 # OF TESTS 810 # OF TESTS 1377
# OF RESISTANT TESTS 0
# OF RESISTANT TESTS 17
# OF RESISTANT TESTS 17
SITE AR INDEX 0SITE AR INDEX 17/810 = .021
SITE AR INDEX 17/1377 = .012
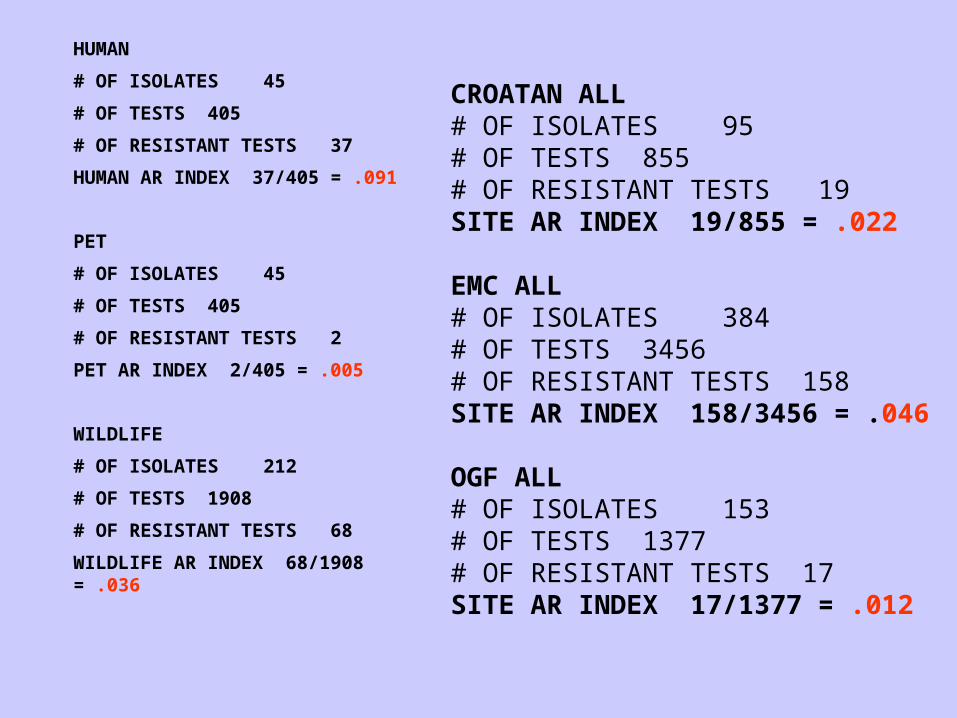
HUMAN
# OF ISOLATES 45
# OF TESTS 405
# OF RESISTANT TESTS 37
HUMAN AR INDEX 37/405 = .091
PET
# OF ISOLATES 45
# OF TESTS 405
# OF RESISTANT TESTS 2
PET AR INDEX 2/405 = .005
WILDLIFE
# OF ISOLATES 212
# OF TESTS 1908
# OF RESISTANT TESTS 68
WILDLIFE AR INDEX 68/1908 = .036
CROATAN ALL # OF ISOLATES 95# OF TESTS 855# OF RESISTANT TESTS 19SITE AR INDEX 19/855 = .022
EMC ALL# OF ISOLATES 384# OF TESTS 3456# OF RESISTANT TESTS 158SITE AR INDEX 158/3456 = .046
OGF ALL# OF ISOLATES 153# OF TESTS 1377# OF RESISTANT TESTS 17SITE AR INDEX 17/1377 = .012
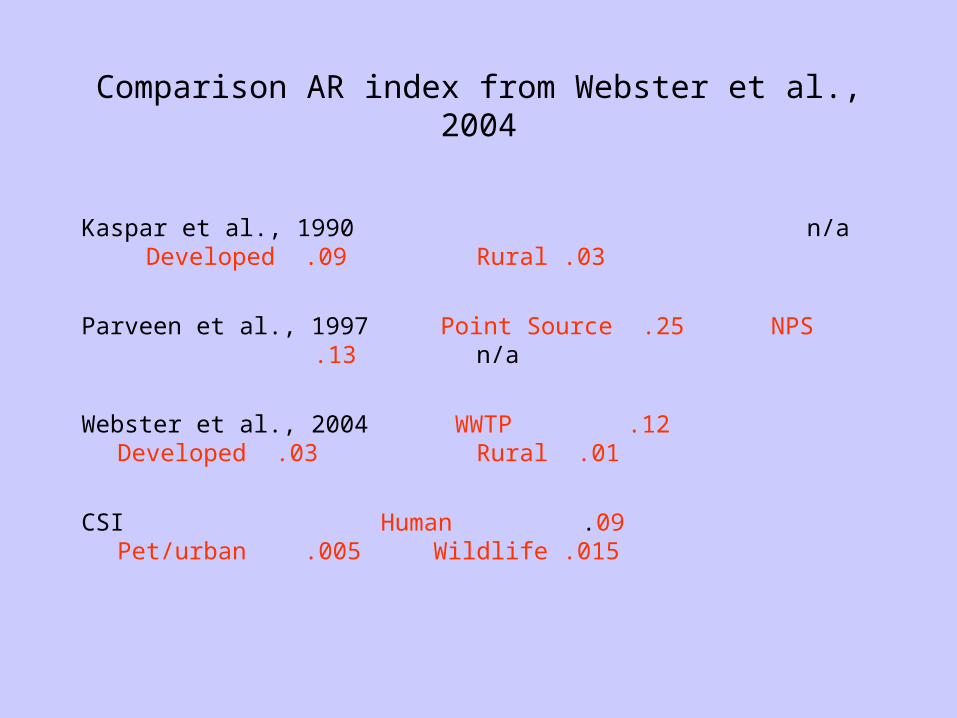
Comparison AR index from Webster et al., 2004
Kaspar et al., 1990 n/a Developed .09 Rural .03
Parveen et al., 1997 Point Source .25 NPS .13 n/a
Webster et al., 2004 WWTP .12 Developed .03 Rural .01
CSI Human .09 Pet/urban .005 Wildlife .015
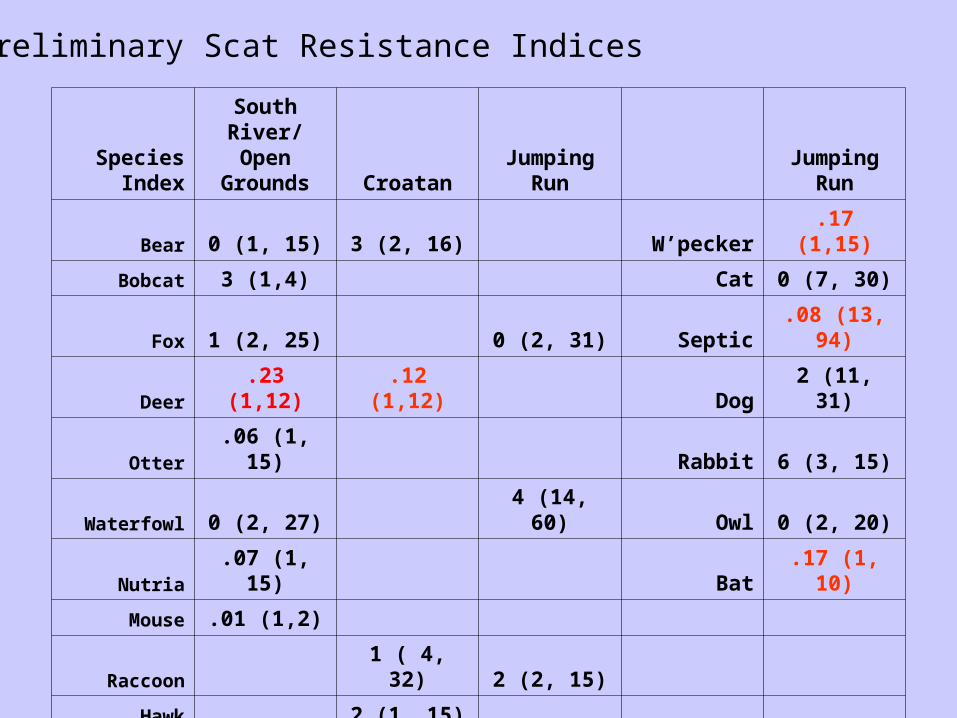
Species Index
South River/ Open
Grounds CroatanJumping
RunJumping
Run
Bear 0 (1, 15) 3 (2, 16) W’pecker .17 (1,15)
Bobcat 3 (1,4) Cat 0 (7, 30)
Fox 1 (2, 25) 0 (2, 31) Septic .08 (13, 94)
Deer .23 (1,12) .12 (1,12) Dog 2 (11, 31)
Otter .06 (1, 15) Rabbit 6 (3, 15)
Waterfowl 0 (2, 27) 4 (14, 60) Owl 0 (2, 20)
Nutria .07 (1, 15) Bat .17 (1, 10)
Mouse .01 (1,2)
Raccoon 1 ( 4, 32) 2 (2, 15)
Hawk 2 (1, 15)
Horse .15 (3, 31)
Opossum .14 (4, 21) .30 (4, 15)
Squirrel 0 (3,15)
Preliminary Scat Resistance Indices
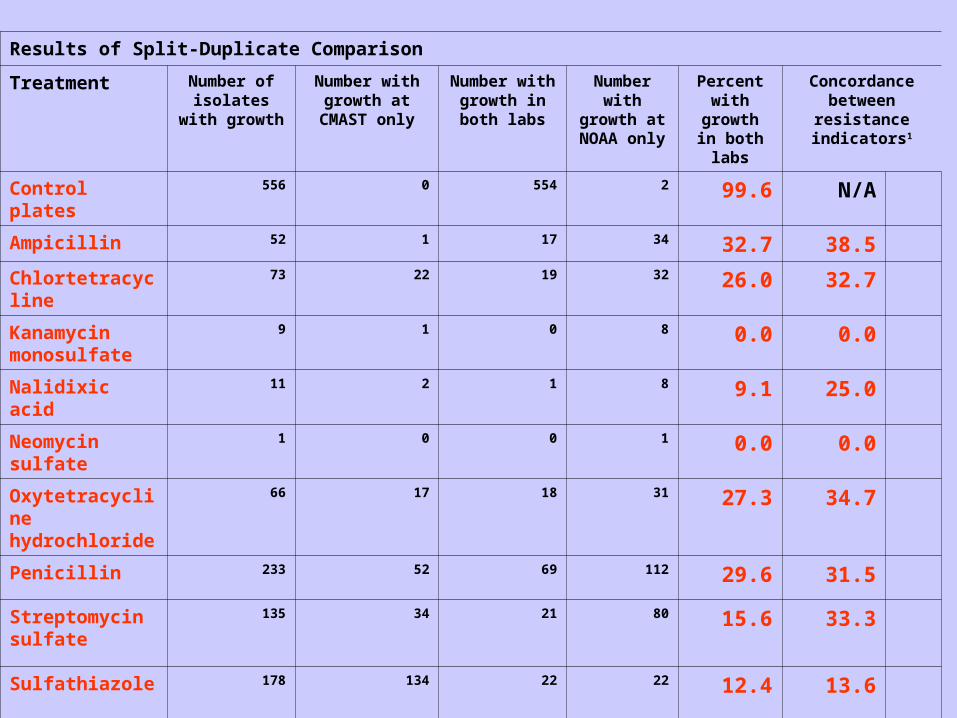
Results of Split-Duplicate Comparison
Treatment Number of isolates with
growth
Number with growth at
CMAST only
Number with growth in both
labs
Number with growth at
NOAA only
Percent with growth in both labs
Concordance between resistance
indicators1
Control plates 556 0 554 2 99.6 N/A
Ampicillin 52 1 17 34 32.7 38.5
Chlortetracycline 73 22 19 32 26.0 32.7
Kanamycin monosulfate
9 1 0 8 0.0 0.0
Nalidixic acid 11 2 1 8 9.1 25.0
Neomycin sulfate 1 0 0 1 0.0 0.0
Oxytetracycline hydrochloride
66 17 18 31 27.3 34.7
Penicillin 233 52 69 112 29.6 31.5
Streptomycin sulfate
135 34 21 80 15.6 33.3
Sulfathiazole 178 134 22 22 12.4 13.6
Tetracycline hydrochloride
64 16 17 31 26.7 32.7
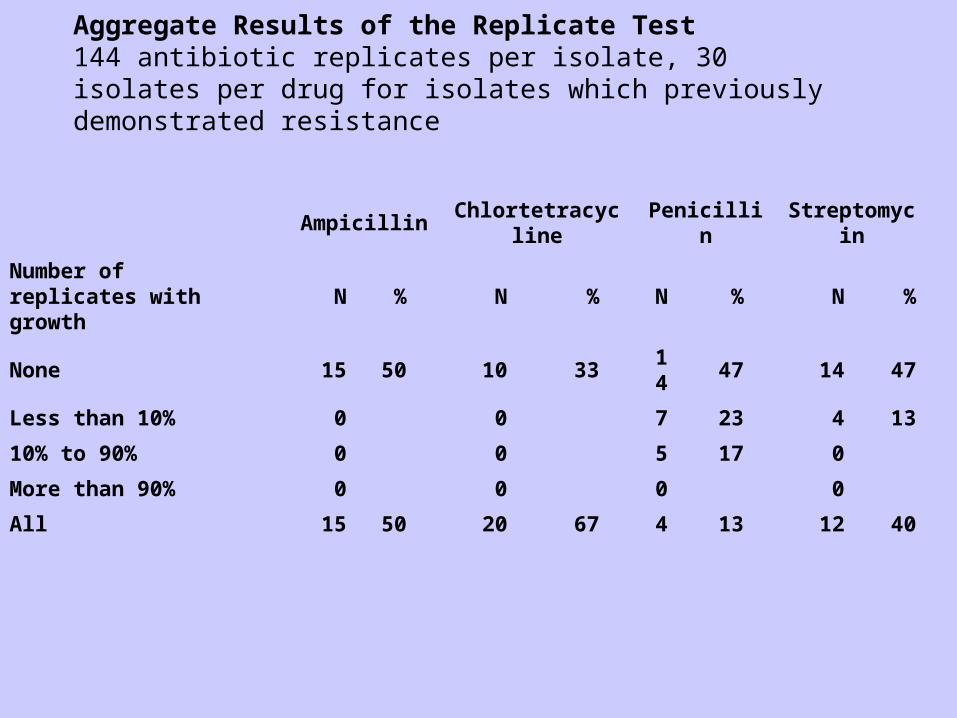
Aggregate Results of the Replicate Test144 antibiotic replicates per isolate, 30 isolates per drug for isolates which previously demonstrated resistance
Ampicillin Chlortetracycline Penicillin Streptomycin
Number of replicates with growth
N % N % N % N %
None 15 50 10 33 14 47 14 47
Less than 10% 0 0 7 23 4 13
10% to 90% 0 0 5 17 0
More than 90% 0 0 0 0
All 15 50 20 67 4 13 12 40
Summary
• High levels of bacterial loading is occurring in all land use types—loads at baseflow would still violate both recreational and shellfish water quality standards.
• ARA results for both the index and split-duplicate results indicate unreliability in the response patterns for e coli calling into question is usefulness as a environmental source tracking method. Are the cells derived from the sediments, possibly being “old”?
• Good example of situation where waters are impaired (TMDL), but is the source and transport vector? What management action should be taken? Of note is that flow volume which triggers runoff, Croatan National Forest requires more than 2-3” of rain to generate enough runoff to generate stream flow. Just reducing the volume of storm event flow would provide some relief, but how much?
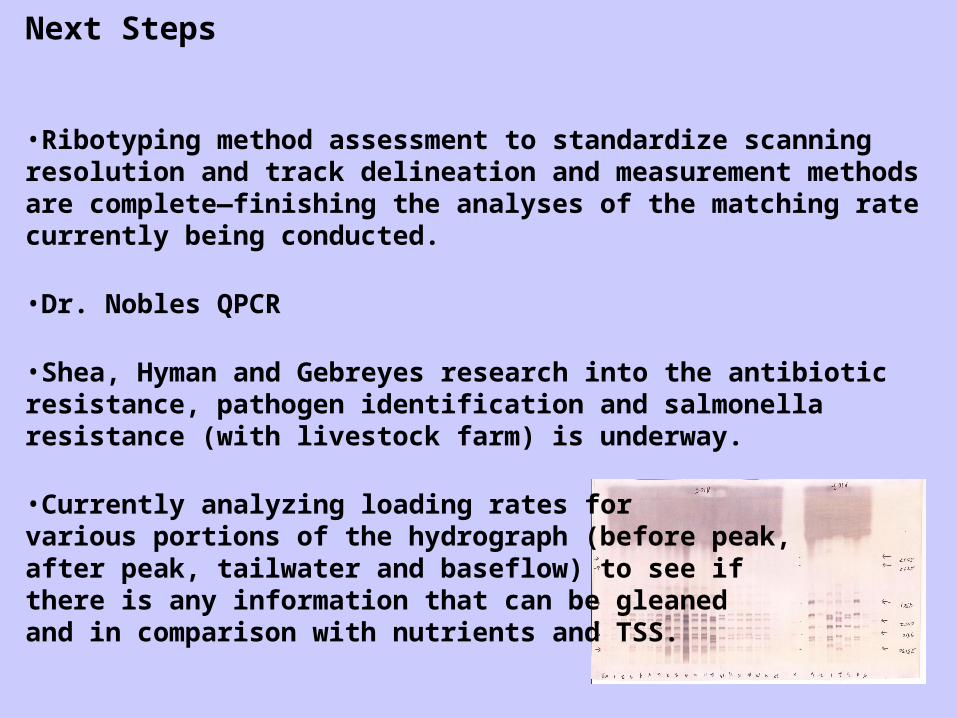
Next Steps
•Ribotyping method assessment to standardize scanning resolution and track delineation and measurement methods are complete—finishing the analyses of the matching rate currently being conducted.
•Dr. Nobles QPCR
•Shea, Hyman and Gebreyes research into the antibiotic resistance, pathogen identification and salmonella resistance (with livestock farm) is underway.
•Currently analyzing loading rates for various portions of the hydrograph (before peak, after peak, tailwater and baseflow) to see if there is any information that can be gleaned and in comparison with nutrients and TSS.