Embed Size (px)
Citation preview

Waterloo South Renewal
1
March 2020
Waterloo South
Final Report
Population and Demographic Study
Waterloo South Renewal
2
Table of contents
1. Executive summary ....................................................................................................... 4
2. Introduction .................................................................................................................... 9
2.1 Introduction ....................................................................................................................... 9
2.2 Waterloo Estate ............................................................................................................... 10
2.3 Waterloo South ................................................................................................................ 12
2.4 Renewal Vision ................................................................................................................ 14
2.5 Purpose of this report ...................................................................................................... 16
2.6 Waterloo South planning proposal ................................................................................. 17
3. Baseline analysis - Strategic context for the Waterloo Precinct ................................. 20
3.1 Introduction ..................................................................................................................... 20
3.2 Strategic context .............................................................................................................. 20
3.3 Social drivers ................................................................................................................... 21
3.4 Economic drivers ............................................................................................................. 25
3.5 Drives for renewal ........................................................................................................... 27
3.6 Precinct profile ................................................................................................................. 29
3.7 Case study benchmarks .................................................................................................. 57
3.8 How does the precinct compare? ................................................................................... 77
3.9 Employment benchmarks ................................................................................................ 82
3.10 Forecasts without the planning proposal ........................................................................ 93
3.11 Population and households ............................................................................................. 93
3.12 Employment .................................................................................................................... 97
4. Waterloo South Forecasts ........................................................................................... 99
4.1 Study area definition ....................................................................................................... 99
4.2 Population and housing forecasts ................................................................................... 99
4.3 Employment projections ............................................................................................... 109
5. Conclusion .................................................................................................................. 113
6. Appendix .................................................................................................................... 114
6.1 Terminology .................................................................................................................. 114

Waterloo South Renewal
3
6.2 Geographic areas used in this report ............................................................................ 115
6.3 Other definitions ............................................................................................................ 116

Waterloo South Renewal
4
1. Executive summary
Introduction
.id was commissioned by Department of Planning, Industry and Environment to undertake a
demographic and employment analysis of Waterloo South. This report provides a profile of the
Waterloo Precinct today and then presents forecast growth of Waterloo South.
Geographic definitions
The demographic and economic profile presented in this report is based on the Waterloo Precinct
area. The demographic profile of the Waterloo Precinct presented in Section 3 is based on the
following SA1’s: – 1133801, 1133802, 1133804, 1133806, 1133838, 1133839, 1133841. The
economic and employment profile is defined as the DZN 113381369 (ABS) and TZ 270 (NSW BTS).
SA1’s were not used for the economic analysis as Census data for Place of Work is not available at
this level.
The forecasts presented in Section 4 refer to the refer to the Waterloo South only (highlighted by the
blue boundary in the map below).
Demographic assessment –
Waterloo Precinct
Economic assessment –
Waterloo Precinct
Forecasts – Waterloo
South
Waterloo South (forecast area)

Waterloo South Renewal
5
Strategic context
• Greater Sydney and the City of Sydney LGA (Cos) have experienced substantial population growth over the last decade, well above the national rate.
• Inner city locations are experiencing a resurgence, as young workers and some downsizing retirees seek greater access to employment and essential services.
• Population growth is driving large increases in property values. Both the median property price and median rent in CoS have more than doubled in the last ten years. This trend highlights the need for housing diversity and affordable housing.
• CoS is the largest employment agglomeration in NSW by far and its influence has increased over time. In 2011, it supported 15% of the employment. However, in the last five years, it generated 38% of the employment growth.
• This jobs growth is increasing the divergence between where people work compared to where they live in Sydney. CoS has a substantial ‘Jobs Surplus’.
• Driving this growth is an increase in jobs requiring more cognitive and non-routine skills that often necessitate higher qualified employees. These jobs are often concentrated in CBDs and other major employment nodes.
• Knowledge-based industries generate a large amount of these jobs and gain productivity benefits from agglomeration and access to deep labour pools.
• High-density development around major transport nodes can support access to labour for businesses and jobs for residents.
• The share of Social Housing has also declined in the Sydney LGA from 8.6% in 2011 to 8.0% in 2016. This highlights the need to maintain or improve the level of Social Housing available in the Sydney LGA.
• The Waterloo SSP area is planned to generate a substantial increase in residents in an area that has strong accessibility to education and employment opportunities, as well as being close to a major transport node.
Precinct profile today
• The resident population in Waterloo Precinct is much older than the profile for the broader CoS.
• The area is very multicultural with a high population of elderly Eastern European immigrants (Ukraine and Russia). There is an emerging Chinese population.
• There is a much higher share of Indigenous people amongst the resident population than the rest of CoS
• Education attainment is very low with just over 50% of persons aged 15 or more having completed Year 12 or equivalent.
• The Precinct is highly disadvantaged with all SA1s falling within the most disadvantaged 10% of small areas in NSW and Australia.
• The predominate dwelling stock is high-density social housing, largely occupied by lone person households. Just over three-quarters of dwellings are rented from a State or Territory Housing Authority.
• Participation in the labour force was very low (34%), less than half the CoS rate and the unemployment rate was 18.4% in 2016, three times that experienced in the CoS (6.0%).
• The main industries of employment for working residents are Professional, Scientific and Technical Services, Health Care and Social Assistance, and Accommodation and Food Services.
• Most residents work within the CoS. However, unlike other CoS residents, car and train are the most common methods of travel to work, not active methods (walking, cycling).
• The largest employing industries in the Precinct in 2016 were Manufacturing, Retail Trade, and Professional Services.

Waterloo South Renewal
6
• The main occupations were Professionals and Managers. However, physical based occupations were over-represented compared to the Greater Sydney average.
Case study benchmarks
Redfern Estate represents what Waterloo might resemble without market led redevelopment,
maintaining the existing majority social housing supply. Many residents would age in place, lone
person households would become even more dominant and household income levels would be
lower.
With market led redevelopment several outcomes could occur:
• If the redevelopment supported a predominately young employed resident base attracted to the area’s proximity to high value knowledge jobs, it might resemble Pyrmont or Mascot’s demographic profile.
• Zetland displays what could occur if the development attracted a profile that was a closer match to the CoS average.
• If the Precinct development incorporated a significant portion of student housing due to its proximity to education facilities, it might more closely resemble Ultimo.
• Kings Cross/Potts Point represents the demographic profile that could occur if the development supported a more mixed age and income demographic base.
It is likely that the result would be a combination of benchmark areas due to the existing social
housing role and likely attraction of younger workers and/or students.
Assessment of the Proposal: Waterloo South
Our report presents the population and employment projections for Waterloo South. We have relied
on the demographic and economic analysis and applied this to the revised land use assumptions for
Waterloo South.
Population and household forecasts – Waterloo South
Our forecasts are developed using .id’s forecasting model that incorporates our detailed
understanding of the drivers of demographic change as well as specific input provided by project
stakeholders. Please note, these forecasts are based on key assumptions provided by Land and
Housing Corporation. Changes to these assumptions would result in different forecast results.

Waterloo South Renewal
7
The key findings of our forecasts are:
• The forecasts for Waterloo South see an increase in population from 1,719 in 2016 to 5,542 in 2036.
• This forecast is based on an increase of 2,300 dwellings in net terms between 2023 and 2032.
• Average household size is expected to increase from 1.78 in 2016 to 1.86 in 2036. This is a result of the assumed migration of both younger adult age groups, primarily to the private dwellings, as well as a broader range of older ages to the affordable and social housing component.
• The area is expected to attract younger adult age groups, primarily to the private dwellings, driven by fast access to CBD jobs in finance, banking and professional services, as well as a broader range of older ages to the affordable and social housing component.
• The largest forecast increases by age are in the 25-39 age bracket
Employment forecasts – Waterloo South
The method used to forecast future employment at Waterloo South is based on estimated
employment densities and the proposed land use mix presented in the Waterloo South metrics. The
timing of employment is based on the population forecasts for the precinct. This method involves:
• Estimating work-space ratios (i.e. sqm per job) based on analysis of the City of Sydney Census of Land Use and Employment data.
• Applying work-space ratios to estimated land use mix – retail and non-retail space.
• Estimating the number of residents who would work from home (e.g. home based business)
Based on our analysis, employment in Waterloo South is projected to grow from 350 jobs in 2016 to
around 760 in 2041. There will be a period of decline during the construction phase of the project
but then grow in line with the timing and staging of the retail and non-retail uses.
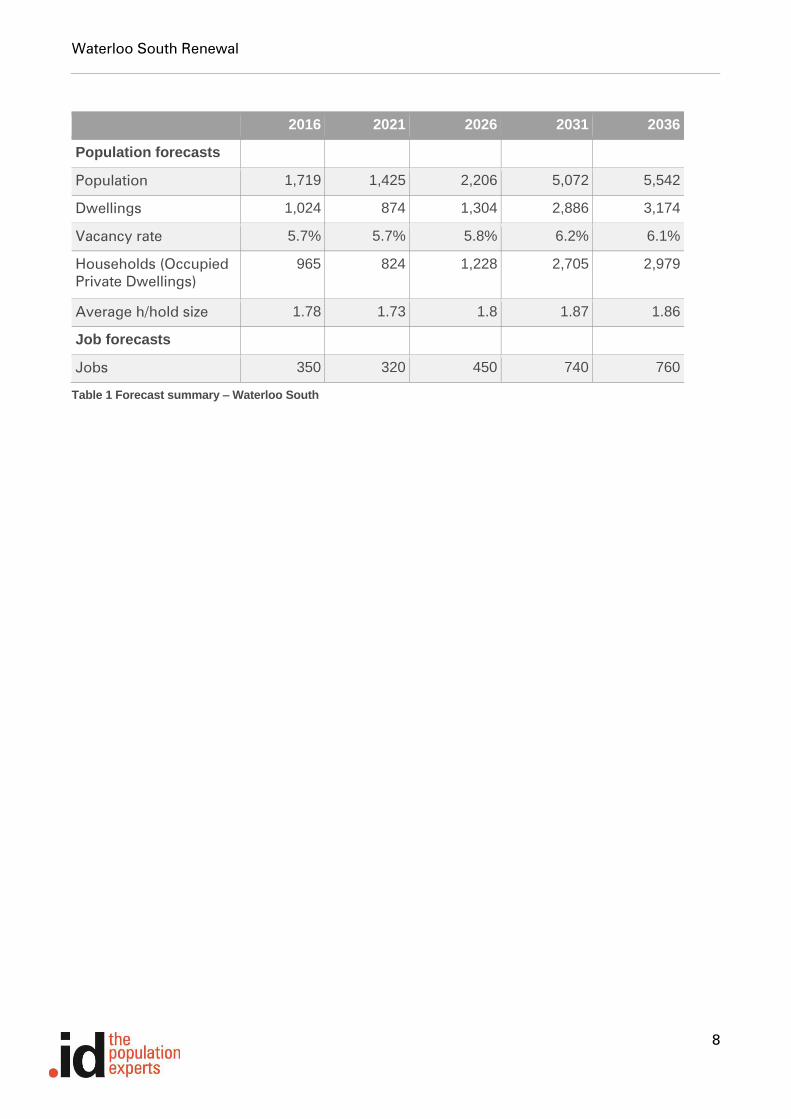
Forecast summary – Waterloo South
The table on the next page summarises the key forecast for Waterloo South. Please refer to
individual sections for more details. The existing households are based upon the existing social
housing and existing market housing currently on the site with an assumption for vacancy based on
analysis within the report.
Waterloo South Renewal
8
2016 2021 2026 2031 2036
Population forecasts
Population 1,719 1,425 2,206 5,072 5,542
Dwellings 1,024 874 1,304 2,886 3,174
Vacancy rate 5.7% 5.7% 5.8% 6.2% 6.1%
Households (Occupied
Private Dwellings)
965 824 1,228 2,705 2,979
Average h/hold size 1.78 1.73 1.8 1.87 1.86
Job forecasts
Jobs 350 320 450 740 760
Table 1 Forecast summary – Waterloo South

Waterloo South Renewal
9
2. Introduction
2.1 Introduction
The Greater Sydney Region Plan and Eastern City District Plan seek to align growth with
infrastructure, including transport, social and green infrastructure. With the catalyst of Waterloo
Metro Station, there is an opportunity to deliver urban renewal to Waterloo Estate that will
create great spaces and places for people to live, work and visit.
The proposed rezoning of Waterloo Estate is to be staged over the next 20 years to enable a
coordinated renewal approach that minimises disruption for existing tenants and allows for the
up-front delivery of key public domain elements such as public open space. Aligned to this
staged approach, Waterloo Estate comprises three separate, but adjoining and inter-related
stages:
• Waterloo South;
• Waterloo Central; and
• Waterloo North.
Waterloo South has been identified as the first stage for renewal. The lower number and density
social housing dwellings spread over a relatively large area, makes Waterloo South ideal as a
first sub-precinct, as new housing can be provided with the least disruption for existing tenants
and early delivery of key public domain elements, such as public open space.
A planning proposal for Waterloo South is being led by NSW Land and Housing Corporation
(LAHC). This will set out the strategic justification for the proposal and provide an assessment of
the relevant strategic plans, state environmental planning policies, ministerial directions and the
environmental, social and economic impacts of the proposed amendment. The outcome of this
planning proposal will be a revised planning framework that will enable future development
applications for the redevelopment of Waterloo South. The proposed planning framework that is
subject of this planning proposal, includes:
• Amendments to the Sydney Local Environmental Plan 2012 – This will include
amendments to the zoning and development standards (i.e. maximum building heights
and floor space ratio) applied to Waterloo South. Precinct-specific local provisions may
also be included.
Waterloo South Renewal
10
• A Development Control Plan (DCP) – This will be a new part inserted into ‘Section 5:
Specific Areas’ of the Sydney DCP 2012 and include detailed controls to inform future
development of Waterloo South.
• An infrastructure framework – in depth needs analysis of the infrastructure required to
service the needs of the future community including open space, community facilities
and servicing infrastructure.
2.2 Waterloo Estate
Waterloo Estate is located approximately 3.3km south-south-west of the Sydney CBD in the
suburb of Waterloo (refer to Figure 1). It is located entirely within the City of Sydney local
government area (LGA). Waterloo Estate is situated approximately 0.6km from Redfern train
station and 0.5km from Australia Technology Park. The precinct adjoins the new Waterloo Metro
Station, scheduled to open in 2024. The Waterloo Metro Quarter adjoins Waterloo Estate and
includes the station and over station development, and was rezoned in 2019. Waterloo Estate
comprises land bounded by Cope, Phillip, Pitt and McEvoy Street, including an additional area
bounded by Wellington, Gibson, Kellick and Pitt Streets. It has an approximate gross site area of
18.98 hectares (14.4 hectares excluding roads). Waterloo Estate currently comprises 2,012
social housing dwellings owned by LAHC, 125 private dwellings, a small group of shops and
community uses on the corner of Wellington and George Streets, and commercial properties on
the south-east corner of Cope and Wellington Streets.
A map of Waterloo Estate and relevant boundaries is illustrated in Figure 2.

Waterloo South Renewal
11
Figure 1 Location plan of Waterloo Estate and Waterloo South
Source: Turner Studio
Waterloo South Renewal
12
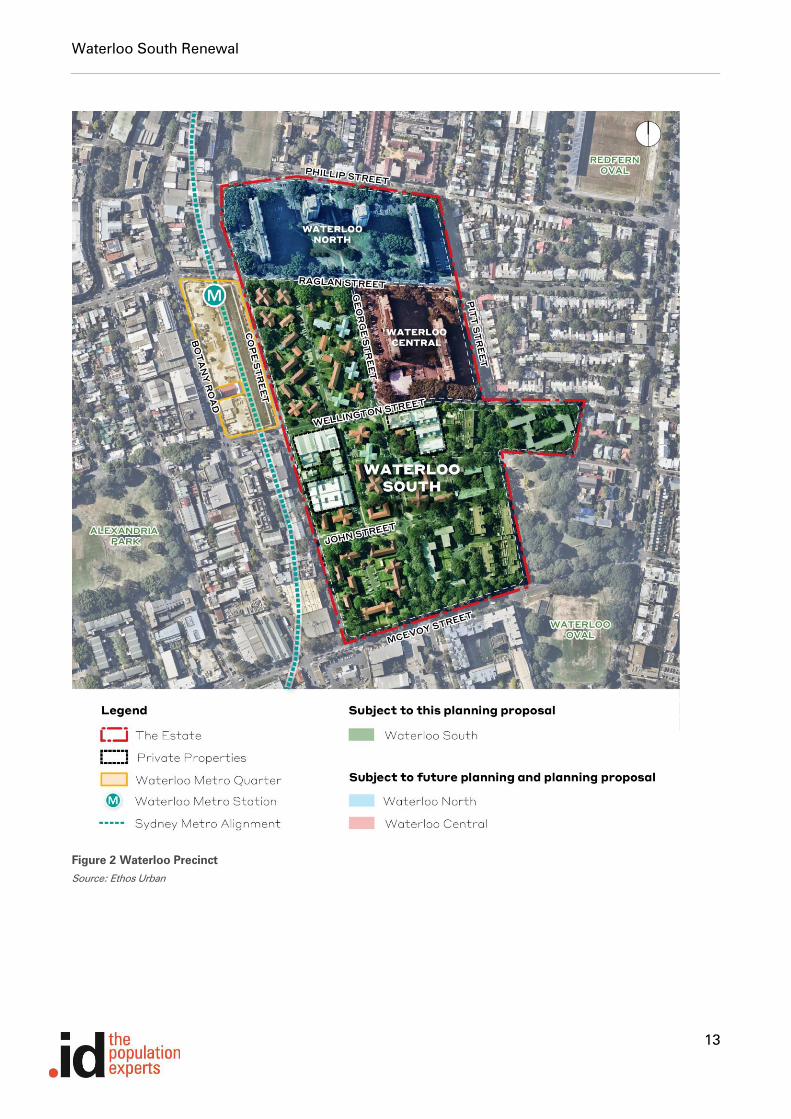
2.3 Waterloo South
Waterloo South includes land bounded by Cope, Raglan, George, Wellington, Gibson, Kellick,
Pitt and McEvoy Streets, and has an approximate gross site area of 12.32 hectares
(approximately 65% of the total Estate).
Waterloo South currently comprises 749 social housing dwellings owned by LAHC, 125 private
dwellings, and commercial properties on the south-east corner of Cope and Wellington Streets.
Existing social housing within Waterloo South is predominantly walk up flat buildings
constructed in the 1950s and ‘60s, and mid-rise residential flat buildings (Drysdale, Dobell & 76
Wellington Street) constructed in the 1980s. Listed Heritage Items within Waterloo South
include the Duke of Wellington Hotel, Electricity Substation 174 on the corner of George and
McEvoy Streets, the terrace houses at 229-231 Cope Street and the Former Waterloo Pre-School
at 225-227 Cope Street. The State Heritage listed ‘Potts Hill to Waterloo Pressure Tunnel and
Shafts’ passes underneath the precinct.
A map of Waterloo South and relevant boundaries is illustrated in Figure 2.
Waterloo South Renewal
13
Figure 2 Waterloo Precinct
Source: Ethos Urban
Waterloo South Renewal
14
2.4 Renewal Vision
The transition of Waterloo Estate will occur over a 20-year timeframe, replacing and providing fit
for purpose social (affordable rental) housing as well as private housing to create a new integrated
and inclusive mixed-tenure community. This aligns with Future Directions for Social Housing in
NSW – the NSW Government’s vision for social housing. It also aligns with LAHC’s Communities
Plus program, which is tasked with achieving three key objectives:
1. Provide more social housing
2. Provide a better social housing experience
3. Provide more opportunities and support for social housing tenants
The following is LAHC’s Redevelopment Vision for Waterloo Estate, which was derived from
extensive consultation and technical studies:

Waterloo South Renewal
15
Source: Let’s Talk Waterloo: Waterloo Redevelopment (Elton Consulting, 2019)
Culture and Heritage
• Recognise and celebrate the significance of Waterloo’s Aboriginal history and heritage across the built and
natural environments.
• Make Waterloo an affordable place for more Aboriginal people to live and work.
• Foster connection to culture by supporting authentic storytelling and recognition of artistic, cultural and sporting
achievements.
Communal and Open Space
• Create high quality, accessible and safe open spaces that connect people to nature and cater to different needs,
purposes and age groups.
• Create open spaces that bring people together and contribute to community cohesion and wellbeing.
Movement and Connectivity
• Make public transport, walking and cycling the preferred choice with accessible, reliable and safe connections and
amenities.
• Make Waterloo a desired destination with the new Waterloo Station at the heart of the Precinct’s transport network
– serving as the gateway to a welcoming, safe and active community.
Character of Waterloo
• Strengthen the diversity, inclusiveness and community spirit of Waterloo.
• Reflect the current character of Waterloo in the new built environment by mixing old and new.
Local Employment Opportunities
• Encourage a broad mix of businesses and social enterprise in the area that provides choice for residents and
creates local job opportunities.
Community Services, Including Support for Those Who Are Vulnerable
• Ensure that social and human services support an increased population and meet the diverse needs of the
community, including the most vulnerable residents.
• Provide flexible communal spaces to support cultural events, festivals and activities that strengthen community
spirit.
Accessible Services
• Deliver improved and affordable services that support the everyday needs of the community, such as health
and wellbeing, grocery and retail options.
Design Excellence
• Ensure architectural design excellence so that buildings and surrounds reflect community diversity, are environmentally sustainable & people friendly – contributing to lively, attractive and safe neighbourhoods.
• Recognise and celebrate Waterloo’s history and culture in the built environment through artistic and creative expression.
• Create an integrated, inclusive community where existing residents and newcomers feel welcome, through a thoughtfully designed mix of private, and social (affordable rental) housing.
Waterloo South Renewal
16
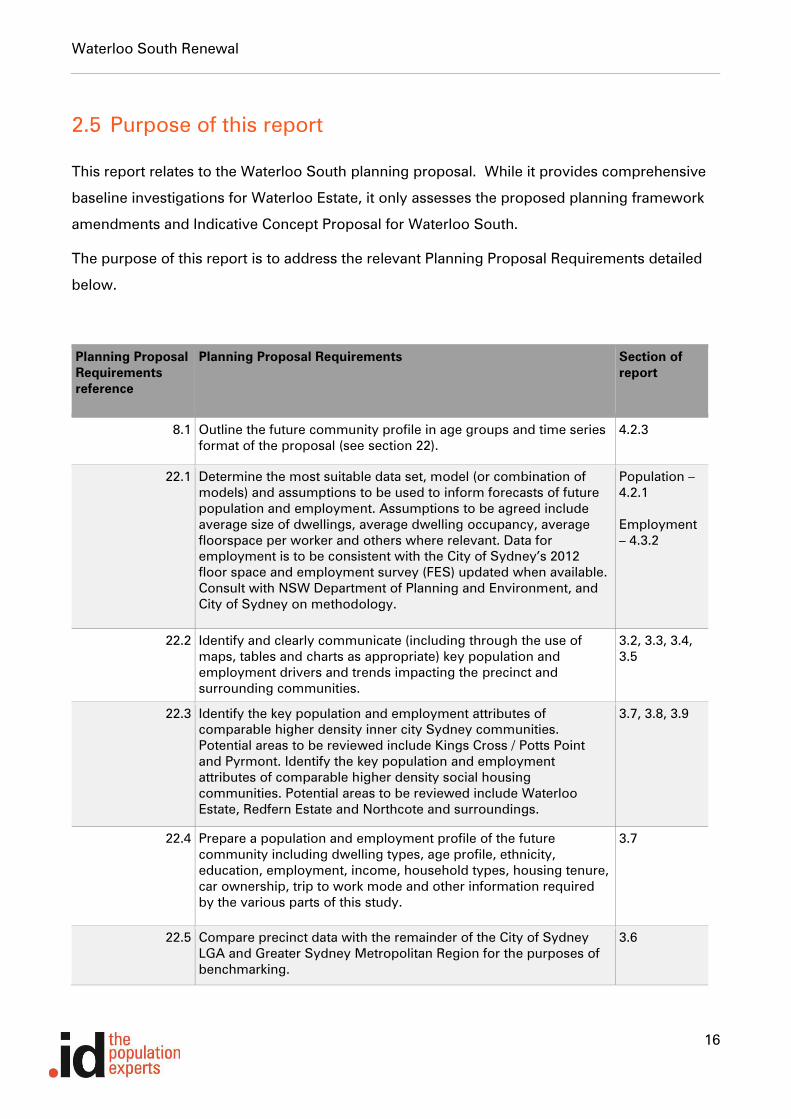
2.5 Purpose of this report
This report relates to the Waterloo South planning proposal. While it provides comprehensive
baseline investigations for Waterloo Estate, it only assesses the proposed planning framework
amendments and Indicative Concept Proposal for Waterloo South.
The purpose of this report is to address the relevant Planning Proposal Requirements detailed
below.
Planning Proposal Requirements reference
Planning Proposal Requirements Section of report
8.1 Outline the future community profile in age groups and time series
format of the proposal (see section 22).
4.2.3
22.1 Determine the most suitable data set, model (or combination of
models) and assumptions to be used to inform forecasts of future
population and employment. Assumptions to be agreed include
average size of dwellings, average dwelling occupancy, average
floorspace per worker and others where relevant. Data for
employment is to be consistent with the City of Sydney’s 2012
floor space and employment survey (FES) updated when available.
Consult with NSW Department of Planning and Environment, and
City of Sydney on methodology.
Population –
4.2.1
Employment
– 4.3.2
22.2 Identify and clearly communicate (including through the use of
maps, tables and charts as appropriate) key population and
employment drivers and trends impacting the precinct and
surrounding communities.
3.2, 3.3, 3.4,
3.5
22.3 Identify the key population and employment attributes of
comparable higher density inner city Sydney communities.
Potential areas to be reviewed include Kings Cross / Potts Point
and Pyrmont. Identify the key population and employment
attributes of comparable higher density social housing
communities. Potential areas to be reviewed include Waterloo
Estate, Redfern Estate and Northcote and surroundings.
3.7, 3.8, 3.9
22.4 Prepare a population and employment profile of the future
community including dwelling types, age profile, ethnicity,
education, employment, income, household types, housing tenure,
car ownership, trip to work mode and other information required
by the various parts of this study.
3.7
22.5 Compare precinct data with the remainder of the City of Sydney
LGA and Greater Sydney Metropolitan Region for the purposes of
benchmarking.
3.6

Waterloo South Renewal
17
Planning Proposal Requirements reference
Planning Proposal Requirements Section of report
22.6 Prepare time series (5 year increments) population and
employment profiles of the precinct and surrounding community
(including dwelling and job yields) based on existing development
capacity, without the Planning Proposal.
3.10
22.7 Prepare time series (5 year increments) population and
employment forecasts of the precinct and surrounding community
(including dwelling and job yields) based on strategic modelling,
with the Planning Proposal. Reference dwelling yields for the
precinct will be provided for the precinct.
Population –
4.2
Employment
– 4.3
22.8 Update data as the 2016 census results become available All
2.6 Waterloo South planning proposal
The planning proposal will establish new land use planning controls for Waterloo South,
including zoning and development standards to be included in Sydney LEP 2012, a new section
in Part 5 of DCP 2012, and an infrastructure framework. Turner Studio and Turf has prepared an
Urban Design and Public Domain Study which establishes an Indicative Concept Proposal
presenting an indicative renewal outcome for Waterloo South. The Urban Design and Public
Domain Study provides a comprehensive urban design vision and strategy to guide future
development of Waterloo South and has informed the proposed planning framework. The
Indicative Concept Proposal has also been used as the basis for testing, understanding and
communicating the potential development outcomes of the proposed planning framework.
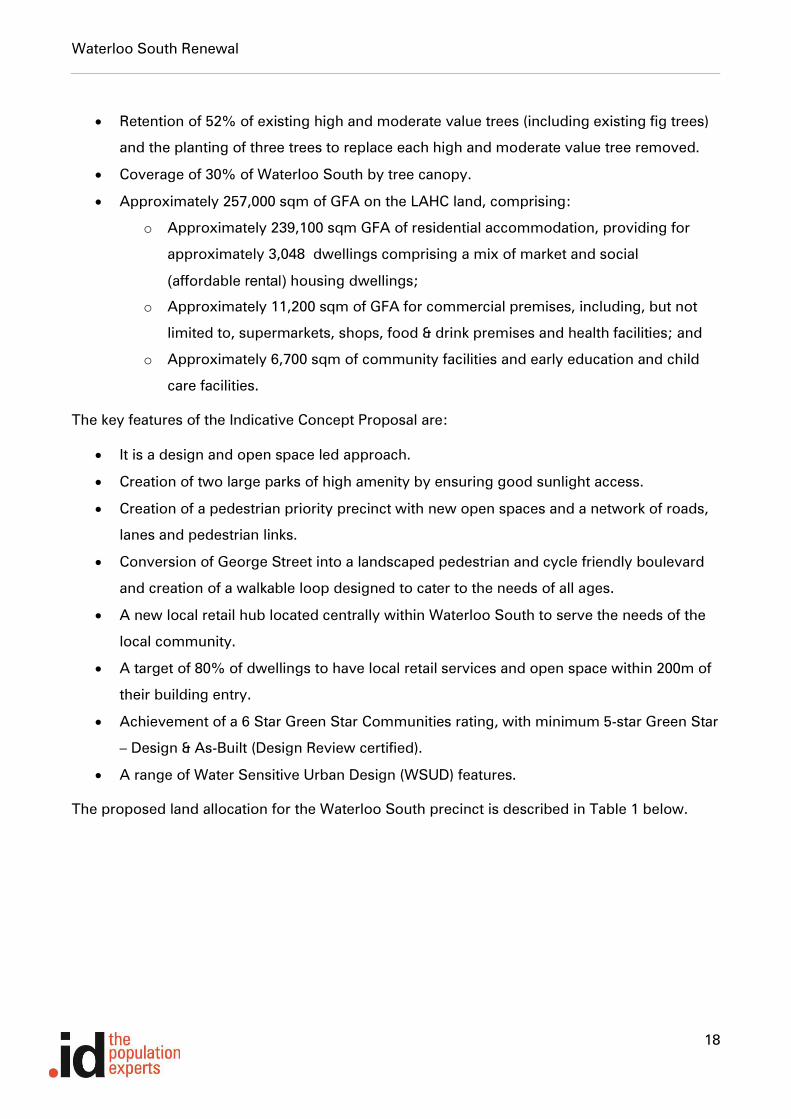
The Indicative Concept Proposal comprises:
• Approximately 2.57 hectares of public open space representing 17.8% of the total Estate (Gross Estate area - existing roads)proposed to be dedicated to the City of Sydney Council, comprising:
o Village Green – a 2.25 hectare park located next to the Waterloo Metro Station;
and
o Waterloo Common and adjacent – 0.32 hectares located in the heart of the
Waterloo South precinct
o The 2.57 hectares all fall within the Waterloo South Planning Proposal
representing 32.2% of public open space
Waterloo South Renewal
18
• Retention of 52% of existing high and moderate value trees (including existing fig trees)
and the planting of three trees to replace each high and moderate value tree removed.
• Coverage of 30% of Waterloo South by tree canopy.
• Approximately 257,000 sqm of GFA on the LAHC land, comprising:
o Approximately 239,100 sqm GFA of residential accommodation, providing for
approximately 3,048 dwellings comprising a mix of market and social
(affordable rental) housing dwellings;
o Approximately 11,200 sqm of GFA for commercial premises, including, but not
limited to, supermarkets, shops, food & drink premises and health facilities; and
o Approximately 6,700 sqm of community facilities and early education and child
care facilities.
The key features of the Indicative Concept Proposal are:
• It is a design and open space led approach.
• Creation of two large parks of high amenity by ensuring good sunlight access.
• Creation of a pedestrian priority precinct with new open spaces and a network of roads,
lanes and pedestrian links.
• Conversion of George Street into a landscaped pedestrian and cycle friendly boulevard
and creation of a walkable loop designed to cater to the needs of all ages.
• A new local retail hub located centrally within Waterloo South to serve the needs of the
local community.
• A target of 80% of dwellings to have local retail services and open space within 200m of
their building entry.
• Achievement of a 6 Star Green Star Communities rating, with minimum 5-star Green Star
– Design & As-Built (Design Review certified).
• A range of Water Sensitive Urban Design (WSUD) features.
The proposed land allocation for the Waterloo South precinct is described in Table 1 below.
Waterloo South Renewal
19
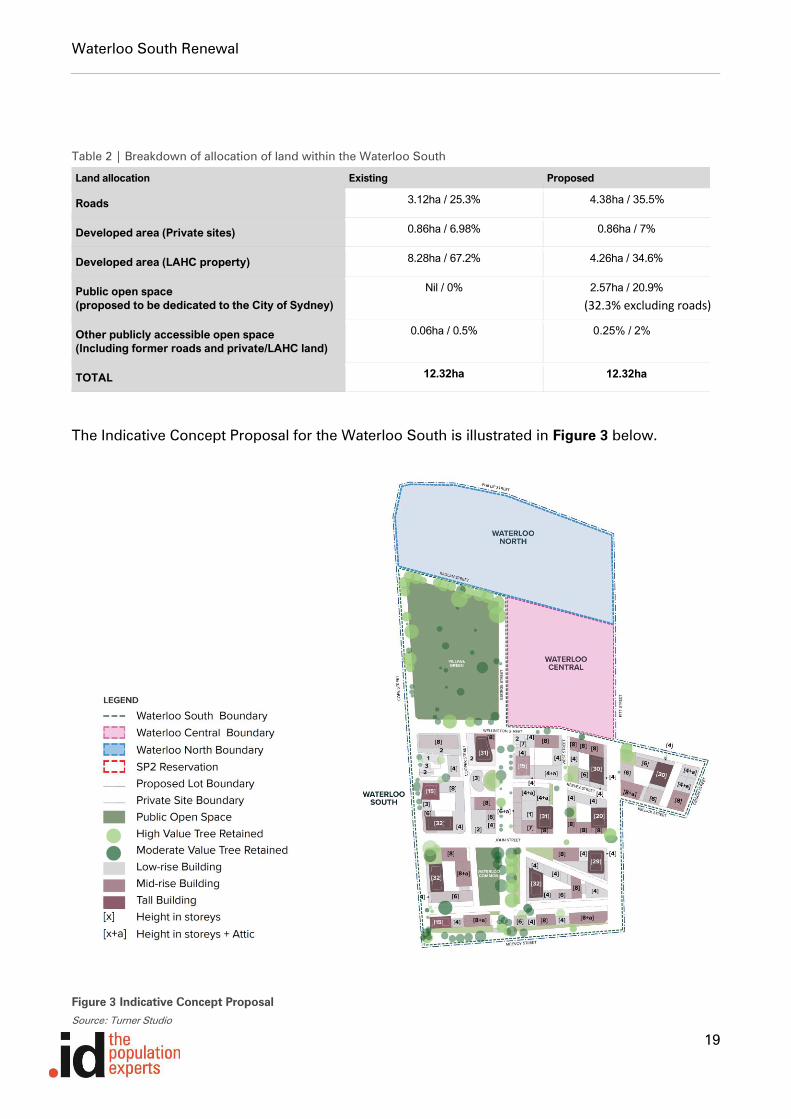
Table 2 | Breakdown of allocation of land within the Waterloo South
Land allocation Existing Proposed
Roads 3.12ha / 25.3% 4.38ha / 35.5%
Developed area (Private sites) 0.86ha / 6.98% 0.86ha / 7%
Developed area (LAHC property) 8.28ha / 67.2% 4.26ha / 34.6%
Public open space
(proposed to be dedicated to the City of Sydney)
Nil / 0% 2.57ha / 20.9%
Other publicly accessible open space
(Including former roads and private/LAHC land)
0.06ha / 0.5% 0.25% / 2%
TOTAL 12.32ha 12.32ha
The Indicative Concept Proposal for the Waterloo South is illustrated in Figure 3 below.
Figure 3 Indicative Concept Proposal
Source: Turner Studio
(32.3% excluding roads)

Waterloo South Renewal
20
3. Baseline analysis - Strategic context for the
Waterloo Precinct
3.1 Introduction
This section presents the findings of .id baseline investigations for the broader Waterloo
Precinct. This section of our report includes the following:
• Strategic context
• Precinct Profile
• Case study / benchmark analysis
3.2 Strategic context
This section provides an overview of some of the main social and economic trends impacting
the Waterloo Precinct. It also highlights some of the strategic drivers for renewal.
Key findings
• Greater Sydney and the City of Sydney LGA (Cos) have experienced substantial
population growth over the last decade, well above the national rate.
• Inner city locations are experiencing a resurgence, as young workers and some
downsizing retirees seek greater access to employment and essential services.
• Population growth is driving large increases in property values. Both the median
property price and median rent in CoS have more than doubled in the last ten years.
This trend highlights the need for housing diversity and affordable housing.
• CoS is the largest employment agglomeration in NSW by far and its influence has
increased over time. In 2011, it supported 15% of the employment. However, in the
last five years, it generated 38% of the employment growth.
• This jobs growth is increasing the divergence between where people work compared
to where they live in Sydney. CoS has a substantial ‘Jobs Surplus’.
• Driving this growth is an increase in jobs requiring more cognitive and non-routine
skills that often necessitate higher qualified employees. These jobs are often
concentrated in CBDs and other major employment nodes.
• Knowledge-based industries generate a large amount of these jobs and gain
productivity benefits from agglomeration and access to deep labour pools.
• High-density development around major transport nodes can support access to labour
for businesses and jobs for residents.
• The share of Social Housing has also declined in the Sydney LGA from 8.6% in 2011 to
8.0% in 2016. This highlights the need to maintain or improve the level of Social
Housing available in the Sydney LGA.
Waterloo South Renewal
21
• The Waterloo Precinct area is planned to generate a substantial increase in residents in
an area that has strong accessibility to education and employment opportunities, as
well as being close to a major transport node.
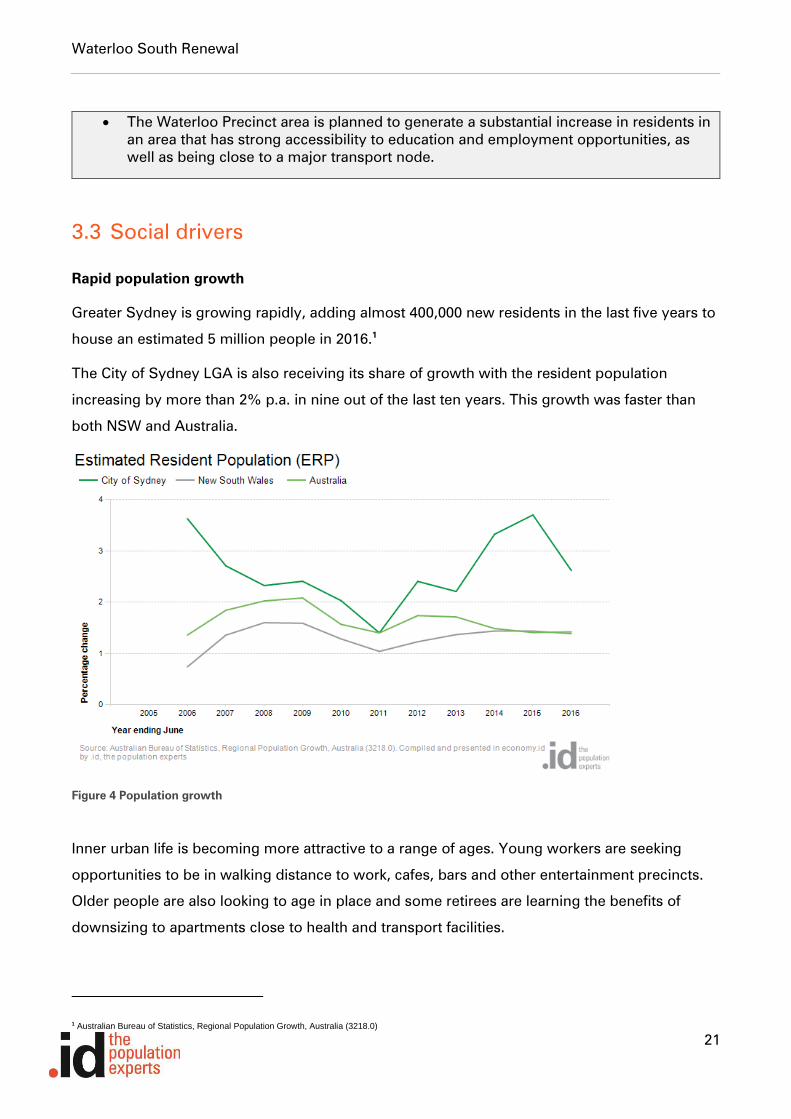
3.3 Social drivers
Rapid population growth
Greater Sydney is growing rapidly, adding almost 400,000 new residents in the last five years to
house an estimated 5 million people in 2016.1
The City of Sydney LGA is also receiving its share of growth with the resident population
increasing by more than 2% p.a. in nine out of the last ten years. This growth was faster than
both NSW and Australia.
Figure 4 Population growth
Inner urban life is becoming more attractive to a range of ages. Young workers are seeking
opportunities to be in walking distance to work, cafes, bars and other entertainment precincts.
Older people are also looking to age in place and some retirees are learning the benefits of
downsizing to apartments close to health and transport facilities.
1 Australian Bureau of Statistics, Regional Population Growth, Australia (3218.0)

Waterloo South Renewal
22
Figure 5 Age profile – City of Sydney
The CoS is very multicultural place with 47.7% of residents born overseas, compared to 36.7%
for Greater Sydney. It is often the first location for new migrants. In 2016, over 40% of overseas
born residents in the LGA had arrived in the last five years. This compares with 20% for Greater
Sydney as a whole.
Figure 6 Overseas arrivals – City of Sydney
Declining affordability
Rising population and an increasing desire from more affluent individuals and families to live
close to inner city Sydney is having an impact on house prices. The median property price
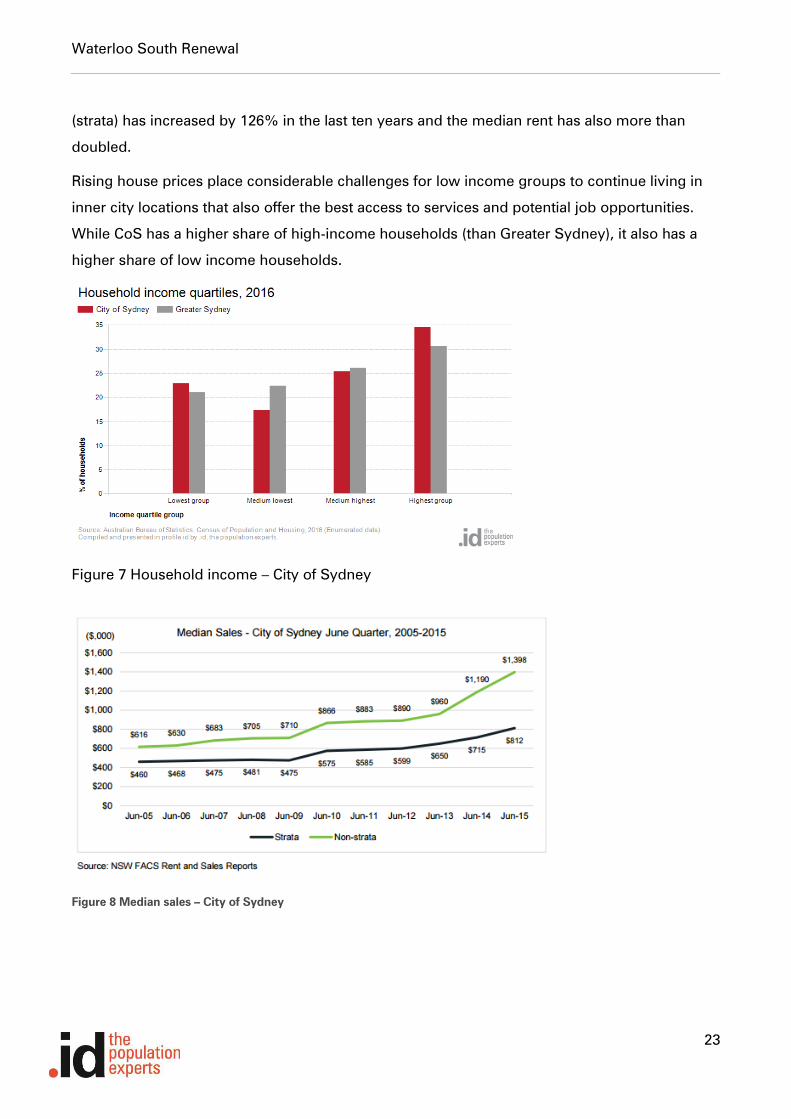
Waterloo South Renewal
23
(strata) has increased by 126% in the last ten years and the median rent has also more than
doubled.
Rising house prices place considerable challenges for low income groups to continue living in
inner city locations that also offer the best access to services and potential job opportunities.
While CoS has a higher share of high-income households (than Greater Sydney), it also has a
higher share of low income households.
Figure 7 Household income – City of Sydney
Figure 8 Median sales – City of Sydney
Waterloo South Renewal
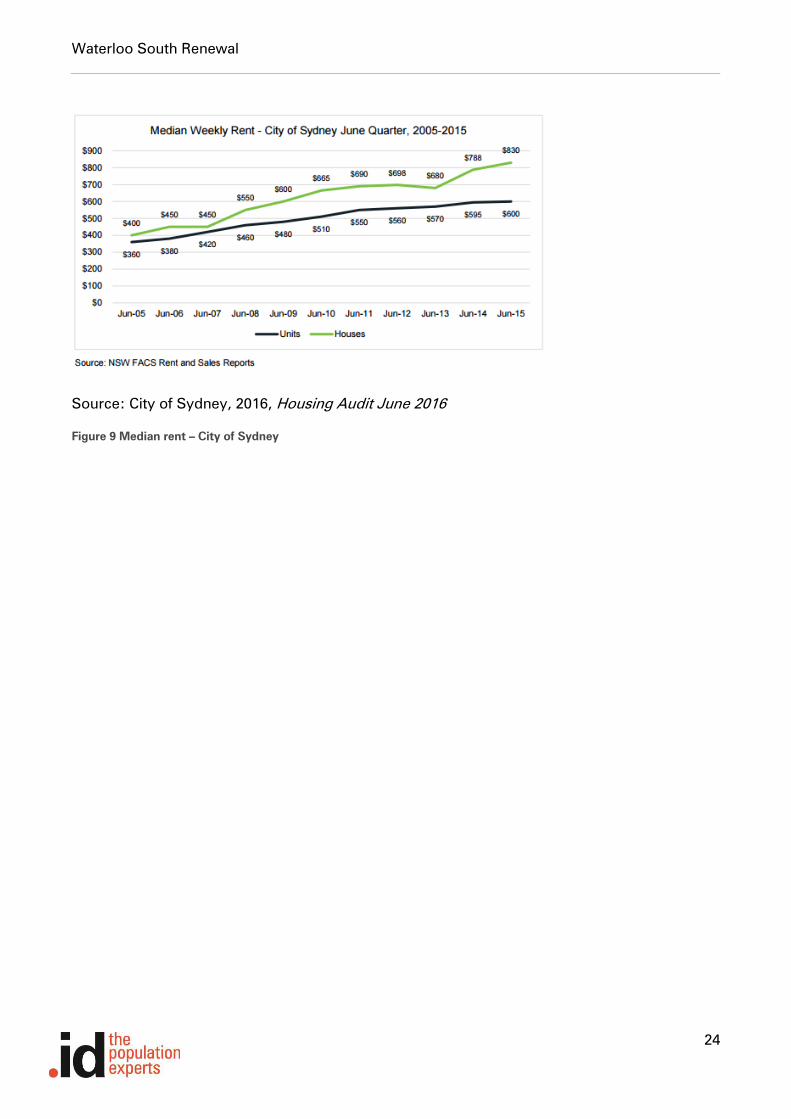
24
Source: City of Sydney, 2016, Housing Audit June 2016
Figure 9 Median rent – City of Sydney
Waterloo South Renewal
25
3.4 Economic drivers
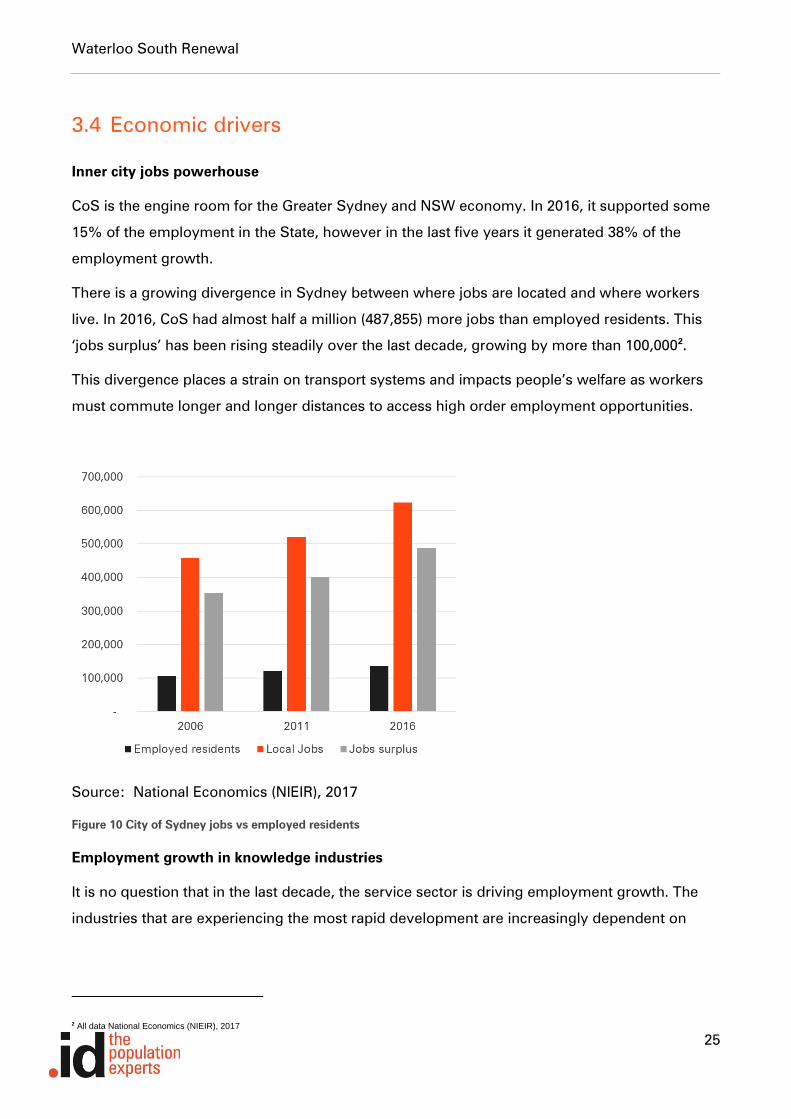
Inner city jobs powerhouse
CoS is the engine room for the Greater Sydney and NSW economy. In 2016, it supported some
15% of the employment in the State, however in the last five years it generated 38% of the
employment growth.
There is a growing divergence in Sydney between where jobs are located and where workers
live. In 2016, CoS had almost half a million (487,855) more jobs than employed residents. This
‘jobs surplus’ has been rising steadily over the last decade, growing by more than 100,0002.
This divergence places a strain on transport systems and impacts people’s welfare as workers
must commute longer and longer distances to access high order employment opportunities.
Source: National Economics (NIEIR), 2017
Figure 10 City of Sydney jobs vs employed residents
Employment growth in knowledge industries
It is no question that in the last decade, the service sector is driving employment growth. The
industries that are experiencing the most rapid development are increasingly dependent on
2 All data National Economics (NIEIR), 2017

Waterloo South Renewal
26
ideas and problem-solving skills. Except for construction, the industries that have contributed
most to growth in the last 15 years have required non-routine and often cognitive skills.
The rewards of the new economy then flow towards those with higher qualifications. In 2019,
those with a degree had higher participation rates, faced lower unemployment and earned far
more.
Figure 11 Industry of Employment by skill type - Australia
Source: 6227.0 - Education and Work, Australia, May 2019
Figure 12 Labour force outcome by level of educational attainment
85%
85%
3.6%
72%
67%
8.3%
0% 10% 20% 30% 40% 50% 60% 70% 80% 90%
Full time
Participation rate
Unemployment
Labour force outcomes by level of educational attainment
Without a non-school qualification With a non-school qualification
Waterloo South Renewal
27
Agglomeration favours service sector industries
Most knowledge-based industries benefit from agglomeration, the co-location or clustering of
firms and deep labour pools. Health care, professional services, finance and insurance, and
administration industries have all been shown to increase labour productivity as job density
increases3.
Transit Orientated Development has been a popular planning concept for some time. The
maximisation of business and residential space around key transport nodes offers residents the
greats access to employment opportunities and businesses access to the widest labour pools.
However, TOD in Australia is often successful at achieving only one outcome, residents or
businesses. ‘Knowledge Oriented Development’ (KOD) where businesses and residents both
benefit from agglomeration of housing and employment co-located along rapid transit hubs is
the next step.
3.5 Drives for renewal
Sydney Metro
Labelled Australia’s biggest public transport project, the Sydney Metro is a new 64km urban
railway line that aims to provide high frequency metro train services in and out of Sydney’s
CBD.
Stage 1 of the project (Northwest) is complete and Stage 2 (City & Southwest) is underway. The
Stage 2 component of the project incorporates a new metro station in Waterloo.
The new metro station at Waterloo aims to support revitalisation of the Waterloo precinct and
support the extension of the CBD. It is planned to connect with:
• bus services along Botany Road and rail services at Redfern Station.
• employment opportunities in the Australian Technology Park.
• expanded development opportunities along the Global Economic Corridor between the
Sydney CBD and Green Square.
Social housing
The NSW Government has a ten-year vision for developing better outcomes for social housing
tenants. Future Directions for Social Housing in NSW4 outlines three strategic priorities:
• More social housing.
3 See SGS, 2012, Productivity and Agglomeration Benefits in Australian Capital Cities 4 NSW Government Family and Community Services Department
Waterloo South Renewal
28
• More opportunities, support and incentives to avoid and/or leave social housing.
• A better social housing experience.
As an area of high social housing tenure, the Waterloo SSP study area is of key focus in the
Government achieving its priorities. The Waterloo redevelopment will provide better quality
housing and more opportunities to access work and necessary services for the local resident
base.
Waterloo South Renewal
29
3.6 Precinct profile
This section provides a representative demographic and employment profile of the Waterloo
Precinct area. The information provided mainly relies on data from the 2016 ABS Census of
Population and Housing. All information refers to the Waterloo Precinct area unless stated
otherwise.
Key findings
• The resident population in Waterloo Precinct is much older than the profile for the broader
CoS.
• The area is very multicultural with a high population of elderly Eastern European
immigrants (Ukraine and Russia). There is an emerging Chinese population.
• There is a much higher share of Indigenous people amongst the resident population than
the rest of CoS
• Education attainment is very low with just over 50% of persons aged 15 or more having
completed Year 12 or equivalent.
• The Precinct is highly disadvantaged with all SA1s falling within the most disadvantaged
10% of small areas in NSW and Australia.
• The predominate dwelling stock is high-density social housing, largely occupied by lone
person households . Just over three-quarters of dwellings are rented from a State or
Territory Housing Authority.
• Participation in the labour force was low (34%), less than half the CoS rate and the
unemployment rate was 18.4% in 2016, three times that experienced in the CoS (6.0%).
• The main industries of employment for working residents are Professional, Scientific and
Technical Services, Health Care and Social Assistance, and Accommodation and Food
Services.
• Most residents work within the CoS. Unlike other CoS residents, car and train are the most
common methods of travel to work, not active methods (walking, cycling).
• The largest employing industries in the Precinct in 2016 were Manufacturing, Retail Trade,
and Professional Services.
• The main occupations were Professionals and Managers. However, physical based
occupations were over-represented compared to the Greater Sydney average.
3.6.1 Geographic definition
The demographic and economic profile presented in this report is based on the Waterloo
Precinct area. The demographic profile of the Waterloo Precinct presented in Section 3 is based
on the following SA1’s: – 1133801, 1133802, 1133804, 1133806, 1133838, 1133839, 1133841.
The economic and employment profile is defined as the DZN 113381369 (ABS) and TZ 270
(NSW BTS). SA1’s were not used for the economic analysis as Census data for Place of Work is
not available at this level.

Waterloo South Renewal
30
The forecasts presented in Section 4 refer to Waterloo South only (highlighted by the black
boundary in the map below5).
Demographic assessment
– Waterloo Precinct
Economic assessment –
Waterloo Precinct
Forecasts – Waterloo
South
5 Note: Village Green not included as no housing development is forecast here
Waterloo South (forecast area)

Waterloo South Renewal
31
3.6.2 Who lives in the precinct?
According to the ABS Census of Population and Housing, there were 3,650 residents living in
the Waterloo Precinct in 2016 (see Section 3.6.1 for definition). This represented 1.8% of the
City of Sydney’s resident population. The population of the Precinct grew by 477 people or 15%
between 2011 and 2016.
Older demographic
The current residents of the Precinct are quite elderly.
Just under a third of residents were aged over 65 years in 2016, compared to 8% in the City of
Sydney and 14% across Greater Sydney. This proportion is slightly lower than it was in 2011.
The older demographic in the Precinct impact service needs in the area. In 2016, 12.5% of
residents had need for assistance, much higher than the City of Sydney (2.4%) and Greater
Sydney rates (4.9%). The majority in need were 65 or over (63%).
Figure 13 Age structure – Waterloo (2016)

Waterloo South Renewal
32
Currently medium to low density for inner city area
The densest areas in the precinct are in the northern SA1s which incorporate the larger social
housing buildings. SA1 - 1133838 had a population density of 236 persons per hectare in 2016,
while areas to the south had densities below 150 persons per hectare
Figure 14 Population density – Waterloo (2016)
Waterloo South Renewal
33
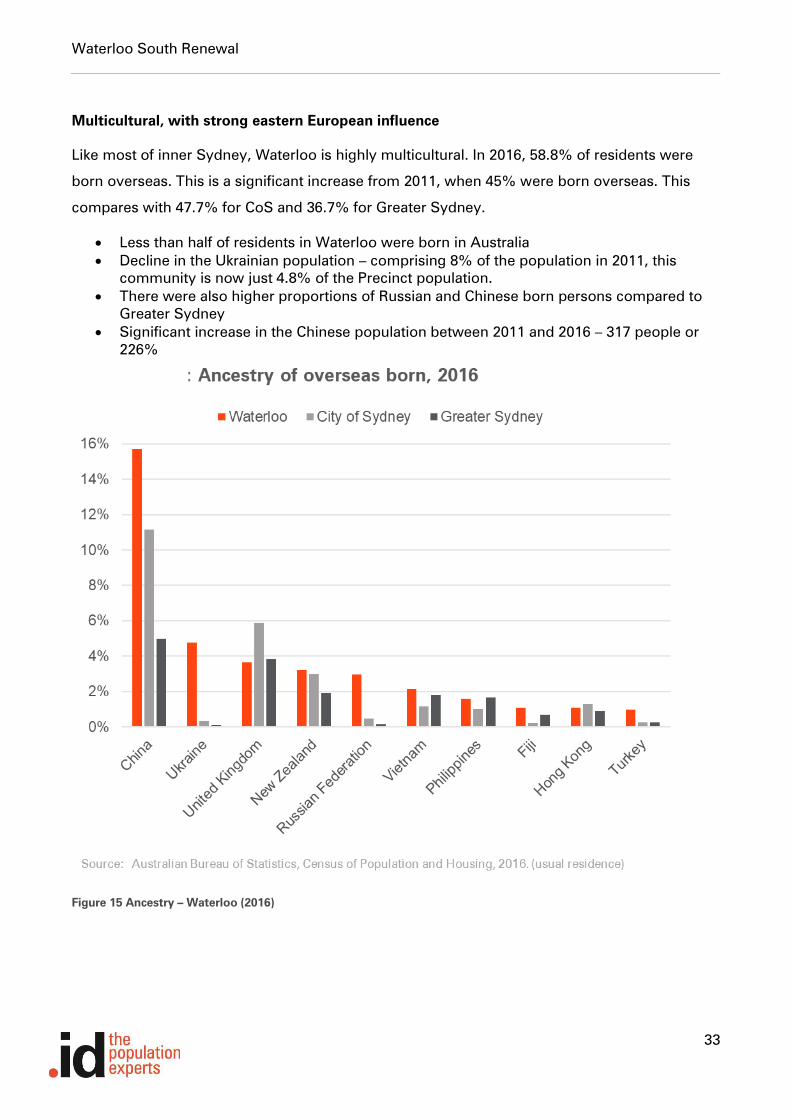
Multicultural, with strong eastern European influence
Like most of inner Sydney, Waterloo is highly multicultural. In 2016, 58.8% of residents were
born overseas. This is a significant increase from 2011, when 45% were born overseas. This
compares with 47.7% for CoS and 36.7% for Greater Sydney.
• Less than half of residents in Waterloo were born in Australia
• Decline in the Ukrainian population – comprising 8% of the population in 2011, this
community is now just 4.8% of the Precinct population.
• There were also higher proportions of Russian and Chinese born persons compared to
Greater Sydney
• Significant increase in the Chinese population between 2011 and 2016 – 317 people or
226%
Figure 15 Ancestry – Waterloo (2016)

Waterloo South Renewal
34
Influx of migrants in 80s and 90s
The majority of residents that were born overseas arrived in the 1980s and 1990s. This could
possibly be a result of the break-up of the Soviet Union, given the ancestry of migrants.
However, there has been a significant influx of migrants in the past five years, most likely from
China.
Figure 16 Arrival of overseas born – Waterloo (2016)

Waterloo South Renewal
35
High share of Indigenous people
In 2016, 227 residents (or 6.2%) identified as Aboriginal and/or Torres Strait Islander, a far
higher proportion than the 1.5% average across Greater Sydney. There was also a
concentration of middle aged adults with some evidence of young families, with a high
proportion of children aged 10 to 14 years
Figure 17 Indigenous population – Waterloo (2016)
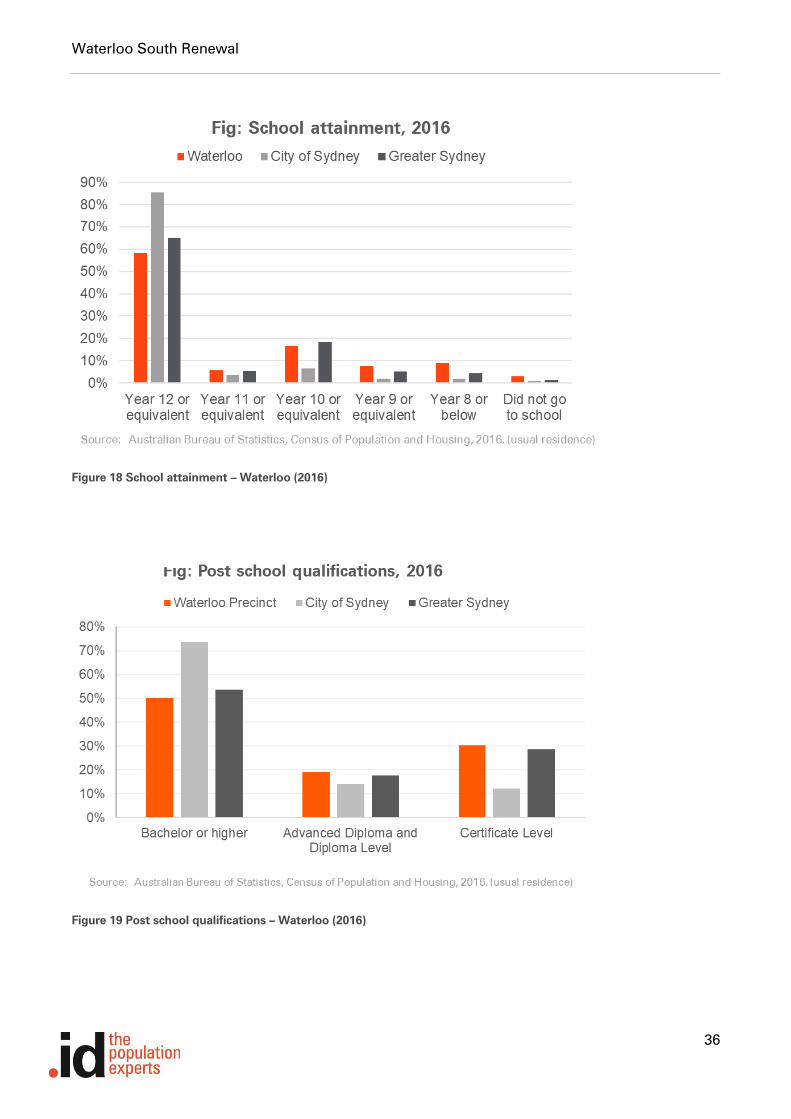
Lower education levels
Just over half of residents in the Waterloo Precinct completed Year 12 or equivalent, compared
to 85% in the City of Sydney and 65% across Greater Sydney. However, this rate has improved
since 2011. Almost one in five completed Year 9 or below, including those that did not attend
school at all.
In 2016, 43% of residents had a post school qualification, this contrasts with 65% for the City of
Sydney, but is close to the Greater Sydney average (46%). Of those with post school
qualifications, most had a bachelor degree or higher (50%) but this was far lower than the
average for the City of Sydney (74%), and less than Greater Sydney (54%).
Waterloo South Renewal
36
Figure 18 School attainment – Waterloo (2016)
Figure 19 Post school qualifications – Waterloo (2016)

Waterloo South Renewal
37
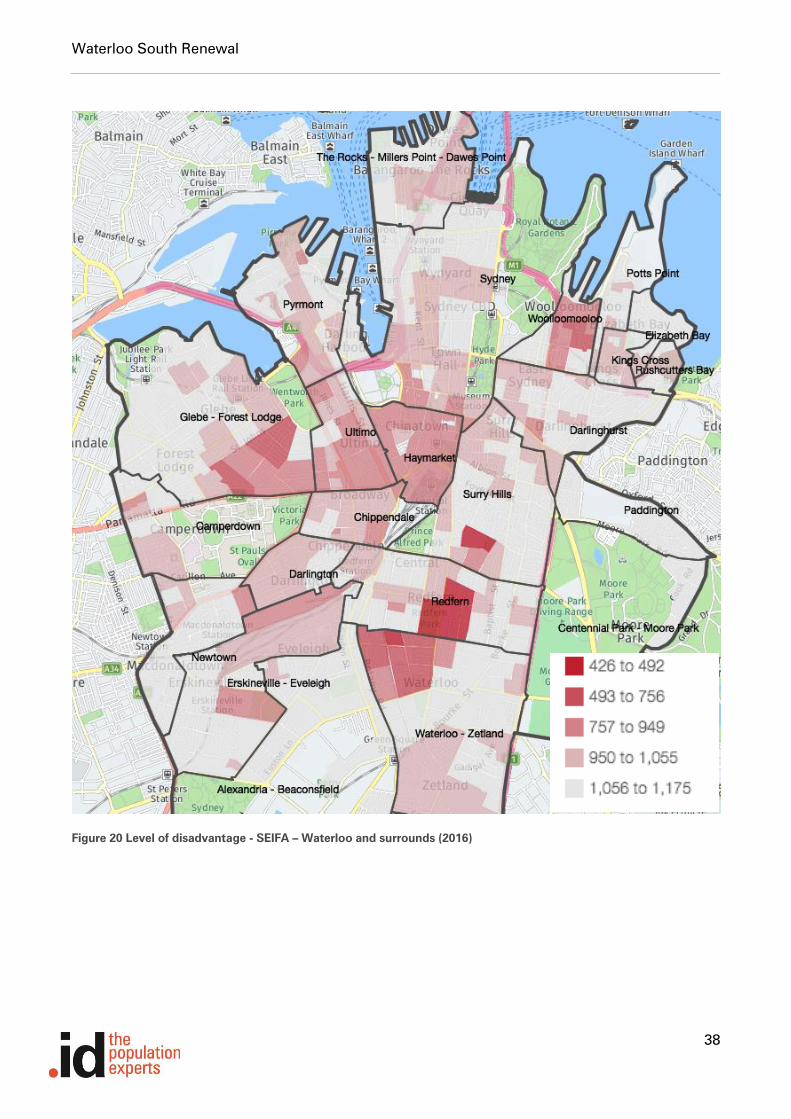
High disadvantage levels
The Waterloo Precinct contains some of the most disadvantaged areas in the CoS. All SA1s
within the Precinct fall within the SEIFA index of disadvantage 1st
decile (most disadvantaged
10%) in NSW and Australia.6 Five SA1s are within the 1
st
percentile (most disadvantaged 1%) in
NSW and one in is ranked the 28th
most disadvantaged SA1 in NSW7.
6 1The Socio-Economic Indexes for Areas (SEIFA) index of relative socio-economic disadvantage is the most commonly used aggregate measure of disadvantage at the local level in Australia. The 2011 SEIFA data is currently the most up to date available. SEIFA 2016 indexes will be available in 2018. 7 Note: there are 17,131 SA1s in NSW.
Waterloo South Renewal
38
Figure 20 Level of disadvantage - SEIFA – Waterloo and surrounds (2016)

Waterloo South Renewal
39
3.6.3 How do they live?
According to the ABS Census of Population and Housing, there were 2,545 dwellings recorded
in the Waterloo Precinct area in 2016. This represented 2.3% of the City of Sydney’s dwelling
stock.
High density living
Just over 90% of dwellings in the Waterloo Precinct were high density, slightly higher than the
City of Sydney and far higher than Greater Sydney. Just 0.2% of dwellings were separate
houses, compared to 55% across Greater Sydney.
Figure 21 Dwelling type – Waterloo (2016)

Waterloo South Renewal
40
Large proportion of one-bedroom dwellings
There were a high proportion of one-bedroom dwellings (32.3%) – just a little lower than City of
Sydney (38%). Surprisingly, medium density dwellings are mostly likely to have one bedroom.
Figure 22 Dwelling type by bedrooms – Waterloo (2016)
Waterloo South Renewal
41
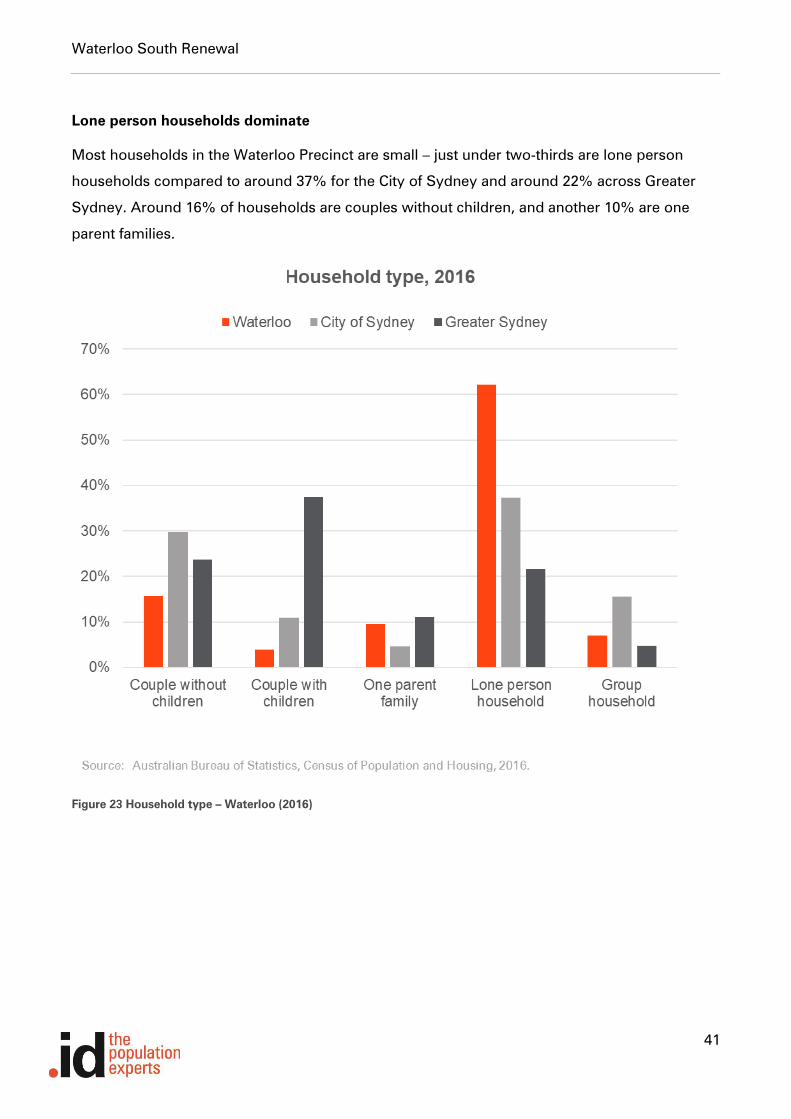
Lone person households dominate
Most households in the Waterloo Precinct are small – just under two-thirds are lone person
households compared to around 37% for the City of Sydney and around 22% across Greater
Sydney. Around 16% of households are couples without children, and another 10% are one
parent families.
Figure 23 Household type – Waterloo (2016)

Waterloo South Renewal
42
Low income households
Household incomes are much lower in the Waterloo Precinct – around a half of residents earned
between $300 and $649 per week. Around one in eight earned $1,000 or more per week,
compared to 62% across the City of Sydney.
Figure 24 Household Weekly income – Waterloo (2016)

Waterloo South Renewal
43
Predominantly social housing tenure
Most households (76%) in the Waterloo Precinct are rented from a State or Territory Housing
Authority, compared to less than 5% across Greater Sydney. Private rentals and mortgages
have increased since 2011. Around 9.4% are rented from a real estate agent, and around 5% are
owned with a mortgage.
Figure 25 Tenure – Waterloo (2016)

Waterloo South Renewal
44
Reliance on public transport
Most households (65%) in Waterloo do not own a motor vehicle. Car ownership is far lower
than the rest of Greater Sydney, reflecting the inner city location and income levels of the area.
.
Figure 26 Vehicle ownership – Waterloo (2016)
Waterloo South Renewal
45
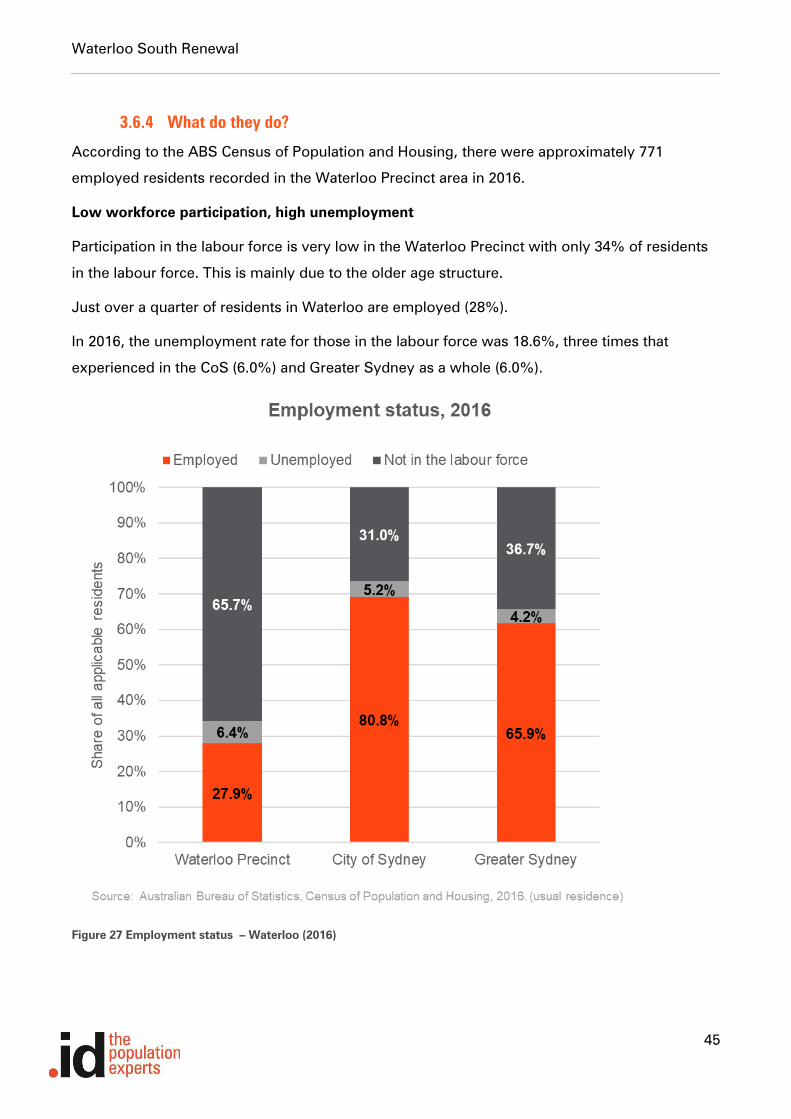
3.6.4 What do they do?
According to the ABS Census of Population and Housing, there were approximately 771
employed residents recorded in the Waterloo Precinct area in 2016.
Low workforce participation, high unemployment
Participation in the labour force is very low in the Waterloo Precinct with only 34% of residents
in the labour force. This is mainly due to the older age structure.
Just over a quarter of residents in Waterloo are employed (28%).
In 2016, the unemployment rate for those in the labour force was 18.6%, three times that
experienced in the CoS (6.0%) and Greater Sydney as a whole (6.0%).
Figure 27 Employment status – Waterloo (2016)
Waterloo South Renewal
46
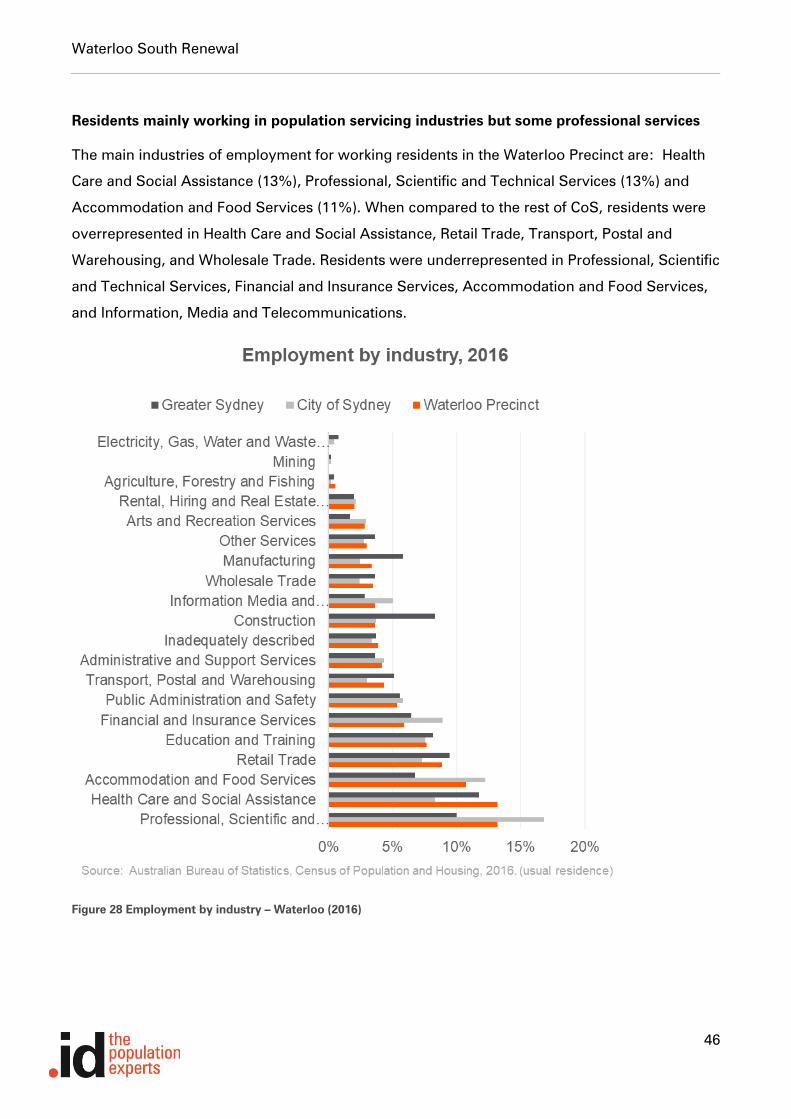
Residents mainly working in population servicing industries but some professional services
The main industries of employment for working residents in the Waterloo Precinct are: Health
Care and Social Assistance (13%), Professional, Scientific and Technical Services (13%) and
Accommodation and Food Services (11%). When compared to the rest of CoS, residents were
overrepresented in Health Care and Social Assistance, Retail Trade, Transport, Postal and
Warehousing, and Wholesale Trade. Residents were underrepresented in Professional, Scientific
and Technical Services, Financial and Insurance Services, Accommodation and Food Services,
and Information, Media and Telecommunications.
Figure 28 Employment by industry – Waterloo (2016)
Waterloo South Renewal
47
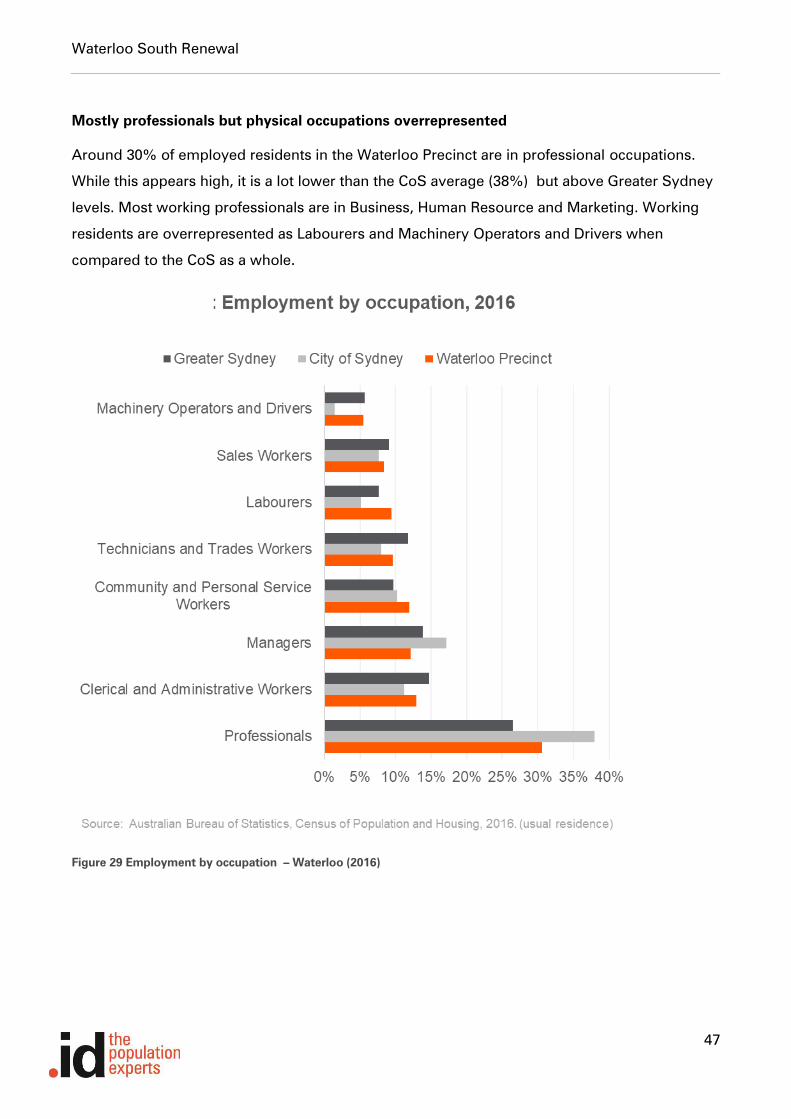
Mostly professionals but physical occupations overrepresented
Around 30% of employed residents in the Waterloo Precinct are in professional occupations.
While this appears high, it is a lot lower than the CoS average (38%) but above Greater Sydney
levels. Most working professionals are in Business, Human Resource and Marketing. Working
residents are overrepresented as Labourers and Machinery Operators and Drivers when
compared to the CoS as a whole.
Figure 29 Employment by occupation – Waterloo (2016)
Waterloo South Renewal
48
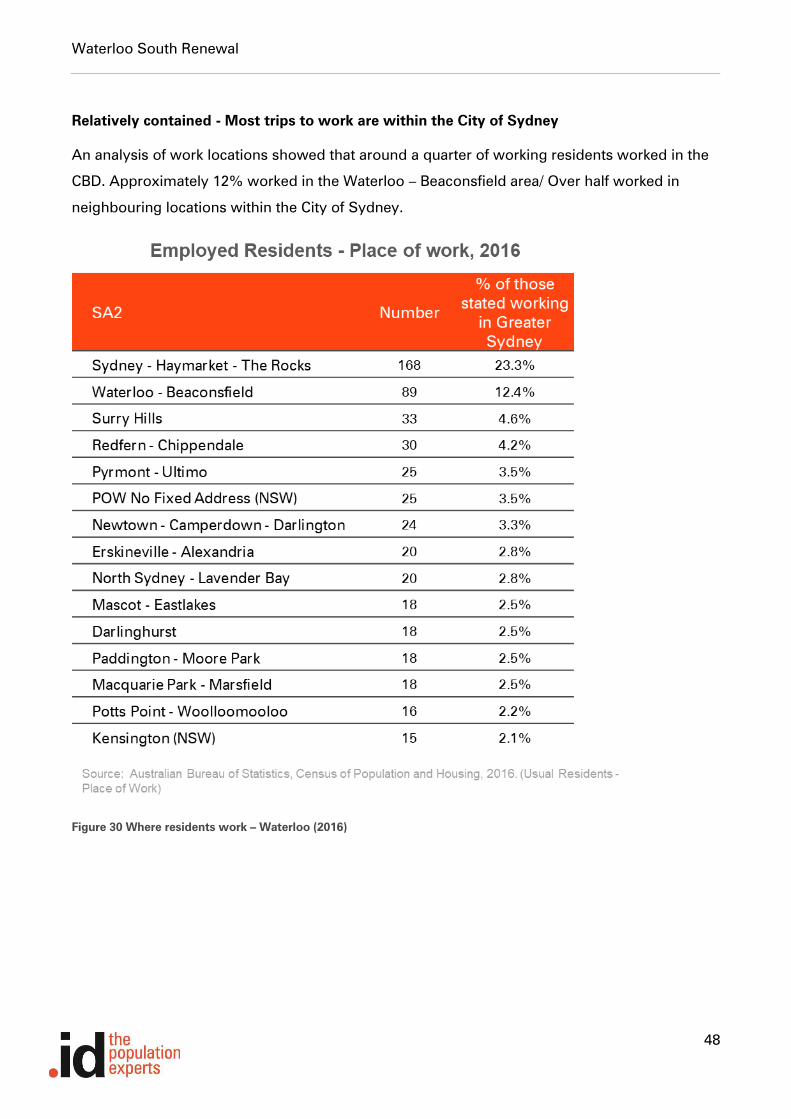
Relatively contained - Most trips to work are within the City of Sydney
An analysis of work locations showed that around a quarter of working residents worked in the
CBD. Approximately 12% worked in the Waterloo – Beaconsfield area/ Over half worked in
neighbouring locations within the City of Sydney.
Figure 30 Where residents work – Waterloo (2016)
Waterloo South Renewal
49
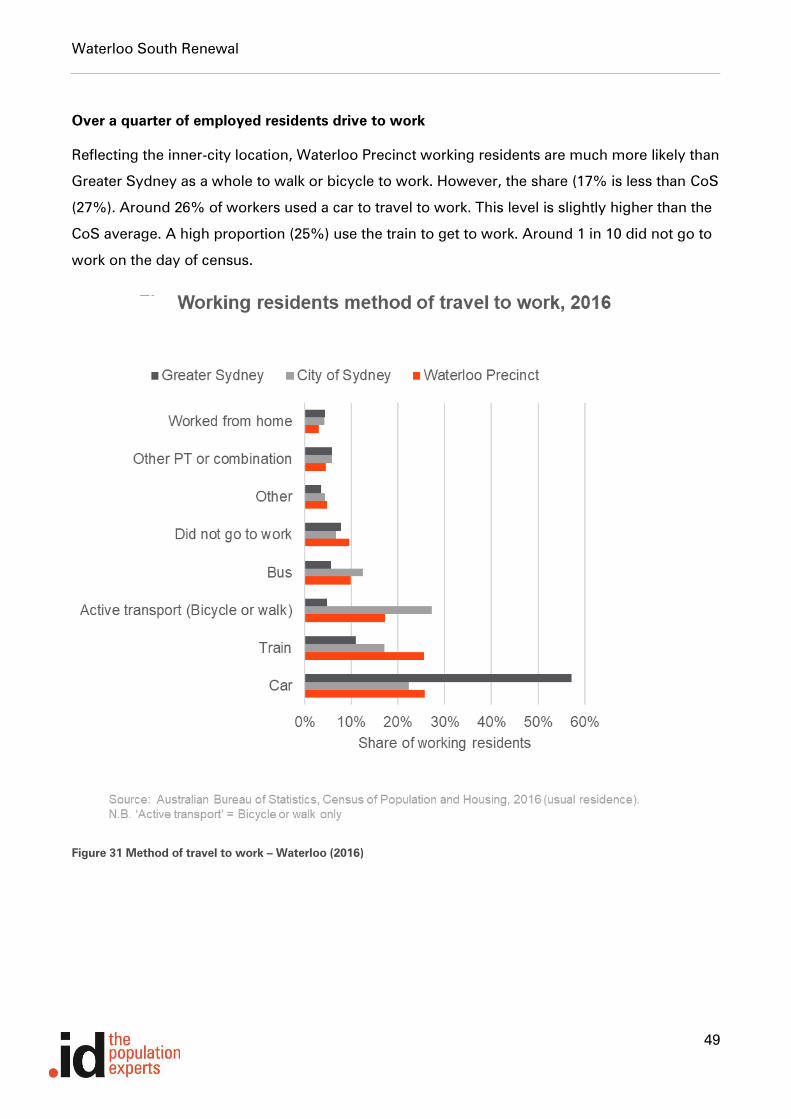
Over a quarter of employed residents drive to work
Reflecting the inner-city location, Waterloo Precinct working residents are much more likely than
Greater Sydney as a whole to walk or bicycle to work. However, the share (17% is less than CoS
(27%). Around 26% of workers used a car to travel to work. This level is slightly higher than the
CoS average. A high proportion (25%) use the train to get to work. Around 1 in 10 did not go to
work on the day of census.
Figure 31 Method of travel to work – Waterloo (2016)

Waterloo South Renewal
50
Disengaged youth
In 2016, approximately 7% of persons aged 15-24 year in the Precinct were not in the labour
force (NILF) and not studying, this is more than double the CoS share (3.1%).
An estimated 41% of unemployed and 14% of those NILF were not pursuing some form of
study. This compares to 18% and 7% for the CoS as a whole. The figures more closely
resemble that for Greater Sydney (37% and 13% respectively). It is much more difficult for
young people to enter the labour force and achieve employment outcomes if they are not even
developing skills outside the work environment.
Figure 32 Disengaged youth – Waterloo (2016)
Waterloo South Renewal
51
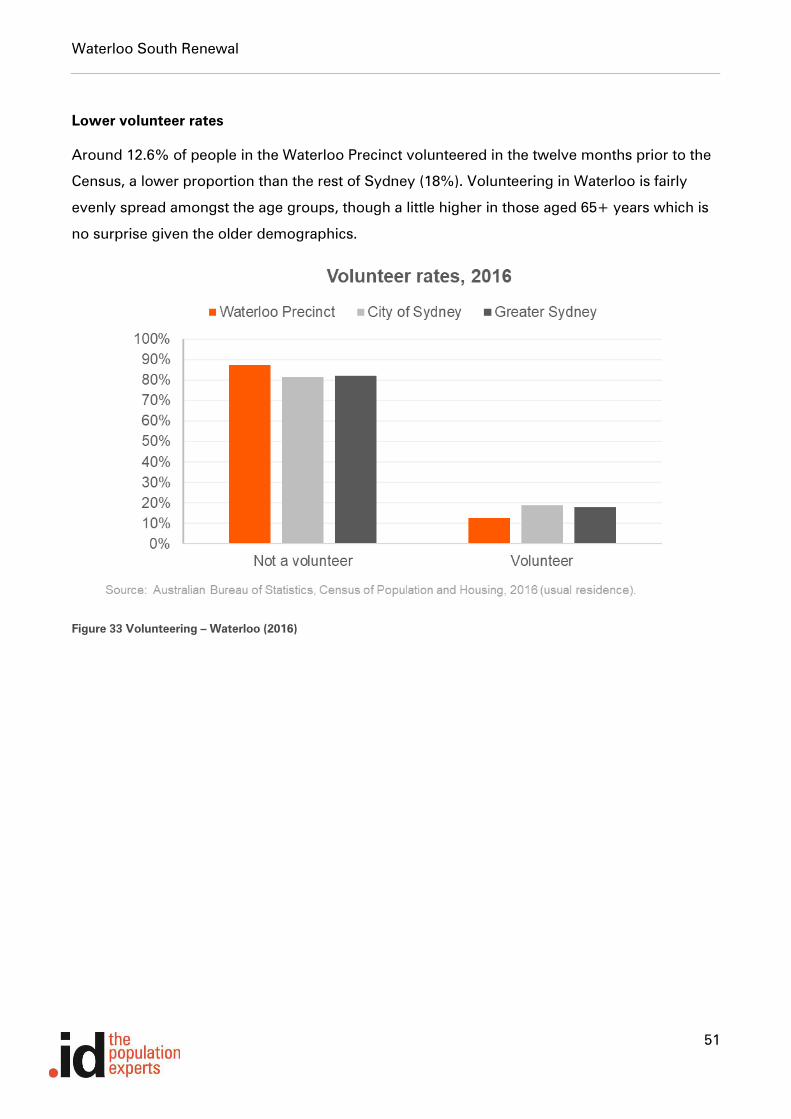
Lower volunteer rates
Around 12.6% of people in the Waterloo Precinct volunteered in the twelve months prior to the
Census, a lower proportion than the rest of Sydney (18%). Volunteering in Waterloo is fairly
evenly spread amongst the age groups, though a little higher in those aged 65+ years which is
no surprise given the older demographics.
Figure 33 Volunteering – Waterloo (2016)
Waterloo South Renewal
52
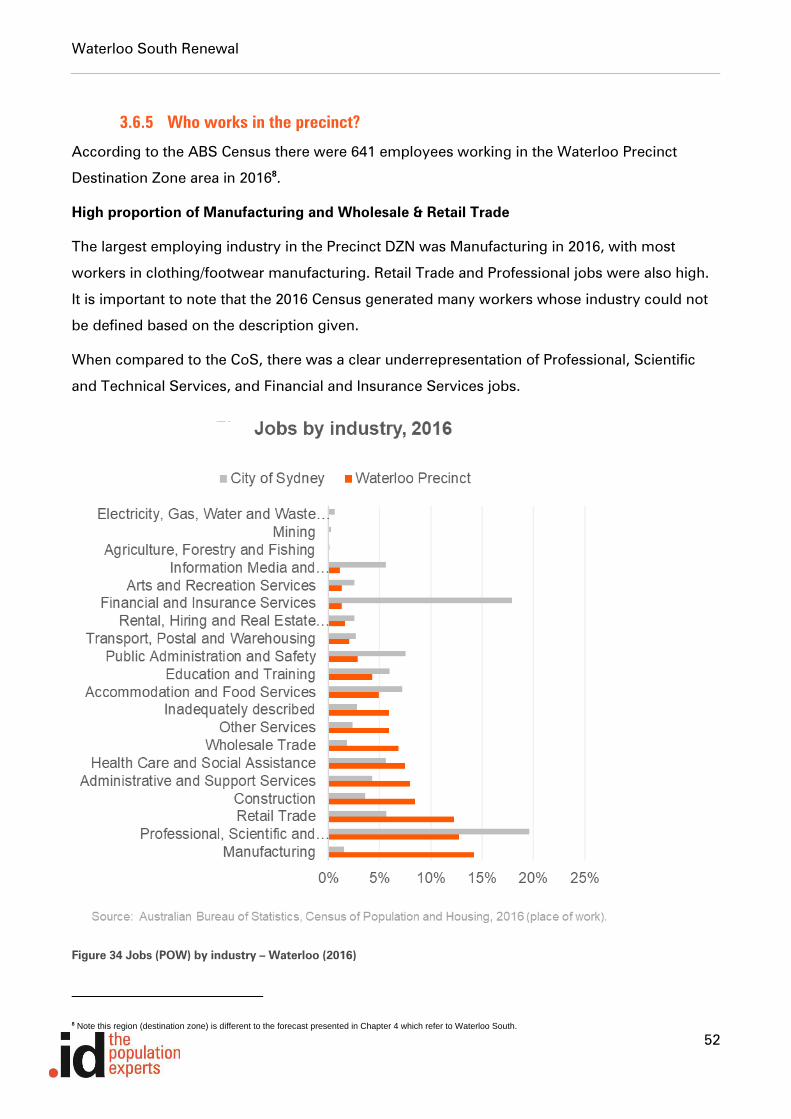
3.6.5 Who works in the precinct?
According to the ABS Census there were 641 employees working in the Waterloo Precinct
Destination Zone area in 20168.
High proportion of Manufacturing and Wholesale & Retail Trade
The largest employing industry in the Precinct DZN was Manufacturing in 2016, with most
workers in clothing/footwear manufacturing. Retail Trade and Professional jobs were also high.
It is important to note that the 2016 Census generated many workers whose industry could not
be defined based on the description given.
When compared to the CoS, there was a clear underrepresentation of Professional, Scientific
and Technical Services, and Financial and Insurance Services jobs.
Figure 34 Jobs (POW) by industry – Waterloo (2016)
8 Note this region (destination zone) is different to the forecast presented in Chapter 4 which refer to Waterloo South.
Waterloo South Renewal
53
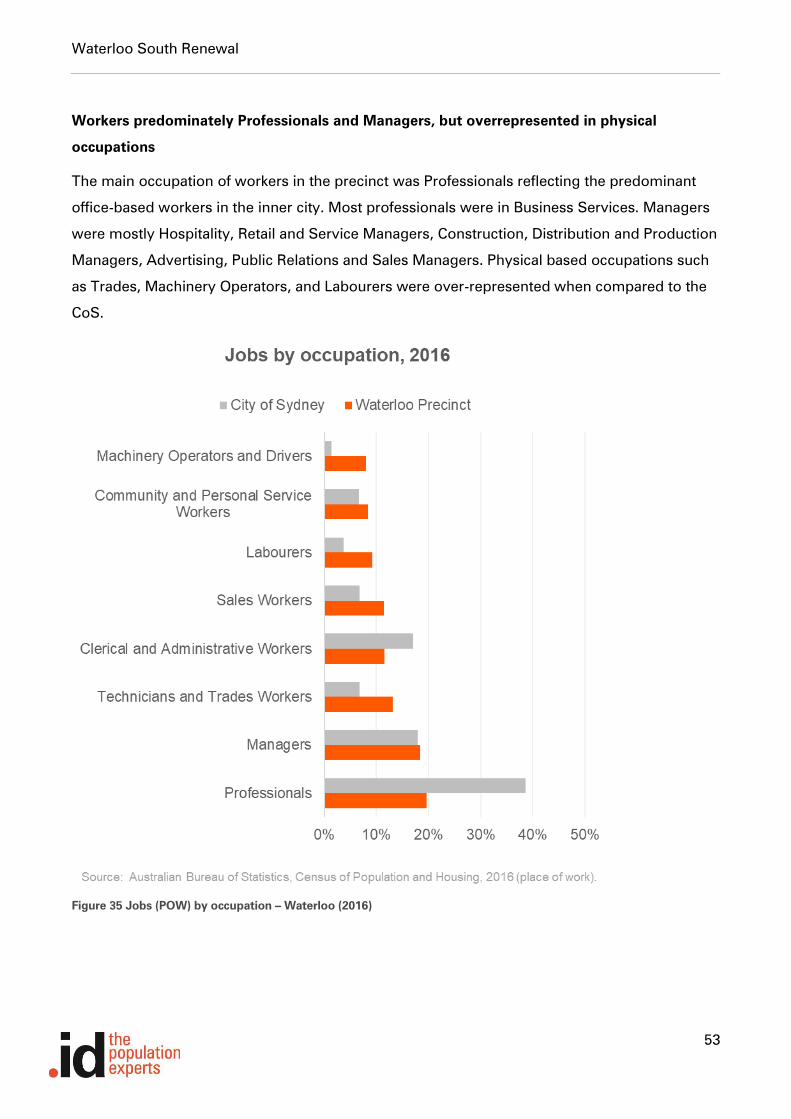
Workers predominately Professionals and Managers, but overrepresented in physical
occupations
The main occupation of workers in the precinct was Professionals reflecting the predominant
office-based workers in the inner city. Most professionals were in Business Services. Managers
were mostly Hospitality, Retail and Service Managers, Construction, Distribution and Production
Managers, Advertising, Public Relations and Sales Managers. Physical based occupations such
as Trades, Machinery Operators, and Labourers were over-represented when compared to the
CoS.
Figure 35 Jobs (POW) by occupation – Waterloo (2016)

Waterloo South Renewal
54
Most businesses, and likely employment, located along Botany Bay Rd/Cope Street corridor
There were approximately 103 GST registered businesses in the Waterloo Precinct DZN in 2017.
Most were located on the western periphery bordering Botany Road. Around 39 or 38% of
businesses were Sole Traders.
There were an estimated 66 businesses in the designated Precinct Development area (excludes
those in DZN but not in focus area). Of these, 27% were Sole Traders. Most businesses were in
Transport, Postal and Warehousing, Professional, Scientific and Technical Service, and
Construction.
Figure 36 Businesses – Waterloo (2016)
Waterloo South Renewal
55
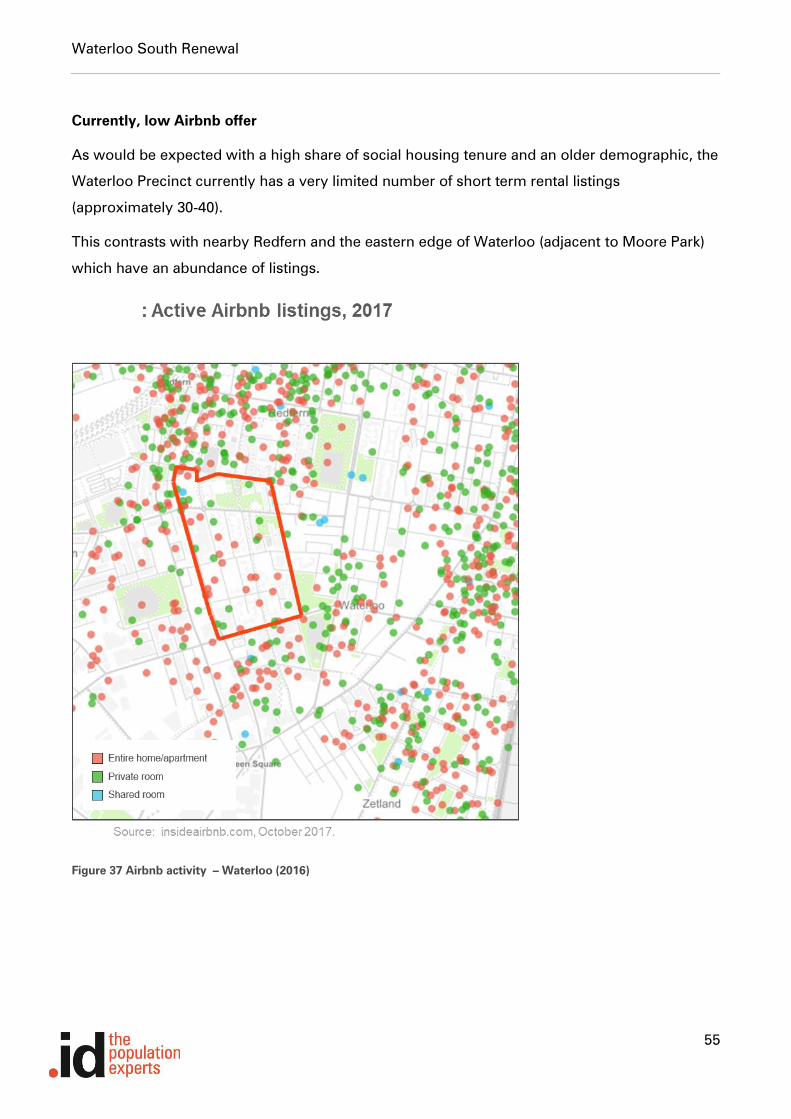
Currently, low Airbnb offer
As would be expected with a high share of social housing tenure and an older demographic, the
Waterloo Precinct currently has a very limited number of short term rental listings
(approximately 30-40).
This contrasts with nearby Redfern and the eastern edge of Waterloo (adjacent to Moore Park)
which have an abundance of listings.
Figure 37 Airbnb activity – Waterloo (2016)

Waterloo South Renewal
56
Strong creative industries cluster
The City of Sydney Floor space and employment survey provides another measure of economic
activity in the Waterloo precinct. The 2012 City of Sydney Floor space survey revealed a high
amount of workers who could be defined as working in ‘creative industries’, whether that be in
creative business, manufacturing or print/media. The largest business count was in Retail and
Personal Services.
Figure 38 Employment and business– Waterloo (2016)
Waterloo South Renewal
57
3.7 Case study benchmarks
This section compares other inner urban areas in the City of Sydney with the current profile of
the Waterloo Precinct area. The areas are of different geographies and population sizes.
However, they are generally all medium to high density locations.
The areas reflect the possible demographic outcomes of the Waterloo Precinct under different
scenarios e.g. current trends, or with market led development. The benchmark areas include:
Redfern Estate, Pyrmont, Zetland, Ultimo, and Kings Cross/Potts Point.
Key findings
Redfern Estate represents what Waterloo might resemble without market led redevelopment,
maintaining the existing majority social housing supply. Many residents would age in place,
lone person households would become even more dominant and household income levels
would be lower.
With market led redevelopment several outcomes could occur:
• If the redevelopment supported a predominately young employed resident base
attracted to the area’s proximity to high value knowledge jobs, it might resemble
Pyrmont or Mascot’s demographic profile.
• Zetland displays what could occur if the development attracted a profile that was a
closer match to the CoS average.
• If the Precinct development incorporated a significant portion of student housing due
to its proximity to education facilities, it might more closely resemble Ultimo.
• Kings Cross/Potts Point represents the demographic profile that could occur if the
development supported a more mixed age and income demographic base.
It is likely that the result would be a combination of benchmark areas due to the existing
social housing role and likely attraction of younger workers and/or students.

Waterloo South Renewal
58
3.7.1 Benchmark area 1 – Redfern Estate
Redfern Estate is an area of very high density social housing close to the Waterloo Precinct. The
resident base is older than Waterloo and much older than the rest of CoS. Redfern Estate
reflects what is likely to occur in Waterloo without redevelopment. Many residents would age in
place, lone person households would become even more dominant and household income
levels would be lower.
Figure 39 Age structure – Waterloo and Redfern (2016)

Waterloo South Renewal
59
Households and dwellings
High density living is the norm in the Redfern Estate which largely consists of social housing
blocks. Lone person households make up 74.7% of all households, far above the CoS average
(37.3%). There is a very low share of couples with children (2.6%)
Figure 40 Household type – Waterloo and Redfern (2016)

Waterloo South Renewal
60
Figure 41 Dwelling type – Waterloo and Redfern (2016)
Tenure and income
Almost exclusively social housing tenure. Nearly all households in Redfern Estate have income
levels below $1000 a week
Figure 42 Tenure – Waterloo and Redfern (2016)

Waterloo South Renewal
61
Figure 43 Income – Waterloo and Redfern (2016)
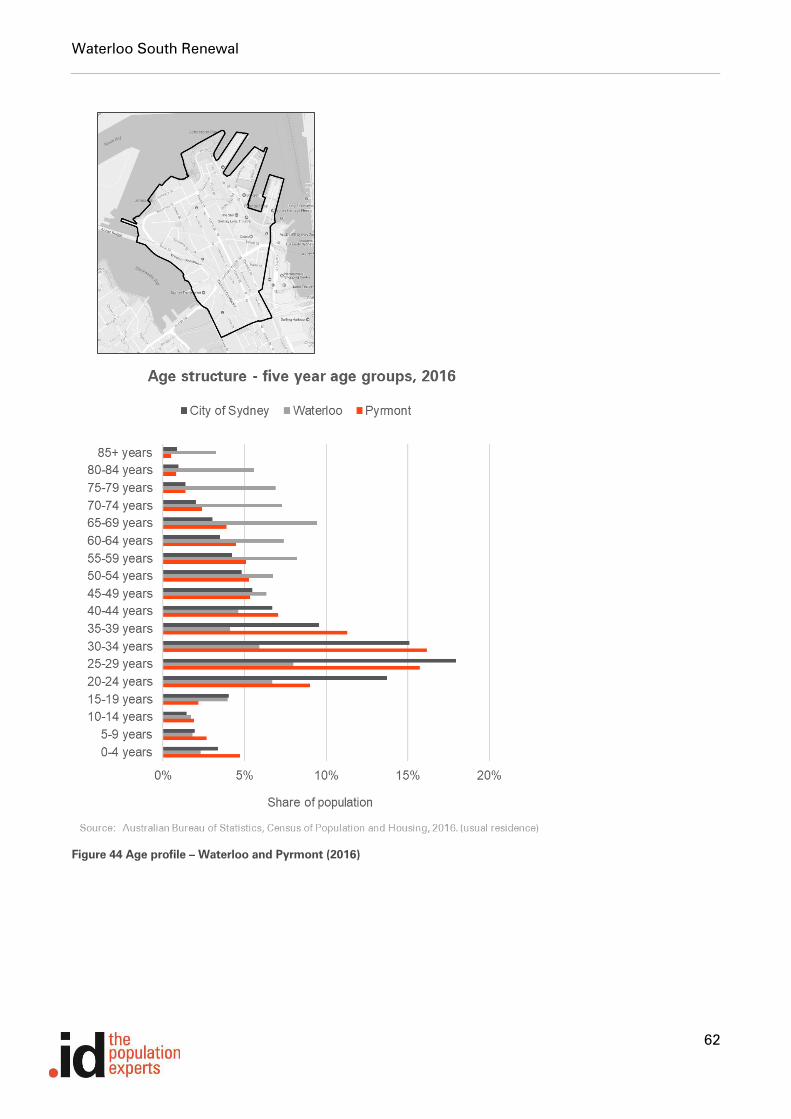
3.7.2 Benchmark area 2 – Pyrmont
Pyrmont is a relatively affluent area close to Sydney Harbour that supports a young high-income
working population. The area is much larger than Waterloo but accommodates a similar
population size to that planned for the Precinct. It represents the demographic profile that could
occur if the development supported a predominately young employed base attracted to the
area’s proximity to high value knowledge jobs.
Waterloo South Renewal
62
Figure 44 Age profile – Waterloo and Pyrmont (2016)
Waterloo South Renewal
63
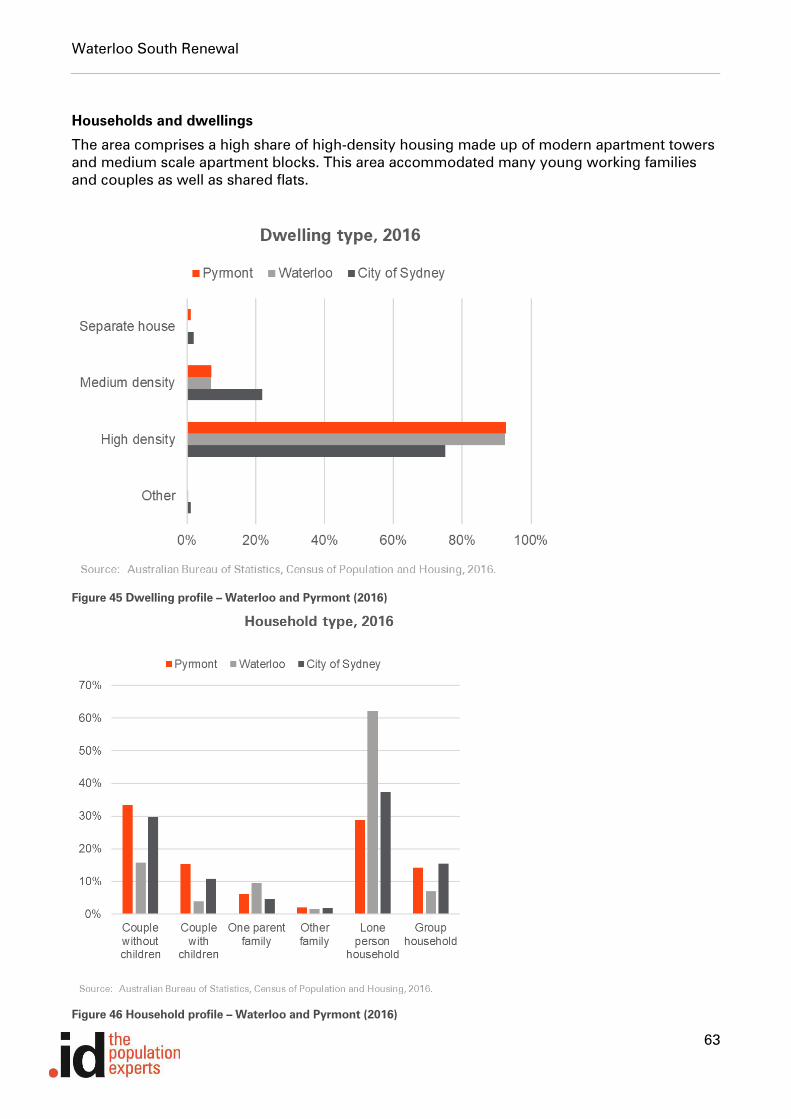
Households and dwellings
The area comprises a high share of high-density housing made up of modern apartment towers
and medium scale apartment blocks. This area accommodated many young working families
and couples as well as shared flats.
Figure 45 Dwelling profile – Waterloo and Pyrmont (2016)
Figure 46 Household profile – Waterloo and Pyrmont (2016)
Waterloo South Renewal
64
Tenure and income
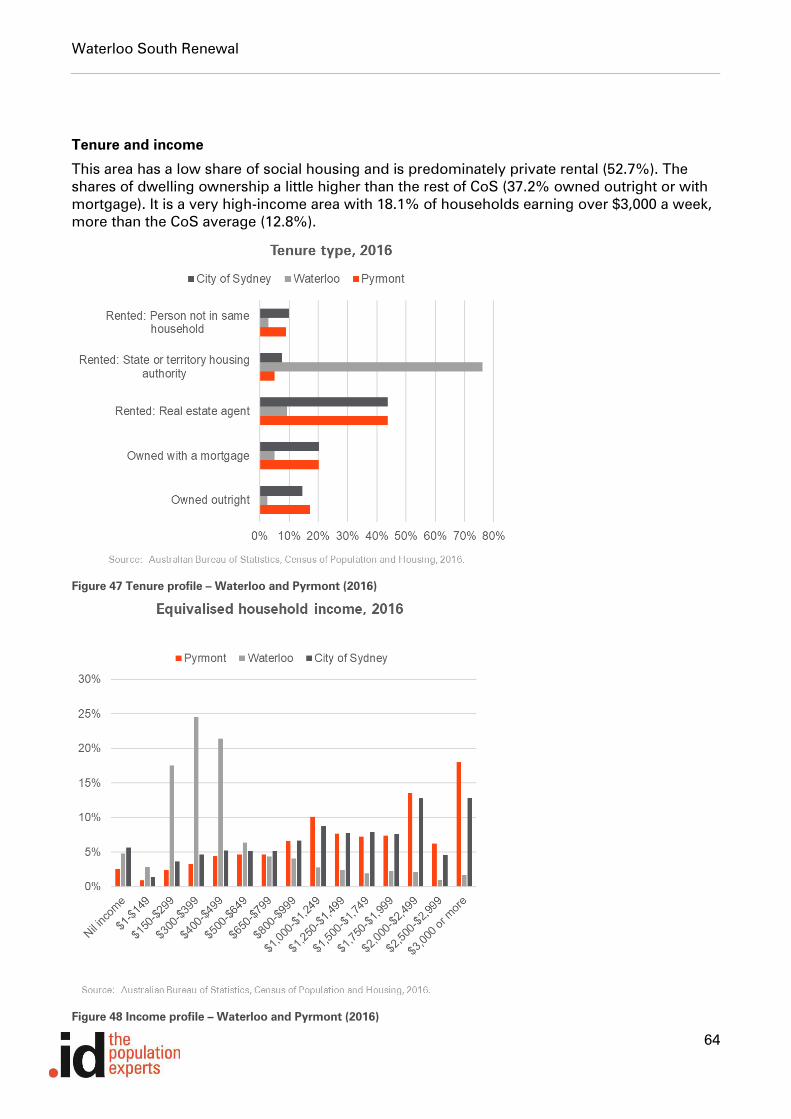
This area has a low share of social housing and is predominately private rental (52.7%). The
shares of dwelling ownership a little higher than the rest of CoS (37.2% owned outright or with
mortgage). It is a very high-income area with 18.1% of households earning over $3,000 a week,
more than the CoS average (12.8%).
Figure 47 Tenure profile – Waterloo and Pyrmont (2016)
Figure 48 Income profile – Waterloo and Pyrmont (2016)
Waterloo South Renewal
65
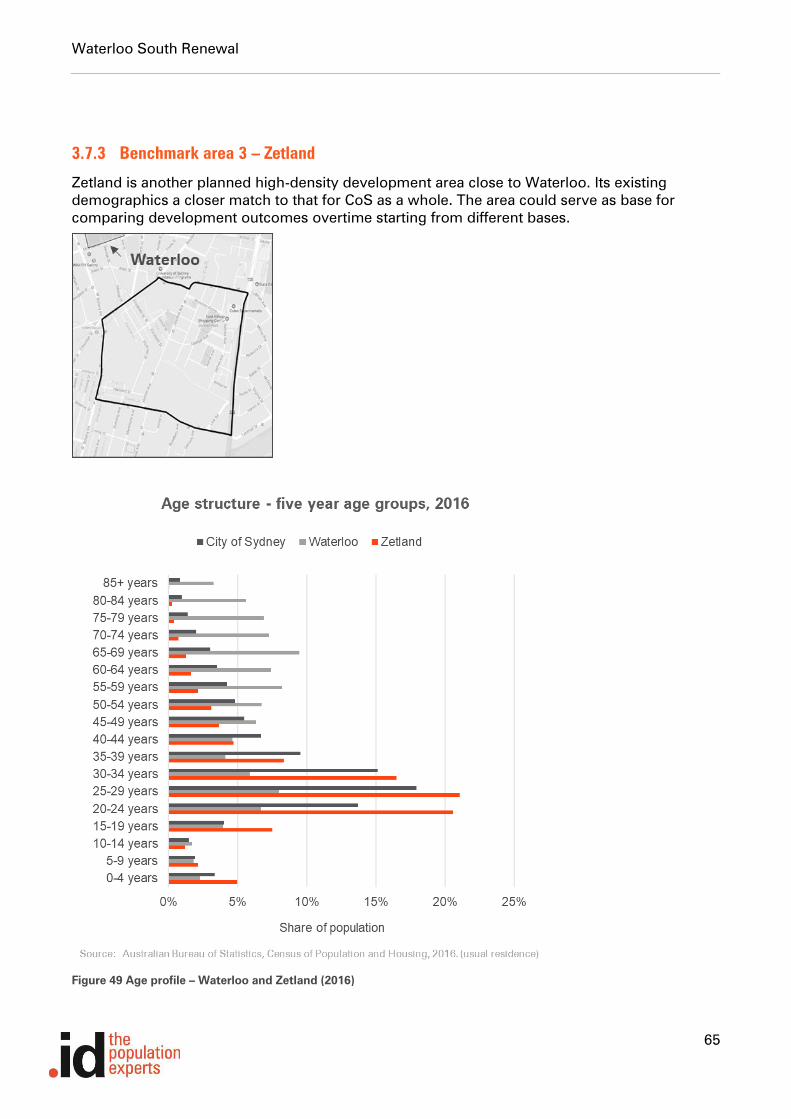
3.7.3 Benchmark area 3 – Zetland
Zetland is another planned high-density development area close to Waterloo. Its existing
demographics a closer match to that for CoS as a whole. The area could serve as base for
comparing development outcomes overtime starting from different bases.
Figure 49 Age profile – Waterloo and Zetland (2016)
Waterloo South Renewal
66
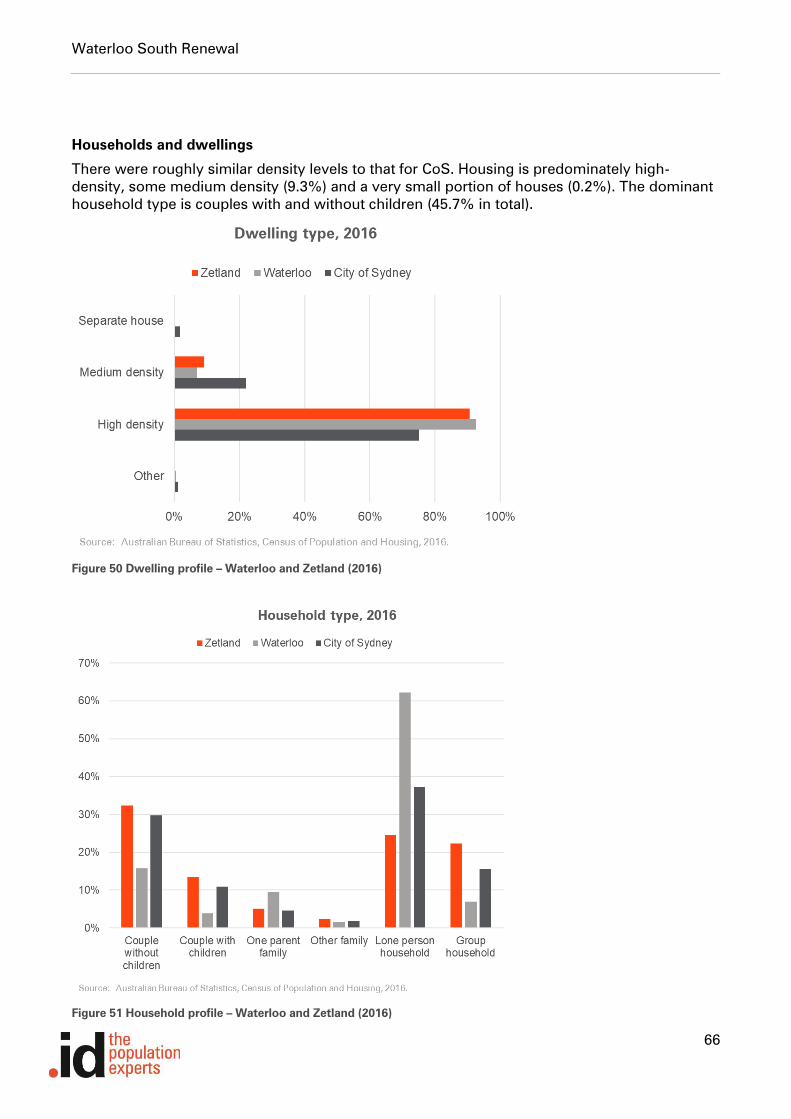
Households and dwellings
There were roughly similar density levels to that for CoS. Housing is predominately high-
density, some medium density (9.3%) and a very small portion of houses (0.2%). The dominant
household type is couples with and without children (45.7% in total).
Figure 50 Dwelling profile – Waterloo and Zetland (2016)
Figure 51 Household profile – Waterloo and Zetland (2016)

Waterloo South Renewal
67
Tenure and income
The area has a low share of social housing, predominately rental through agent (48.6%) or
owner mortgage (25.8%). Ownership has declined significantly since 2011. Income levels on par
with CoS, but with a slightly higher share households earning no income. The increase in “nil
income” is significant since 2011.
Figure 52 Tenure profile – Waterloo and Zetland (2016)
Figure 53 Income profile – Waterloo and Zetland (2016)

Waterloo South Renewal
68
3.7.4 Benchmark area 4 - Ultimo
Ultimo represents a higher density area that incorporates a much younger population, high
share of students, due to its inclusion of UTS and TAFE NSW Ultimo, and its proximity to
University of Sydney. It reflects a possible outcome if the Precinct development incorporated a
significant portion of student housing (studios and shared rentals) due to its proximity to these
education facilities (1-1.5km walk).
Figure 54 Age profile – Waterloo and Ultimo (2016)

Waterloo South Renewal
69
Households and dwellings
The area has similar housing density levels to that for CoS average. There is a high share of
high-density housing, some medium density (20%) . The predominate household type is lone
persons reflecting high shares of student accommodation (e.g. UTS housing – Yura Mudang
tower). Group households are also becoming increasingly common. However, a third of
households are also made up of couples and families.
Figure 55 Dwelling profile – Waterloo and Ultimo (2016)
Figure 56 Household profile – Waterloo and Ultimo (2016)

Waterloo South Renewal
70
Tenure and income
The predominate tenure type by far is agent-based rental. Income levels are lower than the CoS
average and there is a high share of nil income households, once again reflecting the high
student population.
Figure 57 Tenure profile – Waterloo and Ultimo (2016)
Figure 58 Income profile – Waterloo and Ultimo (2016)
Waterloo South Renewal
71
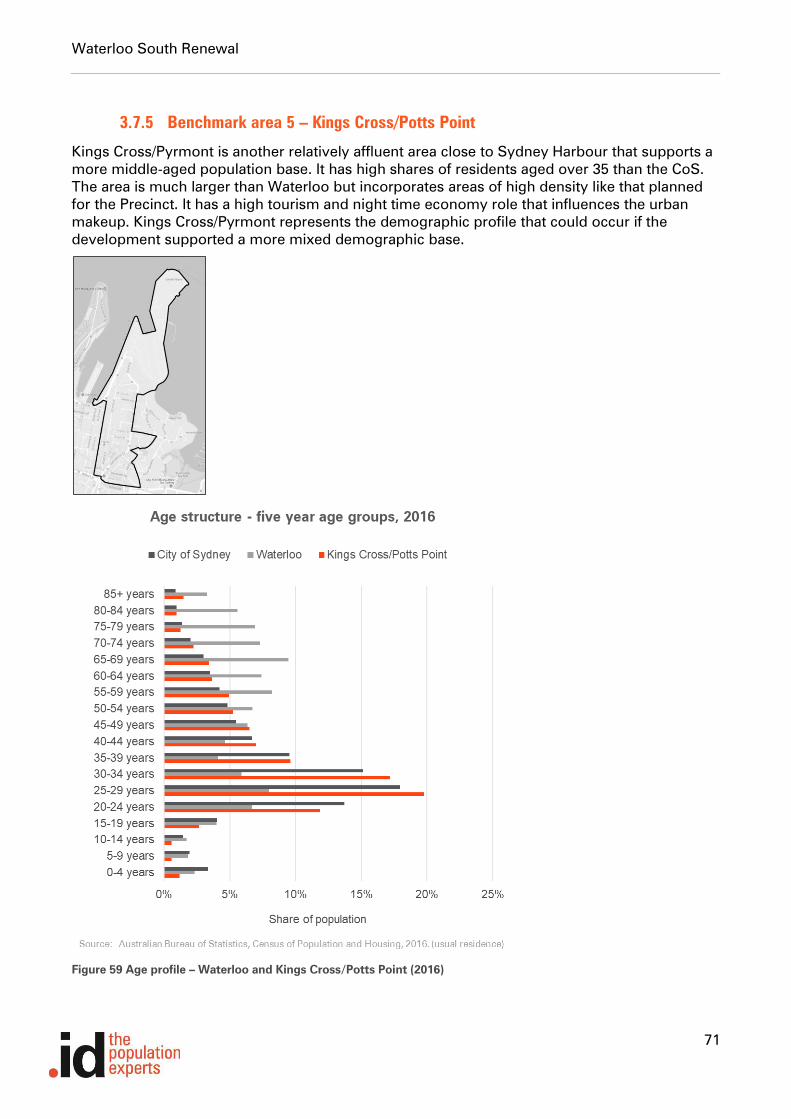
3.7.5 Benchmark area 5 – Kings Cross/Potts Point
Kings Cross/Pyrmont is another relatively affluent area close to Sydney Harbour that supports a
more middle-aged population base. It has high shares of residents aged over 35 than the CoS.
The area is much larger than Waterloo but incorporates areas of high density like that planned
for the Precinct. It has a high tourism and night time economy role that influences the urban
makeup. Kings Cross/Pyrmont represents the demographic profile that could occur if the
development supported a more mixed demographic base.
Figure 59 Age profile – Waterloo and Kings Cross/Potts Point (2016)

Waterloo South Renewal
72
Households and dwellings
The area has a higher share of higher density housing compared to CoS (92% of housing is
high-density). The predominate household type is lone persons which is spread across the age
groups. This reflects the attractiveness of the location for short term stays and people seeking
proximity to night time entertainment opportunities.
Figure 60 Dwelling profile – Waterloo and Kings Cross/Potts Point (2016)
Figure 61 Household profile – Waterloo and Kings Cross/Potts Point (2016)
Waterloo South Renewal
73
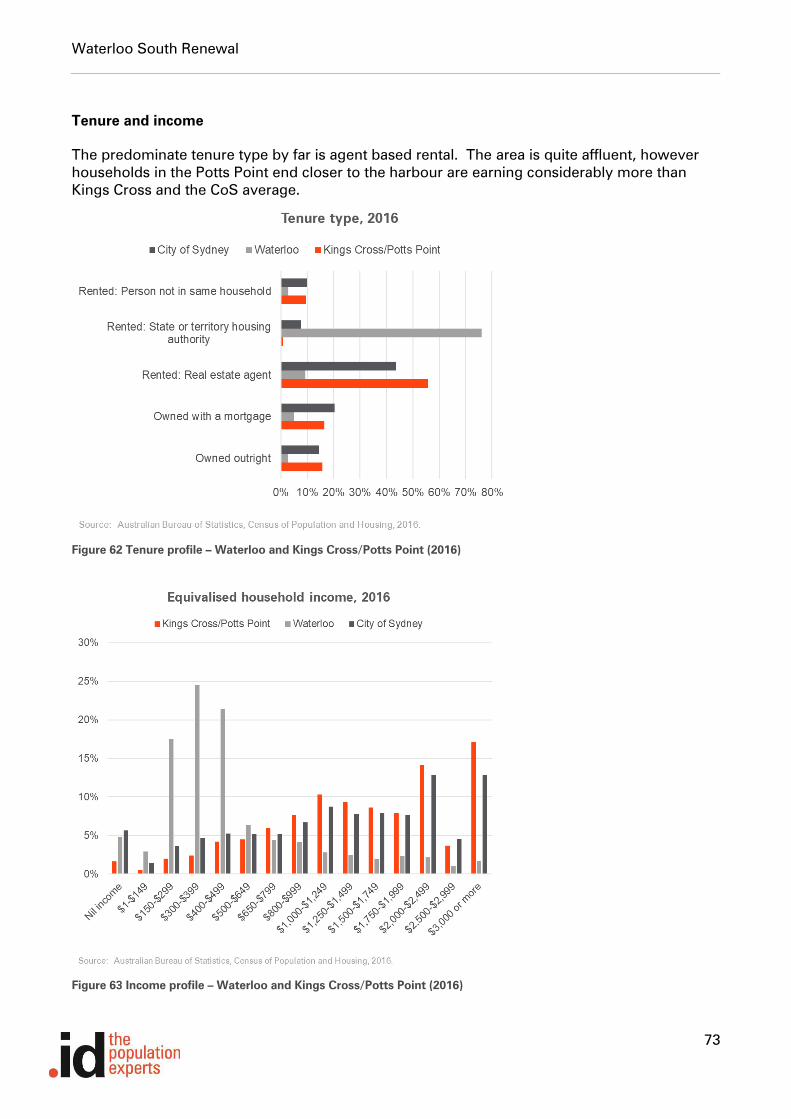
Tenure and income
The predominate tenure type by far is agent based rental. The area is quite affluent, however
households in the Potts Point end closer to the harbour are earning considerably more than
Kings Cross and the CoS average.
Figure 62 Tenure profile – Waterloo and Kings Cross/Potts Point (2016)
Figure 63 Income profile – Waterloo and Kings Cross/Potts Point (2016)
Waterloo South Renewal
74
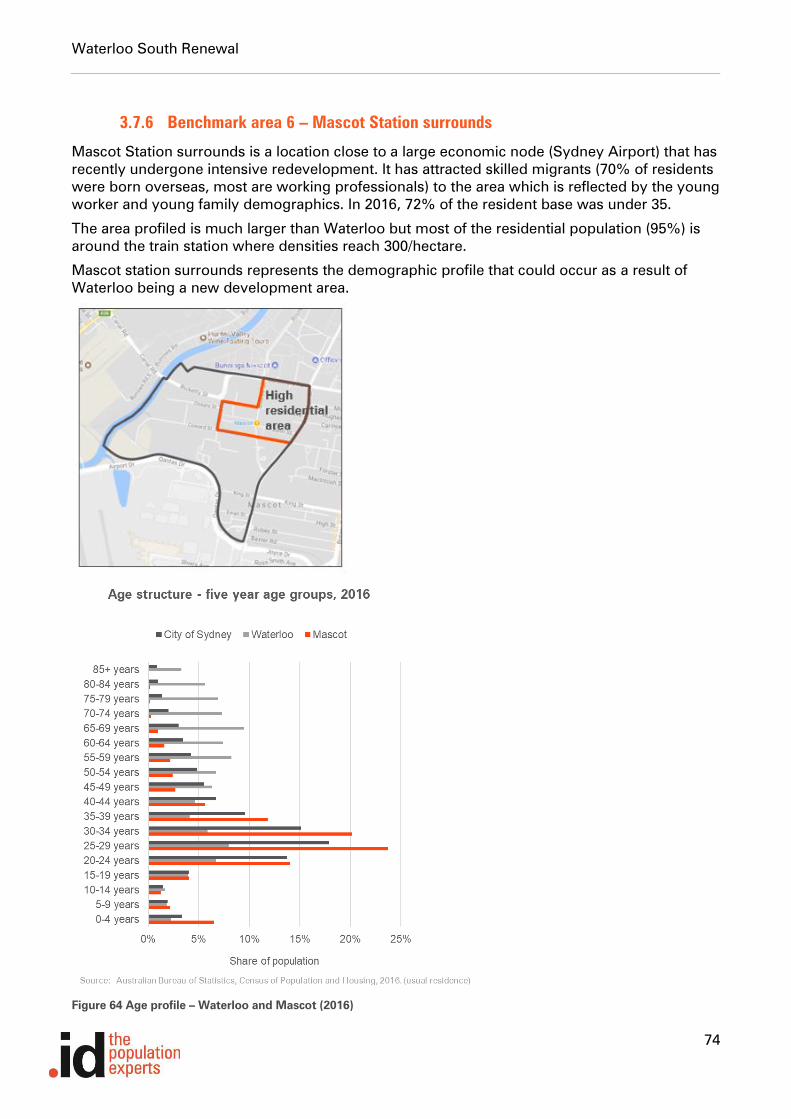
3.7.6 Benchmark area 6 – Mascot Station surrounds
Mascot Station surrounds is a location close to a large economic node (Sydney Airport) that has
recently undergone intensive redevelopment. It has attracted skilled migrants (70% of residents
were born overseas, most are working professionals) to the area which is reflected by the young
worker and young family demographics. In 2016, 72% of the resident base was under 35.
The area profiled is much larger than Waterloo but most of the residential population (95%) is
around the train station where densities reach 300/hectare.
Mascot station surrounds represents the demographic profile that could occur as a result of
Waterloo being a new development area.
Figure 64 Age profile – Waterloo and Mascot (2016)
Waterloo South Renewal
75
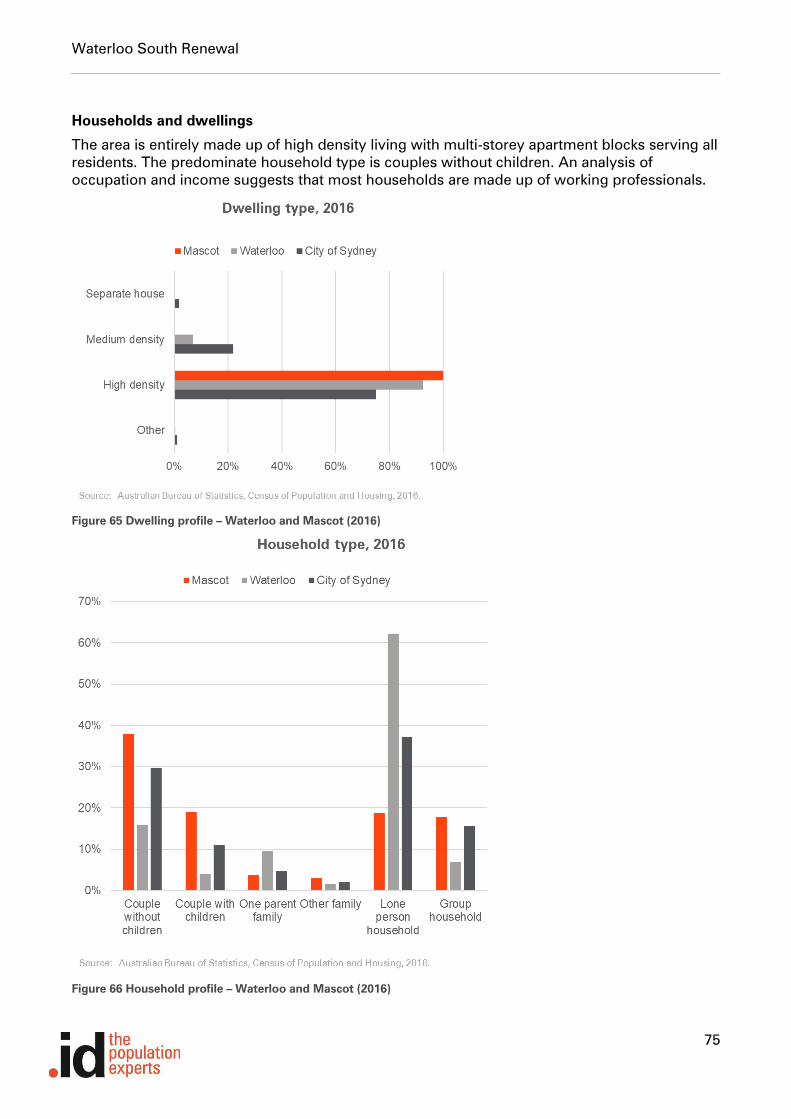
Households and dwellings
The area is entirely made up of high density living with multi-storey apartment blocks serving all
residents. The predominate household type is couples without children. An analysis of
occupation and income suggests that most households are made up of working professionals.
Figure 65 Dwelling profile – Waterloo and Mascot (2016)
Figure 66 Household profile – Waterloo and Mascot (2016)

Waterloo South Renewal
76
Tenure and income
The predominate tenure type by far is agent-based rental. The area is very affluent with 30% of
households earning more than $3,000 per week. There are very little low-income earners.
Figure 67 Tenure profile – Waterloo and Mascot (2016)
Figure 68 Income profile – Waterloo and Mascot (2016)
Waterloo South Renewal
77
3.8 How does the precinct compare?
3.8.1 Comparisons to other inner city areas
The following table provides an overview of the key demographic differences between the
locations.
Redfern Estate presents an area which most closely resembles Waterloo currently and what it
could become without market led redevelopment.
The other areas present different demographic profiles that could occur under a market led
redevelopment but largely reflect their specific roles and function. For example, Ultimo’s role as
a base for students.

Waterloo South Renewal
78
Source: Australian Bureau of Statistics, Census of Population and Housing, 2016
Figure 69 Comparison of benchmark areas
79
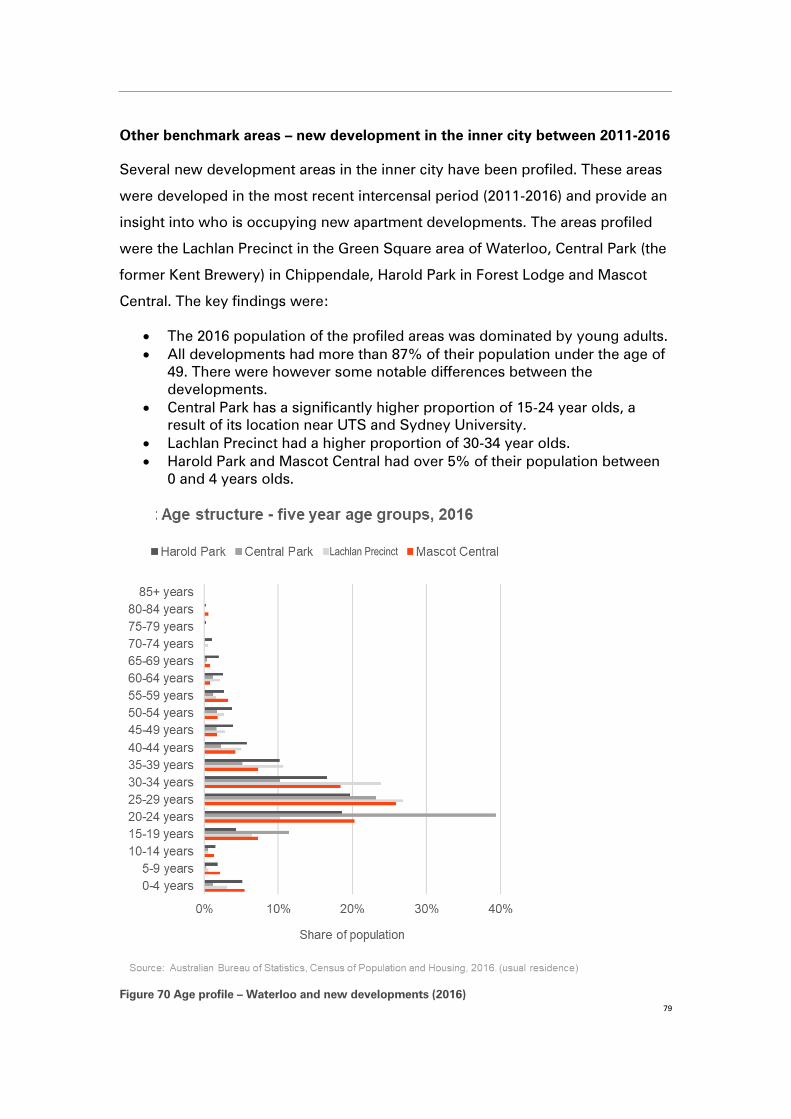
Other benchmark areas – new development in the inner city between 2011-2016
Several new development areas in the inner city have been profiled. These areas
were developed in the most recent intercensal period (2011-2016) and provide an
insight into who is occupying new apartment developments. The areas profiled
were the Lachlan Precinct in the Green Square area of Waterloo, Central Park (the
former Kent Brewery) in Chippendale, Harold Park in Forest Lodge and Mascot
Central. The key findings were:
• The 2016 population of the profiled areas was dominated by young adults.
• All developments had more than 87% of their population under the age of
49. There were however some notable differences between the
developments.
• Central Park has a significantly higher proportion of 15-24 year olds, a
result of its location near UTS and Sydney University.
• Lachlan Precinct had a higher proportion of 30-34 year olds.
• Harold Park and Mascot Central had over 5% of their population between
0 and 4 years olds.
Figure 70 Age profile – Waterloo and new developments (2016)
Lachlan Precinct

Waterloo South – Population Study
80
Other benchmark areas – household types
All developments had high proportions of lone person and couple without
children households.
Central Park had a particularly high proportion of lone person households. This is
influenced by the dwelling format of the development. Harold Park and Mascot
Central had noticeably higher proportions of couple with children households.
The prospect of these households ageing in these developments rather than
moving to separate households elsewhere will be an interesting trend to observe
over time. Lachlan Precinct had a high proportion of couple without children
households at around 40%.
Figure 71 Household profile – Waterloo and new developments (2016)
Lachlan Precinct

Waterloo South – Population Study
81
Other benchmark areas – dwelling sizes
All developments had high proportions of one and two-bedroom dwellings.
Central Park has a focus on smaller format dwellings. Nearly two thirds of
dwellings are bedsit or one-bedroom dwellings. Harold Park and Mascot Central
had higher proportions of three-bedroom dwellings which correlates with the
noticeably higher proportions of couple with children households. Lachlan
Precinct had a similar proportion of one and two bedroom dwellings.
Figure 72 Dwelling size profile – Waterloo and new developments (2016)
Lachlan Precinct
Waterloo South – Population Study
82
3.9 Employment benchmarks
This section presents several inner urban benchmarks to understand the possible
employment outcomes of the Waterloo Precinct. The benchmark areas include:
• Waterloo Crown Square
• Rhodes
• Kings Cross/Potts Point
• Pyrmont North
• Pyrmont South
• Mascot
As Waterloo South is planned to be a predominately residential location and is
located in close proximity to existing and planned knowledge worker hubs it is
likely to generate jobs primarily in population servicing industries9.
It is likely given the proximity to other larger employment nodes that Waterloo
precinct would be on the lower side and be comparative to Waterloo Crown
Square. Waterloo Crown Square was developed approximately 15 years ago to a
density of 365 residents per hectare over an area of almost 13 hectares and
includes primarily population servicing employment (in addition to a car
showroom).
9 Population servicing industries defined as those that work to serve a residential population base e.g. retail, education, health services. See Appendix for full list)
Waterloo South – Population Study
83
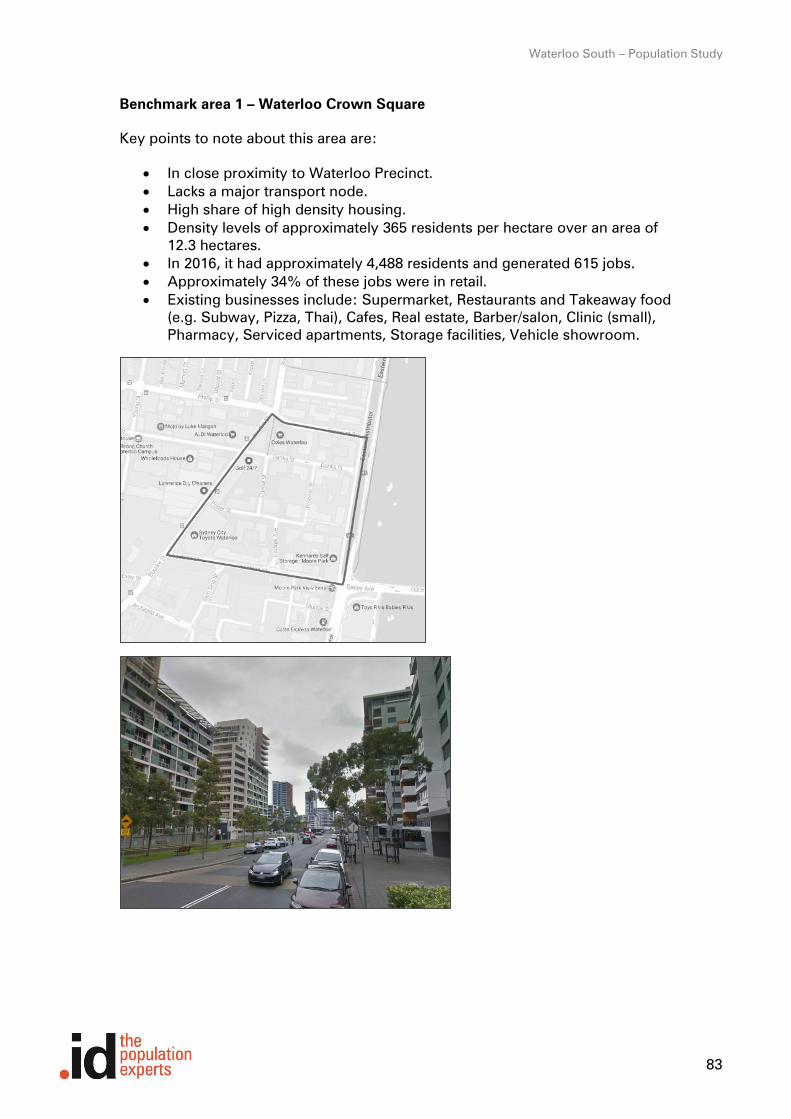
Benchmark area 1 – Waterloo Crown Square
Key points to note about this area are:
• In close proximity to Waterloo Precinct.
• Lacks a major transport node.
• High share of high density housing.
• Density levels of approximately 365 residents per hectare over an area of
12.3 hectares.
• In 2016, it had approximately 4,488 residents and generated 615 jobs.
• Approximately 34% of these jobs were in retail.
• Existing businesses include: Supermarket, Restaurants and Takeaway food
(e.g. Subway, Pizza, Thai), Cafes, Real estate, Barber/salon, Clinic (small),
Pharmacy, Serviced apartments, Storage facilities, Vehicle showroom.

Waterloo South – Population Study
84
Benchmark area 2 – Rhodes
Key points to note about this area are:
• Existing medium density and planned high density residential
environment.
• Adjacent to transport node and shopping centre with large box retail
stores (IKEA; Target).
• Density levels of approximately 300 residents per hectare over an area of
37 hectares (excl. shopping centre), but rising to 373/h by 2036.
• In 2016, it had approximately 11,151 residents and the broader area
including the supermarket and commercial offices generated 4,112 jobs.
• Existing businesses in residential area include: Convenience stores,
Restaurants and Takeaway food (e.g. Chinese, Italian), Cafes, Real estate,
Kindergarten, Medical clinic, Salon, Serviced apartments.
• 23% of these jobs were in retail or hospitality; 13% in Financial and
Insurance Services; 10% in Wholesale; 9% in Information Media and
Telecommunications.
Waterloo South – Population Study
85
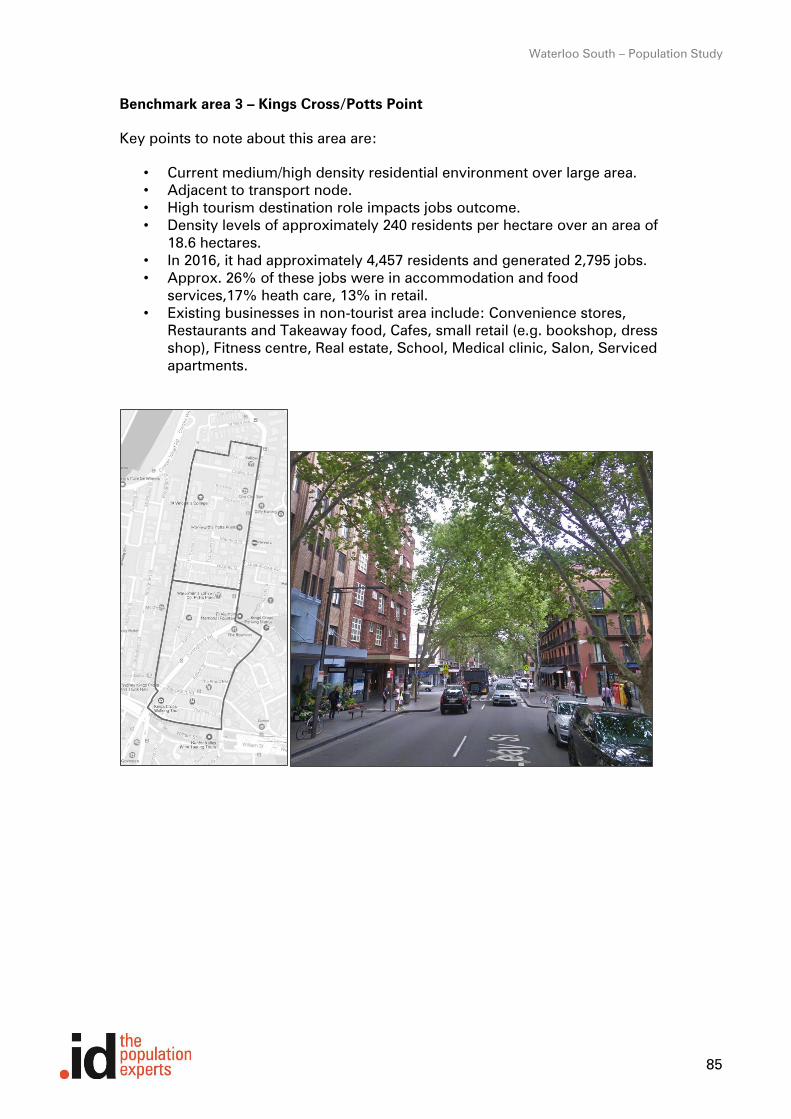
Benchmark area 3 – Kings Cross/Potts Point
Key points to note about this area are:
• Current medium/high density residential environment over large area.
• Adjacent to transport node.
• High tourism destination role impacts jobs outcome.
• Density levels of approximately 240 residents per hectare over an area of
18.6 hectares.
• In 2016, it had approximately 4,457 residents and generated 2,795 jobs.
• Approx. 26% of these jobs were in accommodation and food
services,17% heath care, 13% in retail.
• Existing businesses in non-tourist area include: Convenience stores,
Restaurants and Takeaway food, Cafes, small retail (e.g. bookshop, dress
shop), Fitness centre, Real estate, School, Medical clinic, Salon, Serviced
apartments.

Waterloo South – Population Study
86
Benchmark area 4 – Pyrmont North
Key points to note about this area are:
• Current med/high density residential environment.
• Adjacent to transport nodes (light rail).
• Density levels of approximately 184 residents per hectare over an area of
19 hectares.
• In 2016, it had approximately 3,511 residents and generated 2,742 jobs.
• Approx. 52% of these jobs were in Information Media and
Telecommunications (Network Ten), 19% in Professional, Scientific and
Technical Services.
• Existing businesses excluding large commercial ones include:
Convenience stores, Restaurants and Takeaway food, Pubs, Cafes, small
retail, Community centre, Real estate.

Waterloo South – Population Study
87
Benchmark area 5 – Pyrmont South
Key points to note about this area are:
• Current med/high density residential environment.
• Adjacent to transport nodes (light rail) and inclusive of freeway.
• Density levels of approximately 315 residents per hectare over an area of
10.8 hectares (Western Distributor removed).
• In 2016, it had approximately 3,409 residents and generated 1,220 jobs.
• Approx. 27% of these jobs were in in Professional, Scientific and Technical
Services, 15% in Information Media and Telecommunications, and 10% in
Administration and Support Services.
• Other existing businesses include: Convenience stores, Restaurants and
Takeaway food, Cafes, Small retail, Adult learning, Accommodation, Co-
working space, Real estate, Serviced apartments, Car hire.

Waterloo South – Population Study
88
Benchmark area 6 – Mascot
Key points to note about this area are:
• Current high density residential environment.
• Adjacent to major transport gateway and employment node of Sydney
Airport.
• Density levels of approximately 300 residents per hectare in high
residential area, but very low outside of this.
• In 2016, the broad destination zone area had approximately 6,165
residents and generated a substantial 18,060 jobs
• Approx. 48% of these jobs were in Transport, Postal and Warehousing due
to the airport. Of the remaining jobs, 13% were in Retail Trade and 13% in
Administrative and Support Services.
• Existing businesses in the high residential area include: Supermarket,
Convenience stores, Restaurants and Takeaway food, Cafes, Small retail,
Pharmacy, Accommodation, Gymnasium, Hairdressers, Real estate,
Serviced apartments, Car hire.

Waterloo South – Population Study
89
Comparative overview
The different case study areas present variant employment outcomes as expected
based on their location and the relevant historical and existing functional role of
that location.
As Waterloo Precinct is planned to be a predominately residential location and is
located in close proximity to existing and planned knowledge worker hubs it is
likely to generate jobs primarily in population servicing industries10
. Disregarding
Kings Cross/Potts Point (tourism role) and Mascot (Airport influence), it would
appear that a ratio of 0.08 – 0.1 population servicing jobs per person is an
appropriate estimate for a high-density residential area. This of course has the
potential to rise considerably if a larger scale shopping centre is
attracted/incorporated.
However, every area studied attracts additional non-population servicing jobs too,
ranging from a marginal addition in Waterloo Crown Square, to substantial job
numbers in the case of Rhodes, Pyrmont North and Mascot.
It is likely given the proximity to other larger employment nodes that Waterloo
precinct would be on the lower side and be comparative to Waterloo Crown
Square.
10 Population servicing industries defined as those that work to serve a residential population base e.g. retail, education, health services. See Appendix for full list)

90
Waterloo Crown
Square
Rhodes Kings Cross/Potts Point Pyrmont North Pyrmont South Mascot
Density 365/ha 300/ha (residential area); forecast to
increase to 373/ha
240/ha 184/ha 315/ha 300/ha in residential area;
outside of that – very low
Jobs to
pop ratio
Pop
servicing
jobs/pop
0.14
0.103
<0.05 in residential area; 0.37 if
including commercial/shopping
centre
0.08 in residential area; 0.14 if
including commercial/shopping
centre
0.62
0.453
0.78
0.085
0.36
0.088
2.93
0.581
Industry
structure
Predominately retail
and also high share of
accommodation and
food services
Predominately population based
industries (retail, health, education)
in residential area but very high
share information media and
professional services in commercial
centre
Large share of
accommodation and food
services (obvious tourism,
night-time entertainment
role) and high shares of
other population based
industries
Very high share
information
media and
professional
services
Very high share
information
media and
professional
services
Extremely high share of
Transport, Postal and
Warehousing jobs due to
proximity of Airport.
Makes jobs comparisons in
non-residential area a poor
benchmark
Table 3 Employment outcomes at relevant benchmarks
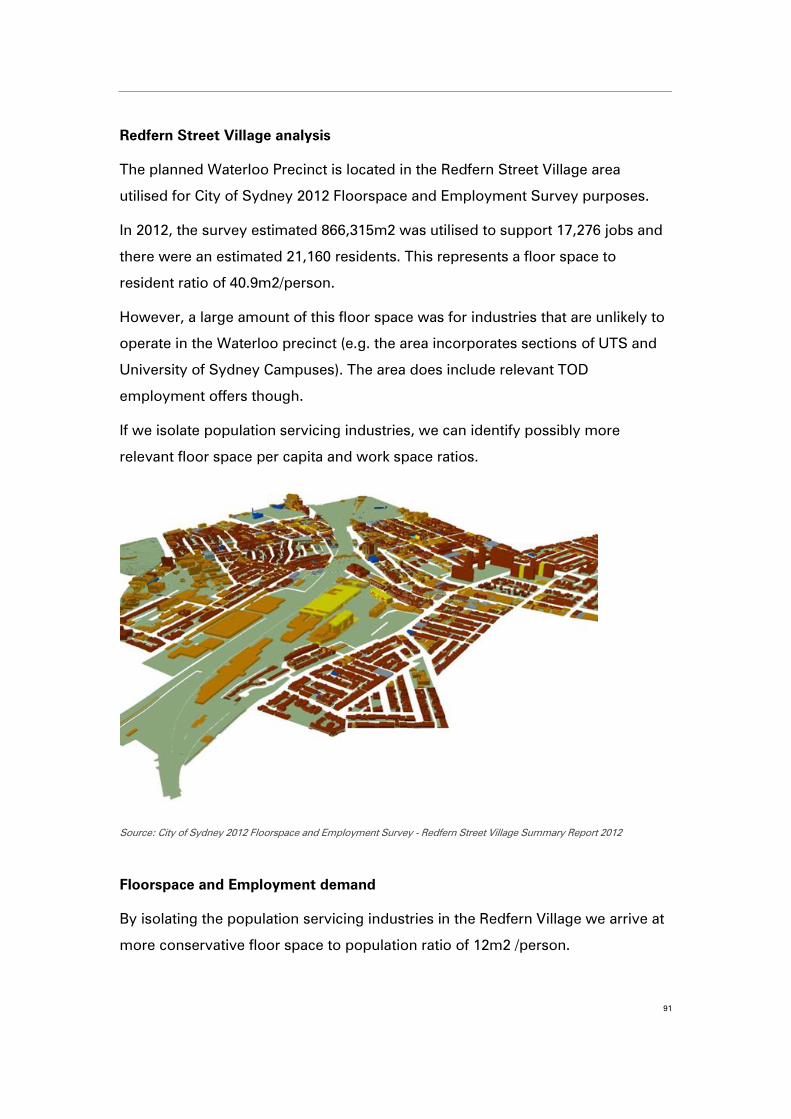
91
Redfern Street Village analysis
The planned Waterloo Precinct is located in the Redfern Street Village area
utilised for City of Sydney 2012 Floorspace and Employment Survey purposes.
In 2012, the survey estimated 866,315m2 was utilised to support 17,276 jobs and
there were an estimated 21,160 residents. This represents a floor space to
resident ratio of 40.9m2/person.
However, a large amount of this floor space was for industries that are unlikely to
operate in the Waterloo precinct (e.g. the area incorporates sections of UTS and
University of Sydney Campuses). The area does include relevant TOD
employment offers though.
If we isolate population servicing industries, we can identify possibly more
relevant floor space per capita and work space ratios.
Source: City of Sydney 2012 Floorspace and Employment Survey - Redfern Street Village Summary Report 2012
Floorspace and Employment demand
By isolating the population servicing industries in the Redfern Village we arrive at
more conservative floor space to population ratio of 12m2 /person.
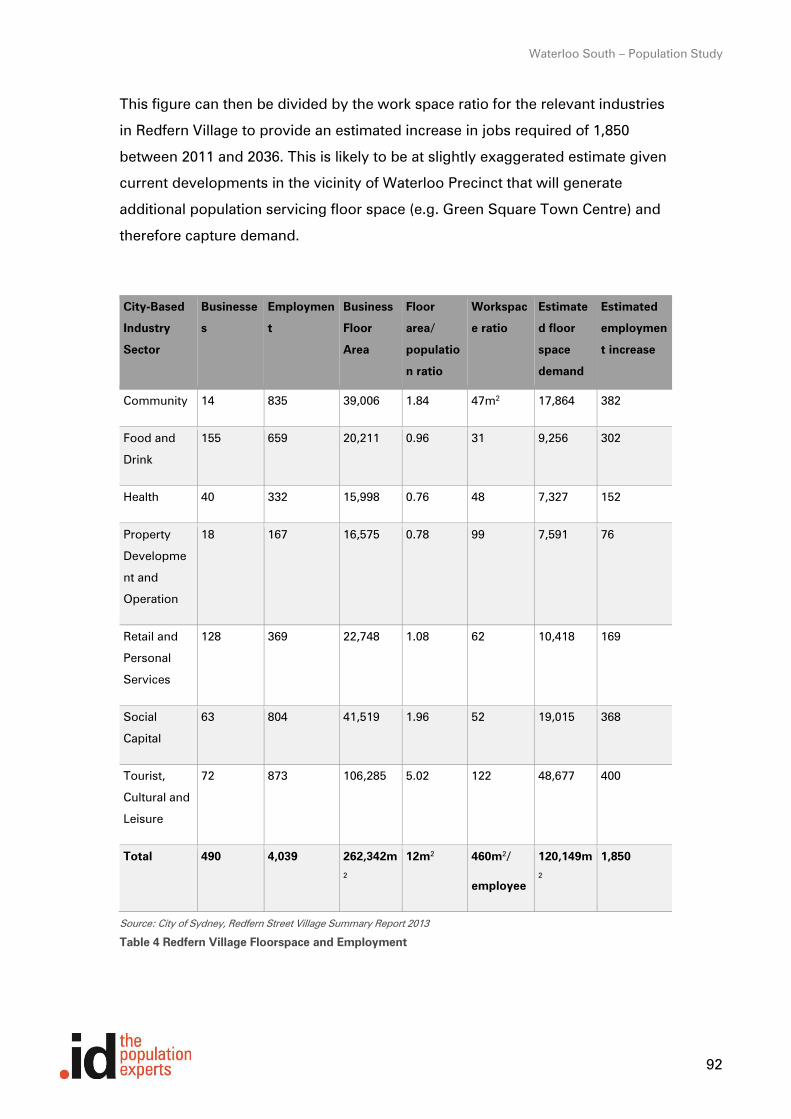
Waterloo South – Population Study
92
This figure can then be divided by the work space ratio for the relevant industries
in Redfern Village to provide an estimated increase in jobs required of 1,850
between 2011 and 2036. This is likely to be at slightly exaggerated estimate given
current developments in the vicinity of Waterloo Precinct that will generate
additional population servicing floor space (e.g. Green Square Town Centre) and
therefore capture demand.
City-Based
Industry
Sector
Businesse
s
Employmen
t
Business
Floor
Area
Floor
area/
populatio
n ratio
Workspac
e ratio
Estimate
d floor
space
demand
Estimated
employmen
t increase
Community 14 835 39,006 1.84 47m2 17,864 382
Food and
Drink
155 659 20,211 0.96 31 9,256 302
Health 40 332 15,998 0.76 48 7,327 152
Property
Developme
nt and
Operation
18 167 16,575 0.78 99 7,591 76
Retail and
Personal
Services
128 369 22,748 1.08 62 10,418 169
Social
Capital
63 804 41,519 1.96 52 19,015 368
Tourist,
Cultural and
Leisure
72 873 106,285 5.02 122 48,677 400
Total 490 4,039 262,342m
2
12m2 460m2/
employee
120,149m
2
1,850
Source: City of Sydney, Redfern Street Village Summary Report 2013
Table 4 Redfern Village Floorspace and Employment
Waterloo South – Population Study
93
3.10 Forecasts without the planning proposal
This section provides forecasts for the Waterloo Precinct, without the Planning
Proposal. Please note that these forecasts refer to a different area than presented
in Section 4.
It is important that this is not a ‘no development’ scenario as the area was already
expected to experience housing development. As such, this scenario is based on
the dwelling change assumptions made for the Waterloo Precinct as part of the
most recent set of small area forecasts (forecast.id) prepared for the City of
Sydney, prior to the development of the Planning Proposal.
The City of Sydney forecasts are undertaken for 15 small areas. The Waterloo
precinct is part of the Redfern Street (Redfern Waterloo) small area. This area
comprises the study area as well as Darlington, Eveleigh, the western half of
Redfern and most of Waterloo. In 2011, the precinct comprised 23% of the
Redfern Street (Redfern-Waterloo) small area.
3.11 Population and households
3.11.1 Assumptions
Births and deaths, age specific migration:
• Assumptions about births and deaths and age specific migration are
identical to those in the draft forecasts for Waterloo Precinct. As the City of
Sydney forecasts were prepared for the larger area of Redfern Street
(Redfern Waterloo), there were no previous site-specific assumptions
made solely for the Waterloo Precinct.
Net dwelling change:
• Assumptions about residential development for the Waterloo Precinct
base case scenario used the site assumptions from the City of Sydney
forecasts (forecast.id). They assumed a net increase of 5,000 dwellings
between 2018 and 2036. This is compared to the Waterloo Precinct draft
forecast assumptions of 5,533 net dwellings from 2020 to 2036.
3.11.2 Results
The Without the Planning Proposal scenario forecasts for the Waterloo Precinct
see an increase in population from 3,241 in 2011 to 11,976 in 2036. This forecast
is based on an increase of 5,000 dwellings in net terms between 2018 and 2036.
This scenario differs from the Planning Proposal scenario only in terms of net
change to dwellings.
Similar to the Planning Proposal scenario:
• average household size is expected to increase from 1.60 in 2011 to 1.75 in
2036 based on the addition of significant numbers of private dwellings of
two or more dwellings attracting larger households.

Waterloo South – Population Study
94
• the area is expected to attract younger adult age groups, primarily to the
private dwellings, as well as a broader range of older ages to the
affordable and social housing component. The largest forecast increases
by age are in the 20-44 age bracket.
• all household types are expected to increase to 2016, with the largest
numerical increase in lone person households. Percentage wise however,
couples without children are expected to increase from 13 to 23% of
households over the forecast period.
Waterloo Precinct 2011 2016 2021 2026 2031 2036
Population 3,241 3,259 3,600 6,368 9,423 11,976
Change in pop. (5yrs) 190 18 341 2,768 3,055 2,552
Average annual % change 1.2% 0.1% 2.0% 12.1% 8.2% 4.9%
Households 2,024 2,024 2,170 3,716 5,398 6,823
Change in households (5yrs) 53 0 146 1,547 1,682 1,425
Average h/hold size 1.60 1.61 1.66 1.71 1.74 1.75
Table 5 Forecast summary – Waterloo Precinct – Without Planning Proposal Scenario

Waterloo South – Population Study
95
Figure 73 Age structure, Waterloo Precinct, 2011-2036 – Without Planning Proposal Scenario
2011 2016 2021 2026 2031 2036
0 to 4 98 105 109 231 434 589
5 to 9 59 91 99 114 191 307
10 to 14 81 73 95 109 124 174
15 to 19 115 118 135 222 268 295
20 to 24 188 174 241 606 825 920
25 to 29 222 197 277 911 1,369 1,581
30 to 34 168 182 223 690 1,215 1,518
35 to 39 168 158 193 425 783 1,102
40 to 44 184 177 180 329 528 760
45 to 49 207 215 218 280 422 585
50 to 54 252 264 275 343 428 558
55 to 59 239 292 311 423 519 612
60 to 64 300 257 308 447 592 699
65 to 69 243 276 249 391 550 690
70 to 74 270 204 234 279 431 578
75 to 79 217 209 167 241 309 444
80 to 84 132 151 150 161 231 293
85 to 89 64 78 92 111 138 189
90 and over 35 39 45 56 69 82
Total population 3,241 3,259 3,600 6,368 9,423 11,976
Table 6 Age forecast – Waterloo Precinct – Without Planning Proposal Scenario

Waterloo South – Population Study
96
Figure 74 Household forecast – Waterloo Precinct –Without Planning Proposal Scenario
2011 2016 2021 2026 2031 2036
Couple families with children 90 89 120 212 338 442
Couples without children 262 268 345 817 1,239 1,593
One parent families 226 214 215 266 390 510
Other families 51 51 49 69 102 122
Lone person households 1,296 1,300 1,306 2,025 2,844 3,571
Group households 100 102 135 327 485 585
Total households 2,024 2,024 2,170 3,716 5,398 6,823
Table 7 Household forecasts – Waterloo Precinct – Without Planning Proposal Scenario
Figure 75 Net migration profile – Waterloo Precinct – Without Planning Proposal Scenario
Waterloo South – Population Study
97
3.11.3 No development scenario
The base case scenario above is not a “no development” scenario. However, if
the Planning Proposal change to the floor space ratio did not occur the base case
scenario would not be achieved. Under the status quo (no planning changes), the
Waterloo Precinct would experience much slower growth in population and
dwellings. The demographic profile would also be much older as resident’s age in
place with little opportunity for inward migration.
3.12 Employment
3.12.1 Assumptions
This section provides employment projections for the Waterloo Precinct
(Waterloo TZ area) without the Planning Proposal. This forecast is based on an
analysis of Bureau of Transport Statistics (BTS) employment projections. We
believe this is the most likely outcome that would occur Without the Planning
Proposal. This is because employment growth would be more ad-hoc and not
part of a coordinated effort across stakeholders.
The projections are based largely on the local population service offer using .id
population forecasts (Without Planning Proposal Scenario) as the main
employment driver. Planning and development decisions that impact the
provision of commercial office space (for example) would influence employment
numbers.
3.12.2 Results
Under an adjusted BTS Forecasts method, an extra 372 jobs would be created
between 2011 and 2036, resulting in approximately 1,070 jobs. This results in a
slower and lower employment outcome compared to the Planning Proposal
Scenario.

Waterloo South – Population Study
98
Employment estimates 2011 2016 2021 2026 2031 2036 Net
additional
2011 -
2036
1. Adjusted BTS
(without Planning
Proposal scenario)
698 701 703 787 909 1,070 +372
Table 8 Employment forecasts – Waterloo Precinct – Without Planning Proposal Scenario
3.12.3 No development scenario
The base case scenario above is not a “no development” scenario. However, if
the Planning Proposal change to the floor space ratio did not occur the base case
scenario would not be achieved. Under the status quo (no planning changes), the
Waterloo Precinct would experience much slower growth in employment, and
possibly employment decline given the older demographic profile of the Waterloo
Precinct under the Without Planning Proposal Scenario.

Waterloo South – Population Study
99
4. Waterloo South Forecasts
4.1 Study area definition
This section presents the population and employment projections for Waterloo
South. We have relied on the demographic and economic analysis in stage 1
(section 3 of this report) and applied this to the revised land use assumptions for
the Waterloo South. The map below illustrates the forecast area used in this
section.
4.2 Population and housing forecasts
This section provides population and household forecasts for the Waterloo South
area. The forecasts are developed using .id’s forecasting model that incorporates
our detailed understanding of the drivers of demographic change as well as
specific input provided by project stakeholders. Please note: these forecasts are
based on key assumptions provided by the Land and Housing Corporation NSW.
Assumptions of timing of dwelling construction and dwelling format (number of
bedrooms) are key inputs. Changes to these assumptions would result in different
forecast results.
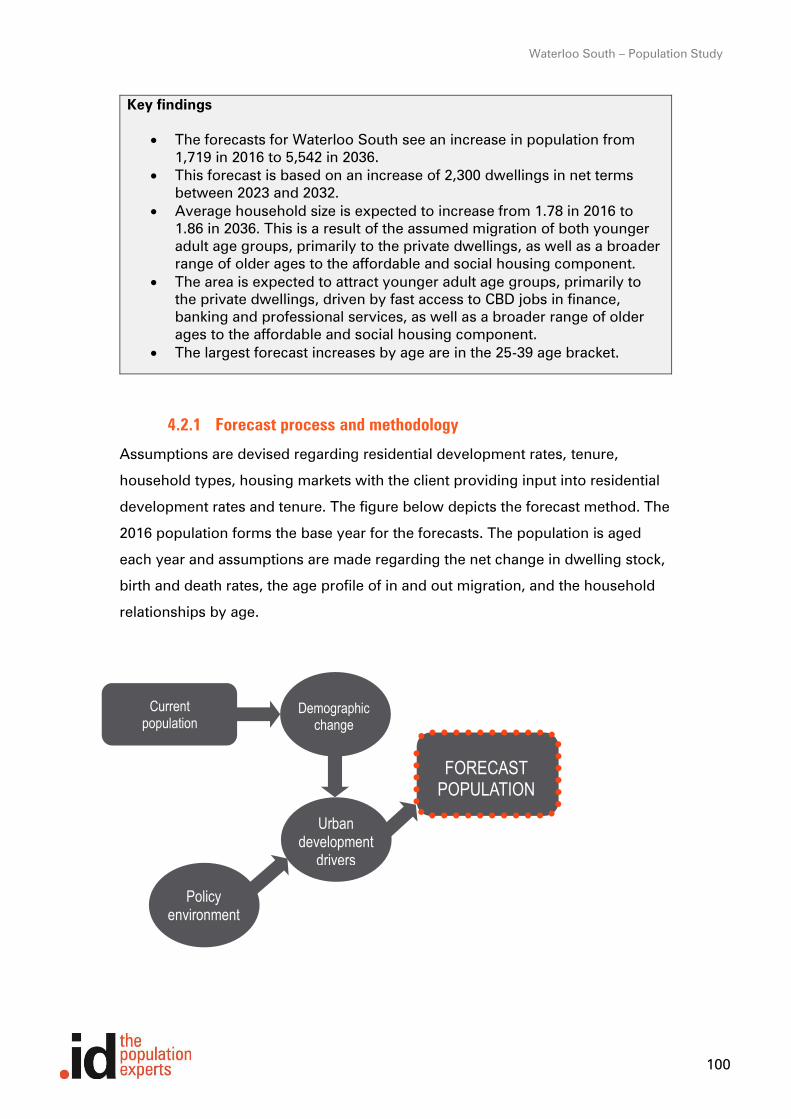
Waterloo South – Population Study
100
Key findings
• The forecasts for Waterloo South see an increase in population from
1,719 in 2016 to 5,542 in 2036.
• This forecast is based on an increase of 2,300 dwellings in net terms
between 2023 and 2032.
• Average household size is expected to increase from 1.78 in 2016 to
1.86 in 2036. This is a result of the assumed migration of both younger
adult age groups, primarily to the private dwellings, as well as a broader
range of older ages to the affordable and social housing component.
• The area is expected to attract younger adult age groups, primarily to
the private dwellings, driven by fast access to CBD jobs in finance,
banking and professional services, as well as a broader range of older
ages to the affordable and social housing component.
• The largest forecast increases by age are in the 25-39 age bracket.
4.2.1 Forecast process and methodology
Assumptions are devised regarding residential development rates, tenure,
household types, housing markets with the client providing input into residential
development rates and tenure. The figure below depicts the forecast method. The
2016 population forms the base year for the forecasts. The population is aged
each year and assumptions are made regarding the net change in dwelling stock,
birth and death rates, the age profile of in and out migration, and the household
relationships by age.
Current population
Demographic change
Urban development
drivers
FORECAST POPULATION
Policy environment

Waterloo South – Population Study
101
4.2.2 Forecast inputs
Drivers of change – metropolitan and regional
At a metropolitan and regional level, overseas migration is the key driver of
migration change particularly in inner metropolitan areas. New South Wales has
traditionally attracted a significant share of Australia’s overseas intake and this is
expected to continue. The Waterloo area’s access to significant numbers of jobs
in both inner Sydney as well as the airport precinct are key drivers of residential
demand in this area.
Drivers of change – local inputs to model - Births and deaths
These are based on the assumptions used for the City of Sydney forecasts for the
Redfern Street (Redfern-Waterloo) small area. The Redfern Street (Redfern-
Waterloo) small area comprises the study area as well as Darlington, Eveleigh, the
western half of Redfern and most of Waterloo. In 2016, the precinct comprised
8.4% of the Redfern Street (Redfern-Waterloo) small area. The birth and death
rates for the larger area are preferred for this analysis. This is because the
precinct’s characteristics after redevelopment will be more similar to the larger
area than its current demographic characteristics. This is based on the likely
eventual split between private and public housing and the likely age groups and
household types that will be living in the area.
Age specific migration
In terms of age specific migration, it is assumed that the private dwelling
component of the precinct will play a similar role to areas such as Green Square,
attracting 20-29 year olds in large numbers. Fast access to CBD jobs in finance,
banking and professional services will be a key driver here. There will be a
component of migration in the older ages of 45-69 consistent with the traditional
migration profile of the area. The social and affordable housing component of the
precinct at completion is 25% of total stock and it is assumed that this housing
will have a slightly different migration profile to the private dwelling stock.
Household structure
This is informed by both the nature of the dwelling stock proposed in terms of
number of bedrooms and the tenure type. It is assumed that household
Waterloo South – Population Study
102
relationships by age more closely reflects private housing areas such as Green
Square. The general result sees 18-29 year olds being more likely to be in lone
person, couple without children and group household relationships. There are
however still assumed to be some proportions of older adults (50+) assumed to
be in lone person households based on the social housing component of the
area. This has a dampening effect on overall average household size, with a 2036
average household size of 1.86 being lower than areas such as Ultimo, Pyrmont
and Green Square.
Non-private dwellings
Non private dwellings include institutional uses such as nursing homes, boarding
schools, prisons, military facilities etc. There are no non-private dwellings in the
area as at 2016, and none are assumed to be added over the forecast period.
Vacancy rates
Vacancy rates are assumed to increase slightly as new dwelling stock is
established before stabilising, going from 5.7% in 2024 to 6.4% in 2033. By 2036,
the vacancy rate is assumed to be 6.1%
Assumed dwelling change
The chart following shows the assumed residential development timings in these
forecasts. The total dwelling numbers, timings and tenure and were provided by
LAHC. Please note, these assumptions are based on the net impact of dwelling
change each year (completions – demolitions).

Waterloo South – Population Study
103
Figure 76 Dwelling inputs –Waterloo South
The chart below shows the forecast number of private dwellings11
in the Waterloo
South as a result of the demolition and addition activity presented in the chart
above. Vacancy rates are applied to these dwelling forecasts to estimate the
number of households. As at 2020, there were 874 dwellings in Waterloo South
(749 social, 125 private). This forms the base of the forecasts. Net change in
dwellings is then applied for each year of the forecasts.
These forecasts are based on ABS Census counts of dwellings in 2016 as the
starting point (1,024 dwellings). There is a discrepancy between this number and
what the Department of Planning, Industry and Environment understands is in the
Waterloo South area. To account for this, the model removes dwellings between
2016 and 2020 to ensure consistency with understood dwelling totals.
11 Includes occupied and vacant private dwellings of all tenure types.
-200
-100
0
100
200
300
400
500
600
700N
et d
we
llin
g c
ha
ng
e
year
Private market dwellings
Social dwellings
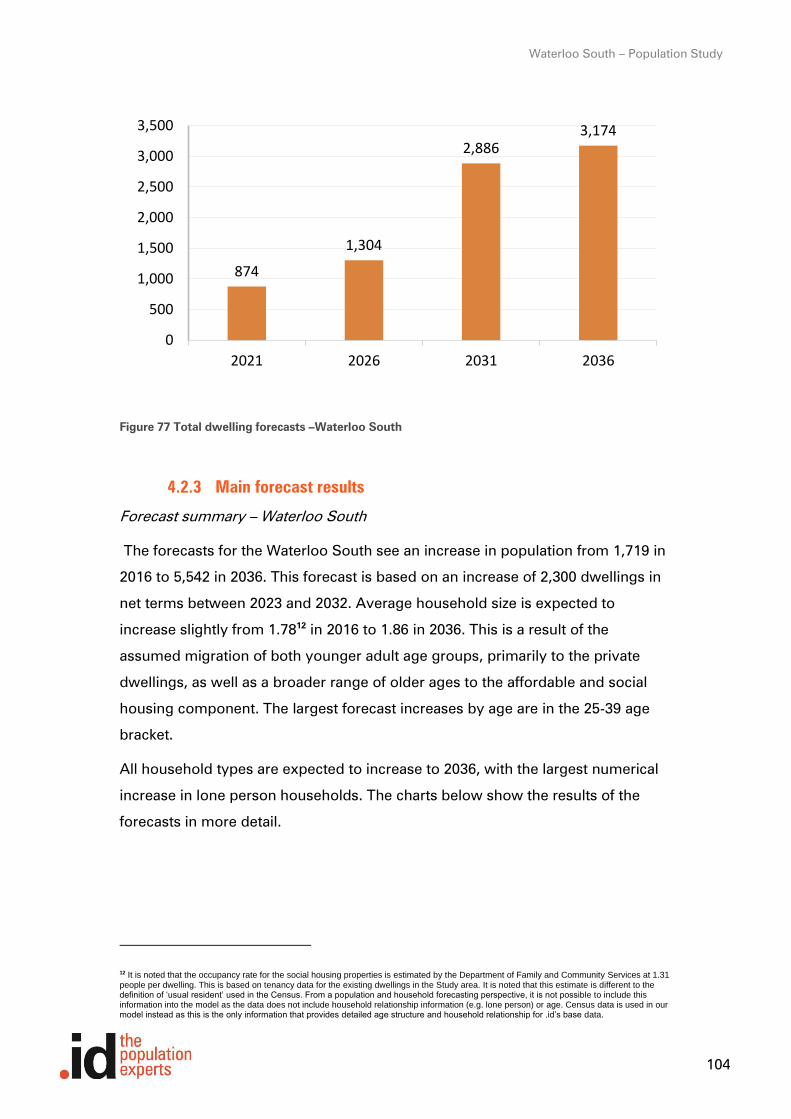
Waterloo South – Population Study
104
Figure 77 Total dwelling forecasts –Waterloo South
4.2.3 Main forecast results
Forecast summary – Waterloo South
The forecasts for the Waterloo South see an increase in population from 1,719 in
2016 to 5,542 in 2036. This forecast is based on an increase of 2,300 dwellings in
net terms between 2023 and 2032. Average household size is expected to
increase slightly from 1.7812
in 2016 to 1.86 in 2036. This is a result of the
assumed migration of both younger adult age groups, primarily to the private
dwellings, as well as a broader range of older ages to the affordable and social
housing component. The largest forecast increases by age are in the 25-39 age
bracket.
All household types are expected to increase to 2036, with the largest numerical
increase in lone person households. The charts below show the results of the
forecasts in more detail.
12 It is noted that the occupancy rate for the social housing properties is estimated by the Department of Family and Community Services at 1.31 people per dwelling. This is based on tenancy data for the existing dwellings in the Study area. It is noted that this estimate is different to the definition of ‘usual resident’ used in the Census. From a population and household forecasting perspective, it is not possible to include this information into the model as the data does not include household relationship information (e.g. lone person) or age. Census data is used in our model instead as this is the only information that provides detailed age structure and household relationship for .id’s base data.
874
1,304
2,8863,174
0
500
1,000
1,500
2,000
2,500
3,000
3,500
2021 2026 2031 2036
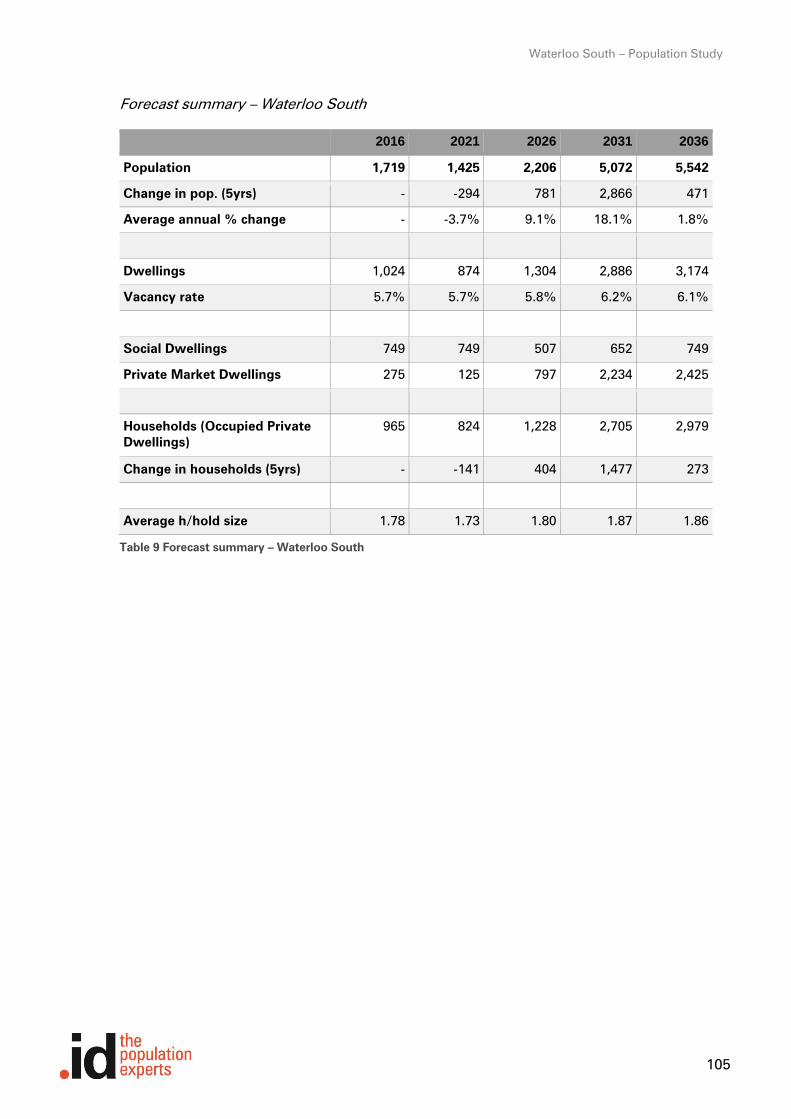
Waterloo South – Population Study
105
Forecast summary – Waterloo South
2016 2021 2026 2031 2036
Population 1,719 1,425 2,206 5,072 5,542
Change in pop. (5yrs) - -294 781 2,866 471
Average annual % change - -3.7% 9.1% 18.1% 1.8%
Dwellings 1,024 874 1,304 2,886 3,174
Vacancy rate 5.7% 5.7% 5.8% 6.2% 6.1%
Social Dwellings 749 749 507 652 749
Private Market Dwellings 275 125 797 2,234 2,425
Households (Occupied Private Dwellings)
965 824 1,228 2,705 2,979
Change in households (5yrs) - -141 404 1,477 273
Average h/hold size 1.78 1.73 1.80 1.87 1.86
Table 9 Forecast summary – Waterloo South

Waterloo South – Population Study
106
Forecast age structure– Waterloo South
2016 2021 2026 2031 2036
0 to 4 53 57 74 216 320
5 to 9 38 35 49 90 149
10 to 14 40 31 43 84 85
15 to 19 108 55 103 214 161
20 to 24 172 114 236 570 421
25 to 29 187 132 315 826 694
30 to 34 128 120 222 646 711
35 to 39 84 86 150 389 515
40 to 44 87 65 113 284 348
45 to 49 112 79 97 222 297
50 to 54 133 102 117 238 272
55 to 59 133 117 134 262 295
60 to 64 95 116 146 275 318
65 to 69 122 86 134 247 307
70 to 74 92 104 90 189 257
75 to 79 66 69 94 128 185
80 to 84 42 36 56 103 111
85 to 89 15 14 21 57 65
90 and over 11 6 12 32 31
Total population 1,719 1,425 2,206 5,072 5,542

Waterloo South – Population Study
107
Figure 78 Forecast age structure – Waterloo South
Figure 79 Forecast household structure – Waterloo South
0
100
200
300
400
500
600
700
800N
um
ber
of
peo
ple
Age group
2016 2026 2036
0
200
400
600
800
1,000
1,200
1,400
1,600
Couplefamilies with
children
Coupleswithoutchildren
One parentfamilies
Other families Lone personhouseholds
Grouphouseholds
Nu
mb
er
of
ho
useh
old
s
Household type
2016 2026 2036

Waterloo South – Population Study
108
Forecast household structure– Waterloo South
2016 2021 2026 2031 2036
Couple families with children 53 47 71 187 241
Couples without children 167 149 251 605 655
One parent families 126 87 102 222 260
Other families 17 13 24 57 53
Lone person households 495 460 667 1,348 1,501
Group households 106 68 113 286 268
Total households 965 824 1,228 2,705 2,979
Figure 80 Net migration by age profile – Waterloo South
-300
-200
-100
0
100
200
300
400
500
600
700
Num
ber
of
people
Age group
2017-2021
2022-2026
2027-2031
2032-2036
Waterloo South – Population Study
109
4.3 Employment projections
This section provides employment projections for the Waterloo South.
4.3.1 Overview
The stage 1 report presented three employment forecasts scenarios. This was
necessary as the economic role and function of the precinct was still being
defined.
We have now developed an updated employment projection for the Waterloo
South based on our understanding of the role and function and land use mix
proposed.
4.3.2 Methodology
The method used to forecast future employment at the Waterloo South is based
on estimated employment densities and the proposed land use mix presented in
the Turner Report. The timing of employment is based on the population
forecasts for the precinct.
This method involves:
• Estimating work space ratios (i.e. sqm per job) based on analysis of the
City of Sydney Census of Land Use and Employment data.
• Applying work space ratios to estimated land use mix – retail and non-
retail space.
• Estimating the number of residents who would work from home (e.g.
home based business)
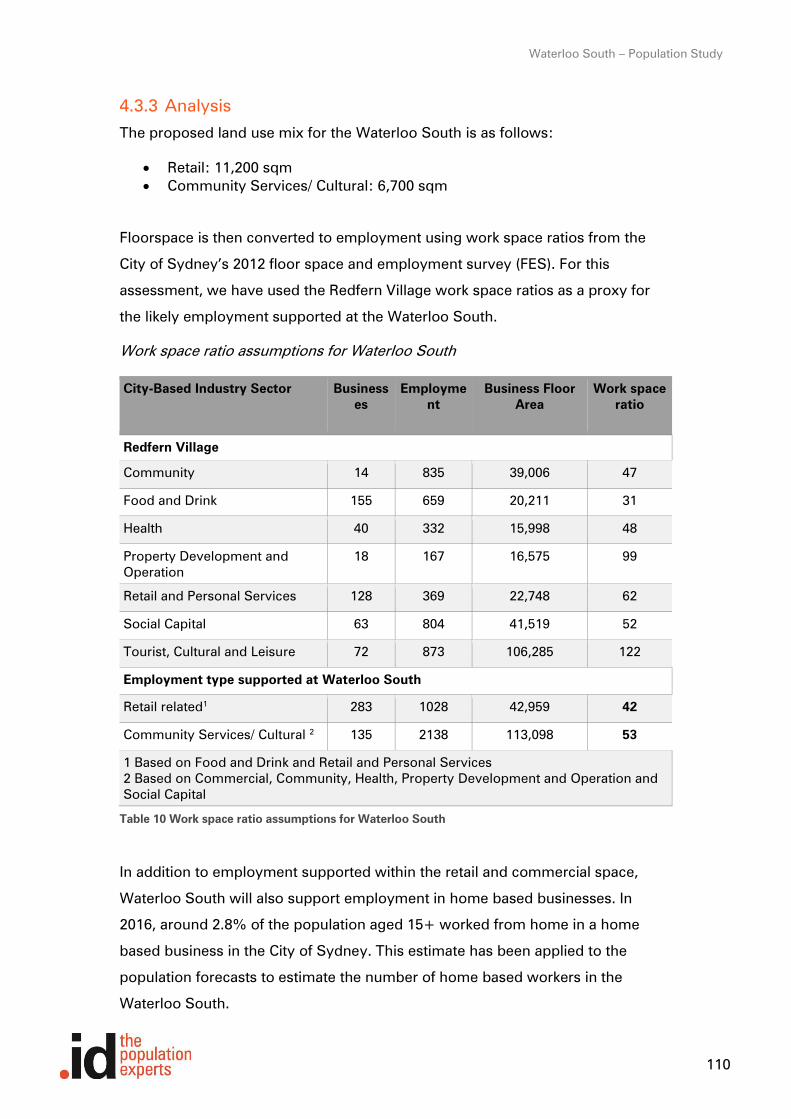
Waterloo South – Population Study
110
4.3.3 Analysis
The proposed land use mix for the Waterloo South is as follows:
• Retail: 11,200 sqm
• Community Services/ Cultural: 6,700 sqm
Floorspace is then converted to employment using work space ratios from the
City of Sydney’s 2012 floor space and employment survey (FES). For this
assessment, we have used the Redfern Village work space ratios as a proxy for
the likely employment supported at the Waterloo South.
Work space ratio assumptions for Waterloo South
City-Based Industry Sector Businesses
Employment
Business Floor Area
Work space ratio
Redfern Village
Community 14 835 39,006 47
Food and Drink 155 659 20,211 31
Health 40 332 15,998 48
Property Development and
Operation
18 167 16,575 99
Retail and Personal Services 128 369 22,748 62
Social Capital 63 804 41,519 52
Tourist, Cultural and Leisure 72 873 106,285 122
Employment type supported at Waterloo South
Retail related1 283 1028 42,959 42
Community Services/ Cultural 2 135 2138 113,098 53
1 Based on Food and Drink and Retail and Personal Services
2 Based on Commercial, Community, Health, Property Development and Operation and
Social Capital
Table 10 Work space ratio assumptions for Waterloo South
In addition to employment supported within the retail and commercial space,
Waterloo South will also support employment in home based businesses. In
2016, around 2.8% of the population aged 15+ worked from home in a home
based business in the City of Sydney. This estimate has been applied to the
population forecasts to estimate the number of home based workers in the
Waterloo South.

Waterloo South – Population Study
111
4.3.4 Results
The table below presents the employment projections for the Waterloo South.
Employment in the Waterloo South is projected to grow from 350 in 2016 to
around 760 by 2036. There will be a period of decline during the construction
phase of the project, but then grow in line with the timing and staging of the retail
and non-retail uses.
Employment projections - Waterloo South
2016 2021 2026 2031 2036
Total jobs 350 320 450 740 760
Table 11 Employment projections –Waterloo South
4.3.5 Potential employment opportunities
Based on our analysis of similar high density locations in Sydney, the forecast
population growth, and desired planning function of the precinct, we believe
employment opportunities will be largely focused in:
Health and aged care services
• A growing industry and considering the existing older demographics of
the area, there is a likely service need.
Community services
• Given the existing social housing tenure and the planned rapid population
growth, community facilities would be required.
Child care
• There is a forecast substantial increase in young working families with
younger children providing an obvious need for child care or even
kindergarten facilities.
Personal services
• A number of comparison areas supported beauty salons, hairdressers,
dry-cleaning etc.
• Local retail
• Every comparison area had a supply of small retail outlets and/or
convenience stores. The transport node would likely support a number of
like businesses.
Cafes/Restaurants and fast food

Waterloo South – Population Study
112
• Every comparison area had a supply of diverse café and food service
providers
Serviced apartments
• A number of comparison areas included the provision of serviced
apartments which would be supported by the proximity to a major
transport node.
Home based businesses
• There is a growing number of workers, especially in knowledge industries,
who are providing freelance work to larger companies.
Office space
• Given the location next to a transport node, some commercial office space
may be generated, or even co-working spaces.
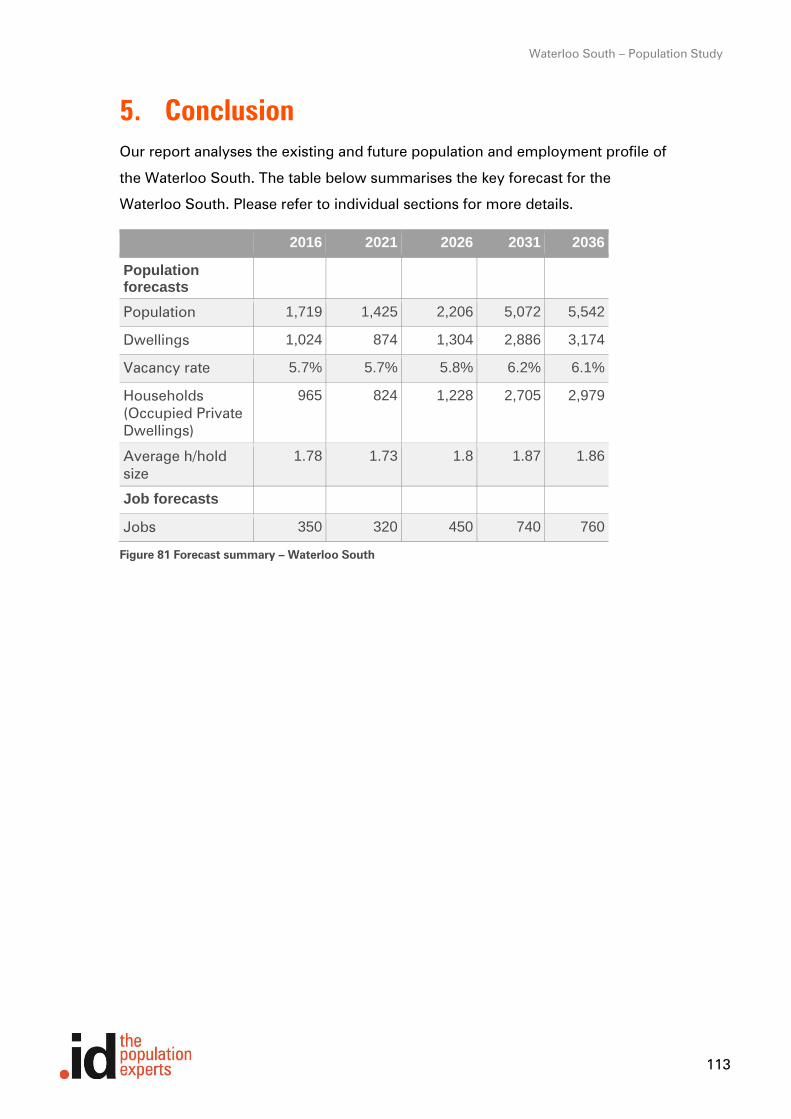
Waterloo South – Population Study
113
5. Conclusion Our report analyses the existing and future population and employment profile of
the Waterloo South. The table below summarises the key forecast for the
Waterloo South. Please refer to individual sections for more details.
2016 2021 2026 2031 2036
Population forecasts
Population 1,719 1,425 2,206 5,072 5,542
Dwellings 1,024 874 1,304 2,886 3,174
Vacancy rate 5.7% 5.7% 5.8% 6.2% 6.1%
Households
(Occupied Private
Dwellings)
965 824 1,228 2,705 2,979
Average h/hold
size
1.78 1.73 1.8 1.87 1.86
Job forecasts
Jobs 350 320 450 740 760
Figure 81 Forecast summary – Waterloo South
Waterloo South – Population Study
114
6. Appendix
6.1 Terminology
The following terms and acronyms are used in this report.
Waterloo SSP study area
Waterloo State Significant Precinct
Precinct/Waterloo Precinct
Geographic area for profile and employment projection purposes that includes
the Waterloo State Significant Precinct
CoS
City of Sydney
LGA
Local Government Area
Villages
City of Sydney Local Government Area Village Centre Geographies
DZN
Destination Zone (ABS Journey to Work small area geography)
ABS
Australian Bureau of Statistics
TZN

Waterloo South – Population Study
115
Travel Zone (BTS forecast small area geography)
BTS
Bureau of Transport Statistics
FES
Floor Space and Employment Survey
6.2 Geographic areas used in this report
The demographic and economic profile presented in this report is based on the
Waterloo Precinct area. The demographic profile of the Waterloo Precinct
presented in Section 4 is based on the following SA1’s: – 1133801, 1133802,
1133804, 1133806, 1133838, 1133839, 1133841. The economic and employment
profile is defined as the DZN 113381369 (ABS) and TZ 270 (NSW BTS). SA1’s
were not used for the economic analysis as Census data for Place of Work is not
available at this level.
The forecasts presented in Section 6 refer to the refer to the Waterloo South only
(highlighted by the blue boundary in the map below).
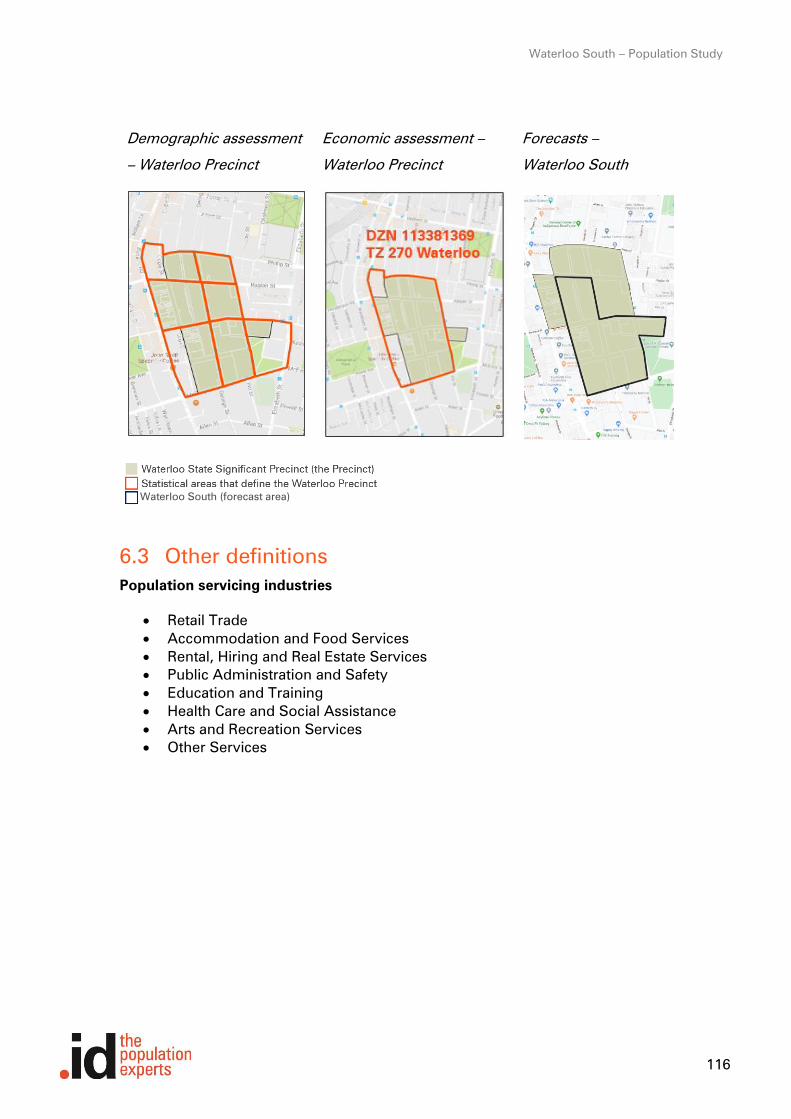
Waterloo South – Population Study
116
Demographic assessment
– Waterloo Precinct
Economic assessment –
Waterloo Precinct
Forecasts –
Waterloo South
6.3 Other definitions
Population servicing industries
• Retail Trade
• Accommodation and Food Services
• Rental, Hiring and Real Estate Services
• Public Administration and Safety
• Education and Training
• Health Care and Social Assistance
• Arts and Recreation Services
• Other Services
Waterloo South (forecast area)