Embed Size (px)
Citation preview
New York City Department of Health and Mental Hygiene Bureau of Communicable Disease
& New York City Department of Environmental Protection
Bureau of Water Supply
Waterborne Disease Risk Assessment Program
15th Semi-Annual Report (for January – June 2012)
August 31, 2012
Prepared in accordance with the United States Environmental Protection Agency Filtration Avoidance Determination
Prepared by:
Sharon Balter, M.D. - DOHMH Daniel Cimini, R.N., C.P.H. - DOHMH Lisa Alleyne, M.P.A. - DOHMH
Anne Seeley, M.P.H. - DEP With: David Lipsky, Trang Nguyen, Marc Paladini, and other members of the Waterborne Disease Risk Assessment Program Team
THE WATERBORNE DISEASE RISK ASSESSMENT PROGRAM TEAM
The Waterborne Disease Risk Assessment Program (WDRAP) is an interagency program involving the New York City Departments of Environmental Protection and Health and Mental Hygiene.
� New York City Department of Health and Mental Hygiene (DOHMH) Bureau of Communicable Disease (BCD)
42-09 28th Street, CN-22A, Queens, NY 11101-4132 Marcelle Layton, M.D., Assistant Commissioner Don Weiss, M.D., M.P.H., Medical Director, Surveillance & Data Analysis Unit Sharon Balter, M.D., Medical Director (WDRAP Coordinator for DOHMH) Daniel Cimini, R.N., C.P.H., City Research Scientist (WDRAP Asst. Coordinator) Lisa Alleyne, M.P.A., Public Health Epidemiologist Bureau of Communicable Disease: Ann Afordi, Erlinda Amoroso, Fazlul Chowdhury, Jennifer Hsieh, Muhammad Iftekharuddin, Lucretia Jones, Lan Li, Yin Ling Leung, Michelle Middleton, Trang Nguyen, Daniel Osuagwu, Marc Paladini, Jose Poy, Anna Smorodina, Renee Stewart, Rajmohan Sunkara
� New York City Department of Environmental Protection (DEP) Bureau of Water Supply
59-17 Junction Blvd., 20th Floor, Flushing, NY 11373-5108. David Lipsky, Ph.D., Chief, Distribution Water Quality Science & Research Division Anne Seeley, M.P.H., Section Chief, Health Assessment & Policy Coordination (WDRAP Coordinator for DEP)
========================================================= Additional copies of WDRAP reports are available from Anne Seeley at the DEP address listed above, by phone (718-595-5346), or E-mail: [email protected] Copies of the questionnaires used for disease surveillance are available from Daniel Cimini at the DOHMH address listed above, by phone (347-396-2623), or E-mail: [email protected]. The authors wish to acknowledge the dedication of the other members of the Waterborne Disease Risk Assessment Program Team, and the assistance of Kathleen Czarnogorski (DEP), Neeraja Nalamothu (DEP), Fran Guerriero (DEP), and Giselle Merizalde (DOHMH).
2 NYC DOHMH August 2012
WATERBORNE DISEASE RISK ASSESSMENT PROGRAM -- SEMI-ANNUAL REPORT (JANUARY – JUNE 2012) PART I: SURVEILLANCE FOR GIARDIASIS AND CRYPTOSPORIDIOSIS Introduction Under the Waterborne Disease Risk Assessment Program, New York City established active surveillance for giardiasis and cryptosporidiosis to ensure complete reporting of all laboratory-diagnosed cases of these potentially waterborne illnesses. Active laboratory surveillance, involving regular visits to or telephone contact with parasitology laboratories by DOHMH staff members, began in July 1993 for giardiasis and in November 1994 for cryptosporidiosis. (Adoption of a New York City Health Code amendment by the New York City Board of Health on November 16, 1993 made cryptosporidiosis a reportable disease in New York City, effective January 3, 1994.) Active laboratory-based surveillance for giardiasis and cryptosporidiosis continued in New York City through 2010. As noted in prior WDRAP reports, in January 2011 active laboratory surveillance for giardiasis and cryptosporidiosis was discontinued, as it had been replaced by an electronic reporting system. By January 2011 almost all NYC clinical laboratories were fully enrolled in the Electronic Clinical Laboratory Reporting System (ECLRS), which was developed in order to ensure more rapid and complete reporting of reportable conditions, including giardiasis and cryptosporidiosis. Electronic reporting provides timelier data than active laboratory surveillance, and is more complete than typical paper-based systems. This change in surveillance is not expected to have a significant impact on the completeness or quality of giardiasis and cryptosporidiosis surveillance data. Interviews of persons with giardiasis were routinely conducted through July 1995. Interviews of cryptosporidiosis case-patients have been conducted from January 1995 to the present. For all cryptosporidiosis cases, and as needed for giardiasis cases, public health epidemiologists contact case-patients to verify the data collected on the case report, to collect additional demographic and clinical information, and to identify possible sources of exposure. Part I of this report presents highlights from NYC’s parasitic disease surveillance program for this reporting period. Further details can be found in the tables and figures, which appear at the end of the report. Additional data will be provided in the Annual Report. For this report the population denominators used to calculate rates were intercensal population estimates for all years except 2000, and years 2010 to 2012. For the years 1994 through 1999, intercensal population estimates per year were used based upon linear interpolation between the 1990 and 2000 US Census.1 For the years 2001 through 2009, intercensal population estimates for each year were used from data produced by DOHMH based on the US Census Bureau Population Estimate Program and housing unit data obtained from the NYC Department of City Planning.2 For 2010 to 2012, the year 2010 US Census data were used.3 Because rates for the years 2001 1 See http://sasebiweb100.health.dohmh.nycnet/EpiQuery/Census/index.html 2 See http://sasebiweb100.health.dohmh.nycnet/EpiQuery/Census/index2001.html 3 See http://2010.census.gov/news/press-kits/summary-file-1.html
3 NYC DOHMH August 2012
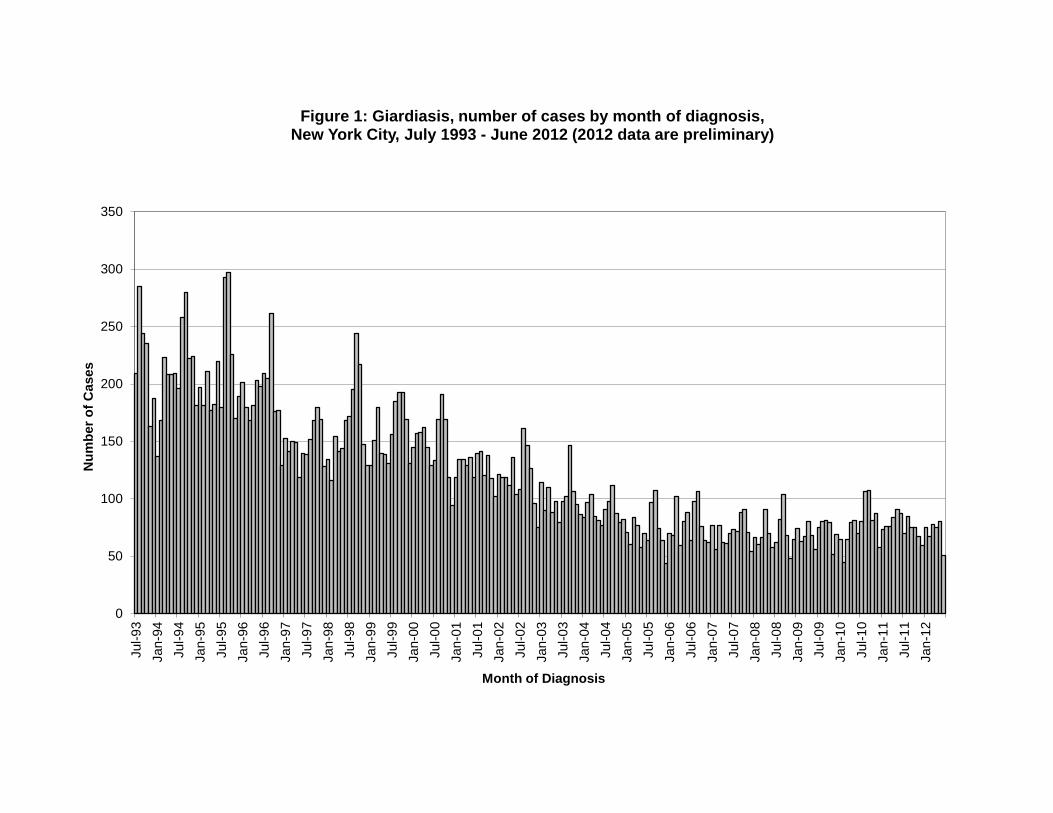
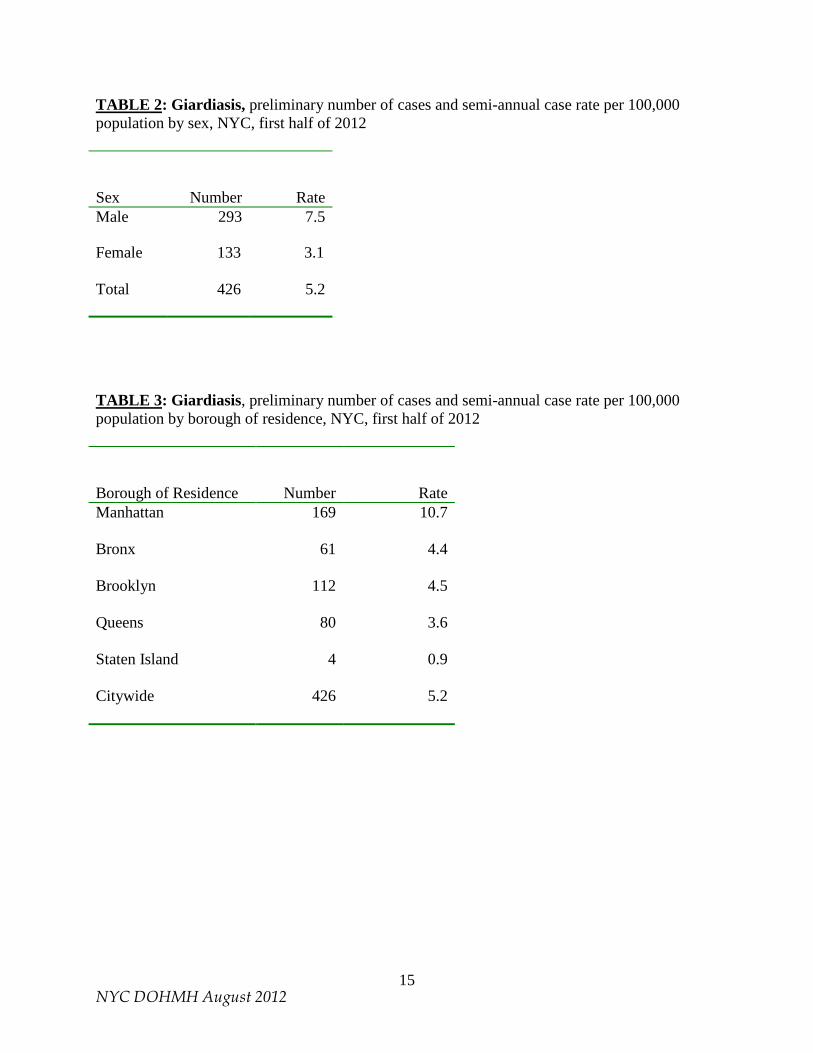
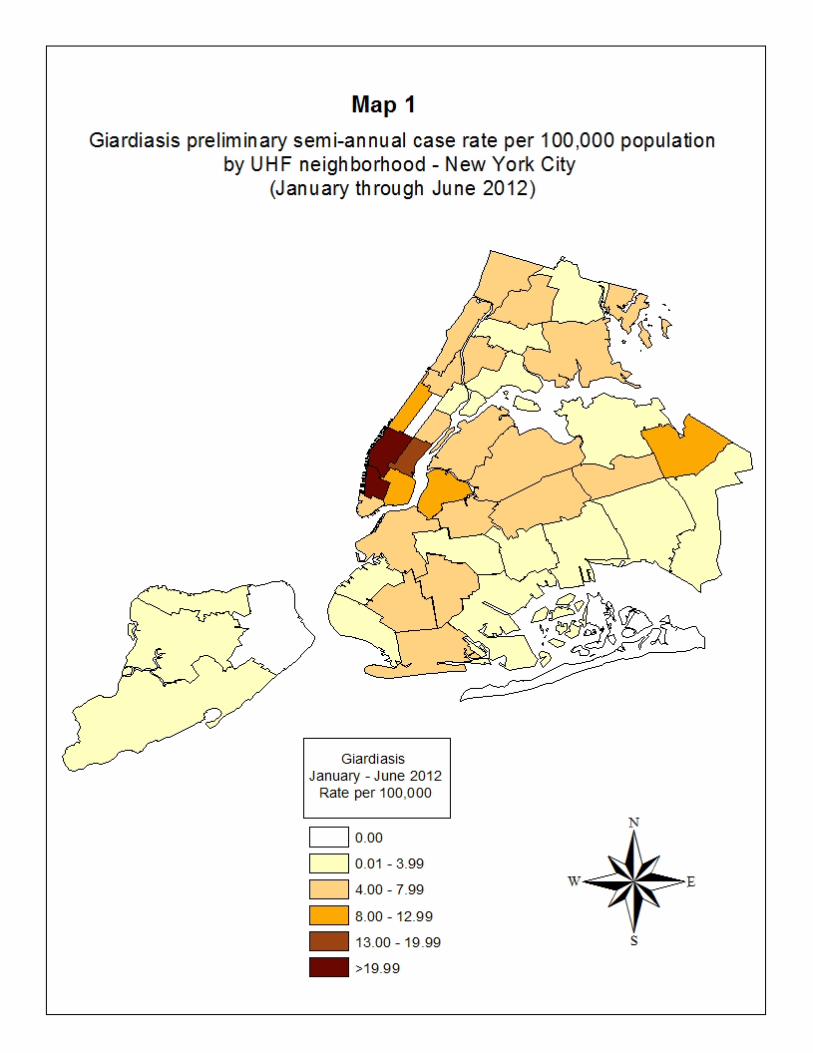
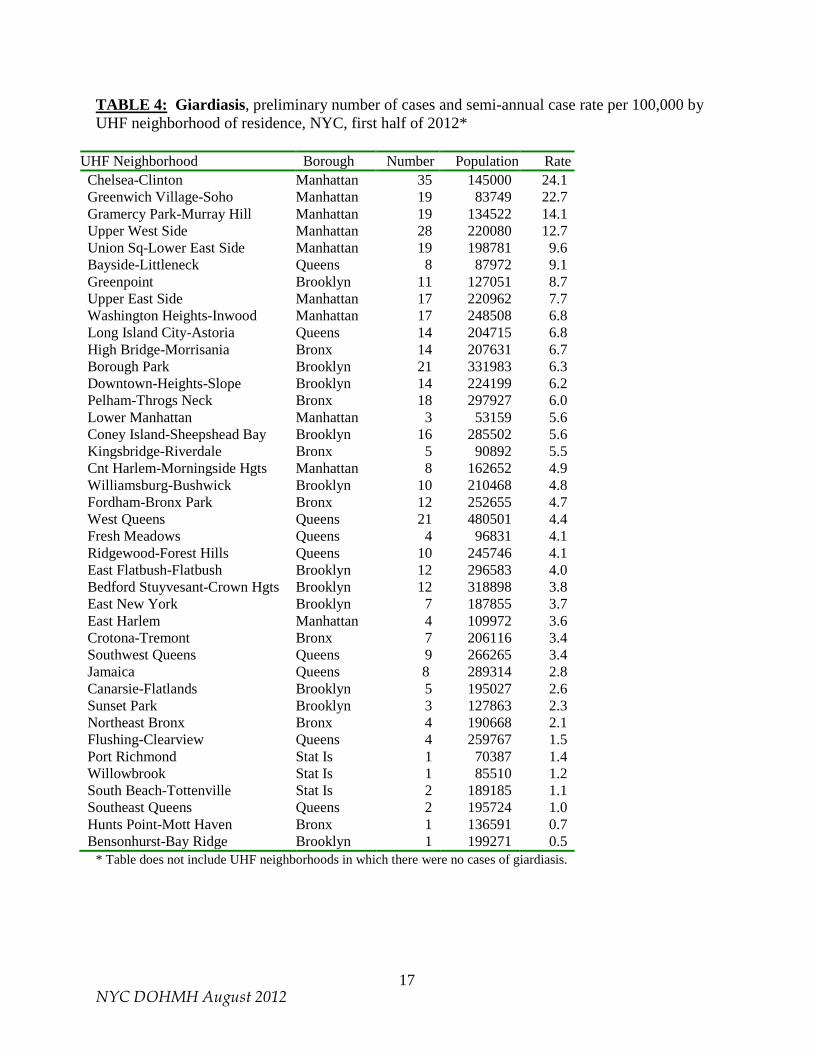
through 2009 were calculated for this report using intercensal population estimates, they may differ from previously reported rates based on year 2000 US Census data. Other variations in data between this report and previous reports may be due to factors such as disease reporting delays, correction of errors, and refinements in data processing (for example, the removal of duplicate disease reports). All rates in this report are semi-annual case rates. Caution must be exercised when interpreting rates based on very small case numbers. This report provides data on cases diagnosed between January 1, 2012 and June 30, 2012. All data for 2012 in this report should be considered preliminary. In this report, race/ethnicity-specific semi-annual case rates for 2012 are based upon year 2010 Census race/ethnicity categories and population counts. In previous semi-annual reports, there was one race/ethnicity category entitled “Asian, Pacific Islander, American Indian, Alaskan Native, non-Hispanic.” In the current report there are separate categories for non-Hispanic Asians, non-Hispanic Pacific Islanders and Native Hawaiians, and non-Hispanic American Indians. In addition, there is a new, separate race/ethnicity category entitled “Other Race, non-Hispanic,” which pertains to non-Hispanics, of a single race which is not Black, White, Asian, Native Hawaiian, Pacific Islander, or American Indian. For mapping purposes, the United Hospital Fund (UHF) neighborhood of case-patient residence was used. New York City is divided on the basis of zip code into 42 UHF neighborhoods. Maps illustrating semi-annual rates by UHF neighborhoods are included in this report. Surveillance for Giardiasis (January – June 2012, preliminary data) A total of 426 giardiasis cases were diagnosed among NYC residents in the first half of 2012, for a semi-annual rate of 5.2 per 100,000 population. Data for the first half of 2012 and for the first half of earlier years are presented in Table 1. The number of cases diagnosed each month for the period July 1993 through June 2012 is indicated in Figure 1. Since September 1995, case investigations for giardiasis are conducted only for case-patients who are in a secondary transmission risk category (e.g., food handler, health care worker, child attending day care, or day care worker). Investigations have been completed for all such giardiasis cases diagnosed during the first half of 2012. Sex Information regarding sex was available for all 426 cases of giardiasis. The number and rate of giardiasis cases were higher in males than females, with 293 males (7.5 cases per 100,000) and 133 females (3.1 cases per 100,000) reported (Table 2). Borough of case-patient residence The borough in which case-patients resided was known for all 426 giardiasis case-patients who were reported as residing in New York City. Manhattan had the highest borough-specific case rate (10.7 cases per 100,000) (Table 3). The highest UHF neighborhood-specific case rate was in Chelsea-Clinton in Manhattan (24.1 cases per 100,000) and Greenwich Village-Soho in Manhattan (22.7 cases per 100,000) (Map 1 and Table 4).
4 NYC DOHMH August 2012
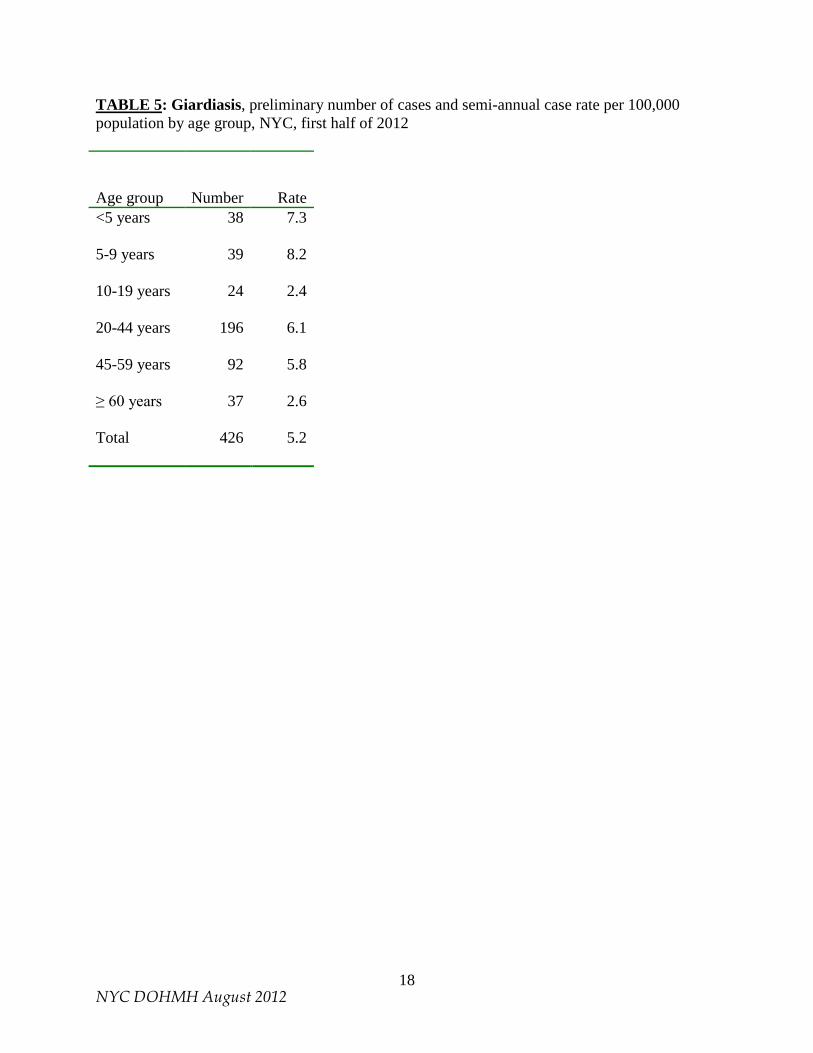
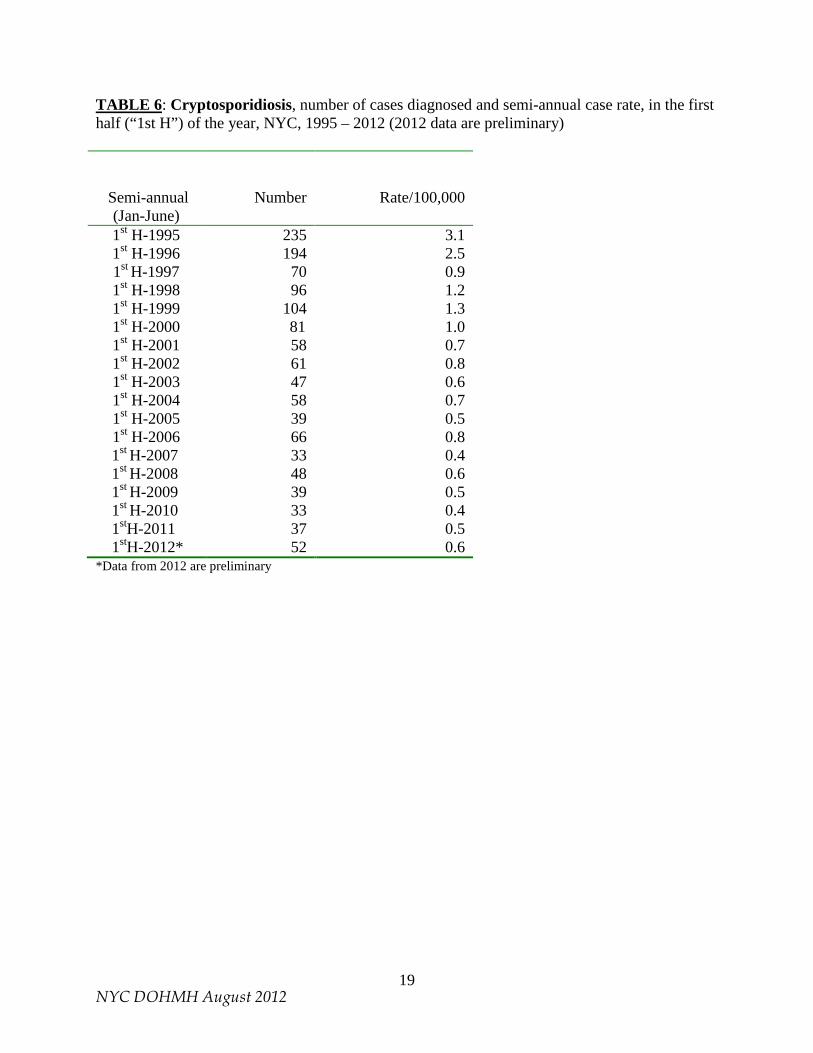
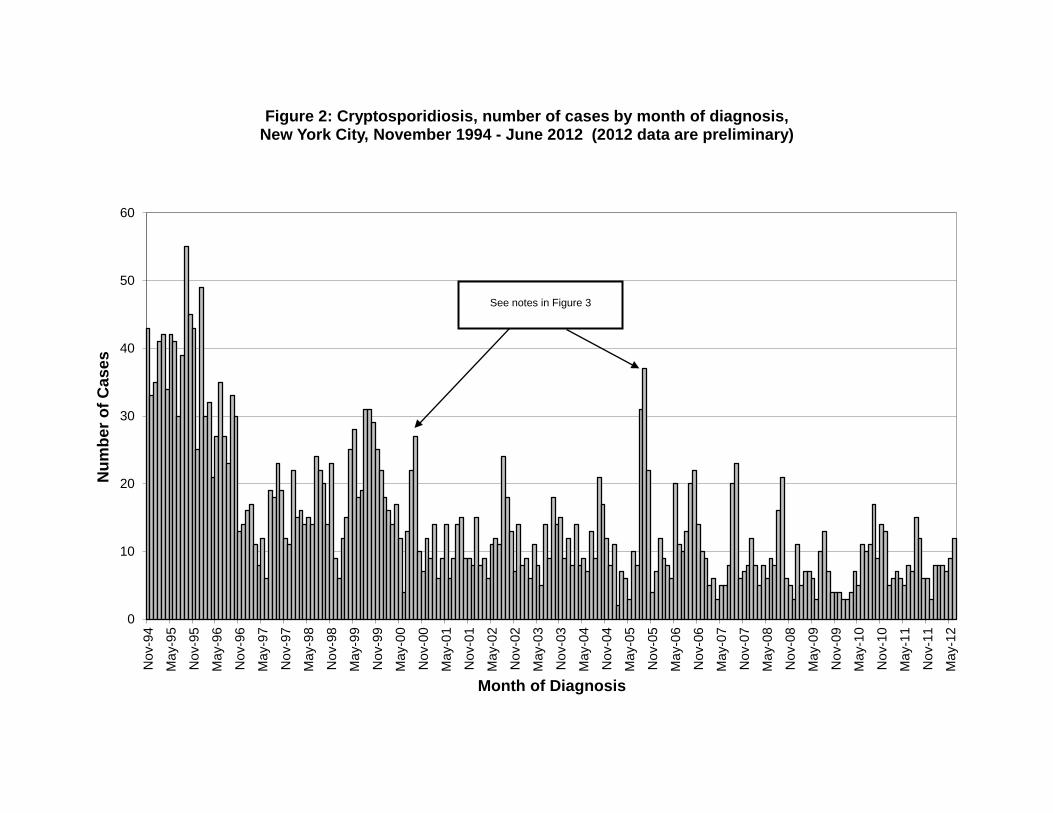
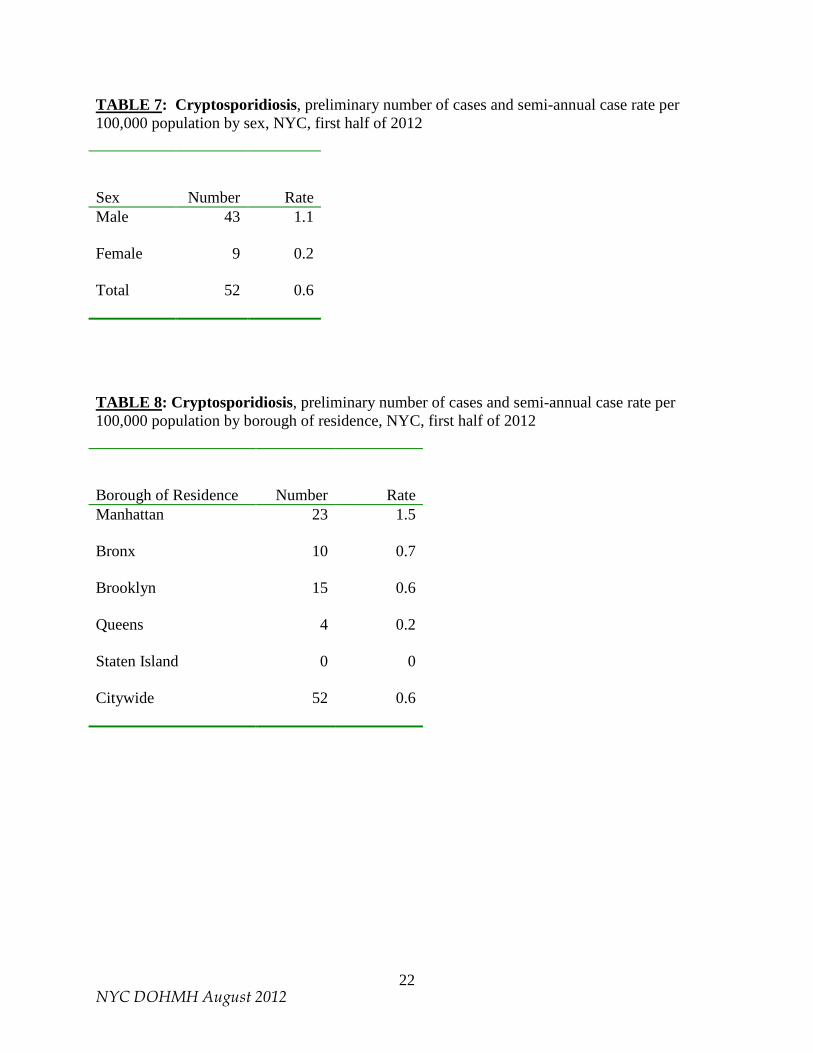
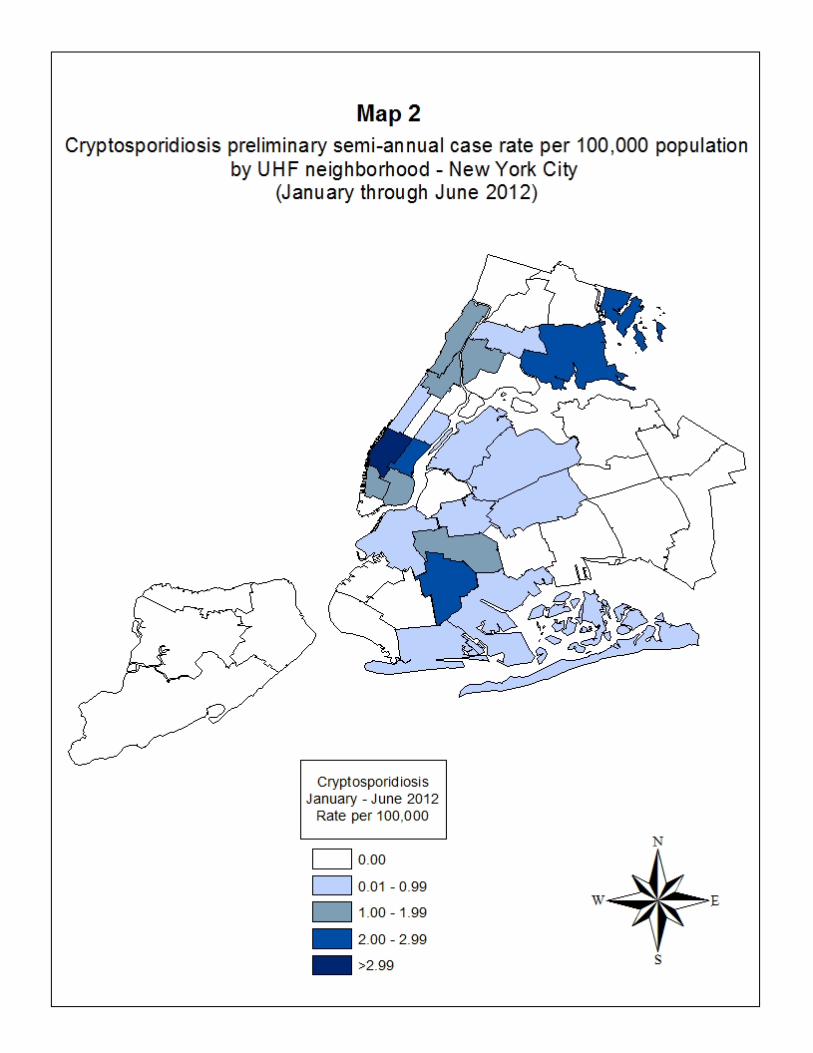
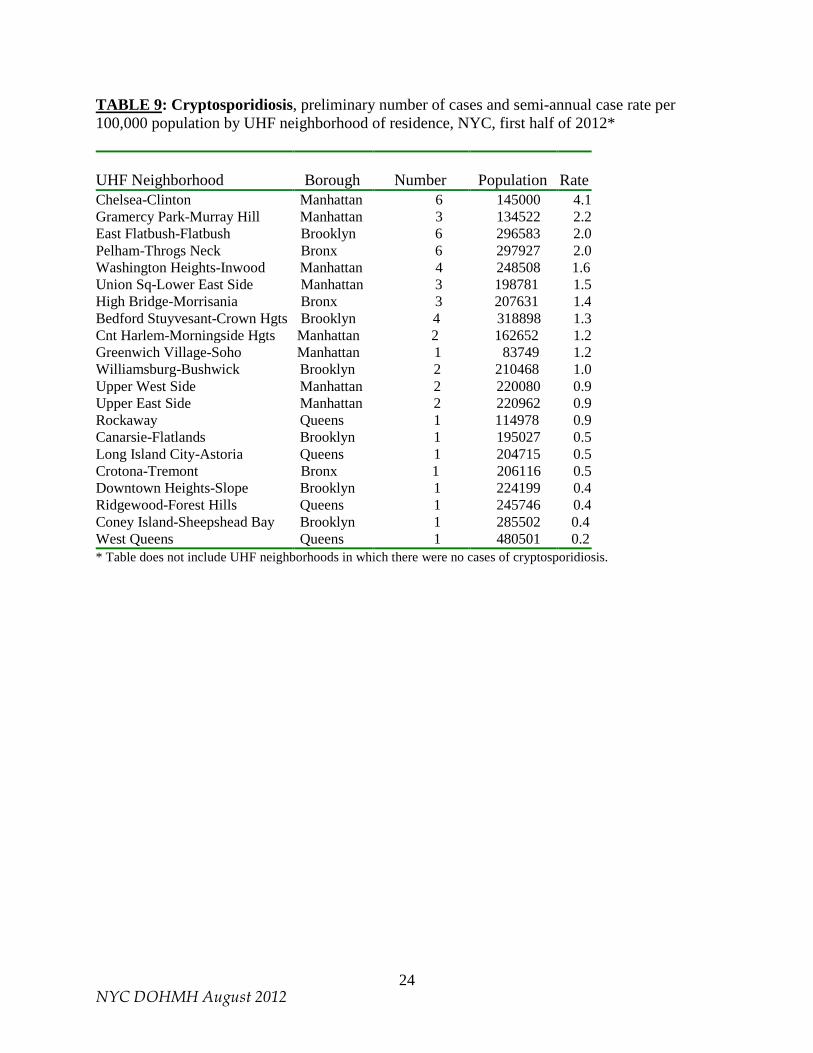
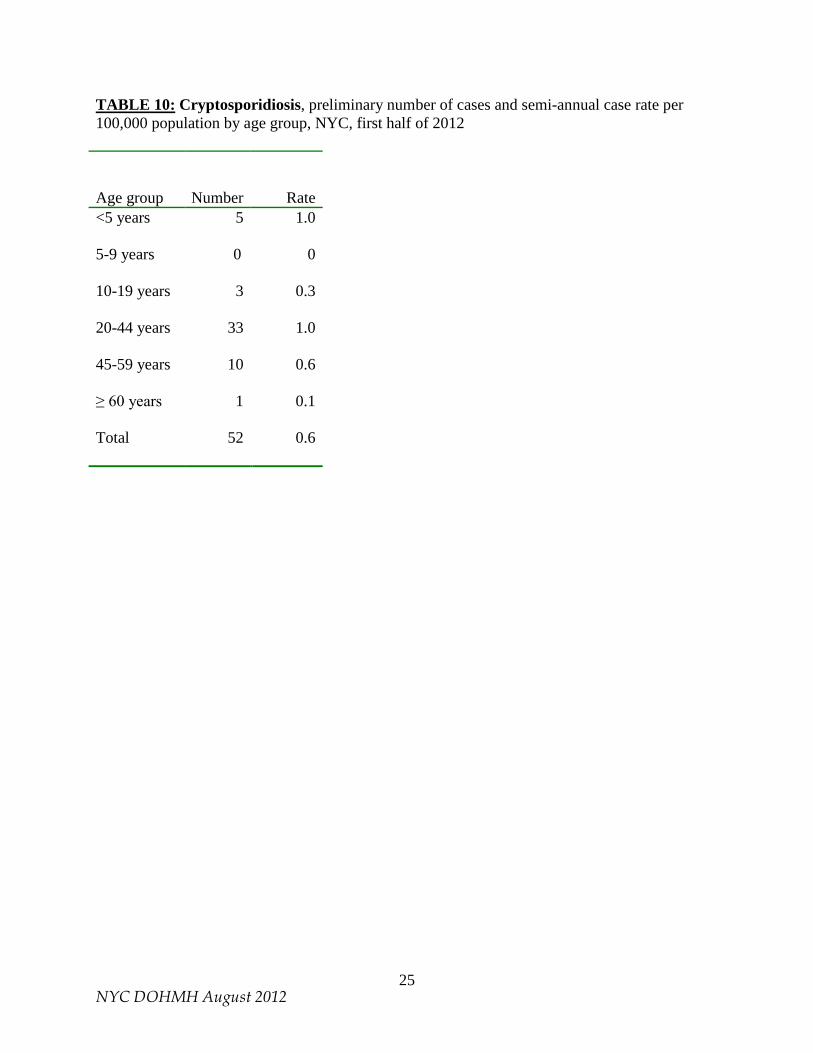
Age Information regarding age was available for all 426 cases of giardiasis. The highest age group-specific case rate was among children 5-9 years old (8.2 cases per 100,000) and children less than five years old (7.3 cases per 100,000) (Table 5). Race/Ethnicity Information regarding race/ethnicity was available for 45 of 426 cases (11%). Giardiasis case-patients are not routinely interviewed unless they are reported as being in occupations or settings that put them at increased risk for secondary transmission, as noted above. For the majority of giardiasis cases, race/ethnicity information, when provided, is not based upon self-report, but rather upon the impressions of health care providers, which may be inaccurate. For this reason, and because race/ethnicity information was missing from most giardiasis disease reports, race/ethnicity findings pertaining to giardiasis cases diagnosed in the first half of 2012 are not presented in this report. Surveillance for Cryptosporidiosis (January – June 2012, preliminary data) A total of 52 cryptosporidiosis cases were diagnosed among NYC residents in the first half of 2012, for a semi-annual case rate of 0.6 per 100,000 population. Data for the first half of 2012 and for the first half of earlier years are presented in Table 6. Case-patient interviews, health care provider interviews, or chart reviews have been completed for 49 of 52 patients diagnosed during the first half of 2012 (94%). The number of cases diagnosed each month for the period November 1994 through June 2012 is indicated in Figure 2. Because diagnosis may occur some time after onset, information is collected in the interview regarding the date of onset of symptoms. The date of onset can be used more accurately than date of diagnosis to estimate when case-patients most likely were exposed to Cryptosporidium. The number of cryptosporidiosis cases by month of onset for the period January 1995 through June 2012 is presented in Figure 3. Sex Information on sex was available for all 52 cases of cryptosporidiosis. The number and rate of cryptosporidiosis cases were higher in males than females, with 43 males (1.1 cases per 100,000) and 9 females (0.2 cases per 100,000) reported (Table 7). Borough of case-patient residence Borough of case-patient residence was known for all cryptosporidiosis case-patients. Manhattan had the largest number of cases and case rate (23 cases, with a rate of 1.5 per 100,000) (Table 8). The highest UHF neighborhood-specific case rate was found in Chelsea-Clinton in Manhattan (4.1 cases per 100,000) (Map 2 and Table 9). Age Information regarding age was available for all cases. The highest age group-specific case rate occurred among adults 20 – 44 years old and among children less than five years old (case rate 1.0 per 100,000 in each age group) (Table 10).
5 NYC DOHMH August 2012
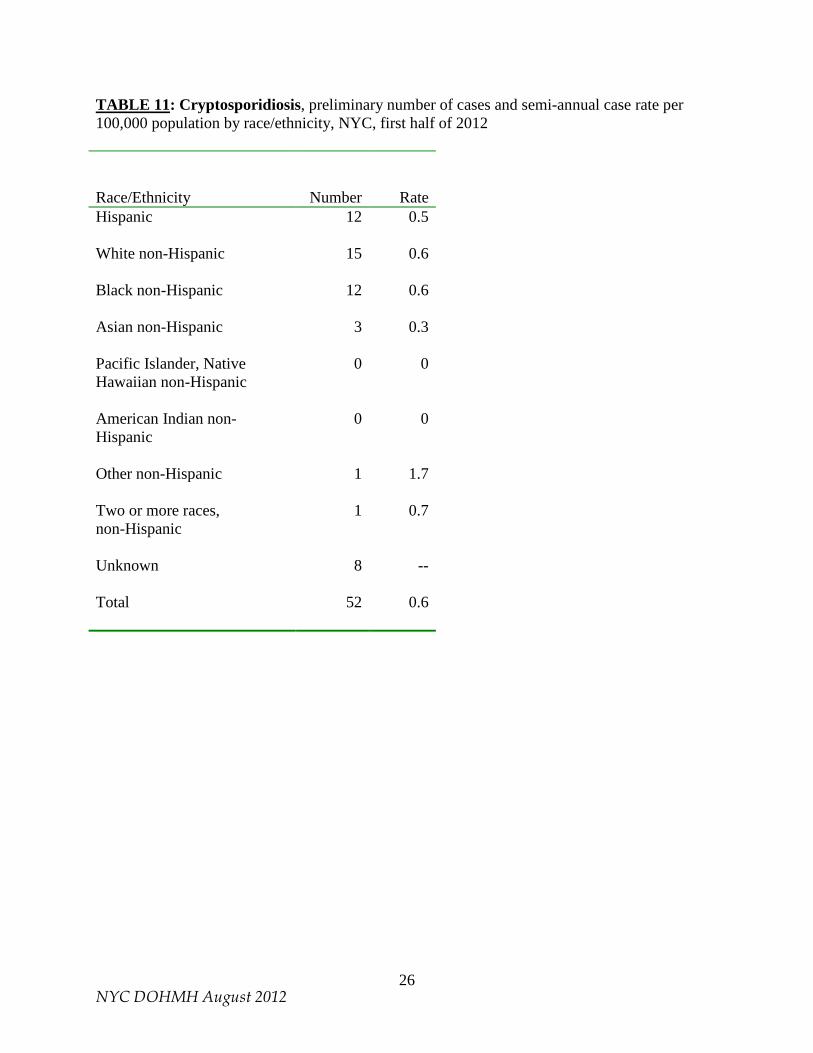
Race/Ethnicity Race/ethnicity information was available for 44 of 52 cases (85%). Of the case-patients for whom race/ethnicity information was available, the highest racial/ethnic group-specific case rate occurred among non-Hispanics of Other race (1.7 cases per 100,000); however, there was only one case in this race/ethnicity group. The largest number of cases occurred among White non-Hispanics (15 cases, with a rate of 0.6 per 100,000), Black non-Hispanics (12 cases, with a rate of 0.6 per 100,000) and Hispanics (12 cases, with a rate of 0.5 per 100,000) (Table 11). PART II: SYNDROMIC SURVEILLANCE/OUTBREAK DETECTION Introduction The tracking of sentinel populations or surrogate indicators of disease (“syndromic surveillance”) can be useful in assessing gastrointestinal (GI) disease trends in the general population. Such tracking programs provide greater assurance against the possibility that a citywide outbreak would remain undetected. In addition, such programs can potentially play a role in limiting the extent of an outbreak by providing an early indication of a problem so that control measures may be rapidly implemented. Over the years, beginning in the mid-1990s, the City has established and maintained a number of distinct and complementary outbreak detection systems. One system monitors and assists in the investigation of GI outbreaks in sentinel nursing homes. Another monitors the number of stool specimens submitted to a participating clinical laboratory for microbiological testing, and a third system utilizes hospital emergency department (ED) chief complaint logs to monitor for outbreaks. The City also utilizes two separate systems for monitoring sales of anti-diarrheal medications: one system is known as the ADM system and the other as the OTC system. All systems rely upon the voluntary participation of the organizations providing the syndromic data. A summary of syndromic surveillance findings pertaining to GI illness for the first half of 2012 is provided in the final section of this part, on pages 9-10. Program Components – Overviews and Updates A. Nursing Home Sentinel Surveillance The nursing home surveillance system began in March of 1997 and was significantly modified in August of 2002. Under the current protocol, when a participating nursing home notes an outbreak of gastrointestinal illness that is legally reportable to the New York State Department of Health (NYSDOH), the nursing home also notifies designated WDRAP team members working in the DOHMH BCD. Such an outbreak is defined as onset of diarrhea and/or vomiting involving three or more patients on a single ward/unit within a seven-day period, or more than the expected (baseline) number of cases within a single facility. All participating nursing homes have been provided with stool collection kits in advance. When such an outbreak is noted, specimens are to be collected for bacterial culture and sensitivity, ova and parasites, Cryptosporidium, viruses, and Clostridium difficile toxin testing. Though C. difficile is not a waterborne pathogen, C. difficile toxin testing was added in April 2010 in order to address a need
6 NYC DOHMH August 2012
expressed by infection control practitioners in the nursing homes, and was intended to help ensure compliance with the sentinel nursing home protocol. DOHMH BCD staff facilitates transportation of stool specimens to the City’s Public Health Laboratory. Testing for culture and sensitivity occurs at the Public Health Laboratory. On May 1, 2011 the DOHMH Public Health Laboratory discontinued parasitology testing. Specimens for ova and parasites and Cryptosporidium, as well as for viruses and C. difficile toxin testing, are currently being sent to the NYSDOH Wadsworth Center. There are eight nursing homes participating in the program. Three are in Manhattan, two are in the Bronx, two are in Queens, and one is in Brooklyn. As feedback for their role in outbreak detection, participating nursing homes are provided with copies of the Waterborne Disease Risk Assessment Program semi-annual and annual reports. B. Clinical Laboratory Monitoring The number of stool specimens submitted to clinical laboratories for bacterial and parasitic testing also provides information on gastrointestinal illness trends in the population. In March 2010, one of the two clinical laboratories that were participating in the program discontinued operations. Clinical Laboratory Monitoring stool specimen submission data which previously would have been received from that laboratory is now included in data received from the laboratory that continued to participate in the program in 2010 and throughout the period of this report. That laboratory (“Laboratory A”) transmits data by fax transmission to DOHMH BCD daily to three times per week, indicating the number of stool specimens examined per day for: (a) bacterial culture and sensitivity, (b) ova and parasites, and (c) Cryptosporidium. Clinical Laboratory Monitoring results are reviewed upon receipt. Beginning in August 2004, DOHMH started implementation of a computer model to establish statistical cut-offs for significant increases in clinical laboratory submissions. The model uses the entire historical dataset, that is, since November 1995 for Laboratory A. Sundays and holidays are removed because the laboratory does not test specimens on those days. Linear regression is used to adjust for average day-of-week and day-after-holiday effects as certain days routinely have higher volumes than other days. The cumulative sums (CUSUM) method is applied to a two-week baseline to identify statistically significant aberrations (or “signals”) in submissions for ova and parasites and for bacterial culture and sensitivity. CUSUM is a quality control method that has been adapted for aberration-detection in public health surveillance. (CUSUM is described further in: Hutwagner L, Maloney E, Bean N, Slutsker L, Martin S. Using Laboratory-Based Surveillance Data for Prevention: An Algorithm for Detecting Salmonella Outbreaks. Emerging Infectious Diseases. 1997, 3[3]: 395-400.) C. Anti-Diarrheal Medication Monitoring The tracking of sales of anti-diarrheal medications is a potentially useful source of information about the level of diarrheal illness in the community. NYC began tracking anti-diarrheal drug sales as a public health indicator in 1995.4 Modifications to NYC’s anti-diarrheal surveillance
4 The first NYC anti-diarrheal tracking system, involving data from a regional distributor serving independent pharmacies, was implemented in 1995. This system was discontinued in 2000 due to a diminishing data stream. This summary of NYC antidiarrheal medication monitoring programs therefore begins with discussion of the ADM system which was implemented in 1996 and is ongoing.
7 NYC DOHMH August 2012
program have been made over the years, and in 2002 NYC’s program was enhanced by two additional drug-tracking systems, the OTC system and the National Retail Data Monitor (NRDM) system. Participation of DOHMH in the NRDM system was discontinued in November 2007. Currently NYC utilizes two separate systems to monitor sales of anti-diarrheal medications: the ADM system and the OTC system. (NOTE: the program names “ADM” and “OTC” are abbreviations for “Anti-diarrheal Medications” and “Over-the-Counter.” Both systems involve the tracking of over-the-counter or non-prescription anti-diarrheal medications, but the program names were chosen simply as a way to distinguish the two systems.) The ADM System In 1996, NYC’s ADM system was established, utilizing volume-of-sales information of non-prescription anti-diarrheal medications obtained weekly from a major store chain. As discussed in previous WDRAP reports, a number of significant enhancements have been made to DEP’s ADM program since that time. In March 2010, DEP implemented an enhanced ADM system as a pilot program. This enhanced program is still in operation and includes the following features: (a) ADM data is received in digital format on a daily basis; (b) more products and more stores are included; (c) Health and Beauty products sales volume data is now utilized in the analysis in an effort to “normalize” the data (e.g., to help account for changing store traffic on different days of the week); (d) data on promotional sales vs. non-promotional sales is provided directly by the data provider; and (e) CDC’s Early Aberration Reporting System (EARS) is used for analysis of signals. EARS uses three aberration detection methods which are based on a one-sided positive CUSUM calculation. Data is analyzed in terms of citywide sales and sales by borough. During the period of January 1 to June 30, 2012, the ADM system operated by DEP continued. Timeliness of reporting from the data provider to DEP during this period was excellent: 98% of reports were sent on time to DEP by the store chain data provider. (Data receipt is considered to be on time if it is received on the day immediately following the date of product sale; data receipt is 7 days/week.) Provider data report delays were most notable during February. In terms of timeliness of data analysis during this semi-annual period, DEP completed analysis of the data on time 71% of the time. (Data analysis is considered to be on time if it is completed the same day that it is received from the data provider, except for data that comes in on weekends and holidays, in which case data analysis is considered to be on time if it is completed by the next business day). The data analysis delays were most notable in May 2012. DEP and DOHMH continue to work to address any program issues. The OTC System The second of the currently operating drug monitoring systems, the OTC system, was started in 2002 by DOHMH. When it was initiated, this system involved the monitoring of anti-diarrheal medication sales at a second store chain. Currently, as will be described below, the OTC system receives medication sales data from several major chains. When the OTC system was initiated, the goal was to develop a system that would provide more timely and detailed data than the ADM tracking system in place at the time. Also, the OTC system collects data on other medicines, including fever and allergy medications, for broader bioterrorism and emerging infectious disease surveillance purposes. Routine daily analyses for the OTC system began in mid-December 2002. Currently, each daily electronic file contains data for approximately 30,000 non-prescription medication sales. A separate file is also sent daily by one of the data
8 NYC DOHMH August 2012
providers which contains 9,000 prescription medication sales. However, the prescription medications have not been found to be as useful as the non-prescription medications for monitoring diarrheal illness in the OTC system, and therefore sales data of prescription anti-diarrheal medications are not routinely analyzed. Drugs are categorized into key syndromes, and trends are analyzed for citywide increases in sales of non-prescription anti-diarrheal medications. Prior to 2012, the gastrointestinal category included generic and brand name loperamide-containing agents and bismuth subsalicylate agents. Beginning in mid-June 2011, there was a decrease in the number of stores reporting medication sales to the OTC system. The decrease resulted from a disruption in data transmission that occurred because the store chain that had been submitting data merged with another large chain and underwent a revision to their data system as stores were being gradually moved over to the new system. This change affected the ability of the OTC system to detect signals in anti-diarrheal medication sales from mid-June 2011 to October 2011. From October 21, 2011 to April 16, 2012, due to very limited and inconsistent data transmission, DOHMH did not run the OTC analysis. On April 17, when consistent data transmission was restored, OTC data analysis was resumed. In the interim period the number of stores providing data to the OTC system had been increased by the addition of more stores to the DOHMH OTC system and through the inclusion of stores from the DEP ADM system. The ADM system addition was made possible through an arrangement among DEP, DOHMH and the data provider that had been submitting data to the DEP ADM system. Consequently, anti-diarrheal medication sales data from that data provider are currently analyzed by both DOHMH and DEP, resulting in some overlap between the DOHMH OTC system and the DEP ADM system. The plan is for DEP to eventually phase out its ADM monitoring program. Enhancements now in effect in the OTC system include an increased number of stores providing data, new analytic methods, and separate analyses for citywide increases in sales of over-the-counter, non-bismuth-containing anti-diarrheal medications and of bismuth medications. From April 17 to June 30, 2012, an average of 345 stores were submitting data for OTC analysis. Within this timeframe, there was a decrease in the number of stores submitting data on the following days: May 4, May 12, and June 20. A back-fill of data for these days has been requested. The chains providing OTC data are continuing to have data transmission problems, and DOHMH is working with the data providers to resolve the issue. D. Emergency Department System NYC initiated monitoring of hospital emergency department visits as a public health surveillance system in 2001. In the first half of 2012, DOHMH received electronic data from 49 of New York City’s 52 EDs, reporting approximately 11,000 visits per day, roughly 95% of all ED visits citywide. Hospitals transmit electronic files each morning containing chief complaint and demographic information for patient visits during the previous 24 hours. Patients are classified into syndrome categories, and daily analyses are conducted to detect any unusual patterns, or signals. The two syndromes used to track gastrointestinal illness are vomiting syndrome and diarrhea syndrome. Temporal citywide analyses assess whether the frequency of ED visits for the syndrome has increased in the last one, two or three days compared to the previous fourteen days. Spatial analyses scan the data for geographic clustering in syndrome visits on the most
9 NYC DOHMH August 2012
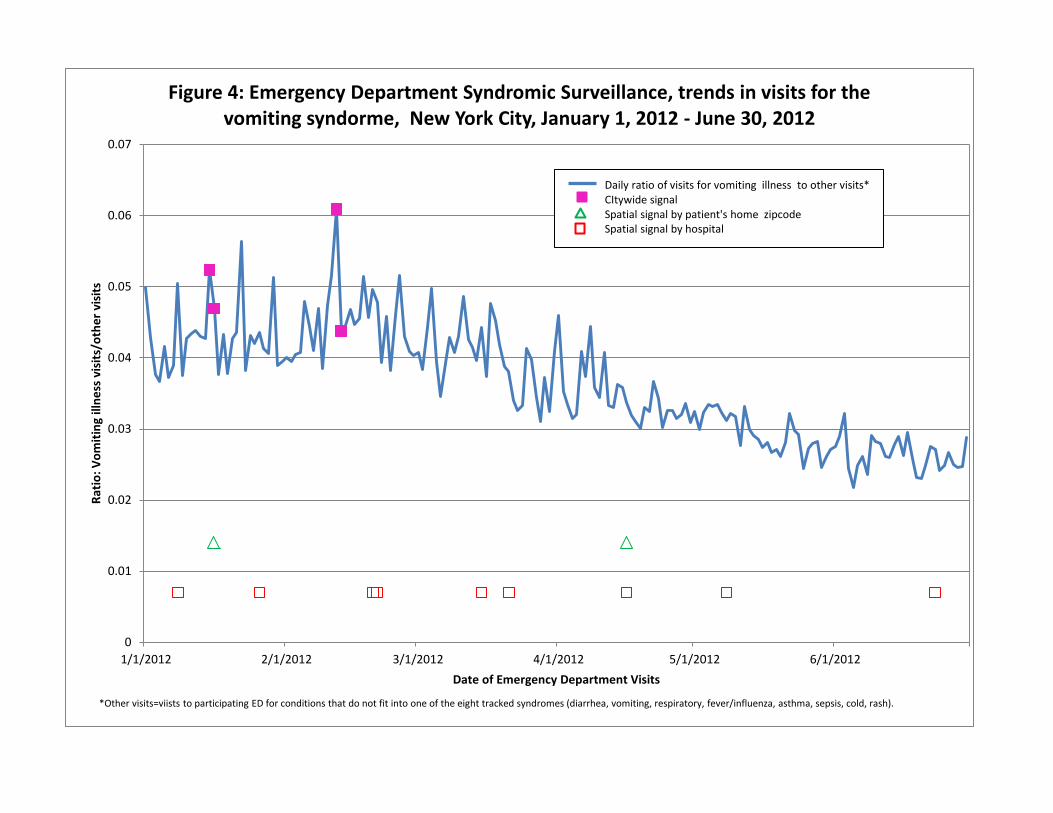
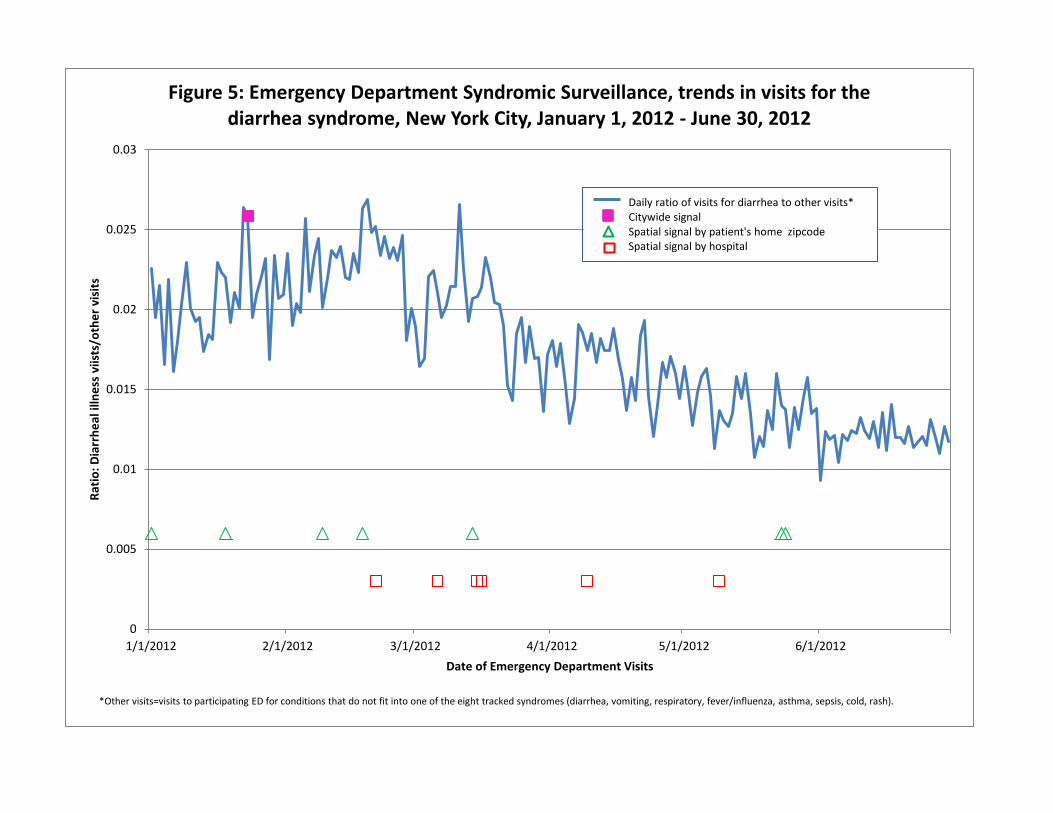
recent day compared to the previous 14 days. Clustering is examined by both hospital location and residential zip code. Statistical significance is based on Monte Carlo probability estimates that adjust for the multiple comparisons inherent in examining many candidate clusters each day. The threshold of significance for citywide and spatial signals was set at P<.01, indicating that fewer than 1 out of every 100 analyses would generate a cluster due to chance alone. Beginning March 11, 2005, the threshold of significance for spatial signals was changed to P<.005, while the threshold of significance for citywide signals remained at P<.01. (The system is described further in: Heffernan R, Mostashari F, Das D, Karpati A, Kulldorf M, Weiss D. Syndromic Surveillance in Public Health Practice, New York City. Emerging Infectious Diseases. 2004,10[5]: 858-864.) Findings: Summary of Syndromic Surveillance Signals Syndromic surveillance signals alone cannot be used to determine etiologic diagnoses. Also, experience has shown that most signals, especially localized spatial signals in the emergency department system or signals in the laboratory or anti-diarrheal medication systems, may be statistical aberrations and not related to public health events. The systems are therefore used in concert. A signal in one system is compared to other systems to see whether or not there are concurrent signals. In this report we present a summary of GI disease signals from NYC’s syndromic surveillance systems in three figures: Figures 4, 5, and 6. Figures 4 and 5 summarize ED system trends and signals. Figure 6 is a summary of signal results from the syndromic surveillance systems operated by DOHMH and DEP during this reporting period. Figure 4 shows a graphic representation of the ratio of daily ED visits for the vomiting syndrome to all other daily ED visits for syndromes not tracked by ED syndromic surveillance (“other visits”) from January 1 to June 30, 2012. The graph also includes an indication of citywide signals and of the spatial residential zipcode and hospital signals. Figure 5 is the same graph for the syndrome of diarrhea. Figures 4 and 5 indicate that there were citywide vomiting signals from January 15 -16 and from February 12 - 13, and citywide diarrhea signals on January 23. ED signals for vomiting and diarrhea in January and February are consistent with historical experience showing a seasonal increase in viral gastroenteritis due to norovirus and/or rotavirus. There were no ED citywide signals for the diarrhea or vomiting syndromes during March through June. There were spatial residential diarrhea signals from May 23 - 24 in the Brooklyn UHF neighborhood Flatbush-East Flatbush. During this time, there were increased cases of shigellosis occurring in the same UHF neighborhood which were being investigated by DOHMH and which were part of a well-recognized, recurrent shigellosis outbreak that has been affecting this community every three to four years. During this reporting period, no other ED system spatial signal was sustained in any NYC UHF neighborhood for more than one day. Figure 6 is a time-series plot of signals from NYC syndromic surveillance systems for the gastrointestinal syndrome covering the period January 1 to June 30, 2012. The systems included are the emergency department system, the clinical laboratory monitoring system, the OTC anti-diarrheal medication system operated by DOHMH, the ADM anti-diarrheal medication system operated by DEP, and the nursing home sentinel surveillance system. For the ED, ADM and OTC systems, only citywide signals have been included. As noted above, there was citywide ED system signaling for the vomiting and diarrhea syndromes in January and February, likely
10 NYC DOHMH August 2012
representing the seasonality of norovirus and rotavirus. In the clinical laboratory system, there were no signals during January through March. In May there was sustained signaling during the following periods: May 1 - 2, May 16 – 18, and May 30 – 31. No specimens tested for Cryptosporidium during the month of May in this clinical laboratory were found to be positive. As noted in the section above concerning the OTC system, there was a disruption in data transmission which affected the ability of this system to detect signals, and so OTC system data analysis was suspended from October 21, 2011 to April 16, 2012. After OTC system data analysis was resumed, on April 17, no signals were detected, though, as previously noted, there were three days when there was a decrease in the number of stores submitting anti-diarrheal sales data. During this reporting period, no GI outbreaks were reported among the eight nursing homes participating in sentinel surveillance. With regard to the ADM program, Figure 6 indicates all dates of citywide signals from the ADM EARS analysis. The EARS program uses several different baselines to identify different types of signals; citywide signal results are combined in Figure 6 by date. All ADM results are shared with DOHMH, and when signals or other unusual ADM sales results are observed, these results can be compared by DOHMH with results from the other syndromic systems. During the period of this report, there were 24 days of citywide ADM EARS signals. Most (20 of 24) of the citywide signal dates coincided with reported ADM product promotional events (though 3 of these days were of relatively low-level promotional sales volume). Though it is not possible to attribute signals fully to product promotions with complete confidence, promotions certainly may explain above-typical sales volume. In any case, none of the 24 citywide EARS signals seen during this reporting period appeared to represent a notable public health event: the ADM sales ratio for 23 out of 24 instances of citywide EARS signaling appeared to be generally within background sales ratio range (despite the EARS signal). The remaining instance, on June 1, which appeared somewhat above the sales ratio observed during the recently preceding period was not sustained (and also may have signaled due to a promotional event). Based upon ADM findings during this reporting period, DEP recommended to DOHMH elevated attention to other syndromic systems data on at least two occasions during this period: on May 21 (especially regarding Staten Island data), and on June 25 (especially regarding Bronx data). As noted above, there were ED system spatial diarrhea signals in the Flatbush-East Flatbush UHF neighborhood in Brooklyn from May 23 – 24, though there were none in Staten Island. Otherwise, neither of these dates appeared to coincide with signals in any other syndromic systems. In summary, for the period of this report, January through June 2012, there were citywide ED system signals for vomiting and diarrhea in January and February, consistent with seasonal trends in norovirus and rotavirus. There was no evidence of a drinking water-related outbreak in New York City.
11 NYC DOHMH August 2012
Index to Tables, Figures and Maps Page
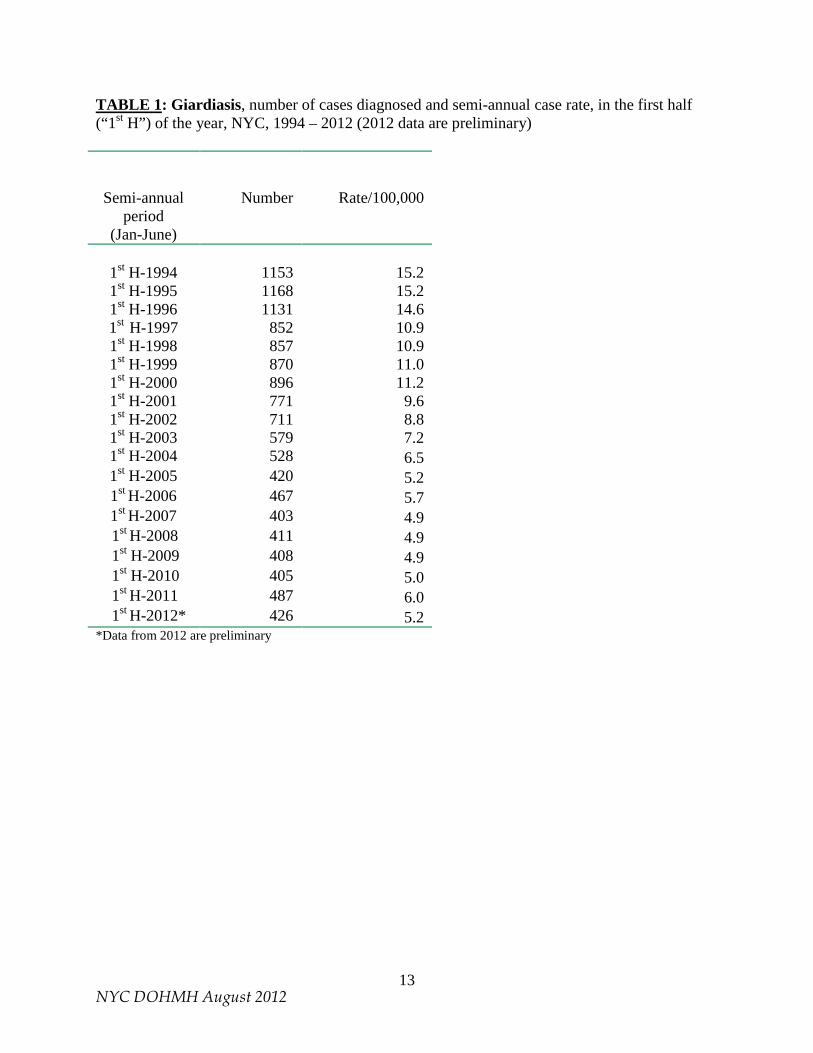
TABLE 1: Giardiasis, number of cases diagnosed and semi-annual case rate, in the first half of the year, NYC, 1994 -2012 (2012 data are preliminary)
13
FIGURE 1: Giardiasis, number of cases by month of diagnosis, NYC, July 1993 – June 2012 (2012 data are preliminary)
14
TABLE 2: Giardiasis, preliminary number of cases and semi-annual case rate per 100,000 population by sex, NYC, first half of 2012
15
TABLE 3: Giardiasis, preliminary number of cases, semi-annual case rate per 100,000 population by borough of residence, NYC, first half of 2012
15
MAP 1: Giardiasis preliminary semi-annual case rate per 100,000 population by UHF neighborhood, NYC, January – June, 2012
16
TABLE 4: Giardiasis, preliminary number of cases and semi-annual case rate per 100,000 population by UHF neighborhood of residence, NYC, first half of 2012
17
TABLE 5: Giardiasis, preliminary number of cases and semi-annual case rate per 100,000 population by age group, NYC, first half of 2012
18
TABLE 6: Cryptosporidiosis, number of cases diagnosed and semi-annual case rate, in the first half of the year, NYC, 1995 – 2012 (2012 data preliminary)
19
FIGURE 2: Cryptosporidiosis, number of cases by month of diagnosis, NYC, November 1994 – June 2012 (2012 data are preliminary)
20
FIGURE 3: Cryptosporidiosis, number of cases by month of onset, NYC, January 1995 – June 2012 (2012 data are preliminary)
21
TABLE 7: Cryptosporidiosis, preliminary number of cases and semi-annual case rate per 100,000 population by sex, NYC, first half of 2012
22
12 NYC DOHMH August 2012
Index to Tables, Figures and Maps (continued)
Page
TABLE 8: Cryptosporidiosis, preliminary number of cases and semi-annual case rate per 100,000 population by borough of residence, NYC, first half of 2012
22
MAP 2: Cryptosporidiosis preliminary semi-annual case rate per 100,000 population by UHF neighborhood, NYC, January – June, 2012
23
TABLE 9: Cryptosporidiosis, preliminary number of cases and semi-annual case rate per 100,000 population by UHF neighborhood of residence, NYC, first half of 2012
24
TABLE 10: Cryptosporidiosis, preliminary number of cases and semi-annual case rate per 100,000 population by age group, NYC, first half of 2012
25
TABLE 11: Cryptosporidiosis, preliminary number of cases and semi-annual case rate per 100,000 population by race/ethnicity, NYC, first half of 2012
26
FIGURE 4: Emergency Department Syndromic Surveillance, Trends in visits for vomiting syndrome, NYC, January 1, 2012 – June 30, 2012
27
FIGURE 5: Emergency Department Syndromic Surveillance, Trends in visits for diarrhea syndrome, NYC, January 1, 2012 – June 30, 2012.
28
FIGURE 6: Signals for Gastrointestinal Illness, Syndromic Surveillance Systems, NYC, January 1, 2012 – June 30, 2012.
29
13 NYC DOHMH August 2012
TABLE 1: Giardiasis, number of cases diagnosed and semi-annual case rate, in the first half (“1st H”) of the year, NYC, 1994 – 2012 (2012 data are preliminary)
Semi-annual period
(Jan-June)
Number
Rate/100,000
1st H-1994
1153 15.2
1st H-1995 1168 15.2 1st H-1996 1131 14.6 1st H-1997 852 10.9 1st H-1998 857 10.9 1st H-1999 870 11.0 1st H-2000 896 11.2 1st H-2001 771 9.6 1st H-2002 711 8.8 1st H-2003 579 7.2 1st H-2004 528 6.5 1st H-2005 420 5.2 1st H-2006 467 5.7 1st H-2007 403 4.9
1st H-2008 411 4.9 1st H-2009 408 4.9 1st H-2010 405 5.0 1st H-2011 487 6.0 1st H-2012* 426 5.2 *Data from 2012 are preliminary
0
50
100
150
200
250
300
350
Jul-9
3Ja
n-94
Jul-9
4Ja
n-95
Jul-9
5Ja
n-96
Jul-9
6Ja
n-97
Jul-9
7Ja
n-98
Jul-9
8Ja
n-99
Jul-9
9Ja
n-00
Jul-0
0Ja
n-01
Jul-0
1Ja
n-02
Jul-0
2Ja
n-03
Jul-0
3Ja
n-04
Jul-0
4Ja
n-05
Jul-0
5Ja
n-06
Jul-0
6Ja
n-07
Jul-0
7Ja
n-08
Jul-0
8Ja
n-09
Jul-0
9Ja
n-10
Jul-1
0Ja
n-11
Jul-1
1Ja
n-12
Num
ber o
f Cas
es
Month of Diagnosis
Figure 1: Giardiasis, number of cases by month of diagnosis, New York City, July 1993 - June 2012 (2012 data are preliminary)
15 NYC DOHMH August 2012
TABLE 2: Giardiasis, preliminary number of cases and semi-annual case rate per 100,000 population by sex, NYC, first half of 2012 Sex
Number
Rate Male 293 7.5
Female 133 3.1
Total 426 5.2
TABLE 3: Giardiasis, preliminary number of cases and semi-annual case rate per 100,000 population by borough of residence, NYC, first half of 2012 Borough of Residence
Number
Rate Manhattan
169 10.7
Bronx
61 4.4
Brooklyn
112 4.5
Queens
80 3.6
Staten Island
4 0.9
Citywide
426 5.2
17 NYC DOHMH August 2012
TABLE 4: Giardiasis, preliminary number of cases and semi-annual case rate per 100,000 by UHF neighborhood of residence, NYC, first half of 2012*
UHF Neighborhood Borough Number Population Rate Chelsea-Clinton Manhattan 35 145000 24.1 Greenwich Village-Soho Manhattan 19 83749 22.7 Gramercy Park-Murray Hill Manhattan 19 134522 14.1 Upper West Side Manhattan 28 220080 12.7 Union Sq-Lower East Side Manhattan 19 198781 9.6 Bayside-Littleneck Queens 8 87972 9.1 Greenpoint Brooklyn 11 127051 8.7 Upper East Side Manhattan 17 220962 7.7 Washington Heights-Inwood Manhattan 17 248508 6.8 Long Island City-Astoria Queens 14 204715 6.8 High Bridge-Morrisania Bronx 14 207631 6.7 Borough Park Brooklyn 21 331983 6.3 Downtown-Heights-Slope Brooklyn 14 224199 6.2 Pelham-Throgs Neck Bronx 18 297927 6.0 Lower Manhattan Manhattan 3 53159 5.6 Coney Island-Sheepshead Bay Brooklyn 16 285502 5.6 Kingsbridge-Riverdale Bronx 5 90892 5.5 Cnt Harlem-Morningside Hgts Manhattan 8 162652 4.9 Williamsburg-Bushwick Brooklyn 10 210468 4.8 Fordham-Bronx Park Bronx 12 252655 4.7 West Queens Queens 21 480501 4.4 Fresh Meadows Queens 4 96831 4.1 Ridgewood-Forest Hills Queens 10 245746 4.1 East Flatbush-Flatbush Brooklyn 12 296583 4.0 Bedford Stuyvesant-Crown Hgts Brooklyn 12 318898 3.8 East New York Brooklyn 7 187855 3.7 East Harlem Manhattan 4 109972 3.6 Crotona-Tremont Bronx 7 206116 3.4 Southwest Queens Queens 9 266265 3.4 Jamaica Queens 8 289314 2.8 Canarsie-Flatlands Brooklyn 5 195027 2.6 Sunset Park Brooklyn 3 127863 2.3 Northeast Bronx Bronx 4 190668 2.1 Flushing-Clearview Queens 4 259767 1.5 Port Richmond Stat Is 1 70387 1.4 Willowbrook Stat Is 1 85510 1.2 South Beach-Tottenville Stat Is 2 189185 1.1 Southeast Queens Queens 2 195724 1.0 Hunts Point-Mott Haven Bronx 1 136591 0.7 Bensonhurst-Bay Ridge Brooklyn 1 199271 0.5
* Table does not include UHF neighborhoods in which there were no cases of giardiasis.
18 NYC DOHMH August 2012
TABLE 5: Giardiasis, preliminary number of cases and semi-annual case rate per 100,000 population by age group, NYC, first half of 2012 Age group
Number
Rate <5 years 38
7.3
5-9 years 39
8.2
10-19 years 24
2.4
20-44 years 196
6.1
45-59 years 92
5.8
≥ 60 years 37
2.6
Total 426 5.2
19 NYC DOHMH August 2012
TABLE 6: Cryptosporidiosis, number of cases diagnosed and semi-annual case rate, in the first half (“1st H”) of the year, NYC, 1995 – 2012 (2012 data are preliminary)
Semi-annual (Jan-June)
Number
Rate/100,000
1st H-1995 235 3.1 1st H-1996 194 2.5 1st H-1997 70 0.9 1st H-1998 96 1.2 1st H-1999 104 1.3 1st H-2000 81 1.0 1st H-2001 58 0.7 1st H-2002 61 0.8 1st H-2003 47 0.6 1st H-2004 58 0.7 1st H-2005 39 0.5 1st H-2006 66 0.8
1st H-2007 33 0.4 1st H-2008 48 0.6 1st H-2009 39 0.5 1st H-2010 33 0.4 1stH-2011 37 0.5 1stH-2012* 52 0.6 *Data from 2012 are preliminary
0
10
20
30
40
50
60
Nov
-94
May
-95
Nov
-95
May
-96
Nov
-96
May
-97
Nov
-97
May
-98
Nov
-98
May
-99
Nov
-99
May
-00
Nov
-00
May
-01
Nov
-01
May
-02
Nov
-02
May
-03
Nov
-03
May
-04
Nov
-04
May
-05
Nov
-05
May
-06
Nov
-06
May
-07
Nov
-07
May
-08
Nov
-08
May
-09
Nov
-09
May
-10
Nov
-10
May
-11
Nov
-11
May
-12
Num
ber o
f Cas
es
Month of Diagnosis
Figure 2: Cryptosporidiosis, number of cases by month of diagnosis, New York City, November 1994 - June 2012 (2012 data are preliminary)
See notes in Figure 3
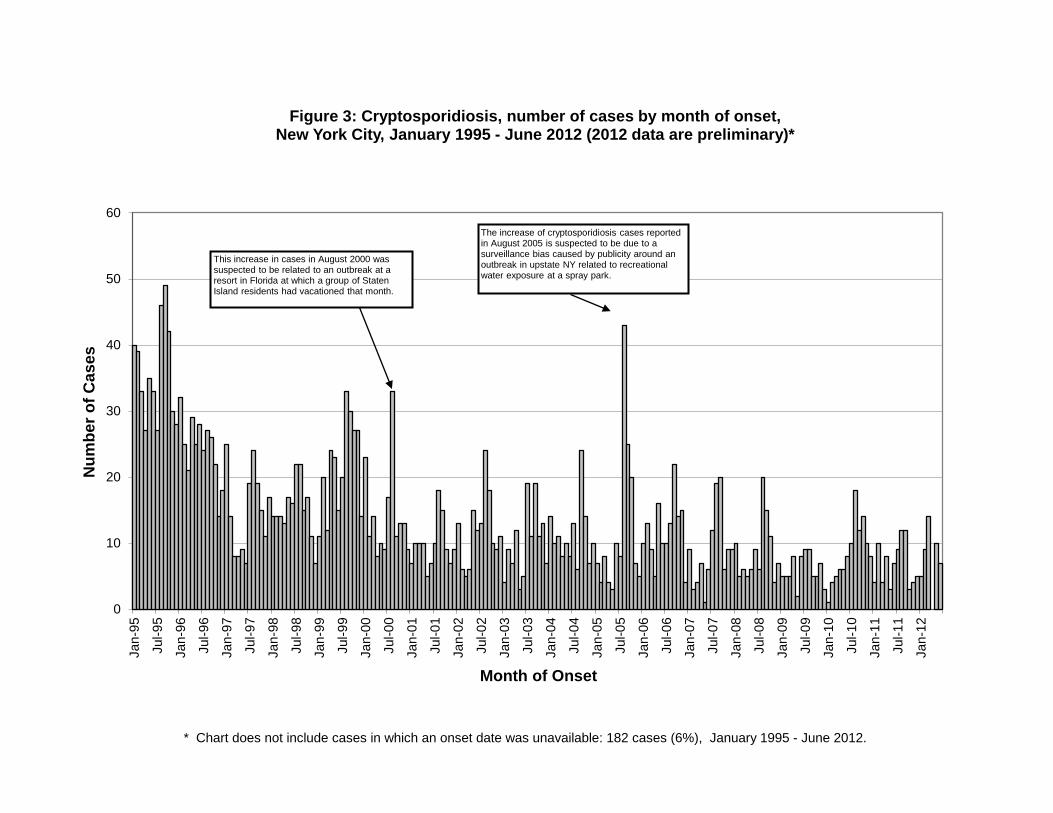
* Chart does not include cases in which an onset date was unavailable: 182 cases (6%), January 1995 - June 2012.
0
10
20
30
40
50
60
Jan-
95
Jul-9
5
Jan-
96
Jul-9
6
Jan-
97
Jul-9
7
Jan-
98
Jul-9
8
Jan-
99
Jul-9
9
Jan-
00
Jul-0
0
Jan-
01
Jul-0
1
Jan-
02
Jul-0
2
Jan-
03
Jul-0
3
Jan-
04
Jul-0
4
Jan-
05
Jul-0
5
Jan-
06
Jul-0
6
Jan-
07
Jul-0
7
Jan-
08
Jul-0
8
Jan-
09
Jul-0
9
Jan-
10
Jul-1
0
Jan-
11
Jul-1
1
Jan-
12
Num
ber o
f Cas
es
Month of Onset
Figure 3: Cryptosporidiosis, number of cases by month of onset, New York City, January 1995 - June 2012 (2012 data are preliminary)*
This increase in cases in August 2000 was suspected to be related to an outbreak at a resort in Florida at which a group of Staten Island residents had vacationed that month.
The increase of cryptosporidiosis cases reported in August 2005 is suspected to be due to a surveillance bias caused by publicity around an outbreak in upstate NY related to recreational water exposure at a spray park.
22 NYC DOHMH August 2012
TABLE 7: Cryptosporidiosis, preliminary number of cases and semi-annual case rate per 100,000 population by sex, NYC, first half of 2012 Sex
Number
Rate Male 43
1.1
Female
9 0.2
Total
52 0.6
TABLE 8: Cryptosporidiosis, preliminary number of cases and semi-annual case rate per 100,000 population by borough of residence, NYC, first half of 2012 Borough of Residence
Number
Rate Manhattan
23 1.5
Bronx
10 0.7
Brooklyn
15 0.6
Queens
4 0.2
Staten Island
0 0
Citywide
52 0.6
24 NYC DOHMH August 2012
TABLE 9: Cryptosporidiosis, preliminary number of cases and semi-annual case rate per 100,000 population by UHF neighborhood of residence, NYC, first half of 2012*
UHF Neighborhood
Borough Number Population Rate Chelsea-Clinton Manhattan 6 145000 4.1 Gramercy Park-Murray Hill Manhattan 3 134522 2.2 East Flatbush-Flatbush Brooklyn 6 296583 2.0 Pelham-Throgs Neck Bronx 6 297927 2.0 Washington Heights-Inwood Manhattan 4 248508 1.6 Union Sq-Lower East Side Manhattan 3 198781 1.5 High Bridge-Morrisania Bronx 3 207631 1.4 Bedford Stuyvesant-Crown Hgts Brooklyn 4 318898 1.3 Cnt Harlem-Morningside Hgts Manhattan 2 162652 1.2 Greenwich Village-Soho Manhattan 1 83749 1.2 Williamsburg-Bushwick Brooklyn 2 210468 1.0 Upper West Side Manhattan 2 220080 0.9 Upper East Side Manhattan 2 220962 0.9 Rockaway Queens 1 114978 0.9 Canarsie-Flatlands Brooklyn 1 195027 0.5 Long Island City-Astoria Queens 1 204715 0.5 Crotona-Tremont Bronx 1 206116 0.5 Downtown Heights-Slope Brooklyn 1 224199 0.4 Ridgewood-Forest Hills Queens 1 245746 0.4 Coney Island-Sheepshead Bay Brooklyn 1 285502 0.4 West Queens Queens 1 480501 0.2 * Table does not include UHF neighborhoods in which there were no cases of cryptosporidiosis.
25 NYC DOHMH August 2012
TABLE 10: Cryptosporidiosis, preliminary number of cases and semi-annual case rate per 100,000 population by age group, NYC, first half of 2012 Age group
Number
Rate <5 years 5
1.0
5-9 years 0
0
10-19 years 3
0.3
20-44 years 33
1.0
45-59 years 10
0.6
≥ 60 years 1
0.1
Total 52
0.6
26 NYC DOHMH August 2012
TABLE 11: Cryptosporidiosis, preliminary number of cases and semi-annual case rate per 100,000 population by race/ethnicity, NYC, first half of 2012 Race/Ethnicity
Number
Rate Hispanic
12 0.5
White non-Hispanic
15 0.6
Black non-Hispanic
12 0.6
Asian non-Hispanic
3 0.3
Pacific Islander, Native Hawaiian non-Hispanic
0 0
American Indian non-Hispanic
0 0
Other non-Hispanic 1 1.7 Two or more races, non-Hispanic Unknown
1
8
0.7
--
Total 52 0.6
0
0.01
0.02
0.03
0.04
0.05
0.06
0.07
1/1/2012 2/1/2012 3/1/2012 4/1/2012 5/1/2012 6/1/2012
Ratio
: Vom
iting
illn
ess
visi
ts/o
ther
vis
its
Date of Emergency Department Visits
Figure 4: Emergency Department Syndromic Surveillance, trends in visits for the vomiting syndorme, New York City, January 1, 2012 - June 30, 2012
*Other visits=viists to participating ED for conditions that do not fit into one of the eight tracked syndromes (diarrhea, vomiting, respiratory, fever/influenza, asthma, sepsis, cold, rash).
Daily ratio of visits for vomiting illness to other visits* CItywide signal Spatial signal by patient's home zipcode Spatial signal by hospital
0
0.005
0.01
0.015
0.02
0.025
0.03
1/1/2012 2/1/2012 3/1/2012 4/1/2012 5/1/2012 6/1/2012
Ratio
: Dia
rrhe
al il
lnes
s vi
ists
/oth
er v
isits
Date of Emergency Department Visits
Figure 5: Emergency Department Syndromic Surveillance, trends in visits for the diarrhea syndrome, New York City, January 1, 2012 - June 30, 2012
*Other visits=visits to participating ED for conditions that do not fit into one of the eight tracked syndromes (diarrhea, vomiting, respiratory, fever/influenza, asthma, sepsis, cold, rash).
Daily ratio of visits for diarrhea to other visits* Citywide signal Spatial signal by patient's home zipcode Spatial signal by hospital
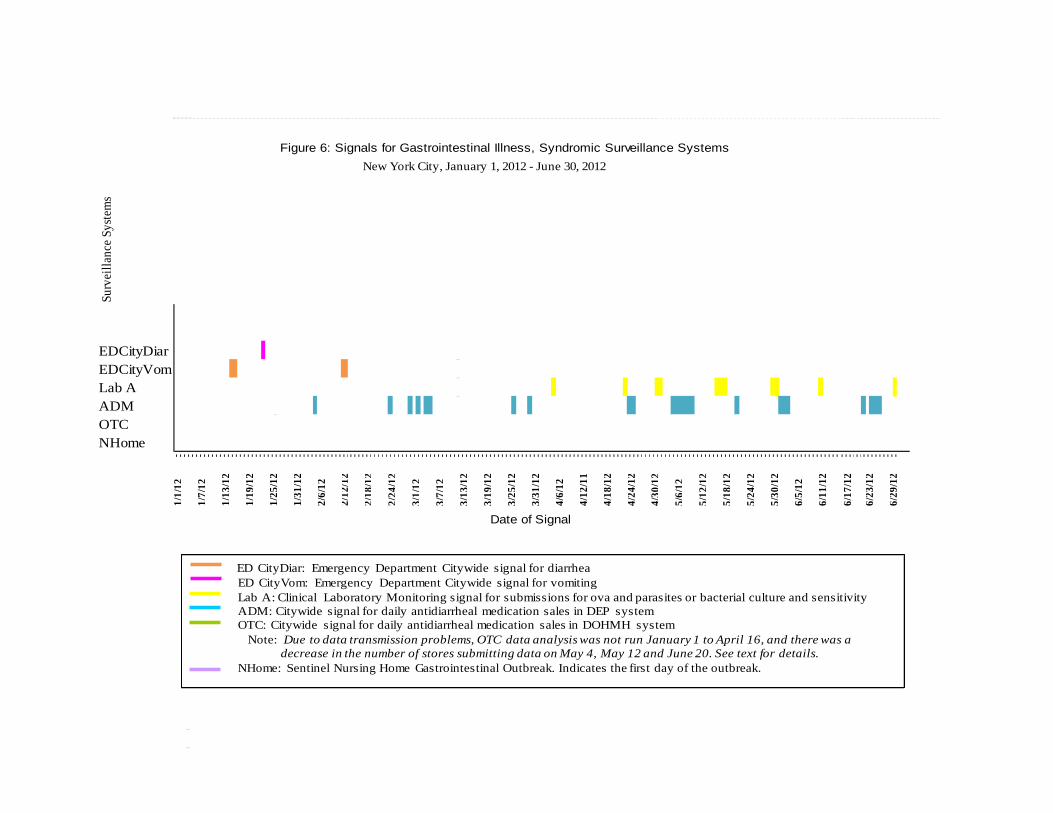
Figure 6: Signals for Gastrointestinal Illness, Syndromic Surveillance Systems New York City, January 1, 2012 - June 30, 2012
Surv
eilla
nce S
yste
ms
EDCityDiarEDCityVomLab AADMOTCNHome
- - - - - - - - - - - - - - - - - - - - - - - - - - - - - - - - - - - - - - - - - - - - - - - - - - - - - - - - - - - - - - - - - - - - - - - - - - - - - - - - - - - - - - - - - - - - - - - - - - - - - - - - - - - - - - - - - - - - - - - - - - - - - - - - - - - - - - - - - - - - - - - - - - - - - - - - - - - - - - - - - - - - - - - - - - - - - - - - - - - - - -
Date of Signal
6/17
/12
6/23
/12
6/29
/12
5/24
/12
5/30
/12
6/5/
12
6/11
/12
4/30
/12
5/6/
12
5/12
/12
5/18
/12
4/6/
12
4/12
/11
4/18
/12
4/24
/12
1/25
/12
1/31
/12
2/6/
12
2/12
/12
1/1/
12
1/7/
12
1/13
/12
1/19
/12
3/13
/12
3/19
/12
3/25
/12
3/31
/12
2/18
/12
2/24
/12
3/1/
12
3/7/
12
ED CityDiar: Emergency Department Citywide signal for diarrheaED CityVom: Emergency Department Citywide signal for vomitingLab A: Clinical Laboratory Monitoring signal for submissions for ova and parasites or bacterial culture and sensitivityADM: Citywide signal for daily antidiarrheal medication sales in DEP systemOTC: Citywide signal for daily antidiarrheal medication sales in DOHMH system
Note: Due to data transmission problems, OTC data analysis was not run January 1 to April 16, and there was a decrease in the number of stores submitting data on May 4, May 12 and June 20. See text for details.
NHome: Sentinel Nursing Home Gastrointestinal Outbreak. Indicates the first day of the outbreak.


![Waterborne Disease [FINAL]](https://img.pdfslide.us/doc/110x75/55a6e1d11a28ab9a558b4647/waterborne-disease-final.jpg)