Embed Size (px)
Citation preview

New York City Department of Health and Mental Hygiene Bureau of Communicable Disease
and
New York City Department of Environmental Protection
Bureau of Water Supply
Waterborne Disease Risk Assessment Program
2012 Annual Report
March 31, 2013
Prepared in accordance with Section 8.1 of the July 2007 United States Environmental Protection Agency Filtration Avoidance Determination
Prepared by: Lisa Alleyne, MPA (DOHMH)
Sharon Balter, MD (DOHMH/DEP) Daniel Cimini, RN, MPH (DOHMH) Anne Seeley, MPH (DEP)
With: David Lipsky, Marc Paladini, Robert Mathes, and other members of the Waterborne Disease Risk Assessment Program Team

THE WATERBORNE DISEASE RISK ASSESSMENT PROGRAM TEAM
The Waterborne Disease Risk Assessment Program (WDRAP) is an interagency program involving the New York City Departments of Environmental Protection and Health and Mental Hygiene
� New York City Department of Health and Mental Hygiene (DOHMH) Bureau of Communicable Disease
42-09 28th Street, CN-22A, Queens, New York, NY 11101-4132 Marcelle Layton, M.D., Assistant Commissioner Don Weiss, M.D., M.P.H., Medical Director, Surveillance & Data Analysis Unit Sharon Balter, M.D., Medical Director (WDRAP Coordinator for DOHMH) Daniel Cimini, R.N., M.P.H., City Research Scientist (WDRAP Asst. Coordinator) Lisa Alleyne, M.P.A., Public Health Epidemiologist Bureau of Communicable Disease: Ann Afordi, Erlinda Amoroso, Fazlul Chowdhury, Jennifer Hsieh, Muhammad Iftekharuddin, Lucretia Jones, Yin Ling Leung, Lan Li, Robert Mathes, Michelle Middleton, Daniel Osuagwu, Marc Paladini, Jose Poy, Dr. Alison Ridpath, Anna Smorodina, Renee Stewart and Rajmohan Sunkara
� New York City Department of Environmental Protection (DEP) Bureau of Water Supply
59-17 Junction Blvd., 20th Floor, Flushing, NY 11373-5108. David Lipsky, Ph.D., Chief, Distribution Water Quality Science & Research Division Anne Seeley, M.P.H., Section Chief, Health Assessment & Policy Coordination (WDRAP Coordinator for DEP)
========================================================= Additional copies of WDRAP reports are available from Anne Seeley at the DEP address listed above, by phone (718-595-5346), or E-mail: [email protected] Copies of the questionnaires used for disease surveillance are available from Daniel Cimini at the DOHMH address listed above, by phone (347-396-2623), or E-mail: [email protected] The authors wish to acknowledge the dedication of the other members of the Waterborne Disease Risk Assessment Program Team, and the assistance of Kathleen Czarnogorski (DEP), Neeraja Nalamothu (DEP), Fran Guerriero (DEP) and Giselle Merizalde (DOHMH).

TABLE OF CONTENTS Page Executive Summary Introduction 1 Part I: Disease Surveillance 2 Giardiasis 2 Cryptosporidiosis 5 Part II: Syndromic Surveillance/Outbreak Detection 9 Introduction 9 Program Components – Overviews and Updates 9 A. Nursing Home Sentinel Surveillance 9 B. Clinical Laboratory Monitoring 10 C. Anti-Diarrheal Medication Monitoring 11 D. Hospital Emergency Department Monitoring 13 Findings: Summary of Syndromic Surveillance Signals 13 Part III: Information Sharing and Public Education 16
Tables
Table 1: Giardiasis, number of cases and case rates, NYC, 1994-2012 18 Table 2: Giardiasis, number of cases, annual case rate per 100,000 population by sex and borough of residence, NYC, 2012 19 Table 3: Giardiasis, number of cases, annual case rate per 100,000 population by
UHF neighborhood of residence, NYC, 2012 21 Table 4: Giardiasis, number of cases, annual case rate per 100,000 population by
age group and sex, NYC, 2012 22 Table 5: Giardiasis, number of cases, annual case rate per 100,000 population by age group and borough, NYC, 2012 23 Table 6: Giardiasis, number of cases and case rates by census tract poverty level, NYC, 2012 24 Table 7: Cryptosporidiosis, number of cases and case rates,
NYC, 1994-2012 25 Table 8: Cryptosporidiosis, number of cases, annual case rate per 100,000 population by sex and borough, NYC, 2012 28 Table 9: Cryptosporidiosis, number of cases, annual case rate per 100,000 population by UHF neighborhood of residence, NYC, 2012 30 Table 10: Cryptosporidiosis, number of cases, annual case rate per 100,000 population by age group and sex, NYC, 2012 31 Table 11: Cryptosporidiosis, number of cases, annual case rate per 100,000 population by age group and borough, NYC, 2012 32 Table 12: Cryptosporidiosis, number of cases, annual case rate per 100,000 population by race/ethnicity and borough, NYC, 2012 33 Table 13: Cryptosporidiosis, number of cases, annual case rate per 100,000 population by race/ethnicity and age group, NYC, 2012 34 Table 14: Cryptosporidiosis, number of cases and case rates by census tract poverty level, NYC, 2012 35

Table 15: Percentage of interviewed cryptosporidiosis case-patients reporting selected potential risk exposures before disease onset, persons with HIV/AIDS, NYC, 1995-2012 39 Table 16: Percentage of interviewed cryptosporidiosis case-patients reporting selected potential risk exposures before disease onset, immunocompetent persons, NYC, 1995-2012 40 Table 17: Percentage of interviewed cryptosporidiosis case-patients by type of tap water exposure before disease onset, persons with HIV/AIDS, NYC, 1995-2012 41 Table 18: Percentage of interviewed cryptosporidiosis case-patients by type of tap water exposure before disease onset, immunocompetent persons, NYC, 1995-2012 42
Figures
Figure 1: Giardiasis, number of cases by month of diagnosis, NYC, July 1993 - Dec. 2012 17 Figure 2: Cryptosporidiosis, number of cases by month of diagnosis, NYC, Nov. 1994 - Dec. 2012 26 Figure 3: Cryptosporidiosis, number of cases by month of onset, NYC, Jan. 1995 - Dec. 2012 27 Figure 4: Cryptosporidiosis, number of cases among persons living with HIV/AIDS by month of diagnosis, NYC, Jan. 1995 - Dec. 2012 36 Figure 5: Cryptosporidiosis, number of cases among immunocompetent persons by month of diagnosis, NYC, Jan. 1995 - Dec. 2012 37 Figure 6: Cryptosporidiosis, number of cases by year and immune status, NYC, 1995-2012 38 Figure 7: Emergency Department Syndromic Surveillance, trends, visits for vomiting syndrome, NYC, Jan. 1 – Dec. 31, 2012 43 Figure 8: Emergency Department Syndromic Surveillance, trends, visits for diarrhea syndrome, NYC, Jan. 1 – Dec. 31, 2012 44 Figure 9: Signals for gastrointestinal illness, Syndromic Surveillance Systems, NYC, Jan. 1– June 30, 2012 45 Figure 10: Signals for gastrointestinal illness, Syndromic Surveillance Systems, NYC, July 1 – Dec. 31, 2012 46
Maps Map 1: Giardiasis annual case rate per 100,000 population by UHF neighborhood, NYC (2012) 20 Map 2: Cryptosporidiosis annual case rate per 100,000 population by UHF neighborhood, NYC (2012) 29

EXECUTIVE SUMMARY
The primary objectives of New York City’s Waterborne Disease Risk Assessment Program are to: (a) obtain data on the rates of giardiasis and cryptosporidiosis, along with demographic and risk factor information on case-patients; and (b) provide a system to track diarrheal illness to ensure rapid detection of any outbreaks. The program, jointly administered by the Department of Health and Mental Hygiene (DOHMH) and the Department of Environmental Protection (DEP), began in 1993. This report provides an overview of program progress, and data collected, during 2012. DISEASE SURVEILLANCE Active disease surveillance for giardiasis and cryptosporidiosis began in July 1993 and November 1994, respectively, and continued through 2010. In January 2011 active laboratory surveillance for giardiasis and cryptosporidiosis was discontinued as it had been replaced by an electronic reporting system. This report presents the number of cases and case rates for giardiasis and cryptosporidiosis in 2012 (and includes data from past years for comparison). Also, demographic information, including rates by census tract poverty level, for cases of giardiasis and cryptosporidiosis in 2012 was gathered and is summarized in this report. Telephone interviews of cryptosporidiosis case-patients to gather potential risk exposure information continued, and selected results are presented. Giardiasis and cryptosporidiosis rates have been on a general downward trend over the years of this surveillance program. From 2011 to 2012, the giardiasis case rate decreased slightly from 11.2 per 100,000 population in 2011 to 10.7 per 100,000 (872 cases) in 2012, and the cryptosporidiosis case rate increased from 1.1 per 100,000 to 1.5 per 100,000 (125 cases). Included in this report is a summary of an investigation of a possible increase in cases of giardiasis that occurred approximately one week after Hurricane Sandy made landfall in NYC. Results of the investigation indicated that the increase was likely due to a delay in testing and therefore reporting until after the hurricane, rather than due to exposure to Giardia as a consequence of the hurricane. SYNDROMIC SURVEILLANCE / OUTBREAK DETECTION The tracking of sentinel populations or surrogate indicators of disease (“syndromic surveillance”) can be useful in assessing gastrointestinal (GI) disease trends in the general population. Such tracking programs provide greater assurance against the possibility that a citywide outbreak would remain undetected. In addition, such programs can potentially play a role in limiting the extent of an outbreak by providing an early indication of a problem so that control measures may be rapidly implemented.
The City maintains four distinct and complementary outbreak detection systems. One system involves the tracking of chief complaints from hospital emergency department (ED) logs; under another system DOHMH monitors and assists in the investigation of GI outbreaks in eight sentinel nursing homes; and a third system tracks the number of stool specimens submitted to a clinical laboratory for microbiological testing. During and immediately following Hurricane Sandy, data was not available from approximately 21 of 49 EDs due to hospital shut downs and power outages. Data flow was subsequently restored and back-fill of data was obtained from the EDs that were in operation throughout the storm period. However, as a result of damage from the storm, five emergency departments were temporarily closed and one of the nursing homes

participating in the sentinel surveillance program was evacuated from November 6-13. The hurricane also resulted in a disruption, from October 29 to October 31, in normal operations in the laboratory participating in the clinical laboratory monitoring program. Normal operations at the laboratory resumed on November 1.
The fourth type of outbreak detection system in operation in the City involves monitoring
of sales of over-the-counter or non-prescription anti-diarrheal medications. The City’s anti-diarrheal medication monitoring activities have two components: the “ADM” system and the “OTC” system. The two systems monitor daily sales of non-prescription antidiarrheal medications at major store chains. The ADM system is managed by DEP and the OTC system is managed by DOHMH. Regarding the OTC system, in June 2011 there was a decrease in the number of stores reporting medication sales resulting from a disruption in data transmission that occurred because the store chain that had been submitting data merged with another large chain. From October 21, 2011 to April 16, 2012, due to very limited and inconsistent data transmission, DOHMH did not run the OTC analysis. In the interim period the number of stores providing data to the OTC system had been increased by the addition of more stores to the DOHMH OTC system and through the inclusion of stores from the DEP ADM system. Consequently, anti-diarrheal medication sales data from that data provider are currently analyzed by both DOHMH and DEP, resulting in some overlap between the DOHMH OTC system and the DEP ADM system. Enhancements now in effect in the OTC system include an increased number of stores providing data, new analytic methods, and separate analyses for citywide increases in sales of over-the-counter, non-bismuth-containing anti-diarrheal medications and of bismuth subsalicylate medications. The changes in administration of the retail pharmacies participating in the OTC system as described above have resulted in fluctuations in store reporting. In the coming year DOHMH is planning to conduct an evaluation of the system in order to determine whether there are ways to improve its utility. The ADM system, operated by DEP, was in operation throughout 2012.
A summary of syndromic surveillance findings for 2012 pertaining to GI illness is
presented. Sustained citywide signals in the ED system in January and February and again in late November and December are consistent with annual gastrointestinal viral trends. Most of the syndromic surveillance systems experienced some level of impact from Hurricane Sandy. However, core elements of the program remained in operation throughout the storm period, and overall the WDRAP team believes that these systems continued to provide data useful for detection of an outbreak. There was no evidence of a drinking water-related outbreak in New York City in 2012. INFORMATION SHARING AND PUBLIC EDUCATION Information sharing and education efforts have continued. A presentation was made to clinicians in two Brooklyn hospitals and in a Manhattan hospital in 2012. Information on Cryptosporidium and Giardia continues to be available on New York City Department of Environmental Protection’s and New York City Department of Health and Mental Hygiene’s websites, including annual reports on program activities, fact sheets on giardiasis and cryptosporidiosis, and results from the Department of Environmental Protection’s source water protozoa monitoring program.

1
INTRODUCTION
The ongoing primary objectives of New York City’s Waterborne Disease Risk Assessment Program (WDRAP) are to:
• obtain data on the rates of giardiasis and cryptosporidiosis, along with demographic and risk factor information on case-patients; and
• provide a system to track diarrheal illness to ensure rapid detection of any outbreaks.
Two City agencies are involved in this effort: the Department of Environmental Protection (DEP) and the Department of Health and Mental Hygiene (DOHMH). In addition to participation by staff from both agencies, a special interagency unit, the Parasitic Disease Surveillance Unit, was established to implement major components of this program. In the year 2001, the staff of the Parasitic Disease Surveillance Unit was merged with staff from the DOHMH Bureau of Communicable Disease (BCD). Staff members employed by DEP and DOHMH now jointly work on WDRAP activities as well as on other communicable disease activities. This merger increases the efficiency of the DOHMH BCD but does not affect WDRAP operations. Following below is a summary of program highlights and data for the year 2012. For this report the population denominators used to calculate rates were intercensal population estimates for all years except 2000 and 2010 to 2012. For the years 1994 through 1999, intercensal population estimates per year were used based upon linear interpolation between the 1990 and 2000 NYC Census.1 For the years 2001 through 2009, intercensal population estimates for each year were used from data produced by DOHMH based on the US Census Bureau Population Estimate Program and housing unit data obtained from the NYC Department of City Planning.2 For 2010 to 2012, the year 2010 NYC Census data were used.3 Because rates for the years 2001 through 2009 were calculated for this report using intercensal population estimates, they may differ from previously reported rates based on year 2000 NYC Census data. Other variations in data between this report and previous reports may be due to factors such as disease reporting delays, correction of errors, and refinements in data processing (for example, the removal of duplicate disease reports). All rates in this report are annual case rates. Caution must be exercised when interpreting rates based on very small case numbers.
For mapping purposes, United Hospital Fund (UHF) neighborhood of case-patient residence was used. New York City is divided on the basis of zip code into 42 UHF neighborhoods. Maps illustrating annual rates by UHF neighborhood are included in this report.
In this report, race/ethnicity-specific case rates for 2012 are based upon year 2010 Census
race/ethnicity categories and population counts. In previous reports, there was one race/ethnicity
1 For 1994-2000 NYC intercensal data citywide, by borough, and by UHF neighborhood see https://a816-healthpsi.nyc.gov/EpiQuery/Census/index.html 2 For 2001-2009 NYC intercensal data citywide, by borough, and by UHF neighborhood see https://a816-healthpsi.nyc.gov/EpiQuery/Census/index2001.html 3 For 2010 NYC Census data by geographic area and demographic subgroup see https://a816-healthpsi.nyc.gov/EpiQuery/Census/index2010.html

2
category entitled “Asian, Pacific Islander, American Indian, Alaskan Native, non-Hispanic.” In the current report there are separate categories for non-Hispanic Asians, non-Hispanic Pacific Islanders and Native Hawaiians, and non-Hispanic American Indians. In addition, there is a new, separate race/ethnicity category entitled “Other Race, non-Hispanic,” which pertains to non-Hispanics, of a single race which is not Black, White, Asian, Native Hawaiian, Pacific Islander, or American Indian. The WDRAP Annual Report now includes a socioeconomic status (SES) measure as part of the demographic description of cases of giardiasis and cryptosporidiosis in NYC. Differences in SES among cases of a disease may indicate economically-related disparities in health. In February 2011, a working group of DOHMH epidemiologists proposed a standard demographic variable, neighborhood poverty, to measure disparities in disease for all routinely collected disease surveillance data that includes geolocating information on case-patients (i.e., street address and zip code). Neighborhood poverty is a potential proxy for individual SES and also may have an independent effect on the incidence of certain diseases. The poverty level of the neighborhood of case-patient residence is measured as the percentage of individuals in the neighborhood who live below the federal poverty level, as reported in census data. (The use of neighborhood poverty as an SES measure in public health surveillance is described further in: Krieger N, Chen JT, Waterman PD, Rehkopf DH, Subramanian SV. Painting a Truer Picture of US Socioeconomic and Racial/Ethnic Health Inequalities: the Public Health Disparities Geocoding Project. American Journal of Public Health. 2005; 95[2]: 312-323.) The neighborhood unit that is analyzed and aggregated for the poverty level tables in this report is the NYC census tract. The percent of census tract residents with household income level below 100% of the federal poverty level is the unit of analysis. Four categories for data analysis were utilized: low neighborhood poverty (<10% of residents have household incomes that are below the federal poverty level), medium neighborhood poverty (10-19%), high neighborhood poverty (20-29%), and very high neighborhood poverty (>30%). In this report American Community Survey 2007-2011 data were used for census tract poverty levels. Rates by census tract poverty level for giardiasis and cryptosporidiosis are presented as crude and age-adjusted rates, as compared to the prior WDRAP Annual Report which included crude rates only. PART I: DISEASE SURVEILLANCE Giardiasis New York City implemented a program of active surveillance for giardiasis in July 1993 to ensure complete reporting of all laboratory-diagnosed cases. Active laboratory surveillance (regular site visits or telephone contact with laboratories) continued through 2010. As reported in the WDRAP 2010 and 2011 Annual Reports, in January 2011 active laboratory surveillance for giardiasis and cryptosporidiosis was discontinued, as it had been replaced by an electronic reporting system.

3
Case rates and basic demographic findings were compiled and reported on a quarterly basis through July 2002. Beginning January 2003, rates and demographic findings have been compiled on a semi-annual basis. During 2012, a total of 872 cases of giardiasis were reported to DOHMH and the annual case rate was 10.7 per 100,000. Annual case numbers decreased 5.0% from 2011 to 2012. From 1994 to 2012 annual case numbers declined 64.5% (see Table 1 and Figure 1). Since September 1995, case investigations for giardiasis are conducted only for case-patients who are in a secondary transmission risk category (e.g., food handler, health care worker, child attending day care, or day care worker), or when giardiasis clusters or outbreaks are suspected. A total of 51 such cases of giardiasis were investigated in 2012. Fifty cases were part of an investigation of a possible increase in giardiasis after Hurricane Sandy, as will be described below. One giardiasis case occurred in an individual who was reported as a food handler. The following provides some highlights from the surveillance data for giardiasis among New York City residents from January 1 through December 31, 2012. Additional data are presented in the tables, figures and maps that appear later in this report. Borough of case-patient residence Borough of case-patient residence was known for all 872 giardiasis case-patients who resided in New York City. Manhattan had the highest borough-specific annual case rate (20.5 cases per 100,000) (Table 2). The highest UHF neighborhood-specific case rate was found in the Chelsea-Clinton neighborhood in Manhattan (47.6 cases per 100,000) (Map 1 and Table 3). Sex Information regarding sex was available for all cases. The number and rate of giardiasis cases were higher in males than females, with 620 males (16.0 cases per 100,000) and 252 females (5.9 cases per 100,000) reported. The highest sex- and borough-specific case rate was observed among males residing in Manhattan (34.8 cases per 100,000) (Table 2). Age Information regarding age was available for all cases. The highest age group-specific case rates were among children 5 to 9 years old (17.8 cases per 100,000) and children less than 5 years old (16.8 cases per 100,000). The highest age group and sex-specific case rates were among males 5-9 years old (21.5 cases per 100,000), males 45-59 years old (20.6 cases per 100,000), and males less than 5 years old (20.0 cases per 100,000) (Table 4). The highest age group- and borough-specific case rates were among persons 45-59 years old in Manhattan (29.4 cases per 100,000), children less than 5 years old in Manhattan (24.8 cases per 100,000) and children 5-9 years old in Brooklyn (24.5 cases per 100,000) (Table 5). Race/Ethnicity Information regarding race/ethnicity was available for 116 of 872 cases (13.3%). Ascertainment of race/ethnicity status for giardiasis cases was poor. As indicated above, giardiasis case-patients are not routinely interviewed unless they are in occupations or settings

4
that put them at increased risk for secondary transmission or if they are part of a suspected cluster or outbreak. For the majority of giardiasis cases, race/ethnicity information, when provided, is not based upon self-report, but rather upon the impressions of health care providers, which may be inaccurate. For this reason, and because race/ethnicity information was missing from many giardiasis disease reports, race/ethnicity findings pertaining to giardiasis cases diagnosed in 2012 are not presented in this report. Census Tract Poverty Level Age-adjusted case rates for giardiasis among four levels of census tract poverty, with gradients encompassing low poverty to very high poverty, ranged from 8.6 to 11.6 cases per 100,000 population, with the lowest rate occurring in census tracts with very high poverty levels (Table 6). In 2011 there was a more narrow distribution of giardiasis case rates among census tract poverty levels (range in 2011: 11.1 to 12.0 per 100,000). This variation in findings suggests that more years of data or further analysis may be needed to determine whether neighborhood poverty is associated with the occurrence of giardiasis in New York City. It must be noted that under-diagnosis of giardiasis may have occurred among individuals without health insurance who are less likely to access care and have laboratory testing done. Investigation of Possible Increase in Cases of Giardiasis after Hurricane Sandy, November 2012 The DOHMH BCD Data Analysis Unit runs a weekly trends analysis program to detect statistically significant increases (or “signals”) in disease case counts. A disruption of services in several hospitals, laboratories and medical practices in the aftermath of Hurricane Sandy resulted in a decrease in the number of diseases reported to DOHMH, affecting the ability of the trends analysis program to detect disease increases. BCD therefore developed a modified trends analysis program that adjusted for the decreased number of disease reports received. On November 16 this modified trends analysis program indicated a possible citywide signal for giardiasis cases diagnosed from November 5 to November 10. Twenty cases were reported when eight to nine would be expected. On subsequent dates when the modified trends analysis program was run, the citywide signal did not recur, though there was a signal for giardiasis in the Bronx on November 17 (5 cases reported, 1-2 expected) and for UHF neighborhood Coney Island in Brooklyn on November 21 (2 case reported, <1 expected). On November 27 DOHMH began interviewing giardiasis case-patients to determine whether the possible increase in giardiasis cases was related to Hurricane Sandy. The giardiasis case-patient questionnaire was modified to include questions pertaining to exposure to flood water, loss of running water, loss of electric power, and change of usual place of residence after the hurricane. All giardiasis case-patients residing in NYC who were diagnosed from November 5 and reported to BCD as of November 27 (n=50) were selected for screening interview. Interviews regarding possible exposures to Giardia were completed for case-patients reporting onsets on or after November 5. The date November 5 was selected because Hurricane Sandy made landfall in NYC on October 29, and the incubation period for giardiasis is one to three weeks after exposure. Of the 50 cases selected, interviews were completed (46 case-patients) or partially completed (2 case-patients) for a total of 48 case-patients. Of those 48 case-patients, 39 (81%)

5
had symptoms. Among symptomatic case-patients symptoms most frequently reported were diarrhea (83%), bloating/gas (76%), and abdominal cramps (74%). For asymptomatic case-patients, the diagnosis date was used as a substitute for the symptom onset date. Of the 48 case-patients who were interviewed, 31 (65%) had a symptom onset or diagnosis date before November 5. Only 17 case-patients (35%) had a symptom onset or diagnosis date on or after November 5. Of this group, 14 (82%) were male, and the median age was 30 years old (range 2–92). Boroughs of residence were as follows: Manhattan, 7 case-patients (41%); Queens, 6 (35%), Bronx, 2 (12%), and Brooklyn, 2 (12%). Regarding possible exposures to Giardia, one of the 17 did not answer exposure question. Of the remaining 16 case-patients, one had travelled outside the US during the incubation period (to India). Two case-patients with no symptoms had recently immigrated to the US (from the Dominican Republic and Bangladesh), but prior to the three weeks before diagnosis date. One of the 16 had recreational water exposure and five were exposed to animals. Of the ten adult case-patients, two reported sexual activities in which there is increased risk for giardiasis transmission. Regarding post-hurricane exposures, five cases lost power, two lost water, two relocated, and one person was exposed to floodwater. Regarding exposure to NYC tap water, 9 (56%) of the 16 case-patients stated that they did not drink unboiled or unfiltered NYC tap water during the 1 to 3 weeks before onset, and 7 (44%) stated that they did. Of the 9 case-patients who stated that they did not drink unboiled or unfiltered NYC tap water, all 9 reported an incidental exposure to NYC tap water (i.e., using unboiled, unfiltered tap water to brush teeth, wash fruits and vegetables, make ice, or make juice from a concentrate). A healthy control group was not interviewed. It could therefore not be determined whether there was increased exposure to NYC tap water among giardiasis case-patients who became ill after the hurricane in comparison to healthy controls. During the time that the modified trends analysis was used (from November 16 to November 26), no citywide increases in giardiasis were noted after the initial observation on November 16. In addition, when use of the modified trends analysis program was discontinued with a return to normal levels of disease reporting, no citywide increases in giardiasis were noted using the standard trends analysis program. There was no overall increase of Giardia cases, and most cases selected for interview reported illness onset before November 5. The increase picked up with the modified trends analysis on November 16 was likely due to a delay in testing and therefore reporting until after the hurricane, rather than due to exposure to Giardia as a consequence of the hurricane. Cryptosporidiosis Cryptosporidiosis was added to the list of reportable diseases in the New York City Health Code, effective January 1994. Active disease surveillance for cryptosporidiosis began in November 1994 and continued through 2010. As noted above with regard to giardiasis surveillance, active surveillance for cryptosporidiosis was also discontinued in January 2011 and replaced with electronic reporting.
6
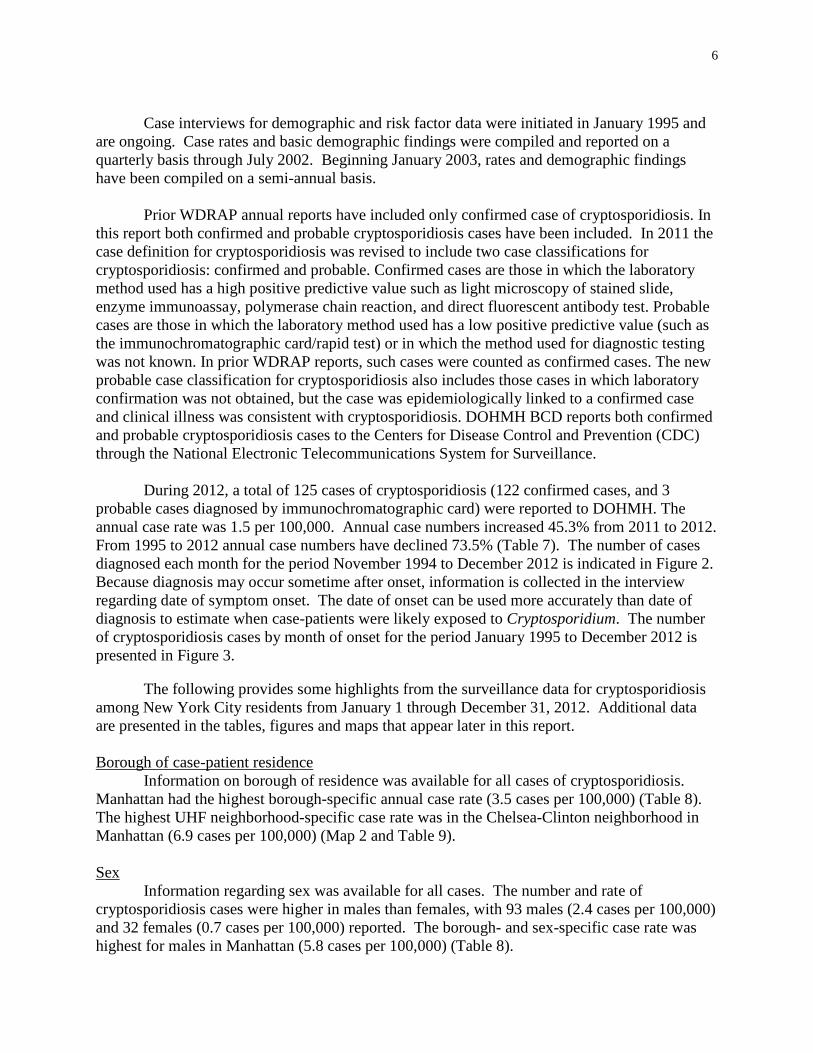
Case interviews for demographic and risk factor data were initiated in January 1995 and are ongoing. Case rates and basic demographic findings were compiled and reported on a quarterly basis through July 2002. Beginning January 2003, rates and demographic findings have been compiled on a semi-annual basis. Prior WDRAP annual reports have included only confirmed case of cryptosporidiosis. In this report both confirmed and probable cryptosporidiosis cases have been included. In 2011 the case definition for cryptosporidiosis was revised to include two case classifications for cryptosporidiosis: confirmed and probable. Confirmed cases are those in which the laboratory method used has a high positive predictive value such as light microscopy of stained slide, enzyme immunoassay, polymerase chain reaction, and direct fluorescent antibody test. Probable cases are those in which the laboratory method used has a low positive predictive value (such as the immunochromatographic card/rapid test) or in which the method used for diagnostic testing was not known. In prior WDRAP reports, such cases were counted as confirmed cases. The new probable case classification for cryptosporidiosis also includes those cases in which laboratory confirmation was not obtained, but the case was epidemiologically linked to a confirmed case and clinical illness was consistent with cryptosporidiosis. DOHMH BCD reports both confirmed and probable cryptosporidiosis cases to the Centers for Disease Control and Prevention (CDC) through the National Electronic Telecommunications System for Surveillance. During 2012, a total of 125 cases of cryptosporidiosis (122 confirmed cases, and 3 probable cases diagnosed by immunochromatographic card) were reported to DOHMH. The annual case rate was 1.5 per 100,000. Annual case numbers increased 45.3% from 2011 to 2012. From 1995 to 2012 annual case numbers have declined 73.5% (Table 7). The number of cases diagnosed each month for the period November 1994 to December 2012 is indicated in Figure 2. Because diagnosis may occur sometime after onset, information is collected in the interview regarding date of symptom onset. The date of onset can be used more accurately than date of diagnosis to estimate when case-patients were likely exposed to Cryptosporidium. The number of cryptosporidiosis cases by month of onset for the period January 1995 to December 2012 is presented in Figure 3.
The following provides some highlights from the surveillance data for cryptosporidiosis among New York City residents from January 1 through December 31, 2012. Additional data are presented in the tables, figures and maps that appear later in this report. Borough of case-patient residence Information on borough of residence was available for all cases of cryptosporidiosis. Manhattan had the highest borough-specific annual case rate (3.5 cases per 100,000) (Table 8). The highest UHF neighborhood-specific case rate was in the Chelsea-Clinton neighborhood in Manhattan (6.9 cases per 100,000) (Map 2 and Table 9). Sex Information regarding sex was available for all cases. The number and rate of cryptosporidiosis cases were higher in males than females, with 93 males (2.4 cases per 100,000) and 32 females (0.7 cases per 100,000) reported. The borough- and sex-specific case rate was highest for males in Manhattan (5.8 cases per 100,000) (Table 8).

7
Age Information regarding age was available for all cases. The highest age group-specific case rates were observed in children less than 5 years old (2.7 cases per 100,000) and in persons 20-44 years old (2.3 cases per 100,000). The highest age group- and sex-specific case rates were in males 20-44 years old (4.1 cases per 100,000) and females less than 5 years old (3.2 cases per 100,000) (Table 10). The highest age group and borough-specific case rates occurred in children less than 5 years old in Manhattan (5.2 cases per 100,000), persons 45-59 years old (5.1 cases per 100,000) in Manhattan and in persons 20-44 years old in Manhattan (4.6 cases per 100,000) (Table 11). Race/Ethnicity Race/ethnicity information was available for 115 of 125 cases (92%). The racial/ethnic group-specific case rate was highest among American Indian non-Hispanics (5.7 cases per 100,000); however, there was only one case in this race/ethnicity group. The next highest racial/ethnic group-specific case rate occurred among Black non-Hispanics (1.8 cases per 100,000). The highest race/ethnicity and borough-specific case rate occurred among American Indian non-Hispanics in Manhattan (46.6 cases per 100,000); however, there was only one case in this race group/borough category. The next highest race group and borough specific case rates occurred in non-Hispanics of other race in Manhattan (5.7 cases per 100,000) and Black non-Hispanics in Manhattan (4.9 cases per 100,000) (Table 12). The highest age group- and race/ethnicity-specific case rates occurred among 20-44 year old American Indian non-Hispanics (1 case, 17.3 cases per 100,000). The highest number of cases occurred among 20 to 44 year old non-Hispanic Whites (23 cases, case rate 2.2 per 100,000) (Table 13). Census Tract Poverty Level Age-adjusted case rates for cryptosporidiosis among four levels of census tract poverty ranged from 1.1 to 2.0 cases per 100,000 population (Table 14). Case rates for census tracts at the four poverty levels were similar and close to the citywide cryptosporidiosis case rate (1.5 cases per 100,000). This narrow distribution of case rates among census tract poverty levels suggests that neighborhood poverty and level of household income have not been determinants in the occurrence of cryptosporidiosis in New York City in 2012. Cryptosporidiosis and Immune Status
Trends observed over the years in reported number of cryptosporidiosis cases have differed between persons living with HIV/AIDS and those who are immunocompetent. Reported cryptosporidiosis cases among persons living with HIV/AIDS decreased considerably, from 392 in 1995 to 67 in 2012, thus causing a decline in the overall number of cryptosporidiosis cases in New York City. However, during the years 1995 through 2012, the number of cases of cryptosporidiosis among immunocompetent persons has shown less variation, ranging from 33 cases in 2009 to 139 cases in 1999. In 2012, there were 55 cryptosporidiosis cases among immunocompetent persons (see Figures 4, 5 and 6). An analysis of trends using Poisson regression to compare the number of cases of cryptosporidiosis among persons with HIV/AIDS to the number of cases among the immunocompetent indicates that the overall decline from 1995 to 2012 was significantly greater in patients who were immunocompromised than in those who

8
were not (P<.01). This decline is generally thought to be due to highly active antiretroviral therapy which was introduced in 1996-1997 for persons living with HIV/AIDS.
Cryptosporidiosis and Potential Risk Exposures
Of the 125 cryptosporidiosis cases diagnosed among NYC residents in 2012, questionnaires concerning potential exposures were completed in 97 cases (77.6%). Reasons for non-completion of questionnaires were: unable to locate case-patient (14 cases, 11.2%), refused (12 cases, 9.6%), and unable to interview due to incapacitating illness (2 cases, 1.6%). Of the immunocompetent case-patients, interviews were completed for 46 case-patients (83.6%). Among persons with HIV/AIDS, interviews were completed for 49 case-patients (73.1%). Summary data for 1995 through 2012 on commonly reported potential risk exposures, obtained from case-patient interviews of persons with HIV/AIDS and from interviews of persons who are immunocompetent, are presented in Tables 15 and 16, respectively. Information has also been collected regarding type of tap water consumption, and is presented in Tables 17 and 18. Tables 15 to 18 indicate the percentage of case-patients who reported engaging in each of the listed potential risk exposures for cryptosporidiosis before disease onset. However, it must be noted that the determination of an association between exposure to possible risk factors for cryptosporidiosis and acquisition of cryptosporidiosis cannot be made without reference to a suitable control population (i.e., non-Cryptosporidium-infected controls). As exposure data for a control population are not available, such determinations of association cannot be made.
Though no conclusions about association can be reached, in an attempt to assess if there
are any patterns of interest, data has been compared between patients who are immunocompromised due to HIV/AIDS and patients who are immunocompetent. Looking at four potential risk categories from Tables 15 and 16 using the chi-square test for comparison of data since 2001, the following results were observed. Patients who were immunocompetent were significantly more likely to report international travel (P<.01 all years except 2009, P<.05), and to report exposure to recreational water in all years except 2003, 2006, 2007, and 2011 (2001-2002, P<.01; 2003, P=.17; 2004, P<.05; 2005, P<.01; 2006, P=.24; 2007, P=.06; 2008, P<.05; 2009-2010, P<.01, 2011, P=.06, 2012, P=<.01). There was no statistically significant difference between these two groups in the proportion of cases reporting animal contact in 2001 to 2012, or reporting high-risk sex in 2001 to 2005, 2007, and 2009 to 2012. In 2006 and 2008, the proportion of cases reporting high-risk sex was significantly higher among persons with HIV/AIDS than among immunocompetent persons (P<.01). It should be noted that high-risk sex in this context refers to having a penis, finger or tongue in a partner’s anus. Information about sexual practices is gathered via phone interview and may not be reliable. These data indicate that, for most years, immunocompetent case-patients were more likely to travel internationally and have recreational water exposure than immunocompromised case-patients. International travel and exposure to recreational water may be more likely risk factors for the acquisition of cryptosporidiosis in the immunocompetent group. However, as noted above, the extent to which these risk factors may have been associated with cryptosporidiosis cannot be determined without comparison to a control population.

9
PART II: SYNDROMIC SURVEILLANCE / OUTBREAK DETECTION Introduction
The tracking of sentinel populations or surrogate indicators of disease (“syndromic surveillance”) can be useful in assessing gastrointestinal (GI) disease trends in the general population. Such tracking programs provide greater assurance against the possibility that a citywide outbreak would remain undetected. In addition, such programs can potentially play a role in limiting the extent of an outbreak by providing an early indication of a problem so that control measures may be rapidly implemented. Over the years, beginning in the 1990s, the City has established and maintained a number of distinct and complementary outbreak detection systems. One system monitors and assists in the investigation of GI outbreaks in sentinel nursing homes. Another system monitors the number of stool specimens submitted to a participating clinical laboratory for microbiological testing, and a third system utilizes hospital emergency department (ED) chief complaint logs to monitor for outbreaks. The City also utilizes two systems for monitoring sales of anti-diarrheal medications: one system is known as the ADM system and the other as the OTC system. All systems rely upon the voluntary participation of the organizations providing the syndromic data. A summary of syndromic surveillance findings pertaining to GI illness for 2012 is provided in the final section of this part, on pages 13 to 16. Program Components – Overviews and Updates
A. Nursing Home Sentinel Surveillance
The nursing home surveillance system began in March 1997 and was significantly
modified in August 2002. Under the current protocol, when a participating nursing home notes an outbreak of gastrointestinal illness that is legally reportable to the New York State Department of Health (NYSDOH), the nursing home also notifies designated WDRAP team members working in the DOHMH BCD. Such an outbreak is defined as onset of diarrhea and/or vomiting involving three or more patients on a single ward/unit within a seven-day period, or more than the expected (baseline) number of cases within a single facility. All participating nursing homes have been provided with stool collection kits in advance. When such an outbreak is noted, specimens are to be collected for testing for bacterial culture and sensitivity, ova and parasites, Cryptosporidium, viruses, and Clostridium difficile toxin testing. Though C. difficile is not a waterborne pathogen, C. difficile toxin testing was added in April 2010 in order to address a need expressed by infection control practitioners in the nursing homes, and was intended to help ensure compliance with the sentinel nursing home protocol.
DOHMH BCD staff facilitates transportation of the specimens to the City’s Public Health
Laboratory. Testing for culture and sensitivity occurs at the Public Health Laboratory. On May 1, 2011 the DOHMH Public Health Laboratory discontinued parasitology testing. Specimens for ova and parasites and Cryptosporidium, as well as for viruses and C. difficile toxin testing, are currently being sent to NYSDOH Wadsworth Center. There are currently eight nursing homes participating in the program. Three are in Manhattan, two are in the Bronx, two are in Queens, and one is in Brooklyn. As feedback for their role in outbreak detection, participating nursing

10
homes are provided with copies of Waterborne Disease Risk Assessment Program semi-annual and annual reports.
During the months of November and December 2012 and January and February 2013, a WDRAP team member from DOHMH BCD made site visits to all eight nursing homes participating in the Nursing Home Sentinel Surveillance system. During the site visits, the DOHMH staff member reviewed with nursing administration or infection control staff the rationale for the program and program protocol. In addition, the DOHMH staff member verified that the nursing homes had adequate stool collection supplies on hand. All participating nursing homes are visited at least once a year to help ensure compliance with the program protocol.
Due to damage incurred as a result of Hurricane Sandy, there was an evacuation in one
of the nursing homes participating in the sentinel surveillance program on November 6; residents were returned to the facility on November 13. Also due to the hurricane, a second nursing home evacuated approximately 100 residents from their facility to another nursing home which is also participating in sentinel surveillance. Those residents were subsequently admitted to the receiving nursing home. The other six participating nursing homes remained in operation throughout 2012. B. Clinical Laboratory Monitoring
The number of stool specimens submitted to clinical laboratories for bacterial and parasitic testing also provides information on gastrointestinal illness trends in the population. NYC’s Clinical Laboratory Monitoring program currently collects data from one large laboratory, designated as Laboratory A in this report. (The number of participating laboratories has changed over time, as reported in prior WDRAP reports.) Laboratory A transmits data by fax to DOHMH BCD daily to three times per week, indicating the number of stool specimens examined per day for: (a) bacterial culture and sensitivity, (b) ova and parasites, and (c) Cryptosporidium.
Clinical Laboratory Monitoring results are reviewed upon receipt. Beginning in August
2004, DOHMH started implementation of a computer model to establish statistical cut-offs for significant increases in clinical laboratory submissions. The model uses the entire historical dataset, that is, since November 1995 for Laboratory A. Sundays and holidays are removed because the laboratories do not test specimens on those days. Linear regression is used to adjust for average day-of-week and day-after-holiday effects as certain days routinely have higher volumes than other days. The cumulative sums (CUSUM) method is applied to a two-week baseline to identify statistically significant aberrations (or signals) in submissions for ova and parasites and for bacterial culture and sensitivity. CUSUM is a quality control method that has been adapted for aberration-detection in public health surveillance. (CUSUM is described further in: Hutwagner L, Maloney E, Bean N, Slutsker L, Martin S. Using Laboratory-Based Surveillance Data for Prevention: An Algorithm for Detecting Salmonella Outbreaks. Emerging Infectious Diseases. 1997; 3[3]: 395-400.)
Due to Hurricane Sandy there was a disruption in normal operations in the participating
clinical laboratory from October 29 to October 31. Normal operations at the laboratory resumed on November 1.

11
C. Anti-Diarrheal Medication Monitoring
The tracking of sales of anti-diarrheal medications is a potentially useful source of information about the level of diarrheal illness in the community. NYC began tracking anti-diarrheal drug sales as a public health indicator in 1995.4 Modifications to NYC’s anti-diarrheal surveillance program have been made over the years, and in 2002 NYC’s program was enhanced by two additional drug-tracking systems, the OTC system and the National Retail Data Monitor (NRDM) system. Participation of DOHMH in the NRDM system was discontinued in November 2007. Currently NYC utilizes two systems to monitor sales of anti-diarrheal medications: the ADM system and the OTC system. (NOTE: the program names “ADM” and “OTC” are abbreviations for “Anti-diarrheal Medications” and “Over-the-Counter.” Both systems involve the tracking of over-the-counter or non-prescription anti-diarrheal medications, but the program names were chosen simply as a way to distinguish the two systems.)
The ADM System
In 1996, NYC’s ADM system was established, utilizing volume-of-sales information of non-prescription anti-diarrheal medications obtained weekly from a major store chain. As discussed in previous WDRAP reports, a number of significant enhancements have been made to DEP’s ADM system since that time. In March 2010, DEP implemented an enhanced ADM system as a pilot program. This enhanced program is still in operation and includes the following features: (a) ADM data is received in digital format on a daily basis; (b) more products and more stores are included; (c) Health and Beauty products sales volume data is now utilized in the analysis in an effort to “normalize” the data (e.g., to help account for changing store traffic on different days of the week); (d) data on promotional sales vs. non-promotional sales is provided directly by the data provider; and (e) CDC’s Early Aberration Reporting System (EARS) is used for analysis of signals. EARS uses three aberration detection methods which are based on a one-sided positive CUSUM calculation. Data is analyzed in terms of citywide sales and sales by borough.
The ADM system was in operation at DEP throughout 2012. The supply of data from the ADM data provider to DEP was very reliable. Some data analysis and reporting delays were experienced at DEP sporadically during 2012. The metrics tracking system, established by the ADM Program under the EPA-funded Water Security Initiative, continued. The ADM system experienced data impacts as well as some reporting delays during and following Hurricane Sandy. Daily data was received from the data provider throughout the storm period, however there were data flow reductions beginning on October 28-29, and continuing most noticeably through November 1. Data analysis and review by DEP staff also experienced some delays related to the storm. The ADM signal detection system utilizes a ratio of ADM sales to other product sales which should reduce the impact of reporting reductions such as from Hurricane Sandy; however, care in data interpretation is still warranted (see discussion of ADM results below, under “Findings: Summary of Syndromic Surveillance Signals”).
4 The first NYC anti-diarrheal medication tracking system, involving data from a regional distributor serving independent pharmacies, was implemented in 1995. This system was discontinued in 2000 due to a diminishing data stream. This summary of NYC anti-diarrheal medication monitoring programs therefore begins with discussion of the ADM system which was implemented in 1996 and is ongoing.

12
The OTC System The second of the currently operating drug monitoring systems, the OTC system, was
started in 2002 by DOHMH. When it was initiated, this system involved the monitoring of anti-diarrheal medication sales at a second store chain. Currently, as will be described below, the OTC system receives medication sales data from two corporations consisting of several major chains. When the OTC system was initiated, the goal was to develop a system that would provide more timely and detailed data than the ADM tracking system in place at the time. Also, the OTC system collects data on other medicines, including fever and allergy medications, for broader bioterrorism and emerging infectious disease surveillance purposes. Routine daily analyses for the OTC system began in mid-December 2002. Currently, each daily electronic file contains data for 30,000-40,000 non-prescription medication sales. A separate file is also sent daily by one of the data providers which contains approximately 12,000 prescription medication sales. However, the prescription medications have not been found to be as useful as the non-prescription medications for monitoring diarrheal illness in the OTC system, and therefore sales data of prescription anti-diarrheal medications are not routinely analyzed. Drugs are categorized into key syndromes, and trends are analyzed for citywide increases in sales of non-prescription anti-diarrheal medications. Prior to 2012, the gastrointestinal category included generic and brand name loperamide-containing agents and bismuth subsalicylate agents.
As noted in the 2011 WDRAP Annual Report, beginning in mid-June 2011, there was a decrease in the number of stores reporting medication sales to the OTC system. The decrease resulted from a disruption in data transmission that occurred because the store chain that had been submitting data merged with another large chain and underwent a revision to their data system as stores were being gradually moved over to the new system. This change affected the ability of the OTC system to detect signals in anti-diarrheal medication sales from mid-June 2011 to October 2011. From October 21, 2011 to April 16, 2012, due to very limited and inconsistent data transmission, DOHMH did not run the OTC analysis. On April 17, when consistent data transmission was restored, OTC data analysis was resumed. In the interim period the number of stores providing data to the OTC system had been increased by the addition of more stores to the DOHMH OTC system and through the inclusion of stores from the DEP ADM system. The ADM system addition was made possible through an arrangement among DEP, DOHMH and the data provider that had been submitting data to the DEP ADM system. Consequently, anti-diarrheal medication sales data from that data provider are currently analyzed by both DOHMH and DEP, resulting in some overlap between the DOHMH OTC system and the DEP ADM system. The plan is for DEP to eventually phase out its ADM monitoring program. Enhancements now in effect in the OTC system include an increased number of stores providing data, new analytic methods, and separate analyses for citywide increases in sales of over-the-counter, non-bismuth-containing anti-diarrheal medications and of bismuth subsalicylate medications.
From April 17 to December 31, 2012, a mean of 328 stores submitted daily data for OTC analysis. During this period, there were 20 days when the number of stores reporting fell two standard deviations below the mean. A back-fill of data for these days has been requested. The changes in administration of the retail pharmacies participating in the OTC system as described above have resulted in fluctuations in store reporting. In the coming year DOHMH is planning

13
to conduct an evaluation of the system in order to determine whether there are ways to improve its utility.
D. Hospital Emergency Department Monitoring
NYC initiated monitoring of hospital emergency department visits as a public health surveillance system in 2001. Throughout most of year 2012, DOHMH received electronic data from 49 of New York City’s 52 EDs reporting approximately 11,000 visits per day, roughly 95% of all ED visits citywide. Due to damage from Hurricane Sandy, starting on October 29, 2 to 5 of the participating EDs were temporarily closed. Hospitals transmit electronic files each morning containing chief complaint and demographic information for patient visits during the previous 24 hours. Patients are classified into syndrome categories, and daily analyses are conducted to detect any unusual patterns, or signals. The two syndromes used to track gastrointestinal illness are vomiting syndrome and diarrhea syndrome. Temporal citywide analyses assess whether the frequency of ED visits for the syndrome has increased in the last one, two or three days compared to the previous fourteen days. Spatial analyses scan the data for geographic clustering in syndrome visits on the most recent day compared to the previous 14 days. Clustering is examined by both hospital location and residential zip code. Statistical significance is based on Monte Carlo probability estimates that adjust for the multiple comparisons inherent in examining many candidate clusters each day. The threshold of significance for citywide and spatial signals was set at P<.01, indicating that fewer than 1 out of every 100 analyses would generate a cluster due to chance alone. Beginning March 11, 2005, the threshold of significance for spatial signals was changed to P<.005, while the threshold of significance for citywide signals remained at P<.01. (The system is described further in: Hefferman R, Mostashari F, Das D, Karpati A, Kulldorf M, Weiss D. Syndromic Surveillance in Public Health Practice, New York City. Emerging Infectious Diseases. 2004; 10[5]: 858-864.)
Due to Hurricane Sandy, there were data transmission problems in the ED system in 2012. During and immediately following the storm, data was not available from approximately 21 of 49 EDs due to hospital shut downs and power outages. Data flow was subsequently restored and back-fill of data was obtained from the EDs that were in operation throughout the storm period. As noted above, due to damage from the storm, five emergency departments were temporarily closed. As of this writing, two of those hospitals are still currently closed. As hospitals come back on line their data is reintegrated into the ED syndromic surveillance system. Findings: Summary of Syndromic Surveillance Signals
Syndromic surveillance signals alone cannot be used to determine etiologic diagnoses. Also, experience has shown that most signals, especially localized spatial signals in the emergency department system or signals in the laboratory or anti-diarrheal medication monitoring systems, may be statistical aberrations and not related to public health events. The systems are therefore used in concert. A signal in one system is compared to other systems to see whether or not there are concurrent signals. In this report Figures 7 to 10 summarize GI disease signals from NYC’s syndromic surveillance systems. Figures 7 and 8 summarize ED system trends and signals for 2012. Figures 9 and 10 summarize signal results from all syndromic surveillance systems operated by DOHMH and DEP during 2012.

14
Figure 7 shows a graphic representation of the ratio of daily ED visits for the vomiting syndrome to all other daily ED visits for syndromes not tracked by ED syndromic surveillance (“other visits”) from January 1 to December 31, 2012. The graph also indicates the occurrence of citywide signals and of the spatial residential zipcode and hospital signals. Figure 8 is the same graph for the syndrome of diarrhea. Figures 7 and 8 indicate that there were citywide vomiting signals from January 15-16 and from February 12-13, and a citywide diarrhea signal on January 23. ED signals for vomiting and diarrhea in January and February are consistent with historical experience showing a seasonal increase in viral gastroenteritis due to norovirus and/or rotavirus. There were no ED citywide signals for the diarrhea or vomiting syndromes during March through June. There were spatial residential diarrhea signals from May 23-24 in the Brooklyn UHF neighborhood Flatbush-East Flatbush. During this time, there were increased cases of shigellosis occurring in the same UHF neighborhood. These shigellosis cases were being investigated by DOHMH and were part of a well-recognized, recurrent shigellosis outbreak that has been affecting this community every three to four years.
There were citywide diarrhea signals from July 10-12, and citywide vomiting signals
from July 5-8. The increases appear to have been heat-related. There were citywide vomiting signals from September 3-4. The increases were likely associated with the Labor Day holiday and increased utilization of the ED. Sustained citywide signaling for vomiting and diarrhea next occurred in late November and December, consistent with NYC’s historical experience with seasonal norovirus and rotavirus. There were citywide diarrhea signals from November 25 – 27, and citywide vomiting signals from November 22 - 27. There were citywide diarrhea signals on December 9, December 25-27, and December 30-31, and there were citywide vomiting signals on December 2-4, December 9, December 16-18, December 23 and December 25. Except as noted above in reference to Brooklyn UHF neighborhood Flatbush-East Flatbush, no spatial signal was sustained in the same geographic location for more than one day during the period of this report.
Figures 9 and 10 are time-series plots of signals from NYC syndromic surveillance systems for the gastrointestinal syndrome covering the period January 1 to June 30, and July 1 to December 31, 2012, respectively. Results from all of the GI syndromic surveillance systems are included (i.e., the ED, clinical laboratory, OTC, ADM and sentinel nursing home systems). For the ED, ADM, and OTC systems, only citywide signals have been included. As discussed above, there was sustained citywide ED system signaling in January and February and November and December, likely representing the seasonality of rotavirus and norovirus. In the clinical laboratory system, there were no signals during January through March. In May there was sustained signaling during the following periods: May 1 - 2, May 16 – 18, and May 30 – 31. Sustained signaling in the clinical laboratory system next occurred on August 23-24 and October 18-19. During these periods, no specimens tested for Cryptosporidium were found to be positive. During this reporting period, no GI outbreaks were reported among the eight nursing homes participating in sentinel surveillance. As noted in the section above concerning the OTC system, there was a disruption in data transmission which affected the ability of this system to detect signals, and so OTC system data analysis was suspended from October 21, 2011 to April 16, 2012. OTC system data analysis was resumed on April 17, though, as previously noted, there were 20 subsequent days in 2012 when there was a notable decrease in the number of stores reporting data due to data transmission

15
problems. There was a one-day OTC signal for bismuth subsalicylate sales on August 3. The signal occurred because there was a decrease in the number of stores reporting data from July 27 through July 31. Sales on August 3, when the signal occurred, were actually within baseline range. However, after the August 3 signal, there was a second period, from August 4-7, during which there was a decrease in the number of stores reporting. This decrease would affect the ability of the OTC system to identify a signal lasting longer than August 3. There was a one-day signal in bismuth subsalicylate sales occurring on October 28. However, from October 30 through November 2 there was a decrease in the number of stores reporting, apparently due to the effects of Hurricane Sandy. This decrease would affect the ability of the OTC system to identify a signal lasting longer than October 28. There were sustained signals in the OTC system for non-bismuth-containing anti-diarrheal sales from December 30, 2012 through January 2, 2013 and for bismuth subsalicylate sales from December 29, 2012 through January 3, 2013. However, for both sales categories, the only day when there appears to have been an actual spike in sales above baseline was on December 31. There was a decrease in the number of stores reporting sales from December 22-24 and on December 25. Signals occurring during the period December 29 to January 3 appear to be the result of: (a) decreased reporting from December 22-25, and (b) an actual increase in sales on December 31.
With regard to the ADM system, Figures 9 and 10 indicate all dates of citywide signals
from the ADM EARS analysis. The EARS program uses three different baselines to identify different types of signals; all citywide signal results are included in Figures 9 and 10 by date. During the period of this report, there were 59 days on which there were citywide ADM signals, and a total of 110 days on which there were citywide signals or borough signals or both. A large proportion of the signal dates coincided with reported ADM product promotional events, though not all. All ADM results are shared with DOHMH upon completion of EARS analysis (i.e., daily Monday to Friday, under normal program operations). Each ADM daily report includes any EARS signals detected; relevant trend data; notations regarding promotional versus non-promotional sales as appropriate; and indication of any events which appeared to warrant elevated attention by DOHMH in terms of syndromic data review. When signals or other unusual ADM sales results are observed, these results can be compared by DOHMH with results from the other syndromic systems. No events were detected during 2012 that were felt to warrant public health concern, or that suggested a waterborne disease event. Note that the ADM program uses a relatively sensitive algorithm for signal detection; therefore signals are commonly observed in this system. During 2012, the most prominent citywide signal seen in the ADM system was for the ADM sales ratio on October 31. A similar pattern of high ADM sales ratio was observed on that same date in the boroughs of Brooklyn, Queens, and Staten Island. This date was immediately following Hurricane Sandy, during a period of significant disruption in areas of the City resulting from the Hurricane. The signals on October 31 coincided with, and may be the result of, unusually low ratio denominator values, which were very possibly related to many stores being closed or otherwise impacted by the storm.
In summary, for the period January through December 2012, there were multiple
citywide signals for gastrointestinal illness in the ED system in January and February and again in late November and December. Sustained citywide signals in the ED system in the beginning and end of the year are consistent with annual gastrointestinal viral trends. Most of the syndromic surveillance systems experienced some level of impact from Hurricane Sandy.

16
However, core elements of the program remained in operation throughout the storm period, and overall the WDRAP team believes that these systems continued to provide data useful for detection of an outbreak. There was no evidence of a drinking water-related outbreak in New York City in 2012.
PART III: INFORMATION SHARING AND PUBLIC EDUCATION Information sharing and education efforts continued during 2012. Educational outreach in 2012 included presentations given by DOHMH WDRAP team members to clinicians in two Brooklyn hospitals and in a Manhattan hospital. Such talks serve to enhance awareness of waterborne diseases and also may lead to more complete disease diagnosis and reporting. Information pertaining to NYC’s Waterborne Disease Risk Assessment Program and related issues continue to be available on both the DEP and DOHMH websites, including results from the City’s source water protozoa monitoring program. Documents on the websites include: DOHMH Webpages:
• Giardiasis fact sheet http://www.nyc.gov/html/doh/html/diseases/cdgia.shtml
• Cryptosporidiosis fact sheet
http://www.nyc.gov/html/doh/html/diseases/cdcry.shtml
DEP Webpages: • DEP Water Supply Testing Results for Giardia and Cryptosporidium
(Data are collected and entered on the website each week. Historical data are also included.) http://www.nyc.gov/html/dep/html/drinking_water/pathogen.shtml
• Waterborne Disease Risk Assessment Program’s Annual Reports, 1997-2011
http://www.nyc.gov/html/dep/html/drinking_water/wdrap.shtml
• New York City Drinking Water Supply and Quality Statement, 1997-2011 (Posting of the 2012 Statement is planned for May 2013.) http://www.nyc.gov/html/dep/html/drinking_water/wsstate.shtml

0
50
100
150
200
250
300
350
Jul-9
3Ja
n-94
Jul-9
4Ja
n-95
Jul-9
5Ja
n-96
Jul-9
6Ja
n-97
Jul-9
7Ja
n-98
Jul-9
8Ja
n-99
Jul-9
9Ja
n-00
Jul-0
0Ja
n-01
Jul-0
1Ja
n-02
Jul-0
2Ja
n-03
Jul-0
3Ja
n-04
Jul-0
4Ja
n-05
Jul-0
5Ja
n-06
Jul-0
6Ja
n-07
Jul-0
7Ja
n-08
Jul-0
8Ja
n-09
Jul-0
9Ja
n-10
Jul-1
0Ja
n-11
Jul-1
1Ja
n-12
Jul-1
2
Num
ber o
f Cas
es
Month of Diagnosis
Figure 1: Giardiasis, number of cases by month of diagnosis, New York City, July 1993 - December 2012

18
TABLE 1: Giardiasis, number of cases and case rates, New York City, 1994 - 2012
Year Number of Cases Case Rate per 100,000
1994 2,457 32.3 1995 2,484 32.4 1996 2,288 29.6 1997 1,787 22.9 1998 1,959 24.9 1999 1,896 23.9
2000 1,771 22.1
2001 1,530 19.0
2002 1,423 17.6
2003 1,214 15.0
2004 1,088 13.4
2005 875 10.7
2006 938 11.4
2007 852 10.3
2008 840 10.0
2009 844 10.1
2010 923 11.3
2011 918 11.2
2012 872 10.7
Note: • Active disease surveillance for giardiasis began in July 1993. Starting January 2011, active laboratory surveillance was
discontinued as it had been replaced by an electronic reporting system. • Case numbers in this table conform to case numbers as they appear in the finalized NYC Department of Health and
Mental Hygiene Bureau of Communicable Disease disease surveillance data bases for the years 1989-2011, and rates have been accordingly adjusted. Yearly case numbers and rates in this table may therefore differ from case numbers and rates that appeared in prior WDRAP reports.

19
TABLE 2: Giardiasis, number of cases and annual case rate per 100,000 population by sex and borough of residence, New York City, 2012 Borough of residence Sex
Citywide number (rate)
Manhattan number (rate)
Bronx number (rate)
Brooklyn number (rate)
Queens number (rate)
Stat Is number (rate)
Male 620
(16.0) 259
(34.8) 68
(10.5) 176
(14.9) 110
(10.2) 7
(3.1) Female 252
(5.9) 66
(7.8) 44
(6.0) 88
(6.6) 47
(4.1) 7
(2.9) Total
872
(10.7) 325
(20.5) 112 (8.1)
264 (10.5)
157 (7.0)
14 (3.0)


21
Table 3: Giardiasis, number of cases and annual case rate per 100,000 by UHF neighborhood of residence, New York City, 2012
UHF Neighborhood Borough Number Population Rate Chelsea-Clinton Manhattan 69 145000 47.6 Greenwich Village-Soho Manhattan 32 83749 38.2 Greenpoint Brooklyn 33 127051 26.0 Upper West Side Manhattan 54 220080 24.5 Gramercy Park-Murray Hill Manhattan 29 134522 21.6 Downtown-Heights-Slope Brooklyn 39 224199 17.4 Upper East Side Manhattan 38 220962 17.2 Union Sq-Lower East Side Manhattan 33 198781 16.6 Lower Manhattan Manhattan 8 53159 15.0 Borough Park Brooklyn 49 331983 14.8 Bayside-Littleneck Queens 12 87972 13.6 Washington Heights-Inwood Manhattan 33 248508 13.3 C.Harlem-Morningside Hgts Manhattan 20 162652 12.3 Long Island City-Astoria Queens 24 204715 11.7 Kingsbridge-Riverdale Bronx 10 90892 11.0 High Bridge-Morrisania Bronx 22 207631 10.6 West Queens Queens 49 480501 10.2 East Flatbush-Flatbush Brooklyn 29 296583 9.8 Bed Stuyvesant-Crown Hgts Brooklyn 30 318898 9.4 Fordham-Bronx Park Bronx 23 252655 9.1 Pelham-Throgs Neck Bronx 27 297927 9.1 Williamsburg-Bushwick Brooklyn 19 210468 9.0 Coney Island-Sheepshead Bay Brooklyn 25 285502 8.8 Fresh Meadows Queens 8 96831 8.3 East Harlem Manhattan 9 109972 8.2 Bensonhurst-Bay Ridge Brooklyn 16 199271 8.0 Ridgewood-Forest Hills Queens 19 245746 7.7 Crotona-Tremont Bronx 15 206116 7.3 Jamaica Queens 16 289314 5.5 East New York Brooklyn 10 187855 5.3 Hunts Point-Mott Haven Bronx 7 136591 5.1 Southwest Queens Queens 13 266265 4.9 Sunset Park Brooklyn 6 127863 4.7 Flushing-Clearview Queens 12 259767 4.6 Northeast Bronx Bronx 8 190668 4.2 Canarsie-Flatlands Brooklyn 8 195027 4.1 Willowbrook Stat Island 3 85510 3.5 South Beach-Tottenville Stat Island 6 189185 3.2 Port Richmond Stat Island 2 70387 2.8 Stapleton-St. George Stat Island 3 123648 2.4 Southeast Queens Queens 4 195724 2.0

22
TABLE 4: Giardiasis, number of cases and annual case rate per 100,000 population by age group and sex, New York City, 2012 Sex Age group
Male number (rate)
Female number (rate)
Total number (rate)
<5 years 53
(20.0) 34
(13.4) 87
(16.8) 5-9 years 52
(21.5) 32
(13.8) 84
(17.8) 10-19 years 35
(6.9) 27
(5.5) 62
(6.2) 20-44 years 283
(18.4) 90
(5.5) 373
(11.7) 45-59 years 153
(20.6) 39
(4.6) 192
(12.1) ≥ 60 years 44
(7.6) 30
(3.6) 74
(5.3) Total 620
(16.0) 252
(5.9) 872
(10.7)

23
TABLE 5: Giardiasis, number of cases and annual case rate per 100,000 population by age group and borough of residence, New York City, 2012 Borough of residence Age group
Citywide number (rate)
Manhattan number (rate)
Bronx number (rate)
Brooklyn number (rate)
Queens number (rate)
Stat Is number (rate)
<5 years 87
(16.8) 19
(24.8) 17
(16.5) 39
(22.0) 9
(6.8) 3
(10.6) 5-9 years 84
(17.8) 14
(22.8) 14
(14.2) 39
(24.5) 16
(12.9) 1
(3.3) 10-19 years
62 (6.2)
10 (7.4)
12 (5.6)
26 (7.9)
14 (5.3)
0
20-44 years
373 (11.7)
162 (22.6)
47 (9.3)
96 (10.0)
64 (7.5)
4 (2.5)
45-59 years
192 (12.1)
87 (29.4)
15 (5.8)
45 (9.7)
39 (8.5)
6 (5.8)
≥ 60 years
74 (5.3)
33 (11.0)
7 (3.4)
19 (4.6)
15 (3.7)
0
Total 872 (10.7)
325 (20.5)
112 (8.1)
264 (10.5)
157 (7.0)
14 (3.0)

24
Table 6: Giardiasis, number of cases and case rates by census tract poverty level, New York City, 2012 Census Tract Poverty Level
Number of Cases Case Rate per 100,000
Age-adjusted rate per 100,000
Lowa 277 11.7 11.5 Mediumb 277 11.8 11.6 Highc 160 9.5 9.4 Very highd 156 8.8 8.6 Totale 870 10.6
a Low poverty: <10% of residents have household incomes that are below 100% of the federal poverty level, per American Community Survey 2007-2011. b Medium poverty: 10-19% of residents have household incomes that are below 100% of the federal poverty level, per American Community Survey 2007-2011. c High poverty: 20-29% of residents have household incomes that are below 100% of the federal poverty level, per American Community Survey 2007-2011. d Very high poverty: >=30% of residents have household incomes that are below 100% of the federal poverty level, per American Community Survey 2007-2011. e Two cases (0.2%) were excluded from the total 2012 case count because geolocating information for census tract identification was unavailable.

25
Table 7: Cryptosporidiosis, number of cases and case rates, New York City, 1994 – 2012
Year Number of Cases Case Rate per 100,000
1994 288 3.8
1995 471 6.1
1996 334 4.3
1997 172 2.2
1998 207 2.6
1999 261 3.3
2000 172 2.1
2001 122 1.5
2002 148 1.8
2003 126 1.6
2004 138 1.7
2005 148 1.8
2006 155 1.9
2007 105 1.3
2008 107 1.3
2009 81 1.0
2010 107 1.3
2011 86 1.1
2012 125 1.5 Note:
• Active disease surveillance for cryptosporidiosis began in November 1994. Starting January 2011, active laboratory surveillance was discontinued as it had been replaced by an electronic reporting system.
• Case numbers in this table conform to case numbers as they appear in the finalized NYC Department of Health and Mental Hygiene Bureau of Communicable Disease disease surveillance data bases for the years 1989-2011, and rates have been accordingly adjusted. Yearly case numbers and rates in this table may therefore differ from case numbers and rates that appeared in prior WDRAP reports.

0
10
20
30
40
50
60
Nov
-94
May
-95
Nov
-95
May
-96
Nov
-96
May
-97
Nov
-97
May
-98
Nov
-98
May
-99
Nov
-99
May
-00
Nov
-00
May
-01
Nov
-01
May
-02
Nov
-02
May
-03
Nov
-03
May
-04
Nov
-04
May
-05
Nov
-05
May
-06
Nov
-06
May
-07
Nov
-07
May
-08
Nov
-08
May
-09
Nov
-09
May
-10
Nov
-10
May
-11
Nov
-11
May
-12
Nov
-12
Num
ber o
f Cas
es
Month of Diagnosis
Figure 2: Cryptosporidiosis, number of cases by month of diagnosis, New York City, November 1994 - December 2012
See notes in Figure 3

* Chart does not include cases in which an onset date was unavailable: 179 cases (6%), January 1995 - December 2012.
0
10
20
30
40
50
60
Jan-
95
Jul-9
5
Jan-
96
Jul-9
6
Jan-
97
Jul-9
7
Jan-
98
Jul-9
8
Jan-
99
Jul-9
9
Jan-
00
Jul-0
0
Jan-
01
Jul-0
1
Jan-
02
Jul-0
2
Jan-
03
Jul-0
3
Jan-
04
Jul-0
4
Jan-
05
Jul-0
5
Jan-
06
Jul-0
6
Jan-
07
Jul-0
7
Jan-
08
Jul-0
8
Jan-
09
Jul-0
9
Jan-
10
Jul-1
0
Jan-
11
Jul-1
1
Jan-
12
Jul-1
2
Num
ber o
f Cas
es
Month of Onset
Figure 3: Cryptosporidiosis, number of cases by month of onset, New York City, January 1995 - December 2012*
This increase in cases in August 2000 was suspected to be related to an outbreak at a resort in Florida at which a group of Staten Island residents had vacationed that month.
The increase of cryptosporidiosis cases reported in August 2005 is suspected to be due to a surveillance bias caused by publicity around an outbreak in upstate NY related to recreational water exposure at a spray park.

28
TABLE 8: Cryptosporidiosis, number of cases and annual case rate per 100,000 population by sex and borough of residence, New York City, 2012 Borough of residence Sex
Citywide number (rate)
Manhattan number (rate)
Bronx number (rate)
Brooklyn number (rate)
Queens number (rate)
Stat Is number (rate)
Male 93
(2.4) 43
(5.8) 14
(2.2) 27
(2.3) 9
(0.8) 0
Female 32 (0.7)
13 (1.5)
9 (1.2)
9 (0.7)
1 (0.1)
0
Total 125 (1.5)
56 (3.5)
23 (1.7)
36 (1.4)
10 (0.4)
0


30
TABLE 9: Cryptosporidiosis, number of cases and annual case rate per 100,000 population by UHF neighborhood of residence, New York City, 2012
UHF Neighborhood
Borough Number Population Rate Chelsea-Clinton Manhattan 10 145000 6.9 Greenwich Village-Soho Manhattan 5 83749 6.0 Gramercy Park-Murray Hill Manhattan 6 134522 4.5 C Harlem-Morningside Hgts Manhattan 6 162652 3.7 Washington Heights-Inwood Manhattan 9 248508 3.6 Downtown Heights-Slope Brooklyn 8 224199 3.6 Kingsbridge-Riverdale Bronx 3 90892 3.3 East Flatbush-Flatbush Brooklyn 9 296583 3.0 East Harlem Manhattan 3 109972 2.7 Upper West Side Manhattan 6 220080 2.7 Upper East Side Manhattan 6 220962 2.7 Pelham-Throgs Neck Bronx 8 297927 2.7 Bed Stuyvesant-Crown Hgts Brooklyn 8 318898 2.5 High Bridge-Morrisania Bronx 5 207631 2.4 Union Sq-Lower East Side Manhattan 4 198781 2.0 Williamsburg-Bushwick Brooklyn 4 210468 1.9 Lower Manhattan Manhattan 1 53159 1.9 Fordham-Bronx Park Bronx 4 252655 1.6 Ridgewood-Forest Hills Queens 3 245746 1.2 Long Island City-Astoria Queens 2 204715 1.0 Rockaway Queens 1 114978 0.9 Greenpoint Brooklyn 1 127051 0.8 Hunts Pont-Mott Haven Bronx 1 136951 0.7 Coney Island-Sheepshead Bay Brooklyn 2 285502 0.7 West Queens Queens 3 480501 0.6 Borough Park Brooklyn 2 331983 0.6 East New York Brooklyn 1 187855 0.5 Northeast Bronx Bronx 1 190668 0.5 Canarsie-Flatlands Brooklyn 1 195027 0.5 Crotona-Tremont Bronx 1 206116 0.5 Jamaica Queens 1 289314 0.3

31
TABLE 10: Cryptosporidiosis, number of cases and annual case rate per 100,000 population by age group and sex, New York City, 2012 Sex Age group
Male number (rate)
Female number (rate)
Total number (rate)
<5 years 6 (2.3)
8 (3.2)
14 (2.7)
5-9 years 1 (0.4)
2 (0.9)
3 (0.6)
10-19 years 3 (0.6)
5 (1.0)
8 (0.8)
20-44 years 63 (4.1)
11 (0.7)
74 (2.3)
45-59 years 19 (2.6)
6 (0.7)
25 (1.6)
≥ 60 years 1 (0.2)
0
1 (0.1)
Total 93 (2.4)
32 (0.7)
125 (1.5)

32
TABLE 11: Cryptosporidiosis, number of cases and annual case rate per 100,000 population by age group and borough, New York City, 2012 Borough of residence Age group
Citywide number (rate)
Manhattan number (rate)
Bronx number (rate)
Brooklyn number (rate)
Queens number (rate)
Stat Is number (rate)
<5 years
14 (2.7)
4 (5.2)
4 (3.9)
6 (3.4)
0
0
5-9 years
3 (0.6)
1 (1.6)
0
2 (1.3)
0
0
10-19 years
8 (0.8)
3 (2.2)
4 (1.9)
1 (0.3)
0
0
20-44 years
74 (2.3)
33 (4.6)
13 (2.6)
21 (2.2)
7 (0.8)
0
45-59 years
25 (1.6)
15 (5.1)
2 (0.8)
5 (1.1)
3 (0.7)
0
≥ 60 years
1 (0.1)
0
0
1 (0.2)
0
0
Total 125 (1.5)
56 (3.5)
23 (1.7)
36 (1.4)
10 (0.4)
0

33
TABLE 12: Cryptosporidiosis, number of cases and annual case rate per 100,000 population by race/ethnicity and borough of residence, New York City, 2012 Borough of residence Race/Ethnicity
Citywide number (rate)
Manhattan number (rate)
Bronx number (rate)
Brooklyn number (rate)
Queens number (rate)
Stat Is number (rate)
Hispanic 30
(1.3) 12
(3.0) 11
(1.5) 6
(1.2) 1
(0.2) 0
White, non-Hispanic 41 (1.5)
24 (3.2)
0
9 (1.0)
8 (1.3)
0
Black, non-Hispanic 33 (1.8)
10 (4.9)
8 (1.9)
14 (1.8)
1 (0.3)
0
Asian, non-Hispanic Pacific Islander, Native Hawaiian, non-Hispanic American Indian, non-Hispanic Other, non-Hispanic
7 (0.7)
0
1 (5.7)
3 (1.5)
3 (1.7)
0
1 (46.6)
2 (5.7)
2 (4.2)
0
0
0
2 (0.8)
0
0
1 (2.0)
0
0
0
0
0
0
0
Unknown
10 4 2 4 0 0
Total 125 (1.5)
56 (3.5)
23 (1.7)
36 (1.4)
10 (0.4)
0

34
TABLE 13: Cryptosporidiosis, number of cases and annual case rate per 100,000 population by race/ethnicity and age group, New York City, 2012 Age group Race /ethnicity
< 5 years
number (rate)
5-9 years
number (rate)
10-19 years
number (rate)
20-44 years
number (rate)
45-59 years
number (rate)
≥ 60 years
number (rate)
Total
number (rate)
Hispanic 4 (2.2)
1 (0.6)
3 (0.8)
16 (1.7)
6 (1.5)
0
30 (1.3)
White, non-Hispanic 4 (2.7)
2 (1.7)
3 (1.3)
23 (2.2)
8 (1.5)
1 (0.2)
41 (1.5)
Black, non-Hispanic 2 (1.8)
0
2 (0.7)
22 (3.3)
7 (1.8)
0
33 (1.8)
Asian, non-Hispanic Pacific Islander, Native Hawaiian, non-Hispanic American Indian, non-Hispanic Other, non-Hispanic
2 (3.6)
0
0
0
0
0
0
0
0
0
0
0
4 (0.9)
0
1 (17.3)
2 (2.4)
1 (0.5)
0
0
1 (2.7)
0
0
0
0
7 (0.7)
0
1 (5.7)
3 (1.5)
Unknown
2 0 0 6 2 0 10
Total 14 (2.7)
3 (0.6)
8 (0.8)
74 (2.3)
25 (1.6)
1 (0.1)
125 (1.5)

35
Table 14: Cryptosporidiosis, number of cases and case rates by census tract poverty level, New York City, 2012 Census Tract Poverty Level
Number of Cases Case Rate per 100,000
Age-adjusted rate per 100,000
Lowa 27 1.1 1.1 Mediumb 30 1.3 1.2 Highc 35 2.1 2.0 Very highd 32 1.8 1.7 Totale 124 1.5
a Low poverty: <10% of residents have household incomes that are below 100% of the federal poverty level, per American Community Survey 2007-2011. b Medium poverty: 10-19% of residents have household incomes that are below 100% of the federal poverty level, per American Community Survey 2007-2011. c High poverty: 20-29% of residents have household incomes that are below 100% of the federal poverty level, per American Community Survey 2007-2011. d Very high poverty: >=30% of residents have household incomes that are below 100% of the federal poverty level, per American Community Survey 2007-2011. e One case (0.8%) was excluded from the total 2012 case count because geolocating information for census tract identification was unavailable.
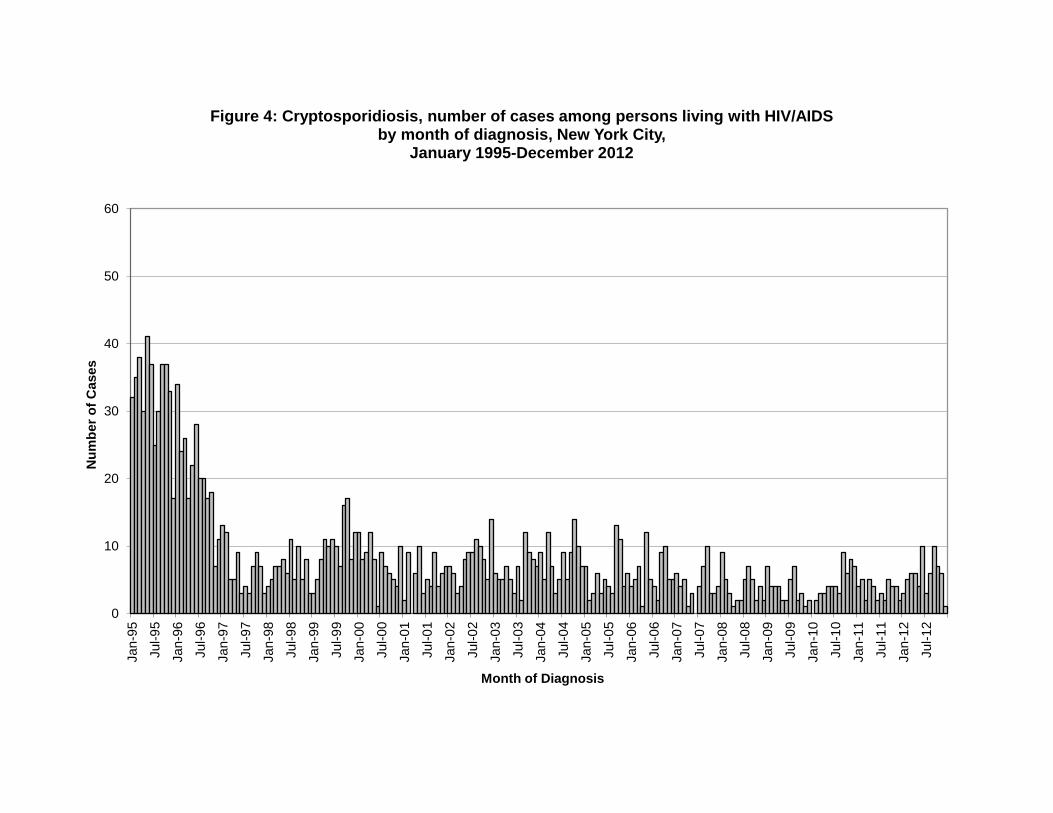
0
10
20
30
40
50
60
Jan-
95
Jul-9
5
Jan-
96
Jul-9
6
Jan-
97
Jul-9
7
Jan-
98
Jul-9
8
Jan-
99
Jul-9
9
Jan-
00
Jul-0
0
Jan-
01
Jul-0
1
Jan-
02
Jul-0
2
Jan-
03
Jul-0
3
Jan-
04
Jul-0
4
Jan-
05
Jul-0
5
Jan-
06
Jul-0
6
Jan-
07
Jul-0
7
Jan-
08
Jul-0
8
Jan-
09
Jul-0
9
Jan-
10
Jul-1
0
Jan-
11
Jul-1
1
Jan-
12
Jul-1
2
Num
ber o
f Cas
es
Month of Diagnosis
Figure 4: Cryptosporidiosis, number of cases among persons living with HIV/AIDS by month of diagnosis, New York City,
January 1995-December 2012

0
10
20
30
40
50
60
Jan-
95Ju
l-95
Jan-
96Ju
l-96
Jan-
97Ju
l-97
Jan-
98Ju
l-98
Jan-
99Ju
l-99
Jan-
00Ju
l-00
Jan-
01Ju
l-01
Jan-
02Ju
l-02
Jan-
03Ju
l-03
Jan-
04Ju
l-04
Jan-
05Ju
l-05
Jan-
06Ju
l-06
Jan-
07Ju
l-07
Jan-
08Ju
l-08
Jan-
09Ju
l-09
Jan-
10Ju
l-10
Jan-
11Ju
l-11
Jan-
12Ju
l-12
Num
ber o
f Cas
es
Month of Diagnosis
Figure 5: Cryptosporidiosis, number of cases among immunocompetent persons by month of diagnosis, New York City,
January 1995-December 2012
See notes in Figure 3

0
50
100
150
200
250
300
350
400
450
1995 1996 1997 1998 1999 2000 2001 2002 2003 2004 2005 2006 2007 2008 2009 2010 2011 2012
Num
ber o
f cas
es
Year
Figure 6: Cryptosporidiosis, number of cases by year of diagnosis and immune status, New York City, 1995 - 2012
Persons with HIV/AIDS Immunocompetent Immunocompromised, Not HIV/AIDS Immune Status Unknown

39
Table 15: Percentage of interviewed cryptosporidiosis case-patients reporting selected potential risk exposures before disease onset,a persons with HIV/AIDS, New York City, 1995 - 2012 Exposure Type Persons with HIV/AIDS
1995 1996 1997 1998 1999 2000 2001 2002 2003 2004 2005 2006 2007 2008 2009 2010 2011 2012
Contact with an Animalb
35% 35% 33% 36% 35% 43% 24% 42% 40% 31% 33% 38% 31% 44% 42% 20% 36% 34%
High-risk Sexual Activityc
(> 18 years old)
22% 22% 9% 15% 20% 25% 16% 23% 24% 34% 27% 31% 21% 39% 35% 7% 14% 23%
International Traveld
9% 9% 9% 13% 18% 14% 10% 11% 13% 15% 17% 9% 6% 7% 8% 7%
4% 6%
Recreational Water Contacte
16% 8% 16% 12% 16% 15% 8% 10% 21% 13% 5% 18% 17% 14% 8% 10% 14% 8%
Note:
• Determination of an association between exposure to possible risk factors for cryptosporidiosis and acquisition of cryptosporidiosis cannot be made without reference to a suitable control population (i.e., non-Cryptosporidium-infected controls).
• Format of case interview form changed on 1/1/1997, 5/11/2001, 8/21/2002, and 4/26/2010. Details regarding changes made to the interview form and
Exposure Types from 1995-2012 are noted below. a From 1/1/1995 to 4/25/2010, case-patients were asked about potential risk exposures during the month before disease onset. Starting 4/26/2010, case-
patients were asked about potential risk exposures during the 14 days before onset. b Contact with an Animal - Includes having a pet, or visiting a farm or petting zoo (1995-1996); expanded to include: or visiting a pet store or
veterinarian office (1997-2012). c High-risk Sexual Activity - Includes having a penis, finger or tongue in sexual partner’s anus (1995-2012). d International Travel - Travel outside the United States (1995-2012).
e Recreational Water Contact - Includes swimming in a pool, or swimming in or drinking from a stream, lake, river or spring (1995-1996); expanded to include: or swimming in the ocean, or visiting a recreational water park (1997-2012).

40
Table 16: Percentage of interviewed cryptosporidiosis case-patients reporting selected potential risk exposures before disease onset,a immunocompetent persons, New York City, 1995 - 2012 Exposure Type Immunocompetent Persons
1995 1996 1997 1998 1999 2000* 2001 2002 2003 2004 2005 2006 2007 2008 2009 2010 2011 2012
Contact with an Animalb
7% 41% 41% 32% 35% 26% 37% 35% 23% 34% 36% 36% 34% 28% 40% 18% 41% 33%
High-risk Sexual Activityc (> 18 years old)
14% 25% 12% 10% 12% 23% 15% 30% 13% 31% 17% 3% 19% 7% 18% 4% 5% 11%
International Traveld
30% 29% 26% 28% 28% 40% 47% 33% 45% 47% 45% 40% 47% 52% 37% 44% 35% 50%
Recreational Water Contacte
21% 27% 40% 24% 22% 32% 35% 35% 34% 33% 52% 28% 36% 40% 50% 33% 35% 46%
Note: • Determination of an association between exposure to possible risk factors for cryptosporidiosis and acquisition of cryptosporidiosis cannot be
made without reference to a suitable control population (i.e., non-Cryptosporidium-infected controls).
• Format of case interview form changed on 1/1/1997, 5/11/2001, 8/21/2002, and 4/26/2010. Details regarding changes made to the interview form and Exposure Types from 1995-2012 are noted below.
a From 1/1/1995 to 4/25/2010, case-patients were asked about potential risk exposures during the month before disease onset. Starting 4/26/2010, case-patients were asked about potential risk exposures during the 14 days before onset.
b Contact with an Animal - Includes having a pet, or visiting a farm or petting zoo (1995-1996); expanded to include: or visiting a pet store or veterinarian office (1997-2012).
c High-risk Sexual Activity - Includes having a penis, finger or tongue in sexual partner’s anus (1995-2012). d International Travel - Travel outside the United States (1995-2012).
e Recreational Water Contact - Includes swimming in a pool, or swimming in or drinking from a stream, lake, river or spring (1995-1996); expanded to include: or swimming in the ocean, or visiting a recreational water park (1997-2012).
* Year 2000 percentage of interviewed cryptosporidiosis cases does not include 14 cases associated with a point source exposure at a swimming pool in
Florida.

41
Table 17: Percentage of interviewed cryptosporidiosis case-patients by type of tap water exposure before disease onset,a persons with HIV/AIDS, New York City, 1995 - 2012 Exposure Type
Persons with HIV/AIDS
1995 1996 1997 1998 1999 2000 2001 2002 2003 2004 2005 2006 2007 2008 2009 2010 2011 2012
Plain Tapb
69% 70% 71% 64% 66% 63% 55% 54% 77% 49% 76% 67% 67% 64% 58% 63% 50% 63%
Filtered Tapc
12% 9% 10% 18% 20% 20% 14% 22% 13% 21% 7% 18% 11% 14% 15% 12% 25% 8%
Boiled Tapd
7% 7% 3% 5% 3% 6% 6% 0% 4% 6% 5% 7% 0% 11% 8% 2% 4% 4%
Incidental Plain Tap Onlye
11% 15% 16% 15% 8% 12% 16% 19% 4% 15% 10% 4% 17% 7% 15% 15% 18% 20%
No Tapf
3% 2% 2% 0% 5% 4% 6% 4% 2% 5% 2% 2% 6% 4% 0% 3% 4% 4%
Note: • Determination of an association between exposure to possible risk factors for cryptosporidiosis and acquisition of cryptosporidiosis cannot be made without
reference to a suitable control population (i.e., non-Cryptosporidium-infected controls).
• Format of case interview form changed on 1/1/1997, 5/11/2001, 8/21/2000, and 4/26/2010. Details regarding changes made to the interview form and Tap Water Exposure Types from 1995-2012 are noted below. a From 1/1/1995 to 4/25/2010, case-patients were asked about Tap Water Exposure during the month before disease onset. Starting 4/26/2010, case-patients were asked about Tap Water Exposure during the 14 days before onset. b Plain Tap - Drank unboiled/unfiltered NYC tap water (1995-5/10/2001); or drank greater than 0 cups of unboiled/unfiltered NYC tap water (5/11/2001-12/31/2012). c Filtered Tap - Drank filtered NYC tap water (1995-5/10/2001); or drank greater than 0 cups of filtered NYC tap water, and 0 or more cups of boiled NYC tap water, and no unboiled /unfiltered NYC tap water (5/11/2001-12/31/2012). d Boiled Tap - Drank boiled NYC tap water (1995-5/10/2001); or drank greater than 0 cups of boiled NYC tap water, and no unboiled /unfiltered NYC tap water, and no filtered NYC tap water (5/11/2001-12/31/2012). e Incidental Plain Tap Only - Did not drink any NYC tap water but did use unboiled/unfiltered NYC tap water to brush teeth, or to wash vegetables/fruits, or to make ice (1995-1996); expanded to include: or to make juice from concentrate (1997-2012) f No Tap - Did not drink any NYC tap water and did not use unboiled/unfiltered NYC tap water to brush teeth, or to wash vegetables/fruits, or to make ice (1995-1996); expanded to include: or to make juice from concentrate (1997-2012).

42
Table 18: Percentage of interviewed cryptosporidiosis case-patients by type of tap water exposure before disease onset,a immunocompetent persons, New York City, 1995 - 2012
Exposure Type
Immunocompetent Persons
1995 1996 1997 1998 1999 2000* 2001 2002 2003 2004 2005 2006 2007 2008 2009 2010 2011 2012
Plain Tapb
58% 63% 58% 67% 56% 56% 43% 33% 36% 27% 30% 30% 27% 30% 47% 33% 44% 30%
Filtered Tapc
18% 17% 21% 21% 25% 17% 31% 44% 36% 30% 25% 20% 22% 30% 23% 27% 18% 26%
Boiled Tapd
11% 10% 8% 3% 4% 2% 4% 0% 2% 7% 5% 8% 4% 14% 0% 7% 3% 2%
Incidental Plain Tap Onlye
7% 9% 12% 8% 11% 8% 16% 21% 16% 13% 25% 28% 18% 14% 27% 22% 15% 15%
No Tapf
2% 4% 4% 3% 7% 17% 6% 2% 9% 21% 14% 14% 27% 12% 3% 11% 21% 26%
Note: • Determination of an association between exposure to possible risk factors for cryptosporidiosis and acquisition of cryptosporidiosis cannot be made without
reference to a suitable control population (i.e., non-Cryptosporidium-infected controls).
• Format of case interview form changed on 1/1/1997, 5/11/2001, 8/21/2000, and 4/26/2010. Details regarding changes made to the interview form and Tap Water Exposure Types from 1995-2012 are noted below. a From 1/1/1995 to 4/25/2010, case-patients were asked about Tap Water Exposure during the month before disease onset. Starting 4/26/2010, case-patients were asked about Tap Water Exposure during the 14 days before onset. b Plain Tap - Drank unboiled/unfiltered NYC tap water (1995-5/10/2001); or drank greater than 0 cups of unboiled/unfiltered NYC tap water (5/11/2001-12/31/2012). c Filtered Tap - Drank filtered NYC tap water (1995-5/10/2001); or drank greater than 0 cups of filtered NYC tap water, and 0 or more cups of boiled NYC tap water, and no unboiled /unfiltered NYC tap water (5/11/2001-12/31/2012). d Boiled Tap - Drank boiled NYC tap water (1995-5/10/2001); or drank greater than 0 cups of boiled NYC tap water, and no unboiled /unfiltered NYC tap water, and no filtered NYC tap water (5/11/2001-12/31/2012). e Incidental Plain Tap Only - Did not drink any NYC tap water but did use unboiled/unfiltered NYC tap water to brush teeth, or to wash vegetables/fruits, or to make ice (1995-1996); expanded to include: or to make juice from concentrate (1997-2012) f No Tap - Did not drink any NYC tap water and did not use unboiled/unfiltered NYC tap water to brush teeth, or to wash vegetables/fruits, or to make ice (1995-1996); expanded to include: or to make juice from concentrate (1997-2012).
* Year 2000 percentage of interviewed cryptosporidiosis cases does not include 14 cases associated with a point source exposure at a swimming pool in Florida.

0
0.01
0.02
0.03
0.04
0.05
0.06
0.071/
1/20
12
1/15
/201
2
1/29
/201
2
2/12
/201
2
2/26
/201
2
3/11
/201
2
3/25
/201
2
4/8/
2012
4/22
/201
2
5/6/
2012
5/20
/201
2
6/3/
2012
6/17
/201
2
7/1/
2012
7/15
/201
2
7/29
/201
2
8/12
/201
2
8/26
/201
2
9/9/
2012
9/23
/201
2
10/7
/201
2
10/2
1/20
12
11/4
/201
2
11/1
8/20
12
12/2
/201
2
12/1
6/20
12
12/3
0/20
12
Ratio
: Vom
iting
illn
ess
vis
its/o
ther
vis
its
Date of Emergency Department visits
Figure 7: Emergency Department Syndromic Surveillance, Trends in visits for the vomiting syndrome, New York City, January 1, 2012 - December 31, 2012
*Other visits=visits to participating ED for conditions that do not fit in to one of the eight tracked syndromes (diarrhea, vomiting, respiratory, fever/influenza, asthma, sepsis, cold, rash).
Daily ratio of visits for vomiting to other visits* Citywide signal Spatial signal by patient's home zipcode Spatial signal by hospital

0
0.005
0.01
0.015
0.02
0.025
0.031/
1/20
12
1/15
/201
2
1/29
/201
2
2/12
/201
2
2/26
/201
2
3/11
/201
2
3/25
/201
2
4/8/
2012
4/22
/201
2
5/6/
2012
5/20
/201
2
6/3/
2012
6/17
/201
2
7/1/
2012
7/15
/201
2
7/29
/201
2
8/12
/201
2
8/26
/201
2
9/9/
2012
9/23
/201
2
10/7
/201
2
10/2
1/20
12
11/4
/201
2
11/1
8/20
12
12/2
/201
2
12/1
6/20
12
12/3
0/20
12
Ratio
: Dia
rrhe
al il
lnes
s vi
sits
/oth
er v
isits
Date of Emergency Department visits
Figure 8: Emergency Department Syndromic Surveillance, Trends in visits for the diarrhea syndrome, New York City, January 1, 2012 - December 31, 2012
*Other visits=visits to participating ED for conditions that do not fit in to one of the eight tracked syndromes (diarrhea, vomiting, respiratory, fever/influenza, asthma, sepsis, cold, rash).
Daily ratio of visits for diarrhea to other visits* Citywide signal Spatial signal by patient's home zipcode Spatial signal by hospital

Figure 9: Signals for Gastrointestinal Illness, Syndromic Surveillance Systems New York City, January 1, 2012 - June 30, 2012
Surv
eilla
nce S
yste
ms
EDCityDiarEDCityVomLab AADMOTCNHome
- - - - - - - - - - - - - - - - - - - - - - - - - - - - - - - - - - - - - - - - - - - - - - - - - - - - - - - - - - - - - - - - - - - - - - - - - - - - - - - - - - - - - - - - - - - - - - - - - - - - - - - - - - - - - - - - - - - - - - - - - - - - - - - - - - - - - - - - - - - - - - - - - - - - - - - - - - - - - - - - - - - - - - - - - - - - - - - - - - - - - -
Date of Signal
3/13
/12
3/19
/12
3/25
/12
3/31
/12
2/18
/12
2/24
/12
3/1/
12
3/7/
12
1/25
/12
1/31
/12
2/6/
12
2/12
/12
1/1/
12
1/7/
12
1/13
/12
1/19
/12
6/17
/12
6/23
/12
6/29
/12
5/24
/12
5/30
/12
6/5/
12
6/11
/12
4/30
/12
5/6/
12
5/12
/12
5/18
/12
4/6/
12
4/12
/11
4/18
/12
4/24
/12
ED CityDiar: Emergency Department Citywide signal for diarrheaED CityVom: Emergency Department Citywide signal for vomitingLab A: Clinical Laboratory Monitoring signal for stool submissions for ova and parasites or bacterial culture and sensitivityADM: Citywide signal for daily antidiarrheal medication sales in DEP systemOTC: Citywide signal for daily antidiarrheal medication sales in DOHMH system
Note: Due to data transmission problems, OTC data analysis was not run January 1 to April 16. When OTC analysis was resumed, there were some days when there was a decrease in the number of stores submitting data. See text for details.
NHome: Sentinel Nursing Home Gastrointestinal Outbreak. Indicates the first day of the outbreak.

Figure 10: Signals for Gastrointestinal Illness, Syndromic Surveillance Systems New York City, July 1, 2012 - December 31, 2012
Surv
eilla
nce S
yste
ms
EDCityDiarEDCityVomLab A ADM OTC NHome
- - - - - - - - - - - - - - - - - - - - - - - - - - - - - - - - - - - - - - - - - - - - - - - - - - - - - - - - - - - - - - - - - - - - - - - - - - - - - - - - - - - - - - - - - - - - - - - - - - - - - - - - - - - - - - - - - - - - - - - - - - - - - - - - - - - - - - - - - - - - - - - - - - - - - - - - - - - - - - - - - - - - - - - - - - - - - - - - - - - - - - - -
Date of Signal
7/31
/12
7/1/
12
7/7/
12
7/13
/12
7/19
/12
7/25
/12
9/23
/12
9/29
/12
10/5
/12
10/1
1/12
8/6/
12
8/12
/12
8/18
/12
8/24
/12
8/30
/12
9/5/
12
12/2
8/12
11/2
2/12
11/2
8/12
12/4
/12
12/1
0/12
12/1
6/12
12/2
2/12
10/1
7/12
10/2
3/12
10/2
9/12
11/4
/12
11/1
0/12
11/1
6/12
9/11
/12
9/17
/12
ED CityDiar: Emergency Department Citywide signal for diarrheaED CityVom: Emergency Department Citywide signal for vomitingLab A: Clinical Laboratory Monitoring signal for stool submissions for ova and parasites or bacterial culture and sensitivityADM: Citywide signal for daily antidiarrheal medication sales in DEP systemOTC: Citywide signal for daily antidiarrheal medication sales in DOHMH system
Note: There were some days during the above period when there was a decrease in the number of stores submitting data . See text for details.
NHome: Sentinel Nursing Home Gastrointestinal Outbreak. Indicates the first day of the outbreak.


![Waterborne Disease [FINAL]](https://img.pdfslide.us/doc/110x75/55a6e1d11a28ab9a558b4647/waterborne-disease-final.jpg)