Embed Size (px)
Citation preview

WATER VAPOR AND GAS TRANSPORT
THROUGH POLYMERIC MEMBRANES

WATER VAPOR AND GAS TRANSPORT
THROUGH POLYMERIC MEMBRANES
PROEFSCHRIFT
ter verkrijging van de graad van doctor aan de Universiteit Twente,
op gezag van de rector magnificus, prof. dr. F.A. van Vught,
volgens besluit van het College voor Promoties in het openbaar te verdedigen
op vrijdag 21 november 2003 om 16.45 uur
door
Sybrandus Jacob Metz
geboren op 14 januari 1975
te Pietersbierum
Dit proefschrift is goedgekeurd door de promotor Prof. Dr.-Ing. M. Wessling en de assistant promoter Dr. Ir. N.F.A. van der Vegt
ISBN ?
© by S.J.Metz, Enschede, The Netherlands, 2003.
All rights reserved.
Printed by PrintPartners Ipskamp B.V., Enschede, The Netherlands.

Contents
i
Contents
1 Introduction 1 1.1 Water vapor and gas transport through polymeric membranes 1 1.2 Scope of this thesis 7 1.3 References 9 2 Measurement of Water Vapor and Gas Permeation through 11
Polymers 2.1 Introduction 12 2.2 Background 12
2.2.1 Measurement of water vapor permeation 12 2.2.2 Mass transfer limitations 14
2.3 Experimental 16 2.3.1 Mixed gas water vapor permeation set-up 16 2.3.2 Permeation cell 18 2.3.3 Determination of the permeability values 19 2.3.4 Materials 20 2.3.5 PEO-PBT block copolymers 20 2.3.6 Film preparation 21
2.4 Results and Discussion 21 2.4.1 Effects of concentration polarization 21 2.4.2 Boundary layer resistance 24 2.4.3 Validation permeability values 27 2.4.4 Highly permeable, highly selective materials 29
2.5 Conclusions 30 2.6 Acknowledgements 30 2.7 References 31 3 Performance of Polyethersulfone/Polyimide Hollow Fiber 33
Membranes in the Separation of Wet CO2/N2 Gaseous Mixtures 3.1 Introduction 34 3.2 Background 35
3.2.1 Resistances towards mass transfer 35 3.3 Experimental 39
3.3.1 Materials 39 3.3.2 Module preparation and post treatment 40 3.3.3 Mixed gas/water vapor permeation set-up 40
Contents
ii
3.3.4 Determination of the transport rates 41 3.3.5 Sorption experiments 43
3.4 Results and Discussion 44 3.4.1 Effect of water vapor activity on gas permeance 44 3.4.2 Influence of total pressure 47 3.4.3 Resistance towards mass transfer 50
3.5 Conclusions 53 3.6 Acknowledgements 54 3.7 List of Symbols 54 3.8 References 55 4 Gas Permeation Properties of Poly(Ethylene Oxide) 57
Poly(Butylene Terephthalate) Block Copolymers 4.1 Introduction 58 4.2 Background 59
4.2.1 Permeability 59 4.3 Experimental section 62
4.3.1 Materials 62 4.3.2 Film preparation 62 4.3.3 Proton-NMR 62 4.3.4 Differential Scanning Calometry (DSC) 62 4.3.5 Gas permeation 63 4.3.6 Equilibrium sorption 63
4.4 Results and Discussion 64 4.4.1 Thermal properties of PEO-PBT block copolymers 64 4.4.2 Selectivity 65 4.4.3 Effect of the amount of PBT on permeation properties 66 4.4.4 Effect of the PEO segment length on permeation properties 72 4.4.5 Effect of temperature on permeation properties 75
4.5 Conclusions 76 4.6 Acknowledgements 76 4.7 References 77 5 Thermodynamics of Water Vapor Sorption in Poly(Ethylene 79
Oxide) Poly(Butylene Terephthalate) Block copolymers 5.1 Introduction 80 5.2 Experimental section 80
5.2.1 Materials 80 5.2.2 PEO-PBT block copolymers 81 5.2.3 Film preparation 81 5.2.4 Proton NMR 81
Contents
iii
5.2.5 Differential Scanning Calometry (DSC) 81 5.2.6 Sorption isotherms 82
5.3 Theory 82 5.3.1 Flory-Huggins sorption model 82 5.3.2 Solvation thermodynamics 83
5.4 Results and discussion 85 5.4.1 Solubility 85 5.4.2 Flory-Huggins sorption model 86 5.4.3 Solvation thermodynamics 89
5.5 Conclusions 95 5.6 References 95 6 Mixed gas water vapor/N2 transport in Poly(Ethylene Oxide) 97
Poly(Butylene Terephthalate) Block copolymers 6.1 Introduction 98 6.2 Experimental 99
6.2.1 Materials 99 6.2.2 Film preparation 99 6.2.3 Mixed gas water vapor permeation 99 6.2.4 Sorption isotherms 99 6.2.5 Infrared Spectroscopy 100
6.3 Results and Discussion 100 6.3.1 Solubility of water vapor in PEO-PBT block copolymers 100 6.3.2 Permeability 102 6.3.3 State of water in PEO-PBT block copolymers 107 6.3.4 Concentration-dependent diffusion coefficient 112 6.3.5 Effect of temperature 114 6.3.6 Effect of block copolymer composition 118
6.4 Conclusions 121 6.5 Acknowledgements 121 6.6 References 121 Summary 125 Samenvatting (voor niet-membraantechnologen) 129 Dankwoord 132

1
Chapter 1
Introduction 1.1 Water vapor and gas transport through polymeric
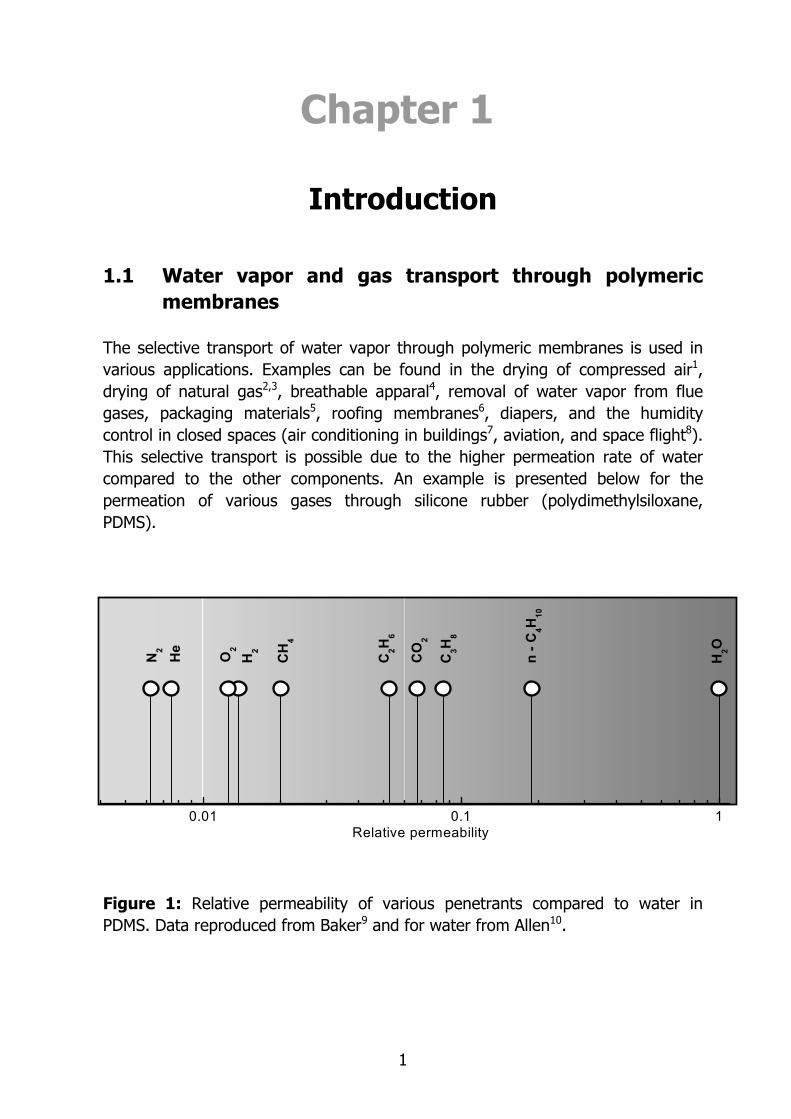
membranes The selective transport of water vapor through polymeric membranes is used in various applications. Examples can be found in the drying of compressed air1, drying of natural gas2,3, breathable apparal4, removal of water vapor from flue gases, packaging materials5, roofing membranes6, diapers, and the humidity control in closed spaces (air conditioning in buildings7, aviation, and space flight8). This selective transport is possible due to the higher permeation rate of water compared to the other components. An example is presented below for the permeation of various gases through silicone rubber (polydimethylsiloxane, PDMS).
Figure 1: Relative permeability of various penetrants compared to water in PDMS. Data reproduced from Baker9 and for water from Allen10.
0.01 0.1 1
H2O
n - C
4H10
C3H
8
CO
2
C2H
6
CH
4
H2O2
He
N2
Relative permeability
Chapter 1
2
Figure 1 shows the relative transport rate of various penetrants compared to water. The transport rate for water is much faster compared to the other components even though PDMS is a hydrophobic material. The permeability coefficient of a material is an intrinsic material property, since it gives a measure for the amount of gas permeating per second through a material with a surface area of 1 cm2 and a thickness of 1 cm normalized for the driving force in cmHg. The total amount of gas permeating is expressed as a flux of gas at standard temperature and pressure (cm3(STP)/(cm2 s)):
( )permeate,ifeed,i fflP
J −= (1)
with P the permeability (Barrer = 1 10-10 cm3 cm/(cm2 s cmHg)), l the membrane thickness (cm), fi,feed and fi,permeate the fugacities of component i on the high pressure side (feed) and low pressure side (permeate) (cmHg), respectively. For low pressure applications the fugacities equal the partial pressure. The permeability of a gas, vapor or liquid through a dense polymeric membrane can be described by the solution-diffusion model11,12, equating the permeability P to the product of the diffusivity and solubility:
SDP ⋅= (2) where D is the diffusion coefficient (cm2/s) and S the solubility coefficient (cm3(STP)/(cm3 cmHg)). The magnitude of the permeability is determined by the diffusion rate (D), which is a kinetic parameter, and the solubility, a thermodynamic parameter accounting for the amount sorbed by the membrane. The combination of a high mobility for water (diffusivity) and a high solubility causes a high permeability for water compared to other penetrants. Figure 2 and Figure 3 will visualize this for PDMS.
Introduction
3
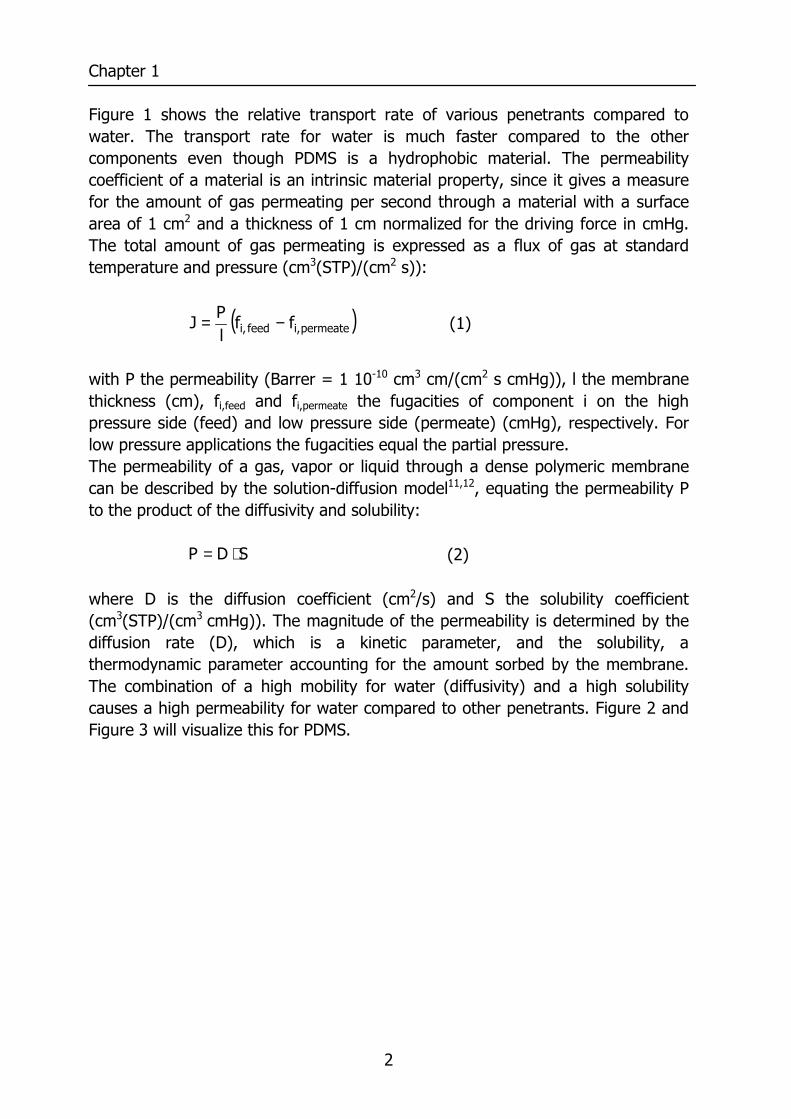
Figure 2: Solubility coefficient at infinite dilution at 35°C versus the critical temperature of various penetrants in PDMS. Data reproduced from Merkel et. al.13 and water from Barrie14.
Figure 2 shows the solubility coefficient for various penetrants in PDMS at 35°C reproduced from literature13,14 as a function of the critical temperature15, which can be interpreted as a measure for the condensability of the penetrant. The solubility coefficient increases with an increase of the critical temperature. The solubility coefficient depicted in Figure 2 is determined at infinite dilution and represents the solubility of a penetrant, which does not change the environment into which it absorbs macroscopically. However, in reality the solubility may depend on the penetrant concentration and various sorption isotherms (deviations from ideal dissolution following Henry’s law) can be observed.
0 100 200 300 400 500 600 70010-4
10-3
10-2
10-1
100
H2OC3H8
C2H6
CO2CH4N2O2
S∞[c
m3 (S
TP)/(
cm3 cm
Hg)
]
Critical Temperature [K]
H2
Chapter 1
4
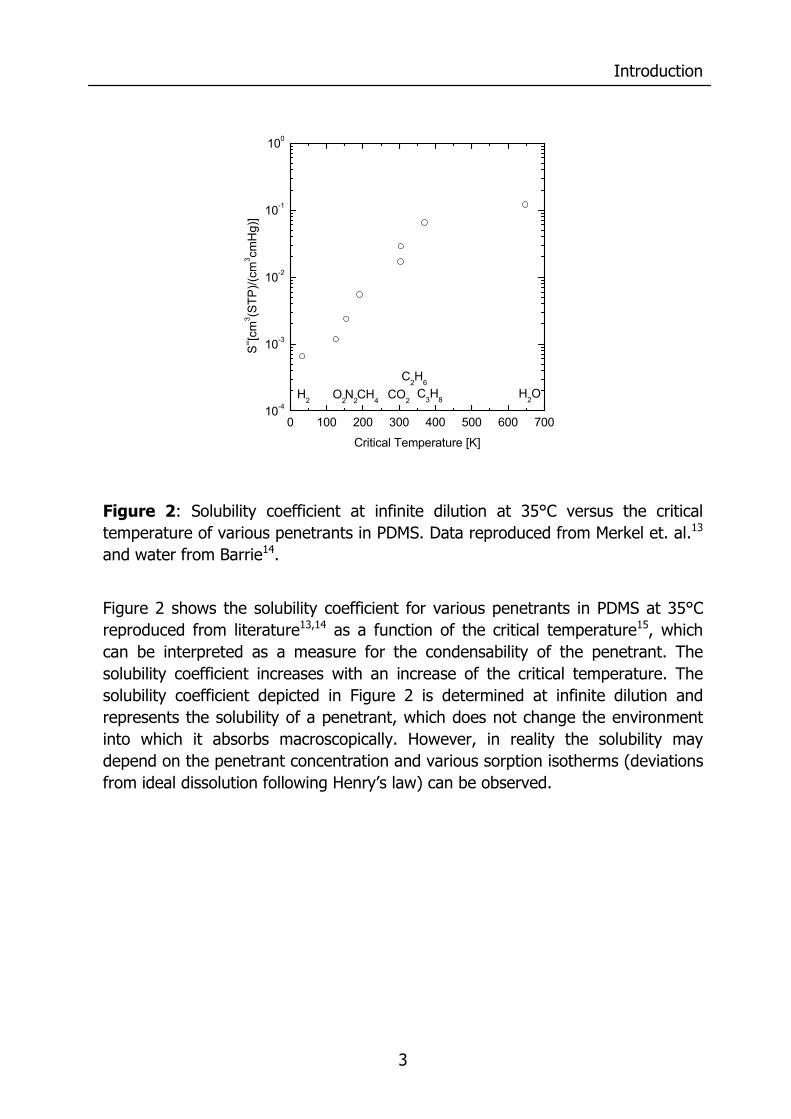
Figure 3: The effect of penetrant size on the diffusion coefficient at infinite dilution. Data reproduced from Merkel et. al.13 and for H2O from Barrie14.
Figure 3 shows the effect of penetrant size on the diffusivity, which decreases with an increase of penetrant size16. The diffusivity of the penetrant depicted in Figure 3 is determined at infinite dilution as well. The diffusion coefficient of a penetrant may depend on its concentration and can increase with the amount of penetrant due to plasticization of the polymeric matrix17-20 or decreases due to the formation of penetrant clusters in the polymeric matrix14,21-23 or a combination of both effects24. The smallest penetrant (H2O) possesses the highest solubility and diffusivity even in a hydrophobic polymer like PDMS. This causes a remarkable high water vapor permeability (Figure 1). However, the chemical structure of a polymer determines the actual permeability for water vapor as well as for other gases. The water vapor/N2 selectivity and water vapor permeability for various polymers are listed in Table.1. Figure 4 shows the cross plot of the selectivity, calculated from single gas experiments, as a function of the water vapor permeability. The permeance values are extrapolated to a water vapor activity of 0, since the water vapor permeability strongly depends on the water vapor activity.
2.0 2.5 3.0 3.5 4.0 4.5 5.01E-6
1E-5
1E-4
C3H8C2H6
CH4
CO2
O2 N2
Diff
usiv
ity [c
m2 /s
]
kinetic diameter [Å]
H2O H2
Introduction
5
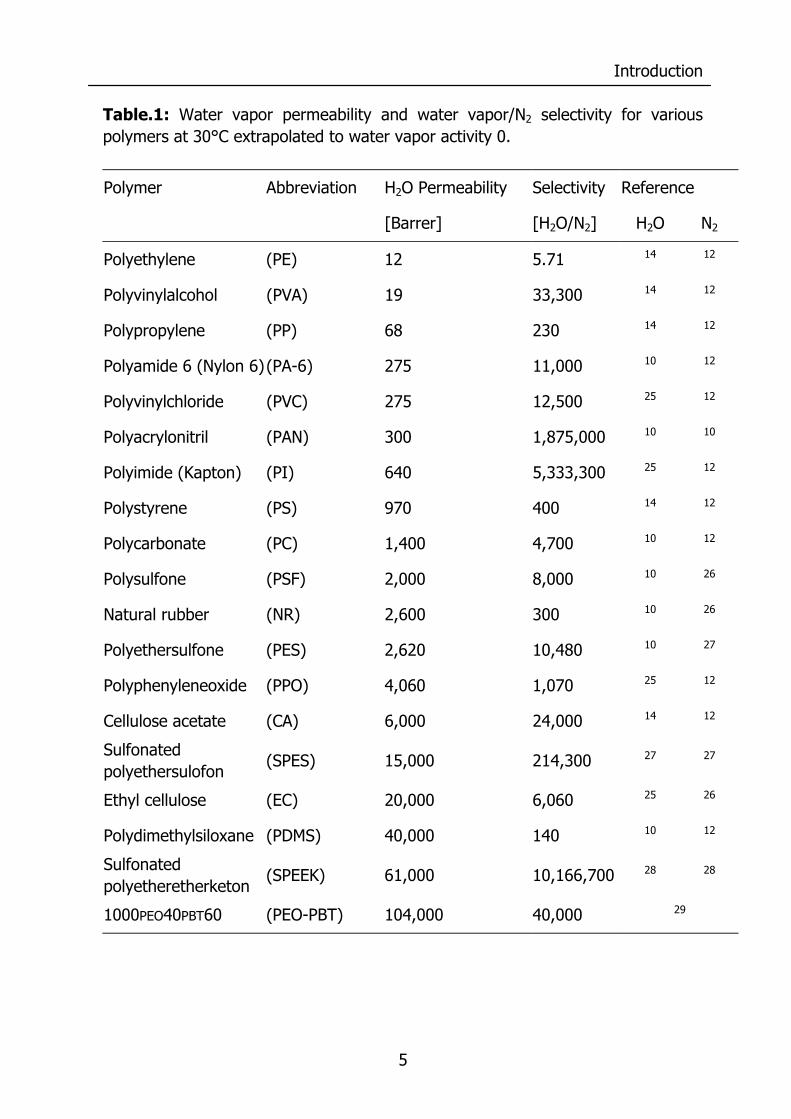
Table.1: Water vapor permeability and water vapor/N2 selectivity for various polymers at 30°C extrapolated to water vapor activity 0.
Polymer Abbreviation H2O Permeability Selectivity Reference
[Barrer] [H2O/N2] H2O N2
Polyethylene (PE) 12 5.71 14 12
Polyvinylalcohol (PVA) 19 33,300 14 12
Polypropylene (PP) 68 230 14 12
Polyamide 6 (Nylon 6) (PA-6) 275 11,000 10 12
Polyvinylchloride (PVC) 275 12,500 25 12
Polyacrylonitril (PAN) 300 1,875,000 10 10
Polyimide (Kapton) (PI) 640 5,333,300 25 12
Polystyrene (PS) 970 400 14 12
Polycarbonate (PC) 1,400 4,700 10 12
Polysulfone (PSF) 2,000 8,000 10 26
Natural rubber (NR) 2,600 300 10 26
Polyethersulfone (PES) 2,620 10,480 10 27
Polyphenyleneoxide (PPO) 4,060 1,070 25 12
Cellulose acetate (CA) 6,000 24,000 14 12
Sulfonated polyethersulofon
(SPES) 15,000 214,300 27 27
Ethyl cellulose (EC) 20,000 6,060 25 26
Polydimethylsiloxane (PDMS) 40,000 140 10 12
Sulfonated polyetheretherketon
(SPEEK) 61,000 10,166,700 28 28
1000PEO40PBT60 (PEO-PBT) 104,000 40,000 29
Chapter 1
6
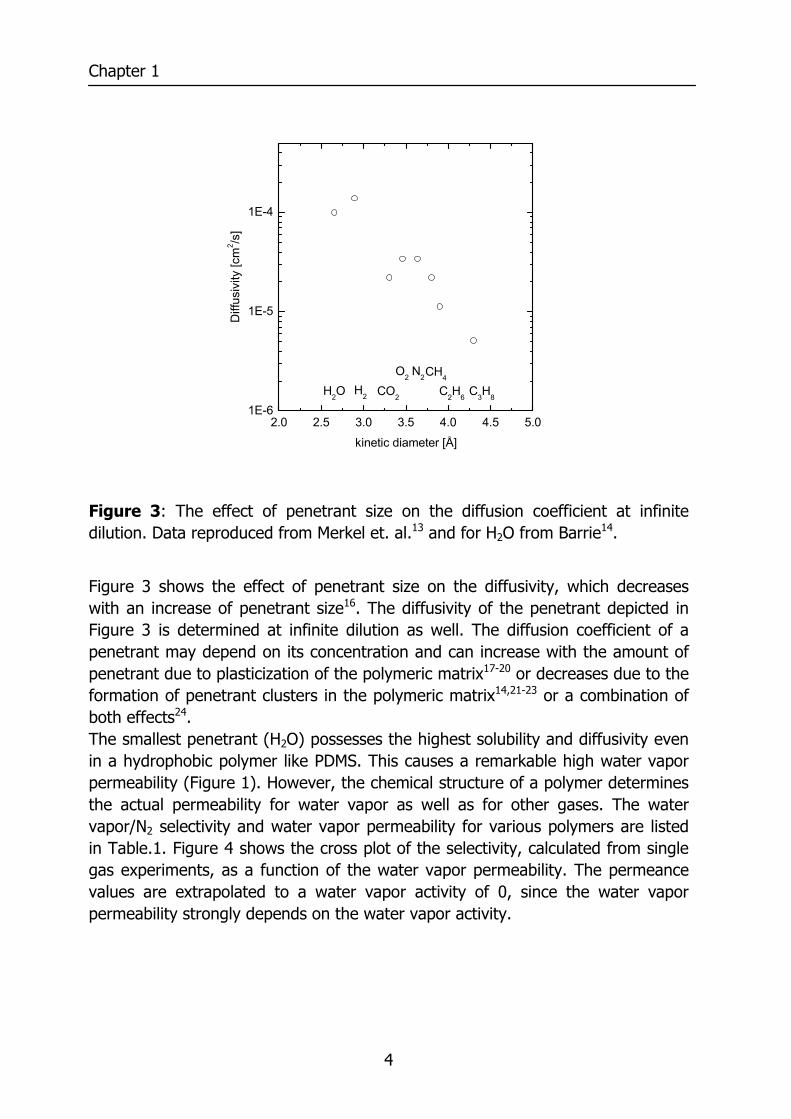
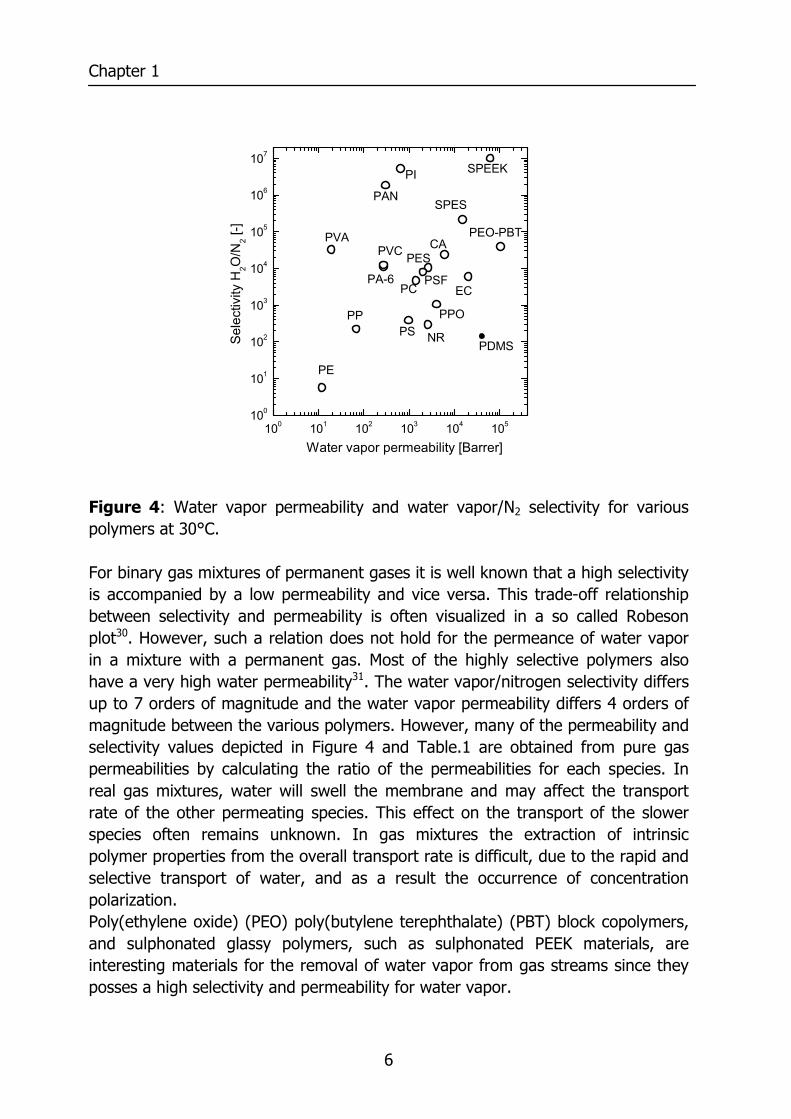
Figure 4: Water vapor permeability and water vapor/N2 selectivity for various polymers at 30°C. For binary gas mixtures of permanent gases it is well known that a high selectivity is accompanied by a low permeability and vice versa. This trade-off relationship between selectivity and permeability is often visualized in a so called Robeson plot30. However, such a relation does not hold for the permeance of water vapor in a mixture with a permanent gas. Most of the highly selective polymers also have a very high water permeability31. The water vapor/nitrogen selectivity differs up to 7 orders of magnitude and the water vapor permeability differs 4 orders of magnitude between the various polymers. However, many of the permeability and selectivity values depicted in Figure 4 and Table.1 are obtained from pure gas permeabilities by calculating the ratio of the permeabilities for each species. In real gas mixtures, water will swell the membrane and may affect the transport rate of the other permeating species. This effect on the transport of the slower species often remains unknown. In gas mixtures the extraction of intrinsic polymer properties from the overall transport rate is difficult, due to the rapid and selective transport of water, and as a result the occurrence of concentration polarization. Poly(ethylene oxide) (PEO) poly(butylene terephthalate) (PBT) block copolymers, and sulphonated glassy polymers, such as sulphonated PEEK materials, are interesting materials for the removal of water vapor from gas streams since they posses a high selectivity and permeability for water vapor.
100 101 102 103 104 105100
101
102
103
104
105
106
107
Sel
ectiv
ity H
2O/N
2 [-]
Water vapor permeability [Barrer]
PE
PP
PVA
PAN
PI SPEEK
PDMS
PVC
PC
PESCA
SPES
PEO-PBT
ECPSF
PPO
NRPS
PA-6
Introduction
7
PEO-PBT block copolymers allow for a structural modification by the amount of PEO and the PEO segment length. Moreover, these materials are also interesting for the separation of polar (quadrupolar) components from gas streams (e.g. CO2, H2S), since PEO containing block copolymers have a high solubility for these gases32-34. Little is known on the water and simultaneous inert gas transport for highly permeable polymers. Frequently, additional mass transport resistances at the feed and permeate side of the membrane develop due to the high permeability and selectivity, and leave the extraction of intrinsic material properties a challenging task. 1.2 Scope of this thesis Until today, no systematic study on the influence of block length and block weight ratio of block copolymers on its permeation properties is published. The major part of this thesis deals with the kinetics and thermodynamics of mass transport through PEO-PBT block copolymers. However, before elucidating the transport properties of the highly selective and highly permeable PEO-PBT based block copolymer, a thorough investigation of the hydrodynamic resistances during water vapor transport is presented for flat sheet as well as for hollow fiber membranes. Chapter 2 describes a new experimental set-up, for the simultaneous measurement of the transport rate of water vapor and permanent gases with a sweep gas, in the temperature range of 20 – 80°C and the pressure range 1 – 80 bars. This chapter describes in detail the set-up and deals with concentration polarization phenomena encountered in the measurement of humidified single and binary gas mixtures. The water vapor permeation rates measured for ethyl cellulose and polysulfone are verified with literature values. Chapter 3 presents the permeance of N2/H2O, CO2/H2O, and N2/CO2/H2O gaseous mixtures through high flux PES/PI blend hollow fibers, which were recently developed in our lab19. The effect of concentration polarization on the water vapor transport rate is quantified and the influence of water vapor on the transport rate of CO2, N2, and a CO2/N2 mixture is treated. The remainder of this thesis focuses on the transport through PEO-PBT block copolymers. The pure gas permeabilities of various PEO-PBT block copolymers are presented in Chaper 4. These block copolymers allow for a structural modification in the amount of PEO and its PEO segment length. The block copolymer structure is varied systematically and its effect on the permeability and selectivity of CO2, N2, and He in the temperature range of 10 – 80°C is investigated. The PEO-PBT block copolymers have a high solubility for water vapor compared to other polymers (Chapter 5). This solubility can be tailored by changing the
Chapter 1
8
amount of PEO as well as the PEO segment length. The sorption isotherms are analyzed with the Flory-Huggins model and with a thermodynamic analysis. The latter reveals increased water uptake to be entropy driven. The permeation of water vapor and N2 through a series of PEO-PBT block copolymers is covered in Chapter 6. The sorption isotherms are analyzed with the Zimm and Lundberg cluster model35,36. Diffusivities are extracted from the sorption and permeation isotherms and decrease with an increase of the amount of water in the polymer. The state of water in the polymer is analyzed with Attenuated Total Reflection Fourier Transformed Infrared Spectroscopy (ATR-FTIR). Chapter 6 reflects on the physical reason for increasing and decreasing diffusivities with increasing penetrant concentration and degree of swelling, respectively. Ultimately, this thesis aims to establish a thorough analysis for water transport through polymeric membranes. Particularly, the transport behavior of systematically tailored PEO-PBT block copolymers is investigated. Due to their superior properties, they are viable candidates for applications such as drying and natural gas dehydration. 1.3 References (1) Wu, Y. L.; Peng, X.; Liu, J. Z.; Kong, Q. Y.; Shi, B. L.; Tong, M. S. J.
Membr. Sci. 2002, 196, 179-183. (2) Tabe-Mohammadi, A. Sep. Sci. Technol. 1999, 34, 2095-2111. (3) Liu, L.; Chen, Y.; Kang, Y. X.; Deng, M. Chem. Eng. Technol. 2001, 24,
1045-1048. (4) Gebben, B. J. Membr. Sci. 1996, 113, 323-329. (5) George, S. C.; Thomas, S. Prog. Polym. Sci. 2001, 26, 985-1017. (6) Dutt, O.; Lavallee, C.; Ashton, H. E. J. Test. Eval. 1993, 21, 199-210. (7) El-Dessouky, H. T.; Ettouney, H. M.; Bouhamra, W. Chem. Eng. Res. Des.
2000, 78, 999-1009. (8) Scovazzo, P.; Burgos, J.; Hoehn, A.; Todd, P. J. Membr. Sci. 1998, 149,
69-81. (9) Baker, R. W. Membrane Technology and Applications; McGraw-Hill
Professional Publishing, 1999. (10) Allen, S. M.; Fujii, M.; Stannett, V.; Hopfenberg, H. B.; Williams, J. L. J.
Membr. Sci. 1977, 2, 153-164. (11) Wijmans, J. G.; Baker, R. W. J. Membr. Sci. 1995, 107, 1-21. (12) Mulder, M. H. V. Basic principles of membrane technology, second ed.;
Kluwer: Dordrecht, 1996. (13) Merkel, T. C.; Bondar, V. I.; Nagai, K.; Freeman, B. D.; Pinnau, I. J.
Polym. Sci., Polym. Phys. Ed. 2000, 38, 415-434.
Introduction
9
(14) Barrie, J. A. In Diffusion in Polymers; Crank, J.; Park, G. S., Eds.; Academic Press, 1968.
(15) Poling, B. E.; Prausnitz, J. M.; O'Connell, J. P. The properties of gases and liquids; McGraw-Hill: New York, 2001.
(16) Breck, D. W. Zeolite molecular sieves: structure, chemistry, and use; Wiley: New York, 1974.
(17) Bos, A., Punt, I.G.M., Wessling, M., Strathmann, H. J. Membr. Sci. 1999, 155, 67-78.
(18) Wessling, M.; Lopez, M. L.; Strathmann, H. Sep. Purif. Technol. 2001, 24, 223-233.
(19) Kapantaidakis, G. C.; Koops, G. H.; Kaldis, S. P.; Sakelaropoulos, G. P.; Wessling, M. AIChE J. 2003, 49, 1702-1711.
(20) Bos, A.; Punt, I. G. M.; Wessling, M.; Strathmann, H. J. Polym. Sci., Polym. Phys. Ed. 1998, 36, 1547-1556.
(21) Nguyen, Q. T.; Favre, E.; Ping, Z. H.; Neel, J. J. Membr. Sci. 1996, 113, 137-150.
(22) Strathmann, H.; Michaels, A. S. Desalination 1977, 21, 195-202. (23) Koros, W. J.; Hellums, M. W. In Encyclopedia of polymer science and
engineering; Kroschwitz, J. I., Ed.; Wiley: New York, 1990; pp 724-802. (24) Beck, M. I.; Tomka, I. J. Macromol. Sci., Phys. 1997, B36, 19-39. (25) Barrie, J. A. Proceeding of the fourth BOC Priestly Conference 1986, 89-
113. (26) Ho, W. S. W.; Sirkar, K. K. Membrane Handbook; Van Nostrand Reinhold:
New York, 1992. (27) Jia, L.; Xu, X. F.; Zhang, H. J.; Xu, J. P. J. Polym. Sci., Polym. Phys. Ed.
1997, 35, 2133-2140. (28) Liu, S.; Wang, F.; Chen, T. Macromol. Rapid. Commun. 2001, 22, 579-
582. (29) Metz, S. J.; Ven, W. J. C. v. d.; Mulder, M. H. V.; Wessling, M. Chapter
6. (30) Robeson, L. M. J. Membr. Sci. 1991, 62, 165-185. (31) Nunes, S. P.; Peinemann, K.-V. Membrane technology in the chemical
industry; Wiley-VCH: Weinheim, 2001. (32) Bondar, V. I.; Freeman, B. D.; Pinnau, I. J. Polym. Sci., Polym. Phys. Ed.
1999, 37, 2463-2475. (33) Bondar, V. I.; Freeman, B. D.; Pinnau, I. J. Polym. Sci., Polym. Phys. Ed.
2000, 38, 2051-2062. (34) Okamoto, K.; Fujii, M.; Okamyo, S.; Suzuki, H.; Tanaka, K.; Kita, H.
Macromolecules 1995, 28, 6950-6956. (35) Zimm, B. H. J. Chem. Phys. 1953, 21, 934. (36) Zimm, B. H.; Lundberg, J. L. J. Phys. Chem. 1956, 60, 425.

10
11
Chapter 2
Measurement of Water Vapor and Gas Permeation through Polymers
Abstract This chapter describes in detail the measurement of the permeation properties of a water vapor/N2 gas mixture for highly permeable polymers. The measurements are complicated by the presence of stagnant boundary layers at feed and permeate side. Its resistance can be extracted from the measurement of the overall resistance of polymeric films having various thicknesses. Water vapor permeabilities of ethyl cellulose and polysulfone films are determined and corrected for the resistance in the stagnant boundary layer and correspond to those in literature. Permeability values of a highly permeable PEO-PBT block copolymer (1000PEO56PBT44) are presented to illustrate the contribution of the stagnant boundary layer at various process conditions. The water vapor permeability shows a strong dependence on the total pressure. An increase of the total pressure results in a larger resistance in the stagnant feed boundary layer, thereby lowering the total water vapor flux.
Chapter 2
12
2.1 Introduction Water vapor transport through polymeric barrier materials or membranes is of major industrial importance. Applications can be found in the drying of natural gas1, drying of compressed air2, protective apparel3, packaging materials, roofing membranes, diapers, and the humidity control in closed spaces (air conditioning in buildings, aviation and space flight). Various polymers can be used as a selective membrane or barrier material for the transport of water vapor. Depending on the application, a high or low permeability or selectivity for water vapor is preferred. Generally, water permeates to a larger extent than permanent gases due to a larger solubility of water vapor. However, many of the permeability and selectivity values are obtained from pure gas permeabilities by calculating the ratio of the permeabilities for each species. In real gas mixtures water may swell the membrane and its effect on the transport of the slower species often remains unknown. In gas mixtures the extraction of intrinsic polymer properties from the overall transport rate is also difficult, due to the rapid transport of water resulting in concentration polarization. This chapter describes in detail the measurement of the permeability of a water vapor in a water/N2 mixture through polymers in a newly developed experimental set-up. Permeability values are compared with literature data. Furthermore, the effect of water vapor activity, temperature, total pressure, membrane thickness and feed flow rate are investigated for a highly selective and highly permeable block copolymer, composed of hydrophilic PEO blocks and impermeable PBT blocks. 2.2 Background 2.2.1 Measurement of water vapor permeation The “cup method” is probably the most used technique to determine the transport rate of water vapor through a polymeric material. This method is based on a polymeric film, covering a container containing water or a dessicant. This container is placed in a humidity-controlled environment, and the permeability of water vapor through a polymeric film is determined by the rate of weight change of the container. The permeability determined by the cup method is affected by the presence of stagnant boundary layers on both sides of the polymeric film4. Moreover, the sealing of the film can give rise to errors, especially for low permeable films5. More accurate results can be obtained with the variable pressure constant volume method, where a vacuum is applied at the permeate side of the membrane and a
Measurement of Water Vapor and Gas Permeation through Polymers
13
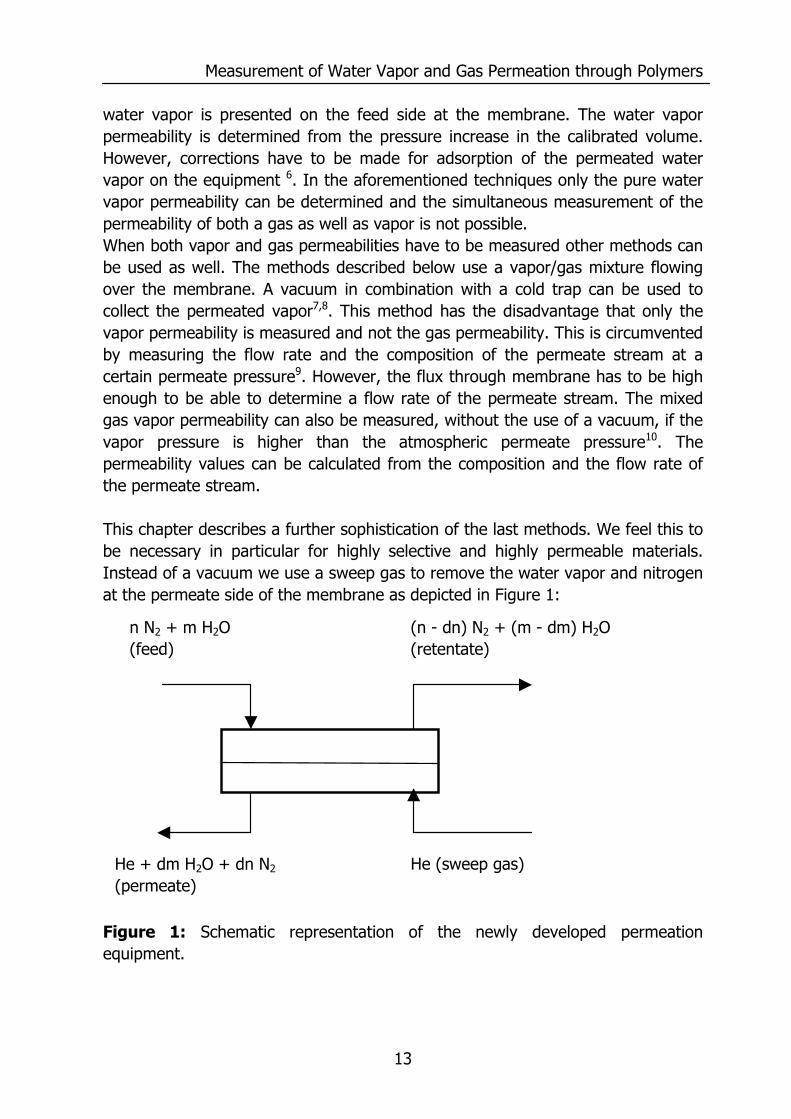
water vapor is presented on the feed side at the membrane. The water vapor permeability is determined from the pressure increase in the calibrated volume. However, corrections have to be made for adsorption of the permeated water vapor on the equipment 6. In the aforementioned techniques only the pure water vapor permeability can be determined and the simultaneous measurement of the permeability of both a gas as well as vapor is not possible. When both vapor and gas permeabilities have to be measured other methods can be used as well. The methods described below use a vapor/gas mixture flowing over the membrane. A vacuum in combination with a cold trap can be used to collect the permeated vapor7,8. This method has the disadvantage that only the vapor permeability is measured and not the gas permeability. This is circumvented by measuring the flow rate and the composition of the permeate stream at a certain permeate pressure9. However, the flux through membrane has to be high enough to be able to determine a flow rate of the permeate stream. The mixed gas vapor permeability can also be measured, without the use of a vacuum, if the vapor pressure is higher than the atmospheric permeate pressure10. The permeability values can be calculated from the composition and the flow rate of the permeate stream. This chapter describes a further sophistication of the last methods. We feel this to be necessary in particular for highly selective and highly permeable materials. Instead of a vacuum we use a sweep gas to remove the water vapor and nitrogen at the permeate side of the membrane as depicted in Figure 1:
Figure 1: Schematic representation of the newly developed permeation equipment.
n N2 + m H2O (feed)
(n - dn) N2 + (m - dm) H2O (retentate)
He (sweep gas)He + dm H2O + dn N2
(permeate)
Chapter 2
14
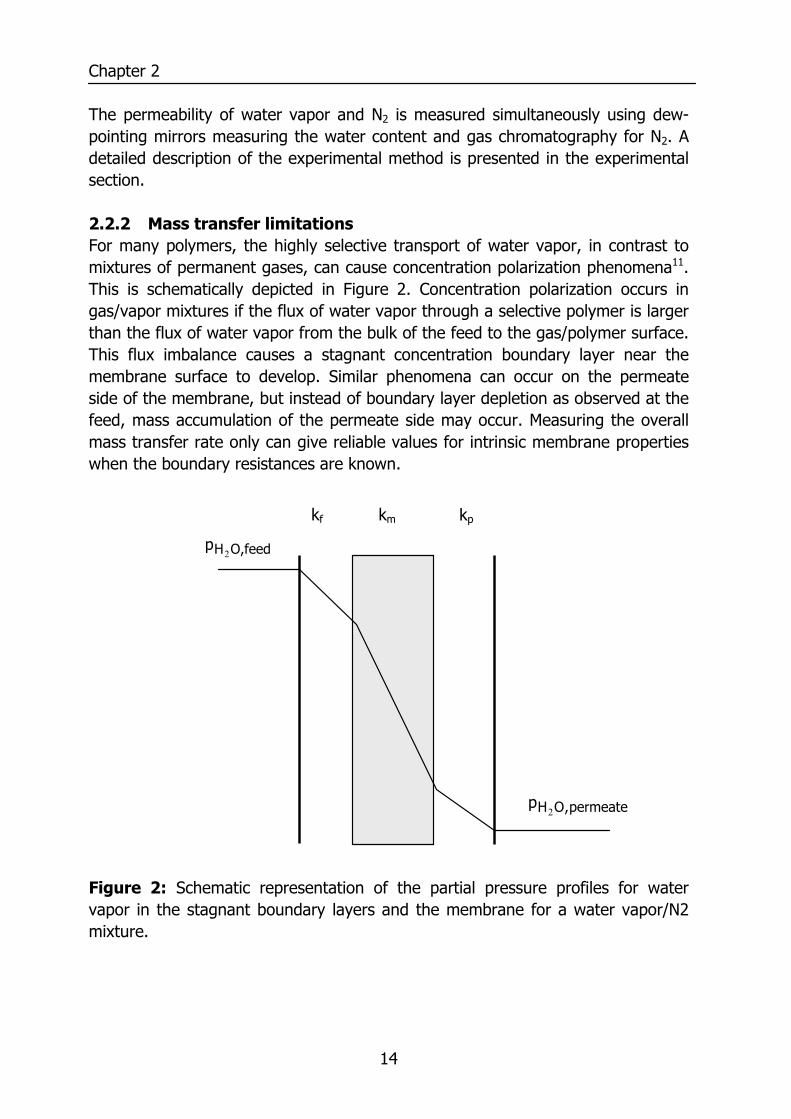
The permeability of water vapor and N2 is measured simultaneously using dew-pointing mirrors measuring the water content and gas chromatography for N2. A detailed description of the experimental method is presented in the experimental section. 2.2.2 Mass transfer limitations For many polymers, the highly selective transport of water vapor, in contrast to mixtures of permanent gases, can cause concentration polarization phenomena11. This is schematically depicted in Figure 2. Concentration polarization occurs in gas/vapor mixtures if the flux of water vapor through a selective polymer is larger than the flux of water vapor from the bulk of the feed to the gas/polymer surface. This flux imbalance causes a stagnant concentration boundary layer near the membrane surface to develop. Similar phenomena can occur on the permeate side of the membrane, but instead of boundary layer depletion as observed at the feed, mass accumulation of the permeate side may occur. Measuring the overall mass transfer rate only can give reliable values for intrinsic membrane properties when the boundary resistances are known.
Figure 2: Schematic representation of the partial pressure profiles for water vapor in the stagnant boundary layers and the membrane for a water vapor/N2 mixture.
permeate,OHp2
O,feedHp2
kp kf km
Measurement of Water Vapor and Gas Permeation through Polymers
15
In Figure 2 kf, km, and kp are the mass transfer coefficients in the feed boundary layer, the membrane, and the permeate boundary layer, respectively. The stagnant boundary layers on the feed and permeate side of the membrane represent an extra resistance through the membrane. These resistances can be represented with the resistance in series model:
pmfov kkkk1111 ++=
(1)
where 1/kov is the overall resistance for water vapor permeation (s/m) and kov the overall mass transfer coefficient for water vapor (m/s). The mass transfer coefficients in the feed and permeate depend on the geometry and the hydrodynamic conditions of the system and are often described with Sherwood relations12:
d
h
cb
dL
ScReaSh
=
where
=DkdSh h
,
η
ρ= hvdRe
,
ρη=D
Sc
(2)
and a, b, c and d are specific constants depending on the geometry of the system. Sh is the Sherwood number (-), Re the Reynolds number (-), Sc the Schmidt number (-), k the mass transfer coefficient (m/s), dh the hydraulic diameter (m), ρ the density (kg/m3), η the viscosity (Pa s), L the length of the flow path (m) and D the diffusion coefficient of water vapor in the gas mixture (m2/s). The diffusion coefficient of water vapor in nitrogen at various pressures and temperatures can be estimated with the following empirical relation derived by Massman13:
811
0
00
.
TT
pp
DD
=
(3)
where D is the diffusion coefficient of water in nitrogen (cm2/s), D0 is the diffusion coefficient of water in nitrogen at 1 bar and 273 K (0.2190 cm2/s), p0 = 1.013 bar, p the pressure (bar), T the absolute temperature (K) and T0 = 273.15 K. The amount of nitrogen near the membrane surface is higher than the bulk concentration due to the lower water vapor pressure near the membrane surface. Frequently, this effect is negligible since the amount of water vapor in the feed is
Chapter 2
16
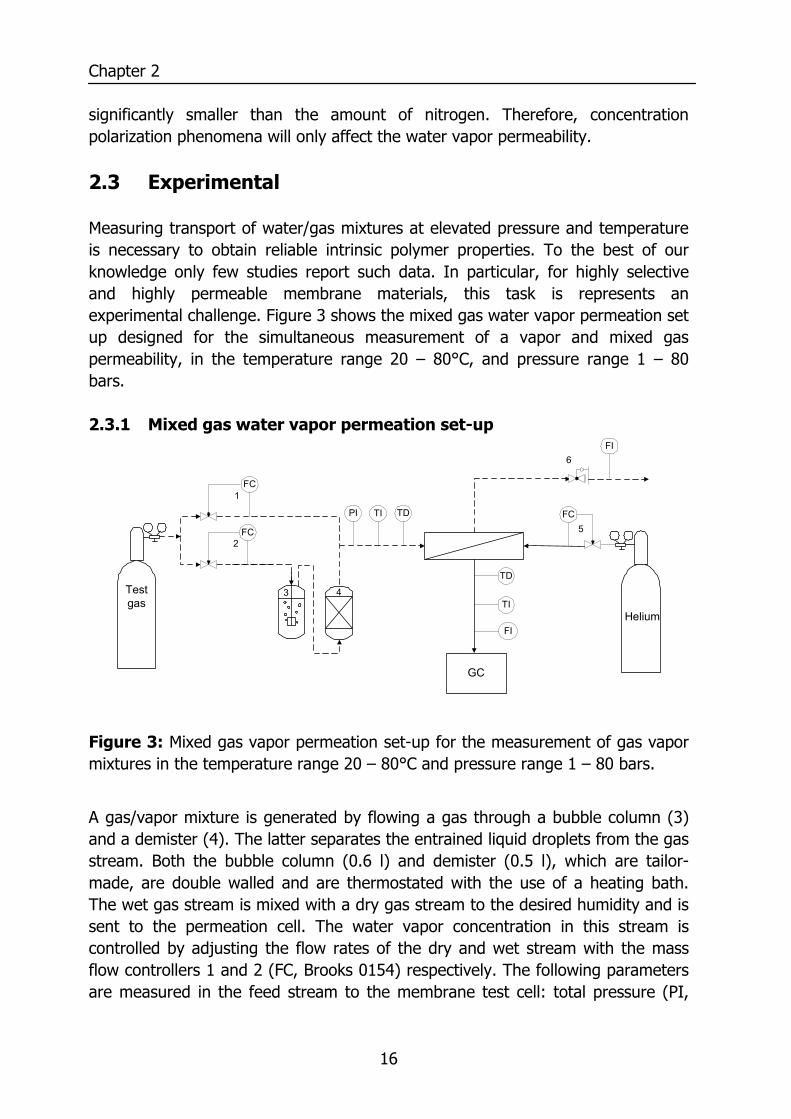
significantly smaller than the amount of nitrogen. Therefore, concentration polarization phenomena will only affect the water vapor permeability. 2.3 Experimental Measuring transport of water/gas mixtures at elevated pressure and temperature is necessary to obtain reliable intrinsic polymer properties. To the best of our knowledge only few studies report such data. In particular, for highly selective and highly permeable membrane materials, this task is represents an experimental challenge. Figure 3 shows the mixed gas water vapor permeation set up designed for the simultaneous measurement of a vapor and mixed gas permeability, in the temperature range 20 – 80°C, and pressure range 1 – 80 bars. 2.3.1 Mixed gas water vapor permeation set-up
Figure 3: Mixed gas vapor permeation set-up for the measurement of gas vapor mixtures in the temperature range 20 – 80°C and pressure range 1 – 80 bars.
A gas/vapor mixture is generated by flowing a gas through a bubble column (3) and a demister (4). The latter separates the entrained liquid droplets from the gas stream. Both the bubble column (0.6 l) and demister (0.5 l), which are tailor-made, are double walled and are thermostated with the use of a heating bath. The wet gas stream is mixed with a dry gas stream to the desired humidity and is sent to the permeation cell. The water vapor concentration in this stream is controlled by adjusting the flow rates of the dry and wet stream with the mass flow controllers 1 and 2 (FC, Brooks 0154) respectively. The following parameters are measured in the feed stream to the membrane test cell: total pressure (PI,
PI TI
Testgas
FC
FC1
2
3 4TI
TD
Helium
FC
FI
GC
5
6
TD
FI
Measurement of Water Vapor and Gas Permeation through Polymers
17
Druck PTX 1400), temperature (TI, thermocouple), and the water vapor dew point (TD, Michel instruments SD). This gas mixture flows over a polymeric film mounted in a membrane test cell and leaves the system via a back pressure (6, Go backpressure regulator), which controls the total pressure in the system. The flow rate of the stream leaving the membrane test cell is measured with a soap bubble meter (FI). Water vapor as well as gas permeate through the membrane material and are removed with a helium sweep gas. The flow rate of this sweep gas can be controlled with a mass flow controller 5 (FC, Brooks 0154). In the sweep gas stream leaving the permeate side of the cell the following parameters are analyzed: water vapor dew point (TD, Michel instruments SD), temperature (TI, thermocouple), flow rate (FI, soap bubble meter), and nitrogen concentration with a gas chromatograph (GS, Varian 3400, column: Porapack Q). The whole set up is insulated and temperature controlled with the use of a heating bath, via heat exchangers and heating tape (Isopad heating tape and Winkler temperature control unit), which prevent condensation of water vapor in the tubing of the set up.
Chapter 2
18
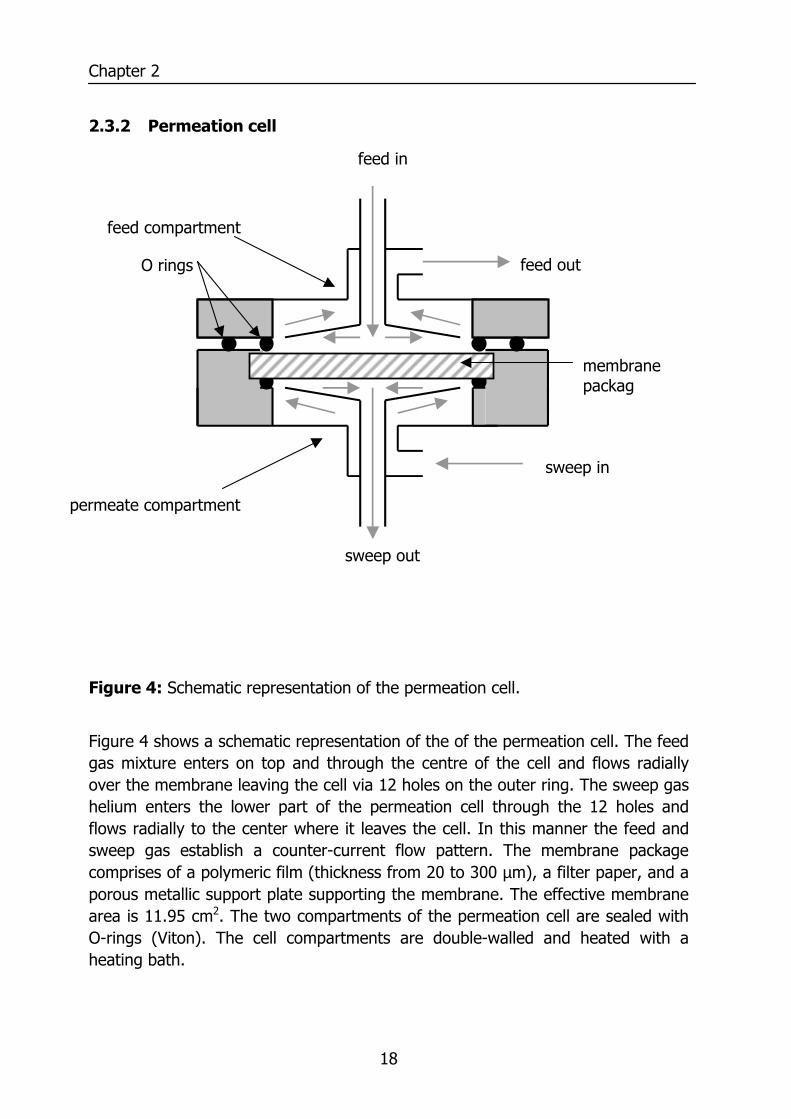
2.3.2 Permeation cell
Figure 4: Schematic representation of the permeation cell.
Figure 4 shows a schematic representation of the of the permeation cell. The feed gas mixture enters on top and through the centre of the cell and flows radially over the membrane leaving the cell via 12 holes on the outer ring. The sweep gas helium enters the lower part of the permeation cell through the 12 holes and flows radially to the center where it leaves the cell. In this manner the feed and sweep gas establish a counter-current flow pattern. The membrane package comprises of a polymeric film (thickness from 20 to 300 µm), a filter paper, and a porous metallic support plate supporting the membrane. The effective membrane area is 11.95 cm2. The two compartments of the permeation cell are sealed with O-rings (Viton). The cell compartments are double-walled and heated with a heating bath.
feed compartment
permeate compartment
feed out
sweep in
sweep out
membrane packag
O rings
feed in
Measurement of Water Vapor and Gas Permeation through Polymers
19
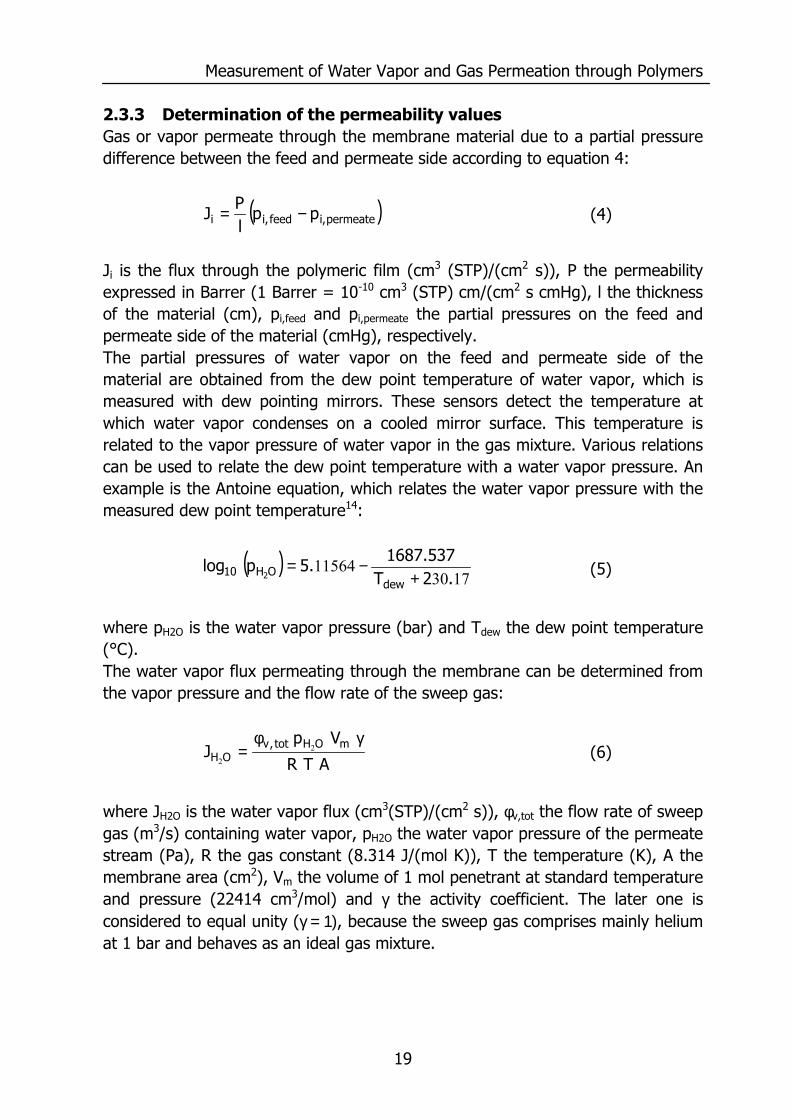
2.3.3 Determination of the permeability values Gas or vapor permeate through the membrane material due to a partial pressure difference between the feed and permeate side according to equation 4:
( )permeate,ifeed,ii pplP
J −=
(4)
Ji is the flux through the polymeric film (cm3 (STP)/(cm2 s)), P the permeability expressed in Barrer (1 Barrer = 10-10 cm3 (STP) cm/(cm2 s cmHg), l the thickness of the material (cm), pi,feed and pi,permeate the partial pressures on the feed and permeate side of the material (cmHg), respectively. The partial pressures of water vapor on the feed and permeate side of the material are obtained from the dew point temperature of water vapor, which is measured with dew pointing mirrors. These sensors detect the temperature at which water vapor condenses on a cooled mirror surface. This temperature is related to the vapor pressure of water vapor in the gas mixture. Various relations can be used to relate the dew point temperature with a water vapor pressure. An example is the Antoine equation, which relates the water vapor pressure with the measured dew point temperature14:
( )1730
11564.2T
1687.537.5plog
dewOH10 2 +
−= (5)
where pH2O is the water vapor pressure (bar) and Tdew the dew point temperature (°C). The water vapor flux permeating through the membrane can be determined from the vapor pressure and the flow rate of the sweep gas:
ATR
VpJ mOHtot,v
OHγφ
= 22
(6)
where JH2O is the water vapor flux (cm3(STP)/(cm2 s)), φv,tot the flow rate of sweep gas (m3/s) containing water vapor, pH2O the water vapor pressure of the permeate stream (Pa), R the gas constant (8.314 J/(mol K)), T the temperature (K), A the membrane area (cm2), Vm the volume of 1 mol penetrant at standard temperature and pressure (22414 cm3/mol) and γ the activity coefficient. The later one is considered to equal unity (γ = 1), because the sweep gas comprises mainly helium at 1 bar and behaves as an ideal gas mixture.
Chapter 2
20
The nitrogen permeability is determined from the amount of nitrogen present in the sweep gas as detected with the gas chromatograph, and the feed pressure of nitrogen. The flux of can be determined with Eq. (7):
A
FJ Ntot,v 2
2
φ=N
(7)
where JN2 is the flux of nitrogen (cm3 (STP)/(cm2 s), φv,tot the volume flow of the sweep gas (cm3(STP)/s), FN2 the fraction of nitrogen present in the sweep gas, and A the effective membrane area (cm2). The nitrogen permeability can be determined by using Eq. (4), where pi,feed is the nitrogen pressure in the feed (cmHg) and pi,permeate the amount of nitrogen in the sweep. The latter partial pressure is negligible compared to the nitrogen pressure in the feed (pfeed = 2-5
bar, ppermeate = 1· 10-4 – 3·10-3 bar). 2.3.4 Materials Bisphenol A polysulfone (PSf), type Udel® P3500 was obtained from Amoco Chemicals (Belgium), and ethyl cellulose (ethoxyl content 49%) was obtained from Acros. Chloroform (CHCl3), dichloromethane (CH2Cl2) and trifluoroacetic acid (TFA) were both purchased from Merck (analytical grade) and used as solvents. For the gas permeation experiments nitrogen (N2) and helium (He) were purchased from Hoekloos b.v. (the Netherlands). All the gases have a purity greater than 99.9%. Gas mixtures of helium and nitrogen (1000, 1500 and 2500 ppm), for the calibration of the Thermal Conductive Detector (TCD) of the gas chromatograph (GC), were obtained from Praxair n.v. (Belgium). 2.3.5 PEO-PBT block copolymers
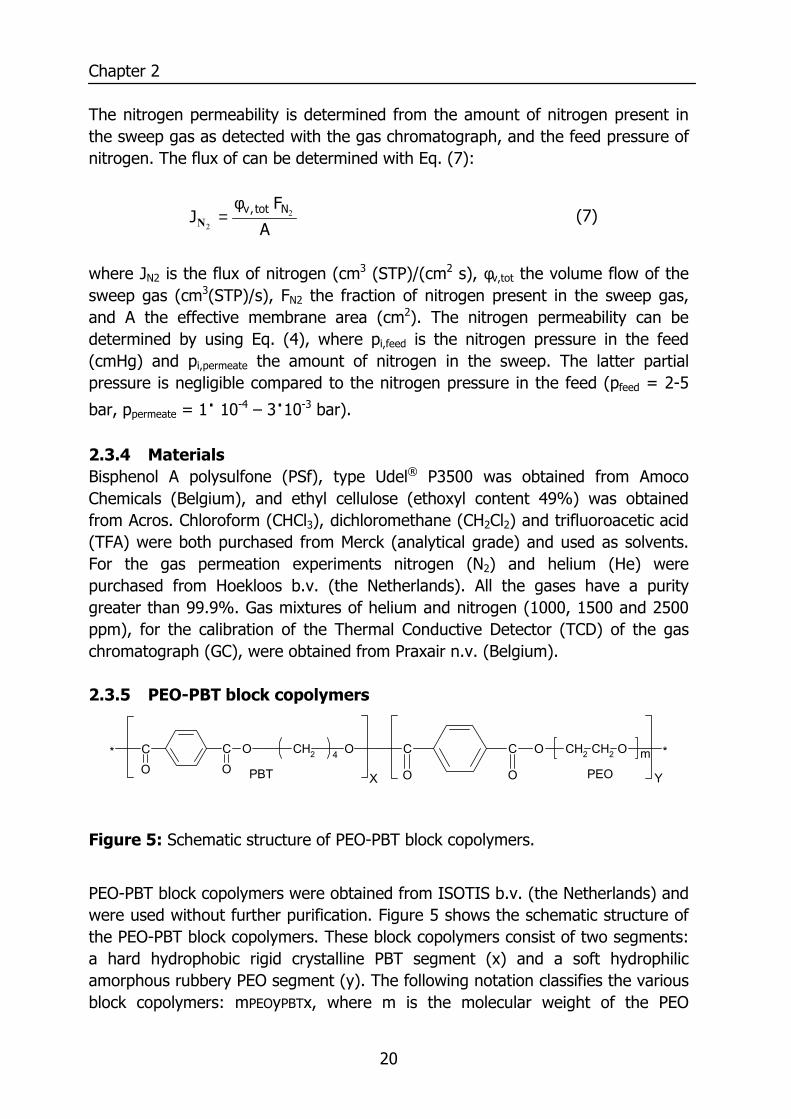
Figure 5: Schematic structure of PEO-PBT block copolymers.
PEO-PBT block copolymers were obtained from ISOTIS b.v. (the Netherlands) and were used without further purification. Figure 5 shows the schematic structure of the PEO-PBT block copolymers. These block copolymers consist of two segments: a hard hydrophobic rigid crystalline PBT segment (x) and a soft hydrophilic amorphous rubbery PEO segment (y). The following notation classifies the various block copolymers: mPEOyPBTx, where m is the molecular weight of the PEO
CC O
OO* CH2 O4
C
O
C
O
O CH2 CH2 O *m
PEOPBT X Y
Measurement of Water Vapor and Gas Permeation through Polymers
21
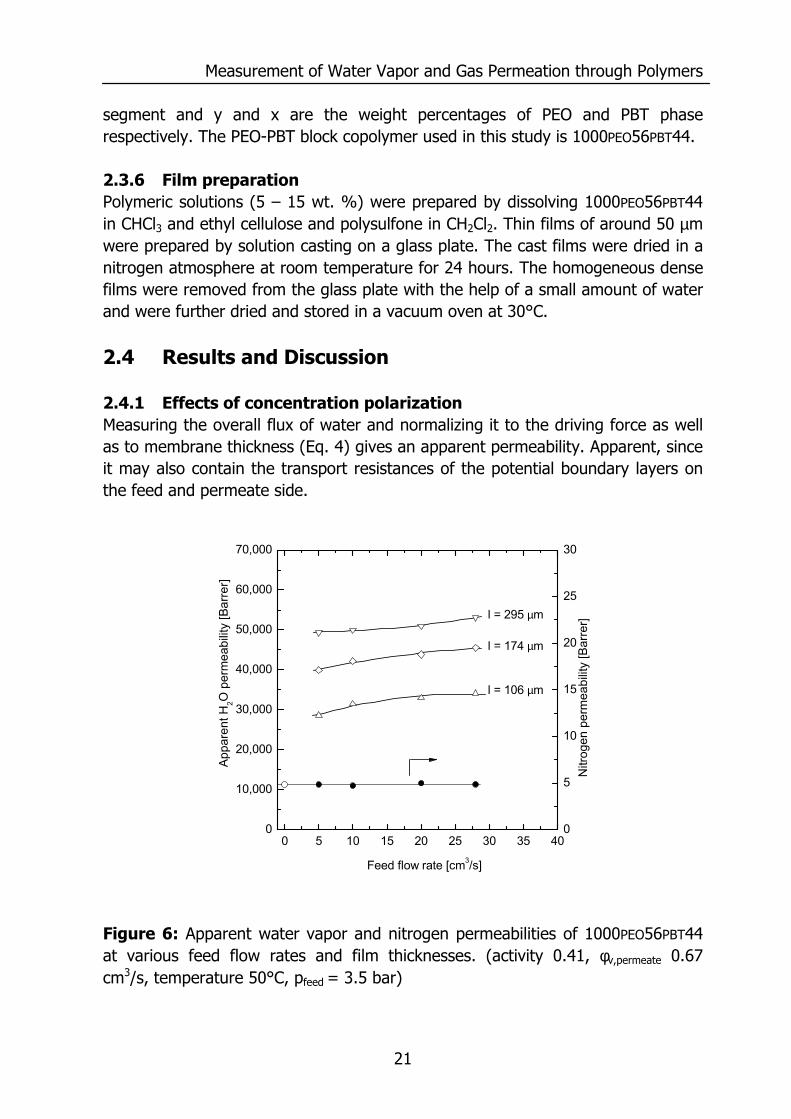
segment and y and x are the weight percentages of PEO and PBT phase respectively. The PEO-PBT block copolymer used in this study is 1000PEO56PBT44. 2.3.6 Film preparation Polymeric solutions (5 – 15 wt. %) were prepared by dissolving 1000PEO56PBT44 in CHCl3 and ethyl cellulose and polysulfone in CH2Cl2. Thin films of around 50 µm were prepared by solution casting on a glass plate. The cast films were dried in a nitrogen atmosphere at room temperature for 24 hours. The homogeneous dense films were removed from the glass plate with the help of a small amount of water and were further dried and stored in a vacuum oven at 30°C. 2.4 Results and Discussion 2.4.1 Effects of concentration polarization Measuring the overall flux of water and normalizing it to the driving force as well as to membrane thickness (Eq. 4) gives an apparent permeability. Apparent, since it may also contain the transport resistances of the potential boundary layers on the feed and permeate side.
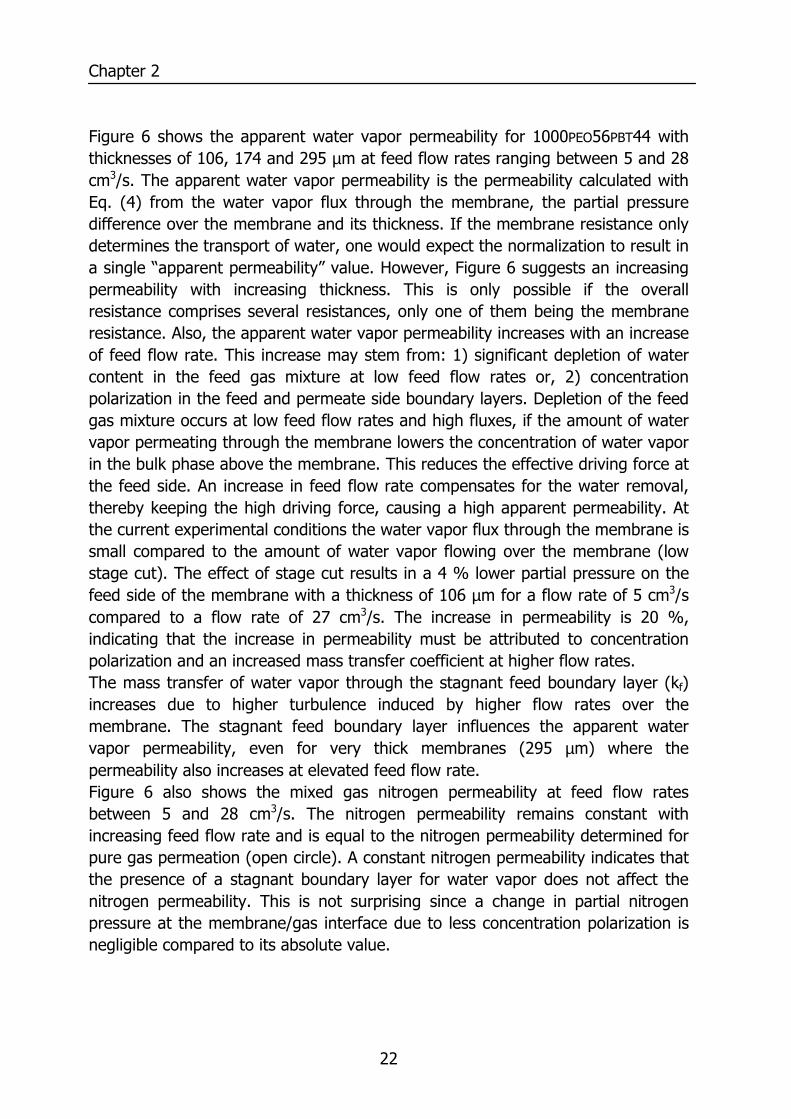
Figure 6: Apparent water vapor and nitrogen permeabilities of 1000PEO56PBT44 at various feed flow rates and film thicknesses. (activity 0.41, φv,permeate 0.67 cm3/s, temperature 50°C, pfeed = 3.5 bar)
0
5
10
15
20
25
30
0 5 10 15 20 25 30 35 400
10,000
20,000
30,000
40,000
50,000
60,000
70,000
l = 295 µm
l = 174 µm
Feed flow rate [cm3/s]
Appa
rent
H2O
per
mea
bilit
y [B
arre
r]
l = 106 µm
Nitr
ogen
per
mea
bilit
y [B
arre
r]
Chapter 2
22
Figure 6 shows the apparent water vapor permeability for 1000PEO56PBT44 with thicknesses of 106, 174 and 295 µm at feed flow rates ranging between 5 and 28 cm3/s. The apparent water vapor permeability is the permeability calculated with Eq. (4) from the water vapor flux through the membrane, the partial pressure difference over the membrane and its thickness. If the membrane resistance only determines the transport of water, one would expect the normalization to result in a single “apparent permeability” value. However, Figure 6 suggests an increasing permeability with increasing thickness. This is only possible if the overall resistance comprises several resistances, only one of them being the membrane resistance. Also, the apparent water vapor permeability increases with an increase of feed flow rate. This increase may stem from: 1) significant depletion of water content in the feed gas mixture at low feed flow rates or, 2) concentration polarization in the feed and permeate side boundary layers. Depletion of the feed gas mixture occurs at low feed flow rates and high fluxes, if the amount of water vapor permeating through the membrane lowers the concentration of water vapor in the bulk phase above the membrane. This reduces the effective driving force at the feed side. An increase in feed flow rate compensates for the water removal, thereby keeping the high driving force, causing a high apparent permeability. At the current experimental conditions the water vapor flux through the membrane is small compared to the amount of water vapor flowing over the membrane (low stage cut). The effect of stage cut results in a 4 % lower partial pressure on the feed side of the membrane with a thickness of 106 µm for a flow rate of 5 cm3/s compared to a flow rate of 27 cm3/s. The increase in permeability is 20 %, indicating that the increase in permeability must be attributed to concentration polarization and an increased mass transfer coefficient at higher flow rates. The mass transfer of water vapor through the stagnant feed boundary layer (kf) increases due to higher turbulence induced by higher flow rates over the membrane. The stagnant feed boundary layer influences the apparent water vapor permeability, even for very thick membranes (295 µm) where the permeability also increases at elevated feed flow rate. Figure 6 also shows the mixed gas nitrogen permeability at feed flow rates between 5 and 28 cm3/s. The nitrogen permeability remains constant with increasing feed flow rate and is equal to the nitrogen permeability determined for pure gas permeation (open circle). A constant nitrogen permeability indicates that the presence of a stagnant boundary layer for water vapor does not affect the nitrogen permeability. This is not surprising since a change in partial nitrogen pressure at the membrane/gas interface due to less concentration polarization is negligible compared to its absolute value.
Measurement of Water Vapor and Gas Permeation through Polymers
23
The permeate flow rate of the sweep gas is varied in order to determine whether concentration polarization on the permeate side may affect the water vapor permeability.
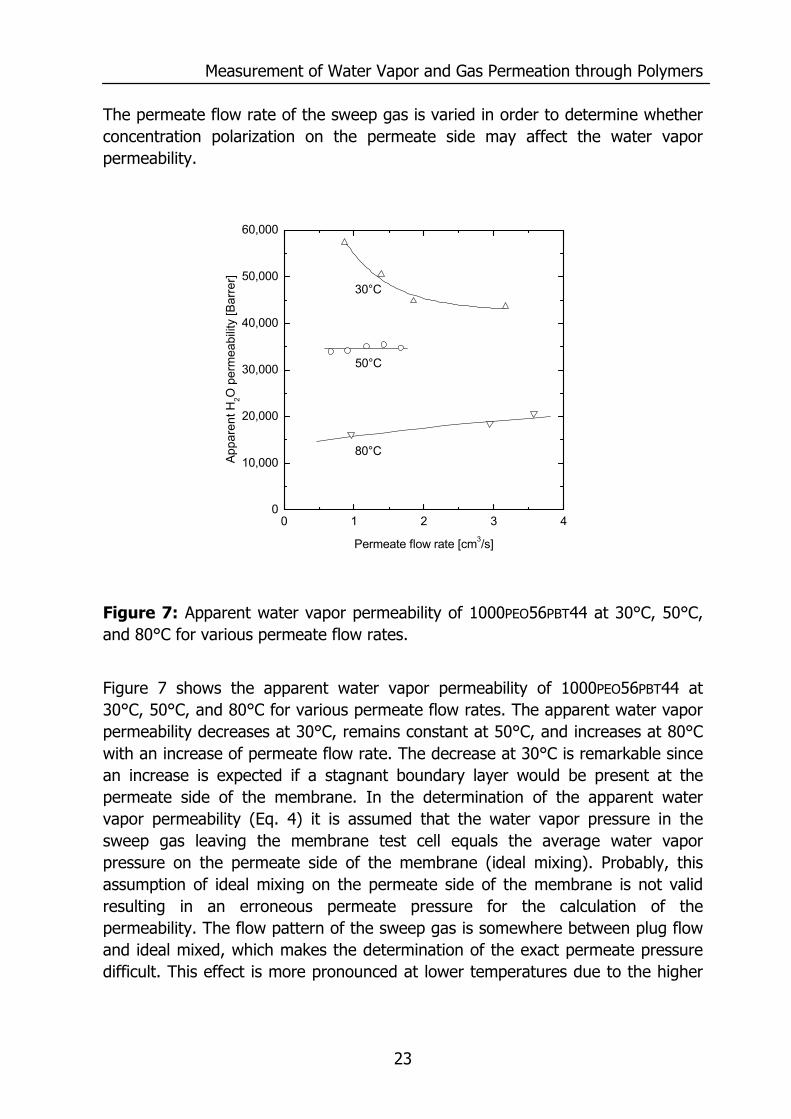
Figure 7: Apparent water vapor permeability of 1000PEO56PBT44 at 30°C, 50°C, and 80°C for various permeate flow rates.
Figure 7 shows the apparent water vapor permeability of 1000PEO56PBT44 at 30°C, 50°C, and 80°C for various permeate flow rates. The apparent water vapor permeability decreases at 30°C, remains constant at 50°C, and increases at 80°C with an increase of permeate flow rate. The decrease at 30°C is remarkable since an increase is expected if a stagnant boundary layer would be present at the permeate side of the membrane. In the determination of the apparent water vapor permeability (Eq. 4) it is assumed that the water vapor pressure in the sweep gas leaving the membrane test cell equals the average water vapor pressure on the permeate side of the membrane (ideal mixing). Probably, this assumption of ideal mixing on the permeate side of the membrane is not valid resulting in an erroneous permeate pressure for the calculation of the permeability. The flow pattern of the sweep gas is somewhere between plug flow and ideal mixed, which makes the determination of the exact permeate pressure difficult. This effect is more pronounced at lower temperatures due to the higher
0 1 2 3 40
10,000
20,000
30,000
40,000
50,000
60,000
80°C
50°C
Appa
rent
H2O
per
mea
bilit
y [B
arre
r]
Permeate flow rate [cm3/s]
30°C
Chapter 2
24
water vapor permeability of this material. The feed- and permeate pressures of water vapor at 30°C, 50°C, and 80°C are presented in Table 1.
Table 1: Feed- and permeate pressure at 30°C, 50°C, and 80°C for 1000PEO56PBT44 for φv,feed = 10 cm3/s and φv,permeate = 0.67 cm3/s.
The permeate pressure at 30°C is lower than at 50°C and 80°C and its relative contribution to the driving force (pH2O,feed – pH2O,permeate) is much larger. A deviation in the permeate pressure will therefore have a larger effect. The apparent water vapor permeability remains constant at 50°C with an increase of sweep gas flow rate, which also indicates that concentration polarization at the permeate side of the membrane is negligible for the flow rates investigated. A stagnant boundary layer on the permeate side of the membrane probably affects the permeability at 80°C, which increases with an increase of permeate flow rate. The relative contribution of non-ideal mixing and the presence of stagnant boundary layers obviously are less pronounced for thicker polymeric films. An estimate of the contribution of these effects on the total permeability can be determined by plotting the overall resistance for various films versus their thickness. 2.4.2 Boundary layer resistance The resistance for permeation due to the presence of stagnant boundary layers and non-ideal permeate mixing can be determined by plotting overall resistance for mass transfer (1/kov) versus the film thickness.
Temperature p,feed p,permeate
[°C] [cmHg] [cmHg]
30 1.08 0.46
50 2.30 0.65
80 6.54 1.51
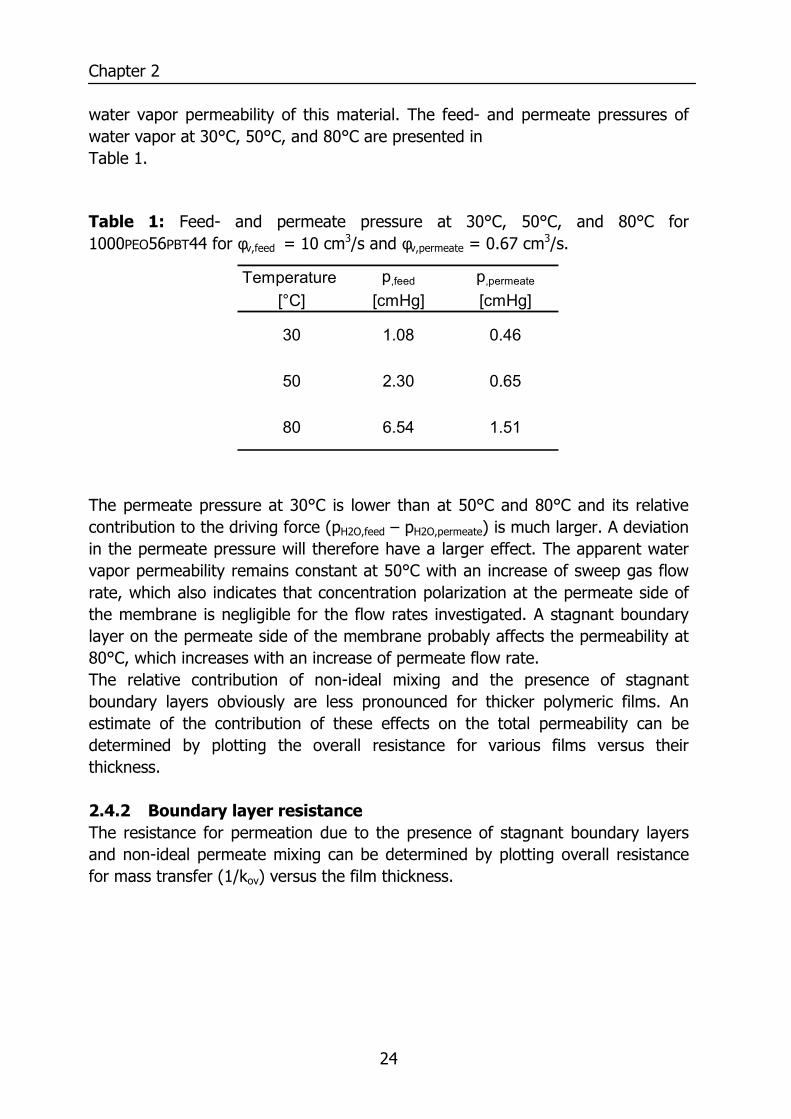
Measurement of Water Vapor and Gas Permeation through Polymers
25
Figure 8: Overall resistance towards mass transfer for various film thicknesses. (1000PEO56PBT44, activity 0.20, φv,feed 10 cm3/s, φv,permeate 0.67 cm3/s, pressure 3.5 bar, activity 0.34 and temperature 80°C). Figure 8 shows the overall mass transfer resistance for 1000PEO56PBT44 at 80°C versus the film thicknesses. The film thickness is varied and the overall resistance is determined at constant pressure, temperature, and feed- and permeate flow rates and increases with an increase of the polymeric film thickness. The abscissa represents the resistance in the boundary layers and comprises mainly of the resistance in the stagnant permeate boundary layer and non-ideal mixing. The resistance at the permeate side of the polymeric film can stem from resistance for diffusion in the support material (filter paper and porous metallic plate). The procedure in Figure 8 is repeated at 30°C, 50°C and 80°C to quantify the stagnant boundary layer resistance at different temperatures is. The results are summarized in Table 2.
0 50 100 150 200 250 300 3500
2000
4000
6000
8000
10000
12000
Ove
rall
resi
stan
ce [s
/m]
Thickness [µm]
1/kb
Chapter 2
26
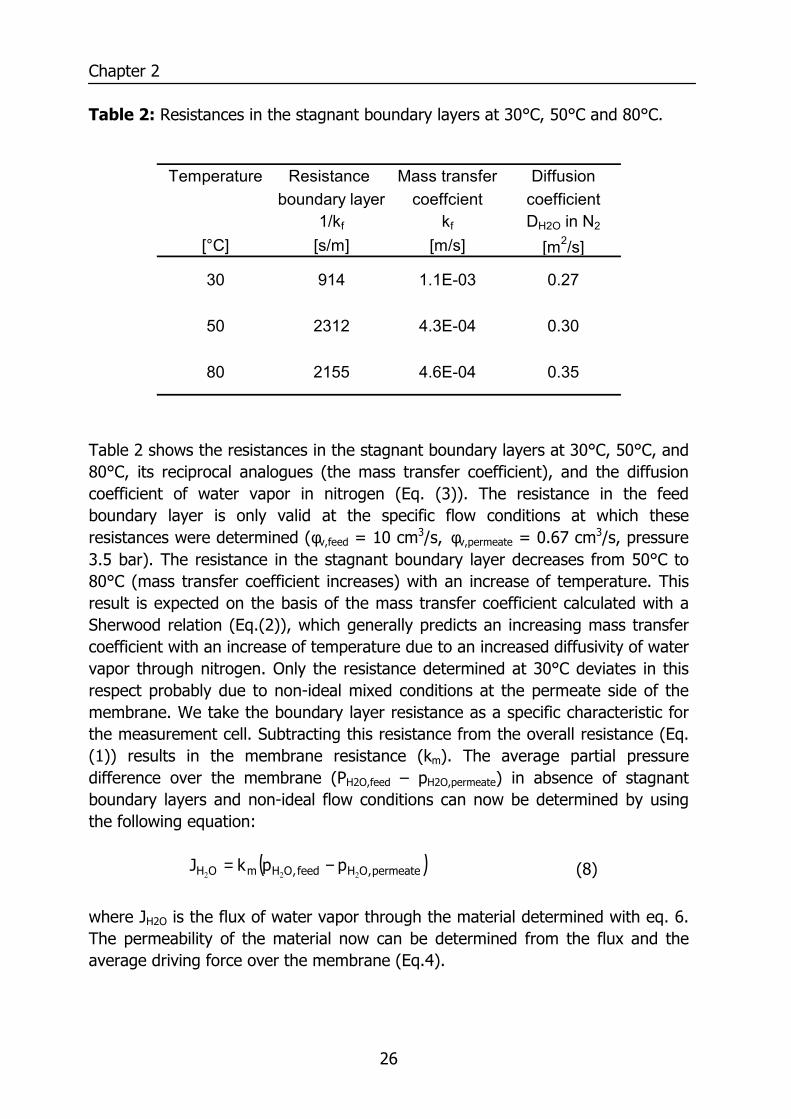
Table 2: Resistances in the stagnant boundary layers at 30°C, 50°C and 80°C.
Table 2 shows the resistances in the stagnant boundary layers at 30°C, 50°C, and 80°C, its reciprocal analogues (the mass transfer coefficient), and the diffusion coefficient of water vapor in nitrogen (Eq. (3)). The resistance in the feed boundary layer is only valid at the specific flow conditions at which these resistances were determined (φv,feed = 10 cm3/s, φv,permeate = 0.67 cm3/s, pressure 3.5 bar). The resistance in the stagnant boundary layer decreases from 50°C to 80°C (mass transfer coefficient increases) with an increase of temperature. This result is expected on the basis of the mass transfer coefficient calculated with a Sherwood relation (Eq.(2)), which generally predicts an increasing mass transfer coefficient with an increase of temperature due to an increased diffusivity of water vapor through nitrogen. Only the resistance determined at 30°C deviates in this respect probably due to non-ideal mixed conditions at the permeate side of the membrane. We take the boundary layer resistance as a specific characteristic for the measurement cell. Subtracting this resistance from the overall resistance (Eq. (1)) results in the membrane resistance (km). The average partial pressure difference over the membrane (PH2O,feed – pH2O,permeate) in absence of stagnant boundary layers and non-ideal flow conditions can now be determined by using the following equation:
( )permeate,OHfeed,OHmOH ppkJ222
−= (8)
where JH2O is the flux of water vapor through the material determined with eq. 6. The permeability of the material now can be determined from the flux and the average driving force over the membrane (Eq.4).
Temperature Resistance Mass transfer Diffusionboundary layer coeffcient coefficient
1/kf kf DH2O in N2
[°C] [s/m] [m/s] [m2/s]
30 914 1.1E-03 0.27
50 2312 4.3E-04 0.30
80 2155 4.6E-04 0.35
Measurement of Water Vapor and Gas Permeation through Polymers
27
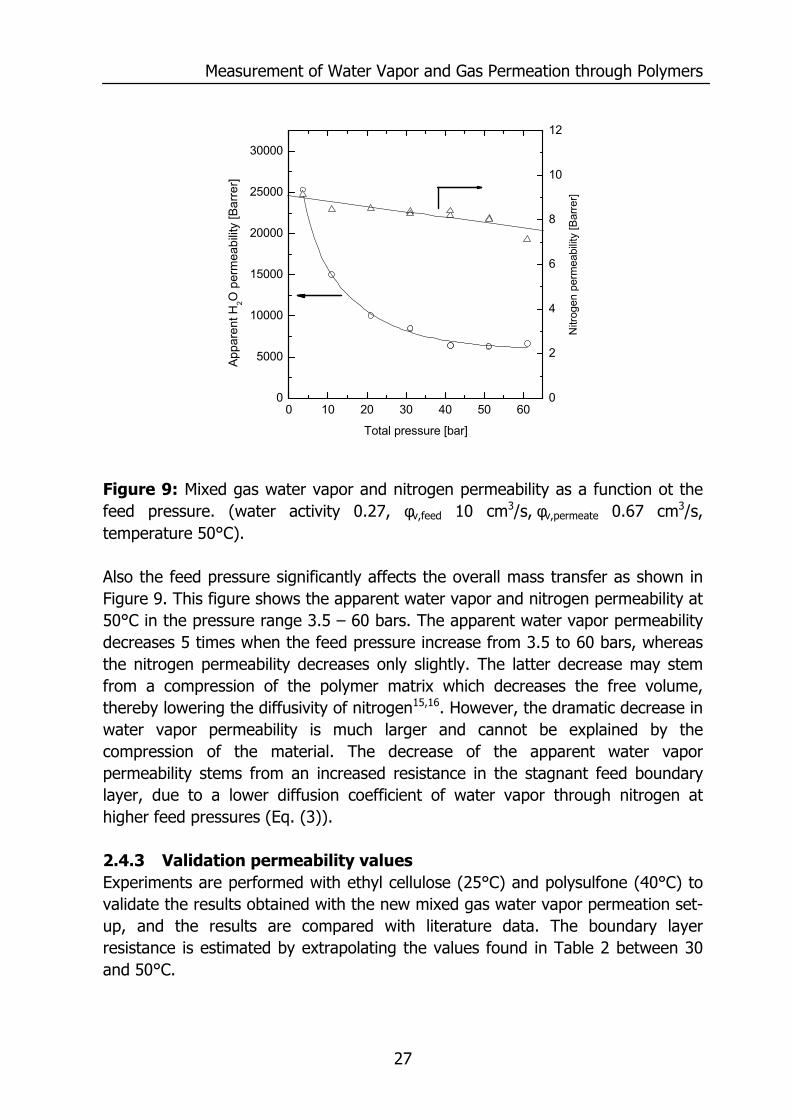
Figure 9: Mixed gas water vapor and nitrogen permeability as a function ot the feed pressure. (water activity 0.27, φv,feed 10 cm3/s, φv,permeate 0.67 cm3/s, temperature 50°C). Also the feed pressure significantly affects the overall mass transfer as shown in Figure 9. This figure shows the apparent water vapor and nitrogen permeability at 50°C in the pressure range 3.5 – 60 bars. The apparent water vapor permeability decreases 5 times when the feed pressure increase from 3.5 to 60 bars, whereas the nitrogen permeability decreases only slightly. The latter decrease may stem from a compression of the polymer matrix which decreases the free volume, thereby lowering the diffusivity of nitrogen15,16. However, the dramatic decrease in water vapor permeability is much larger and cannot be explained by the compression of the material. The decrease of the apparent water vapor permeability stems from an increased resistance in the stagnant feed boundary layer, due to a lower diffusion coefficient of water vapor through nitrogen at higher feed pressures (Eq. (3)). 2.4.3 Validation permeability values Experiments are performed with ethyl cellulose (25°C) and polysulfone (40°C) to validate the results obtained with the new mixed gas water vapor permeation set-up, and the results are compared with literature data. The boundary layer resistance is estimated by extrapolating the values found in Table 2 between 30 and 50°C.
0 10 20 30 40 50 600
5000
10000
15000
20000
25000
30000
Total pressure [bar]
Appa
rent
H2O
per
mea
bilit
y [B
arre
r]
0
2
4
6
8
10
12
Nitr
ogen
per
mea
bilit
y [B
arre
r]
Chapter 2
28
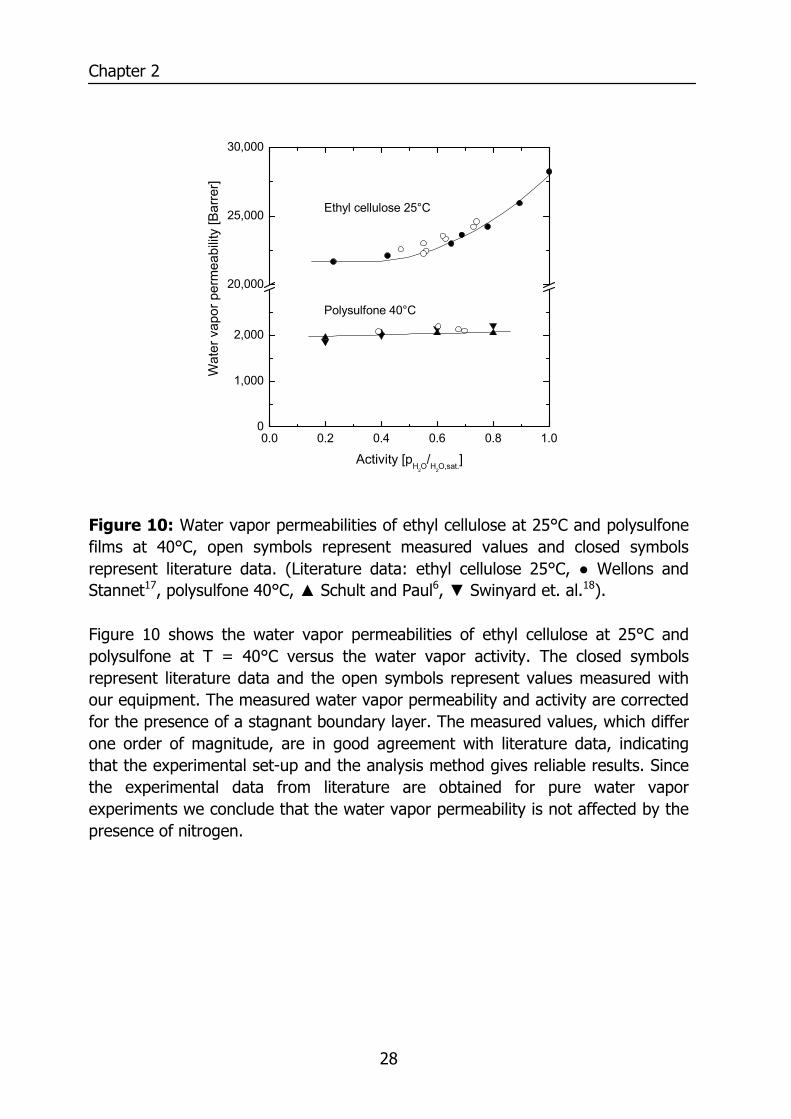
Figure 10: Water vapor permeabilities of ethyl cellulose at 25°C and polysulfone films at 40°C, open symbols represent measured values and closed symbols represent literature data. (Literature data: ethyl cellulose 25°C, ● Wellons and Stannet17, polysulfone 40°C, ▲ Schult and Paul6, ▼ Swinyard et. al.18). Figure 10 shows the water vapor permeabilities of ethyl cellulose at 25°C and polysulfone at T = 40°C versus the water vapor activity. The closed symbols represent literature data and the open symbols represent values measured with our equipment. The measured water vapor permeability and activity are corrected for the presence of a stagnant boundary layer. The measured values, which differ one order of magnitude, are in good agreement with literature data, indicating that the experimental set-up and the analysis method gives reliable results. Since the experimental data from literature are obtained for pure water vapor experiments we conclude that the water vapor permeability is not affected by the presence of nitrogen.
0.0 0.2 0.4 0.6 0.8 1.00
1,000
2,000
20,000
25,000
30,000
Polysulfone 40°C
Wat
er v
apor
per
mea
bilit
y [B
arre
r]
Activity [pH2O/H2O,sat.]
Ethyl cellulose 25°C
Measurement of Water Vapor and Gas Permeation through Polymers
29
The relative contribution of the correction term for the stagnant boundary layer (Table 2) to the overall resistance calculated for a film thickness of 100 µm amounts to 15 % for ethyl cellulose and 3 % for polysulfone at activity 0.5. Using thick films minimizes the influence of the stagnant boundary layer on the total permeability. This correction term has to be taken into account for polymers with a high water vapor permeability (>20.000 Barrer). 2.4.4 Highly permeable, highly selective materials PEO-PBT block copolymers are investigated for their water vapor permeability, since the PEO block shows a high solubility for water facilitating high water vapor permeability. The high solubility of the block copolymer stems from a high solubility of water vapor in the PEO block, PEO itself as a pure polymer is soluble in water 19. The addition of a PBT segment in the block copolymer makes the block copolymer insoluble in water, but enables a high solubility of water vapor in the PEO phase.
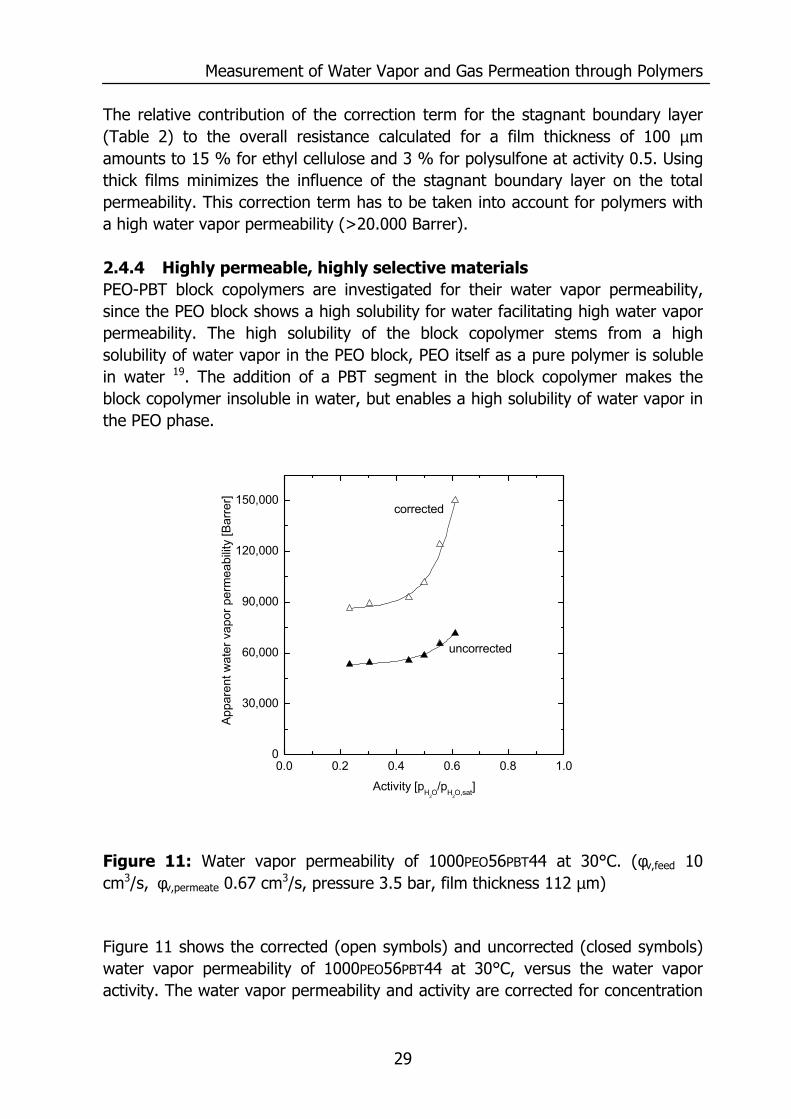
Figure 11: Water vapor permeability of 1000PEO56PBT44 at 30°C. (φv,feed 10 cm3/s, φv,permeate 0.67 cm3/s, pressure 3.5 bar, film thickness 112 µm)
Figure 11 shows the corrected (open symbols) and uncorrected (closed symbols) water vapor permeability of 1000PEO56PBT44 at 30°C, versus the water vapor activity. The water vapor permeability and activity are corrected for concentration
0.0 0.2 0.4 0.6 0.8 1.00
30,000
60,000
90,000
120,000
150,000
uncorrected
Appa
rent
wat
er v
apor
per
mea
bilit
y [B
arre
r]
Activity [pH2O/pH2O,sat]
corrected
Chapter 2
30
polarization. The water vapor permeability at 30°C increases with an increase in activity stemming from a higher solubility of water vapor at higher activities. The relative contribution of the correction term for the stagnant boundary layer to the overall resistance calculated for a film thickness of 100 µm is 45 %, which is much higher than for ethyl cellulose and polysulfone due to the higher water vapor permeability of 1000PEO56PBT44. The nitrogen permeability remained constant over the whole activity range and is 1.7 Barrer, which results in a high selectivity of 50,600, compared to other polymers20. The selectivity and permeability of 1000PEO56PBT44 classifies the material as highly permeable and selective. 2.5 Conclusions The selectivity and permeability of 1000PEO56PBT44 are relatively high compared to other polymers. However, the measured permeabilities are affected significantly by the presence of a stagnant boundary layer. This resistance is determined by plotting the overall mass transfer coefficient versus the film thickness. The water vapor permeability of ethyl cellulose and polysulfone are corrected for this resistance and identical to literature values. The water vapor permeability and selectivity of 1000PEO56PBT44 block copolymers are high (86,000 Barrer and H2O/N2 selectivity 50,600) compared to other polymers and the permeability increases significantly with the water vapor activity of the feed gas mixture, whereas the nitrogen permeability remains constant. The water vapor permeability shows a strong dependence on the total pressure. An increase of the total pressure results in a larger resistance in the stagnant feed boundary layer, thereby lowering the total water vapor flux. The relative contribution of the resistance of the stagnant boundary layer is larger for materials with a higher permeability due to the lower resistance for permeation in these materials. 2.6 Acknowledgements The European Union is kindly acknowledged for supporting this project: Brite Euram III, Contract no. BRPR-CT 98-0804
Measurement of Water Vapor and Gas Permeation through Polymers
31
2.7 References (1) Baker, R. W. Ind. Eng. Chem. Res. 2002, 41, 1393-1411. (2) Wang, K. L.; McCray, S. H.; Newbold, D. D.; Cussler, E. L. J. Membr. Sci.
1992, 72, 231-244. (3) Gebben, B. J. Membr. Sci. 1996, 113, 323-329. (4) Stroeks, A. Polymer 2001, 42, 9903-9908. (5) Park, G. S. Synthetic membranes: science, engineering and applications;
Reidel: Dordrecht, 1986. (6) Schult, K. A.; Paul, D. R. J. Appl. Polym. Sci. 1996, 61, 1865-1876. (7) Cha, J. S.; Malik, V.; Bhaumik, D.; Li, R.; Sirkar, K. K. J. Membr. Sci.
1997, 128, 195-211. (8) Yeom, C. K.; Lee, S. H.; Song, H. Y.; Lee, J. M. J. Membr. Sci. 2002,
205, 155-174. (9) Ludtke, O.; Behling, R. D.; Ohlrogge, K. J. Membr. Sci. 1998, 146, 145-
157. (10) Dixon-Garrett, S. V.; Nagai, K.; Freeman, B. D. J. Polym. Sci., Polym.
Phys. Ed. 2000, 38, 1078-1089. (11) Baker, R. W.; Wijmans, J. G.; Athayde, A. L.; Daniels, R.; Ly, J. H.; Le,
M. J. Membr. Sci 1997, 137, 159-172. (12) Gabelman, A.; Hwang, S. T. J. Membr. Sci. 1999, 159, 61-106. (13) Massman, W. J. Atmos. Environ. 1998, 32, 1111-1127. (14) Poling, B. E.; Prausnitz, J. M.; O'Connell, J. P. The properties of gases
and liquids; McGraw-Hill: New York, 2001. (15) Merkel, T. C.; Bondar, V. I.; Nagai, K.; Freeman, B. D.; Pinnau, I. J.
Polym. Sci., Polym. Phys. Ed. 2000, 38, 415-434. (16) Koros, W. J.; Hellums, M. W. In Encyclopedia of polymer science and
engineering; Kroschwitz, J. I., Ed.; Wiley: New York, 1990; pp 724-802. (17) Wellons, J. D.; Stannett, V. J. Polym. Sci. 1966, 4, 593-602. (18) Swinyard, B. T.; Sagoo, P. S.; Barrie, J. A.; Ash, R. J. Appl. Polym. Sci.
1990, 41, 2479-2485. (19) Brandrup, J.; Immergut, E. H.; Abe, A.; Bloch, D. R. Polymer handbook,
4 th ed.; Wiley: New York, 1999. (20) Barrie, J. A. In Diffusion in Polymers; Crank, J.; Park, G. S., Eds.;
Academic Press, 1968.

32
33
Chapter 3
Performance of Polyethersulfone/Polyimide Hollow
Fiber Membranes in the Separation of Wet CO2/N2 Gaseous Mixtures
Abstract This work presents the permeation properties of PES/PI 80/20 asymmetric hollow
fiber membranes in the separation of humidified N2, CO2 and a binary mixture of
CO2/N2 55/45%. The permeance values of CO2, N2 and water vapor were
measured by using the variable volume-sweep gas method at various water vapor
activities, feed pressures, feed- and permeate flow rates. Increasing feed water
vapor activity reduces H2O, N2 and CO2 permeance values and H2O/N2 and
H2O/CO2 selectivity, whereas CO2/N2 selectivity remains constant. The observed
reduction in permeance could not be attributed to pore condensation in the
porous substructure, since sorption isotherms of a dense PES/PI film and hollow
fiber membrane showed the same solubility for water vapor. An increase of the
total pressure at constant water vapor activity resulted in a reduction of the water
vapor permeance due to a higher diffusivity of water vapor in the stagnant
boundary layer on the feed side of the membrane. The nitrogen permeance
remained constant with an increase of total pressure whereas the carbon dioxide
permeance increased due to plasticization of the membrane. The resistances to
mass transport for water vapor were studied at various feed- and permeate flow
rates, enabling the derivation of Sherwood relations, which describe the variation
of the overall mass transfer coefficient at various process conditions. This analysis
of mass transfer reveals that the main resistance for water vapor transport is
situated in the stagnant feed boundary layer. This main resistance shifts to the
membrane at higher feed flow rates.
Chapter 3
34
3.1 Introduction
Asymmetric hollow fiber membranes are used in gas separation applications
because they combine a high selectivity (material property) with a high gas flux
(membrane property). This high flux is achieved by an ultra-thin dense skin layer
supported by a sponge-like substructure. Generally, the main resistance for gas
transport is situated in the skin layer and its permeability as well as its thickness
controls the flux through the membrane. This dense skin layer performs the actual
selective separation of the gas mixture. The sponge-like support membrane is
frequently assumed to have a negligible mass transport resistance.
Recently, high flux poly(ethersulfone)-poly(imide) 80/20 wt% (PES-PI) blend
hollow fiber membranes were developed in our group1,2. These membranes
consist of an ultra thin skin layer with a thickness of 0.1 µm, with a CO2/N2
selectivity higher than existing commercial gas separation membranes2.
Numerous papers are devoted to the performance of dense flat polymeric films in
pure gases. However, in real gas separation applications hollow fiber membranes
are used for the separation of gas mixtures. Very little data are disclosed today in
scientific literature, describing the mass transport behavior of such membranes in
multi-component mixtures. The PES-PI membranes are already characterized for
dry CO2/N2 gas mixture2 and this contribution extends the study towards
humidified feed gas mixtures.
In particular, we present and interpret separation performance data at different
operating conditions (humidity, feed pressure, flow rate). Furthermore, we study
the mass transfer resistance for water vapor in boundary layers and relate the
mass transfer coefficient to the operating conditions via Sherwood relations.
Performance of PES/PI Hollow Fiber Membranes in Wet Gaseous Mixtures
35
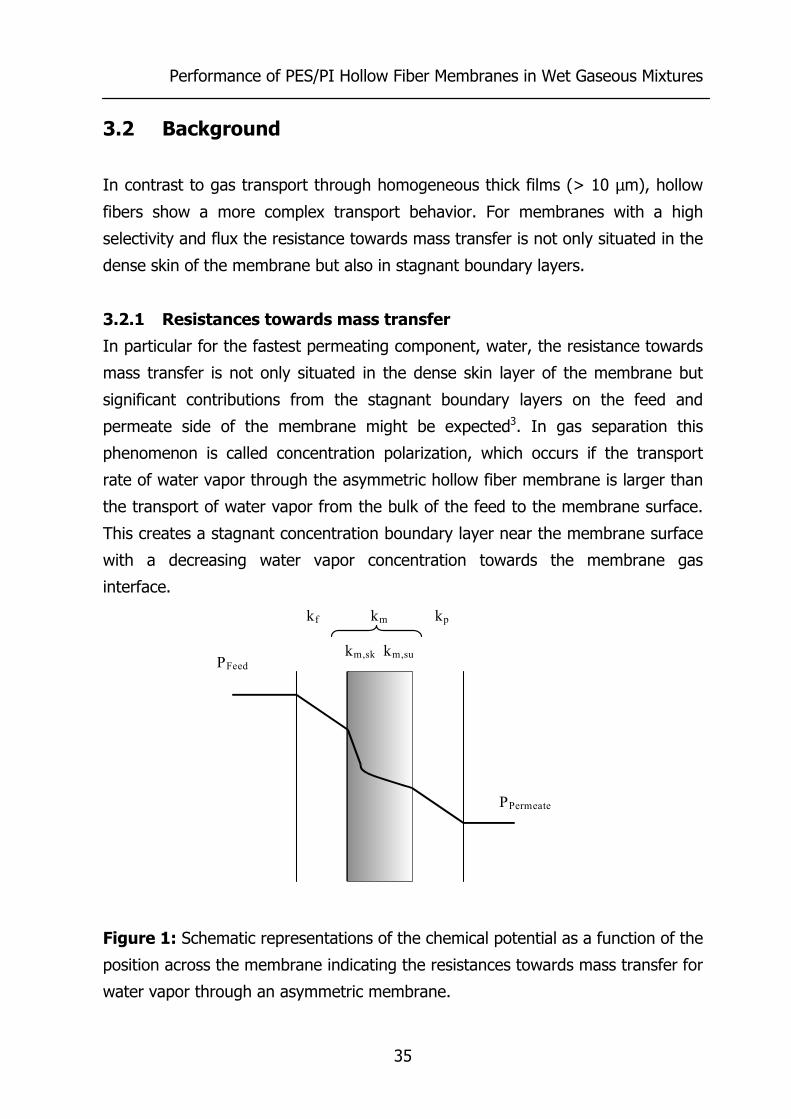
3.2 Background
In contrast to gas transport through homogeneous thick films (> 10 µm), hollow
fibers show a more complex transport behavior. For membranes with a high
selectivity and flux the resistance towards mass transfer is not only situated in the
dense skin of the membrane but also in stagnant boundary layers.
3.2.1 Resistances towards mass transfer
In particular for the fastest permeating component, water, the resistance towards
mass transfer is not only situated in the dense skin layer of the membrane but
significant contributions from the stagnant boundary layers on the feed and
permeate side of the membrane might be expected3. In gas separation this
phenomenon is called concentration polarization, which occurs if the transport
rate of water vapor through the asymmetric hollow fiber membrane is larger than
the transport of water vapor from the bulk of the feed to the membrane surface.
This creates a stagnant concentration boundary layer near the membrane surface
with a decreasing water vapor concentration towards the membrane gas
interface.
Figure 1: Schematic representations of the chemical potential as a function of the
position across the membrane indicating the resistances towards mass transfer for
water vapor through an asymmetric membrane.
kf kp km
PFeed
PPermeate
km,sk km,su
Chapter 3
36
Figure 1 shows schematically the gradient of the chemical potential µ of water
stemming from resistances towards mass transfer for water vapor through an
asymmetric membrane, with kf being the mass transfer coefficient through the
stagnant boundary layer at the feed side of the membrane, km,sk the mass transfer
coefficient of the membrane in the skin, km,su the mass transfer coefficient of the
membrane in the porous support, and kp the mass transfer coefficient of water
vapor trough the stagnant boundary layer at the permeate side of the membrane.
The concentration of water vapor at the interface of the membrane is lower than
in the bulk of the feed due to the flux imbalance: water vapor permeates to faster
through the polymer than diffusive transport from the bulk of the feed to the
surface of the membrane. This would result in a higher surface concentration of
the other permeating component. However, this effect is negligible for water
vapor in N2 and CO2 since the water vapor pressure is relatively small compared to
the total pressure (pH2O = 31.70 mbar at 25°C compared to 2 - 5 bar total
pressure).
Water vapor permeates through the dense skin of the asymmetric membrane,
which establishes the selective separation of water vapor. This resistance is
relatively low for water vapor compared to the other gases (N2, CO2).
Polyethersulfone e.g. has a water permeability of 2200 Barrer4 while the CO2
permeability is only 3.4 Barrer5. However, the porous support may contribute
considerably to the overall transport resistance for water vapor6,7.
The overall resistance for water vapor transport (kov) can be expressed in the
following equation:
ipmofoov dkkdkdk1111 ++=
(1)
where do is the external hollow fiber diameter, and di the internal hollow fiber
diameter. The overall mass transfer resistance (kov), is defined with respect to the
external hollow fiber diameter.
Performance of PES/PI Hollow Fiber Membranes in Wet Gaseous Mixtures
37
The mass transfer coefficients of the stagnant feed and permeate boundary layers
(kf, kp) are given by the geometry of the membrane module and the
hydrodynamic conditions. These mass transfer coefficients are often correlated
with Sherwood relations describing these coefficients in a specific system:
d
hcb
Ld
ScReaSh
=
(2)
where a, b, c and d are constants specific for the system, dh the hydraulic
diameter and L the length of the flow path.
A specific Sherwood relation for the resistance in the stagnant feed and permeate
boundary layer can be obtained via the so-called Wilson plot by plotting (1/kov)
versus (1/vb)8,9 where v is the velocity on the feed or permeate side of the
membrane. The abscissa of this plot represents the resistance in the membrane
and the stagnant permeate boundary layer, and the slope equals b in Eq. (2).
A number of Sherwood relations are available, which describe the mass transfer
coefficient on the shell side of a hollow fiber membrane8. Due to the complex flow
distributions around the shell side of the hollow fibers these equations are only
valid for systems with identical geometry and flow distribution. An example of an
equation which correlates this coefficient is the one found by Prasad and Sirkar9
for liquid-liquid extraction with membranes:
( )Ld
ScReφ1βSh h0.330.60−=
(3)
where ϕ is the packing fraction of hollow fibers in a module, and β a specific
constant which is found to be 5.8 for hydrophobic membranes and 6.1 for
hydrophilic membranes9.
By combining eq. 2 and 3 the mass transfer coefficient becomes:
( )h
h..
h
dD
Ld
Dvd
k
ρη
η
ρϕ−β=330600
1
(4)
Chapter 3
38
where ρ is the density (kg/m3), η the viscosity (Pa s), v the velocity of the gas
mixture (m/s), and D the diffusion coefficient of water vapor (m2/s).
For the determination of the mass transfer coefficient in our system we use the
density and viscosity of the pure N2, CO2 and He10, since the amount of water
vapor in the feed is very small (< 2 vol. %). The diffusion coefficients of water
vapor in N2, CO2 and He can be estimated by using the approach of Fuller11:
( ) ( ) ( )( )2313121
7510014302
/B
/A
/B,A
.
s/cmB,AMp
T.D
νν Σ+Σ=
(5)
where D is the diffusion coefficient of water vapor in carbon dioxide or helium
(cm2/s), T the absolute temperature (K), P the pressure (bar), and Σν the sum of
atomic diffusion volumes, which can be found in literature11. Eq. (6) is used to
calculate the molecular weight (Mab):
1
112−
+=
BAAB MM
M
(6)
where MA and MB are the molecular weight of both components (g/mol).
The diffusion coefficient of water vapor in nitrogen at various pressures and
temperatures needed for the calculation can be estimated with the following
empirical relation derived by Massman12:
811
0
00
.
TT
pp
DD
=
(7)
where D is the diffusion coefficient of water in nitrogen (cm2/s), D0 the diffusion
coefficient of water in nitrogen at 1 bar and 273 K (0.2190 cm2/s), p0 = 1.013 bar,
p the pressure (bar), T the absolute temperature (K) and T0 = 273.15 K.
Performance of PES/PI Hollow Fiber Membranes in Wet Gaseous Mixtures
39
The mass transfer coefficient for the tube side of a hollow fiber can satisfactorily
be described with the Lévêque equation (8), since a defined flow pattern exists at
the tube side of a hollow fiber 7-9.
0.33
h
Ld
ScRe1.62Sh
=
(8)
The membrane resistance is calculated with Eq. (1) if the feed and permeate
mass transfer coefficients are known. The membrane resistance for water vapor
(1/km) depends on the thickness and material of the skin layer, and the structure
of the porous support. First, the overall mass transfer coefficient has to be
determined experimentally from the flux of water vapor through the membrane
(JH2O):
( )permeate,OHfeed,OHovOH cckJ
222−=
(9)
where CH2O,feed and CH2O,permeate (mol/m3) are the concentrations of water vapor on
the feed and permeate side of the membrane. Below, the contributions of the
different resistances to the overall resistance are quantified. Unraveling their
magnitude allows to develop a molecular picture for the permeation of ternary gas
mixtures through the skin of the asymmetric membrane.
3.3 Experimental
3.3.1 Materials
PES/PI 80/20 hollow fibers were spun by using the dry-wet phase inversion
process as described elswhere1. Polyimide, Matrimid 5218, was purchased from
Ciba-Geigy while polyethersulfone, Sumikaexcel, was kindly supplied by
Sumitomo. The total polymer concentration in the solution was 35wt%. N-methyl-
2-pyrrolidone (NMP, 99%, Acros) was used as the polymer solvent and NMP/H2O
(80/20 wt%) mixture as the internal coagulant. Finally, polydimethylsiloxane
(PDMS), (Sylgard-184, DOW Corning Corp), was used to plug any defects existing
on the surface of the hollow fibers. N-hexane was the solvent for Sylgard-184.
Chapter 3
40
Gases used are CO2, N2, and He, from Hoekloos b.v. (the Netherlands) and had a
purity greater than 99.9%. The CO2/N2 mixture (55/45%) mixture was obtained
from Praxair n.v. Belgium. For the calibration of the gas chromatograph a He/N2
mixture containing 2500 ppm N2, and a He/CO2 mixture containing 1000 ppm CO2
were used and delivered by Praxair n.v. (Belgium).
3.3.2 Module preparation and post treatment
About 5 PES/PI 80/20 hollow fibers, 15 cm long, were potted into 3/8” stainless
steel holders by using a regular epoxy resin. In order to heal surface defects, the
hollow fiber bundle was immersed for 5 minutes in a solution of 3 wt% PDMS in
N-hexane and cured in an oven for 4h at 65°C. Then, the coated fibers were
placed inside a stainless steel module housing, leaving the fiber mouth open at
both ends.
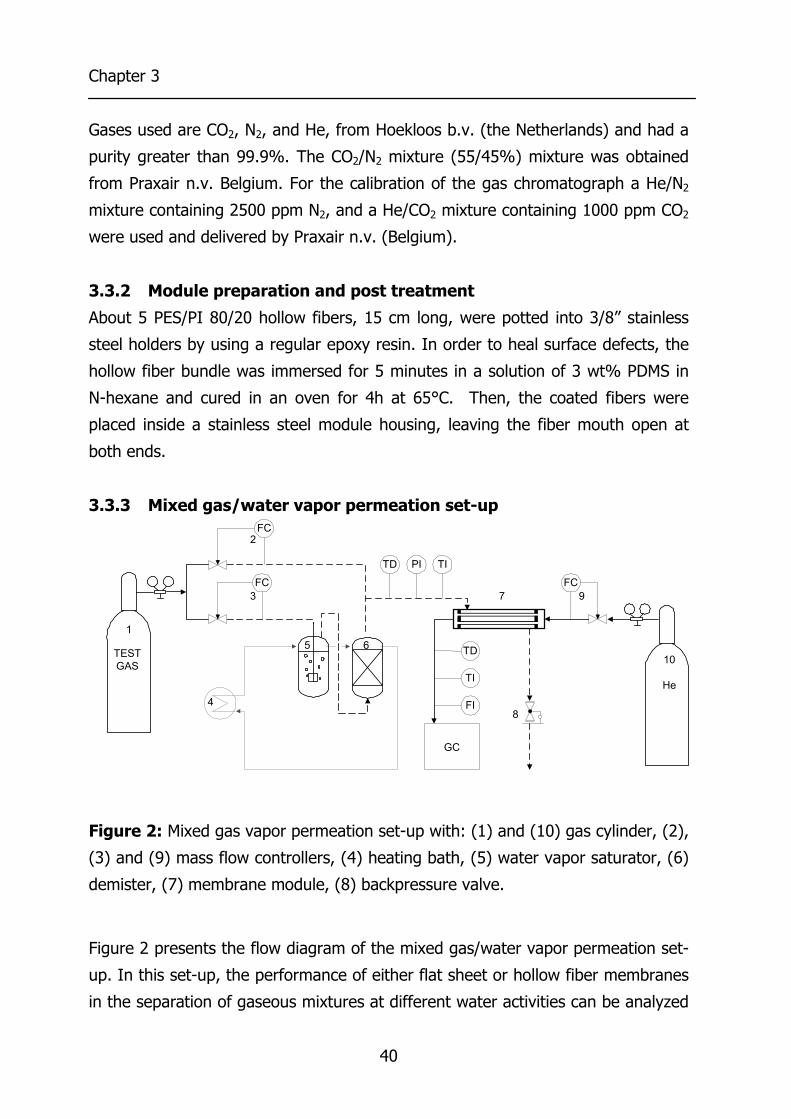
3.3.3 Mixed gas/water vapor permeation set-up
Figure 2: Mixed gas vapor permeation set-up with: (1) and (10) gas cylinder, (2),
(3) and (9) mass flow controllers, (4) heating bath, (5) water vapor saturator, (6)
demister, (7) membrane module, (8) backpressure valve.
Figure 2 presents the flow diagram of the mixed gas/water vapor permeation set-
up. In this set-up, the performance of either flat sheet or hollow fiber membranes
in the separation of gaseous mixtures at different water activities can be analyzed
PITD TI
TESTGAS
FC
FC
FC
TD
TI
FI
GC
1
2
3
5 6
7
84
9
10
He
Performance of PES/PI Hollow Fiber Membranes in Wet Gaseous Mixtures
41
as a function of various process parameters (pressure, temperature, feed flow
rate). At first, the pure gas or the gaseous mixture stream is saturated in a
column filled with water (5), while the entrained liquid droplets are separated in
the demister (6). The temperature of both the saturator and the demister is
controlled by means of a heating bath (4). Then, the water-saturated stream is
mixed with a dry gas stream. The water vapor concentration in the feed stream is
controlled by adjusting the flow rates of the two streams, using mass flow
controllers (2) and (3), (Brooks 0154). The exact water vapor concentration is
measured with a dew-pointing meter, (TD, -Michell Instruments Dewmet SD), the
total pressure by a digital pressure indicator (PI, Druck PTX 1400), and the
temperature by a thermocouple (TI). The feed stream is directed to the shell side
of the hollow fiber module (7), where part of the stream permeates through the
membrane. The residue stream leaves the system via a back pressure regulator,
which controls the pressure in the system. On the bore side of the hollow fibers,
helium is used as a sweep gas to remove the permeating components. A mass
flow controller (Brooks 0154) (9) controls the flow rate of the sweep gas. The
pressure of the permeate side is maintained at atmospheric level, while the
following parameters are analyzed: a) temperature (TI, thermocouple), b) water
vapor concentration (TD, dew-pointing meter, Michell Instruments Dewmet SD),
c) flow rate (FI, soap bubble meter) and d) the gas concentration by using a gas
chromatograph unit (GS, Varian 3400, column: Porapack Q). The gas composition
is analyzed with a thermo conductive detector (TCD), which is calibrated with
different He/N2, and He/CO2 mixtures.
3.3.4 Determination of the transport rates
The performance of a PES/PI 80/20 hollow fiber bundle is tested in the mixed
gas/water vapor permeation set-up described in section 3.2. The total molar flow
of the water vapor permeating through the hollow fiber bundle (φn,H2O) can be
calculated by using Eq. (10)
RT
γp OHtot.v,OHn,
2
2
φ=φ
(10)
Chapter 3
42
where φn,H2O is the total mole flow of water vapor (mol/s), γ the activity coefficient
correcting for the non ideality of the gas (-), T the temperature (K) and R the gas
constant (8.314 J/(mol K). The total permeate flow rate (φv,tot) is measured by the
soap bubble meter, while the vapor pressure (pH2O) of water in the permeate is
calculated from the measured dew point temperature using the Antoine
equation11:
( )233.426T
1730.639.19621plog
dewoH2 +
−= (11)
where pH2O is the water vapor pressure (kPa) and Tdew the dew point temperature
(°C).
The permeate stream consists mainly of the sweep gas, which is helium at 1 bar.
Hence the water vapor permeance is determined by using Eq. (12):
ln
mOHn,
∆pA
V
lP 2
φ=
(12)
where Vm is equal to 22,414 cm3 (molar volume of 1 mole gas at 1 atm and 0°C),
P/l the thickness normalized permeability, which is given in Gas Permeation Units,
GPU (1 GPU = 10-6 cm3 (STP) cm-2s-1 cmHg-1), and A the total membrane area
(cm2) which depends on the number and the geometrical characteristics of the
hollow fibers inside the module. ∆pln is an average driving force of water vapor for
counter-current operation and can be calculated by using the following logarithmic
formula:
( )
( )( )
−−
−−−=
inp,r
outp,f
inp,routp,fln
pppp
ln
)p(ppp∆p
(13)
where pf and pr are the water vapor pressure entering and leaving the module
respectively, pp,out the water vapor pressure in the sweep gas leaving the module,
and pp,in the water vapor pressure of the sweep gas (He) entering the module,
Performance of PES/PI Hollow Fiber Membranes in Wet Gaseous Mixtures
43
which equals zero (pp,in=0). The water vapor pressure on the residue side (pr) is
calculated by a mass balances over the module.
Similarly, the permeance value of a gas component is determined by analyzing its
concentration in the permeate stream and by measuring the total permeate flow
rate (φv,tot). Therefore, the flow rate of the permeating gas throughout the hollow
fiber membrane is:
gastot.v,gasv, x⋅φ=φ
(14)
where xgas is the fraction of gas present in the sweep gas leaving the module (-)
determined by the gas chromatograph. The gas permeance value is:
( )pfgas,v ppAl
P −φ
=
(15)
where pf is the partial pressure of gas in the feed (cmHg) and pp the respective
value in the permeate stream (cmHg). For the aforementioned calculations only
steady state gas and water vapor concentrations are taken into account. This
means that the measured values are constant for a time period of half an hour, at
least.
3.3.5 Sorption experiments
Water vapor sorption experiments were performed with a sorption set-up
containing a microbalance described in detail elsewhere13,14. The sample is
contacted with a N2 stream containing water vapor. Mixing a dry N2 stream with a
water vapor saturated stream generates this stream. The concentration of water
vapor is adjusted by changing the flow rates of both streams. This stream is sent
to a microbalance where the polymeric sample is mounted in a microbalance. The
whole set-up is temperature controlled.
Chapter 3
44
3.4 Results and Discussion
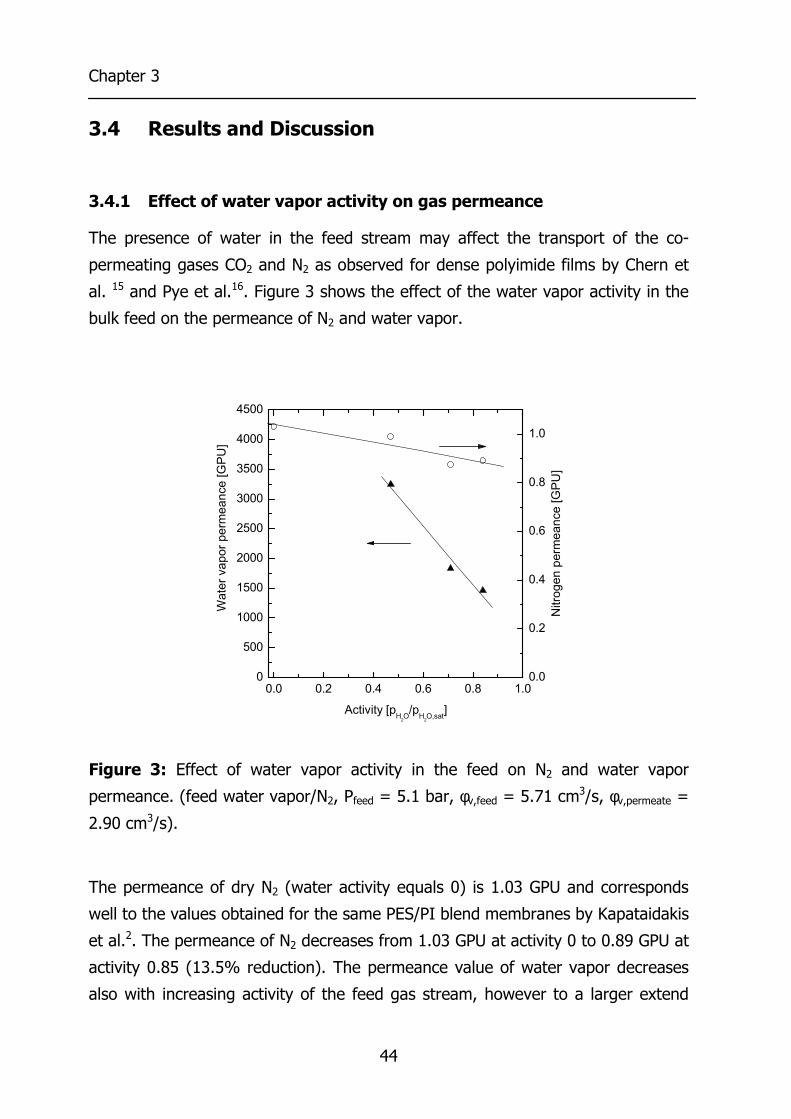
3.4.1 Effect of water vapor activity on gas permeance
The presence of water in the feed stream may affect the transport of the co-
permeating gases CO2 and N2 as observed for dense polyimide films by Chern et
al. 15 and Pye et al.16. Figure 3 shows the effect of the water vapor activity in the
bulk feed on the permeance of N2 and water vapor.
0.0 0.2 0.4 0.6 0.8 1.00
500
1000
1500
2000
2500
3000
3500
4000
4500
Activity [pH2O/pH2O,sat]
Wat
er v
apor
per
mea
nce
[GPU
]
0.0
0.2
0.4
0.6
0.8
1.0
Nitr
ogen
per
mea
nce
[GPU
]
Figure 3: Effect of water vapor activity in the feed on N2 and water vapor
permeance. (feed water vapor/N2, Pfeed = 5.1 bar, φv,feed = 5.71 cm3/s, φv,permeate =
2.90 cm3/s).
The permeance of dry N2 (water activity equals 0) is 1.03 GPU and corresponds
well to the values obtained for the same PES/PI blend membranes by Kapataidakis
et al.2. The permeance of N2 decreases from 1.03 GPU at activity 0 to 0.89 GPU at
activity 0.85 (13.5% reduction). The permeance value of water vapor decreases
also with increasing activity of the feed gas stream, however to a larger extend
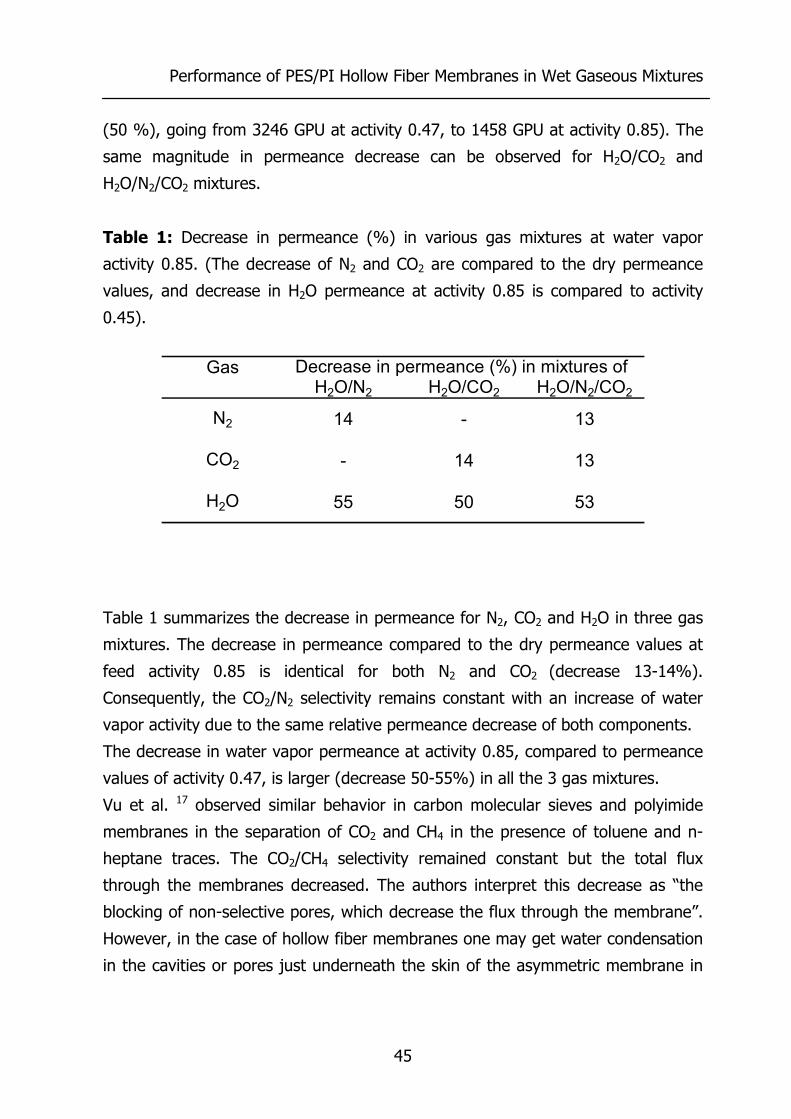
Performance of PES/PI Hollow Fiber Membranes in Wet Gaseous Mixtures
45
(50 %), going from 3246 GPU at activity 0.47, to 1458 GPU at activity 0.85). The
same magnitude in permeance decrease can be observed for H2O/CO2 and
H2O/N2/CO2 mixtures.
Table 1: Decrease in permeance (%) in various gas mixtures at water vapor
activity 0.85. (The decrease of N2 and CO2 are compared to the dry permeance
values, and decrease in H2O permeance at activity 0.85 is compared to activity
0.45).
Table 1 summarizes the decrease in permeance for N2, CO2 and H2O in three gas
mixtures. The decrease in permeance compared to the dry permeance values at
feed activity 0.85 is identical for both N2 and CO2 (decrease 13-14%).
Consequently, the CO2/N2 selectivity remains constant with an increase of water
vapor activity due to the same relative permeance decrease of both components.
The decrease in water vapor permeance at activity 0.85, compared to permeance
values of activity 0.47, is larger (decrease 50-55%) in all the 3 gas mixtures.
Vu et al. 17 observed similar behavior in carbon molecular sieves and polyimide
membranes in the separation of CO2 and CH4 in the presence of toluene and n-
heptane traces. The CO2/CH4 selectivity remained constant but the total flux
through the membranes decreased. The authors interpret this decrease as “the
blocking of non-selective pores, which decrease the flux through the membrane”.
However, in the case of hollow fiber membranes one may get water condensation
in the cavities or pores just underneath the skin of the asymmetric membrane in
GasH2O/N2 H2O/CO2 H2O/N2/CO2
N2 14 - 13
CO2 - 14 13
H2O 55 50 53
Decrease in permeance (%) in mixtures of
Chapter 3
46
the support structure. This increases the transport resistance through the
asymmetric membranes, while the selectivity remains unaffected.
Sorption experiments were performed on asymmetric hollow fibers and dense flat
sheet membranes at various water vapor activities to check whether pore
condensation in asymmetric membranes occurred.
Figure 4: Sorption isotherms of water vapor at 25°C for a PES/PI film (▲) and an
asymmetric PES/PI hollow fiber (○).
Figure 4 shows the sorption isotherm of water vapor for a dense PES/PI 80/20
film and a PES/PI 80/20 asymmetric hollow fiber. The solubility of water vapor in
the PES/PI film and the PES/PI asymmetric hollow fiber increases to the same
extent with an increase of water vapor activity. If pore condensation would occur
than the values of the asymmetric hollow fiber are believed to show a higher
increase than the dense film. Therefore we conclude that pore condensation does
not occur for the hollow fibers tested.
A decrease in gas permeance in the presence of water vapor has also been
observed for dense glassy polyimide films by Chern et al.15 and Pye et al.16. They
0.0 0.2 0.4 0.6 0.8 1.00
2
4
6
8
10
12
14 PES/PI (80/20) film PES/PI (80/20) asymmetric membrane
Wei
ght i
ncre
ase
[%]
Activity [pH2O/pH2O,SAT]
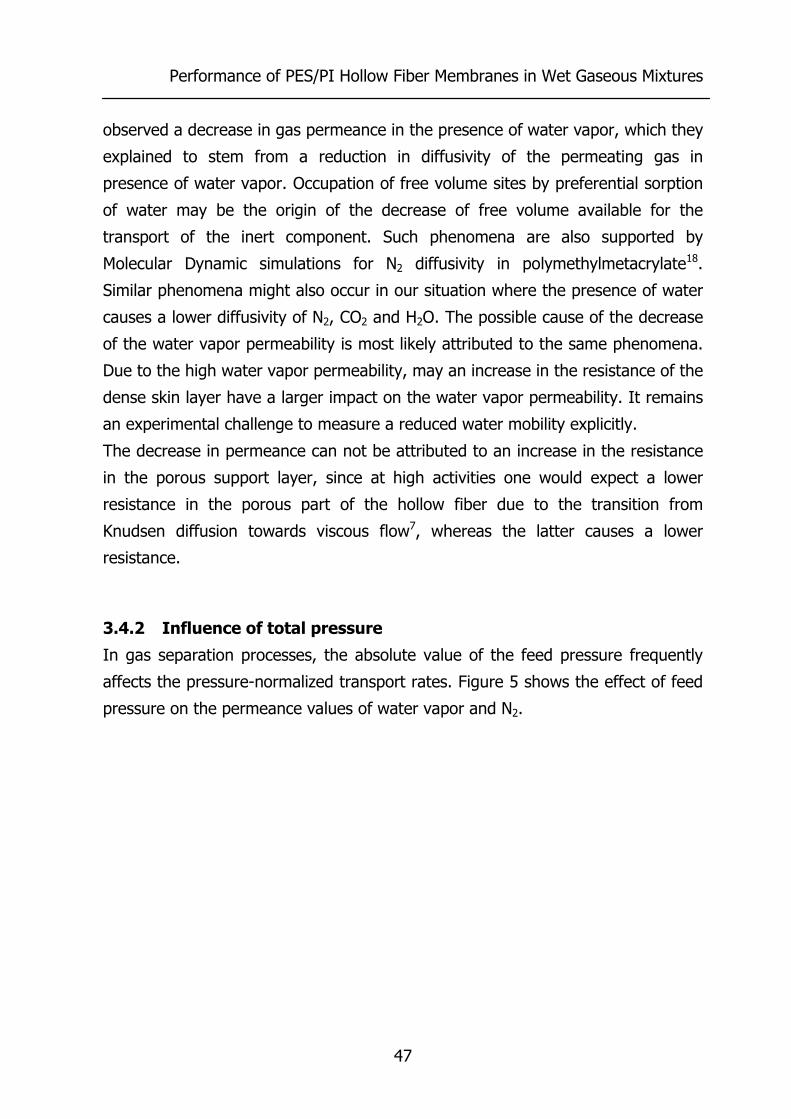
Performance of PES/PI Hollow Fiber Membranes in Wet Gaseous Mixtures
47
observed a decrease in gas permeance in the presence of water vapor, which they
explained to stem from a reduction in diffusivity of the permeating gas in
presence of water vapor. Occupation of free volume sites by preferential sorption
of water may be the origin of the decrease of free volume available for the
transport of the inert component. Such phenomena are also supported by
Molecular Dynamic simulations for N2 diffusivity in polymethylmetacrylate18.
Similar phenomena might also occur in our situation where the presence of water
causes a lower diffusivity of N2, CO2 and H2O. The possible cause of the decrease
of the water vapor permeability is most likely attributed to the same phenomena.
Due to the high water vapor permeability, may an increase in the resistance of the
dense skin layer have a larger impact on the water vapor permeability. It remains
an experimental challenge to measure a reduced water mobility explicitly.
The decrease in permeance can not be attributed to an increase in the resistance
in the porous support layer, since at high activities one would expect a lower
resistance in the porous part of the hollow fiber due to the transition from
Knudsen diffusion towards viscous flow7, whereas the latter causes a lower
resistance.
3.4.2 Influence of total pressure
In gas separation processes, the absolute value of the feed pressure frequently
affects the pressure-normalized transport rates. Figure 5 shows the effect of feed
pressure on the permeance values of water vapor and N2.
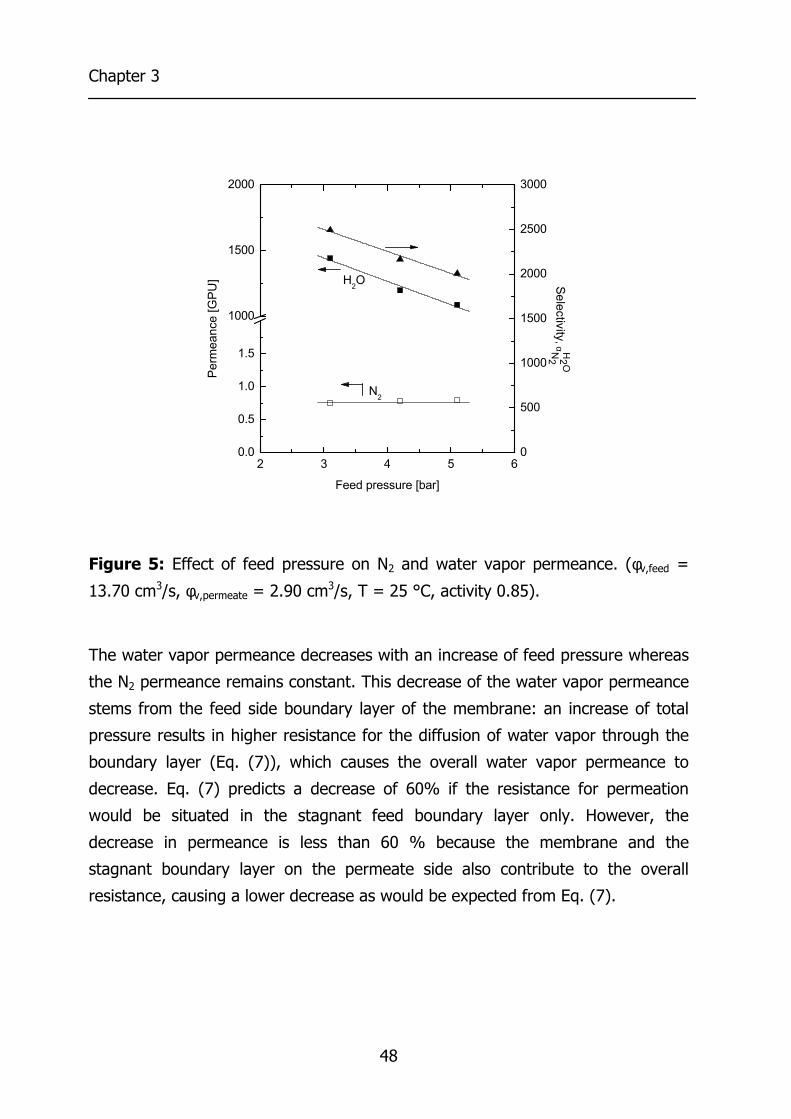
Chapter 3
48
Figure 5: Effect of feed pressure on N2 and water vapor permeance. (φv,feed =
13.70 cm3/s, φv,permeate = 2.90 cm3/s, T = 25 °C, activity 0.85).
The water vapor permeance decreases with an increase of feed pressure whereas
the N2 permeance remains constant. This decrease of the water vapor permeance
stems from the feed side boundary layer of the membrane: an increase of total
pressure results in higher resistance for the diffusion of water vapor through the
boundary layer (Eq. (7)), which causes the overall water vapor permeance to
decrease. Eq. (7) predicts a decrease of 60% if the resistance for permeation
would be situated in the stagnant feed boundary layer only. However, the
decrease in permeance is less than 60 % because the membrane and the
stagnant boundary layer on the permeate side also contribute to the overall
resistance, causing a lower decrease as would be expected from Eq. (7).
2 3 4 5 60.0
0.5
1.0
1.5
1000
1500
2000
Feed pressure [bar]
Perm
eanc
e [G
PU]
N2
H2O
0
500
1000
1500
2000
2500
3000
Selectivity, α H2 O
N2
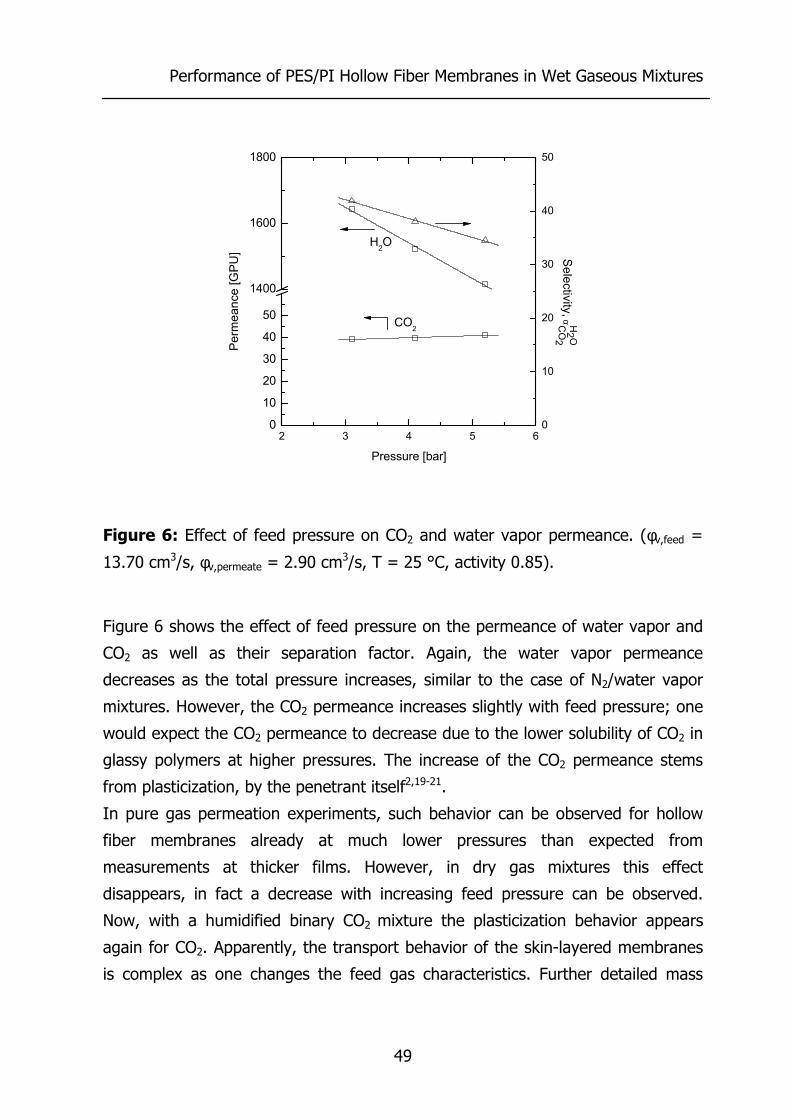
Performance of PES/PI Hollow Fiber Membranes in Wet Gaseous Mixtures
49
Figure 6: Effect of feed pressure on CO2 and water vapor permeance. (φv,feed =
13.70 cm3/s, φv,permeate = 2.90 cm3/s, T = 25 °C, activity 0.85).
Figure 6 shows the effect of feed pressure on the permeance of water vapor and
CO2 as well as their separation factor. Again, the water vapor permeance
decreases as the total pressure increases, similar to the case of N2/water vapor
mixtures. However, the CO2 permeance increases slightly with feed pressure; one
would expect the CO2 permeance to decrease due to the lower solubility of CO2 in
glassy polymers at higher pressures. The increase of the CO2 permeance stems
from plasticization, by the penetrant itself2,19-21.
In pure gas permeation experiments, such behavior can be observed for hollow
fiber membranes already at much lower pressures than expected from
measurements at thicker films. However, in dry gas mixtures this effect
disappears, in fact a decrease with increasing feed pressure can be observed.
Now, with a humidified binary CO2 mixture the plasticization behavior appears
again for CO2. Apparently, the transport behavior of the skin-layered membranes
is complex as one changes the feed gas characteristics. Further detailed mass
2 3 4 5 60
10
20
30
40
50
1400
1600
1800
Pressure [bar]
Perm
eanc
e [G
PU]
CO2
H2O
0
10
20
30
40
50
Selectivity, α H
2 OC
O2
Chapter 3
50
transport studies are required to fully comprehend the separation and permeation
properties in complex feed gas streams.
3.4.3 Resistance towards mass transfer
Experiments at various feed and permeate flow rates are performed in order to
determine the resistance towards mass transfer for water vapor caused by the
stagnant boundary layers on the feed and permeate side of the membrane.
Figure 7: Water vapor permeance at various feed (○) and permeate (∇ ) flow
rates. (Pfeed = 5.1 bar, T = 25 °C, activity 0.85).
Figure 7 shows the water vapor permeance at various feed- and permeate flow
rates (total pressure, temperature, water vapor activity and permeate- or feed
flow rate are kept constant). The permeance of water vapor increases with flow
rate due to a reduction of the laminar boundary layer thickness induced by a
higher flow rate. This increases the mass transfer rate, indicating that the
stagnant feed- and permeate boundary layers contribute to the overall resistance
of water vapor. The N2 or CO2 permeance remains constant at various flow rates
verifying that the resistance for these components is located in the membrane and
0 2 4 6 8 10 12 140
200
400
600
800
1000
1200
1400
1600
1800
H2O (permeate flow rate)
Flow rate [cm3/s]
H2O (feed flow rate)
Per
mea
nce
[GP
U]
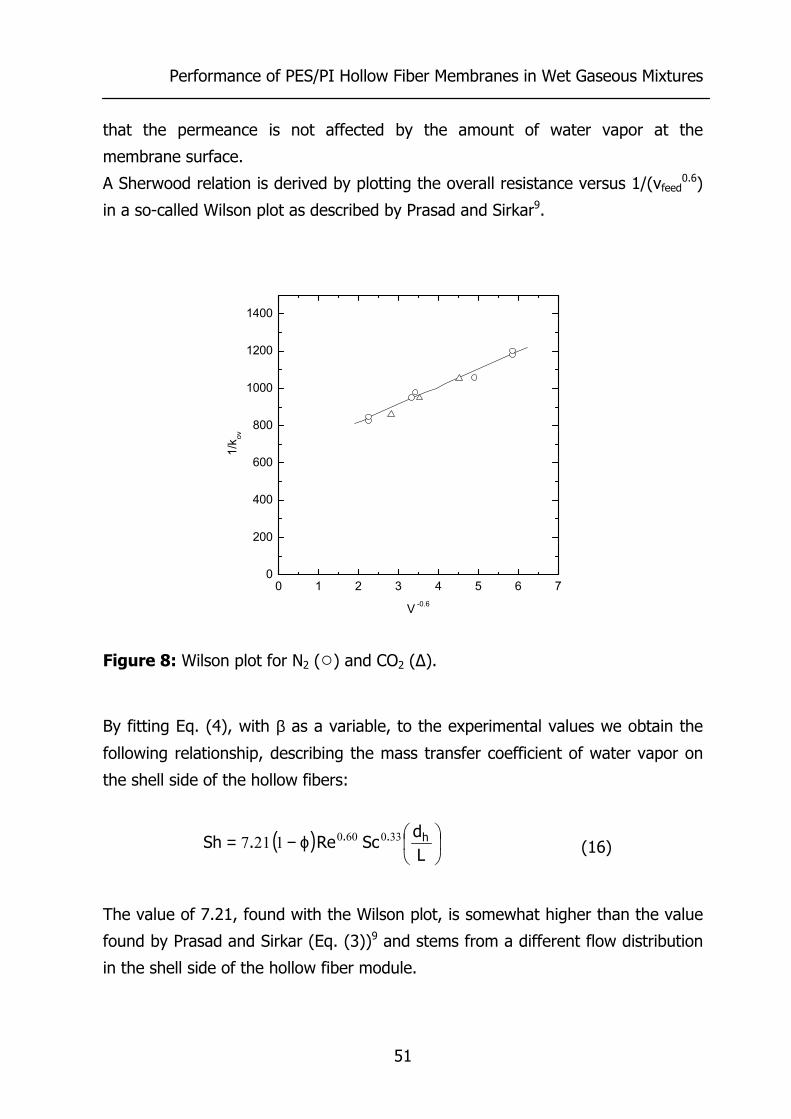
Performance of PES/PI Hollow Fiber Membranes in Wet Gaseous Mixtures
51
that the permeance is not affected by the amount of water vapor at the
membrane surface.
A Sherwood relation is derived by plotting the overall resistance versus 1/(vfeed0.6)
in a so-called Wilson plot as described by Prasad and Sirkar9.
Figure 8: Wilson plot for N2 (○) and CO2 (∆).
By fitting Eq. (4), with β as a variable, to the experimental values we obtain the
following relationship, describing the mass transfer coefficient of water vapor on
the shell side of the hollow fibers:
( )
ϕ−=Ld
ScRe.Sh h.. 3306001217
(16)
The value of 7.21, found with the Wilson plot, is somewhat higher than the value
found by Prasad and Sirkar (Eq. (3))9 and stems from a different flow distribution
in the shell side of the hollow fiber module.
0 1 2 3 4 5 6 70
200
400
600
800
1000
1200
1400
1/k ov
V -0.6
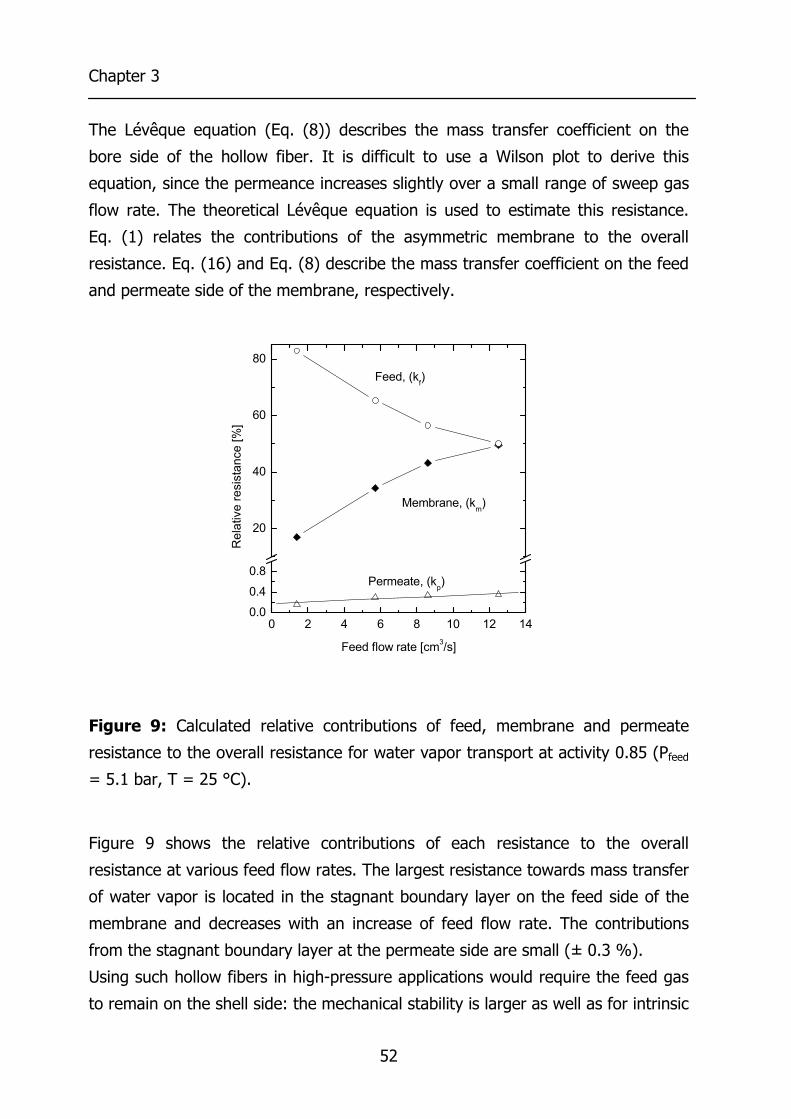
Chapter 3
52
The Lévêque equation (Eq. (8)) describes the mass transfer coefficient on the
bore side of the hollow fiber. It is difficult to use a Wilson plot to derive this
equation, since the permeance increases slightly over a small range of sweep gas
flow rate. The theoretical Lévêque equation is used to estimate this resistance.
Eq. (1) relates the contributions of the asymmetric membrane to the overall
resistance. Eq. (16) and Eq. (8) describe the mass transfer coefficient on the feed
and permeate side of the membrane, respectively.
Figure 9: Calculated relative contributions of feed, membrane and permeate
resistance to the overall resistance for water vapor transport at activity 0.85 (Pfeed
= 5.1 bar, T = 25 °C).
Figure 9 shows the relative contributions of each resistance to the overall
resistance at various feed flow rates. The largest resistance towards mass transfer
of water vapor is located in the stagnant boundary layer on the feed side of the
membrane and decreases with an increase of feed flow rate. The contributions
from the stagnant boundary layer at the permeate side are small (± 0.3 %).
Using such hollow fibers in high-pressure applications would require the feed gas
to remain on the shell side: the mechanical stability is larger as well as for intrinsic
0 2 4 6 8 10 12 140.0
0.4
0.8
20
40
60
80Feed, (kf)
Rel
ativ
e re
sist
ance
[%]
Feed flow rate [cm3/s]
Permeate, (kp)
Membrane, (km)
Performance of PES/PI Hollow Fiber Membranes in Wet Gaseous Mixtures
53
safety reasons (fiber collapse is preferred over fiber bursting). Due to the high
susceptibility of shell-side flow towards concentration polarization, precise packing
of the fibers will be of utmost importance.
3.5 Conclusions
For glassy hollow fiber membranes based on a blend of PES and polyimide mixed
gas permeabilities of water vapor/N2, water vapor/CO2 and water vapor/N2/CO2
are determined at various process conditions. Water vapor activity, total pressure,
feed- and permeate flow rate are varied.
The gas and water vapor permeance decrease as the water vapor activity in the
feed mixture increases. The relative decrease of the gas permeance, in the
presence of water vapor, was independent of the applied gas composition.
However, the relative decrease was larger for water vapor compared to N2 and
CO2. The decrease in permeance with an increase of water activity was not
caused by condensation of water vapor in the pores of the asymmetric
membrane: the sorption isotherms of both the asymmetric membrane and a
dense PES/PI film showed the same solubility of water vapor. A higher solubility
would be expected in the asymmetric hollow fiber if pore condensation would
occur. This decrease in permeance stems possibly from a lower diffusivity through
the dense skin due to the presence of water, which might lower the free volume
thereby increasing the resistance for permeation.
An increase of total feed pressure causes the water vapor permeance to decrease
due to a decreased diffusion coefficient of water vapor through the stagnant feed
boundary layer. The N2 permeance remains constant with an increase of pressure
whereas the CO2 permeance increases due to plasticization phenomena.
Sherwood relations are derived, which describe the variation of the overall mass
transfer coefficient for water vapor at various feed- and permeate flow rates. This
analysis reveals that the main resistance for water vapor transport is located in
the stagnant feed boundary layer. At higher flow rates the main resistance shifts
towards the membrane.
Chapter 3
54
3.6 Acknowledgements
This research was supported through a European Community Marie Curie B-30
Fellowship, (Contract No HPMFCT-2000-0475) and a Brite Euram III Project,
(Contract No. BRPR-CT 98-0804).
3.7 List of Symbols
A surface area [m2]
a, b, c, and
d specific constants in Eq. 2 [-]
D diffusion coefficient [m2/s]
dh hydraulic diameter (4*wetted area/wetted
circumfence) [m]
di inside diameter [m]
do outside diameter [m]
k mass transfer coefficient [m/s]
kf mass transfer coefficient feed [m/s]
km mass transfer coefficient membrane [m/s]
kov overall mass transfer coefficient feed [m/s]
kp mass transfer coefficient permeate [m/s]
L length of flow path [m]
l membrane thickness [m]
M molecular weight [g/mol]
P permeability [Barrer]
p pressure [bar]
pf feed pressure [cmHg]
pfeed feed pressure [cmHg]
pp,in permeate pressure e entering the module [cmHg]
pp,out permeate pressure leaving the module [cmHg]
ppermeate permeate pressure [cmHg]
pr retentate pressure [cmHg]
Performance of PES/PI Hollow Fiber Membranes in Wet Gaseous Mixtures
55
R gas constant (8.314) [J/(molK)]
Re Reynolds number [-]
Sc Schmidt number [-]
Sh Sherwood number [-]
T temperature [K]
Tdew dew point temperature (Eq. 11) [°C]
v velocity [m/s]
Vm molar volume [m3/mol]
x fraction [-]
∆pln logarithmic pressure difference [cmHg]
Greek Symbols β constant in Eq. 3 [-]
φn molar flow [mol/s]
φv,gas flow rate gas [cm3/s]
φv,tot total flow rate [cm3/s]
γ activity coefficient [-]
η viscosity [Pa s]
ϕ packing fraction [-]
ρ density [kg/m3]
3.8 References (1) Kapantaidakis, G. C.; Koops, G. H. J. Membr. Sci. 2002, 204, 153-171. (2) Kapantaidakis, G. C.; Koops, G. H.; Kaldis, S. P.; Sakelaropoulos, G. P.;
Wessling, M. AIChE J. 2003, 49, 1702-1711. (3) Wang, K. L.; McCray, S. H.; Newbold, D. D.; Cussler, E. L. J. Membr. Sci.
1992, 72, 231-244. (4) Swinyard, B. T.; Sagoo, P. S.; Barrie, J. A.; Ash, R. J. Appl. Polym. Sci.
1990, 41, 2479-2485. (5) Mulder, M. H. V. Basic principles of membrane technology, second ed.;
Kluwer: Dordrecht, 1996. (6) Liu, L.; Chen, Y.; Li, S. G.; Deng, M. C. Sep. Sci. Technol. 2001, 36,
3701-3720. (7) Beuscher, U.; Gooding, C. H. J. Membr. Sci. 1999, 152, 99-116. (8) Gabelman, A.; Hwang, S. T. J. Membr. Sci. 1999, 159, 61-106. (9) Prasad, R.; Sirkar, K. K. AIChE J. 1988, 34, 177-188.
Chapter 3
56
(10) VDI Heat Atlas: Duesseldorf, 1993. (11) Poling, B. E.; Prausnitz, J. M.; O'Connell, J. P. The properties of gases
and liquids; McGraw-Hill: New York, 2001. (12) Massman, W. J. Atmos. Environ. 1998, 32, 1111-1127. (13) Boom, J. P.; Punt, I. G. M.; Zwijnenberg, H.; de Boer, R.; Bargeman,
D.; Smolders, C. A.; Strathmann, H. J. Membr. Sci. 1998, 138, 237-258. (14) Stamatialis, D.; Wessling, M.; Sanopoulou, M.; Strathmann, H.;
Petropoulos, J. J. Membr. Sci. 1997, 125, 165-175. (15) Chern, R. T. K., W. J.; Sanders, E. S.; Yui, R. J. Membr. Sci. 1983, 15,
157-169. (16) Pye, D. G.; Hoehn, H. H.; Panar, M. J. Appl. Polym. Sci. 1976, 20, 287-
301. (17) Vu, D. Q.; Koros, W. J.; Miller, S. J. Ind. Eng. Chem. Res. 2003, 42,
1064-1075. (18) Bharadwaj, R. K. Macromolecules 2002, 35, 5334-5336. (19) Wessling, M.; Lopez, M. L.; Strathmann, H. Sep. Purif. Technol. 2001, 24,
223-233. (20) Krol, J. J.; Boerrigter, M.; Koops, G. H. J. Membr. Sci. 2001, 184, 275-
286. (21) Barsema, J. N.; Kapantaidakis, G. C.; van der Vegt, N. F. A.; Koops, G.
H.; Wessling, M. J. Membr. Sci. 2003, 216, 195-205.
57
Chapter 4
Gas Permeation Properties of Poly(Ethylene Oxide) Poly(Butylene
Terephthalate) Block Copolymers Abstract This chapter reports the gas permeation properties of poly(ethylene oxide) (PEO) poly(butylene terephthalate) (PBT) segmented block copolymers. These block copolymers allow a structural modification by the amount of PBT and the PEO segment length, enabling a systematic study of the relationship between polymer composition and gas transport properties. These block copolymers exhibit a high CO2/N2selectivity (α ≈ 60 at T = 35°C) due to the high solubility of CO2. However, this selectivity is structure-dependent and is higher for block copolymers with larger amounts of PBT. The CO2/He selectivity shows a different structure dependency since the permeation of CO2 occurs primarily through the PEO phase and the He permeation occurs through both the PEO and PBT phase. Block copolymers with a better phase separation between the PEO phase and the PBT phase and more PEO therefore have a higher CO2/He selectivity. The permeability depends on the amount of PEO and the PEO segment length. The permeabilities are compared with the Maxwell model, and the difference between the experimental values and the Maxwell model are interpreted on the basis of chain flexibility of the PEO phase The chain flexibility decreases with increasing amounts of PBT due to a less pronounced phase separation between the PEO and PBT phase. The increase of the permeability with an increasing PEO block length, at the same ratio PEO-PBT, is caused by larger chain flexibility for longer PEO segments. The permeability depends also on the degree of crystallinity and the melting temperature of the PEO phase, which increases with the amount and the PEO segment length.
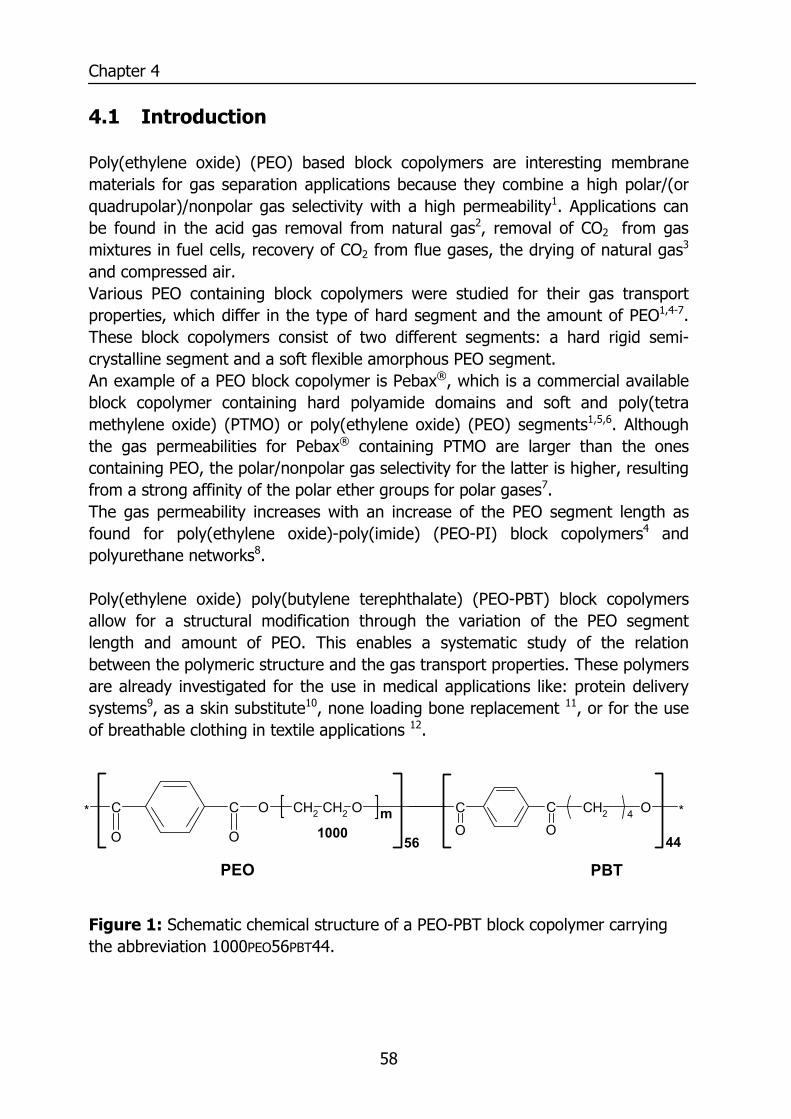
Chapter 4
58
4.1 Introduction Poly(ethylene oxide) (PEO) based block copolymers are interesting membrane materials for gas separation applications because they combine a high polar/(or quadrupolar)/nonpolar gas selectivity with a high permeability1. Applications can be found in the acid gas removal from natural gas2, removal of CO2 from gas mixtures in fuel cells, recovery of CO2 from flue gases, the drying of natural gas3 and compressed air. Various PEO containing block copolymers were studied for their gas transport properties, which differ in the type of hard segment and the amount of PEO1,4-7. These block copolymers consist of two different segments: a hard rigid semi-crystalline segment and a soft flexible amorphous PEO segment. An example of a PEO block copolymer is Pebax®, which is a commercial available block copolymer containing hard polyamide domains and soft and poly(tetra methylene oxide) (PTMO) or poly(ethylene oxide) (PEO) segments1,5,6. Although the gas permeabilities for Pebax® containing PTMO are larger than the ones containing PEO, the polar/nonpolar gas selectivity for the latter is higher, resulting from a strong affinity of the polar ether groups for polar gases7. The gas permeability increases with an increase of the PEO segment length as found for poly(ethylene oxide)-poly(imide) (PEO-PI) block copolymers4 and polyurethane networks8. Poly(ethylene oxide) poly(butylene terephthalate) (PEO-PBT) block copolymers allow for a structural modification through the variation of the PEO segment length and amount of PEO. This enables a systematic study of the relation between the polymeric structure and the gas transport properties. These polymers are already investigated for the use in medical applications like: protein delivery systems9, as a skin substitute10, none loading bone replacement 11, or for the use of breathable clothing in textile applications 12.
Figure 1: Schematic chemical structure of a PEO-PBT block copolymer carrying the abbreviation 1000PEO56PBT44.
PEO
CCOO
CH2 O4
44
C
O
C
O
O CH2 CH2 O m *
56
*
PBT
1000
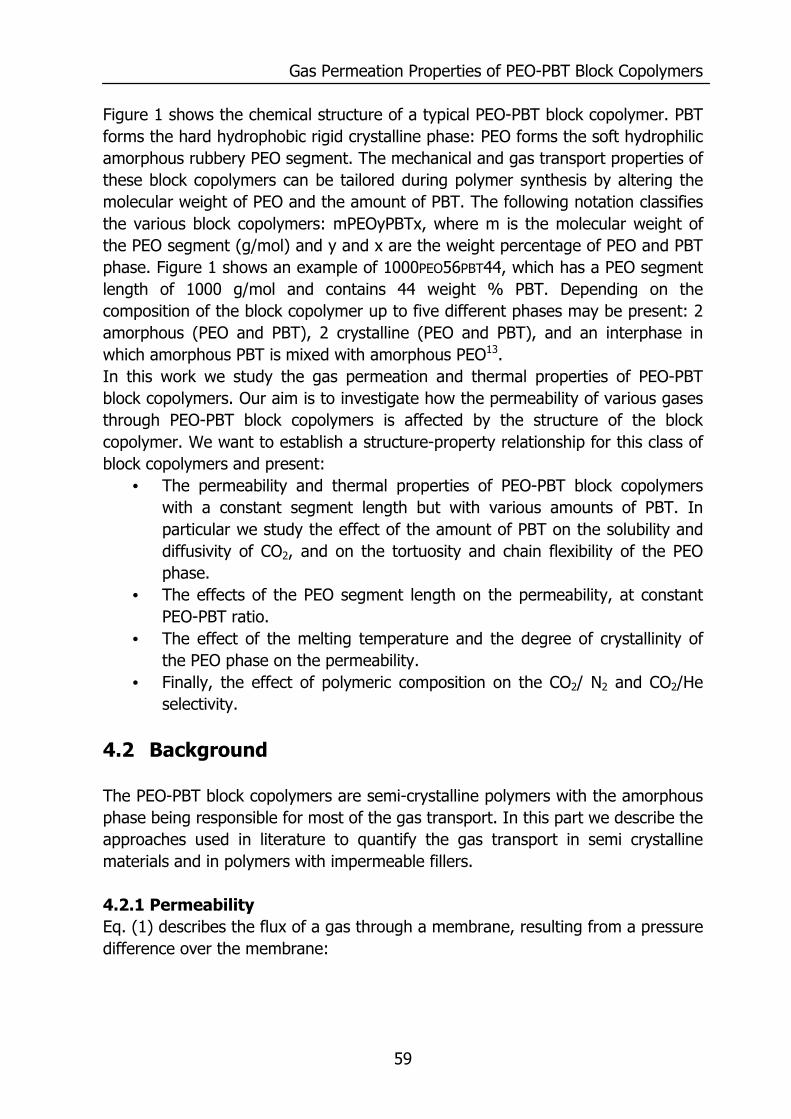
Gas Permeation Properties of PEO-PBT Block Copolymers
59
Figure 1 shows the chemical structure of a typical PEO-PBT block copolymer. PBT forms the hard hydrophobic rigid crystalline phase: PEO forms the soft hydrophilic amorphous rubbery PEO segment. The mechanical and gas transport properties of these block copolymers can be tailored during polymer synthesis by altering the molecular weight of PEO and the amount of PBT. The following notation classifies the various block copolymers: mPEOyPBTx, where m is the molecular weight of the PEO segment (g/mol) and y and x are the weight percentage of PEO and PBT phase. Figure 1 shows an example of 1000PEO56PBT44, which has a PEO segment length of 1000 g/mol and contains 44 weight % PBT. Depending on the composition of the block copolymer up to five different phases may be present: 2 amorphous (PEO and PBT), 2 crystalline (PEO and PBT), and an interphase in which amorphous PBT is mixed with amorphous PEO13. In this work we study the gas permeation and thermal properties of PEO-PBT block copolymers. Our aim is to investigate how the permeability of various gases through PEO-PBT block copolymers is affected by the structure of the block copolymer. We want to establish a structure-property relationship for this class of block copolymers and present:
• The permeability and thermal properties of PEO-PBT block copolymers with a constant segment length but with various amounts of PBT. In particular we study the effect of the amount of PBT on the solubility and diffusivity of CO2, and on the tortuosity and chain flexibility of the PEO phase.
• The effects of the PEO segment length on the permeability, at constant PEO-PBT ratio.
• The effect of the melting temperature and the degree of crystallinity of the PEO phase on the permeability.
• Finally, the effect of polymeric composition on the CO2/ N2 and CO2/He selectivity.
4.2 Background The PEO-PBT block copolymers are semi-crystalline polymers with the amorphous phase being responsible for most of the gas transport. In this part we describe the approaches used in literature to quantify the gas transport in semi crystalline materials and in polymers with impermeable fillers. 4.2.1 Permeability Eq. (1) describes the flux of a gas through a membrane, resulting from a pressure difference over the membrane:
Chapter 4
60
plP
J ∆= (1)
where J is the gas flux through the membrane (cm3(STP)/(cm2 s)), P the permeability coefficient (Barrer, 1 Barrer = 1 10-10 cm3 (STP)cm/(cm2 s cmHg)), l the membrane thickness (cm), and ∆p the pressure difference over the membrane (cmHg). The gas permeability through a dense nonporous polymeric material is given as the product of diffusivity and solubility:
SDP = (2) where D is the diffusivity (cm2/s), and S the solubility coefficient (cm3(STP)/(cm3 polymer cmHg)) of the solute. PEO-PBT block copolymers consist of two segments, which can be either amorphous or crystalline. The solubility in semi crystalline materials depends on the fraction of amorphous material present in the polymer 14:
0SS α= (3) where S is the solubility coefficient, α the fraction of amorphous material and S0 the solubility coefficient (cm3(STP)/(cm3 PEO cmHg)) of a completely amorphous material. Eq. (3) implies that the solubility in the crystalline phase can be neglected. The measured or apparent diffusivity of a solute through a semi crystalline material depends on: 1) the tortuosity in the material (τ), which increases with an increased number of impermeable objects, and 2) the chain mobility, which maybe reduced at the surface of crystallites. An increase of the tortuosity and lower chain mobility reduce the diffusivity through the amorphous phase, following 15 :
τβ= 0D
D (4)
where D is the apparent diffusivity through the block copolymer, D0 the diffusivity through a completely amorphous material and β a chain immobilization factor, which increases as the mobility of a chain is reduced. The permeability through semi crystalline materials can be calculated by combining Eq. 2, 3 and 4, resulting in:
Gas Permeation Properties of PEO-PBT Block Copolymers
61
βτα= 00 DS
P (5)
PEO-PBT block copolymers comprise a highly permeable PEO phase and a less permeable PBT phase. This PBT phase can be considered as an impermeable barrier, which influences transport through the PEO phase. The Maxwell model describes the gas transport through polymers with non-interacting barriers and can also be used to describe the gas transport in block copolymers16-19:
φ+
φ−=
21
10
b
bMaxwell PP (6)
where P0 is the permeability through a completely amorphous material, and φb the volume fraction barrier material. The reduced permeability resulting from the presence of impermeable barriers stems from an increased path length and a reduced cross sectional area for diffusion. The Maxwell model offers an estimate of the increased diffusivity through the continuous phase due to the presence of randomly dispersed barriers. Eq. (6) also states that the presence of an impermeable object does not affect the chain mobility of the permeable phase. Merkel et al. recently have shown that this assumption may not always hold for nanoscale fumed silica particles, which disrupt the chain packing of the polymer thereby increasing its free volume17. The Maxwell model is valid for a randomly mixed dispersion of isometric particles with a uniform interparticle gaps. The size and shape of the isometric particles is unimportant under the condition that the particles are well separated and that the particle size is in the microscopic range18. Deviations form the Maxwell model are caused by the nonrandom packing of the impermeable objects. This is not expected in block copolymers and polymer blends since these are considered to be randomly mixed.
Chapter 4
62
4.3 Experimental section 4.3.1 Materials PEO-PBT block copolymers were obtained from Isotis b.v. (the Netherlands) and were used without further purification. Chloroform (CHCl3) and trifluoroacetic acid (TFA) were both purchased from Merck (analytical grade) and used as solvents. For the gas permeation experiments carbon dioxide (CO2), nitrogen (N2), and helium (He) were purchased from Hoekloos b.v. (Netherlands), and methane (CH4), propane (C3H8), and butane (C4H10) from Praxair n.v. (Belgium). All the gases had a purity greater than 99.9 %. 4.3.2 Film preparation PEO-PBT block copolymers were dissolved in CHCl3 (5 – 10 wt. %), and TFA was added (± 4 volume % in CHCl3) when the weight ratio of PEO in the block copolymer was lower than 50 wt%. Thin films of around 50 µm were prepared by solution casting on a glass plate. The cast films were dried in a N2 atmosphere at room temperature for 24 hours. The homogeneous dense films were removed from the glass plate and were further dried and stored in a vacuum oven at 30°C. 4.3.3 Proton-NMR Proton-NMR measurements were performed to determine the exact weight ratio between the soft PEO and the hard PBT phase as described by Fakirov20. The PEO-PBT manufacturer (Isotis b.v.) determined the molecular weight of the PEO segment. 4.3.4 Differential Scanning Calometry (DSC) The thermal properties of the PEO-PBT block copolymers were determined using a DSC7 (Perkin Elmer). Indium and cyclohexane were used for calibration. The amount of polymer used was 5 – 10 mg. The samples were dried in a vacuum oven at 30°C and a dry N2 atmosphere was used in the DSC experiments, preventing water vapor affecting the measurements. The thermal properties were determined from the second heating scan (heating rate of 10°C/min), in the temperature range from –80°C to +250°C. The glass transition temperature was determined from the midpoint of the heat capacity change and the melting temperature from the onset of melting. The degree of crystallinity in both the PEO and PBT phase was calculated by using Eq. 7:
0f
fc
HwH
X∆⋅
∆= (7)

Gas Permeation Properties of PEO-PBT Block Copolymers
63
where ∆Hf is the enthalpy of formation of the crystalline PEO or PBT phase (J/g), ∆Hf
0 the enthalpy of formation of the pure crystal (for PEO 144.5 (J/g) 21and for PBT 213.4 (J/g)20), and w the weight percent PEO or PBT present in the block copolymer. 4.3.5 Gas permeation Pure gas permeation properties of the PEO-PBT block copolymer were determined with CO2, N2, He, CH4, C3H8, and C4H10 in the temperature range from 10 – 80 °C. The experiments were performed following the constant volume variable pressure method, described in detail elsewhere 22-24. Permeabilities were determined at least 8 hours after contacting the polymeric film with the gas. Experiments performed in duplo yielded values within an experimental error range of 15 %. This falls within the systematic error for the characterization equipment used. 4.3.6 Equilibrium sorption Equilibrium sorption of CO2 in various PEO-PBT block copolymers was obtained for pressures up to 50 bar at 25 °C. The equipment used and the experimental procedure of the sorption measurement are described in detail elsewhere25. The obtained sorption isotherms increased linear with pressure following Henry’s law:
pSCp ⋅= (8) where Cp is the concentration of CO2 in the block copolymer (cm3(STP)/cm3
polymer), S the solubility coefficient (cm3(STP)/(cm3(polymer) cmHg)), and p the pressure (cmHg).
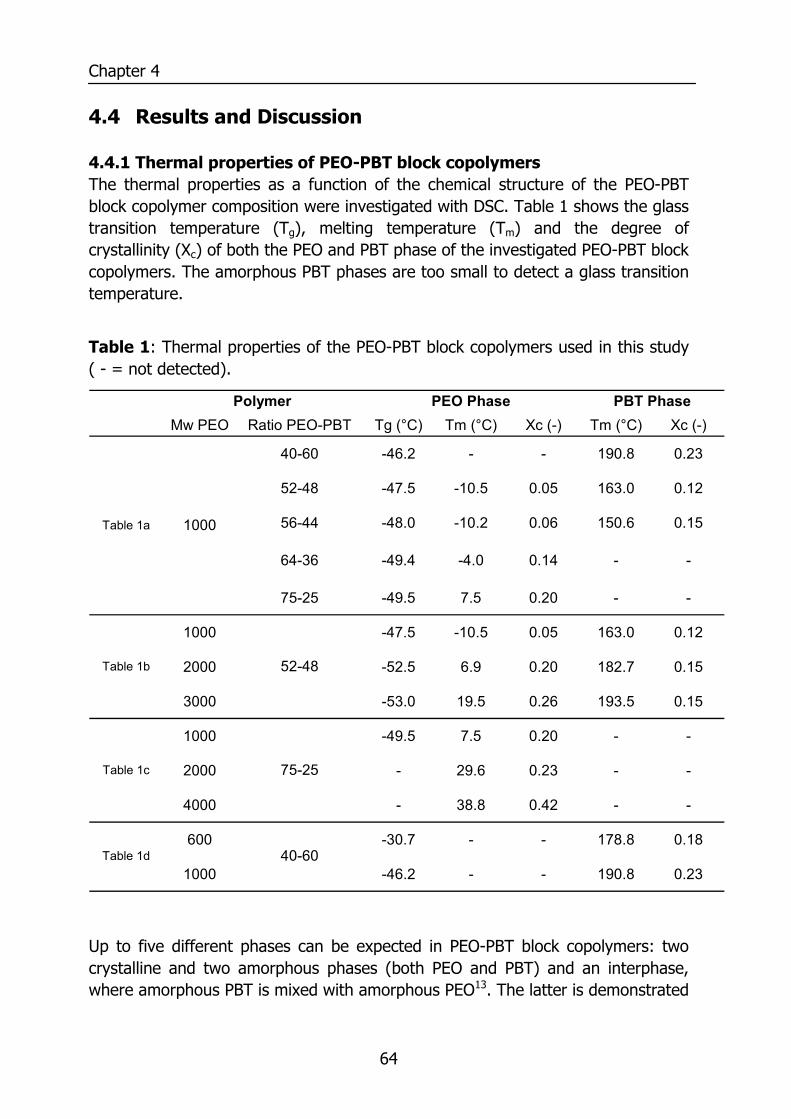
Chapter 4
64
4.4 Results and Discussion 4.4.1 Thermal properties of PEO-PBT block copolymers The thermal properties as a function of the chemical structure of the PEO-PBT block copolymer composition were investigated with DSC. Table 1 shows the glass transition temperature (Tg), melting temperature (Tm) and the degree of crystallinity (Xc) of both the PEO and PBT phase of the investigated PEO-PBT block copolymers. The amorphous PBT phases are too small to detect a glass transition temperature.
Table 1: Thermal properties of the PEO-PBT block copolymers used in this study ( - = not detected).
Up to five different phases can be expected in PEO-PBT block copolymers: two crystalline and two amorphous phases (both PEO and PBT) and an interphase, where amorphous PBT is mixed with amorphous PEO13. The latter is demonstrated
Mw PEO Ratio PEO-PBT Tg (°C) Tm (°C) Xc (-) Tm (°C) Xc (-)
40-60 -46.2 - - 190.8 0.23
52-48 -47.5 -10.5 0.05 163.0 0.12
56-44 -48.0 -10.2 0.06 150.6 0.15
64-36 -49.4 -4.0 0.14 - -
75-25 -49.5 7.5 0.20 - -
1000 -47.5 -10.5 0.05 163.0 0.12
2000 -52.5 6.9 0.20 182.7 0.15
3000 -53.0 19.5 0.26 193.5 0.15
1000 -49.5 7.5 0.20 - -
2000 - 29.6 0.23 - -
4000 - 38.8 0.42 - -
600 -30.7 - - 178.8 0.18
1000 -46.2 - - 190.8 0.23
75-25
40-60
Table 1c
1000Table 1a
Table 1d
PEO Phase PBT PhasePolymer
52-48Table 1b
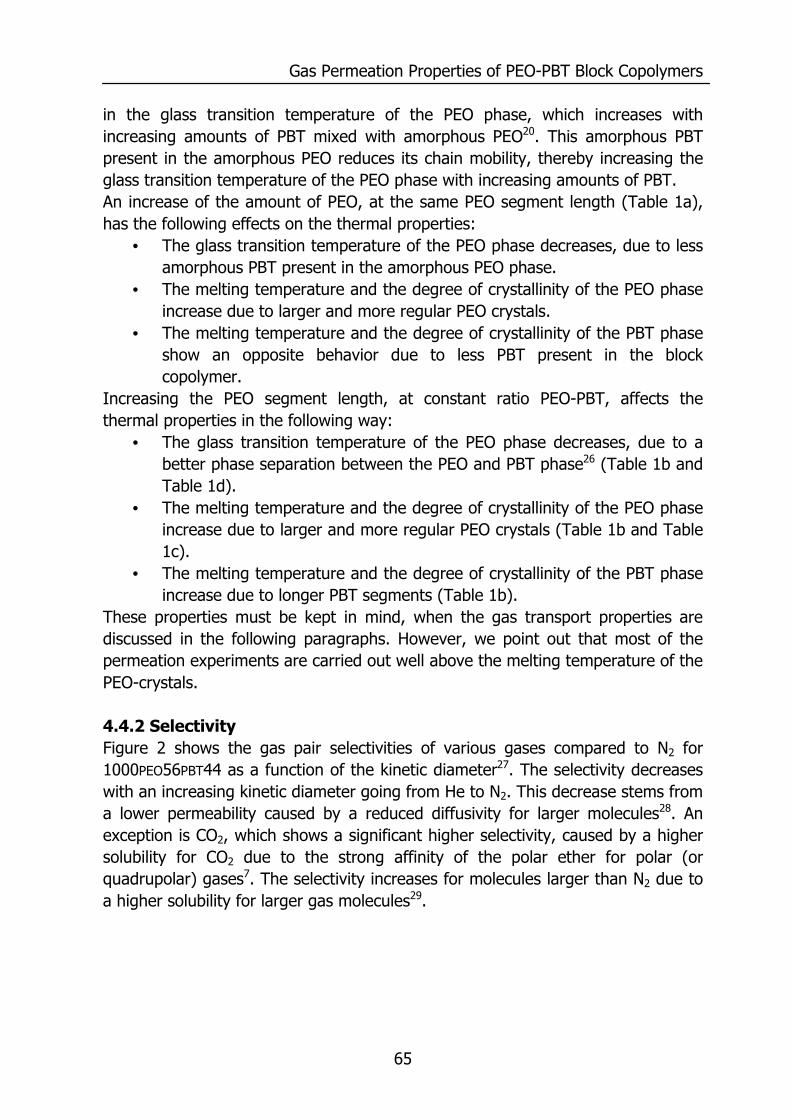
Gas Permeation Properties of PEO-PBT Block Copolymers
65
in the glass transition temperature of the PEO phase, which increases with increasing amounts of PBT mixed with amorphous PEO20. This amorphous PBT present in the amorphous PEO reduces its chain mobility, thereby increasing the glass transition temperature of the PEO phase with increasing amounts of PBT. An increase of the amount of PEO, at the same PEO segment length (Table 1a), has the following effects on the thermal properties:
• The glass transition temperature of the PEO phase decreases, due to less amorphous PBT present in the amorphous PEO phase.
• The melting temperature and the degree of crystallinity of the PEO phase increase due to larger and more regular PEO crystals.
• The melting temperature and the degree of crystallinity of the PBT phase show an opposite behavior due to less PBT present in the block copolymer.
Increasing the PEO segment length, at constant ratio PEO-PBT, affects the thermal properties in the following way:
• The glass transition temperature of the PEO phase decreases, due to a better phase separation between the PEO and PBT phase26 (Table 1b and Table 1d).
• The melting temperature and the degree of crystallinity of the PEO phase increase due to larger and more regular PEO crystals (Table 1b and Table 1c).
• The melting temperature and the degree of crystallinity of the PBT phase increase due to longer PBT segments (Table 1b).
These properties must be kept in mind, when the gas transport properties are discussed in the following paragraphs. However, we point out that most of the permeation experiments are carried out well above the melting temperature of the PEO-crystals. 4.4.2 Selectivity Figure 2 shows the gas pair selectivities of various gases compared to N2 for 1000PEO56PBT44 as a function of the kinetic diameter27. The selectivity decreases with an increasing kinetic diameter going from He to N2. This decrease stems from a lower permeability caused by a reduced diffusivity for larger molecules28. An exception is CO2, which shows a significant higher selectivity, caused by a higher solubility for CO2 due to the strong affinity of the polar ether for polar (or quadrupolar) gases7. The selectivity increases for molecules larger than N2 due to a higher solubility for larger gas molecules29.
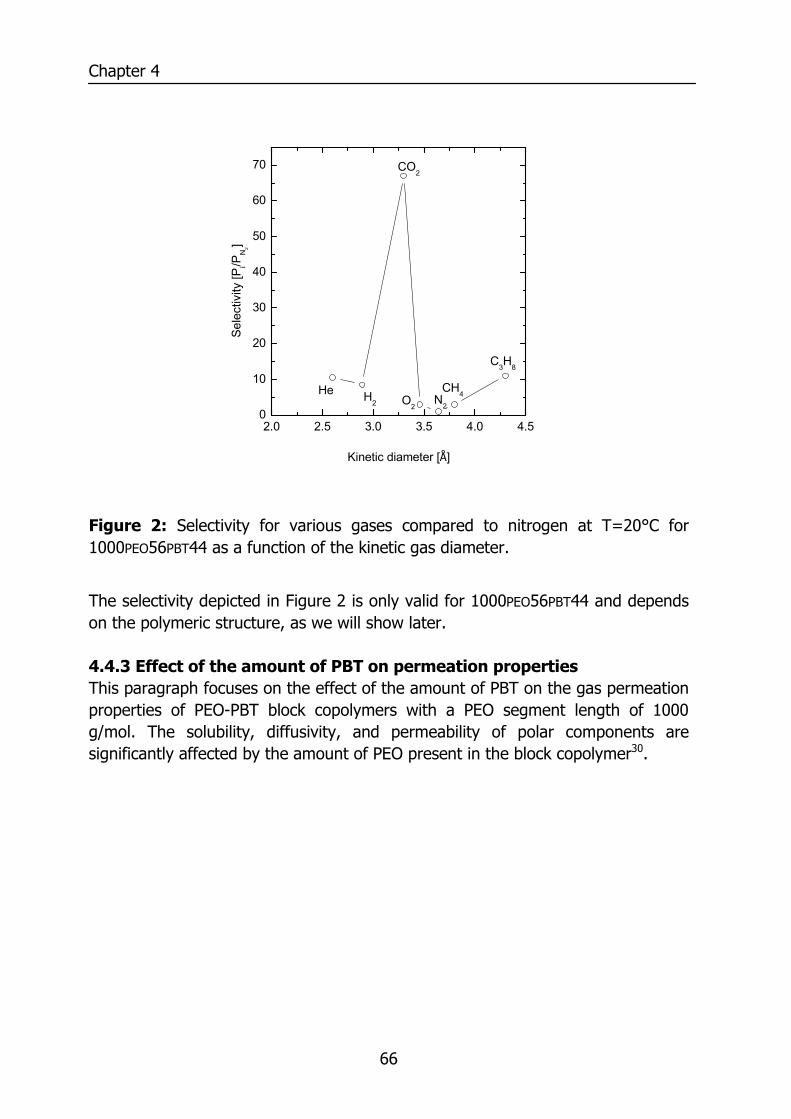
Chapter 4
66
Figure 2: Selectivity for various gases compared to nitrogen at T=20°C for 1000PEO56PBT44 as a function of the kinetic gas diameter.
The selectivity depicted in Figure 2 is only valid for 1000PEO56PBT44 and depends on the polymeric structure, as we will show later. 4.4.3 Effect of the amount of PBT on permeation properties This paragraph focuses on the effect of the amount of PBT on the gas permeation properties of PEO-PBT block copolymers with a PEO segment length of 1000 g/mol. The solubility, diffusivity, and permeability of polar components are significantly affected by the amount of PEO present in the block copolymer30.
2.0 2.5 3.0 3.5 4.0 4.50
10
20
30
40
50
60
70
Sele
ctiv
ity [P
i/PN
2]
Kinetic diameter [Å]
He H2 O2N2
CH4
CO2
C3H8
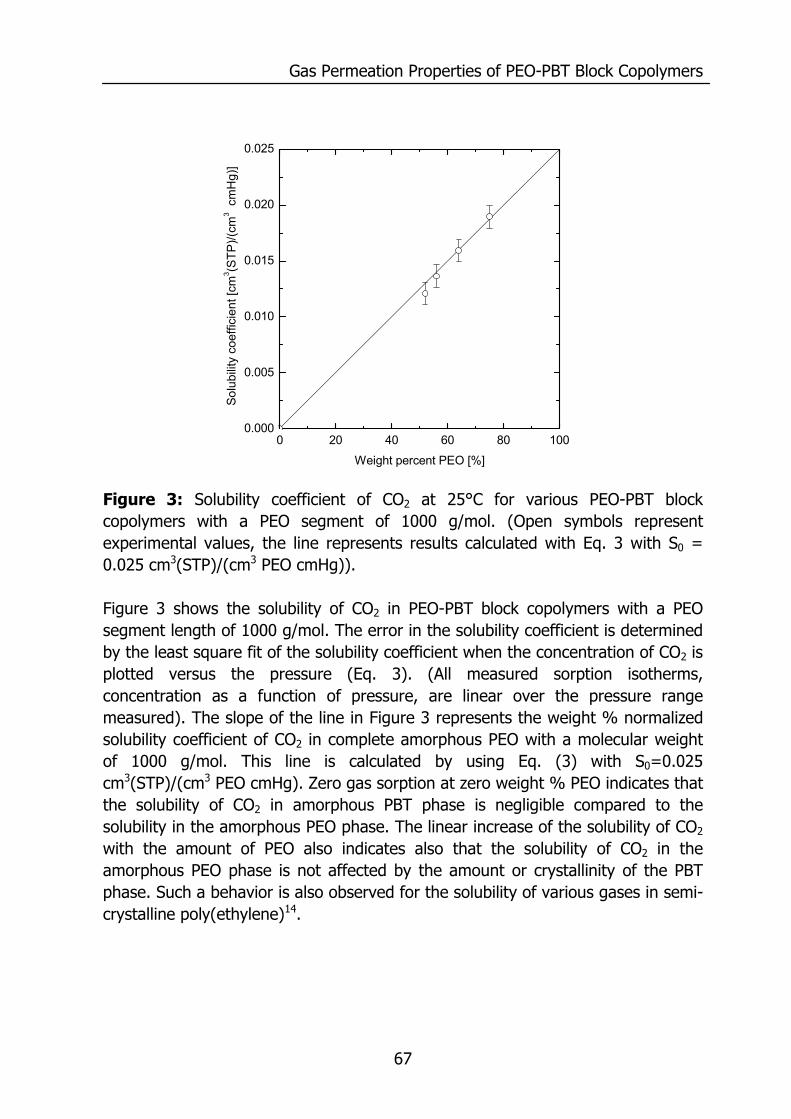
Gas Permeation Properties of PEO-PBT Block Copolymers
67
0 20 40 60 80 1000.000
0.005
0.010
0.015
0.020
0.025
Solu
bilit
y co
effic
ient
[cm
3 (STP
)/(cm
3 cm
Hg)
]
Weight percent PEO [%]
Figure 3: Solubility coefficient of CO2 at 25°C for various PEO-PBT block copolymers with a PEO segment of 1000 g/mol. (Open symbols represent experimental values, the line represents results calculated with Eq. 3 with S0 = 0.025 cm3(STP)/(cm3 PEO cmHg)). Figure 3 shows the solubility of CO2 in PEO-PBT block copolymers with a PEO segment length of 1000 g/mol. The error in the solubility coefficient is determined by the least square fit of the solubility coefficient when the concentration of CO2 is plotted versus the pressure (Eq. 3). (All measured sorption isotherms, concentration as a function of pressure, are linear over the pressure range measured). The slope of the line in Figure 3 represents the weight % normalized solubility coefficient of CO2 in complete amorphous PEO with a molecular weight of 1000 g/mol. This line is calculated by using Eq. (3) with S0=0.025 cm3(STP)/(cm3 PEO cmHg). Zero gas sorption at zero weight % PEO indicates that the solubility of CO2 in amorphous PBT phase is negligible compared to the solubility in the amorphous PEO phase. The linear increase of the solubility of CO2 with the amount of PEO also indicates also that the solubility of CO2 in the amorphous PEO phase is not affected by the amount or crystallinity of the PBT phase. Such a behavior is also observed for the solubility of various gases in semi-crystalline poly(ethylene)14.
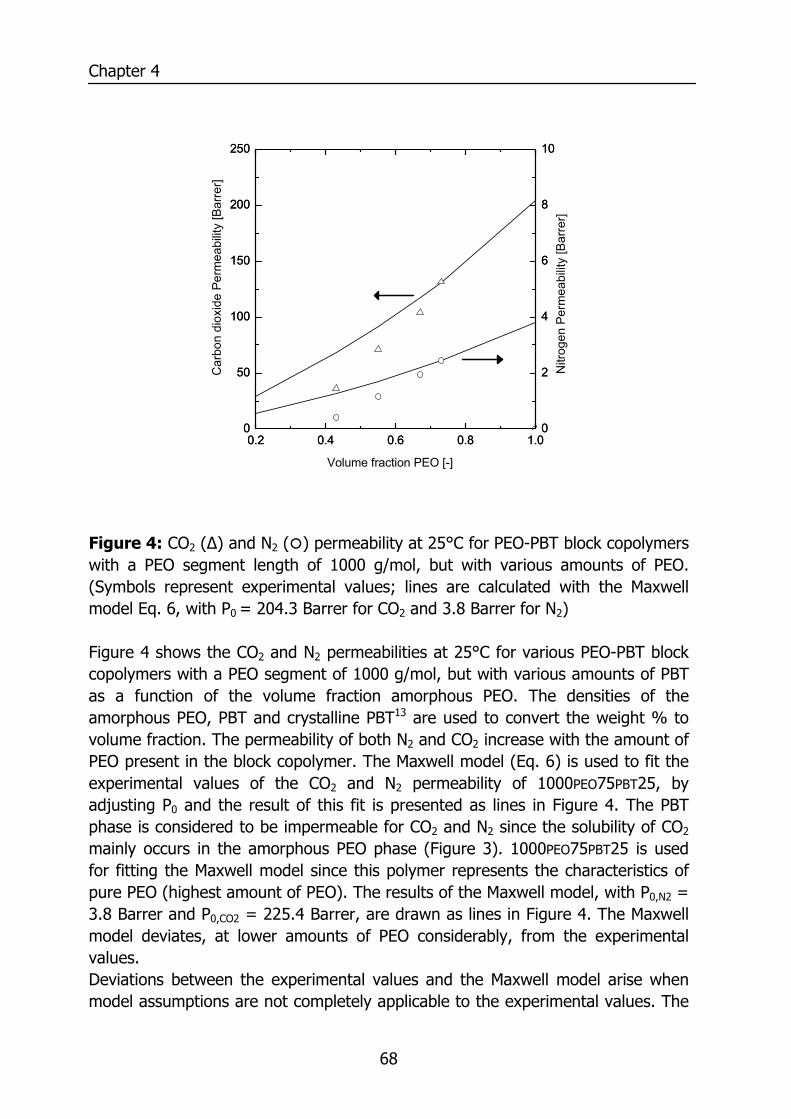
Chapter 4
68
Figure 4: CO2 (∆) and N2 ( ) permeability at 25°C for PEO-PBT block copolymers with a PEO segment length of 1000 g/mol, but with various amounts of PEO. (Symbols represent experimental values; lines are calculated with the Maxwell model Eq. 6, with P0 = 204.3 Barrer for CO2 and 3.8 Barrer for N2) Figure 4 shows the CO2 and N2 permeabilities at 25°C for various PEO-PBT block copolymers with a PEO segment of 1000 g/mol, but with various amounts of PBT as a function of the volume fraction amorphous PEO. The densities of the amorphous PEO, PBT and crystalline PBT13 are used to convert the weight % to volume fraction. The permeability of both N2 and CO2 increase with the amount of PEO present in the block copolymer. The Maxwell model (Eq. 6) is used to fit the experimental values of the CO2 and N2 permeability of 1000PEO75PBT25, by adjusting P0 and the result of this fit is presented as lines in Figure 4. The PBT phase is considered to be impermeable for CO2 and N2 since the solubility of CO2 mainly occurs in the amorphous PEO phase (Figure 3). 1000PEO75PBT25 is used for fitting the Maxwell model since this polymer represents the characteristics of pure PEO (highest amount of PEO). The results of the Maxwell model, with P0,N2 = 3.8 Barrer and P0,CO2 = 225.4 Barrer, are drawn as lines in Figure 4. The Maxwell model deviates, at lower amounts of PEO considerably, from the experimental values. Deviations between the experimental values and the Maxwell model arise when model assumptions are not completely applicable to the experimental values. The
0.2 0.4 0.6 0.8 1.00
50
100
150
200
250
0
2
4
6
8
10
Nitr
ogen
Per
mea
bilit
y [B
arre
r]
0.2 0.4 0.6 0.8 1.00
50
100
150
200
250
Volume fraction PEO [-]
Car
bon
diox
ide
Perm
eabi
lity
[Bar
rer]
0
2
4
6
8
10
Gas Permeation Properties of PEO-PBT Block Copolymers
69
Maxwell model assumes rigid impermeable objects embedded in a permeable PEO phase. However, intermixing of amorphous PBT in the amorphous PEO phase reduces the chain mobility of the PEO phase13. This is reflected in the glass transition temperature of the PEO phase, which increases with an increase of PBT content (Table 1a). It is also observed for Pebax6 and polyurethane8 membranes that imperfect phase separation hampers diffusion and lowers the permeability. This occurs probably also in PEO-PBT block copolymers where a higher amount of PEO results in a PEO phase with less intermixed amorphous PBT mixed in this phase. The phase separation between the PEO and PBT phase deteriorates at higher amounts of PBT causing lower chain mobility and larger deviations between the experimental values and the Maxwell model. The Maxwell model predicts permeabilities when the mobility of the amorphous phase is not reduced by the presence of impermeable barriers. According to Eq. 5, using β = 1, this gives:
τα= 00DS
P wellmax (9)
However, the chain mobility of the PEO phase is affected by the presence of an impermeable phase. The chain immobilization factor (β) is estimated by comparing the measured permeability (Eq. 5) with the permeability calculated with the Maxwell permeability (Eq. 9) in the following way:
β=
βτ
α
τ
α
=00
00
DS
DS
PP
measured
Maxwell (10)
The diffusivity through complete amorphous PEO (D0) is calculated with Eq. 2 since the permeability and solubility of CO2 in completely amorphous PEO are known (P0 = 204.3 (Barrer), S0 = 0.025 (cm3(STP)/(cm3 PEO cmHg)). This gives D0= 8.2 10-7 (cm2/s)).
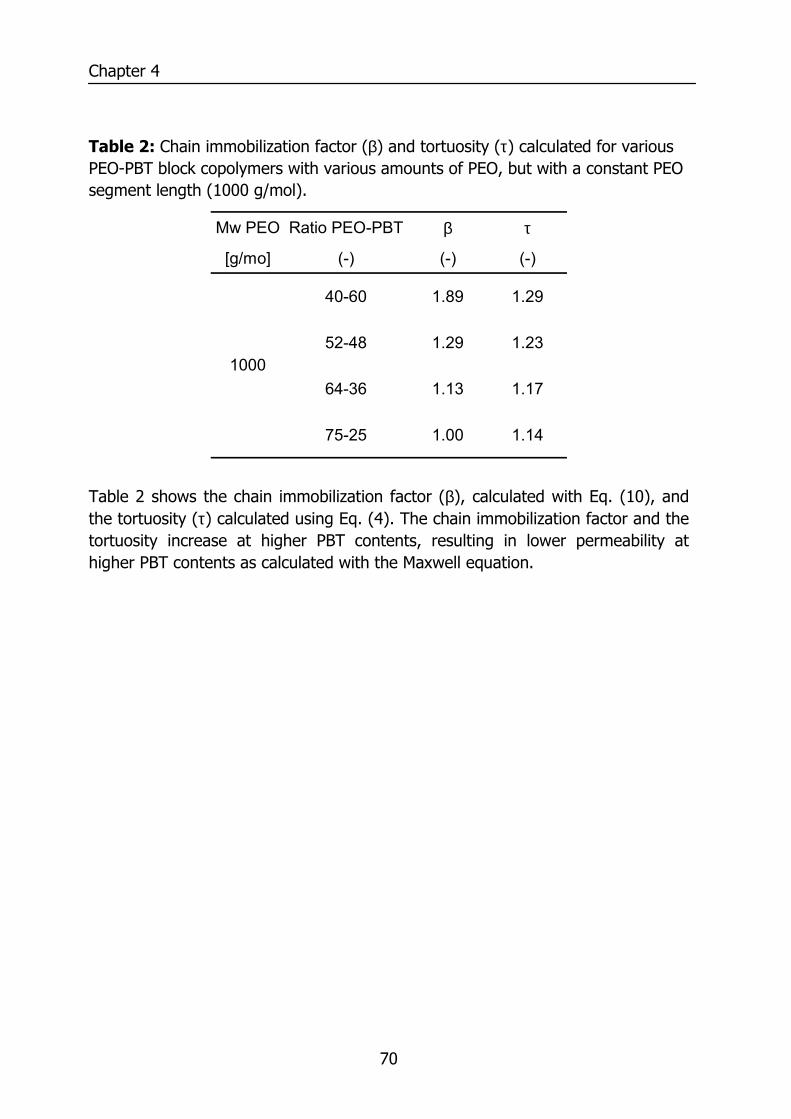
Chapter 4
70
Table 2: Chain immobilization factor (β) and tortuosity (τ) calculated for various PEO-PBT block copolymers with various amounts of PEO, but with a constant PEO segment length (1000 g/mol).
Table 2 shows the chain immobilization factor (β), calculated with Eq. (10), and the tortuosity (τ) calculated using Eq. (4). The chain immobilization factor and the tortuosity increase at higher PBT contents, resulting in lower permeability at higher PBT contents as calculated with the Maxwell equation.
Mw PEO Ratio PEO-PBT β τ
[g/mo] (-) (-) (-)
40-60 1.89 1.29
52-48 1.29 1.23
64-36 1.13 1.17
75-25 1.00 1.14
1000
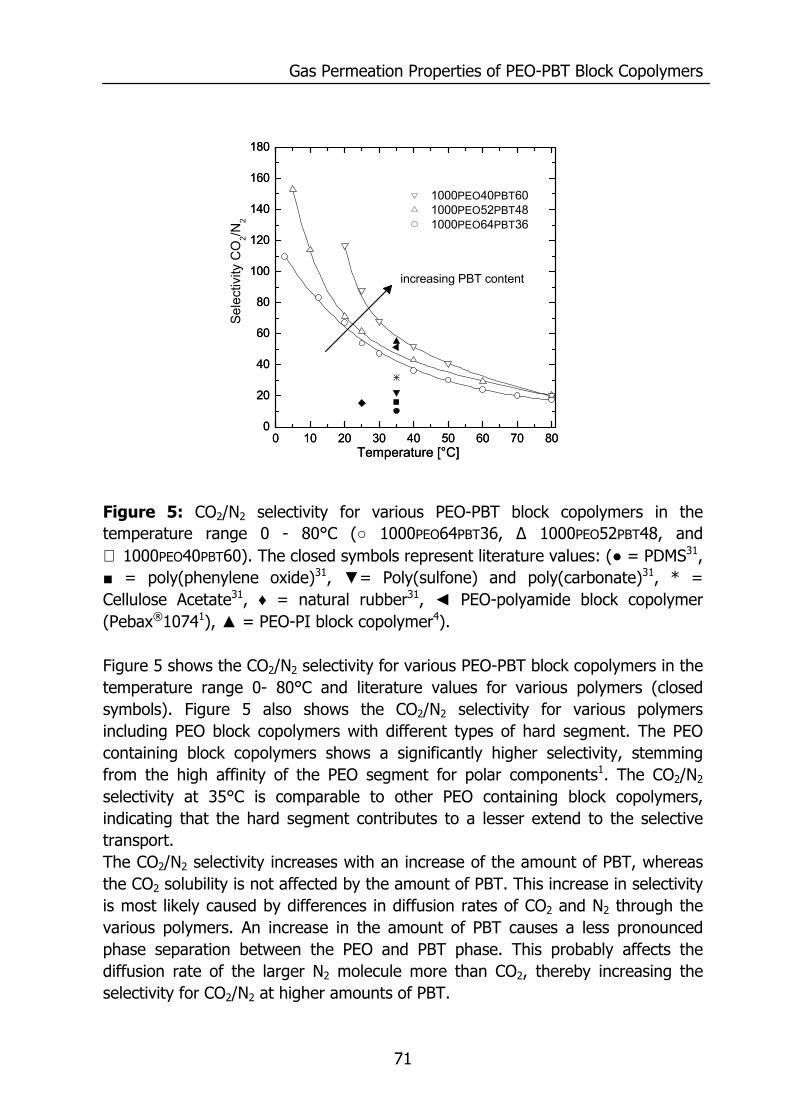
Gas Permeation Properties of PEO-PBT Block Copolymers
71
Figure 5: CO2/N2 selectivity for various PEO-PBT block copolymers in the temperature range 0 - 80°C (○ 1000PEO64PBT36, ∆ 1000PEO52PBT48, and ∇ 1000PEO40PBT60). The closed symbols represent literature values: (● = PDMS31, ■ = poly(phenylene oxide)31, ▼= Poly(sulfone) and poly(carbonate)31, * = Cellulose Acetate31, ♦ = natural rubber31, ◄ PEO-polyamide block copolymer (Pebax®10741), ▲ = PEO-PI block copolymer4). Figure 5 shows the CO2/N2 selectivity for various PEO-PBT block copolymers in the temperature range 0- 80°C and literature values for various polymers (closed symbols). Figure 5 also shows the CO2/N2 selectivity for various polymers including PEO block copolymers with different types of hard segment. The PEO containing block copolymers shows a significantly higher selectivity, stemming from the high affinity of the PEO segment for polar components1. The CO2/N2 selectivity at 35°C is comparable to other PEO containing block copolymers, indicating that the hard segment contributes to a lesser extend to the selective transport. The CO2/N2 selectivity increases with an increase of the amount of PBT, whereas the CO2 solubility is not affected by the amount of PBT. This increase in selectivity is most likely caused by differences in diffusion rates of CO2 and N2 through the various polymers. An increase in the amount of PBT causes a less pronounced phase separation between the PEO and PBT phase. This probably affects the diffusion rate of the larger N2 molecule more than CO2, thereby increasing the selectivity for CO2/N2 at higher amounts of PBT.
0 10 20 30 40 50 60 70 800
20
40
60
80
100
120
140
160
180
0 10 20 30 40 50 60 70 800
20
40
60
80
100
120
140
160
180
1000PEO40PBT60 1000PEO52PBT48 1000PEO64PBT36
Temperature [°C]
Sele
ctiv
ity C
O2/N
2
increasing PBT content
Temperature [°C]
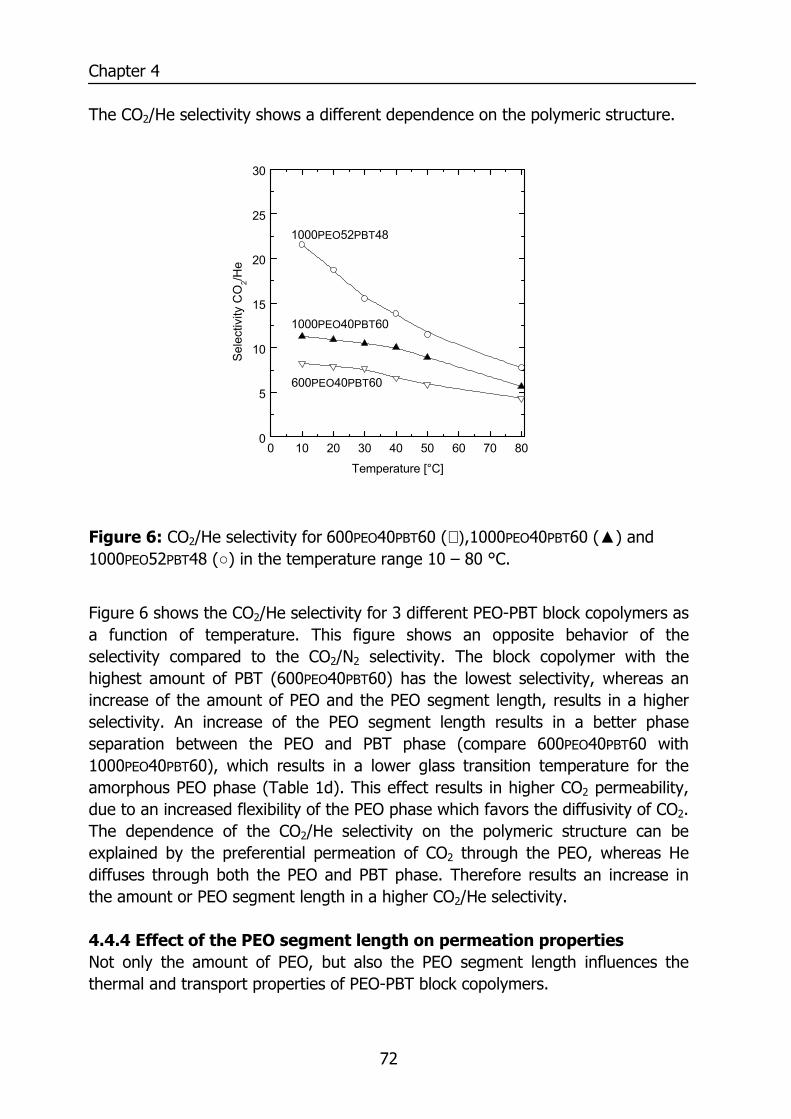
Chapter 4
72
The CO2/He selectivity shows a different dependence on the polymeric structure.
Figure 6: CO2/He selectivity for 600PEO40PBT60 (∇) ,1000PEO40PBT60 (▲) and 1000PEO52PBT48 (○) in the temperature range 10 – 80 °C.
Figure 6 shows the CO2/He selectivity for 3 different PEO-PBT block copolymers as a function of temperature. This figure shows an opposite behavior of the selectivity compared to the CO2/N2 selectivity. The block copolymer with the highest amount of PBT (600PEO40PBT60) has the lowest selectivity, whereas an increase of the amount of PEO and the PEO segment length, results in a higher selectivity. An increase of the PEO segment length results in a better phase separation between the PEO and PBT phase (compare 600PEO40PBT60 with 1000PEO40PBT60), which results in a lower glass transition temperature for the amorphous PEO phase (Table 1d). This effect results in higher CO2 permeability, due to an increased flexibility of the PEO phase which favors the diffusivity of CO2. The dependence of the CO2/He selectivity on the polymeric structure can be explained by the preferential permeation of CO2 through the PEO, whereas He diffuses through both the PEO and PBT phase. Therefore results an increase in the amount or PEO segment length in a higher CO2/He selectivity. 4.4.4 Effect of the PEO segment length on permeation properties Not only the amount of PEO, but also the PEO segment length influences the thermal and transport properties of PEO-PBT block copolymers.
0 10 20 30 40 50 60 70 800
5
10
15
20
25
30
600PEO40PBT60
1000PEO40PBT60
Sel
ectiv
ity C
O2/H
e
Temperature [°C]
1000PEO52PBT48
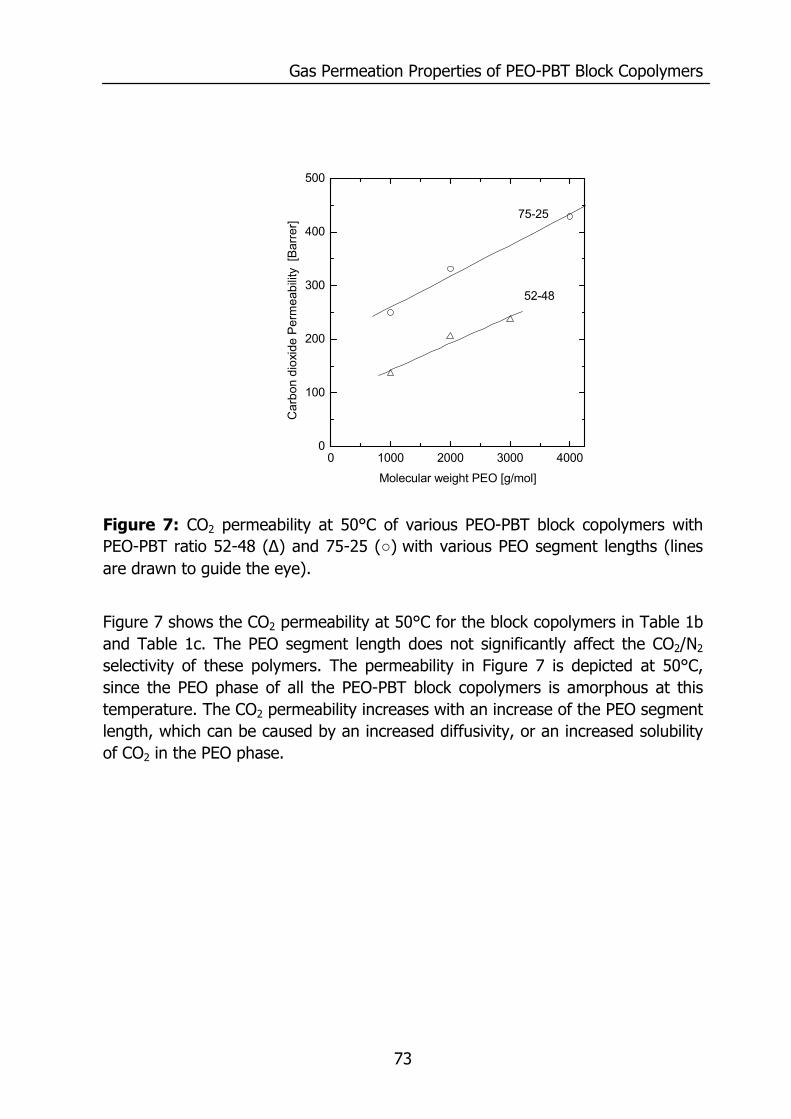
Gas Permeation Properties of PEO-PBT Block Copolymers
73
Figure 7: CO2 permeability at 50°C of various PEO-PBT block copolymers with PEO-PBT ratio 52-48 (∆) and 75-25 (○) with various PEO segment lengths (lines are drawn to guide the eye).
Figure 7 shows the CO2 permeability at 50°C for the block copolymers in Table 1b and Table 1c. The PEO segment length does not significantly affect the CO2/N2 selectivity of these polymers. The permeability in Figure 7 is depicted at 50°C, since the PEO phase of all the PEO-PBT block copolymers is amorphous at this temperature. The CO2 permeability increases with an increase of the PEO segment length, which can be caused by an increased diffusivity, or an increased solubility of CO2 in the PEO phase.
0 1000 2000 3000 40000
100
200
300
400
500
Car
bon
diox
ide
Perm
eabi
lity
[Bar
rer]
Molecular weight PEO [g/mol]
52-48
75-25
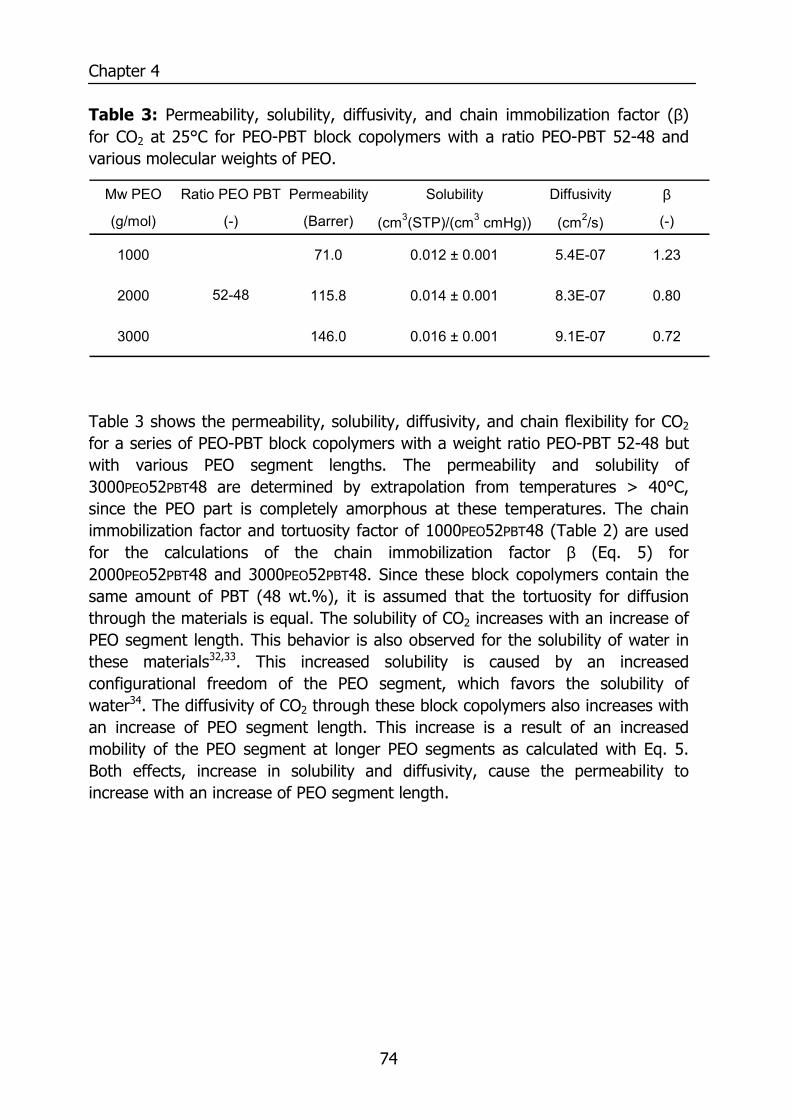
Chapter 4
74
Table 3: Permeability, solubility, diffusivity, and chain immobilization factor (β) for CO2 at 25°C for PEO-PBT block copolymers with a ratio PEO-PBT 52-48 and various molecular weights of PEO.
Table 3 shows the permeability, solubility, diffusivity, and chain flexibility for CO2 for a series of PEO-PBT block copolymers with a weight ratio PEO-PBT 52-48 but with various PEO segment lengths. The permeability and solubility of 3000PEO52PBT48 are determined by extrapolation from temperatures > 40°C, since the PEO part is completely amorphous at these temperatures. The chain immobilization factor and tortuosity factor of 1000PEO52PBT48 (Table 2) are used for the calculations of the chain immobilization factor β (Eq. 5) for 2000PEO52PBT48 and 3000PEO52PBT48. Since these block copolymers contain the same amount of PBT (48 wt.%), it is assumed that the tortuosity for diffusion through the materials is equal. The solubility of CO2 increases with an increase of PEO segment length. This behavior is also observed for the solubility of water in these materials32,33. This increased solubility is caused by an increased configurational freedom of the PEO segment, which favors the solubility of water34. The diffusivity of CO2 through these block copolymers also increases with an increase of PEO segment length. This increase is a result of an increased mobility of the PEO segment at longer PEO segments as calculated with Eq. 5. Both effects, increase in solubility and diffusivity, cause the permeability to increase with an increase of PEO segment length.
Mw PEO Ratio PEO PBT Permeability Solubility Diffusivity β
(g/mol) (-) (Barrer) (cm3(STP)/(cm3 cmHg)) (cm2/s) (-)
1000 71.0 0.012 ± 0.001 5.4E-07 1.23
2000 115.8 0.014 ± 0.001 8.3E-07 0.80
3000 146.0 0.016 ± 0.001 9.1E-07 0.72
52-48
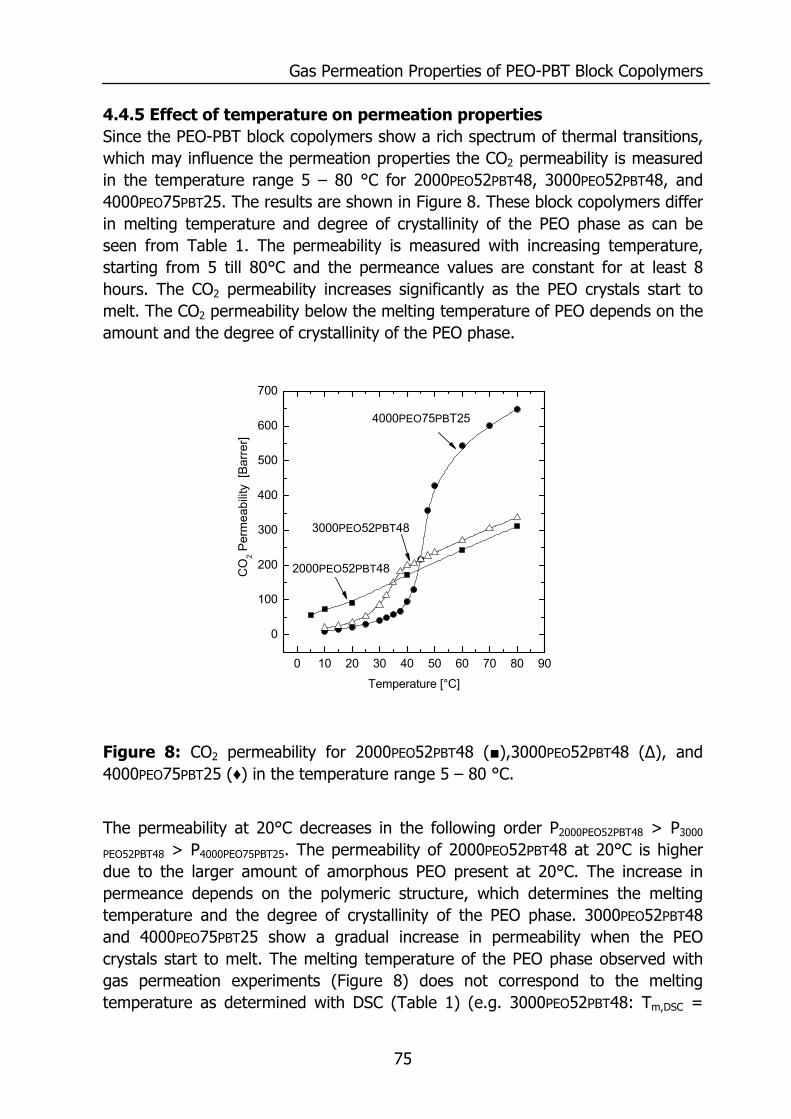
Gas Permeation Properties of PEO-PBT Block Copolymers
75
4.4.5 Effect of temperature on permeation properties Since the PEO-PBT block copolymers show a rich spectrum of thermal transitions, which may influence the permeation properties the CO2 permeability is measured in the temperature range 5 – 80 °C for 2000PEO52PBT48, 3000PEO52PBT48, and 4000PEO75PBT25. The results are shown in Figure 8. These block copolymers differ in melting temperature and degree of crystallinity of the PEO phase as can be seen from Table 1. The permeability is measured with increasing temperature, starting from 5 till 80°C and the permeance values are constant for at least 8 hours. The CO2 permeability increases significantly as the PEO crystals start to melt. The CO2 permeability below the melting temperature of PEO depends on the amount and the degree of crystallinity of the PEO phase.
Figure 8: CO2 permeability for 2000PEO52PBT48 (■),3000PEO52PBT48 (∆), and 4000PEO75PBT25 (♦) in the temperature range 5 – 80 °C.
The permeability at 20°C decreases in the following order P2000PEO52PBT48 > P3000
PEO52PBT48 > P4000PEO75PBT25. The permeability of 2000PEO52PBT48 at 20°C is higher due to the larger amount of amorphous PEO present at 20°C. The increase in permeance depends on the polymeric structure, which determines the melting temperature and the degree of crystallinity of the PEO phase. 3000PEO52PBT48 and 4000PEO75PBT25 show a gradual increase in permeability when the PEO crystals start to melt. The melting temperature of the PEO phase observed with gas permeation experiments (Figure 8) does not correspond to the melting temperature as determined with DSC (Table 1) (e.g. 3000PEO52PBT48: Tm,DSC =
0 10 20 30 40 50 60 70 80 90
0
100
200
300
400
500
600
700
CO
2 Per
mea
bilit
y [B
arre
r]
Temperature [°C]
4000PEO75PBT25
3000PEO52PBT48
2000PEO52PBT48
Chapter 4
76
19.5°C, Tm,gaspermeation = 35°C). Deviations between both experiments are caused by (a) different heating rates of the sample, and (b) different thermal history. The heating rate in the gas permeation experiments is much lower (< 1°C/hour), compared to the heating rate in DSC experiments (10°C/min). The low heating rate of the gas permeation experiments cause the PEO crystals to melt and recrystallize and thereby increasing the melting temperature of PEO. The thermal history of the samples is also very different. The samples analyzed by DSC have been cooled down to T = - 80°C. The films used for permeation are prepared at room temperature: any further cooling may stem from solvent evaporation, however the cooling is by no means comparable. 2000PEO52PBT48 does not show a sharp increase in permeability, because the PEO phase is still amorphous due to an insufficient temperature gradient to induce crystallization. Similar phenomena are also observed by Hirayama et. al.35 who observed hysteresis in the increase in permeance between heating and cooling runs. 4.5 Conclusions The gas transport properties of PEO-PBT block copolymers depend on their structure in the following way: The transport of CO2 and N2 occurs mainly through the amorphous PEO phase, whereas He permeates through both the amorphous PBT and PEO phase. This causes the CO2/He selectivity to decrease with increasing amounts of PBT. The increase of the amount of PBT at constant PEO segment length causes a less pronounced phase separation between the PEO and PBT phase. This lowers the permeability through the amorphous PEO phase more than when the PBT phase is considered as an impermeable barrier, using the Maxwell model, obstructing transport. The CO2/N2 selectivity increases with the amount of PBT, probably due to a different dependence of the diffusivity on the amount of PBT. An increase of the PEO segment length, at the same ratio PEO-PBT, elevates the chain flexibility of the PEO phase thereby causing a higher permeance. The degree of crystallinity and the melting temperature of the amorphous PEO phase, both determined by the amount and PEO segment length, affect the permeance. The melting temperature of the crystalline PEO phase increases with a higher amounts of PEO and larger PEO segments. 4.6 Acknowledgements The European Union is kindly acknowledged for supporting this project: Brite Euram III, Contract no. BRPR-CT 98-0804
Gas Permeation Properties of PEO-PBT Block Copolymers
77
4.7 References (1) Bondar, V. I.; Freeman, B. D.; Pinnau, I. J. Polym. Sci., Polym. Phys. Ed.
2000, 38, 2051-2062. (2) Bhide, B. D.; Voskericyan, A.; Stern, S. A. J. Membr. Sci. 1998, 140, 27-
49. (3) Metz, S. J.; Potreck, J.; Mulder, M. H. V.; Wessling, M. Desalination
2002, 148, 303-307. (4) Okamoto, K.; Fujii, M.; Okamyo, S.; Suzuki, H.; Tanaka, K.; Kita, H.
Macromolecules 1995, 28, 6950-6956. (5) Kim, J. H.; Ha, S. Y.; Lee, Y. M. J. Membr. Sci. 2001, 190, 179-193. (6) Barbi, V.; Funari, S. S.; Gehrke, R.; Scharnagl, N.; Stribeck, N.
Macromolecules 2003, 36, 749-758. (7) Bondar, V. I.; Freeman, B. D.; Pinnau, I. J. Polym. Sci., Polym. Phys. Ed.
1999, 37, 2463-2475. (8) Damain, C. E., E.; Cuney, S.; Pascault, J. P. J. Appl. Polym. Sci. 1997, 65,
2579-2587. (9) Bezemer, J. M. R., R. Grijpma, D.W. Dijkstra ,P.J. van Blitterswijk, C.A.,
Feijen, J. J. Controlled Release 2000, 67, 249-260. (10) Beumer, G. J.; Vanblitterswijk, C. A.; Ponec, M. J. Biomed. Mater. Res.
1994, 28, 545-552. (11) Radder, A. M.; Leenders, H.; vanBlitterswijk, C. A. J. Biomed. Mater. Res.
1996, 30, 341-351. (12) Gebben, B. J. Membr. Sci. 1996, 113, 323-329. (13) Fakirov, S.; Apostolov, A. A.; Boeseke, P.; Zachmann, H. G. J. Macromol.
Sci., Phys. 1990, B29, 379-395. (14) Michaels, A. S.; Bixler, H. J. J. Polym. Sci. 1961, 50, 393-412. (15) Michaels, A. S.; Bixler, H. J. J. Polym. Sci. 1961, 50, 413-439. (16) Barrer, R. M. Diffusion in polymers; Academic press: New York, 1968. (17) Merkel, T. C.; Freeman, B. D.; Spontak, R. J.; He, Z.; Pinnau, I.;
Meakin, P.; Hill, A. J. Science 2002, 296, 519-522. (18) Petropoulos, J. H. J. Polym. Sci., Polym. Phys. Ed. 1985, 23, 1309-1324. (19) Arnold, M. E.; Naga, i. K.; Freeman, B. D.; Spontak, R. J.; Betts, D. E.;
DeSimone, J. M.; Pinnau, I. Macromolecules 2001, 34, 5611-5619. (20) Fakirov, S.; Gogeva, T. Makromol. Chem. 1990, 191, 603-614. (21) Tsutsui, K.; Yoshimizu, H.; Tsujita, Y.; Kinoshita, T. J. Appl. Polym. Sci.
1999, 73, 2733-2738. (22) Meuleman, E. E. B.; Willemsen, J. H. A.; Mulder, M. H. V.; Strathmann,
H. J. Membr. Sci. 2001, 188, 235-249. (23) Wessling, M.; Lopez, M. L.; Strathmann, H. Sep. Purif. Technol. 2001,
24, 223-233.
Chapter 4
78
(24) Bos, A.; Punt, I. G. M.; Wessling, M.; Strathmann, H. J. Polym. Sci., Polym. Phys. Ed. 1998, 36, 1547-1556.
(25) Krause, B.; Sijbesma, H. J. P.; Munuklu, P.; van der Vegt, N. F. A.; Wessling, M. Macromolecules 2001, 34, 8792-8801.
(26) Fakirov, S.; Gogeva, T. Makromol. Chem. 1990, 191, 615-624. (27) Breck, D. W. Zeolite molecular sieves: structure, chemistry, and use;
Wiley: New York, 1974. (28) Koros, W. J.; Hellums, M. W. In Encyclopedia of polymer science and
engineering; Kroschwitz, J. I., Ed.; Wiley: New York, 1990; pp 724-802. (29) Mulder, M. H. V. Basic principles of membrane technology, second ed.;
Kluwer: Dordrecht, 1996. (30) Bondar , V. I. F., B. D.;Pinnau, I. J. Polym. Sci., Polym. Phys. Ed.2000,
38, 2051-2062. (31) Ho, W. S. W.; Sirkar, K. K. Membrane Handbook; Van Nostrand Reinhold:
New York, 1992. (32) Bezemer, J. M.; Grijpma, D. W.; Dijkstra, P. J.; van Blitterswijk, C. A.;
Feijen, J. J. Controlled Release 1999, 62, 393-405. (33) Deschamps, A. A.; Grijpma, D. W.; Feijen, J. Polymer 2001, 42, 9335-
9345. (34) Metz, S. J.; van der Vegt, N. F. A.; Mulder, M. H. V.; Wessling, M.
Chapter 5. (35) Hirayama, Y.; Kase, Y.; Tanihara, R.; Sumiyama, Y.; Kusuki, Y.;
Haraya, K. J. Membr. Sci. 1999, 160, 1.
79
Chapter 5
Thermodynamics of Water Vapor Sorption in Poly(Ethylene Oxide)
Poly(Butylene Terephthalate) Block copolymers
Abstract This chapter studies: (a) the influence of the composition of poly(ethylene oxide) (PEO) poly(butylene terephthalate) (PBT) block copolymers on the solubility of water vapor, (b) the thermodynamic quantities governing the solubility of water vapor in these polymers. The block copolymers examined differ with respect to their hydrophilic block length (PEO segment) and the weight ratio between the hard hydrophobic PBT segment and the soft hydrophilic PEO segment. Water sorption isotherms, determined gravimetrically, are of Flory-Huggins type exhibiting a linear relation between weight uptake and vapor activity at low activities and a sharp increase (convex shape) at higher activities. The Flory-Huggins interaction parameter decreases as the concentration of water inside the polymer increases. Its numerical value strongly depends on the polymeric structure: an increase of the soft hydrophilic PEO block length and PEO content both lead to a decrease of the interaction parameter. Solvation Gibbs energies, entropies and enthalpies, extracted from temperature dependent sorption data, reveal that: (1) water-polymer interactions are stronger than water-water interactions in liquid water, (2) the water-polymer interactions become weaker at higher water vapor activities, (3) the water sorption entropy increases with increasing vapor activity. The last observation (3) is responsible for the convex nature of the water sorption isotherm. Moreover, this effect depends on the structure of the polymer: the larger the PEO segment length and more PEO weight fraction the higher the solvation entropy and, consequently, the solubility of water vapor in the PEO-PBT block copolymer.
Chapter 5
80
5.1 Introduction Solute transport in polymeric materials, in particular in polymer membranes, occurs via the so-called solution diffusion mechanism: a solute dissolves at the polymer interface, diffuses through the material and desorbs at the opposite side. A specific component can selectively be removed from a molecular mixture when its solubility and/or diffusion coefficient in the polymeric phase is higher than that of the other components. Applications based on this separation mechanism can be found in membrane based gas separation, pervaporation, and vapor permeation. Sorption models are often used to describe the solubility of solutes in polymers. At low solute concentrations Henry’s law describes the concentration of a gas or vapor in a rubbery polymer: the solubility coefficient, defined as the concentration of dissolved vapor divided by the equilibrium vapor pressure, is independent of the solute concentration. Rubbery and glassy polymers demonstrate, especially at high gas or vapor concentrations, non-ideal behavior leading to increased solubility coefficients and sorption isotherms that are convex to the relative pressure axis. Such non-ideal sorption behavior can often described with Flory-Huggins thermodynamics1-14, however, often requires researchers to invoke a concentration dependent polymer-solute interaction parameter. The concentration dependence of the interaction parameter, often obtained by fitting or through the use of empirical expressions, hampers physical chemical interpretations of the nature of the sorption process. We study the solubility of water vapor in a series of poly(ethylene oxide) (PEO) poly(butylene terephthalate) (PBT) block copolymers. These polymers are promising candidates for membrane-based separations targeting the removal of water vapor from gas streams as they demonstrate high water vapor solubility, as we will show below. We report the influence of the polymeric structure on the solubility of water vapor. The data are analyzed using the classical Flory-Huggins sorption model commonly used for fitting sorption isotherms1-14 as well as an approach based on solvation thermodynamics15,16. The latter approach reveals relations between the polymer structure and the free energy, enthalpy and entropy of interaction with water. The Flory-Huggins model cannot adequately account for such contributions, which we will show to be important to adequately interpret trends in the water vapor solubility. 5.2 Experimental section 5.2.1 Materials The PEO-PBT block copolymers were obtained from Isotis b.v. (the Netherlands) and were used without further purification. Chloroform (CHCl3) and trifluoroacetic acid (TFA) were both purchased from Merck (analytical grade) and used as

Thermodynamics of Water Vapor Sorption in PEO PBT Block copolymers
81
solvents. Nitrogen (N2, 99,9%) was purchased from Hoekloos b.v. Demineralized water was used for the sorption experiments. 5.2.2 PEO-PBT block copolymers PEO-PBT block copolymers belong to the class of multi block copolymers, and their schematic chemical structure of is depicted in Figure 1:
CC O
OO* CH2 O4
C
O
C
O
O CH2 CH2 O *m
X Y
Figure 1: Chemical structure of the PEO-PBT block copolymer
The PEO-PBT block copolymer consists of a hard hydrophobic PBT segment (x) and a soft hydrophilic PEO segment (y) with a certain molecular weight of PEO (m). The various block copolymers can be identified with the following notation: mPEOyPBTx, where m is the molecular weight of the PEO segment, y the weight percentage PEO and x the weight percentage PBT present in the block copolymer. PEO-PBT block copolymers used in this work are: 1000PEO52PBT48, 2000PEO52PBT48, 3000PEO52PBT48, and 1000PEO64PBT36 and their thermal properties are described elsewhere17. 5.2.3 Film preparation The PEO-PBT block copolymers were dissolved in CHCl3 and TFA was added (± 4 volume % in chloroform) when the weight ratio of PEO in the block copolymer was lower than 50 wt%. Thin films of around 50 µm were prepared by solution casting on a glass plate. The cast films were dried in a N2 atmosphere at room temperature for 24 hours. The homogeneous dense films were removed from the glass plate with the help of a small amount of water and were further dried and stored in a vacuum oven at 30°C for further use. 5.2.4 Proton NMR Proton NMR measurements were performed in order to determine the exact weight ratio between the soft PEO and the hard PBT phase as described by Fakirov18. The manufacturer (Isotis b.v.) determined the molecular weight of the PEO segment. 5.2.5 Differential Scanning Calometry (DSC) Thermal properties of the segmented PEO-PBT block copolymers were determined using a DSC7 (Perkin Elmer). Indium and cyclohexane were used for calibration. The amount of polymer used was 5 – 10 mg. The samples were dried in a vacuum
Chapter 5
82
oven at 30°C and a dry N2 atmosphere was used in the DSC experiments, preventing water vapor affecting the measurements. The thermal properties were determined from the second heating scan (heating rate of 10°C/min), in the temperature range from –80°C to +250°C. The glass transition temperature was determined from the midpoint of the heat capacity change and the melting temperature was determined from the onset of melting. 5.2.6 Sorption isotherms An electro balance (TGA Perkin Elmer) was used to perform the gravimetric sorption experiments and is described also elsewhere19,20. The concentration of water inside the polymeric film was determined from the mass uptake due to sorption and was calculated by using the following equation21:
( )pw
i
VMMM
c⋅⋅−= ∞ 22414 (1)
where c is the equilibrium concentration of water inside the polymeric film [cm3(STP)]/cm3polymer], ∞M and iM are the final and initial mass of the
polymer, respectively, Mw is the molecular weight of the penetrant, Vp the volume of the polymer and 22414 the volume (units cm3) of 1 mol penetrant at standard temperature and pressure. Sorption isotherms of water vapor in ethyl cellulose were determined and compared with literature data. The results of the sorption isotherm and the diffusion coefficient calculated from the sorption kinetics were in good comparison with literature data22. 5.3 Theory 5.3.1 Flory-Huggins sorption model The Flory-Huggins theory7 is frequently used to fit the sorption isotherms of vapor penetrants in polymers1-14. This theory uses a lattice model to account for the entropy effects of mixing and requires the interaction parameter χ for the mixing enthalpy. According to this theory the excess chemical potential (RT lnas) of a penetrant dissolved in a polymer matrix of infinite molecular weight can be written as:
( ) ( )[ ]21 ppps lnRTalnRT χφ+φ+φ−= (2)
with as being the vapor activity, φp the polymer volume fraction, χ the parameter related to the interaction Helmholz energy of the first neighbors, R the universal
Thermodynamics of Water Vapor Sorption in PEO PBT Block copolymers
83
gas constant, and T the temperature. Although χ was originally introduced as a system constant, many experimental measurements have shown this parameter to be concentration dependent for a successful fit. 5.3.2 Solvation thermodynamics To characterize the physical-chemical interactions of water with the PEO-PBT block copolymer thermodynamic solvation quantities need to be extracted from the experimental data. These quantities involve the thermodynamic work involved in the process of transferring a water molecule from the vapor phase into the PEO-PBT matrix (i.e. the solvation Gibbs energy) together with its enthalpic and entropic components. These thermodynamic data allow a simple and unambiguous (model independent) interpretation unlike the Flory-Huggings interaction parameter commonly reported in vapor sorption studies1-14. Following Ben-Naim’s convention16, the solvation Gibbs energy, ∆Gs
*, has been defined as the Gibbs energy change for transferring a solute molecule S (water) from a fixed position in the vapor phase to a fixed position in the polymer at constant pressure P, temperature T, and composition. This quantity, which has been proven to be “the only genuine measure of the average free energy of interaction of a single (solute) molecule with its surrounding”15, is directly accessible from equilibrium sorption data according to16,23.
)Lln(RT
lnRTGeq
igs
s*s
−≡
ρρ−=∆
(3)
In eq. (3) ρs and ρs
ig are the solute molar densities [mol/cm3] in the polymer and vapor phase, respectively. ρs is determined gravimetrically (cf. experimental section), whereas ρs
ig =pH2O/RT, where we assume ideal gas behavior of the vapor phase. The subscript eq indicates that both phases are at equilibrium. The ratio of these two equilibrium molar densities is usually referred to as the Ostwald solubility L. ∆Gs
* is the solute free energy of interaction with the environment it is transferred into. Theoretically, ∆Gs
* can be broken up into two parts by writing ∆Gs
*=∆G*cavity+∆G*
interactions 23. The cavity term reflects the work invested to create a molecular sized cavity of suitable size and shape and is always positive. The interaction term reflects the work released due to solute polymer interactions established when introducing the solute and is always negative. When weakly
Chapter 5
84
interacting gases are dissolved in a rubbery polymer (for example poly(ethylene)23), cavity formation dominates and ∆Gs
* is positive. Stronger interacting gases such as CO2 give rise to negative values of ∆Gs
*23. The stronger polar (hydrogen bonding) interactions between water and PEO-PBT give rise to negative values of the solvation Gibbs energy presented later on in this chapter. The solvation entropy ∆Ss
* and solvation enthalpy ∆Hs* can be obtained from the
temperature dependence of ∆Gs*. This information is obtained from the
temperature dependence of the vapor sorption isotherms in which the solute concentration in the polymer is presented versus the vapor activity a=pH2O/pH2O,sat. The iso-steric heat of water sorption ∆Hc is defined as24:
R/HTaln
cc,P
∆=
∂∂1
(4)
and is directly accessible from vapor sorption isotherms obtained at different temperatures. The relation between ∆Hc and ∆Hc
* is derived below. Again assuming the vapor phase to behave ideal and using the definition of the Ostwald solubility L (eq. 3) we can write:
LpRT
pp
asat,OH
s
sat,OH
OH
22
2 ρ== (5)
Substituting the right-hand-side of eq. (5) into eq. (4) yields
[ ] ( )c,P
c,P
sat,OHs
c,P TLln
T
p/RTln
Taln
∂∂−
∂
ρ∂=
∂∂
1112
(6)
The first term at the right-hand-side of eq. (6) can be evaluated by employing the Clausius-Clapeyron relation to the temperature dependence of the saturated water vapor pressure and equals (∆Hvap-RT)/R. Using lnL=-∆Gs
*/RT (eq. 3) and invoking the Gibbs-Helmholtz relation, the second term on the rhs of eq. (6) relates to ∆Hs
*/R. Hence, we obtain:
RRTHH
Taln *
svap
c,P
−∆+∆=
∂∂1
(7)
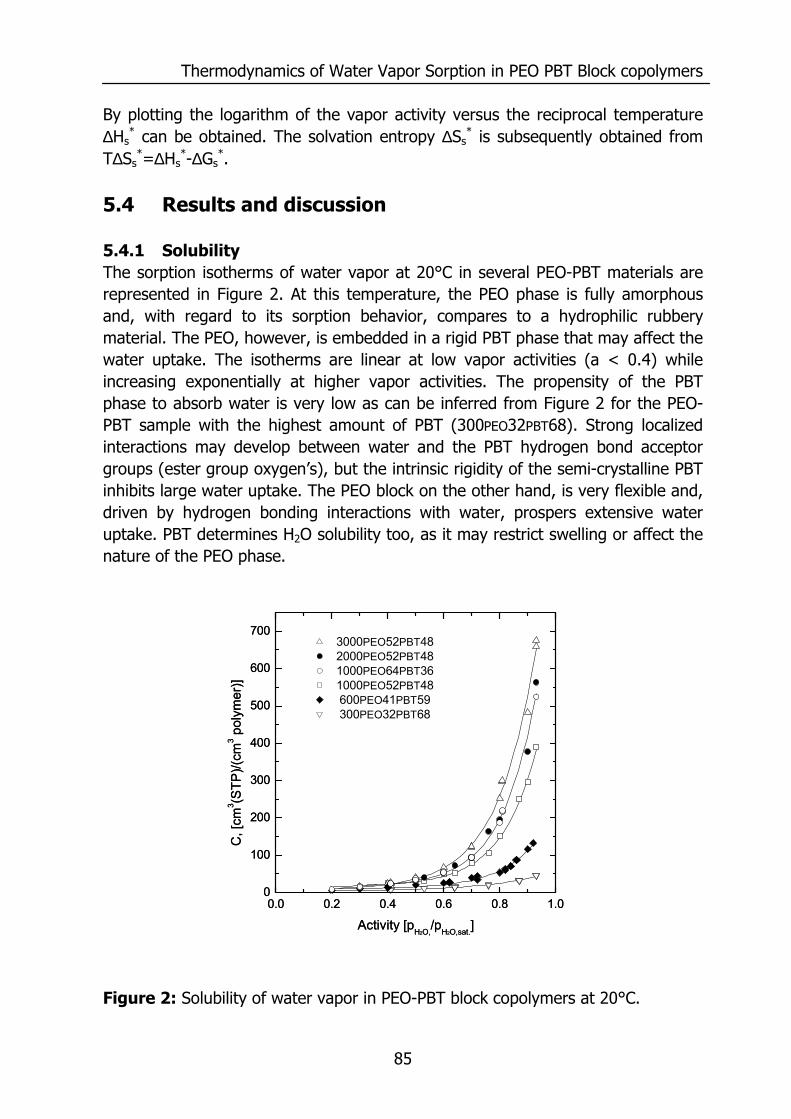
Thermodynamics of Water Vapor Sorption in PEO PBT Block copolymers
85
By plotting the logarithm of the vapor activity versus the reciprocal temperature ∆Hs
* can be obtained. The solvation entropy ∆Ss* is subsequently obtained from
T∆Ss*=∆Hs
*-∆Gs*.
5.4 Results and discussion 5.4.1 Solubility The sorption isotherms of water vapor at 20°C in several PEO-PBT materials are represented in Figure 2. At this temperature, the PEO phase is fully amorphous and, with regard to its sorption behavior, compares to a hydrophilic rubbery material. The PEO, however, is embedded in a rigid PBT phase that may affect the water uptake. The isotherms are linear at low vapor activities (a < 0.4) while increasing exponentially at higher vapor activities. The propensity of the PBT phase to absorb water is very low as can be inferred from Figure 2 for the PEO-PBT sample with the highest amount of PBT (300PEO32PBT68). Strong localized interactions may develop between water and the PBT hydrogen bond acceptor groups (ester group oxygen’s), but the intrinsic rigidity of the semi-crystalline PBT inhibits large water uptake. The PEO block on the other hand, is very flexible and, driven by hydrogen bonding interactions with water, prospers extensive water uptake. PBT determines H2O solubility too, as it may restrict swelling or affect the nature of the PEO phase.
Figure 2: Solubility of water vapor in PEO-PBT block copolymers at 20°C.
0.0 0.2 0.4 0.6 0.8 1.00
100
200
300
400
500
600
700
0.0 0.2 0.4 0.6 0.8 1.00
100
200
300
400
500
600
700
C, [
cm3 (S
TP)/(
cm3 p
olym
er)]
Activity [pH2O,/pH2O,sat.]
3000PEO52PBT48 2000PEO52PBT48 1000PEO64PBT36 1000PEO52PBT48 600PEO41PBT59 300PEO32PBT68
C, [
cm3 (S
TP)/(
cm3 p
olym
er)]
Activity [pH2O,/pH2O,sat.]
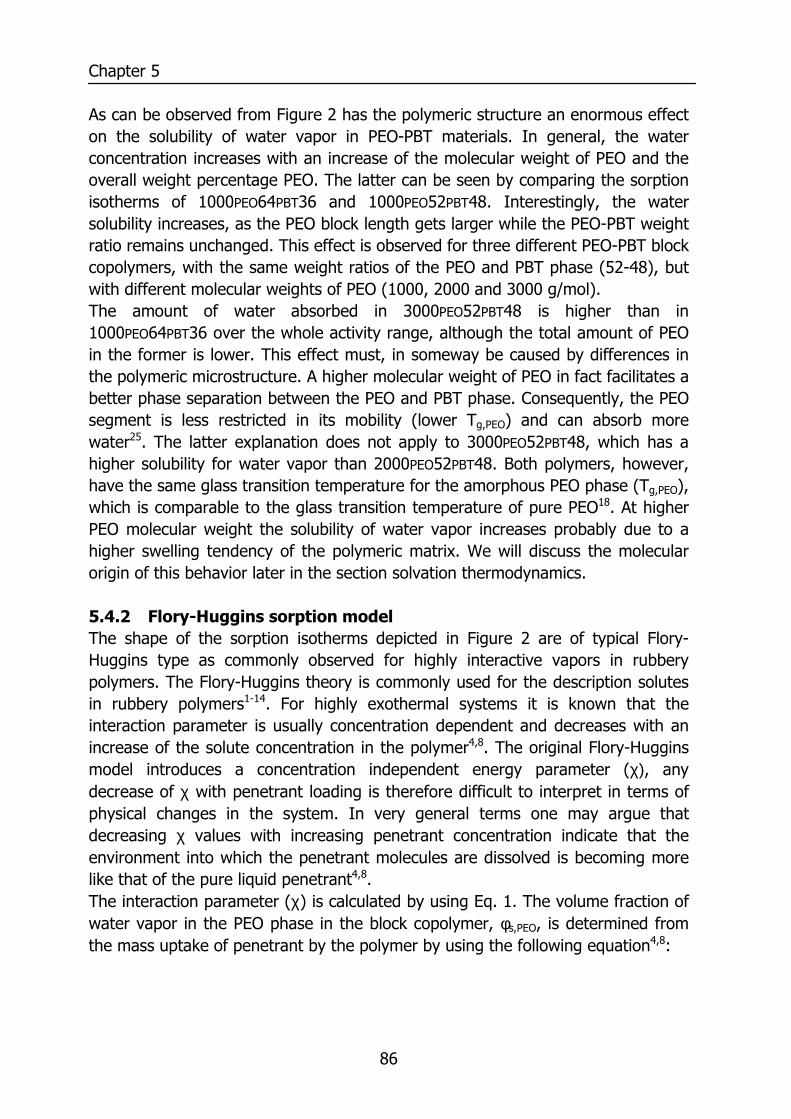
Chapter 5
86
As can be observed from Figure 2 has the polymeric structure an enormous effect on the solubility of water vapor in PEO-PBT materials. In general, the water concentration increases with an increase of the molecular weight of PEO and the overall weight percentage PEO. The latter can be seen by comparing the sorption isotherms of 1000PEO64PBT36 and 1000PEO52PBT48. Interestingly, the water solubility increases, as the PEO block length gets larger while the PEO-PBT weight ratio remains unchanged. This effect is observed for three different PEO-PBT block copolymers, with the same weight ratios of the PEO and PBT phase (52-48), but with different molecular weights of PEO (1000, 2000 and 3000 g/mol). The amount of water absorbed in 3000PEO52PBT48 is higher than in 1000PEO64PBT36 over the whole activity range, although the total amount of PEO in the former is lower. This effect must, in someway be caused by differences in the polymeric microstructure. A higher molecular weight of PEO in fact facilitates a better phase separation between the PEO and PBT phase. Consequently, the PEO segment is less restricted in its mobility (lower Tg,PEO) and can absorb more water25. The latter explanation does not apply to 3000PEO52PBT48, which has a higher solubility for water vapor than 2000PEO52PBT48. Both polymers, however, have the same glass transition temperature for the amorphous PEO phase (Tg,PEO), which is comparable to the glass transition temperature of pure PEO18. At higher PEO molecular weight the solubility of water vapor increases probably due to a higher swelling tendency of the polymeric matrix. We will discuss the molecular origin of this behavior later in the section solvation thermodynamics. 5.4.2 Flory-Huggins sorption model The shape of the sorption isotherms depicted in Figure 2 are of typical Flory-Huggins type as commonly observed for highly interactive vapors in rubbery polymers. The Flory-Huggins theory is commonly used for the description solutes in rubbery polymers1-14. For highly exothermal systems it is known that the interaction parameter is usually concentration dependent and decreases with an increase of the solute concentration in the polymer4,8. The original Flory-Huggins model introduces a concentration independent energy parameter (χ), any decrease of χ with penetrant loading is therefore difficult to interpret in terms of physical changes in the system. In very general terms one may argue that decreasing χ values with increasing penetrant concentration indicate that the environment into which the penetrant molecules are dissolved is becoming more like that of the pure liquid penetrant4,8. The interaction parameter (χ) is calculated by using Eq. 1. The volume fraction of water vapor in the PEO phase in the block copolymer, φs,PEO, is determined from the mass uptake of penetrant by the polymer by using the following equation4,8:
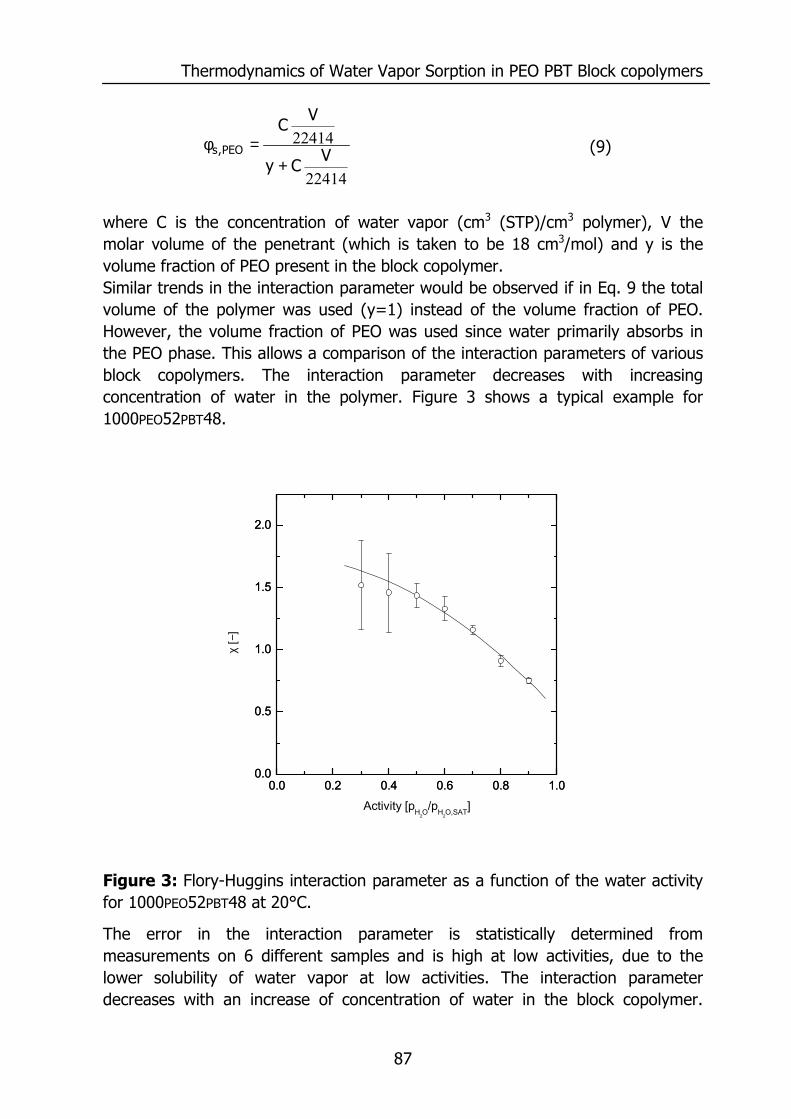
Thermodynamics of Water Vapor Sorption in PEO PBT Block copolymers
87
22414
22414V
Cy
VC
PEO,s+
=φ (9)
where C is the concentration of water vapor (cm3 (STP)/cm3 polymer), V the molar volume of the penetrant (which is taken to be 18 cm3/mol) and y is the volume fraction of PEO present in the block copolymer. Similar trends in the interaction parameter would be observed if in Eq. 9 the total volume of the polymer was used (y=1) instead of the volume fraction of PEO. However, the volume fraction of PEO was used since water primarily absorbs in the PEO phase. This allows a comparison of the interaction parameters of various block copolymers. The interaction parameter decreases with increasing concentration of water in the polymer. Figure 3 shows a typical example for 1000PEO52PBT48.
Figure 3: Flory-Huggins interaction parameter as a function of the water activity for 1000PEO52PBT48 at 20°C.
The error in the interaction parameter is statistically determined from measurements on 6 different samples and is high at low activities, due to the lower solubility of water vapor at low activities. The interaction parameter decreases with an increase of concentration of water in the block copolymer.
0.0 0.2 0.4 0.6 0.8 1.00.0
0.5
1.0
1.5
2.0
0.0 0.2 0.4 0.6 0.8 1.00.0
0.5
1.0
1.5
2.0
χ [−
]
Activity [pH2O/pH2O,SAT]
Chapter 5
88
Comparable trends are also observed for other polymer water vapor systems such as: ethyl cellulose water1,8 cellulose nitrate and cellulose acetate water6. Figure 4 shows the interaction parameter (χ) for different PEO-PBT block copolymers differing in molecular weight of the PEO block and ratio between the PEO and PBT phase.
Figure 4: Interaction parameter for water vapor in different PEO-PBT block copolymers at 20°C.
Again for all PEO-PBT block copolymers the interaction parameter decreases with activity. The interaction parameter, amounts to χ = 2 at low activities and decreases at higher activities to a value of 0.5, indicating that sorption becomes energetically more favorable. Furthermore, there is a dependence of the interaction parameter on the molecular weight of the PEO segment. The higher the molecular weight of the PEO part the lower the value for the interaction parameter and the more energetically favorable it is for the water molecule to be in the polymeric matrix. The exact physical background of the decreasing interaction parameter with activity is difficult to explain, in particular since the interaction parameter (χ) contains both enthalpic and entropic contributions5. Whether this decrease in interaction parameter with increasing activity is due to an average stronger binding of the water vapor molecule with the swollen polymeric matrix or due to more favorable entropic contributions is still unclear and cannot be directly deduced from the Flory Huggins model.
0.0 0.2 0.4 0.6 0.8 1.00.0
0.5
1.0
1.5
2.0
300PEO32PBT68 600PEO41PBT59 1000PEO52PBT48 1000PEO64PBT36 2000PEO52PBT48 3000PEO52PBT48
Mw PEO = 3000
Mw PEO = 1000
Mw PEO = 600
Mw PEO = 300
χ
[−]
Activity [pH2O/pH2O, SAT.]
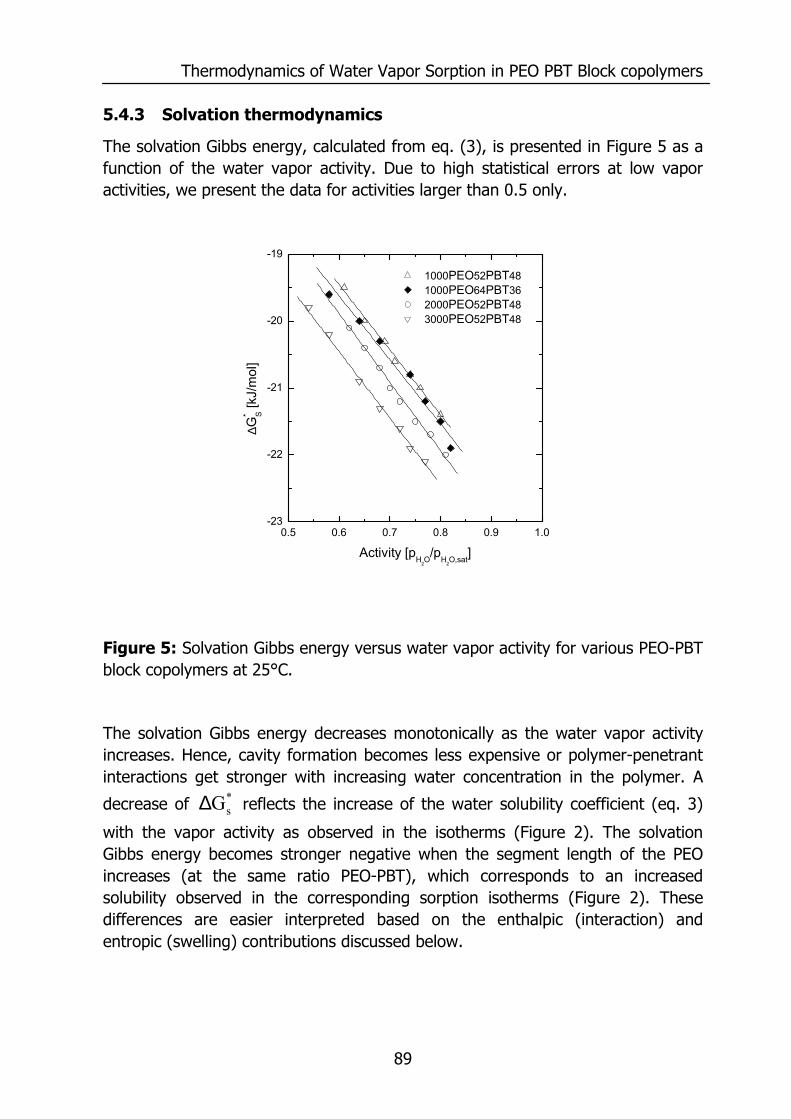
Thermodynamics of Water Vapor Sorption in PEO PBT Block copolymers
89
5.4.3 Solvation thermodynamics
The solvation Gibbs energy, calculated from eq. (3), is presented in Figure 5 as a function of the water vapor activity. Due to high statistical errors at low vapor activities, we present the data for activities larger than 0.5 only.
Figure 5: Solvation Gibbs energy versus water vapor activity for various PEO-PBT block copolymers at 25°C.
The solvation Gibbs energy decreases monotonically as the water vapor activity increases. Hence, cavity formation becomes less expensive or polymer-penetrant interactions get stronger with increasing water concentration in the polymer. A
decrease of *sG∆ reflects the increase of the water solubility coefficient (eq. 3)
with the vapor activity as observed in the isotherms (Figure 2). The solvation Gibbs energy becomes stronger negative when the segment length of the PEO increases (at the same ratio PEO-PBT), which corresponds to an increased solubility observed in the corresponding sorption isotherms (Figure 2). These differences are easier interpreted based on the enthalpic (interaction) and entropic (swelling) contributions discussed below.
0.5 0.6 0.7 0.8 0.9 1.0-23
-22
-21
-20
-19
1000PEO52PBT48 1000PEO64PBT36 2000PEO52PBT48 3000PEO52PBT48
∆G
* S [kJ/
mol
]
Activity [pH2O/pH2O,sat]
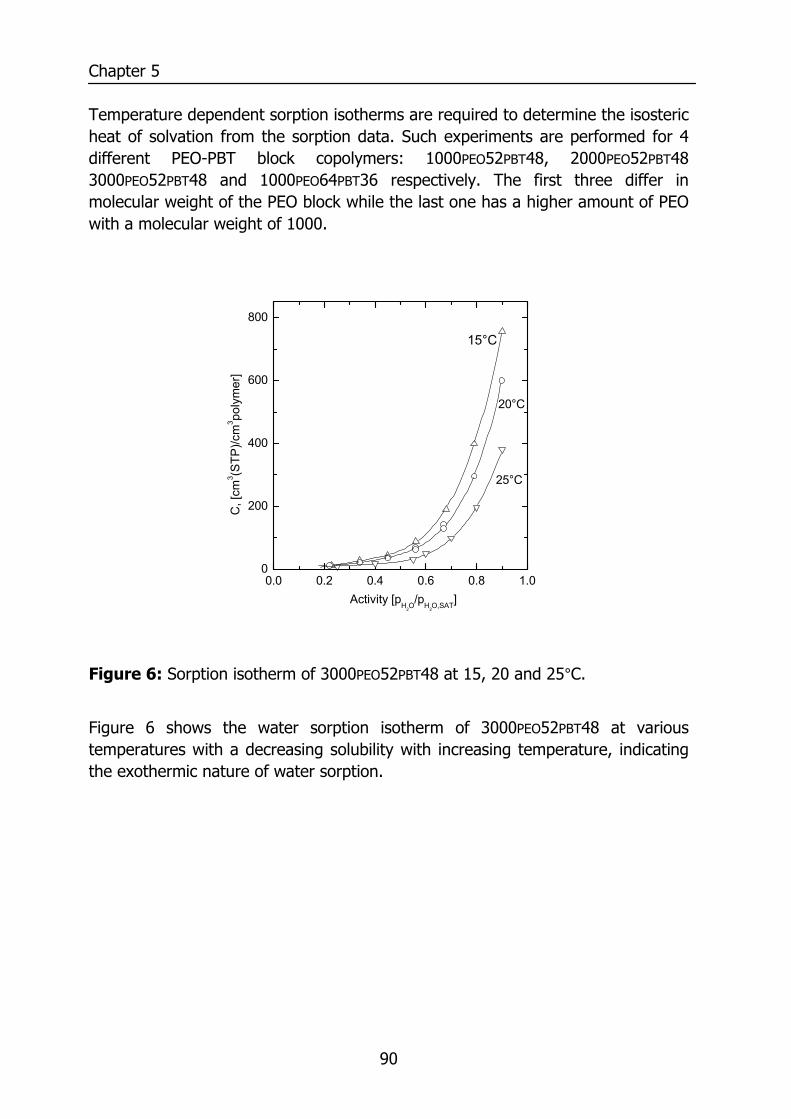
Chapter 5
90
Temperature dependent sorption isotherms are required to determine the isosteric heat of solvation from the sorption data. Such experiments are performed for 4 different PEO-PBT block copolymers: 1000PEO52PBT48, 2000PEO52PBT48 3000PEO52PBT48 and 1000PEO64PBT36 respectively. The first three differ in molecular weight of the PEO block while the last one has a higher amount of PEO with a molecular weight of 1000.
Figure 6: Sorption isotherm of 3000PEO52PBT48 at 15, 20 and 25°C.
Figure 6 shows the water sorption isotherm of 3000PEO52PBT48 at various temperatures with a decreasing solubility with increasing temperature, indicating the exothermic nature of water sorption.
0.0 0.2 0.4 0.6 0.8 1.00
200
400
600
800
25°C
20°C
C, [
cm3 (S
TP)/c
m3 po
lym
er]
15°C
Activity [pH2O/pH2O,SAT]
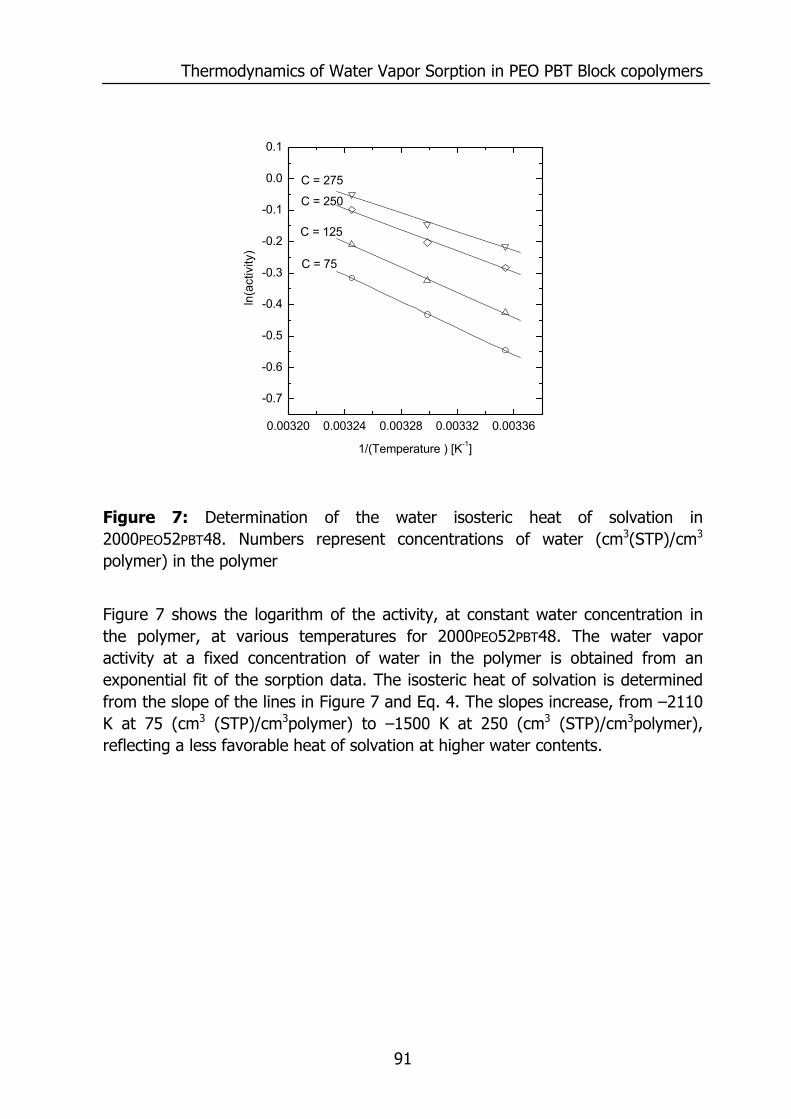
Thermodynamics of Water Vapor Sorption in PEO PBT Block copolymers
91
Figure 7: Determination of the water isosteric heat of solvation in 2000PEO52PBT48. Numbers represent concentrations of water (cm3(STP)/cm3 polymer) in the polymer
Figure 7 shows the logarithm of the activity, at constant water concentration in the polymer, at various temperatures for 2000PEO52PBT48. The water vapor activity at a fixed concentration of water in the polymer is obtained from an exponential fit of the sorption data. The isosteric heat of solvation is determined from the slope of the lines in Figure 7 and Eq. 4. The slopes increase, from –2110 K at 75 (cm3 (STP)/cm3polymer) to –1500 K at 250 (cm3 (STP)/cm3polymer), reflecting a less favorable heat of solvation at higher water contents.
0.00320 0.00324 0.00328 0.00332 0.00336
-0.7
-0.6
-0.5
-0.4
-0.3
-0.2
-0.1
0.0
0.1
C = 275
C = 250
C = 125
ln(a
ctiv
ity)
1/(Temperature ) [K-1]
C = 75
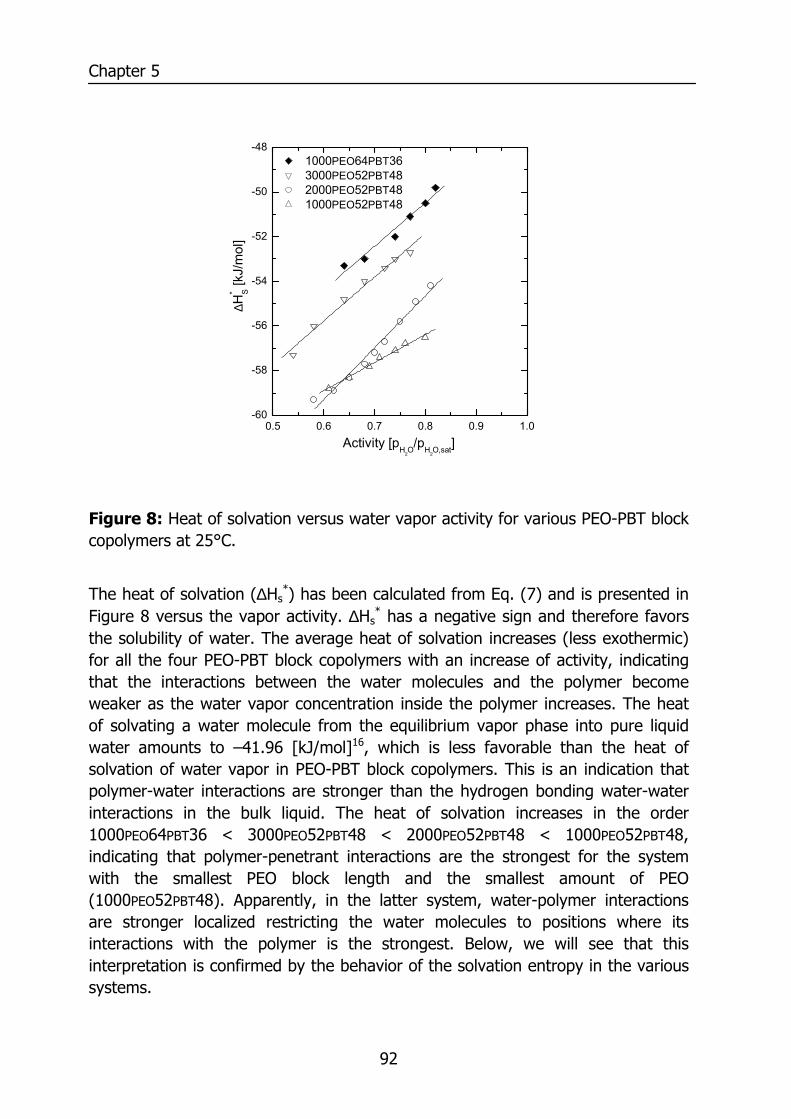
Chapter 5
92
Figure 8: Heat of solvation versus water vapor activity for various PEO-PBT block copolymers at 25°C.
The heat of solvation (∆Hs
*) has been calculated from Eq. (7) and is presented in Figure 8 versus the vapor activity. ∆Hs
* has a negative sign and therefore favors the solubility of water. The average heat of solvation increases (less exothermic) for all the four PEO-PBT block copolymers with an increase of activity, indicating that the interactions between the water molecules and the polymer become weaker as the water vapor concentration inside the polymer increases. The heat of solvating a water molecule from the equilibrium vapor phase into pure liquid water amounts to –41.96 [kJ/mol]16, which is less favorable than the heat of solvation of water vapor in PEO-PBT block copolymers. This is an indication that polymer-water interactions are stronger than the hydrogen bonding water-water interactions in the bulk liquid. The heat of solvation increases in the order 1000PEO64PBT36 < 3000PEO52PBT48 < 2000PEO52PBT48 < 1000PEO52PBT48, indicating that polymer-penetrant interactions are the strongest for the system with the smallest PEO block length and the smallest amount of PEO (1000PEO52PBT48). Apparently, in the latter system, water-polymer interactions are stronger localized restricting the water molecules to positions where its interactions with the polymer is the strongest. Below, we will see that this interpretation is confirmed by the behavior of the solvation entropy in the various systems.
0.5 0.6 0.7 0.8 0.9 1.0-60
-58
-56
-54
-52
-50
-48 1000PEO64PBT36 3000PEO52PBT48 2000PEO52PBT48 1000PEO52PBT48
∆H* S [k
J/m
ol]
Activity [pH2O/pH2O,sat]
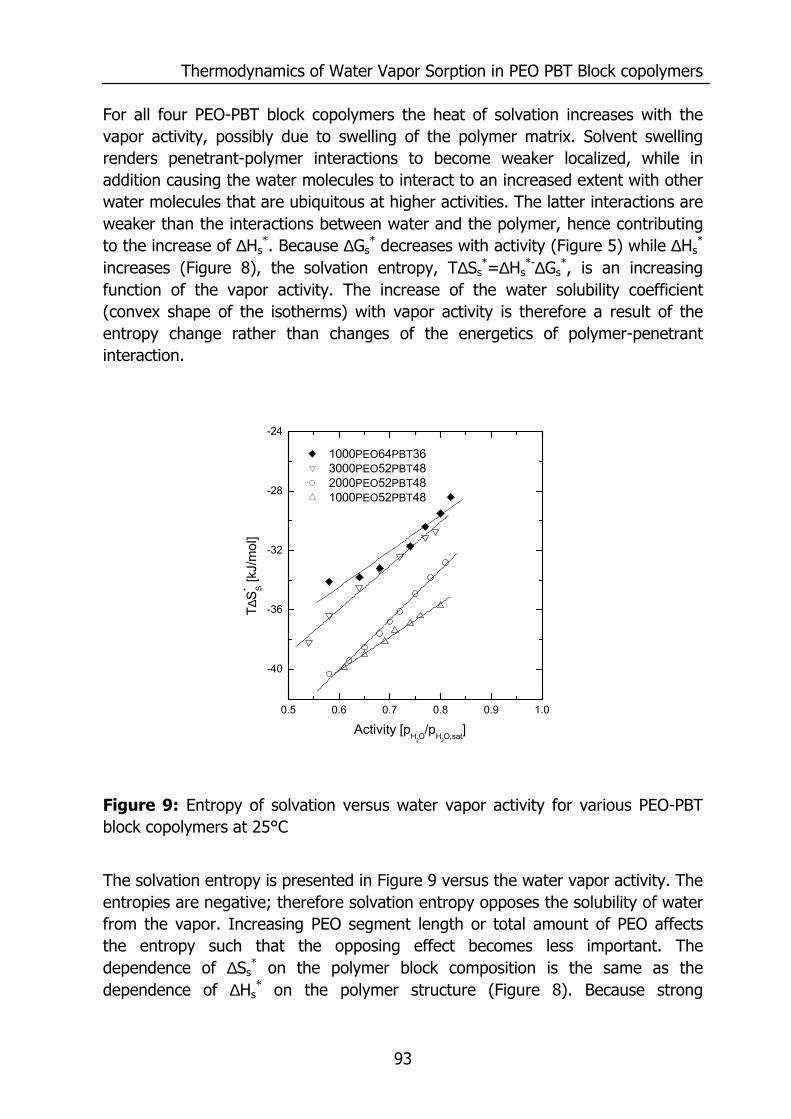
Thermodynamics of Water Vapor Sorption in PEO PBT Block copolymers
93
For all four PEO-PBT block copolymers the heat of solvation increases with the vapor activity, possibly due to swelling of the polymer matrix. Solvent swelling renders penetrant-polymer interactions to become weaker localized, while in addition causing the water molecules to interact to an increased extent with other water molecules that are ubiquitous at higher activities. The latter interactions are weaker than the interactions between water and the polymer, hence contributing to the increase of ∆Hs
*. Because ∆Gs* decreases with activity (Figure 5) while ∆Hs
* increases (Figure 8), the solvation entropy, T∆Ss
*=∆Hs*-∆Gs
*, is an increasing function of the vapor activity. The increase of the water solubility coefficient (convex shape of the isotherms) with vapor activity is therefore a result of the entropy change rather than changes of the energetics of polymer-penetrant interaction.
Figure 9: Entropy of solvation versus water vapor activity for various PEO-PBT block copolymers at 25°C
The solvation entropy is presented in Figure 9 versus the water vapor activity. The entropies are negative; therefore solvation entropy opposes the solubility of water from the vapor. Increasing PEO segment length or total amount of PEO affects the entropy such that the opposing effect becomes less important. The dependence of ∆Ss
* on the polymer block composition is the same as the dependence of ∆Hs
* on the polymer structure (Figure 8). Because strong
0.5 0.6 0.7 0.8 0.9 1.0
-40
-36
-32
-28
-24
1000PEO64PBT36 3000PEO52PBT48 2000PEO52PBT48 1000PEO52PBT48
Activity [pH2O/pH2O,sat]
T∆S
* S [kJ/
mol
]
Chapter 5
94
interactions generally are those that are site specific and localized, the system exhibiting the strongest negative ∆Hs
* values (1000PEO52PBT48) exhibits the strongest negative ∆Ss
* values too. The dependence of the water solvation entropy on the equilibrium water vapor activity is comparable to the dependence of the solvation enthalpy on vapor activity. (Figure 8). An increase in ∆Hs
* with water vapor activity means that at higher water concentrations in the polymer the water molecules interact weaker with their surrounding molecules. As a weaker binding between molecules in the system generally leads to an increased configurational freedom of the molecules, one expects entropy to increase. The Flory-Huggins analysis in the previous section showed that the polymer-water interaction parameter decreases with increasing vapor activity. Based on the data in Figure 8 and Figure 9 it can be concluded that the decrease of the interaction parameter is not a result of a more favorable energetic interaction of the water molecule with its environment. Instead, it results from the strong increase of the water solvation entropy with the water vapor activity. The convex shape of the water vapor isotherms (Figure 2 and Figure 6) thus expresses dissolved water to bind weaker to the polymer at higher vapor activity resulting in a reduced entropic expense of water uptake.
Thermodynamics of Water Vapor Sorption in PEO PBT Block copolymers
95
5.5 Conclusions PEO-PBT block copolymers show a high solubility for water vapor, which is completely determined by the PEO segment. The amount of dissolved water vapor depends on the polymeric structure: the more PEO and the higher the molecular weight of the PEO segment the higher the solubility of water vapor. Based on the Flory-Huggins theory the polymer water interaction parameter has been calculated, which is concentration dependent and decreases with the amount of dissolved water vapor. The absolute value of this interaction parameter depends on the polymeric structure: the larger the PEO content and the higher the PEO segment molecular weight the lower the value for the interaction parameter. The solvation Gibbs energy, enthalpy and entropy of solvation have been determined from the sorption data as well. These thermodynamic properties give more insight in the structure property relationship. When the concentration of water in the block copolymer increases the interactions between water and the polymer become weaker. The solvation Gibbs energy decreases with an increase of water vapor concentration due to an increase of the solvation entropy. This effect is responsible for the convex shape of the water sorption isotherm. Moreover, this effect is structure dependent: the larger the PEO segment and the more PEO present the higher the solvation entropy and the lower the solvation Gibbs energy of interaction. 5.6 References (1) Beck, M. I.; Tomka, I. J. Macromol. Sci., Phys. 1997, B36, 19-39. (2) Dixon-Garrett, S. V.; Nagai, K.; Freeman, B. D. J. Polym. Sci., Polym.
Phys. Ed. 2000, 38, 1078-1089. (3) Merkel, T. C.; Bondar, V. I.; Nagai, K.; Freeman, B. D.; Pinnau, I. J.
Polym. Sci., Polym. Phys. Ed. 2000, 38, 415-434. (4) Singh, A.; Freeman, B. D.; Pinnau, I. J. Polym. Sci., Polym. Phys. Ed.
1998, 36, 289-301. (5) Favre, A.; Nguyen, Q. T.; Schaetzel, P.; Clement, R.; Neel, J. J. Chem.
Soc. Faraday. Trans. 1993, 89, 4339-4346. (6) Perrin, L.; Nguyen, Q.; Sacco, D.; Lochon, P. Polym. Int. 1997, 42, 9-
16. (7) Flory, P. J. Principles of polymer chemistry; Cornell University press, 1953. (8) Schuld, N.; Wolf, B. A. Polymer Handbook, 4th ed.; Wiley: New York,
1999; Vol. VII.
Chapter 5
96
(9) Yamaguchi, T. N., S.I.; Kimura, S. J. Polym. Sci., Polym. Phys. Ed. 1997, 35, 469-477.
(10) Williams, J. L.; Hophenberg, H. B.; Stannett, V. J. of Macromol. Sci. Phys. 1969, B3, 711-725.
(11) Serad, G. E. F., B.D.; Stewart, M.E.; Hill, A.J. Polymer 2001, 42, 6299-6943.
(12) Kamiya, Y. T., K.; Naito, Y.; Wang, J. S. J. of Polym. Sci. Part B- Polym. Phys. 1995, 33, 1663-1671.
(13) Wang, P.; Schneider, N. S.; Sung, N. H. J. of Appl. Polym. Sci. 1999, 71, 1525-1535.
(14) Russell, S. P. W., D. H. Polymer 2001, 42, 2827-2836. (15) Ben-Naim, A. Journal of Solution Chem. 2001, 30, 475-487. (16) Ben-Naim, A. Solvation Thermodynamics; Plenum Press: Jerusalem, 1987. (17) Metz, S. J.; Mulder, M. H. V.; Wessling, M. Chapter 4. (18) Fakirov, S.; Gogeva, T. Makromol. Chem. 1990, 191, 615-624. (19) Boom, J. P.; Punt, I. G. M.; Zwijnenberg, H.; de Boer, R.; Bargeman,
D.; Smolders, C. A.; Strathmann, H. J. Membr. Sci. 1998, 138, 237-258. (20) Stamatialis, D.; Wessling, M.; Sanopoulou, M.; Strathmann, H.;
Petropoulos, J. J. Membr. Sci. 1997, 125, 165-175. (21) Rezac, M. E.; John, T.; Pfromm, P. H. J. Appl. Polym. Sci. 1997, 65,
1983-1993. (22) Wellons, J. D.; Stannett, V. J. Polym. Sci. 1966, 4, 593-602. (23) van der Vegt, N. F. A. J. Membr. Sci. 2002, 205, 125-139. (24) Skirrow, G.; Young, K. R. Polymer 1974, 15, 771-776. (25) Deschamps, A. A.; Grijpma, D. W.; Feijen, J. Polymer 2001, 42, 9335-
9345.
97
Chapter 6
Mixed gas water vapor/N2 transport in Poly(Ethylene Oxide) Poly(Butylene
Terephthalate) Block copolymers Abstract This chapter studies the mass transport properties for water vapor and nitrogen for a series of poly(ethylene oxide) (PEO) poly(butylene terephthalate) (PBT) block copolymers via: (a) the water vapor sorption, (b) the permeation of water vapor/N2 mixtures, (c) the diffusion of water vapor, (d) Zimm and Lundberg cluster analysis, and (e) the state of water in these polymers by FTIR-ATR analysis. The studied block copolymers consist of a PEO segment length of 1000 g/mol containing various amounts of PBT. The water vapor permeability depends strongly on the polymeric structure and increases with an increased amount of PEO due to a higher solubility and diffusivity for water vapor for block copolymers with a larger amount of PEO. The diffusivity of water vapor decreases significantly with an increase of the amount of water vapor sorbed in the block copolymer. This decrease is caused by the clustering of water vapor, as revealed by a Zimm and Lundberg cluster analysis of the sorption isotherm and by FTIR-ATR. The latter technique shows that the interactions between water and the polymer become weaker as the amount of water in the block copolymer increases. This observation suggests that the decrease in interaction energy between water and the polymer must be compensated by an entropy gain, because the amount of water vapor increases with an increase of activity. Water vapor preferably remains in the cluster, which makes diffusion through the polymer energetically less favorable. This causes the diffusion coefficient to decrease with the increase of the amount of water vapor in the polymer. The mixed gas N2 permeability remains constant with an increase of water vapor activity but depends strongly on the polymeric structure, whereas the water vapor permeability depends on the solubility in the block copolymer. This causes a higher selectivity for block copolymers containing more PBT.
Chater 6
98
6.1 Introduction Water vapor transport through polymeric films is often complicated by non-ideal solubility and anomalous diffusivity. Water may interact with the polymer causing plasticization or cluster formation1-3. A trade-off relationship between selectivity and permeability, commonly used for permanent gases in the so called Robeson plot4, where a higher selectivity is accompanied by a lower permeability and vice versa. This not valid for water vapor since the selectivity increases with the pure gas permeability5. Moreover, there exists hardly any literature on the permeation of a permanent gas in the presence of water vapor. The aim of this work is study the permeability of water vapor and N2 in a water vapor/N2 mixture through PEO-PBT block copolymers with various amounts of PEO but with a constant PEO segment length of 1000 g/mol. The water vapor transport is studied via its diffusivity. The state of water in these polymers, affecting the diffusivity, is analyzed via the Zimm and Lundberg cluster analysis and infrared spectroscopy. The mixed gas water vapor and N2 permeability are studied at 30°C, 50°C and 80°C, revealing the temperature and structural dependence of the permeability and selectivity for these block copolymers.
Mixed gas water vapor/N2 transport in PEO PBT Block copolymers
99
6.2 Experimental 6.2.1 Materials PEO-PBT block copolymers were obtained from Isotis b.v. (the Netherlands) and were used without further purification. The structural and thermal properties of these materials are discussed elsewhere6. Chloroform (CHCl3) and trifluoroacetic acid (TFA) were both purchased from Merck (analytical grade) and used as solvents. For the gas permeation experiments carbon dioxide (CO2) nitrogen (N2), and helium (He) were used and purchased from Hoekloos b.v. (Netherlands). The purity of the gases was greater than 99.9 %. 6.2.2 Film preparation PEO-PBT block copolymers were dissolved in CHCl3 (5 – 10 wt%), and TFA was added (± 4 vol. % in CHCl3) when the weight ratio of PEO in the block copolymer was lower than 50 wt%. Thin films of around 50 µm were prepared by solution casting on a glass plate. The cast films were dried in a N2 atmosphere at room temperature for 24 hours. The homogeneous dense films were removed from the glass plate and were further dried and stored in a vacuum oven at 30°C. 6.2.3 Mixed gas water vapor permeation The mixed gas water vapor and nitrogen permeability were determined in a set up described in detail elsewhere7. The determination of the permeance consists in principle of water vapor/N2 mixture flowing over a polymeric film (membrane) and a sweep gas removing the permeated water vapor and N2 at the permeate side. The permeability of both components was determined from the flux through the membrane and the partial pressure difference between the feed- and permeate side of the membrane. A correction of a stagnant boundary layer was necessary and performed for water vapor. 6.2.4 Sorption isotherms An electro balance (TGA Perkin Elmer) was used to perform the gravimetric sorption experiments and is also described elsewhere8,9. The concentration of water inside the polymeric film was determined from the mass uptake due to sorption and was calculated by using the following equation10:
( )pw
i
VMMM
c⋅⋅−= ∞ 22414
(1)
where c is the equilibrium concentration of water inside the polymeric film [cm3(STP)]/cm3polymer], ∞M and iM are the final and initial mass of the
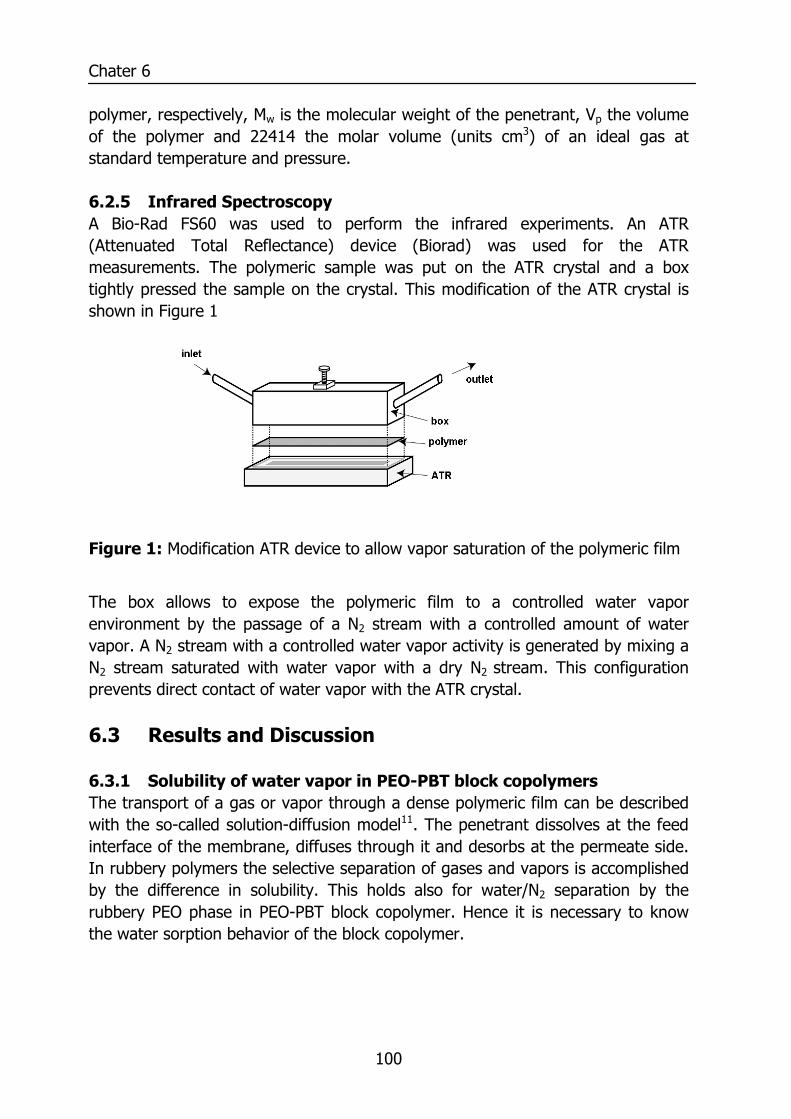
Chater 6
100
polymer, respectively, Mw is the molecular weight of the penetrant, Vp the volume of the polymer and 22414 the molar volume (units cm3) of an ideal gas at standard temperature and pressure. 6.2.5 Infrared Spectroscopy A Bio-Rad FS60 was used to perform the infrared experiments. An ATR (Attenuated Total Reflectance) device (Biorad) was used for the ATR measurements. The polymeric sample was put on the ATR crystal and a box tightly pressed the sample on the crystal. This modification of the ATR crystal is shown in Figure 1
Figure 1: Modification ATR device to allow vapor saturation of the polymeric film
The box allows to expose the polymeric film to a controlled water vapor environment by the passage of a N2 stream with a controlled amount of water vapor. A N2 stream with a controlled water vapor activity is generated by mixing a N2 stream saturated with water vapor with a dry N2 stream. This configuration prevents direct contact of water vapor with the ATR crystal. 6.3 Results and Discussion 6.3.1 Solubility of water vapor in PEO-PBT block copolymers The transport of a gas or vapor through a dense polymeric film can be described with the so-called solution-diffusion model11. The penetrant dissolves at the feed interface of the membrane, diffuses through it and desorbs at the permeate side. In rubbery polymers the selective separation of gases and vapors is accomplished by the difference in solubility. This holds also for water/N2 separation by the rubbery PEO phase in PEO-PBT block copolymer. Hence it is necessary to know the water sorption behavior of the block copolymer.
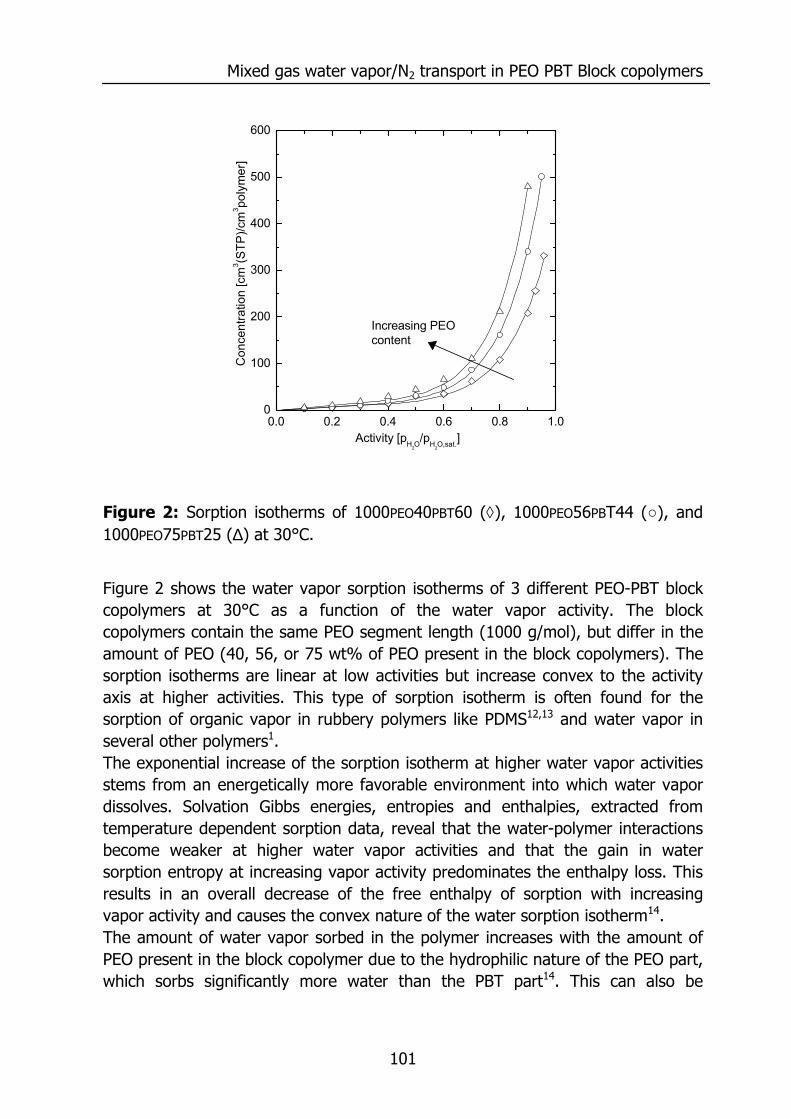
Mixed gas water vapor/N2 transport in PEO PBT Block copolymers
101
Figure 2: Sorption isotherms of 1000PEO40PBT60 (◊), 1000PEO56PBT44 (○), and 1000PEO75PBT25 (∆) at 30°C.
Figure 2 shows the water vapor sorption isotherms of 3 different PEO-PBT block copolymers at 30°C as a function of the water vapor activity. The block copolymers contain the same PEO segment length (1000 g/mol), but differ in the amount of PEO (40, 56, or 75 wt% of PEO present in the block copolymers). The sorption isotherms are linear at low activities but increase convex to the activity axis at higher activities. This type of sorption isotherm is often found for the sorption of organic vapor in rubbery polymers like PDMS12,13 and water vapor in several other polymers1. The exponential increase of the sorption isotherm at higher water vapor activities stems from an energetically more favorable environment into which water vapor dissolves. Solvation Gibbs energies, entropies and enthalpies, extracted from temperature dependent sorption data, reveal that the water-polymer interactions become weaker at higher water vapor activities and that the gain in water sorption entropy at increasing vapor activity predominates the enthalpy loss. This results in an overall decrease of the free enthalpy of sorption with increasing vapor activity and causes the convex nature of the water sorption isotherm14. The amount of water vapor sorbed in the polymer increases with the amount of PEO present in the block copolymer due to the hydrophilic nature of the PEO part, which sorbs significantly more water than the PBT part14. This can also be
0.0 0.2 0.4 0.6 0.8 1.00
100
200
300
400
500
600
Con
cent
ratio
n [c
m3 (S
TP)/c
m3 po
lym
er]
Activity [pH2O/pH2O,sat.]
Increasing PEO content
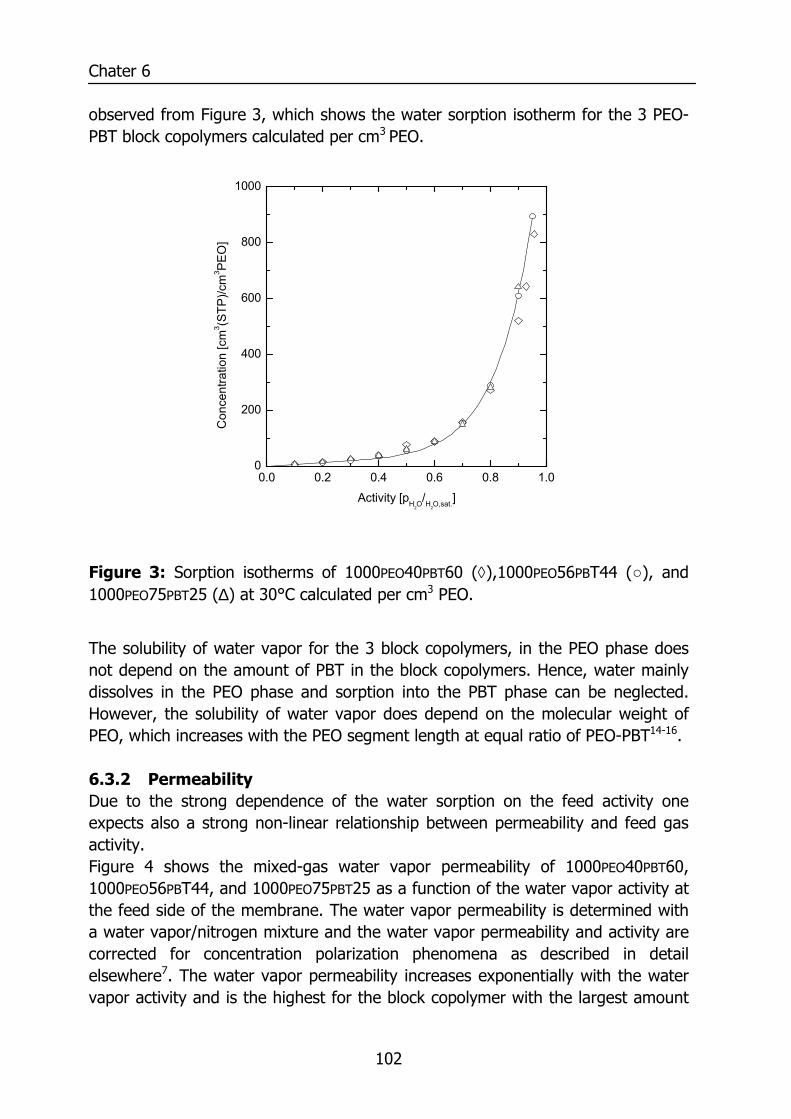
Chater 6
102
observed from Figure 3, which shows the water sorption isotherm for the 3 PEO-PBT block copolymers calculated per cm3 PEO.
Figure 3: Sorption isotherms of 1000PEO40PBT60 (◊),1000PEO56PBT44 (○), and 1000PEO75PBT25 (∆) at 30°C calculated per cm3 PEO.
The solubility of water vapor for the 3 block copolymers, in the PEO phase does not depend on the amount of PBT in the block copolymers. Hence, water mainly dissolves in the PEO phase and sorption into the PBT phase can be neglected. However, the solubility of water vapor does depend on the molecular weight of PEO, which increases with the PEO segment length at equal ratio of PEO-PBT14-16. 6.3.2 Permeability Due to the strong dependence of the water sorption on the feed activity one expects also a strong non-linear relationship between permeability and feed gas activity. Figure 4 shows the mixed-gas water vapor permeability of 1000PEO40PBT60, 1000PEO56PBT44, and 1000PEO75PBT25 as a function of the water vapor activity at the feed side of the membrane. The water vapor permeability is determined with a water vapor/nitrogen mixture and the water vapor permeability and activity are corrected for concentration polarization phenomena as described in detail elsewhere7. The water vapor permeability increases exponentially with the water vapor activity and is the highest for the block copolymer with the largest amount
0.0 0.2 0.4 0.6 0.8 1.00
200
400
600
800
1000
Con
cent
ratio
n [c
m3 (S
TP)/c
m3 PE
O]
Activity [pH2O/H2O,sat.]
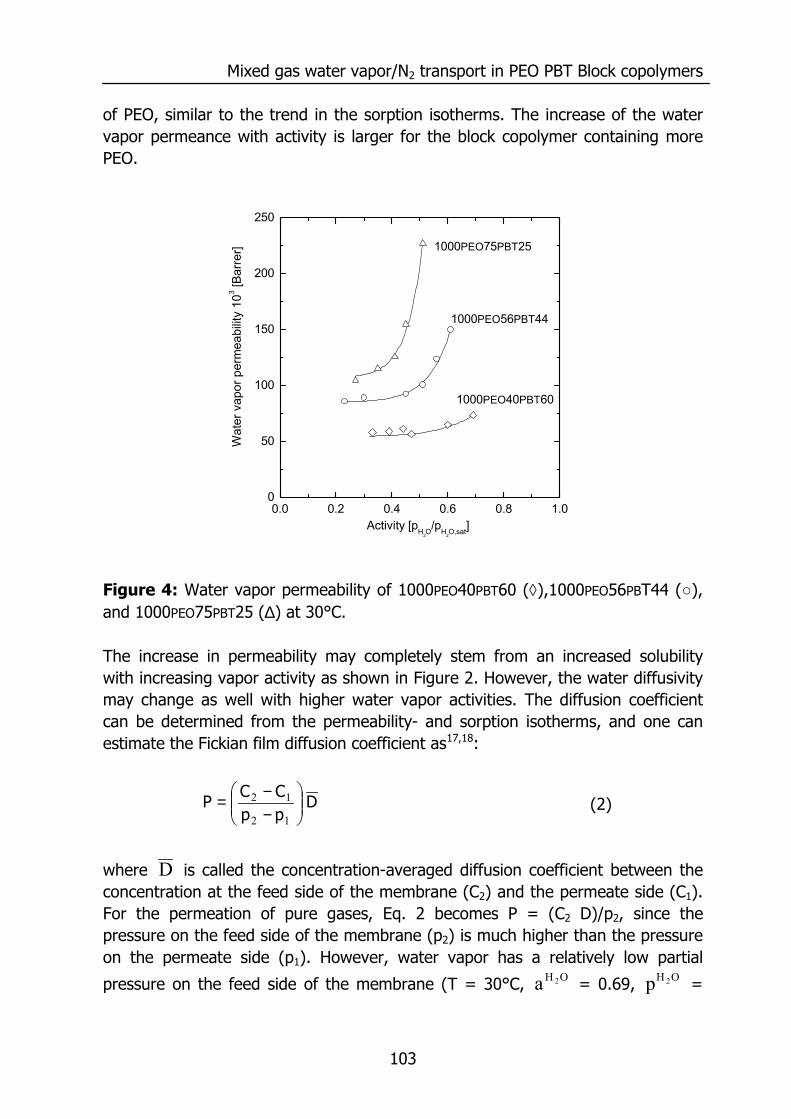
Mixed gas water vapor/N2 transport in PEO PBT Block copolymers
103
of PEO, similar to the trend in the sorption isotherms. The increase of the water vapor permeance with activity is larger for the block copolymer containing more PEO.
Figure 4: Water vapor permeability of 1000PEO40PBT60 (◊),1000PEO56PBT44 (○), and 1000PEO75PBT25 (∆) at 30°C. The increase in permeability may completely stem from an increased solubility with increasing vapor activity as shown in Figure 2. However, the water diffusivity may change as well with higher water vapor activities. The diffusion coefficient can be determined from the permeability- and sorption isotherms, and one can estimate the Fickian film diffusion coefficient as17,18:
DppCC
P
−−=
12
12 (2)
where D is called the concentration-averaged diffusion coefficient between the concentration at the feed side of the membrane (C2) and the permeate side (C1). For the permeation of pure gases, Eq. 2 becomes P = (C2 D)/p2, since the pressure on the feed side of the membrane (p2) is much higher than the pressure on the permeate side (p1). However, water vapor has a relatively low partial
pressure on the feed side of the membrane (T = 30°C, OH2a = 0.69, OH2p =
0.0 0.2 0.4 0.6 0.8 1.00
50
100
150
200
250
1000PEO75PBT25
1000PEO56PBT44
Wat
er v
apor
per
mea
bilit
y 10
3 [Bar
rer]
Activity [pH2O/pH2O,sat]
1000PEO40PBT60
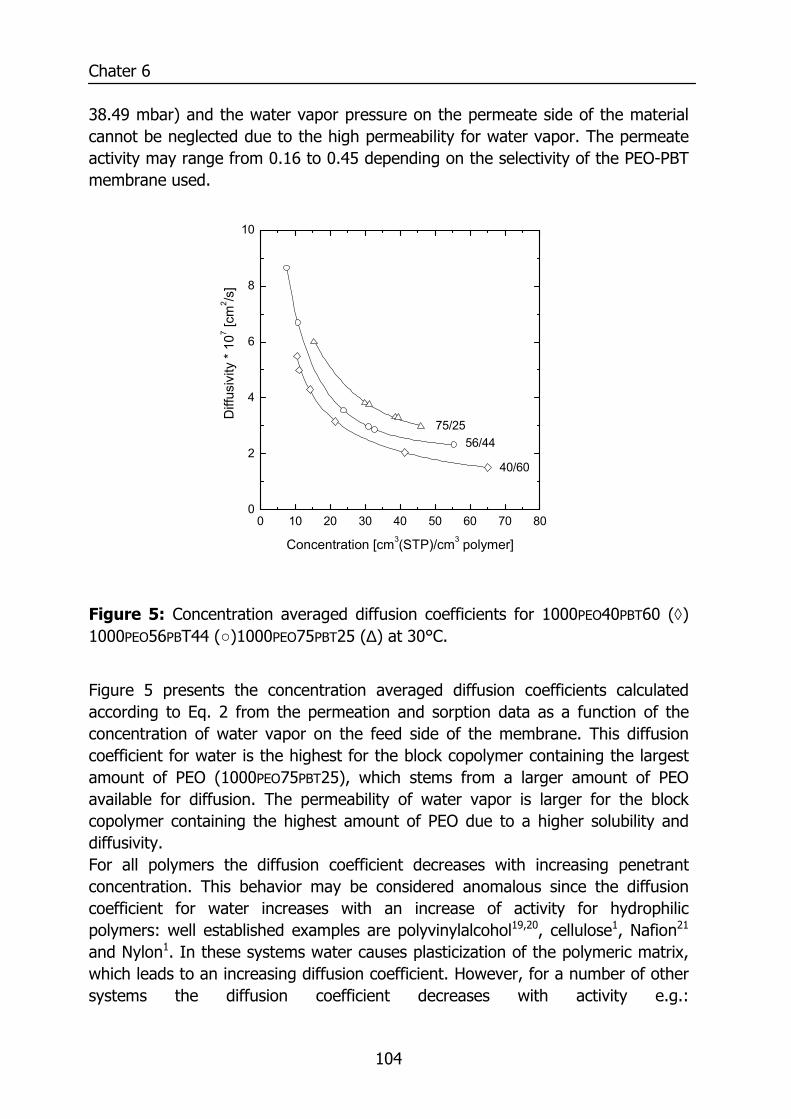
Chater 6
104
38.49 mbar) and the water vapor pressure on the permeate side of the material cannot be neglected due to the high permeability for water vapor. The permeate activity may range from 0.16 to 0.45 depending on the selectivity of the PEO-PBT membrane used.
Figure 5: Concentration averaged diffusion coefficients for 1000PEO40PBT60 (◊) 1000PEO56PBT44 (○)1000PEO75PBT25 (∆) at 30°C.
Figure 5 presents the concentration averaged diffusion coefficients calculated according to Eq. 2 from the permeation and sorption data as a function of the concentration of water vapor on the feed side of the membrane. This diffusion coefficient for water is the highest for the block copolymer containing the largest amount of PEO (1000PEO75PBT25), which stems from a larger amount of PEO available for diffusion. The permeability of water vapor is larger for the block copolymer containing the highest amount of PEO due to a higher solubility and diffusivity. For all polymers the diffusion coefficient decreases with increasing penetrant concentration. This behavior may be considered anomalous since the diffusion coefficient for water increases with an increase of activity for hydrophilic polymers: well established examples are polyvinylalcohol19,20, cellulose1, Nafion21 and Nylon1. In these systems water causes plasticization of the polymeric matrix, which leads to an increasing diffusion coefficient. However, for a number of other systems the diffusion coefficient decreases with activity e.g.:
0 10 20 30 40 50 60 70 800
2
4
6
8
10
40/60
56/44
Diff
usiv
ity *
107 [c
m2 /s
]
Concentration [cm3(STP)/cm3 polymer]
75/25
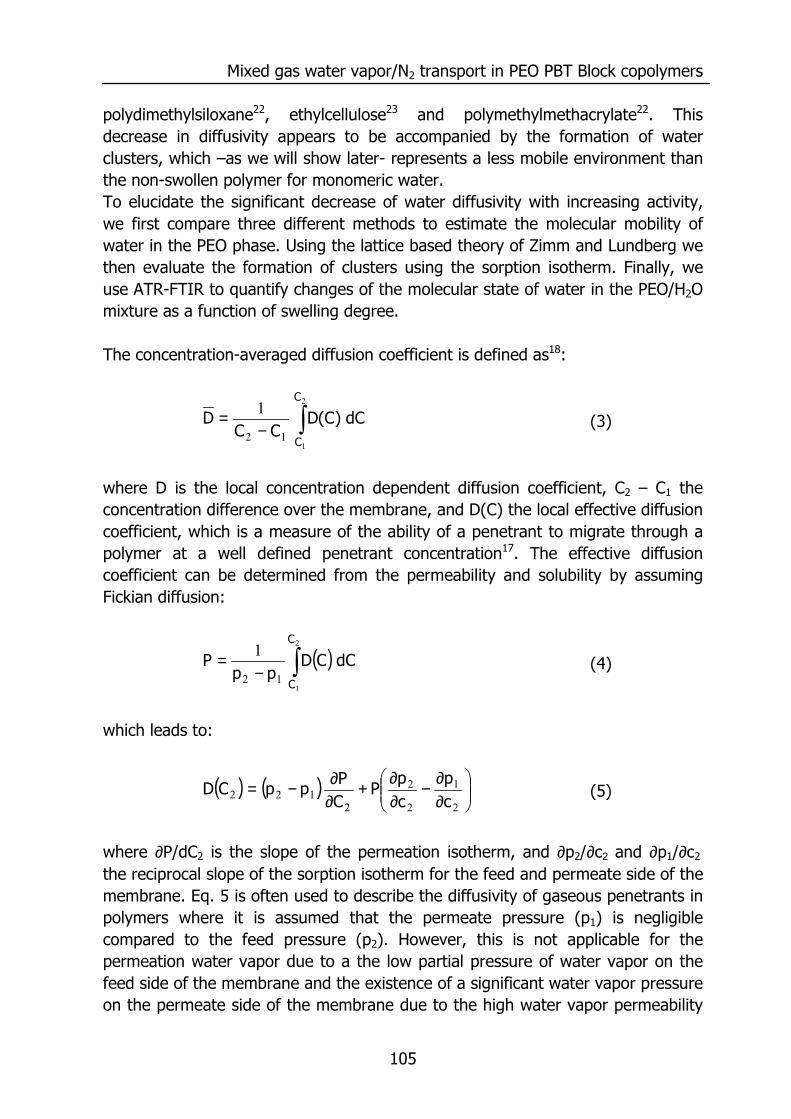
Mixed gas water vapor/N2 transport in PEO PBT Block copolymers
105
polydimethylsiloxane22, ethylcellulose23 and polymethylmethacrylate22. This decrease in diffusivity appears to be accompanied by the formation of water clusters, which –as we will show later- represents a less mobile environment than the non-swollen polymer for monomeric water. To elucidate the significant decrease of water diffusivity with increasing activity, we first compare three different methods to estimate the molecular mobility of water in the PEO phase. Using the lattice based theory of Zimm and Lundberg we then evaluate the formation of clusters using the sorption isotherm. Finally, we use ATR-FTIR to quantify changes of the molecular state of water in the PEO/H2O mixture as a function of swelling degree. The concentration-averaged diffusion coefficient is defined as18:
∫−=
2
112
1C
C
dC)C(DCC
D (3)
where D is the local concentration dependent diffusion coefficient, C2 – C1 the concentration difference over the membrane, and D(C) the local effective diffusion coefficient, which is a measure of the ability of a penetrant to migrate through a polymer at a well defined penetrant concentration17. The effective diffusion coefficient can be determined from the permeability and solubility by assuming Fickian diffusion:
( ) dCCDpp
PC
C∫−
=2
112
1 (4)
which leads to:
( ) ( )
∂∂−
∂∂+
∂∂−=
2
1
2
2
2122 c
pcp
PCP
ppCD (5)
where ∂P/dC2 is the slope of the permeation isotherm, and ∂p2/∂c2 and ∂p1/∂c2 the reciprocal slope of the sorption isotherm for the feed and permeate side of the membrane. Eq. 5 is often used to describe the diffusivity of gaseous penetrants in polymers where it is assumed that the permeate pressure (p1) is negligible compared to the feed pressure (p2). However, this is not applicable for the permeation water vapor due to a the low partial pressure of water vapor on the feed side of the membrane and the existence of a significant water vapor pressure on the permeate side of the membrane due to the high water vapor permeability
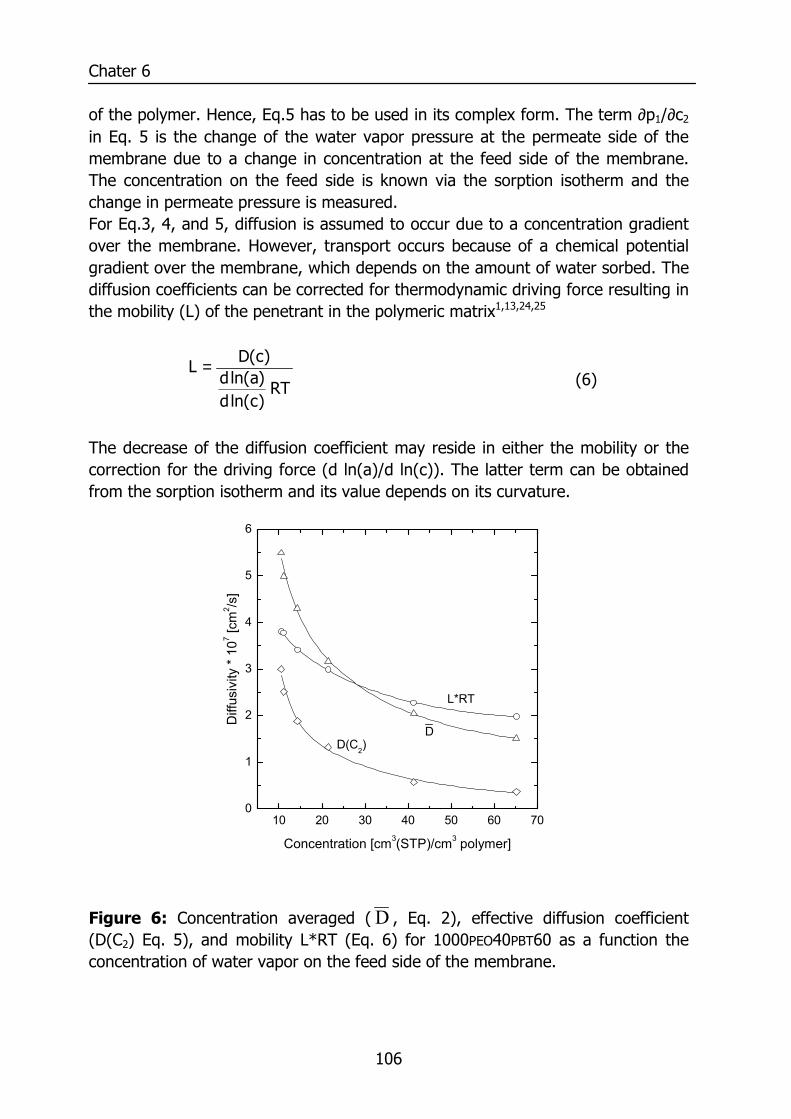
Chater 6
106
of the polymer. Hence, Eq.5 has to be used in its complex form. The term ∂p1/∂c2 in Eq. 5 is the change of the water vapor pressure at the permeate side of the membrane due to a change in concentration at the feed side of the membrane. The concentration on the feed side is known via the sorption isotherm and the change in permeate pressure is measured. For Eq.3, 4, and 5, diffusion is assumed to occur due to a concentration gradient over the membrane. However, transport occurs because of a chemical potential gradient over the membrane, which depends on the amount of water sorbed. The diffusion coefficients can be corrected for thermodynamic driving force resulting in the mobility (L) of the penetrant in the polymeric matrix1,13,24,25
RT)cln(d)aln(d)c(D
L = (6)
The decrease of the diffusion coefficient may reside in either the mobility or the correction for the driving force (d ln(a)/d ln(c)). The latter term can be obtained from the sorption isotherm and its value depends on its curvature.
Figure 6: Concentration averaged (D , Eq. 2), effective diffusion coefficient (D(C2) Eq. 5), and mobility L*RT (Eq. 6) for 1000PEO40PBT60 as a function the concentration of water vapor on the feed side of the membrane.
10 20 30 40 50 60 700
1
2
3
4
5
6
Diff
usiv
ity *
107 [c
m2 /s
]
Concentration [cm3(STP)/cm3 polymer]
DD(C2)
L*RT
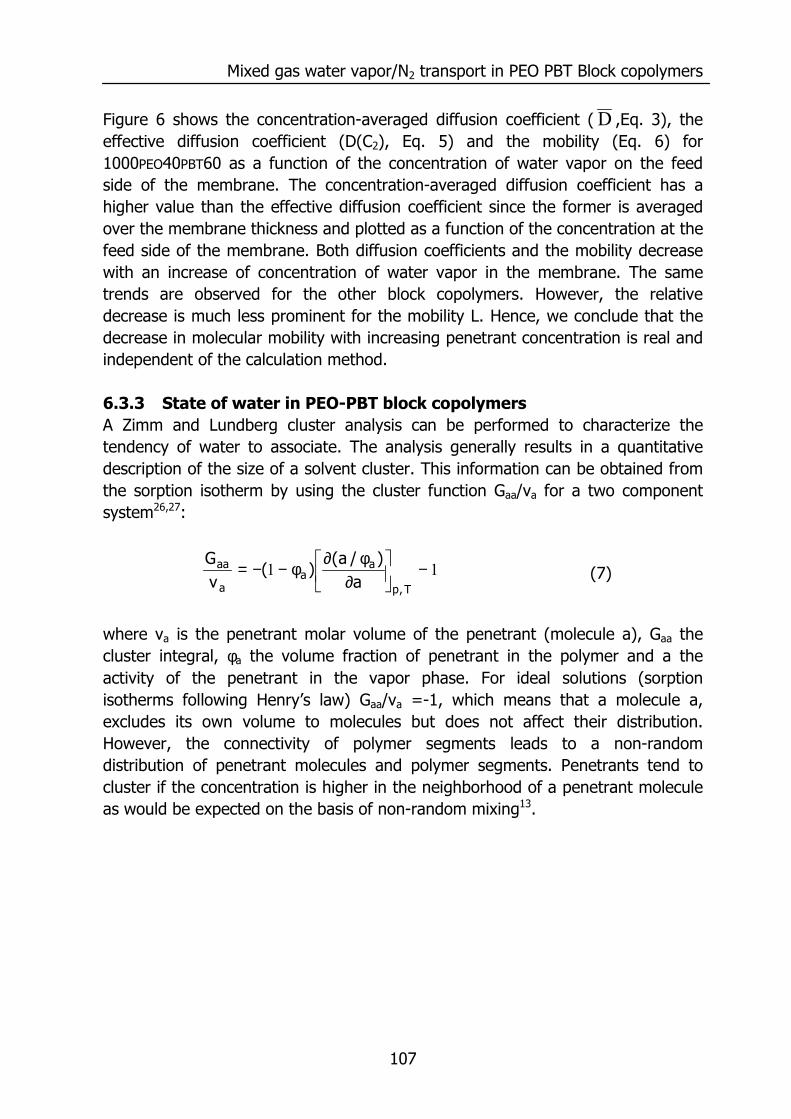
Mixed gas water vapor/N2 transport in PEO PBT Block copolymers
107
Figure 6 shows the concentration-averaged diffusion coefficient (D ,Eq. 3), the effective diffusion coefficient (D(C2), Eq. 5) and the mobility (Eq. 6) for 1000PEO40PBT60 as a function of the concentration of water vapor on the feed side of the membrane. The concentration-averaged diffusion coefficient has a higher value than the effective diffusion coefficient since the former is averaged over the membrane thickness and plotted as a function of the concentration at the feed side of the membrane. Both diffusion coefficients and the mobility decrease with an increase of concentration of water vapor in the membrane. The same trends are observed for the other block copolymers. However, the relative decrease is much less prominent for the mobility L. Hence, we conclude that the decrease in molecular mobility with increasing penetrant concentration is real and independent of the calculation method. 6.3.3 State of water in PEO-PBT block copolymers A Zimm and Lundberg cluster analysis can be performed to characterize the tendency of water to associate. The analysis generally results in a quantitative description of the size of a solvent cluster. This information can be obtained from the sorption isotherm by using the cluster function Gaa/va for a two component system26,27:
11 −
∂
φ∂φ−−=
T,p
aa
a
aa
a)/a(
)(vG
(7)
where va is the penetrant molar volume of the penetrant (molecule a), Gaa the cluster integral, φa the volume fraction of penetrant in the polymer and a the activity of the penetrant in the vapor phase. For ideal solutions (sorption isotherms following Henry’s law) Gaa/va =-1, which means that a molecule a, excludes its own volume to molecules but does not affect their distribution. However, the connectivity of polymer segments leads to a non-random distribution of penetrant molecules and polymer segments. Penetrants tend to cluster if the concentration is higher in the neighborhood of a penetrant molecule as would be expected on the basis of non-random mixing13.
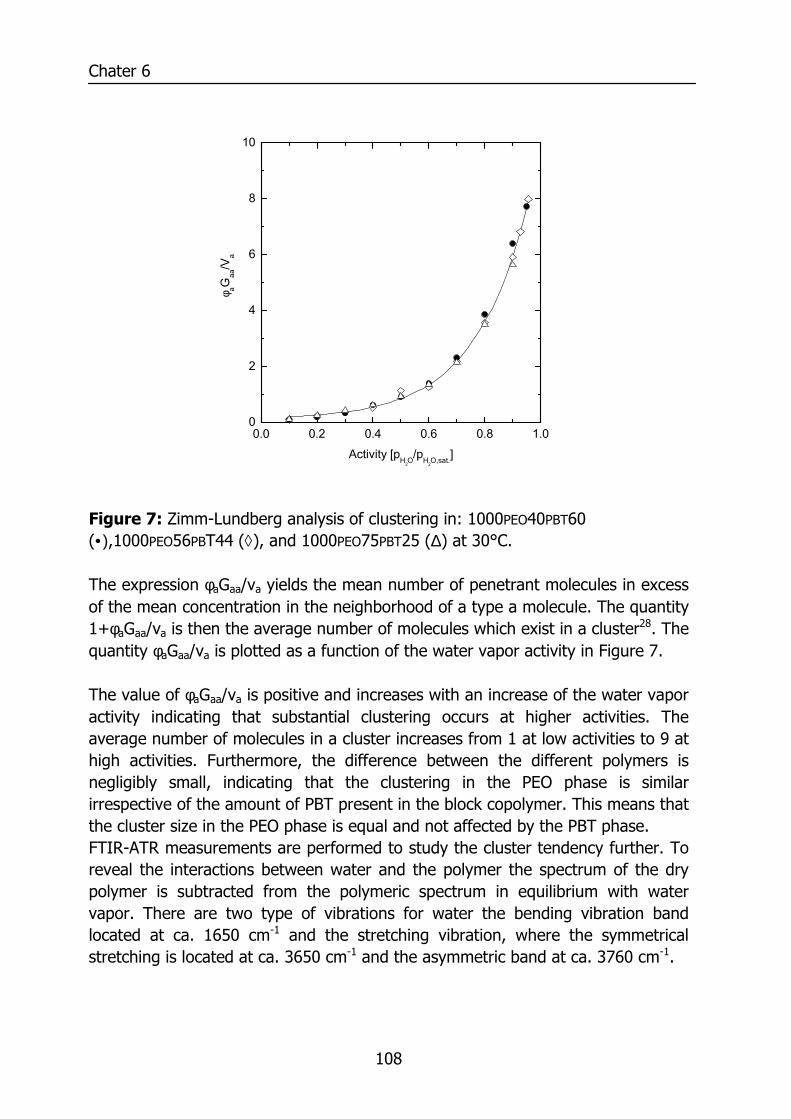
Chater 6
108
Figure 7: Zimm-Lundberg analysis of clustering in: 1000PEO40PBT60 (•) ,1000PEO56PBT44 (◊), and 1000PEO75PBT25 (∆) at 30°C. The expression φaGaa/va yields the mean number of penetrant molecules in excess of the mean concentration in the neighborhood of a type a molecule. The quantity 1+φaGaa/va is then the average number of molecules which exist in a cluster28. The quantity φaGaa/va is plotted as a function of the water vapor activity in Figure 7. The value of φaGaa/va is positive and increases with an increase of the water vapor activity indicating that substantial clustering occurs at higher activities. The average number of molecules in a cluster increases from 1 at low activities to 9 at high activities. Furthermore, the difference between the different polymers is negligibly small, indicating that the clustering in the PEO phase is similar irrespective of the amount of PBT present in the block copolymer. This means that the cluster size in the PEO phase is equal and not affected by the PBT phase. FTIR-ATR measurements are performed to study the cluster tendency further. To reveal the interactions between water and the polymer the spectrum of the dry polymer is subtracted from the polymeric spectrum in equilibrium with water vapor. There are two type of vibrations for water the bending vibration band located at ca. 1650 cm-1 and the stretching vibration, where the symmetrical stretching is located at ca. 3650 cm-1 and the asymmetric band at ca. 3760 cm-1.
0.0 0.2 0.4 0.6 0.8 1.00
2
4
6
8
10
φ aGaa
/Va
Activity [pH2O/pH2O,sat.]
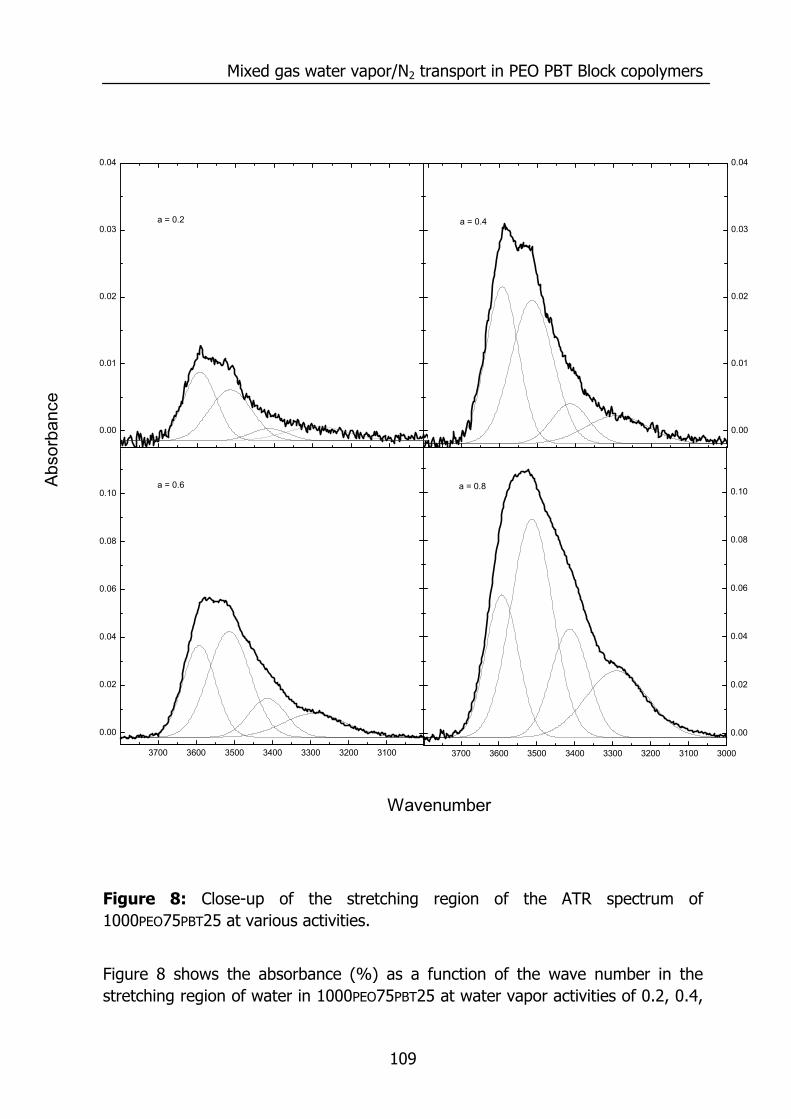
Mixed gas water vapor/N2 transport in PEO PBT Block copolymers
109
Figure 8: Close-up of the stretching region of the ATR spectrum of 1000PEO75PBT25 at various activities.
Figure 8 shows the absorbance (%) as a function of the wave number in the stretching region of water in 1000PEO75PBT25 at water vapor activities of 0.2, 0.4,
0.00
0.01
0.02
0.03
0.04
0.00
0.01
0.02
0.03
0.04
3700 3600 3500 3400 3300 3200 3100 3000
0.00
0.02
0.04
0.06
0.08
0.10
3700 3600 3500 3400 3300 3200 3100 3000
0.00
0.02
0.04
0.06
0.08
0.10
a = 0.2
a = 0.4
Wavenumber
Abso
rban
ce
a = 0.6
a = 0.8
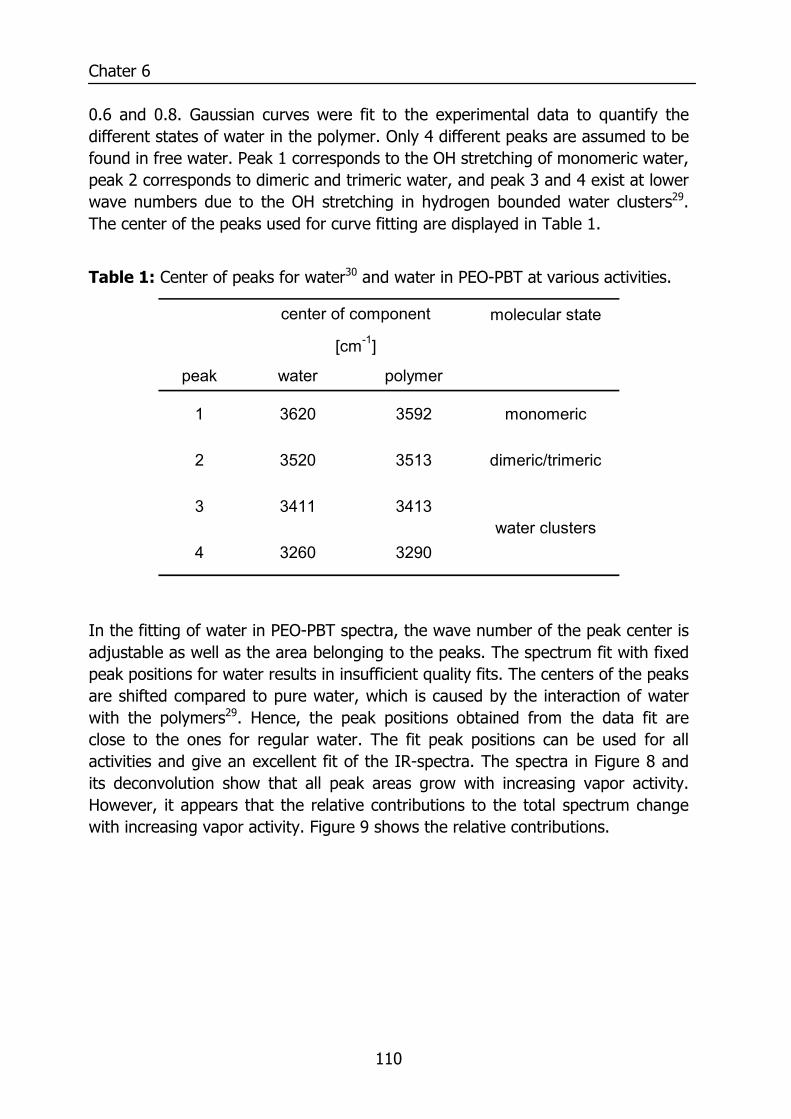
Chater 6
110
0.6 and 0.8. Gaussian curves were fit to the experimental data to quantify the different states of water in the polymer. Only 4 different peaks are assumed to be found in free water. Peak 1 corresponds to the OH stretching of monomeric water, peak 2 corresponds to dimeric and trimeric water, and peak 3 and 4 exist at lower wave numbers due to the OH stretching in hydrogen bounded water clusters29. The center of the peaks used for curve fitting are displayed in Table 1.
Table 1: Center of peaks for water30 and water in PEO-PBT at various activities.
In the fitting of water in PEO-PBT spectra, the wave number of the peak center is adjustable as well as the area belonging to the peaks. The spectrum fit with fixed peak positions for water results in insufficient quality fits. The centers of the peaks are shifted compared to pure water, which is caused by the interaction of water with the polymers29. Hence, the peak positions obtained from the data fit are close to the ones for regular water. The fit peak positions can be used for all activities and give an excellent fit of the IR-spectra. The spectra in Figure 8 and its deconvolution show that all peak areas grow with increasing vapor activity. However, it appears that the relative contributions to the total spectrum change with increasing vapor activity. Figure 9 shows the relative contributions.
molecular state
peak water polymer
1 3620 3592 monomeric
2 3520 3513 dimeric/trimeric
3 3411 3413
4 3260 3290water clusters
center of component
[cm-1]
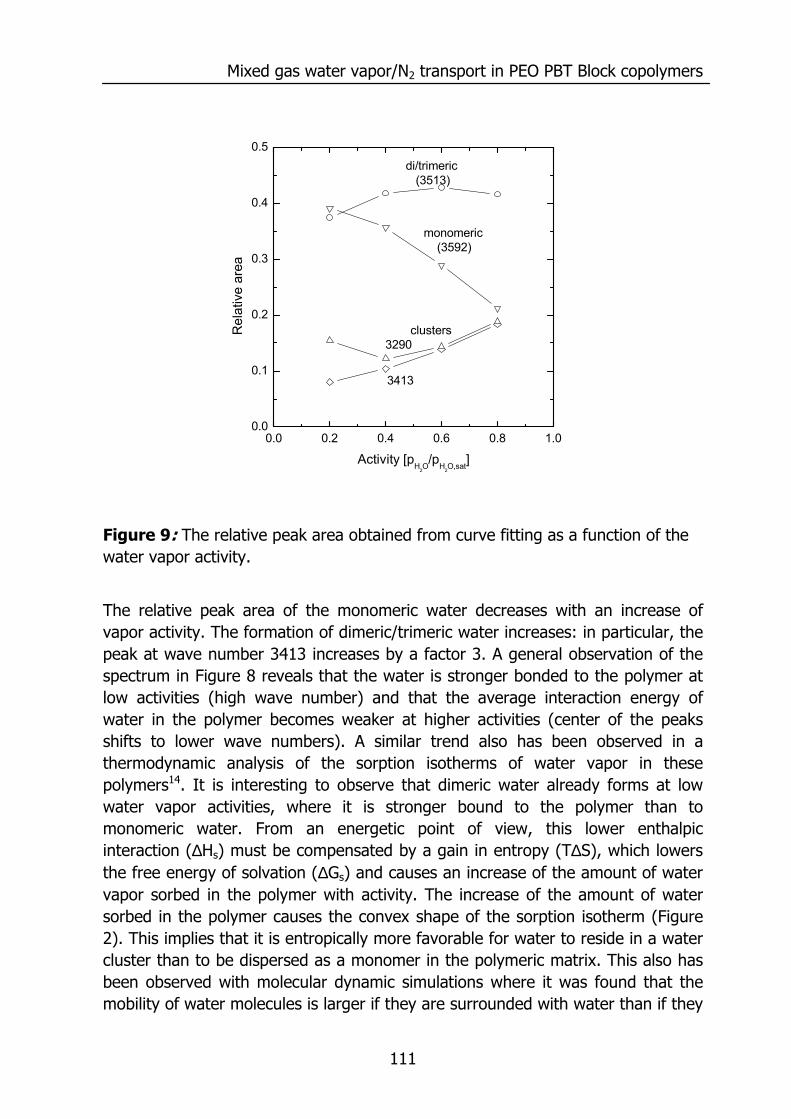
Mixed gas water vapor/N2 transport in PEO PBT Block copolymers
111
Figure 9: The relative peak area obtained from curve fitting as a function of the water vapor activity.
The relative peak area of the monomeric water decreases with an increase of vapor activity. The formation of dimeric/trimeric water increases: in particular, the peak at wave number 3413 increases by a factor 3. A general observation of the spectrum in Figure 8 reveals that the water is stronger bonded to the polymer at low activities (high wave number) and that the average interaction energy of water in the polymer becomes weaker at higher activities (center of the peaks shifts to lower wave numbers). A similar trend also has been observed in a thermodynamic analysis of the sorption isotherms of water vapor in these polymers14. It is interesting to observe that dimeric water already forms at low water vapor activities, where it is stronger bound to the polymer than to monomeric water. From an energetic point of view, this lower enthalpic interaction (∆Hs) must be compensated by a gain in entropy (T∆S), which lowers the free energy of solvation (∆Gs) and causes an increase of the amount of water vapor sorbed in the polymer with activity. The increase of the amount of water sorbed in the polymer causes the convex shape of the sorption isotherm (Figure 2). This implies that it is entropically more favorable for water to reside in a water cluster than to be dispersed as a monomer in the polymeric matrix. This also has been observed with molecular dynamic simulations where it was found that the mobility of water molecules is larger if they are surrounded with water than if they
0.0 0.2 0.4 0.6 0.8 1.00.0
0.1
0.2
0.3
0.4
0.5
Rel
ativ
e ar
ea
Activity [pH2O/pH2O,sat]
monomeric (3592)
di/trimeric (3513)
clusters3290
3413
Chater 6
112
are in contact with the polymer31, suggesting a higher entropy for water in the cluster. 6.3.4 Concentration-dependent diffusion coefficient The change of the diffusion coefficient with increasing degree of swelling is a complex matter. In some cases a dramatic increase with degree of swelling can be observed. In the case of PEO-PBT, D apparently decreases. An increasing diffusion coefficient with increasing degree of swelling can be predicted by the (simple) macroscopic model of Mackie and Meares19:
2
0 11
φ+φ−=
DD
(8)
where φ is the fraction polymer, D the diffusion coefficient through the penetrant sorbed in the polymer, and D0 the self-diffusion coefficient of water32. This model considers the polymer chains as impermeable barriers obstructing the diffusion, and thus diffusion only occurs through water. Recently, molecular dynamic simulations support this model for very different systems such as the diffusion of benzene in polystyrene or water in polyvinylalcohol33.
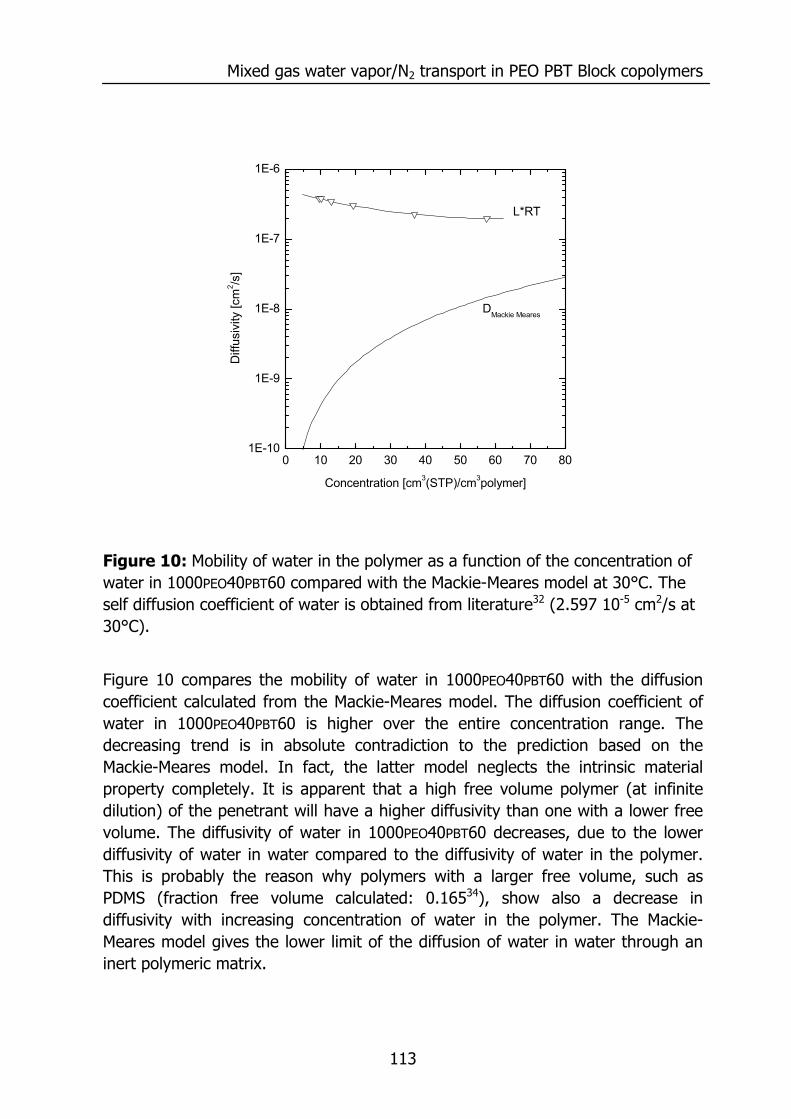
Mixed gas water vapor/N2 transport in PEO PBT Block copolymers
113
Figure 10: Mobility of water in the polymer as a function of the concentration of water in 1000PEO40PBT60 compared with the Mackie-Meares model at 30°C. The self diffusion coefficient of water is obtained from literature32 (2.597 10-5 cm2/s at 30°C).
Figure 10 compares the mobility of water in 1000PEO40PBT60 with the diffusion coefficient calculated from the Mackie-Meares model. The diffusion coefficient of water in 1000PEO40PBT60 is higher over the entire concentration range. The decreasing trend is in absolute contradiction to the prediction based on the Mackie-Meares model. In fact, the latter model neglects the intrinsic material property completely. It is apparent that a high free volume polymer (at infinite dilution) of the penetrant will have a higher diffusivity than one with a lower free volume. The diffusivity of water in 1000PEO40PBT60 decreases, due to the lower diffusivity of water in water compared to the diffusivity of water in the polymer. This is probably the reason why polymers with a larger free volume, such as PDMS (fraction free volume calculated: 0.16534), show also a decrease in diffusivity with increasing concentration of water in the polymer. The Mackie-Meares model gives the lower limit of the diffusion of water in water through an inert polymeric matrix.
0 10 20 30 40 50 60 70 801E-10
1E-9
1E-8
1E-7
1E-6
Diff
usiv
ity [c
m2 /s
]
Concentration [cm3(STP)/cm3polymer]
DMackie Meares
L*RT
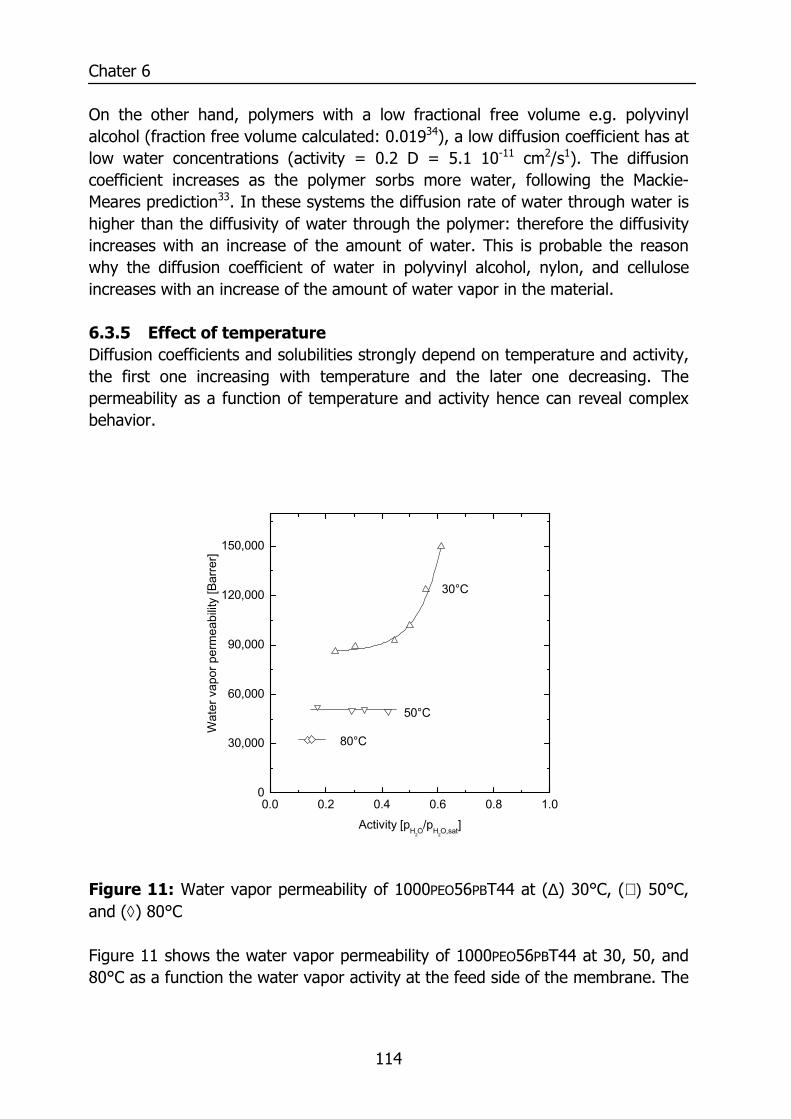
Chater 6
114
On the other hand, polymers with a low fractional free volume e.g. polyvinyl alcohol (fraction free volume calculated: 0.01934), a low diffusion coefficient has at low water concentrations (activity = 0.2 D = 5.1 10-11 cm2/s1). The diffusion coefficient increases as the polymer sorbs more water, following the Mackie-Meares prediction33. In these systems the diffusion rate of water through water is higher than the diffusivity of water through the polymer: therefore the diffusivity increases with an increase of the amount of water. This is probable the reason why the diffusion coefficient of water in polyvinyl alcohol, nylon, and cellulose increases with an increase of the amount of water vapor in the material. 6.3.5 Effect of temperature Diffusion coefficients and solubilities strongly depend on temperature and activity, the first one increasing with temperature and the later one decreasing. The permeability as a function of temperature and activity hence can reveal complex behavior.
Figure 11: Water vapor permeability of 1000PEO56PBT44 at (∆) 30°C, (∇) 50°C, and (◊) 80°C Figure 11 shows the water vapor permeability of 1000PEO56PBT44 at 30, 50, and 80°C as a function the water vapor activity at the feed side of the membrane. The
0.0 0.2 0.4 0.6 0.8 1.00
30,000
60,000
90,000
120,000
150,000
80°C
50°C
30°C
Wat
er v
apor
per
mea
bilit
y [B
arre
r]
Activity [pH2O/pH2O,sat]
Mixed gas water vapor/N2 transport in PEO PBT Block copolymers
115
water vapor permeability decreases with increasing temperature and its dependency on the temperature is often described with the following equation:
−=
RT
EexpPP p
0 (9)
where P0 is a pre-exponential factor, and Ep the activation energy for permeation. Ep can be written as the sum of the heat of sorption ( cH∆ ) and the activation
energy for diffusion (Ed):
dcp EHE +∆= (10) The heat of sorption is the enthalpy difference between the penetrant in the vapor phase and that sorbed in the polymeric matrix, and contains contributions of the
isosteric heat of condensation (∆Hvap) and the isosteric heat of sorption ( *sH∆ ),
with ( *sH∆ ) representing the interaction energy between water and the polymer.
The enthalpy of sorption is negative causing a lower solubility at higher temperatures. The activation energy for diffusion always has a positive value, which in this case is smaller than the heat of sorption causing the permeance to decrease with temperature. This indicates that the water vapor permeance is mainly determined by the solubility of water vapor. At 30°C the water vapor permeability isotherm is convex to the activity axis, whereas it is constant at 50°C. This stems from the exothermic heat of sorption, which causes a lower solubility of water vapor at higher temperatures, causing the shape of the isotherm to be more linear towards higher vapor activities.
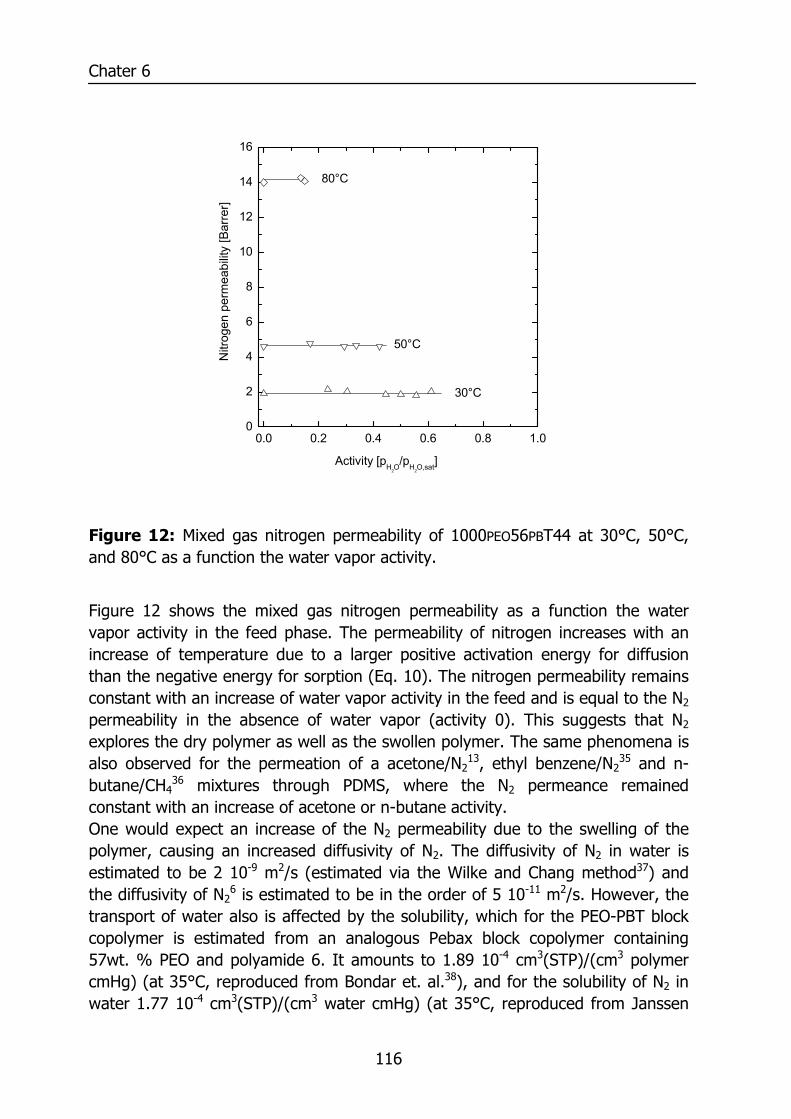
Chater 6
116
Figure 12: Mixed gas nitrogen permeability of 1000PEO56PBT44 at 30°C, 50°C, and 80°C as a function the water vapor activity.
Figure 12 shows the mixed gas nitrogen permeability as a function the water vapor activity in the feed phase. The permeability of nitrogen increases with an increase of temperature due to a larger positive activation energy for diffusion than the negative energy for sorption (Eq. 10). The nitrogen permeability remains constant with an increase of water vapor activity in the feed and is equal to the N2 permeability in the absence of water vapor (activity 0). This suggests that N2 explores the dry polymer as well as the swollen polymer. The same phenomena is also observed for the permeation of a acetone/N2
13, ethyl benzene/N235 and n-
butane/CH436 mixtures through PDMS, where the N2 permeance remained
constant with an increase of acetone or n-butane activity. One would expect an increase of the N2 permeability due to the swelling of the polymer, causing an increased diffusivity of N2. The diffusivity of N2 in water is estimated to be 2 10-9 m2/s (estimated via the Wilke and Chang method37) and the diffusivity of N2
6 is estimated to be in the order of 5 10-11 m2/s. However, the transport of water also is affected by the solubility, which for the PEO-PBT block copolymer is estimated from an analogous Pebax block copolymer containing 57wt. % PEO and polyamide 6. It amounts to 1.89 10-4 cm3(STP)/(cm3 polymer cmHg) (at 35°C, reproduced from Bondar et. al.38), and for the solubility of N2 in water 1.77 10-4 cm3(STP)/(cm3 water cmHg) (at 35°C, reproduced from Janssen
0.0 0.2 0.4 0.6 0.8 1.00
2
4
6
8
10
12
14
16
80°C
50°C
30°C
Nitr
ogen
per
mea
bilit
y [B
arre
r]
Activity [pH2O/pH2O,sat]
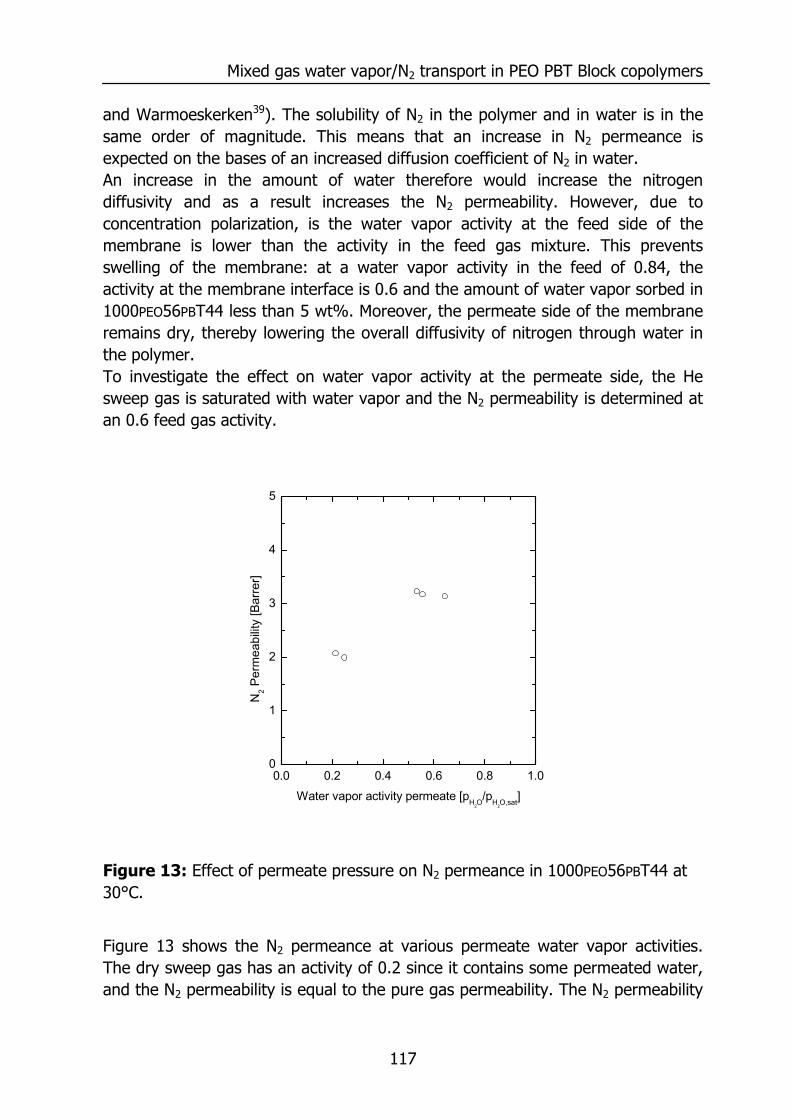
Mixed gas water vapor/N2 transport in PEO PBT Block copolymers
117
and Warmoeskerken39). The solubility of N2 in the polymer and in water is in the same order of magnitude. This means that an increase in N2 permeance is expected on the bases of an increased diffusion coefficient of N2 in water. An increase in the amount of water therefore would increase the nitrogen diffusivity and as a result increases the N2 permeability. However, due to concentration polarization, is the water vapor activity at the feed side of the membrane is lower than the activity in the feed gas mixture. This prevents swelling of the membrane: at a water vapor activity in the feed of 0.84, the activity at the membrane interface is 0.6 and the amount of water vapor sorbed in 1000PEO56PBT44 less than 5 wt%. Moreover, the permeate side of the membrane remains dry, thereby lowering the overall diffusivity of nitrogen through water in the polymer. To investigate the effect on water vapor activity at the permeate side, the He sweep gas is saturated with water vapor and the N2 permeability is determined at an 0.6 feed gas activity.
Figure 13: Effect of permeate pressure on N2 permeance in 1000PEO56PBT44 at 30°C.
Figure 13 shows the N2 permeance at various permeate water vapor activities. The dry sweep gas has an activity of 0.2 since it contains some permeated water, and the N2 permeability is equal to the pure gas permeability. The N2 permeability
0.0 0.2 0.4 0.6 0.8 1.00
1
2
3
4
5
N2 P
erm
eabi
lity
[Bar
rer]
Water vapor activity permeate [pH2O/pH2O,sat]
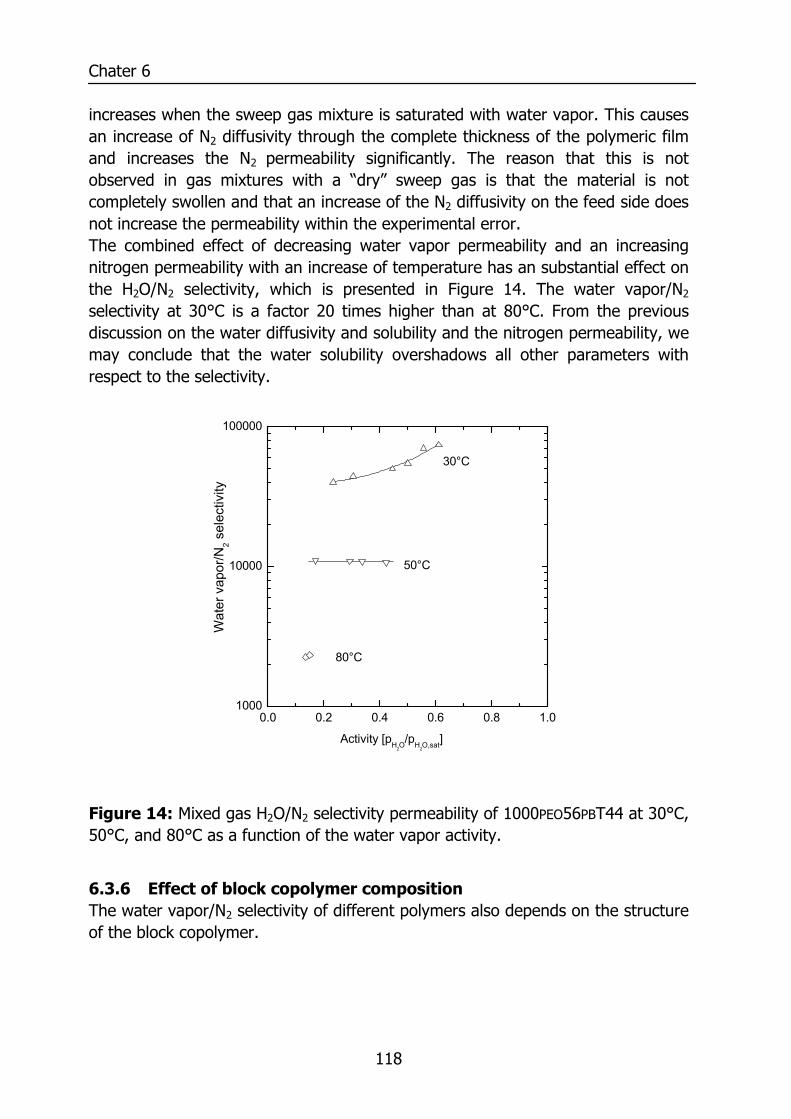
Chater 6
118
increases when the sweep gas mixture is saturated with water vapor. This causes an increase of N2 diffusivity through the complete thickness of the polymeric film and increases the N2 permeability significantly. The reason that this is not observed in gas mixtures with a “dry” sweep gas is that the material is not completely swollen and that an increase of the N2 diffusivity on the feed side does not increase the permeability within the experimental error. The combined effect of decreasing water vapor permeability and an increasing nitrogen permeability with an increase of temperature has an substantial effect on the H2O/N2 selectivity, which is presented in Figure 14. The water vapor/N2 selectivity at 30°C is a factor 20 times higher than at 80°C. From the previous discussion on the water diffusivity and solubility and the nitrogen permeability, we may conclude that the water solubility overshadows all other parameters with respect to the selectivity.
Figure 14: Mixed gas H2O/N2 selectivity permeability of 1000PEO56PBT44 at 30°C, 50°C, and 80°C as a function of the water vapor activity.
6.3.6 Effect of block copolymer composition The water vapor/N2 selectivity of different polymers also depends on the structure of the block copolymer.
0.0 0.2 0.4 0.6 0.8 1.01000
10000
100000
Activity [pH2O/pH2O,sat]
80°C
50°C
30°C
Wat
er v
apor
/N2 s
elec
tivity
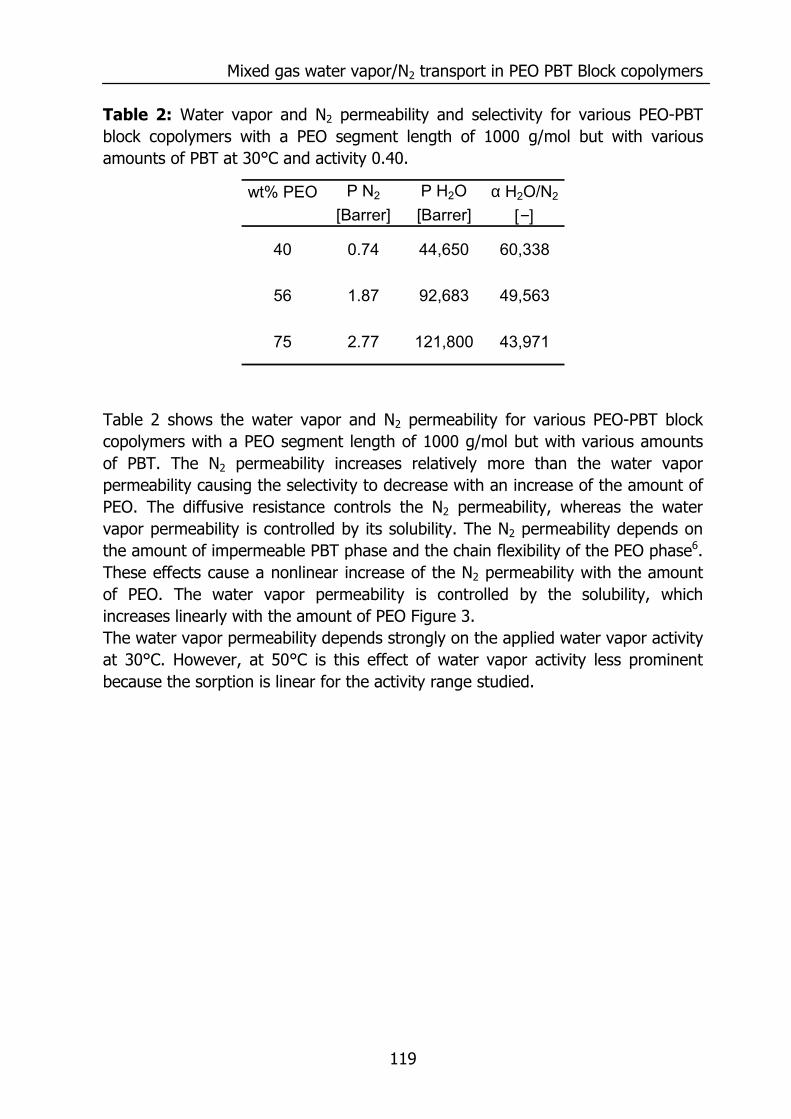
Mixed gas water vapor/N2 transport in PEO PBT Block copolymers
119
Table 2: Water vapor and N2 permeability and selectivity for various PEO-PBT block copolymers with a PEO segment length of 1000 g/mol but with various amounts of PBT at 30°C and activity 0.40.
Table 2 shows the water vapor and N2 permeability for various PEO-PBT block copolymers with a PEO segment length of 1000 g/mol but with various amounts of PBT. The N2 permeability increases relatively more than the water vapor permeability causing the selectivity to decrease with an increase of the amount of PEO. The diffusive resistance controls the N2 permeability, whereas the water vapor permeability is controlled by its solubility. The N2 permeability depends on the amount of impermeable PBT phase and the chain flexibility of the PEO phase6. These effects cause a nonlinear increase of the N2 permeability with the amount of PEO. The water vapor permeability is controlled by the solubility, which increases linearly with the amount of PEO Figure 3. The water vapor permeability depends strongly on the applied water vapor activity at 30°C. However, at 50°C is this effect of water vapor activity less prominent because the sorption is linear for the activity range studied.
wt% PEO P N2 P H2O α H2O/N2
[Barrer] [Barrer] [−]
40 0.74 44,650 60,338
56 1.87 92,683 49,563
75 2.77 121,800 43,971

Chater 6
120
Figure 15: Water vapor/N2 selectivity at 50°C for: 1000PEO40PBT60 (◊),1000PEO56PBT44 (○), and 1000PEO75PBT25 (∆). Figure 15 shows the water vapor/N2 at 50°C for 1000PEO40PBT60, 1000PEO56PBT44, and 1000PEO75PBT25. The water vapor/N2 selectivity decreases with an increase of the PEO content in the block copolymer due to the larger increase of the N2 permeability compared to the water vapor permeability.
0.0 0.2 0.4 0.6 0.80
4,000
8,000
12,000
16,000
20,000
1000PEO75PBT25
1000PEO56PBT44
Sel
ectiv
ity [w
ater
vap
or/N
2]
Activity [pH2O/pH2O,sat.]
1000PEO40PBT60
Mixed gas water vapor/N2 transport in PEO PBT Block copolymers
121
6.4 Conclusions PEO-PBT block copolymers show a high solubility, permeability and selectivity for water vapor, which is completely determined by the PEO segment. The amount of dissolved water vapor depends on the polymeric structure: the larger the PEO weight fraction, the higher the solubility, diffusivity and permeability of water vapor. The diffusion coefficient of water vapor calculated from sorption and permeation isotherms decreases with the amount of water vapor in the polymer. FTIR-ATR analysis of water in the PEO-PBT block copolymers reveals that the interactions between water and the polymer become weaker at higher water contents. This is caused by the formation of water clusters in the material. These clusters develop although the interactions between the water molecules are weaker than the interaction between water and the polymer. Therefore cluster formation is entropically favored, causing a lower free energy for water in the cluster. The diffusion coefficient of water decreases with an increase of the amount of water content due to the lower diffusion rate of water through water. The selectivity of water vapor/N2 increases with an increase of the amount of PBT due to a relatively higher water vapor permeability compared to N2. This is caused by the different permeation mechanisms: the water permeability is controlled by the solubility, whereas the N2 permeability is controlled by the diffusion. 6.5 Acknowledgements The European Union is kindly acknowledged for supporting this project: Brite Euram III, Contract no. BRPR-CT 98-0804 6.6 References (1) Barrie, J. A. In Diffusion in Polymers; Crank, J.; Park, G. S., Eds.;
Academic Press, 1968. (2) Barrie, J. A. Proceeding of the fourth BOC Priestly Conference 1986, 89-
113. (3) Paul, D. R. Macromol. Symp 1999, 138, 13-20. (4) Robeson, L. M. J. Membr. Sci. 1991, 62, 165-185. (5) Nunes, S. P.; Peinemann, K.-V. Membrane technology in the chemical
industry; Wiley-VCH: Weinheim, 2001. (6) Metz, S. J.; Mulder, M. H. V.; Wessling, M. Chapter 4. (7) Metz, S. J.; Potreck, J.; Mulder, M. H. V.; Wessling, M. Chapter 2. (8) Boom, J. P.; Punt, I. G. M.; Zwijnenberg, H.; de Boer, R.; Bargeman,
D.; Smolders, C. A.; Strathmann, H. J. Membr. Sci. 1998, 138, 237-258.
Chater 6
122
(9) Stamatialis, D.; Wessling, M.; Sanopoulou, M.; Strathmann, H.; Petropoulos, J. J. Membr. Sci. 1997, 125, 165-175.
(10) Rezac, M. E.; John, T.; Pfromm, P. H. J. Appl. Polym. Sci. 1997, 65, 1983-1993.
(11) Wijmans, J. G.; Baker, R. W. J. Membr. Sci. 1995, 107, 1-21. (12) Favre, A.; Nguyen, Q. T.; Schaetzel, P.; Clement, R.; Neel, J. J. Chem.
Soc. Faraday. Trans. 1993, 89, 4339-4346. (13) Singh, A.; Freeman, B. D.; Pinnau, I. J. Polym. Sci., Polym. Phys. Ed.
1998, 36, 289-301. (14) Metz, S. J.; van der Vegt, N. F. A.; Mulder, M. H. V.; Wessling, M.
Chapter 5. (15) Deschamps, A. A.; Grijpma, D. W.; Feijen, J. Polymer 2001, 42, 9335-
9345. (16) Bezemer, J. M.; Grijpma, D. W.; Dijkstra, P. J.; van Blitterswijk, C. A.;
Feijen, J. J. Controlled Release 1999, 62, 393-405. (17) Merkel, T. C.; Bondar, V. I.; Nagai, K.; Freeman, B. D.; Pinnau, I. J.
Polym. Sci., Polym. Phys. Ed. 2000, 38, 415-434. (18) Koros, W. J.; Hellums, M. W. Fluid Phase Eq. 1989, 53, 339-354. (19) Mueller Plathe, F. journal of membrane science 1998, 141, 147-154. (20) Perrin, L.; Nguyen, Q. T.; Clement, R.; Neel, J. Polymer International
1996, 39, 251-260. (21) Rivin, D.; Kendrick, C.; Gibson, P.; Schneider, N. Polymer 2001, 42,
623-635. (22) Barrie, J. A.; Platt, B. Polymer 1963, 4, 303-313. (23) Wellons, J. D.; Stannett, V. J. Polym. Sci. 1966, 4, 593-602. (24) Doghieri, F. B., D. Sarti, G.C. Ind. Eng. Chem. Res. 1996, 35, 2420-2430. (25) Mulder, M. H. V. Basic principles of membrane technology, second ed.;
Kluwer: Dordrecht, 1996. (26) Zimm, B. H.; Lundberg, J. L. J. Chem. Phys. 1953, 21, 934. (27) Zimm, B. H.; Lundberg, J. L. J. Chem. Phys. 1956, 60, 425. (28) Strathmann, H.; Michaels, A. S. Desalination 1977, 21, 195-202. (29) Ide, M. Y., D. Maeda, Y. Kitano, H. LANGMUIR 1999, 15, 926-929. (30) Walrafen, G. E. Structure of water and Aqueous solutions; Verlag Chemie:
Weinheim, 1974. (31) Muller-Plathe, F. Macromolecules 1998, 31, 6721-6723. (32) Holz, M.; Heil, S. R.; Sacco, A. Phys. Chem. Chem. Phys. 2000, 2, 4740-
4742. (33) Muller-Plathe, F. J. Membr. Sci. 1998, 141, 147-154. (34) Krevelen, D. W. v. Properties of polymers, 3rd ed.; Elsevier: Amsterdam,
1990.
Mixed gas water vapor/N2 transport in PEO PBT Block copolymers
123
(35) Dixon-Garrett, S. V.; Nagai, K.; Freeman, B. D. J. Polym. Sci., Polym. Phys. Ed. 2000, 38, 1078-1089.
(36) Pinnau, I. T., L.G. J. Membr. Sci. 1996, 116, 199-209. (37) Poling, B. E.; Prausnitz, J. M.; O'Connell, J. P. The properties of gases
and liquids; McGraw-Hill: New York, 2001. (38) Bondar, V. I.; Freeman, B. D.; Pinnau, I. J. Polym. Sci., Polym. Phys. Ed.
1999, 37, 2463-2475. (39) Janssen, L. P. B. M.; Warmoeskerken, M. M. C. G. Transport phenomena
data companion; Delftse Uitgevers Maatschappij: Delft, 1991.

124
125
Summary Water vapor transport through polymeric materials plays an important role in a large number of applications such as: food packaging, breathable clothing, roofing membranes, diapers, and the removal of water vapor from gas streams (e.g. dehydration of natural gas or the drying of compressed air). Depending on the application a high or low permeability or selectivity is preferable. This thesis investigates the transport of water vapor and various gases through polyethylene oxide (PEO) polybutylene terephthalate (PBT) block copolymers and asymmetric polyether sulfone (PES) polyimide (PI) blend hollow fiber membranes. Chapter 2 describes the permeation set-up, which is used in this thesis for the simultaneous measurement of the transport rate of a water vapor gas mixture, in the pressure range of 1 – 80 bar and the temperature range of 20 – 80°C. This set-up uses a helium sweep gas to remove the water vapor on the permeate side of the membrane in order to determine their transport rates. The resistances for permeation in stagnant boundary layers complicate the exact quantification of the water vapor permeability from the overall transport rate. These resistances are determined and subtracted from the overall resistance for water vapor permeation, resulting in the membrane resistance. Water vapor permeability values of ethyl cellulose and polysulfone films determined and corrected for the resistance in the stagnant boundary layers correspond to those in literature. Permeability values of a highly permeable PEO-PBT block copolymer are presented to illustrate the contribution of the stagnant boundary layers at various process conditions to the overall water vapor permeance. The influence of water vapor on the gas permeation rates through a PES/PI asymmetric blend hollow fiber is discussed in Chapter 3. An increase of the water vapor concentration in the feed gas mixture lowers the permeation rates of water vapor, carbon dioxide, and nitrogen. The resistance towards mass transport for water vapor was studied at various feed- and permeate flow rates, enabling the derivation of Sherwood relations, which describe the variation of the overall mass transfer coefficient at various process conditions. This analysis reveals that the main resistance for water vapor transport is situated in the stagnant feed boundary layer. An increase of the total pressure at constant water vapor activity resulted in a reduction of the water vapor permeance due to a lower diffusivity of water vapor in the stagnant feed boundary layer. The nitrogen permeance remained constant with an increase of total pressure, whereas the carbon dioxide permeance increased due to plasticization of the membrane.
Summary
126
Chapter 4 covers a systematic study of the effect of the PEO-PBT block copolymer composition on the gas permeation properties. The composition of these block copolymers is varied by: (1) the amount of PEO, at constant PEO segment length, (2) the PEO segment length a constant PEO-PBT weight ratio. The carbon dioxide/nitrogen selectivity is high (α ≈ 60 at T = 35°C), due to the high solubility of carbon dioxide in the PEO phase. The carbon dioxide/nitrogen selectivity shows a different structural dependency than the carbon dioxide/helium selectivity, since carbon dioxide and nitrogen permeate mainly through the amorphous PEO phase whereas helium permeates through both the PEO and PBT phase. The gas permeability values measured for carbon dioxide and nitrogen are compared with the Maxwell model, which considers the PBT phase as impermeable for carbon dioxide and nitrogen. The difference between the experimental values and the Maxwell model are interpreted on the basis of chain flexibility of the PEO phase The chain flexibility decreases with increasing amounts of PBT due to a less pronounced phase separation between the PEO and PBT phase. The permeability depends also on the degree of crystallinity and the melting temperature of the PEO phase, which increases with the amount and the PEO segment length. The influence of the composition of PEO-PBT block copolymers on the solubility of water vapor and the thermodynamic quantities governing the solubility of water vapor in these polymers is studied in Chapter 5. The sorption isotherms are analyzed with the Flory Huggins model and the interaction parameter (χ) being the fitting parameter, which decreases with the water vapor activity and is lower for block copolymers with a longer PEO segments and higher PEO content. The solvation Gibbs energies, entropies and enthalpies are extracted from temperature dependent sorption data. They reveal that: (1) water-polymer interactions are stronger than water-water interactions in liquid water, (2) the water-polymer interactions become weaker at higher water vapor activities, (3) the water sorption entropy increases with increasing vapor activity. The latter is responsible for the convex nature of the water sorption isotherm. Moreover, this effect depends on the structure of the polymer: the larger the PEO segment length and the more PEO weight fraction, the higher the solvation entropy and, consequently, the solubility of water vapor in the PEO-PBT block copolymer. Chapter 6 studies the mass transport properties for water vapor and nitrogen for a series of PEO-PBT block copolymers with a PEO segment of 1000 g/mol, but with various amounts of PBT via: (a) the water vapor sorption, (b) the permeation of water vapor/nitrogen mixtures, (c) the diffusion of water vapor, (d) Zimm and
Summary
127
Lundberg cluster analysis, and (e) the state of water in these polymers via FTIR-ATR analysis. The water vapor permeability increases with the amount of PEO due to a higher solubility and diffusivity for water vapor. The diffusivity of water vapor decreases significantly with an increase of the amount of water vapor sorbed in the block copolymer. This decrease is caused by the clustering of water vapor, as revealed by a Zimm and Lundberg cluster analysis of the sorption isotherm and by FTIR-ATR. The mixed gas nitrogen permeability remains constant with an increase of water vapor activity but depends strongly on the polymeric structure, whereas the water vapor permeability depends mainly on the solubility in the block copolymer. This causes a higher water vapor/nitrogen selectivity for block copolymers containing more PBT.

128
129
Samenvatting “voor niet-membraantechnologen”
Dit proefschrift beschrijft het onderzoek dat is verricht om te begrijpen hoe een waterdamp/gasmengsel door een polymeer (plastic) membraan wordt getransporteerd. Met een membraan wordt in dit geval een dunne polymere film bedoeld waar waterdamp sneller doorheen gaat (permeëert) dan andere gassen. De permeatie van waterdamp door polymere materialen is in vele toepassingen belangrijk bijvoorbeeld in: verpakkingsmateriaal (bijvoorbeeld een boterhamzakje), ademende kleding (bijvoorbeeld Goretex®- of Sympatex®jassen), ademend schoeisel, handschoenen, dakbedekkingsmateriaal, luiers en de verwijdering van waterdamp uit gasstromen (bijvoorbeeld de ontwatering van aardgas en het drogen van perslucht). Afhankelijk van de toepassing kan een hoge (of lage) selectiviteit met een hoge (of lage) transportsnelheid (permeabiliteit) door een membraan gewenst zijn. In hoofdstuk 2 wordt een nieuwe experimentele opstelling beschreven waarin de transportsnelheid van waterdamp en een gasmengsel door een polymeer materiaal gelijktijdig kunnen worden gemeten. Deze meting is voor waterdamp lastig, omdat waterdamp zo snel door deze membranen permeëert. Hierdoor is de concentratie waterdamp aan het membraanoppervlak lager is dan in de bulk van het gas dat over het membraan stroomt. Daardoor moet waterdamp uit de gasfase naar het membraanoppervlak getransporteerd worden en dit verlaagt de totale transportsnelheid. Hierdoor ontstaat er een extra weerstand voor het transport van waterdamp aan de voedingszijde van het membraan. Ook aan de afvoerzijde (permeaat) bevindt zich een weerstand tegen waterdamptransport. Deze weerstanden zijn bepaald en hierdoor is het mogelijk is om de permeabiliteit van het membraan te bepalen. Dit is getest voor 2 materialen (ethyl cellulose en polysulfone) en deze waarden komen goed overeen met literatuurwaarden. De bijdrage van de grenslaagweerstanden is gevisualiseerd voor een hoog permeabel polyethylene oxide (PEO) polybutylene terephthalate (PBT) blokcopolymeer. Het effect van waterdamp op de transportsnelheid van kooldioxide (CO2) en stikstof (N2) door holle membraangasscheidingsvezels is beschreven in hoofdstuk 3. Deze gasscheidingsvezels zijn asymmetrisch (d.w.z. dat deze vezel een heel dun laagje, ongeveer een tienduizendste deel van een millimeter, polymeer heeft dat ondersteund wordt door een poreuze polymere structuur van hetzelfde materiaal). Dit polymeer bestaat uit een mengsel van de volgende polymeren: polyethersulfone en polyimide. Uit metingen van de transportsnelheid door dit membraan met een waterdamp gasmengsel volgt dat wanneer de
Samenvatting
130
waterdampconcentratie in het gasmengsel toeneemt, dat de permeabiliteiten van waterdamp, CO2 en N2 door dit membraan afnemen. De transportsnelheden van waterdamp zijn bepaald voor het transport van: (1) waterdamp uit het gasmengsel naar het membraan, (2) door het membraan en (3) vanuit het membraan naar de binnenzijde van het holle vezelmembraan. Hieruit volgt dat de grootste transportweerstand zich bevindt in het transport van waterdamp uit de gasfase naar het membraanoppervlak. Een gevolg hiervan is dat wanneer de totale druk van het gasmengsel wordt verhoogd, bij een constante waterdamp concentratie in het gas, de transportsnelheid van waterdamp afneemt door een lagere diffusiecoëfficiënt van waterdamp door het gas aan de voedingszijde van het membraan. Bij een druktoename blijft de transportsnelheid van N2 constant, terwijl de transportsnelheid van CO2 toeneemt. Dit laatste komt door verweking (plastificering) van het membraanmateriaal. In hoofdstuk 4 is de permeatie van zuivere gassen door PEO-PBT blokcopolymeren beschreven. Dit polymeer bestaat uit 2 afzonderlijke polymere delen die via een chemische binding aan elkaar verbonden zijn. In dit polymeer bevinden zich meerdere delen (blokken) van PEO en PBT. Door de verhouding en de grootte van de afzonderlijke te variëren, kunnen de eigenschappen van dit polymeer worden aangepast. Het PEO blok is een zeer flexibel polymeer (rubberachtig) dat makkelijk gassen doorlaat. Het PBT blok is star (glasachtig) en laat minder goed gassen door. Door de samenstelling van zo’n blokcopolymeer te veranderen, verandert ook de transportsnelheid door het materiaal. De eigenschappen van dit materiaal zijn gevarieerd door (1) de hoeveelheid PEO, bij constante PEO bloklengte, (2) de PEO bloklengte, bij constante verhouding PEO-PBT. De CO2/N2 selectiviteit is hoog voor deze materialen (CO2 gaat 60 keer sneller door het materiaal dan N2 bij 35°C). Doordat CO2 en N2 beide door de PEO fase diffunderen en helium (He) door zowel de PEO en PBT fase, vertonen de CO2/ N2 en CO2/He selectiviteit een verschillende afhankelijkheid van de samenstelling van het blokcopolymeer. De CO2 en N2 permeabiliteiten zijn vergeleken met het Maxwell model dat de PBT fase als impermeabel veronderstelt. Het verschil tussen het model en de gemeten waarden wordt geïnterpreteerd op basis van ketenflexibiliteit van de PEO fase. Deze neemt af met een toename van de hoeveelheid PBT, door een slechtere fasescheiding tussen de PEO en PBT blokken. Hierdoor bevinden zich tussen de PEO blokken nog delen PBT die de bewegelijkheid van de PEO blokken verlagen. De permeabiliteit hangt tevens af van de crystalliniteit en de smelttemperatuur van de PEO fase, welke toeneemt met de hoeveelheid PEO en PEO bloklengte.
Samenvatting
131
De invloed van de samenstelling van het PEO-PBT blokcopolymeer op de oplosbaarheid van waterdamp en hun thermodynamische grootheden, zoals de bindingssterkte tussen water en zijn omgeving in het polymeer en het aantal mogelijke manieren hoe water zich in het polymeer kan bevinden wordt bestudeerd in hoofdstuk 5 aan de hand van waterdampsorptie-isothermen. Deze isothermen beschrijven hoeveel water er in het polymeer zit bij een bepaalde waterdamp concentratie in de gasfase. Deze sorptie-isothermen nemen eerst lineair toe bij lage waterdampconcentratie en bij hogere concentratie nemen ze exponentieel toe. Deze sorptie-isothermen zijn gefit met het Flory-Huggins model waarin de interactieparameter (χ) als fitparameter is gebruikt. De interactieparameter neemt af met toenemende waterdampconcentratie in het polymeer en geeft aan dat het energetisch gunstiger wordt voor waterdamp om zich in het polymeer te bevinden. Of dit nu komt door een sterkere binding tussen water en zijn omgeving of doordat het polymeer zo sterk gezwollen is, zodat er meer water in past, wordt onderzocht met een thermodynamische analyse. Deze analyse toont aan dat: (1) water-polymeer bindingen sterker zijn dan water-water bindingen, (2) water-polymeer bindingen zwakker worden wanneer de hoeveelheid water toeneemt, (3) het aantal mogelijkheden dat water in het polymeer past toeneemt wanneer er meer water in het polymeer zit. Dit laatste wordt veroorzaakt door zwelling van het polymeer, waardoor er meer watermoleculen in het polymeer passen. In hoofdstuk 6 wordt het transport van een waterdamp/N2 mengsel bestudeerd voor PEO-PBT blokcopolymer met een vaste lengte van het PEO blok (1000 g/mol) maar met verschillende hoeveelheden PBT. De polymeren transporteren waterdamp ongeveer 50.000 keer sneller dan N2 (bij 30°C), wat ontzettend hoog is voor een polymeer. De waterdamp permeatie neemt toe met de hoeveelheid PEO in het blokcopolymeer door een hogere oplosbaarheid van water in dit deel. (Wanneer er zich meer watermoleculen in het polymeer zijn dan bewegen er ook meer doorheen). Echter de diffusie van water neemt af wanneer er zich meer watermoleculen in het polymeer bevinden. Deze afname vindt gelijktijdig plaats met de clustering van water in het polymeer (d.w.z. in het polymeer bevinden zich gebiedjes waarin zich 2, 3 of meer watermoleculen bevinden). Waarschijnlijk vinden de watermoleculen het energetisch gunstiger om zich in een cluster te bevinden dan zich door het polymeer te diffunderen.
132
Dankwoord Vier jaar promoveren lijkt veel als je eraan begint, maar eenmaal begonnen vloog de tijd voorbij en zit ik dit dankwoord te schrijven. Dat deze periode zo snel voorbij is gegaan komt door de speciale omgeving waarin ik mij bevind. Door het hoge aantal sociale activiteiten in de membraangroep zoals: koffiepauzes, borrels, karten, zeilweekend, kroamschudparties, Geusavonden, BBQ’s, batavierenraces, promotiefeesten, bruiloften, fietstochten enz., voelde ik mij snel thuis en werd ik al snel een echte “membrane lover”. Hiervoor wil ik de hele membraantechnologiegroep en iedereen die op wat voor wijze dan ook aan dit proefschrift hebben bijgedragen bedanken. Een aantal mensen wil ik in het bijzonder bedanken. Allereerst natuurlijk Marcel Mulder. Marcel nam mij als AIO aan en heeft mij, op een voor mij ideale manier, 3 jaar kunnen begeleiden. Marcel gaf mij alle vrijheid en heeft mij nooit zijn ideeën laten uitvoeren, maar probeerde mij via hints en het stellen van veel vragen een eigen beeld te laten vormen. Hiervan heb ik veel geleerd. Ik vind het ontzettend jammer dat ik Marcel nu niet meer bedanken kan. Nico, jou enthousiasme voor de wetenschap stak vele andere mensen aan, ook mensen die jij niet direct begeleidt. Van jou heb ik veel geleerd en ik vind het ontzettend leuk om samen met jou aan hoofdstuk 5 te hebben gewerkt. Matthias wil ik bedanken voor het corrigeren van mijn proefschrift en het stellen van een schijnbaar oneindig aantal vragen, waardoor ik vaak diep moest nadenken en dingen anders moest schrijven. Betty, jou wil ik bedanken voor de eerste 2 maanden toen jij in mijn project werkte. Van jou heb ik geleerd hoe je een membraan moest maken, een sorptie-experiment deed, hoe de gaspermeatie opstelling werkt enz. Veel werk dat in dit proefschrift is beschreven is uitgevoerd door een aantal studenten waaronder: Jens Potreck (Semesterpraktikum), Wilbert van de Ven en Cari van Rood (afstudeeropdracht) en Joris Smit en Stefan van Osch (literatuuropdracht). Uiteraard mijn kamergenoten Magda, Kitty, John Kroll, Dimitris, Nela, Jonathan en Laura voor de talloze discussies, roddels, hulp en adviezen.
133
George Kapantaidakis, I want to thank you for the collaboration and all the measurements we performed during the weekends for the work described in chapter 3. You also taught me some Greek words, which were very helpful to impress the Greek people whenever I was for a holiday in Greece. Een aantal mensen hebben mij enorm geholpen zoals: Klaus Ohlrogge, Torsten Brinkmann, Bernd Keil en Thomas Loewe van GKSS voor hun samenwerking in het Brite Euram III project, Arie Pleiter voor het bouwen van de waterdamp permeatieopstelling, Antoine voor het kritisch doorlezen van dit proefschrift, Bastiaan voor het vangen van de labtopdief, Greet voor al het papierwerk, Peter voor de vele schaakpartijen via het internet, iedereen van de werkplaats en inkoop, de mevrouw van de bieb die mijn naam wel weet maar ik de hare niet, Sandy te Poele, Jelle Roorda, Herman Evenblij en Jasper Verkerk voor het samen organiseren van NYM-3 en natuurlijk Wytse Wijbenga voor het ontwerpen van de voor- en achterkant van dit proefschrift. Heit en mem, al is het misschien moeilijk voor te stellen wat ik nu allemaal doe op de universiteit jullie hebben me altijd gesteund. Tige Tank! Marijje, jij hebt mij deze hele periode gesteund en de laatste 1,5 jaar wel van heel dichtbij dat was en is bjusterbaarlik!
![New advances in polymeric membranes for CO separation · 2016-06-15 · New advances in polymeric membranes for CO2 ... [1]. The membrane gas separation industry has grown dramatically](https://img.pdfslide.us/doc/110x75/5b1c992d7f8b9aef288b459c/new-advances-in-polymeric-membranes-for-co-2016-06-15-new-advances-in-polymeric.jpg)