Embed Size (px)
Citation preview
Water Transport in Multilayer Coatings
PROEFSCHRIFT
ter verkrijging van de graad van doctor aan deTechnische Universiteit Eindhoven, op gezag van derector magnificus, prof.dr.ir. C.J. van Duijn, voor een
commissie aangewezen door het College voor Promoties in het openbaar te verdedigenop maandag 5 maart 2012 om 16.00 uur
door
Viktor Baukh
geboren te Komsomolsk aan de Amoer, Rusland
1
Dit proefschrift is goedgekeurd door de promotoren:
prof.dr.ir. O.C.G. Adanenprof.dr. P.J. McDonald (University of Surrey)
Copromotor:dr.ir. H.P. Huinink
Cover design: Viktor Baukh Printed by: Printservice of Eindhoven University of Technology A catalogue record is available from the Library of Eindhoven University of Technology Proefschrift. ISBN: 978-90-386-3104-2 The research described in this thesis has been done in the group Transport in Permeable Media at the Eindhoven University of Technology, Department of Applied Physics. The research was supported by TNO, TU/e and AkzoNobel Automotive and Aerospace Coatings
2

to my beloved wife Gyulnara,my mother and my grandparents.
3

4
4
Contents
1. Introduction . . . . . . . . . . . . . . . . . . . . . . . . . . . . . . . . . . 71.1 The context . . . . . . . . . . . . . . . . . . . . . . . . . . . . . . . . . 71.2 Goals and Outline . . . . . . . . . . . . . . . . . . . . . . . . . . . . . . 11
2. Water in Organic Coatings . . . . . . . . . . . . . . . . . . . . . . . . . . . 132.1 Introduction . . . . . . . . . . . . . . . . . . . . . . . . . . . . . . . . . 132.2 Equilibrium Sorption in Coatings . . . . . . . . . . . . . . . . . . . . . . 132.3 Kinetics of Diffusion in Coatings . . . . . . . . . . . . . . . . . . . . . . 162.4 Water in Multilayer Coatings . . . . . . . . . . . . . . . . . . . . . . . . 17
3. Nuclear Magnetic Resonance . . . . . . . . . . . . . . . . . . . . . . . . . 193.1 Introduction . . . . . . . . . . . . . . . . . . . . . . . . . . . . . . . . . 193.2 NMR Principles . . . . . . . . . . . . . . . . . . . . . . . . . . . . . . . 193.3 T1 Relaxation . . . . . . . . . . . . . . . . . . . . . . . . . . . . . . . . 233.4 T2 Relaxometry . . . . . . . . . . . . . . . . . . . . . . . . . . . . . . . 233.5 NMR Signal . . . . . . . . . . . . . . . . . . . . . . . . . . . . . . . . . 25
4. Water Uptake Visualization . . . . . . . . . . . . . . . . . . . . . . . . . . 274.1 Introduction . . . . . . . . . . . . . . . . . . . . . . . . . . . . . . . . . 274.2 Samples Description . . . . . . . . . . . . . . . . . . . . . . . . . . . . 274.3 NMR Equipment . . . . . . . . . . . . . . . . . . . . . . . . . . . . . . 294.4 NMR Imaging Procedure . . . . . . . . . . . . . . . . . . . . . . . . . . 304.5 Results . . . . . . . . . . . . . . . . . . . . . . . . . . . . . . . . . . . . 314.6 Conclusions . . . . . . . . . . . . . . . . . . . . . . . . . . . . . . . . . 37
5. Water-Polymer Interactions During Uptake . . . . . . . . . . . . . . . . . . 395.1 Introduction . . . . . . . . . . . . . . . . . . . . . . . . . . . . . . . . . 395.2 Experimental Details . . . . . . . . . . . . . . . . . . . . . . . . . . . . 405.3 Results . . . . . . . . . . . . . . . . . . . . . . . . . . . . . . . . . . . . 415.4 Depicting the Uptake Process . . . . . . . . . . . . . . . . . . . . . . . . 525.5 Conclusions . . . . . . . . . . . . . . . . . . . . . . . . . . . . . . . . . 52
5
6 Contents
6. Modeling Water Transport Kinetics . . . . . . . . . . . . . . . . . . . . . . 576.1 Introduction . . . . . . . . . . . . . . . . . . . . . . . . . . . . . . . . . 576.2 Experimental Details . . . . . . . . . . . . . . . . . . . . . . . . . . . . 576.3 Theory . . . . . . . . . . . . . . . . . . . . . . . . . . . . . . . . . . . . 596.4 Results . . . . . . . . . . . . . . . . . . . . . . . . . . . . . . . . . . . . 646.5 Conclusions . . . . . . . . . . . . . . . . . . . . . . . . . . . . . . . . . 70
7. Water Transport and Humidity Fluctuations . . . . . . . . . . . . . . . . . . 737.1 Introduction . . . . . . . . . . . . . . . . . . . . . . . . . . . . . . . . . 737.2 Theory . . . . . . . . . . . . . . . . . . . . . . . . . . . . . . . . . . . . 747.3 Behavior of BC/TC systems . . . . . . . . . . . . . . . . . . . . . . . . 777.4 Conclusions . . . . . . . . . . . . . . . . . . . . . . . . . . . . . . . . . 81
8. Plasticizer in Top Coats: Influence of Stress Relaxation on Transport . . . . . 838.1 Introduction . . . . . . . . . . . . . . . . . . . . . . . . . . . . . . . . . 838.2 Experimental Details . . . . . . . . . . . . . . . . . . . . . . . . . . . . 848.3 Theory . . . . . . . . . . . . . . . . . . . . . . . . . . . . . . . . . . . . 868.4 Results . . . . . . . . . . . . . . . . . . . . . . . . . . . . . . . . . . . . 888.5 Discussion . . . . . . . . . . . . . . . . . . . . . . . . . . . . . . . . . . 928.6 Conclusions . . . . . . . . . . . . . . . . . . . . . . . . . . . . . . . . . 94
9. Conclusions and Outlook . . . . . . . . . . . . . . . . . . . . . . . . . . . 959.1 Conclusions . . . . . . . . . . . . . . . . . . . . . . . . . . . . . . . . . 959.2 Outlook . . . . . . . . . . . . . . . . . . . . . . . . . . . . . . . . . . . 96
Bibliography . . . . . . . . . . . . . . . . . . . . . . . . . . . . . . . . . . . . 101
Summary . . . . . . . . . . . . . . . . . . . . . . . . . . . . . . . . . . . . . 111
List of publications . . . . . . . . . . . . . . . . . . . . . . . . . . . . . . . . 115
Acknowledgements . . . . . . . . . . . . . . . . . . . . . . . . . . . . . . . . 117
Curriculum vitae . . . . . . . . . . . . . . . . . . . . . . . . . . . . . . . . . . 119
6
1. Introduction
1.1 The context
Paints and coatings are a common way to protect and decorate objects. Various industriesuse coatings to enhance the properties of their products: building, automotive, marine,aerospace industries, etc. Annually the coating industry produces more than 30 billion kgof coatings and presently has a revenue of ca. 100 billion USD per year.
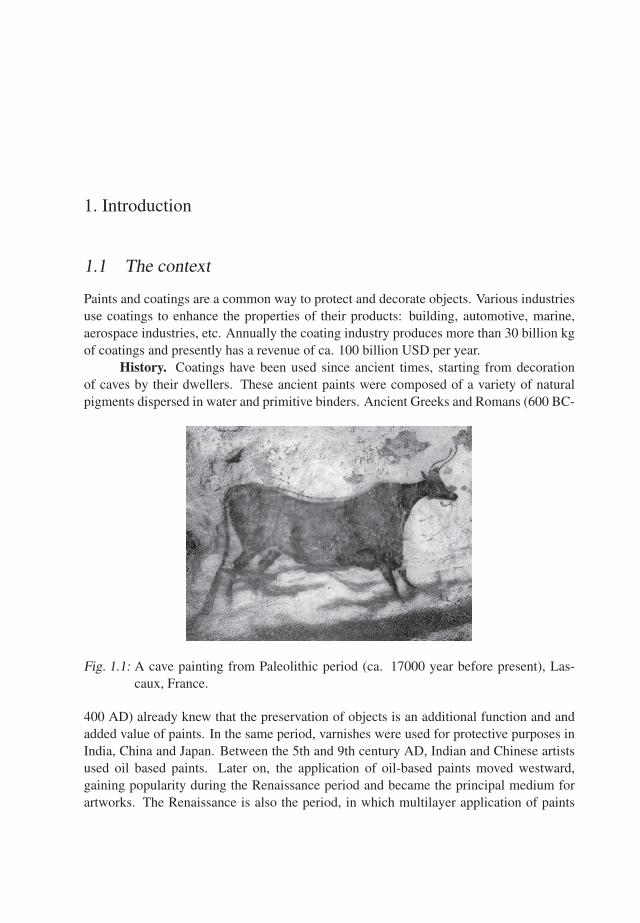
History. Coatings have been used since ancient times, starting from decorationof caves by their dwellers. These ancient paints were composed of a variety of naturalpigments dispersed in water and primitive binders. Ancient Greeks and Romans (600 BC-
Fig. 1.1: A cave painting from Paleolithic period (ca. 17000 year before present), Las-caux, France.
400 AD) already knew that the preservation of objects is an additional function and andadded value of paints. In the same period, varnishes were used for protective purposes inIndia, China and Japan. Between the 5th and 9th century AD, Indian and Chinese artistsused oil based paints. Later on, the application of oil-based paints moved westward,gaining popularity during the Renaissance period and became the principal medium forartworks. The Renaissance is also the period, in which multilayer application of paints
7
8 1. Introduction
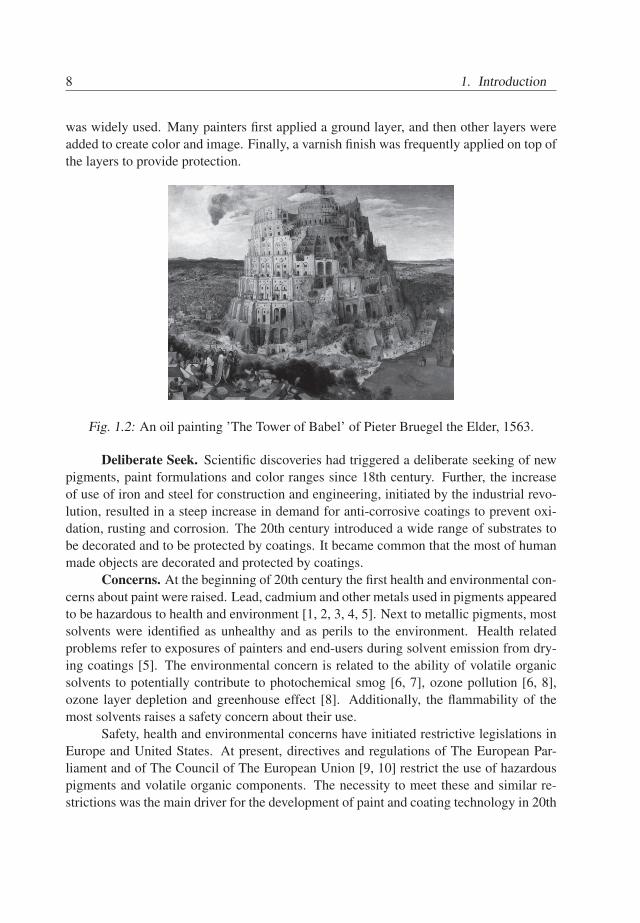
was widely used. Many painters first applied a ground layer, and then other layers wereadded to create color and image. Finally, a varnish finish was frequently applied on top ofthe layers to provide protection.
Fig. 1.2: An oil painting ’The Tower of Babel’ of Pieter Bruegel the Elder, 1563.
Deliberate Seek. Scientific discoveries had triggered a deliberate seeking of newpigments, paint formulations and color ranges since 18th century. Further, the increaseof use of iron and steel for construction and engineering, initiated by the industrial revo-lution, resulted in a steep increase in demand for anti-corrosive coatings to prevent oxi-dation, rusting and corrosion. The 20th century introduced a wide range of substrates tobe decorated and to be protected by coatings. It became common that the most of humanmade objects are decorated and protected by coatings.
Concerns. At the beginning of 20th century the first health and environmental con-cerns about paint were raised. Lead, cadmium and other metals used in pigments appearedto be hazardous to health and environment [1, 2, 3, 4, 5]. Next to metallic pigments, mostsolvents were identified as unhealthy and as perils to the environment. Health relatedproblems refer to exposures of painters and end-users during solvent emission from dry-ing coatings [5]. The environmental concern is related to the ability of volatile organicsolvents to potentially contribute to photochemical smog [6, 7], ozone pollution [6, 8],ozone layer depletion and greenhouse effect [8]. Additionally, the flammability of themost solvents raises a safety concern about their use.
Safety, health and environmental concerns have initiated restrictive legislations inEurope and United States. At present, directives and regulations of The European Par-liament and of The Council of The European Union [9, 10] restrict the use of hazardouspigments and volatile organic components. The necessity to meet these and similar re-strictions was the main driver for the development of paint and coating technology in 20th
8
1.1. The context 9
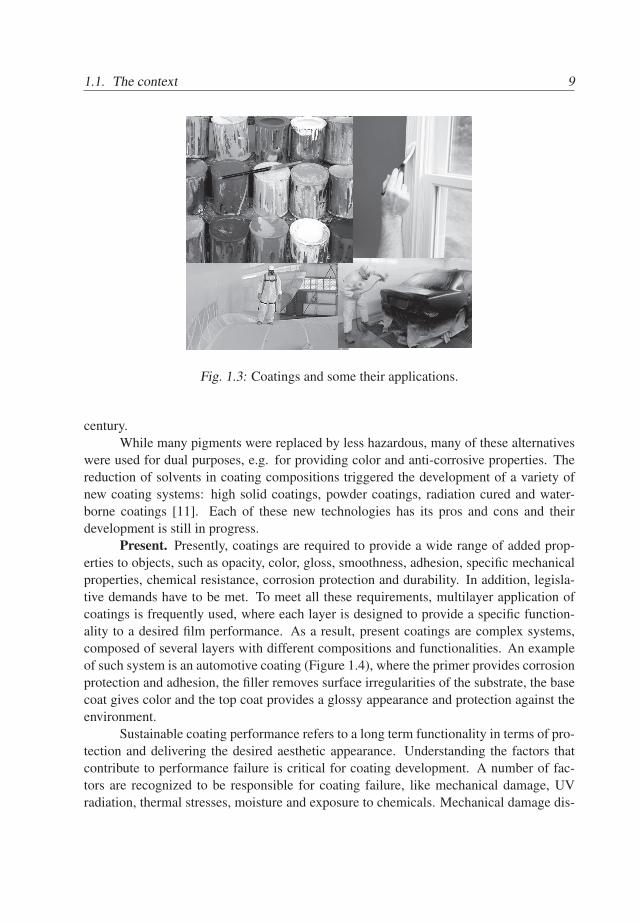
Fig. 1.3: Coatings and some their applications.
century.While many pigments were replaced by less hazardous, many of these alternatives
were used for dual purposes, e.g. for providing color and anti-corrosive properties. Thereduction of solvents in coating compositions triggered the development of a variety ofnew coating systems: high solid coatings, powder coatings, radiation cured and water-borne coatings [11]. Each of these new technologies has its pros and cons and theirdevelopment is still in progress.
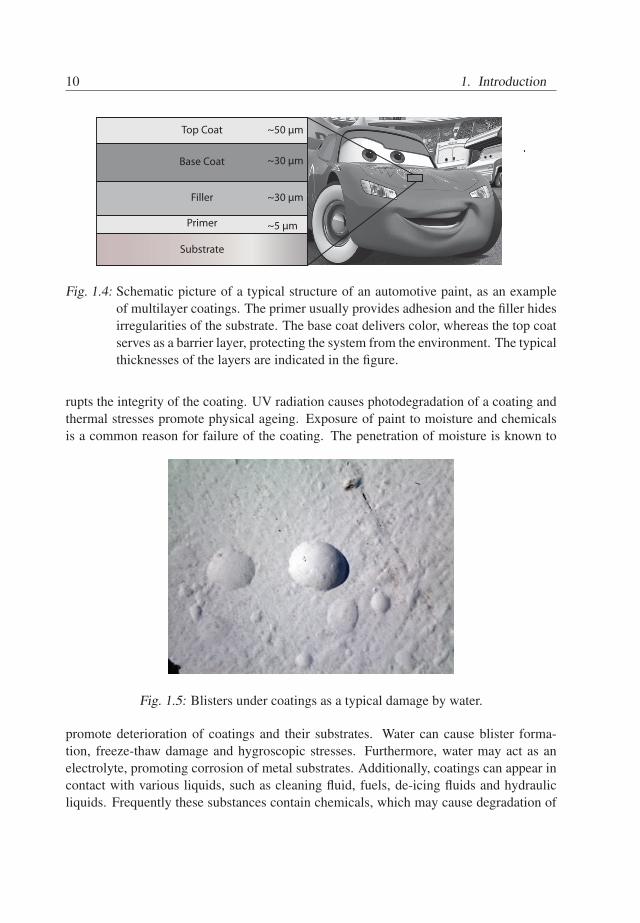
Present. Presently, coatings are required to provide a wide range of added prop-erties to objects, such as opacity, color, gloss, smoothness, adhesion, specific mechanicalproperties, chemical resistance, corrosion protection and durability. In addition, legisla-tive demands have to be met. To meet all these requirements, multilayer application ofcoatings is frequently used, where each layer is designed to provide a specific function-ality to a desired film performance. As a result, present coatings are complex systems,composed of several layers with different compositions and functionalities. An exampleof such system is an automotive coating (Figure 1.4), where the primer provides corrosionprotection and adhesion, the filler removes surface irregularities of the substrate, the basecoat gives color and the top coat provides a glossy appearance and protection against theenvironment.
Sustainable coating performance refers to a long term functionality in terms of pro-tection and delivering the desired aesthetic appearance. Understanding the factors thatcontribute to performance failure is critical for coating development. A number of fac-tors are recognized to be responsible for coating failure, like mechanical damage, UVradiation, thermal stresses, moisture and exposure to chemicals. Mechanical damage dis-
9
10 1. Introduction
Base Coat
Filler
Top Coat
Primer
Substrate
~30 µm
~50 µm
~5 µm
~30 µm
Fig. 1.4: Schematic picture of a typical structure of an automotive paint, as an exampleof multilayer coatings. The primer usually provides adhesion and the filler hidesirregularities of the substrate. The base coat delivers color, whereas the top coatserves as a barrier layer, protecting the system from the environment. The typicalthicknesses of the layers are indicated in the figure.
rupts the integrity of the coating. UV radiation causes photodegradation of a coating andthermal stresses promote physical ageing. Exposure of paint to moisture and chemicalsis a common reason for failure of the coating. The penetration of moisture is known to
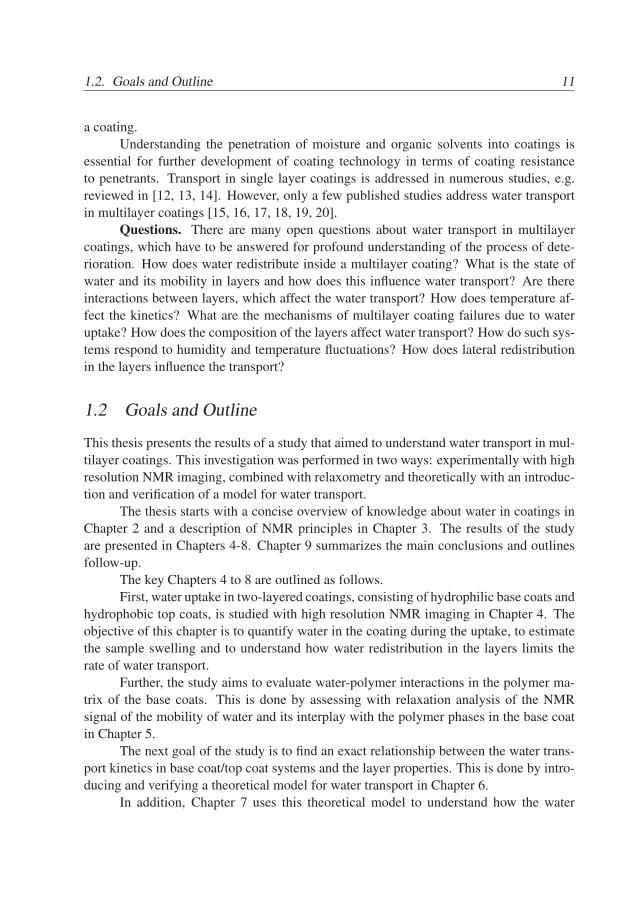
Fig. 1.5: Blisters under coatings as a typical damage by water.
promote deterioration of coatings and their substrates. Water can cause blister forma-tion, freeze-thaw damage and hygroscopic stresses. Furthermore, water may act as anelectrolyte, promoting corrosion of metal substrates. Additionally, coatings can appear incontact with various liquids, such as cleaning fluid, fuels, de-icing fluids and hydraulicliquids. Frequently these substances contain chemicals, which may cause degradation of
10
1.2. Goals and Outline 11
a coating.Understanding the penetration of moisture and organic solvents into coatings is
essential for further development of coating technology in terms of coating resistanceto penetrants. Transport in single layer coatings is addressed in numerous studies, e.g.reviewed in [12, 13, 14]. However, only a few published studies address water transportin multilayer coatings [15, 16, 17, 18, 19, 20].
Questions. There are many open questions about water transport in multilayercoatings, which have to be answered for profound understanding of the process of dete-rioration. How does water redistribute inside a multilayer coating? What is the state ofwater and its mobility in layers and how does this influence water transport? Are thereinteractions between layers, which affect the water transport? How does temperature af-fect the kinetics? What are the mechanisms of multilayer coating failures due to wateruptake? How does the composition of the layers affect water transport? How do such sys-tems respond to humidity and temperature fluctuations? How does lateral redistributionin the layers influence the transport?
1.2 Goals and Outline
This thesis presents the results of a study that aimed to understand water transport in mul-tilayer coatings. This investigation was performed in two ways: experimentally with highresolution NMR imaging, combined with relaxometry and theoretically with an introduc-tion and verification of a model for water transport.
The thesis starts with a concise overview of knowledge about water in coatings inChapter 2 and a description of NMR principles in Chapter 3. The results of the studyare presented in Chapters 4-8. Chapter 9 summarizes the main conclusions and outlinesfollow-up.
The key Chapters 4 to 8 are outlined as follows.First, water uptake in two-layered coatings, consisting of hydrophilic base coats and
hydrophobic top coats, is studied with high resolution NMR imaging in Chapter 4. Theobjective of this chapter is to quantify water in the coating during the uptake, to estimatethe sample swelling and to understand how water redistribution in the layers limits therate of water transport.
Further, the study aims to evaluate water-polymer interactions in the polymer ma-trix of the base coats. This is done by assessing with relaxation analysis of the NMRsignal of the mobility of water and its interplay with the polymer phases in the base coatin Chapter 5.
The next goal of the study is to find an exact relationship between the water trans-port kinetics in base coat/top coat systems and the layer properties. This is done by intro-ducing and verifying a theoretical model for water transport in Chapter 6.
In addition, Chapter 7 uses this theoretical model to understand how the water
11

12 1. Introduction
content of the base coat/top coat systems respond to humidity fluctuations.Finally, Chapter 8 aims to understand the penetration of plasticizer into a highly
crosslinked top coat. This is done by imaging plasticizer profiles in the coating duringuptake with high resolution NMR imaging and analysis of the penetration kinetics.
12

2. Water in Organic Coatings
2.1 Introduction
Penetration of water is an important process for the performance of organic coatings,since water can promote degradation of a coating and the substrate and can be a reasonfor failure of the decorative or protective function of the coating. Understanding watertransport in multilayer coatings requires an insight in of how water is present and diffusesin individual layers.
Individual layers of multilayer organic coatings consist mostly of a polymeric binder,fillers, pigments and various additives. Since pigments and fillers are usually imperme-able or insoluble materials, the transport of water mainly takes place through polymericbinder. Thus, this requires understanding of how water is present and migrates in poly-meric materials.
The goal of this chapter is to give a concise overview of the state of the art knowl-edge on sorption and transport in polymeric coatings. First, equilibrium sorption in poly-meric materials is discussed. Second, the kinetics of water transport is addressed. Finally,the chapter concludes with a brief overview of published studies about water in multilayercoatings.
2.2 Equilibrium Sorption in Coatings
The aim of this section is to give an overview of the state of the art of equilibrium sorptionin polymeric materials. It addresses typical sorption isotherms of polymers and discussesthe physical backgrounds.
The leading classification of equilibrium sorption isotherms, developed by Brunauer,Emmett and Teller [21] for porous materials, was adopted for moisture sorption in poly-mers by Barrie [22]. The commonly observed isotherms for polymers are linear isotherms,Type II and Type III, according to the BET classification (Figure 2.1). Linear isothermsare usually observed for hydrophobic polymers. Type II isotherms are usually observedfor hydrophilic polymers [23, 24, 25, 26, 27], whereas Type III isotherms are typical forless hydrophilic polymers [23, 28, 29].
Generally, the shape of the isotherm reflects how water is present in the poly-mer matrix. In polymers water may be present as dispersed and isolated molecules, as
13
14 2. Water in Organic Coatings
0.0 0.2 0.4 0.6 0.8 1.0
Site Bonding(-)
a (-)
Henry's law Type II Type III
Clustering
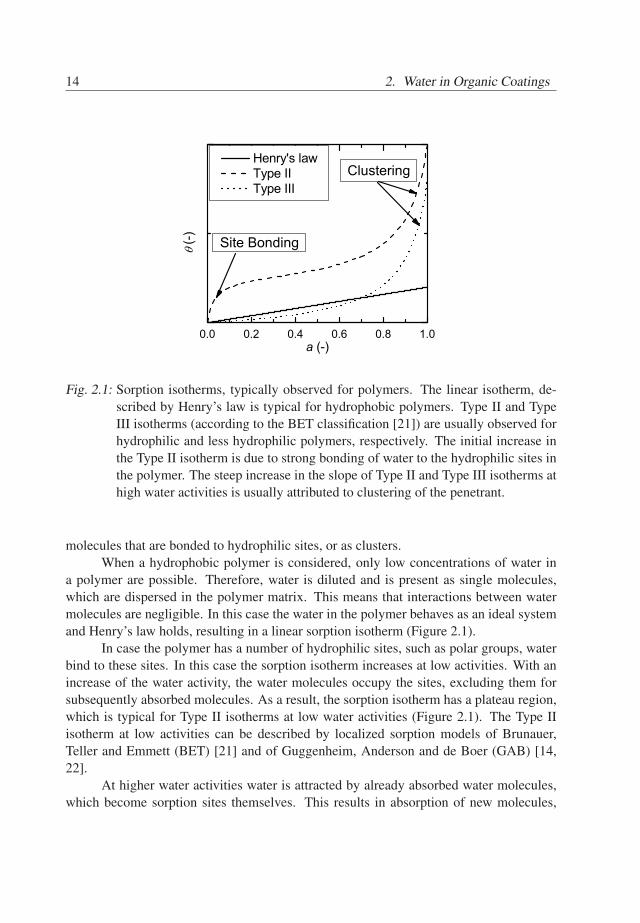
Fig. 2.1: Sorption isotherms, typically observed for polymers. The linear isotherm, de-scribed by Henry’s law is typical for hydrophobic polymers. Type II and TypeIII isotherms (according to the BET classification [21]) are usually observed forhydrophilic and less hydrophilic polymers, respectively. The initial increase inthe Type II isotherm is due to strong bonding of water to the hydrophilic sites inthe polymer. The steep increase in the slope of Type II and Type III isotherms athigh water activities is usually attributed to clustering of the penetrant.
molecules that are bonded to hydrophilic sites, or as clusters.When a hydrophobic polymer is considered, only low concentrations of water in
a polymer are possible. Therefore, water is diluted and is present as single molecules,which are dispersed in the polymer matrix. This means that interactions between watermolecules are negligible. In this case the water in the polymer behaves as an ideal systemand Henry’s law holds, resulting in a linear sorption isotherm (Figure 2.1).
In case the polymer has a number of hydrophilic sites, such as polar groups, waterbind to these sites. In this case the sorption isotherm increases at low activities. With anincrease of the water activity, the water molecules occupy the sites, excluding them forsubsequently absorbed molecules. As a result, the sorption isotherm has a plateau region,which is typical for Type II isotherms at low water activities (Figure 2.1). The Type IIisotherm at low activities can be described by localized sorption models of Brunauer,Teller and Emmett (BET) [21] and of Guggenheim, Anderson and de Boer (GAB) [14,22].
At higher water activities water is attracted by already absorbed water molecules,which become sorption sites themselves. This results in absorption of new molecules,
14
2.2. Equilibrium Sorption in Coatings 15
a) b)
Sorption Site
Sorbed Molecule
Cluster
New Sorption Site
due to Sorbed molecule
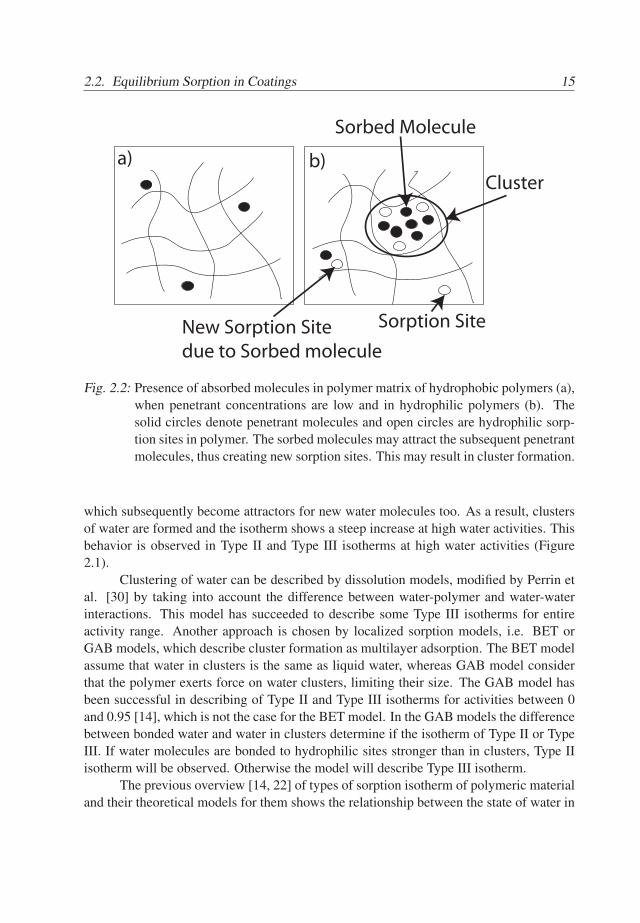
Fig. 2.2: Presence of absorbed molecules in polymer matrix of hydrophobic polymers (a),when penetrant concentrations are low and in hydrophilic polymers (b). Thesolid circles denote penetrant molecules and open circles are hydrophilic sorp-tion sites in polymer. The sorbed molecules may attract the subsequent penetrantmolecules, thus creating new sorption sites. This may result in cluster formation.
which subsequently become attractors for new water molecules too. As a result, clustersof water are formed and the isotherm shows a steep increase at high water activities. Thisbehavior is observed in Type II and Type III isotherms at high water activities (Figure2.1).
Clustering of water can be described by dissolution models, modified by Perrin etal. [30] by taking into account the difference between water-polymer and water-waterinteractions. This model has succeeded to describe some Type III isotherms for entireactivity range. Another approach is chosen by localized sorption models, i.e. BET orGAB models, which describe cluster formation as multilayer adsorption. The BET modelassume that water in clusters is the same as liquid water, whereas GAB model considerthat the polymer exerts force on water clusters, limiting their size. The GAB model hasbeen successful in describing of Type II and Type III isotherms for activities between 0and 0.95 [14], which is not the case for the BET model. In the GAB models the differencebetween bonded water and water in clusters determine if the isotherm of Type II or TypeIII. If water molecules are bonded to hydrophilic sites stronger than in clusters, Type IIisotherm will be observed. Otherwise the model will describe Type III isotherm.
The previous overview [14, 22] of types of sorption isotherm of polymeric materialand their theoretical models for them shows the relationship between the state of water in
15
16 2. Water in Organic Coatings
the polymer and the sorption isotherm. Linear isotherms suggest negligible water-waterinteractions and usually are observed for hydrophobic polymers with a low absorptioncapacity. Type II isotherm indicate that some water is bonded by hydrophilic sites atlow activities, i.e. polar groups, with a subsequent formation of water clusters at higheractivities. Type III isotherms indicate that sorption is mainly due to formation of waterclusters in the polymer.
2.3 Kinetics of Diffusion in Coatings
The goal of this section is to give an overview of typically observed diffusion types andtheir physical background.
The simpliest case of diffusion is Fickian diffusion. For Fickian diffusion it is char-acteristic that the redistribution of water occurs in a way that the concentration of wateris a unique function of x/
√t, where x is a distance from film/penetrant interface1. In this
cases diffusion is driven purely by the concentration gradient and there is a local equilib-rium at the sample surface. The total amount of water initially increases proportionallyto
√t [31]. When the diffusion coefficient steepely increases with water concentration,
a clear front develops that separatew the dry coating regions from regions of the coatingwith water. The front progresses linearly with
√t. In such cases small amounts of pen-
etrant cause plasticization of the polymer matrix, resulting in a higher diffusivity value,which in its turn allows quick penetrant redistribution behind the front.
Mostly, deviations from Fickian diffusion occur due to relaxation processes in thepolymer, e.g. caused by plasticizing penetrants. Such deviations become significant, whenthe timescale of relaxation becomes comparable with the diffusion timescale. The ratio ofthe relaxation timescale to the diffusion timescale is in fact the so-called Deborah numberDe, first introduced for sorption in polymers by Vrentas et al. [32]. Diffusion in glassypolymer systems typically occurs, when De ≫ 1, whereas diffusion in rubbery systemsis characterized by De ≪ 1. In both cases diffusion will have Fickian kinetics. Whenthe Deborah number becomes close to 1, the relaxation processes influence the transportkinetics and deviation from the typical behavior can be observed. The cases, when frontprogression rate departs from being linear with
√t and being linear with t, diffusion is
usually classified as anomalous diffusion [33].A well known extreme case when relaxation processes participate in the driving
force of the diffusion is Case II diffusion [34]. It is characterized by sharp concentrationprofiles, with a front, which progresses linearly with time. This was explained by diffu-sivity concentration dependency and relaxation processes by Thomas and Windle [34].
1 This holds as long as penetrant has not reached the interface, opposite to water/coating inter-face
16
2.4. Water in Multilayer Coatings 17
2.4 Water in Multilayer Coatings
Presently, only few studies have been dedicated to water uptake in multilayer films [15,16, 18]. Carbonini et al. [15] studied the effects of the chemical composition of theconstituent layers on the water uptake in a multilayer system with electroimpedance spec-troscopy. Park et al. [16] investigated multilayer coatings degradation and substrate cor-rosion during water sorption/desorption cycling. They showed that water absorption anddegradation of multilayered systems depend on the chemical characteristics of each layerand on the layer position in the system. Allahar et al. [18] studied water transport inboth single and multilayer epoxy/urethane coatings. They showed that despite observedFickian diffusion in each single layer, the Fickian diffusion is not sufficient to describethe process in the two-layered epoxy/urethane system.
17

18 2. Water in Organic Coatings
18
3. Nuclear Magnetic Resonance
3.1 Introduction
Investigation of water transport in multilayer organic coatings requires knowledge of wa-ter distributions in the layers and assessment of water polymer interactions.
Various techniques are used to probe water in organic coatings, such as gravimetry[35], electrochemical impedance spectroscopy [15, 16, 18, 36], Fourier transform infraredspectroscopy (FTIR) [37, 38, 39], fluorescent spectroscopy [40] and high resolution nu-clear magnetic resonance (NMR) imaging [41]. Except for NMR imaging and FTIR, thesetechniques only measure the total amount of water and do not probe interactions betweenwater and polymer. While FTIR is able to evaluate water-polymer interactions [42], it canprobe water distributions only in the direction, parallel to the coating plane [38, 39]. Fromthe listed techniques, NMR imaging is the only technique, which is capable to measurewith a high spatial resolution in the direction perpendicular to the coating plane.
The GARField approach for NMR imaging, introduced by Glover et al. [43], en-ables imaging with a high resolution of about 5µm. It was successfully used to obtainwater distributions in drying films [44, 45, 46, 47, 48]. Additionally, NMR relaxationanalysis was used to evaluate mobility of polymer chains during crosslinking reactions[49], crosslinking fronts in drying alkyd films [48] and to estimate diffusivity of water inwater-swollen cellophane [41]. Consequently, the combination of high resolution NMRimaging with NMR relaxometry can provide information about mobility of the polymerchains, water diffusivity and water content as a function of the position in the sample.Thus, this is a promising combination for studying water transport in multilayer coatings.
The aim of this chapter is to give an overview of NMR principles. For the detailedinformation about NMR we refer to the book ”Principles of Magnetic Resonance” [50].
3.2 NMR Principles
3.2.1 Magnetic Resonance
NMR is based on behavior of nuclei in magnetic fields. When a nuclear magnetic momentµ is located in a static magnetic field B0, it precesses around the field direction with a
19
20 3. Nuclear Magnetic Resonance
Larmor frequency ω0 [rad/s]ω0 = γ|B0|, , (3.1)
where γ is the gyromagnetic ratio of the nucleus. The gyromagnetic ratio has uniquevalues for each type of nuclei, e.g. for 1H γ = 42.58MHz/T. In this thesis we alwaysplace the static magnetic field B0 aligned along z-axis.
Nuclei in a magnetic field can be excited by a radio-frequency field B1, which isoriented perpendicular to the static static magnetic field. The RF-field has an angularfrequency ωRF . Further in this chapter we will discuss the motions in a reference frame,which rotates around the z-axis with an angular frequency equal to the radio-frequencyωRF . In this rotating frame the RF-field is static and is described by
B1 = (B1 cosϕ,B1 sinϕ,0) . (3.2)
where B1 is the RF-field intensity and ϕ is the phase of the field.The excitation occurs at a resonance frequency, which matches the Larmor fre-
quency, i.e. when ωRF = ω0. For simplicity we consider the amplitude of the RF-field B1to be constant, when the RF-field is applied.
It is important to note that in the rotating frame the magnetic moments precess withthe angular velocity Ω, which is described by[50]
Ω(t) = (ω1(t)cosϕ,ω1(t)sinϕ, ω0 −ωRF) (3.3)
In the absence of the RF-field, the precession occurs only around the z-axis with thefrequency ω0 −ωRF
3.2.2 Macroscopic Behavior
In NMR experiments magnetization M of the sample is measured. The magnetizationvector M equals the sum of expectation values of nuclear magnetic moments ⟨µi⟩ in thesample
M = ∑i⟨µi⟩ , (3.4)
In an equilibrium with the static field B0 the magnetization is aligned along z-axis, M =(0, 0, M0). The magnetization dynamics is described by Bloch’s equations[50, 51]
dMxdt = (Ω× M)x − Mx
T2
dMydt = (Ω× M)y − My
T2
dMzdt = (Ω× M)z − Mz−M0
T1
(3.5)
20
3.2. NMR Principles 21
The first terms in the right side of the equations describes the precession of the magneti-zation in the rotating frame due to the external magnetic fields. The second terms describerelaxation of the magnetization. The relaxation of the longitudinal component Mz is calledT1 relaxation or longitudinal relaxation, whereas the relaxation of transverse componentsMx and My is referred to as transverse relaxation or T2 relaxation. The nature of T1 and T2relaxation is discussed later in Section 3.3 and Section 3.4, respectively.
When the magnetization has non-zero transversal components, Mt =√
M2x +M2
y >
0, the magnetization will precess in the laboratory frame around z-axis with Larmor fre-quency ω0 and will generate a RF-field with this frequency. The NMR signals are obtainedby recording this field.
3.2.3 Spatial Resolution
In order to enable imaging with a spatial resolution, magnetic fields gradients have tobe applied. To achieve high resolution one has to generate an inhomogeneous magneticfield. The mobile universal surface explorer (MOUSE) [52], Stray field magnetic res-onance imaging [53] and Gradient-At-Right-angles-to-Field (GARField) [43] are exam-ples, where high static magnetic field gradients are generated. In the present study, theGARField approach was used, which can operate with a spatial resolution of ca. 5µm.Since in this study GARField approach is used, we discuss only static gradients of themagnetic field.
If the applied static field is position dependent, the Larmor frequency becomesposition dependent
ω0(r) = γ|B0(r)| . (3.6)
Since nuclei will resonate at position dependent frequencies, measurements with spatialresolution become possible. In the excited sample, the local magnetization M(r) generatesRF signal with the intensity, proportional to the local transverse magnetization and theangular frequency ω0(r).
The GARField approach utilizes special shaped magnetic poles to generate a gra-dient in the magnetic field. The magnetic poles are designed to create a gradient ofG ≃ 40T/m. To excite the sample hort pulses with a pulse duration of ca. 1 µs areused. The use of short pulses results in a broad spectrum, with a width of about 1MHz,which corresponds to approximately 500µm at the used gradient. As a result, such pulsesexcite nuclei in the whole coating, which usually has a thickness of ∼ 100µm. Since thefield of view, provided by the pulse spectral width, is directly related to the pulse duration,all the pulses in the pulse sequence should have the same pulse duration.
21
22 3. Nuclear Magnetic Resonance
te 2te 3te0
90Ox 180
Oy 180
Oy 180
Oy
te 2te 3te0
90Ox 90
Oy90
Oy90
Oy
(a) CPMG pulse sequence
(b) Ostro!-Waugh pulse sequence
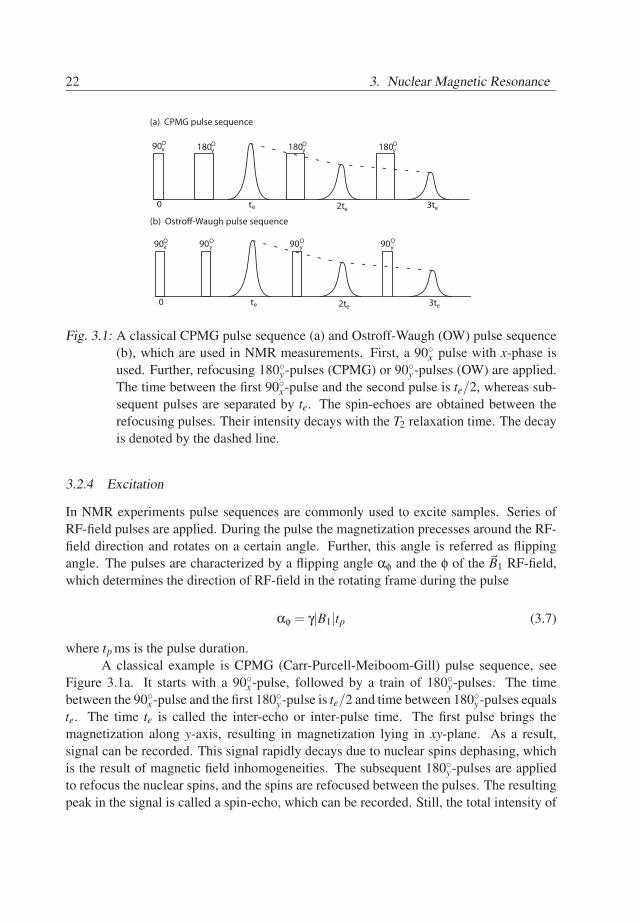
Fig. 3.1: A classical CPMG pulse sequence (a) and Ostroff-Waugh (OW) pulse sequence(b), which are used in NMR measurements. First, a 90x pulse with x-phase isused. Further, refocusing 180y-pulses (CPMG) or 90y-pulses (OW) are applied.The time between the first 90x-pulse and the second pulse is te/2, whereas sub-sequent pulses are separated by te. The spin-echoes are obtained between therefocusing pulses. Their intensity decays with the T2 relaxation time. The decayis denoted by the dashed line.
3.2.4 Excitation
In NMR experiments pulse sequences are commonly used to excite samples. Series ofRF-field pulses are applied. During the pulse the magnetization precesses around the RF-field direction and rotates on a certain angle. Further, this angle is referred as flippingangle. The pulses are characterized by a flipping angle αϕ and the ϕ of the B1 RF-field,which determines the direction of RF-field in the rotating frame during the pulse
αϕ = γ|B1|tp (3.7)
where tp ms is the pulse duration.A classical example is CPMG (Carr-Purcell-Meiboom-Gill) pulse sequence, see
Figure 3.1a. It starts with a 90x-pulse, followed by a train of 180y-pulses. The timebetween the 90x-pulse and the first 180y-pulse is te/2 and time between 180y-pulses equalste. The time te is called the inter-echo or inter-pulse time. The first pulse brings themagnetization along y-axis, resulting in magnetization lying in xy-plane. As a result,signal can be recorded. This signal rapidly decays due to nuclear spins dephasing, whichis the result of magnetic field inhomogeneities. The subsequent 180y-pulses are appliedto refocus the nuclear spins, and the spins are refocused between the pulses. The resultingpeak in the signal is called a spin-echo, which can be recorded. Still, the total intensity of
22
3.3. T1 Relaxation 23
the signals of the recorded spin-echoes will decrease in time due to T2 relaxation.According to Eq. 3.7, the product of the intensity and the pulse duration should
be twice bigger for 180-pulses than for 90-pulses. This can be achieved by tuningthe pulse duration tp or by adjusting the RF-field intensity |B1|. As imaging with theGARField approach requires the same pulse duration, using CPMG is possible only if theintensity of the RF-field can be increased twice. When this is not possible due to equip-ment limitations, an Ostroff-Waugh (OW) pulse sequence is used[54], see Figure 3.1b.The OW-pulse sequence is similar to CPMG pulse sequence, with the only difference thatin the OW-pulse sequence 90y-pulses are used instead of 180y-pulses. Therefore, whenOW-pulse sequence is used, all pulses have the same durations and intensities.
Still, even when the pulses are tuned to be 90, only in a single slice of the samplemagnetization will be flipped 90 degrees. This is because of the intensity of the RF-fieldis position dependent due to the shape of the pulse spectrum. The field intensity varieswith the frequency and the position. As a result, significant part of the magnetization willbe flipped with angles different than 90.
3.3 T1 Relaxation
T1 relaxation of the longitudinal component of the magnetization Mz occurs due to dissi-pation of the energy absorbed by the nuclei to the lattice of the sample. This results in areturn to the equilibrium state, where the magnetization is completely aligned along z-axisand and has its maximal value M0.
Longitudinal or T1 relaxation plays an important role in the choice of repetition timein NMR measurements. The NMR signal during the experiments is measured multipletimes with subsequent averaging. Subsequent measurements are separated by a repetitiontime tr ms. When tr ≫ T1, the magnetization restores to equilibrium after the previousmeasurement. Otherwise, the NMR signal will be depressed, due to lower value of thesample magnetization. Note, that if several types of nuclei are measured, than it is impor-tant that repetition time is bigger than their T1 relaxation time. Thus, T1 of the samplesshould be determined.
Usually, the inversion recovery method [55] or saturation recovery method [56] areused. In this study T1 values of the samples were measured with the saturation recoverymethod. Several short pulses were applied to saturated the nuclear spins in the sample andthen magnetization recovery was probed.
3.4 T2 Relaxometry
The relaxation of the transversal magnetization occurs due to loss of coherence by the nu-clear spins due to spin-spin interactions or diffusion of the measured protons in a magnetic
23
24 3. Nuclear Magnetic Resonance
field gradient. T2 relaxation time characterizes the local molecular motions [57, 58, 59]and self-diffusion [60, 61] of the measured species.
When both self-diffusion and local molecular motions contribute to the relaxationprocess, the measured T2 time reads
T−12 = T−1
2D +T−12S , (3.8)
where T2D [s] is the relaxation due to diffusion and T2S [s] describes relaxation associatedwith the mobility of the measured species.
The general expression for signal attenuation of protons diffusing in a gradient ofthe magnetic field was presented by Hurlimann [61]. Due to an inhomogeneous excitation,pathways have unique parameters for each position in the sample. The attenuation of thesignal of the diffusing species reads[61]
S(t)∼ ∑qk
Mqk exp[−αqkγ2G2Dt2
e t], (3.9)
where qk defines a coherent pathway, Mqk is a weighing factor for a coherent path-way and ϕqk is the phase accumulation during diffusion. D [m2/s] is the self-diffusioncoefficient and N ≡ t/te is the number of pulses. The parameter
αqk =
(13
N
∑k
q2k +
N
∑k
qk
N
∑l
ql(l −1)+N
∑k
qk(k−1)N
∑k
ql
)/N
includes the coherence pathway contributions.It can be concluded that every coherent pathway evolves as a function of a rescaled
time γ2G2Dt2e t and the overall signal S(t) will always be a function of γ2G2Dt2
e t. If themeasured signal of diffusing species decays monoexponentially as exp(−t/T2D), the de-cay time can be described as
T−12D = αγ2G2Dt2
e . (3.10)
The parameter α is a constant, which is defined by the evolution of coherent pathways fora given pulse sequence.
It is known that for Ostroff-Waugh-like pulse sequences, the relaxation time deter-mined by the correlation time τc associated with molecular motions as follows[57, 59]
T−12S = ⟨ω2⟩τc
[1− tanh(te/τc)
te/τc
], (3.11)
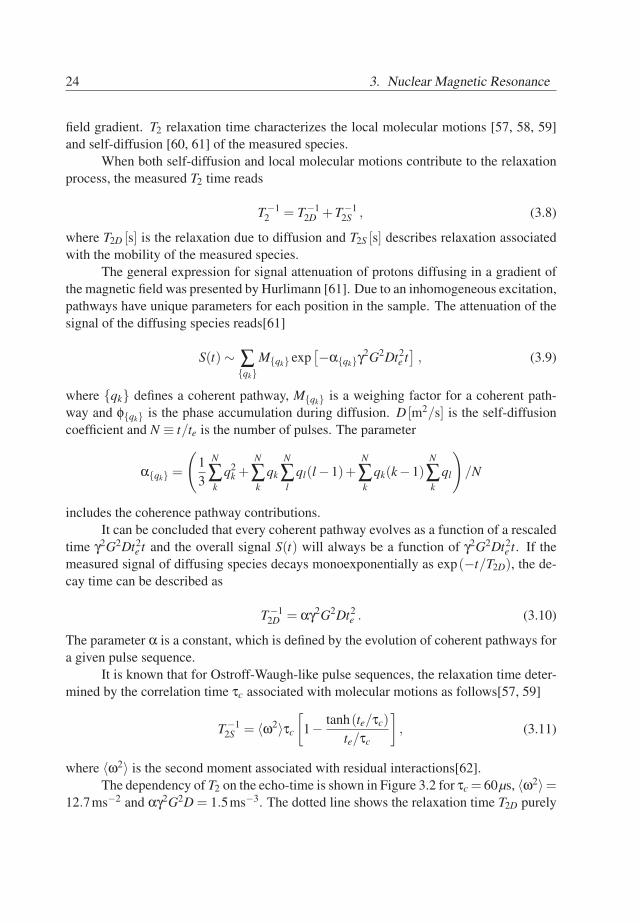
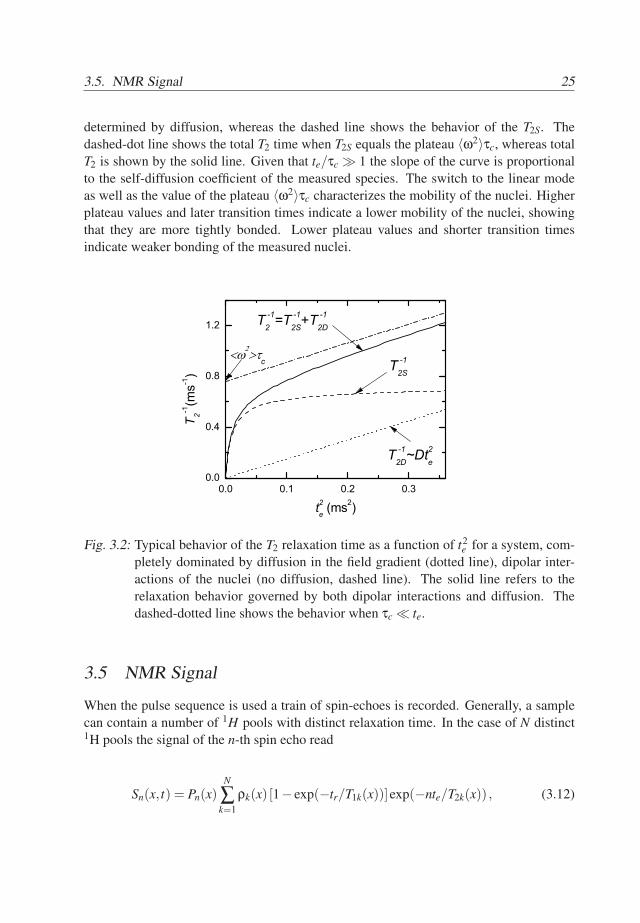
where ⟨ω2⟩ is the second moment associated with residual interactions[62].The dependency of T2 on the echo-time is shown in Figure 3.2 for τc = 60µs, ⟨ω2⟩=
12.7ms−2 and αγ2G2D = 1.5ms−3. The dotted line shows the relaxation time T2D purely
24
3.5. NMR Signal 25
determined by diffusion, whereas the dashed line shows the behavior of the T2S. Thedashed-dot line shows the total T2 time when T2S equals the plateau ⟨ω2⟩τc, whereas totalT2 is shown by the solid line. Given that te/τc ≫ 1 the slope of the curve is proportionalto the self-diffusion coefficient of the measured species. The switch to the linear modeas well as the value of the plateau ⟨ω2⟩τc characterizes the mobility of the nuclei. Higherplateau values and later transition times indicate a lower mobility of the nuclei, showingthat they are more tightly bonded. Lower plateau values and shorter transition timesindicate weaker bonding of the measured nuclei.
0.0 0.1 0.2 0.30.0
0.4
0.8
1.2
T -12D
~Dt2e
T 2-1(m
s-1)
t2e (ms2)
T -12
=T -12S
+T -12D
T -12S
c
Fig. 3.2: Typical behavior of the T2 relaxation time as a function of t2e for a system, com-
pletely dominated by diffusion in the field gradient (dotted line), dipolar inter-actions of the nuclei (no diffusion, dashed line). The solid line refers to therelaxation behavior governed by both dipolar interactions and diffusion. Thedashed-dotted line shows the behavior when τc ≪ te.
3.5 NMR Signal
When the pulse sequence is used a train of spin-echoes is recorded. Generally, a samplecan contain a number of 1H pools with distinct relaxation time. In the case of N distinct1H pools the signal of the n-th spin echo read
Sn(x, t) = Pn(x)N
∑k=1
ρk(x) [1− exp(−tr/T1k(x))]exp(−nte/T2k(x)) , (3.12)
25
26 3. Nuclear Magnetic Resonance
where k refers to a number of a specific 1H pool, ρk [mol/m3] is the density of 1H nuclei ofthe k-th specific pool. The k-th pool has longitudinal relaxation time T1k[s] and transversalrelaxation time T2k[s]. Note that the mentioned parameters reflect properties of a sample.In contrast, the repetition time tr[s] and inter-echo (inter-pulse) time te[s] are settings inthe measurements. The function Pn(x) is a weighing factor for the n-th echo. It combineseffects of the excitation and coil sensitivity profiles and evolution of coherent pathwaysin the used pulse sequences [61] and does not contain information about the measuredsample.
26
4. Water Uptake Visualization
4.1 Introduction
Visualizing the transient water distribution in multilayer coating systems is the contribu-tion of individual layers to water uptake, kinetics and to determine influence of water onthe layers.
The investigation of water transport in multilayer coatings requires knowledge ofhow water distributes in the sample and its individual layers. This knowledge is crucial forunderstanding the contribution of individual layers to water uptake, to understand uptakekinetics and influence of water on the layers.
High resolution NMR imaging based on the GARField approach features protondistribution measurement in the sample. However, during water uptake both protons ofwater and protons of the coating will be probed. Thus, the NMR study of water uptakemeets the challenge to distinguish the contributions of water to the NMR signal. Thisrequires proper calibration of the signal as related to the amount of water in samples.
The aim of this chapter is to visualize and analyze transient water distributionsin two-layered coatings during uptake on the basis high resolution NMR imaging. Theconsidered coatings consist of a hydrophobic top coat and a hydrophilic base coat. Thechapter starts with a determination of the relation between NMR signal profiles duringuptake and water distributions. Furthermore, the consequences of water uptake in termsof swelling of the constituent layers is addressed. The chapter concludes with a discussionof the observed water distributions during uptake and the overall water uptake process bythe considered systems.
4.2 Samples Description
Since this thesis is dedicated to investigation of water transport in multilayer coatings,samples, which may represent multilayer coatings, have to be chosen. As such systemstwo-layered base coat/top coat (BC/TC) systems were chosen. The considered top coatsare solventborne crosslinked systems whereas the base coats are waterborne physicallydries layers. This choice of layers provides significant contrast between them, thereforethis type of two-layered systems can be considered as a valid representative of multilay-ered coatings. Additionally, the chosen base coats contain multiple polymeric phases due
27
28 4. Water Uptake Visualization
to their waterborne nature. Thus, the chosen systems a valid candidate as a sample forstudying water transport in multilayer coatings.
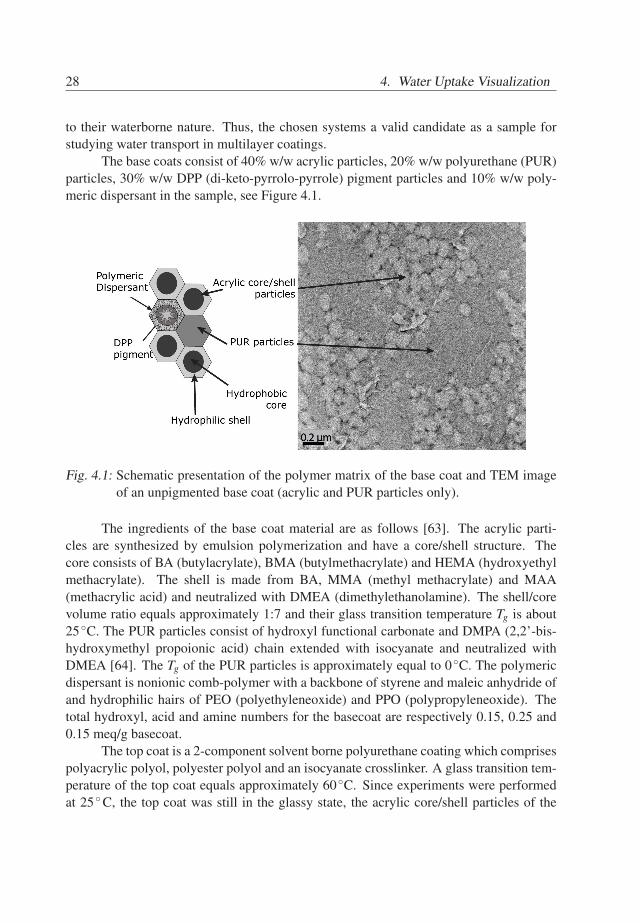
The base coats consist of 40% w/w acrylic particles, 20% w/w polyurethane (PUR)particles, 30% w/w DPP (di-keto-pyrrolo-pyrrole) pigment particles and 10% w/w poly-meric dispersant in the sample, see Figure 4.1.
Fig. 4.1: Schematic presentation of the polymer matrix of the base coat and TEM imageof an unpigmented base coat (acrylic and PUR particles only).
The ingredients of the base coat material are as follows [63]. The acrylic parti-cles are synthesized by emulsion polymerization and have a core/shell structure. Thecore consists of BA (butylacrylate), BMA (butylmethacrylate) and HEMA (hydroxyethylmethacrylate). The shell is made from BA, MMA (methyl methacrylate) and MAA(methacrylic acid) and neutralized with DMEA (dimethylethanolamine). The shell/corevolume ratio equals approximately 1:7 and their glass transition temperature Tg is about25 C. The PUR particles consist of hydroxyl functional carbonate and DMPA (2,2’-bis-hydroxymethyl propoionic acid) chain extended with isocyanate and neutralized withDMEA [64]. The Tg of the PUR particles is approximately equal to 0 C. The polymericdispersant is nonionic comb-polymer with a backbone of styrene and maleic anhydride ofand hydrophilic hairs of PEO (polyethyleneoxide) and PPO (polypropyleneoxide). Thetotal hydroxyl, acid and amine numbers for the basecoat are respectively 0.15, 0.25 and0.15 meq/g basecoat.
The top coat is a 2-component solvent borne polyurethane coating which comprisespolyacrylic polyol, polyester polyol and an isocyanate crosslinker. A glass transition tem-perature of the top coat equals approximately 60 C. Since experiments were performedat 25 C, the top coat was still in the glassy state, the acrylic core/shell particles of the
28
4.3. NMR Equipment 29
base coat were at transition between rubbery and glassy state and PUR particles were atthe rubbery state.
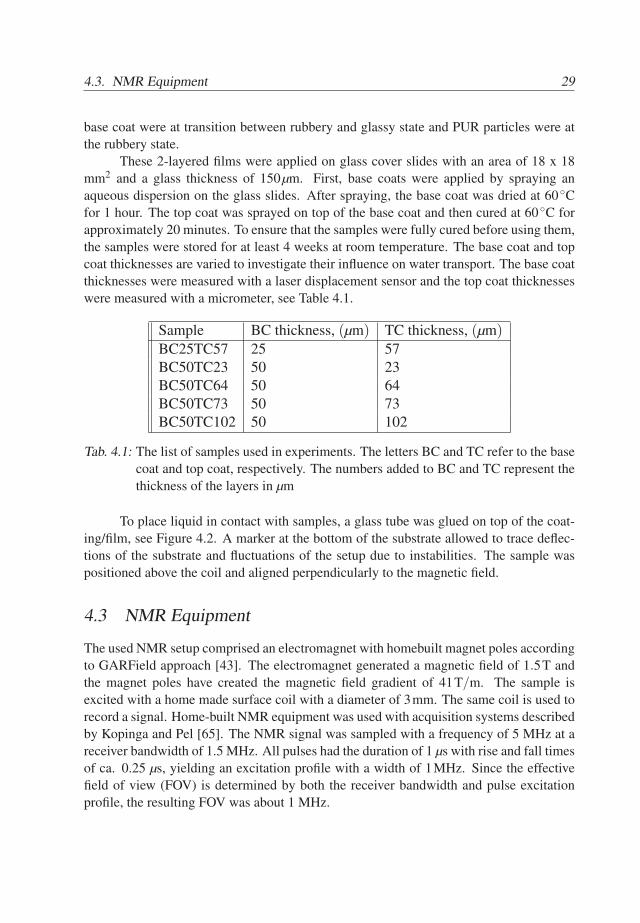
These 2-layered films were applied on glass cover slides with an area of 18 x 18mm2 and a glass thickness of 150µm. First, base coats were applied by spraying anaqueous dispersion on the glass slides. After spraying, the base coat was dried at 60 Cfor 1 hour. The top coat was sprayed on top of the base coat and then cured at 60 C forapproximately 20 minutes. To ensure that the samples were fully cured before using them,the samples were stored for at least 4 weeks at room temperature. The base coat and topcoat thicknesses are varied to investigate their influence on water transport. The base coatthicknesses were measured with a laser displacement sensor and the top coat thicknesseswere measured with a micrometer, see Table 4.1.
Sample BC thickness, (µm) TC thickness, (µm)BC25TC57 25 57BC50TC23 50 23BC50TC64 50 64BC50TC73 50 73BC50TC102 50 102
Tab. 4.1: The list of samples used in experiments. The letters BC and TC refer to the basecoat and top coat, respectively. The numbers added to BC and TC represent thethickness of the layers in µm
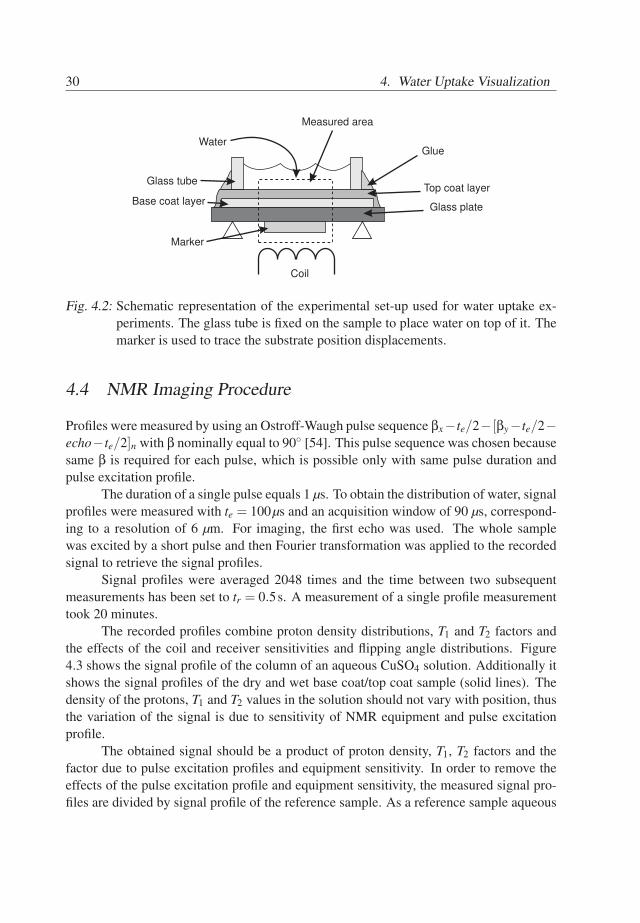
To place liquid in contact with samples, a glass tube was glued on top of the coat-ing/film, see Figure 4.2. A marker at the bottom of the substrate allowed to trace deflec-tions of the substrate and fluctuations of the setup due to instabilities. The sample waspositioned above the coil and aligned perpendicularly to the magnetic field.
4.3 NMR Equipment
The used NMR setup comprised an electromagnet with homebuilt magnet poles accordingto GARField approach [43]. The electromagnet generated a magnetic field of 1.5T andthe magnet poles have created the magnetic field gradient of 41T/m. The sample isexcited with a home made surface coil with a diameter of 3mm. The same coil is used torecord a signal. Home-built NMR equipment was used with acquisition systems describedby Kopinga and Pel [65]. The NMR signal was sampled with a frequency of 5 MHz at areceiver bandwidth of 1.5 MHz. All pulses had the duration of 1 µs with rise and fall timesof ca. 0.25 µs, yielding an excitation profile with a width of 1MHz. Since the effectivefield of view (FOV) is determined by both the receiver bandwidth and pulse excitationprofile, the resulting FOV was about 1 MHz.
29
30 4. Water Uptake Visualization
Glass tube
Glue
Top coat layer
Base coat layerGlass plate
Marker
Water
Coil
Measured area
Fig. 4.2: Schematic representation of the experimental set-up used for water uptake ex-periments. The glass tube is fixed on the sample to place water on top of it. Themarker is used to trace the substrate position displacements.
4.4 NMR Imaging Procedure
Profiles were measured by using an Ostroff-Waugh pulse sequence βx−te/2− [βy−te/2−echo−te/2]n with β nominally equal to 90 [54]. This pulse sequence was chosen becausesame β is required for each pulse, which is possible only with same pulse duration andpulse excitation profile.
The duration of a single pulse equals 1 µs. To obtain the distribution of water, signalprofiles were measured with te = 100µs and an acquisition window of 90 µs, correspond-ing to a resolution of 6 µm. For imaging, the first echo was used. The whole samplewas excited by a short pulse and then Fourier transformation was applied to the recordedsignal to retrieve the signal profiles.
Signal profiles were averaged 2048 times and the time between two subsequentmeasurements has been set to tr = 0.5s. A measurement of a single profile measurementtook 20 minutes.
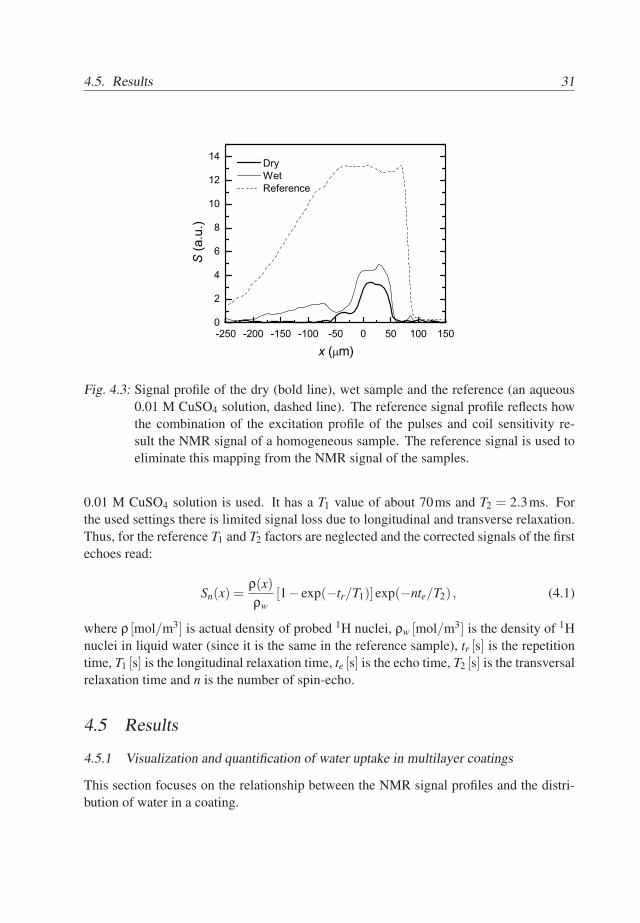
The recorded profiles combine proton density distributions, T1 and T2 factors andthe effects of the coil and receiver sensitivities and flipping angle distributions. Figure4.3 shows the signal profile of the column of an aqueous CuSO4 solution. Additionally itshows the signal profiles of the dry and wet base coat/top coat sample (solid lines). Thedensity of the protons, T1 and T2 values in the solution should not vary with position, thusthe variation of the signal is due to sensitivity of NMR equipment and pulse excitationprofile.
The obtained signal should be a product of proton density, T1, T2 factors and thefactor due to pulse excitation profiles and equipment sensitivity. In order to remove theeffects of the pulse excitation profile and equipment sensitivity, the measured signal pro-files are divided by signal profile of the reference sample. As a reference sample aqueous
30
4.5. Results 31
-250 -200 -150 -100 -50 0 50 100 1500
2
4
6
8
10
12
14
S (a
.u.)
x ( m)
Dry Wet Reference
Fig. 4.3: Signal profile of the dry (bold line), wet sample and the reference (an aqueous0.01 M CuSO4 solution, dashed line). The reference signal profile reflects howthe combination of the excitation profile of the pulses and coil sensitivity re-sult the NMR signal of a homogeneous sample. The reference signal is used toeliminate this mapping from the NMR signal of the samples.
0.01 M CuSO4 solution is used. It has a T1 value of about 70ms and T2 = 2.3ms. Forthe used settings there is limited signal loss due to longitudinal and transverse relaxation.Thus, for the reference T1 and T2 factors are neglected and the corrected signals of the firstechoes read:
Sn(x) =ρ(x)ρw
[1− exp(−tr/T1)]exp(−nte/T2) , (4.1)
where ρ [mol/m3] is actual density of probed 1H nuclei, ρw [mol/m3] is the density of 1Hnuclei in liquid water (since it is the same in the reference sample), tr [s] is the repetitiontime, T1 [s] is the longitudinal relaxation time, te [s] is the echo time, T2 [s] is the transversalrelaxation time and n is the number of spin-echo.
4.5 Results
4.5.1 Visualization and quantification of water uptake in multilayer coatings
This section focuses on the relationship between the NMR signal profiles and the distri-bution of water in a coating.
31
32 4. Water Uptake Visualization
-80 -60 -40 -20 0 20 40 600.0
0.1
0.2
0.3
0.4
0.5
-80 -60 -40 -20 0 20 40 600.0
0.1
0.2
0.3
0.4
0.5 (a)
S (~
)
x ( m)
GlassTop coatWater Base coat
(b)
S (~
)
x ( m)
Dry Wet (H
2O)
Wet (D2O)
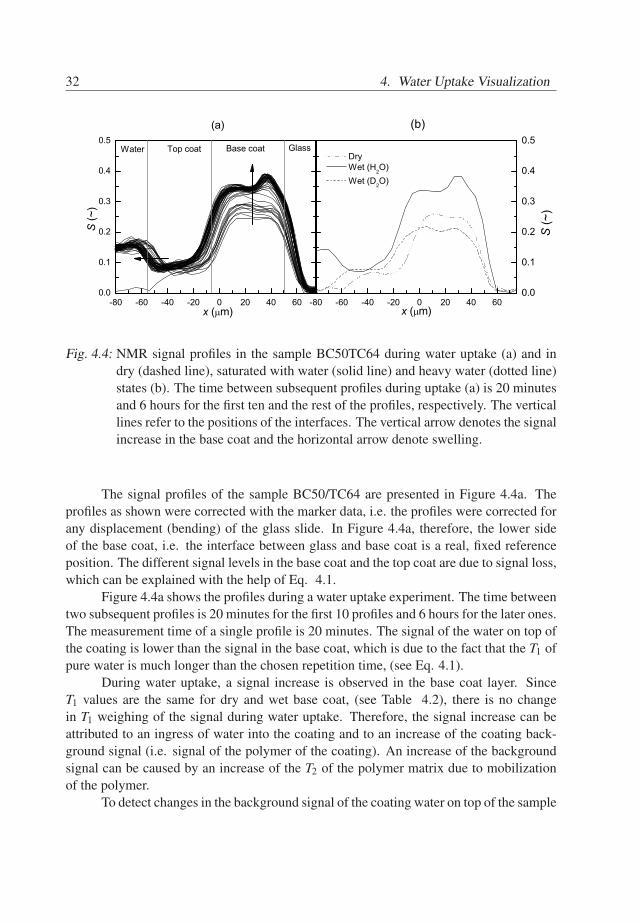
Fig. 4.4: NMR signal profiles in the sample BC50TC64 during water uptake (a) and indry (dashed line), saturated with water (solid line) and heavy water (dotted line)states (b). The time between subsequent profiles during uptake (a) is 20 minutesand 6 hours for the first ten and the rest of the profiles, respectively. The verticallines refer to the positions of the interfaces. The vertical arrow denotes the signalincrease in the base coat and the horizontal arrow denote swelling.
The signal profiles of the sample BC50/TC64 are presented in Figure 4.4a. Theprofiles as shown were corrected with the marker data, i.e. the profiles were corrected forany displacement (bending) of the glass slide. In Figure 4.4a, therefore, the lower sideof the base coat, i.e. the interface between glass and base coat is a real, fixed referenceposition. The different signal levels in the base coat and the top coat are due to signal loss,which can be explained with the help of Eq. 4.1.
Figure 4.4a shows the profiles during a water uptake experiment. The time betweentwo subsequent profiles is 20 minutes for the first 10 profiles and 6 hours for the later ones.The measurement time of a single profile is 20 minutes. The signal of the water on top ofthe coating is lower than the signal in the base coat, which is due to the fact that the T1 ofpure water is much longer than the chosen repetition time, (see Eq. 4.1).
During water uptake, a signal increase is observed in the base coat layer. SinceT1 values are the same for dry and wet base coat, (see Table 4.2), there is no changein T1 weighing of the signal during water uptake. Therefore, the signal increase can beattributed to an ingress of water into the coating and to an increase of the coating back-ground signal (i.e. signal of the polymer of the coating). An increase of the backgroundsignal can be caused by an increase of the T2 of the polymer matrix due to mobilizationof the polymer.
To detect changes in the background signal of the coating water on top of the sample
32
4.5. Results 33
Layer/state T1 [ms]Base coat/dry 200Base coat/wet 200Top coat/dry 350Water 3000
Tab. 4.2: T1 values of the the polymer systems and water.
was replaced by heavy water. Since deuterium is not probed, only the background signalfrom the coating is measured. While the exchange between deuterons of heavy waterand protons of the polymer is possible, the number of exchangeable protons is negligible(Section 4.2). There are only few differences between heavy water and water, like slightlyhigher density and slightly stronger hydrogen bonding. It is known that in polymers heavywater transport is similar to water transport [66, 67] and is used instead of water in studiesof water transport. The measured signal profiles for the dry sample and sample saturatedwith water and heavy water are presented in Figure 4.4b. The signal level of the basecoat filled with D2O is lower than signal level of the dry base coat. Due to the swellingof the coating the hydrogen density of the polymeric material slightly decreases resultingin lower signal level. Since a signal increase is not observed, it is concluded that duringwater uptake the observed signal increase is only due to an increase of the amount of waterin the base coat layer.
0 20 40 60 80 1000.0
0.2
0.4
0.6
0.8
1.0
S/S m
ax
H2O fraction (%)
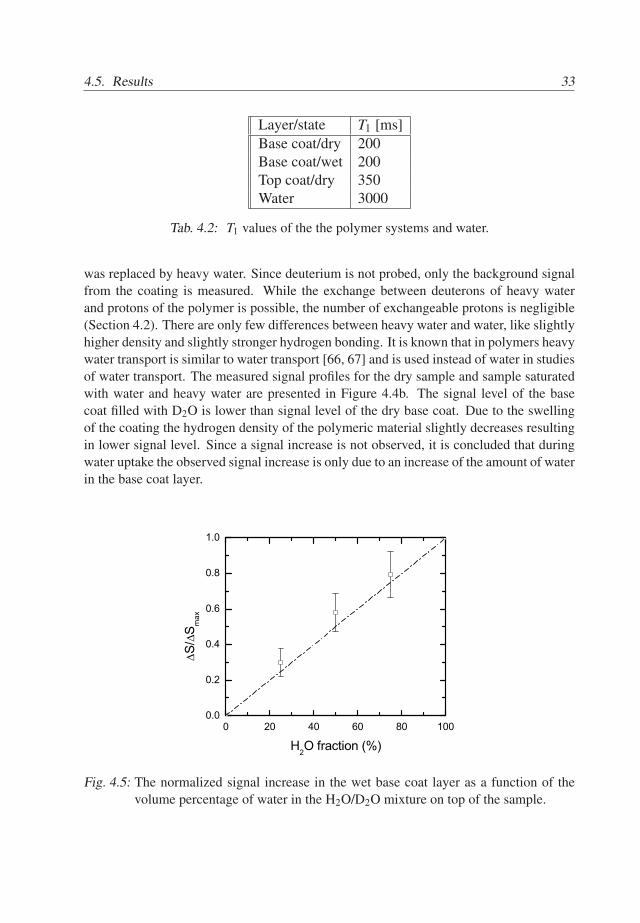
Fig. 4.5: The normalized signal increase in the wet base coat layer as a function of thevolume percentage of water in the H2O/D2O mixture on top of the sample.
33
34 4. Water Uptake Visualization
The water on top of the wetted sample was replaced by various D2O/H2O mixturesin order to find a relation between the signal increase and the amount of water in the basecoat. The signal was integrated from the base coat/glass interface to the top coat/waterinterface. In Figure 4.5 the NMR signal is plotted against the fraction of water in themixture on top of the sample. The normalized integrated signal change is calculatedaccording to S/Smax = [Smix −SD2O]/ [SH2O −SD2O], where Smix, SH2O and SD2O arethe levels of the integrated signal of the base coat layer in the case of exposure to aD2O/H2O mixture, pure water or pure heavy water, respectively. A linear relation betweenthe signal and the amount of water in the mixture is observed. It can be concluded thatsignal increase S is proportional to the mass of water in the coating m [mg], S =km, where k [mg−1] is a proportionality coefficient.
To quantify the signal increase S in terms of the amount of absorbed waterm [mg] the coefficient k should be found. The expression for k can be derived by theintegration of Eq. 4.1
k =1
ρwA[1− exp(−tr/T1)]exp(−te/T2) (4.2)
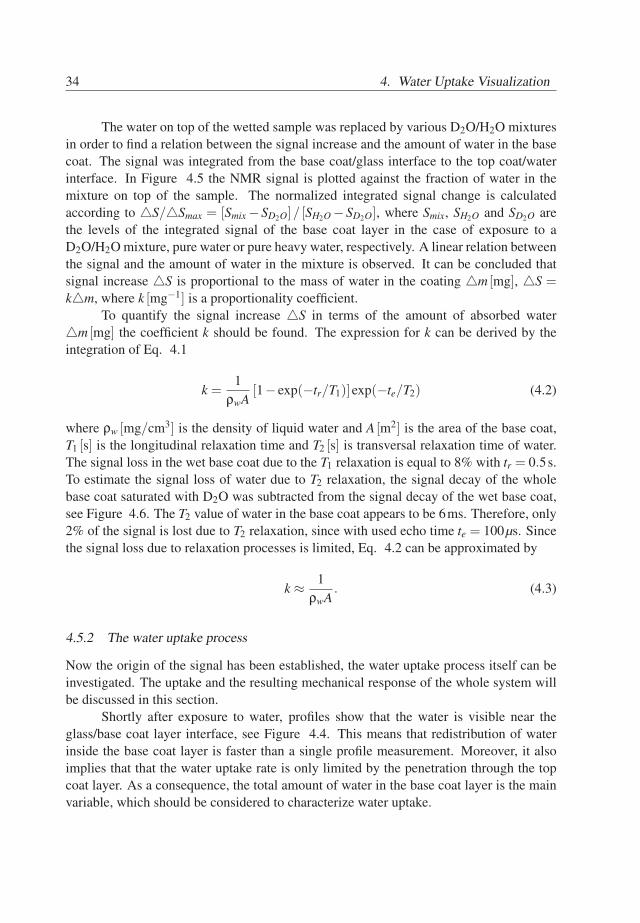
where ρw [mg/cm3] is the density of liquid water and A [m2] is the area of the base coat,T1 [s] is the longitudinal relaxation time and T2 [s] is transversal relaxation time of water.The signal loss in the wet base coat due to the T1 relaxation is equal to 8% with tr = 0.5s.To estimate the signal loss of water due to T2 relaxation, the signal decay of the wholebase coat saturated with D2O was subtracted from the signal decay of the wet base coat,see Figure 4.6. The T2 value of water in the base coat appears to be 6ms. Therefore, only2% of the signal is lost due to T2 relaxation, since with used echo time te = 100µs. Sincethe signal loss due to relaxation processes is limited, Eq. 4.2 can be approximated by
k ≈ 1ρwA
. (4.3)
4.5.2 The water uptake process
Now the origin of the signal has been established, the water uptake process itself can beinvestigated. The uptake and the resulting mechanical response of the whole system willbe discussed in this section.
Shortly after exposure to water, profiles show that the water is visible near theglass/base coat layer interface, see Figure 4.4. This means that redistribution of waterinside the base coat layer is faster than a single profile measurement. Moreover, it alsoimplies that that the water uptake rate is only limited by the penetration through the topcoat layer. As a consequence, the total amount of water in the base coat layer is the mainvariable, which should be considered to characterize water uptake.
34
4.5. Results 35
0 20 40 600.01
0.1
1
10
S (a
.u.)
t ( m)
Fig. 4.6: The signal decay of water in the base coat. The value of the T2 relaxation timeis 6 ca. ms. This value means that at used setting only 2% of the signal of waterin the base coat is lost due to T2 relaxation.
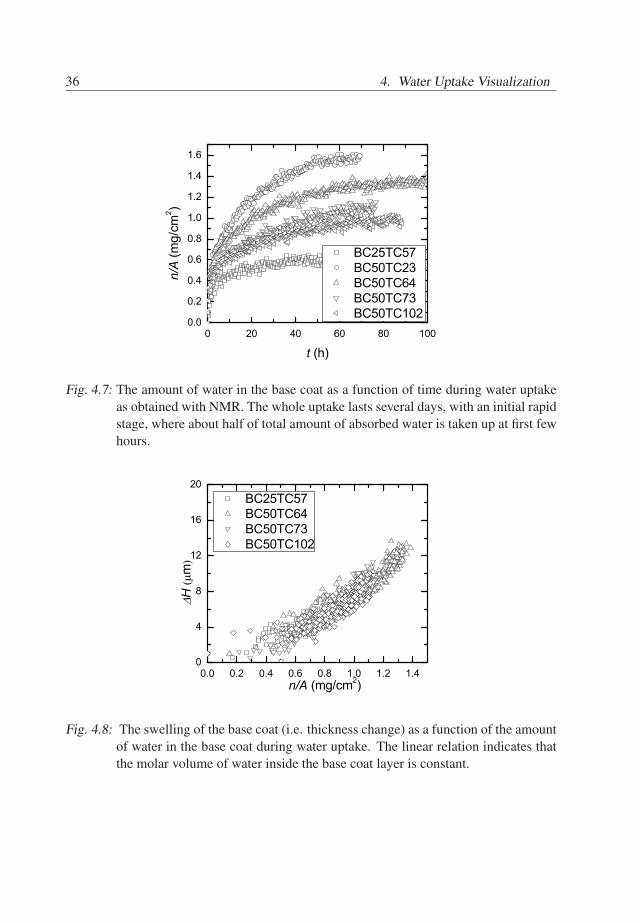
The total amount of water m(t) inside the base coat layer is obtained via integratingthe profiles from the BC/glass to the TC/water interface as the top layer hardly absorbsany water. The swelling ∆H(t) is obtained as the change in distance between the topcoat/water interface and the marker from the second echo profiles, as they provide bettercontrast between water and top coat. Since the top coat absorbs only a small amount ofwater, the swelling is attributed to the base coat layer. The amount of water in the basecoat layer is shown as functions of time in Figure 4.7.
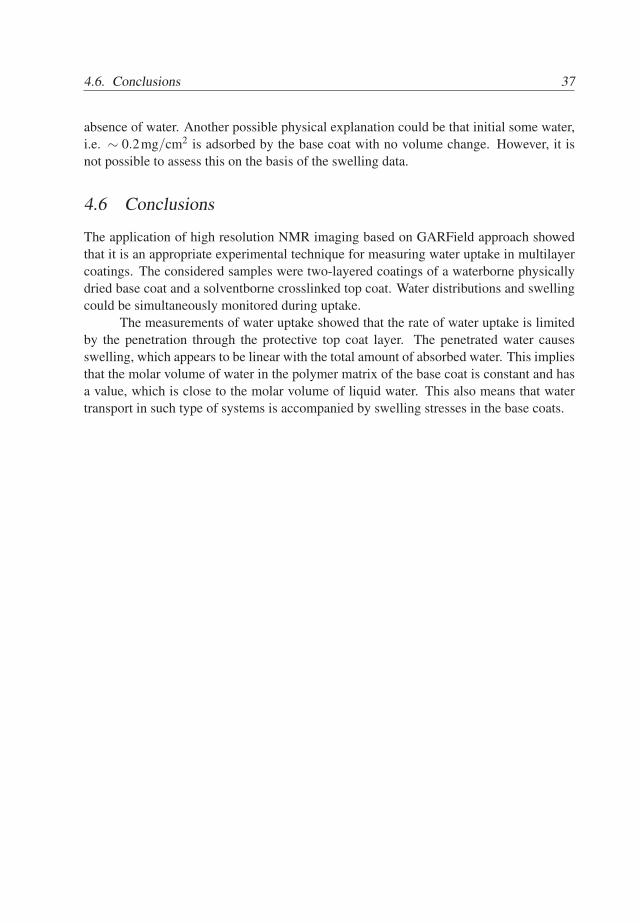
The relation between the amount of water in the base coat and its swelling of thesample is presented in Figure 4.8, showing that the thickness varies linearly with themass. Since the volume change of the base coat can be approximated with ∆V = A∆H (Ais the area of the base coat layer), it can be concluded that the molar volume of water in thebase coat layer is constant. A linear fit gives a slope of ca. A∆H/∆m ≃ 1.1±0.1cm3/g.With the area of the base coat, obtained in the previous section, the molar volume of waterv = MA∆H/∆m in the base coat is estimated to be 18±2cm3/mol. This value is similarto the molar volume of liquid water. This may indicate that the most of absorbed waterresults in volume increase, i.e swelling of the base coat.
The non-zero intercept of the data is an artifact of the procedure, introduced byuse of the first value of distance between the water/top coat interface and the markeras zero-point for swelling. The distance between the interface and the marker for thedry sample cannot be used as the zero-point due to poor accuracy of the interface in the
35
36 4. Water Uptake Visualization
0 20 40 60 80 1000.0
0.2
0.4
0.6
0.8
1.0
1.2
1.4
1.6
BC25TC57 BC50TC23 BC50TC64 BC50TC73 BC50TC102
n/A
(mg/cm
2 )
t (h)
Fig. 4.7: The amount of water in the base coat as a function of time during water uptakeas obtained with NMR. The whole uptake lasts several days, with an initial rapidstage, where about half of total amount of absorbed water is taken up at first fewhours.
0.0 0.2 0.4 0.6 0.8 1.0 1.2 1.40
4
8
12
16
20 BC25TC57 BC50TC64 BC50TC73 BC50TC102
H (m
)
n/A (mg/cm2)
Fig. 4.8: The swelling of the base coat (i.e. thickness change) as a function of the amountof water in the base coat during water uptake. The linear relation indicates thatthe molar volume of water inside the base coat layer is constant.
36
4.6. Conclusions 37
absence of water. Another possible physical explanation could be that initial some water,i.e. ∼ 0.2mg/cm2 is adsorbed by the base coat with no volume change. However, it isnot possible to assess this on the basis of the swelling data.
4.6 Conclusions
The application of high resolution NMR imaging based on GARField approach showedthat it is an appropriate experimental technique for measuring water uptake in multilayercoatings. The considered samples were two-layered coatings of a waterborne physicallydried base coat and a solventborne crosslinked top coat. Water distributions and swellingcould be simultaneously monitored during uptake.
The measurements of water uptake showed that the rate of water uptake is limitedby the penetration through the protective top coat layer. The penetrated water causesswelling, which appears to be linear with the total amount of absorbed water. This impliesthat the molar volume of water in the polymer matrix of the base coat is constant and hasa value, which is close to the molar volume of liquid water. This also means that watertransport in such type of systems is accompanied by swelling stresses in the base coats.
37

38 4. Water Uptake Visualization
38
5. Water-Polymer Interactions During Uptake
5.1 Introduction
The previous chapter has brought insight into water redistribution in two-layered coatings.The studied systems consisted of a waterborne physically dried base coat and a solvent-borne crosslinked top coat. The next step in this study is evaluation of state and mobilityof water in the considered base coat/top coat systems, as it brings insight into how waterpresent in the coating. As the base coat is the main reservoir for water, the main focusin this chapter is on investigation of water in the state of water in the base coat and itsinfluence on the polymer matrix.
A proper interpretation of NMR transverse relaxation times should form the back-bone for such investigation. The contribution of water to the relaxation can be evaluatedby using heavy water. Additionally, there is an opportunity to identify contributions of thevarious polymer phases of the base coat to the NMR signal decay, given a significant dif-ference between polymer chains mobilities in these phases. Furthermore, the relaxationtime of water contains information about self-diffusion coefficient and local molecularmotions in the sample. The polymer relaxation time depends on chains mobility of thepolymer. Understanding these parameters is a key to get an insight of how water is presentin the base coat and what is the effect of water on the polymer matrix. Combined withNMR imaging, NMR relaxometry has the potential to evaluate interactions within specificlayers of multilayer coatings.
The goal of this chapter is to investigate the interplay between water and polymerof the base coat during uptake in the considered base coat/top coat systems. The basecoat is a waterborne physically dried system, which consists of acrylic, polyurethane andpigment particles and includes a polymeric dispersant for the pigment. NMR relaxometryis used to identify water and polymer phases of the base coat. Furthermore, it is evaluated,whether water is highly mobile in the base coat and what is the influence of water on thepolymer phases.
39
40 5. Water-Polymer Interactions During Uptake
5.2 Experimental Details
5.2.1 Sample Description
The studied samples are two-layered base coat/top coat coatings. Here we give a briefinformation about the samples and for more detailed sample composition we refer to Sec-tion 4.2. The base coats consist of 40% w/w acrylic particles, 20% w/w polyurethane(PUR) particles, 30% w/w DPP (di-keto-pyrrolo-pyrrole) pigment particles and 10% w/wpolymeric dispersant in the sample. The acrylic particles are core/shell particles with aglass transition temperature of about 25 C. The PUR particles have a glass transition tem-perature of about 0 C. The dispersant is a comb polymer with a hydrophobic backboneand water-soluble side chains.
The top coat is a solvent borne highly crosslinked system with a glass transition ca.60 C.
To place liquid in contact with samples, a glass tube was glued on top of the coating,see Figure 4.2.
5.2.2 Data Processing
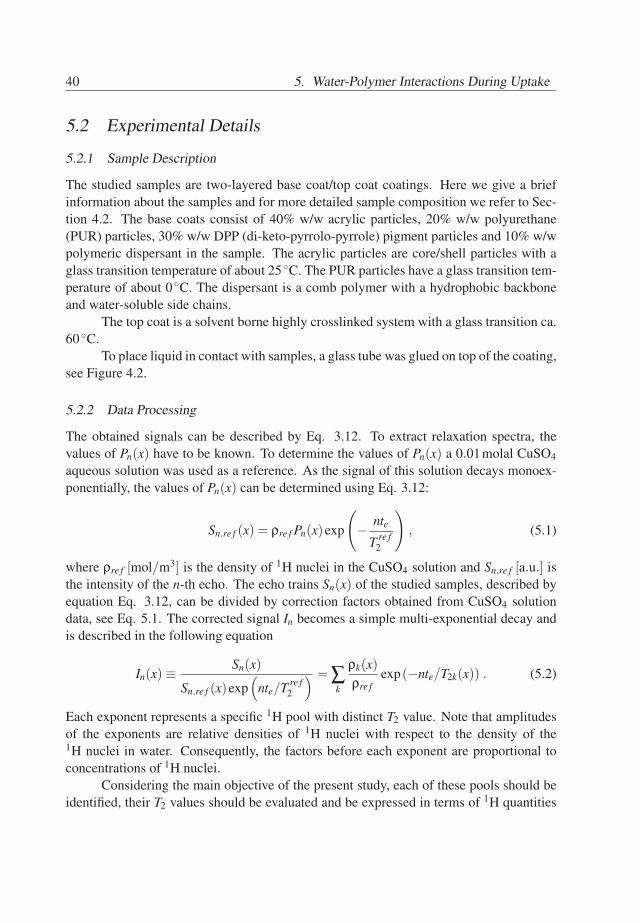
The obtained signals can be described by Eq. 3.12. To extract relaxation spectra, thevalues of Pn(x) have to be known. To determine the values of Pn(x) a 0.01molal CuSO4aqueous solution was used as a reference. As the signal of this solution decays monoex-ponentially, the values of Pn(x) can be determined using Eq. 3.12:
Sn,re f (x) = ρre f Pn(x)exp
(− nte
T re f2
), (5.1)
where ρre f [mol/m3] is the density of 1H nuclei in the CuSO4 solution and Sn,re f [a.u.] isthe intensity of the n-th echo. The echo trains Sn(x) of the studied samples, described byequation Eq. 3.12, can be divided by correction factors obtained from CuSO4 solutiondata, see Eq. 5.1. The corrected signal In becomes a simple multi-exponential decay andis described in the following equation
In(x)≡Sn(x)
Sn,re f (x)exp(
nte/T re f2
) = ∑k
ρk(x)ρre f
exp(−nte/T2k(x)) . (5.2)
Each exponent represents a specific 1H pool with distinct T2 value. Note that amplitudesof the exponents are relative densities of 1H nuclei with respect to the density of the1H nuclei in water. Consequently, the factors before each exponent are proportional toconcentrations of 1H nuclei.
Considering the main objective of the present study, each of these pools should beidentified, their T2 values should be evaluated and be expressed in terms of 1H quantities
40
5.3. Results 41
nk. Therefore, measured signal decays were fitted with a regularized inverse Laplacetransform algorithm (RILT) as proposed by Venkataramanan et al. [68], which resultedin T2 spectra containing a number of peaks. The peaks refer to 1H pools, with a positioncorresponding to the T2 values of 1H in the specific pool. The intensities of the peaksreflect the densities ρk and the total amount nk of 1H nuclei if profiles or total signals aretreated, respectively. The robustness of the fitting procedure is discussed in Appendix B.
5.2.3 Measurements
In this study we are interested in identifying the contributions of water and polymer to theNMR signal and investigating the state of water in the polymer. For identification of thecontributions of water and polymer phases to the signal measurements of the sample indry, H2O-wet and D2O-wet situations were done. They were performed with te = 0.1msand 8192 averages. The identification experiments were performed with primary andacrylic BC/TC samples and with pure PUR films.
Experiments, dedicated to study the state and mobility of water in the polymer wereperformed with te ranging from 0.1ms to 0.6ms and with 8192 averages. The primaryBC/TC sample was studied in partially and fully saturated states, which were achievedby equilibrating the sample with an aqueous solution of polyethylene glycol (PEG) andliquid water, respectively. The aqueous solution of PEG had a water activity equal to 0.9.This water activity was obtained by tuning the PEG concentration in the solution[69].
Water uptake in the primary BC/TC sample was measured with te = 0.1ms and2048 averages. Measurements were performed with a repetition time of tr = 0.5s, result-ing in temporal resolution of 20min. The acquisition time was tacq = 90µs.
The parameter α in Eq. 3.10 was estimated from the signal decay of an 0.01Maqueous CuSO4 solution. Water in this solution has a T2 ≃ 2.6ms. The self-diffusioncoefficient of water in the CuSO4 solution is equal to 2.5× 10⁻⁹ m2/s, which is equalto diffusivity of pure water[70]. Using this value and the fact that for CuSO4 solutionT2S ≫ T2D in our experiments, we obtain that α = 5.
5.3 Results
5.3.1 Distinguishing Water and Polymer
T2 Relaxation Spectra
A prerequisite for understanding the interplay of water and the polymer matrix duringuptake is that the signals of water and polymeric material can be distinguished. Thissection focuses on identifying the NMR signal components and assigning them to waterand polymeric components (acrylic, PUR and dispersant), respectively.
With the help of the RILT fitting procedure relaxation spectra were obtained for
41
42 5. Water-Polymer Interactions During Uptake
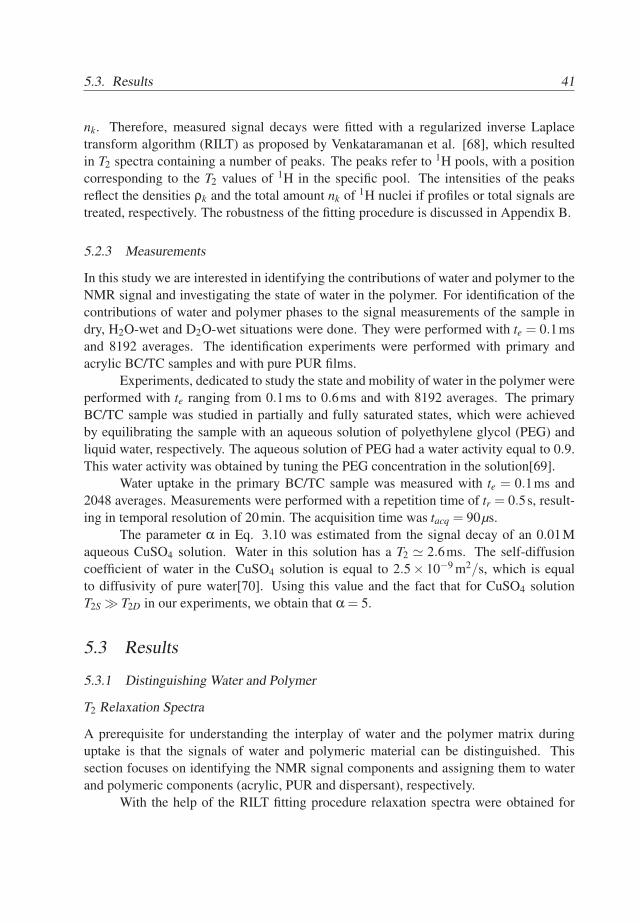
each position in the base coat of the primary BC/TC sample. Four T2 spectral componentswere detected at each position in the base coat. The average T2 values for each componentis shown in Figure 5.1. The dashed line represents the original signal profile In(x). The T2values are nearly constant as a function of position. Consequently, the properties of each1H pool, which are reflected by the T2 value, can be considered as homogeneous in thestudied base coat. Concerning the homogeneity, further analysis in our study is based onthe total signals of the base coat of the primary BC/TC sample.
-20 0 20 40 600.01
0.1
1
10
100
T2 (
ms)
S (~
)
x ( m)
0.0
0.5
Fig. 5.1: The average T2 value of each spectral component in the wet base coat of theprimary sample as a function of the position. The dashed line represents thesignal intensity of the first echo of the coating.
The total signal was obtained by integrating the corrected signal in Eq. 5.2. As aresult, the expression for the total signal It
n of the base coat reads
Itn = ∑
kAk exp(−nte/T2k) , (5.3)
where Ak ≡ ρ−1re f
∫BC
ρkdx [µm] reflect a total amount of 1H nuclei in k-th pool in the base
coat. The density 1H nuclei in liquid water ρre f = 0.11mol/cm3. The amount of 1H nucleink [mol/m2] in k-th pool relates to Ak as follows
nk = ρre f Ak . (5.4)
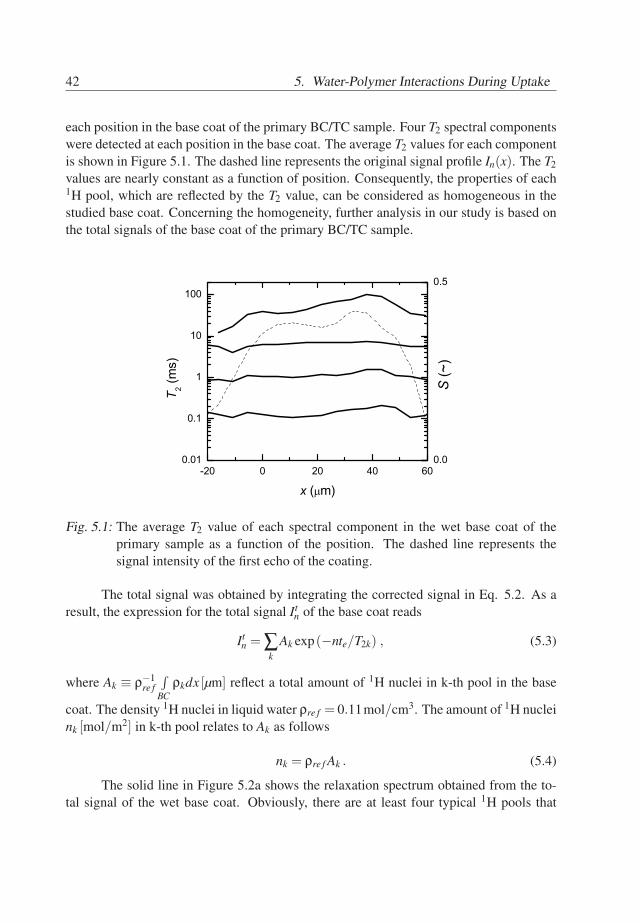
The solid line in Figure 5.2a shows the relaxation spectrum obtained from the to-tal signal of the wet base coat. Obviously, there are at least four typical 1H pools that
42
5.3. Results 43
contribute to the signal. The bars show both the average spectral position and the totalintensity of the peaks. The total intensity equals the total amount of 1H nuclei in the pool.The next steps in our analysis focus on the identification of the peaks, i.e. understandingthe connection of the T2 components with water and polymeric ingredients of the primarybase coat.
0.1 1 10 1000.00
0.06
0.12
0.00
0.02
0.04
0.00
0.06
0.12
0.00
0.02
0.04
0.00
0.06
0.12
0.00
0.02
0.04
T2 (ms)
n (m
mol
/cm
2 )
Dry
Wet(H
2O)
Wet(D
2O)
(a)
(b)
(c)
Fig. 5.2: The T2 spectra of the base coat in wet (H2O (a) and D2O (b)) and dry (c) states.The bars mark the average spectral positions of the peaks and total intensity ofthe peaks. The bars intensities are shown by the left scale and the raw spectraintensities are shown by the right scale.
Water and Polymer
First, the signal of water in the relaxation spectrum will be identified in Figure 5.2a. Com-paring the spectra of the primary base coat wetted with H2O (Figure 5.2a) and wetted withD2O (Figure 5.2b) only revealed a significant difference in the intensity of the spectral
43
44 5. Water-Polymer Interactions During Uptake
component at T2 ≃ 6ms. Whereas in the H2O-wet spectrum a huge peak exists, this peakis small in the D2O-wet spectrum. This implies that this spectral component representswater in the base coat (Table 5.1). The intensity of the water component correspondsto 1.41mg/cm2. This value means that the base coat has absorbed approximately 26%w/w of water. Note that the number of exchangeable protons in hydroxyl, acid and aminegroups in the base coat are equivalent to 0.4% w/w of water in the base coat. Therefore,their amount can be neglected when relaxation spectra are discussed.
As a consequence, all other spectral components are from the polymeric matrix ofthe coating, which may be sensitive to interaction with water. To detect the influence ofwater on the polymer matrix, the T2 spectra of a dry base coat and one wetted with D2Ohave to be compared. The spectrum of the dry base coat contains three peaks, see Figure5.2. The first component is at T2 ≃ 0.1ms and two other components are located at T2 ≃0.9ms and T2 ≃ 2ms, respectively. The spectra of the wet (H2O and D2O) system containa component at T2 ≃ 20− 40ms, which is absent in the spectrum of the dry base coat.Since the T2 increases drastically due to an increase in polymer mobility, the componentat 20−40ms is a consequence of polymer plasticized by water.
The next step in our analysis is the identification of the acrylic, PUR and dispersantingredients among the spectral components of the polymer.
Polymeric Compounds
The pigment particles of the base coat are in a crystalline state and hydrophobic. Asthey have a T2 value much less than the used interecho time te, pigment is not visible inrelaxation spectra. Polymeric components in the relaxation spectra in Figure 5.2 shouldoriginate from acrylic core/shell particles, PUR material and the polymeric dispersant.
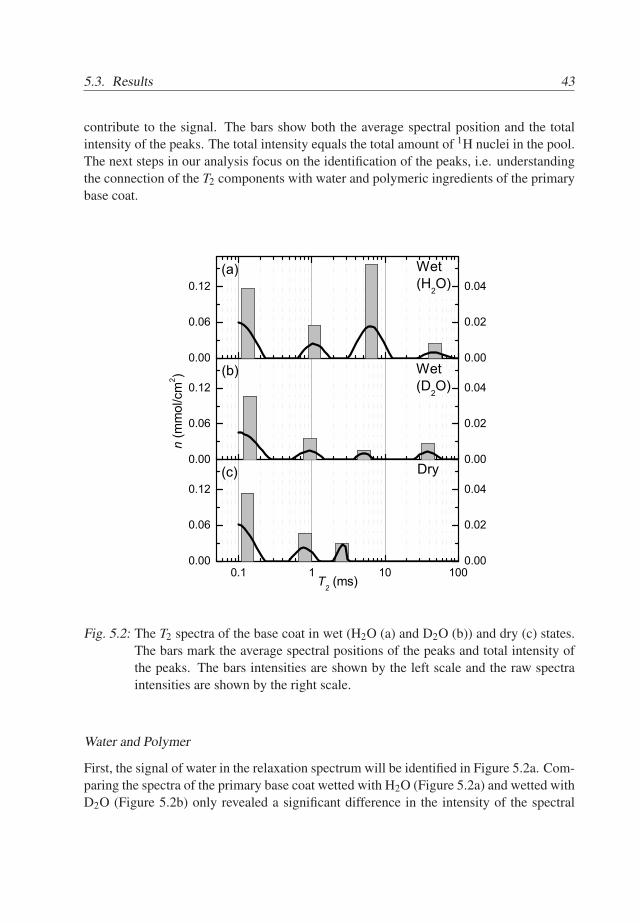
In order to identify the T2 components of the polymer matrix and to determine thepolymer compounds that are plasticized by water, the spectra of a base coat of a pureacrylic BC/TC system and of a PUR film are compared with the spectra of the base coatof the primary sample.
The spectra of the base coat of the acrylic BC/TC sample are presented in Figure5.3. The spectrum of the dry acrylic base coat contains a single component at approxi-mately 0.1ms, see Figure 5.3c. This implies that the components observed at 0.9 ms and 2ms in the spectrum of the dry primary base coat (Figure 5.2) belong PUR particles and thedispersant. The spectrum of the acrylic base coat wetted with D2O is presented in Figure5.3b. As compared to Figure 5.3a it includes a single additional component at 1ms withnegligible intensity, it is concluded that the acrylic core/shell particles are not plasticizedby water. We conclude that the shell of the acrylic particles is not distinguished either dueto small intensity or due to overlap with the main component at 0.1ms.
The spectrum of the wet acrylic base coat includes two additional T2 components,see Figure 5.3a. Since the component at 1ms is very small and since there is no spec-
44
5.3. Results 45
0.1 1 10 1000.00
0.06
0.12
0.00
0.02
0.04
0.00
0.06
0.12
0.00
0.02
0.04
0.00
0.06
0.12
0.00
0.02
0.04
T2 (ms)
n (m
mol
/cm
2 )
Dry
Wet(H
2O)
Wet(D
2O)
(a)
(b)
(c)
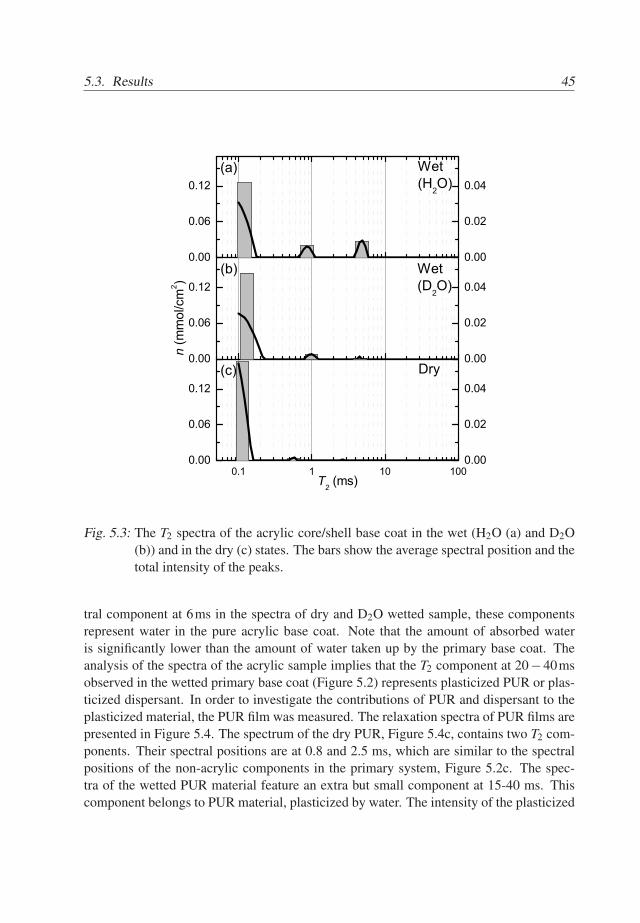
Fig. 5.3: The T2 spectra of the acrylic core/shell base coat in the wet (H2O (a) and D2O(b)) and in the dry (c) states. The bars show the average spectral position and thetotal intensity of the peaks.
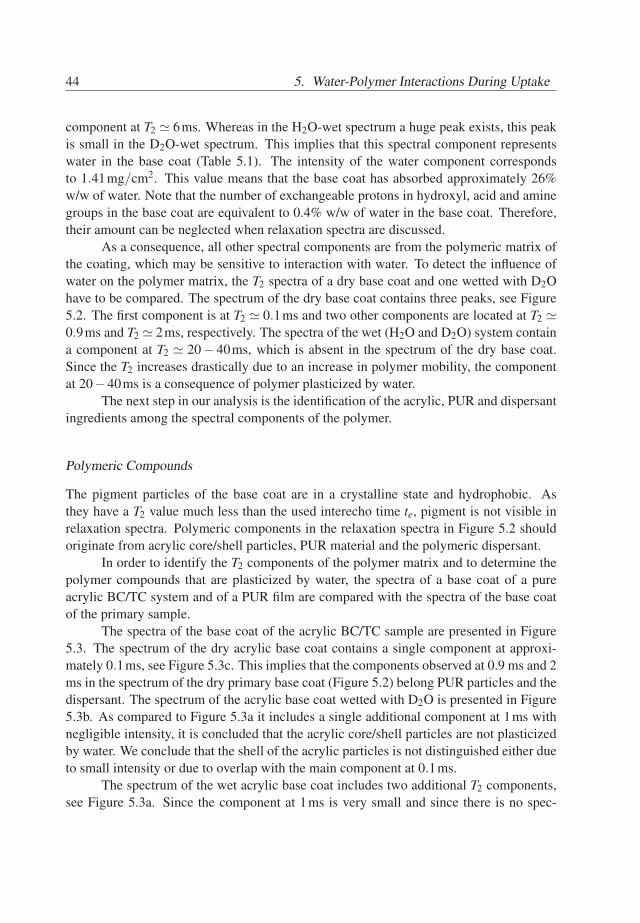
tral component at 6ms in the spectra of dry and D2O wetted sample, these componentsrepresent water in the pure acrylic base coat. Note that the amount of absorbed wateris significantly lower than the amount of water taken up by the primary base coat. Theanalysis of the spectra of the acrylic sample implies that the T2 component at 20−40msobserved in the wetted primary base coat (Figure 5.2) represents plasticized PUR or plas-ticized dispersant. In order to investigate the contributions of PUR and dispersant to theplasticized material, the PUR film was measured. The relaxation spectra of PUR films arepresented in Figure 5.4. The spectrum of the dry PUR, Figure 5.4c, contains two T2 com-ponents. Their spectral positions are at 0.8 and 2.5 ms, which are similar to the spectralpositions of the non-acrylic components in the primary system, Figure 5.2c. The spec-tra of the wetted PUR material feature an extra but small component at 15-40 ms. Thiscomponent belongs to PUR material, plasticized by water. The intensity of the plasticized
45
46 5. Water-Polymer Interactions During Uptake
0.1 1 10 1000.00
0.09
0.18
0.00
0.03
0.06
0.00
0.09
0.18
0.00
0.03
0.06
0.00
0.09
0.18
0.00
0.03
0.06
T2 (ms)
(a)
(b)
(c)
n (m
mol
/cm
2 )
Dry
Wet(H
2O)
Wet(D
2O)
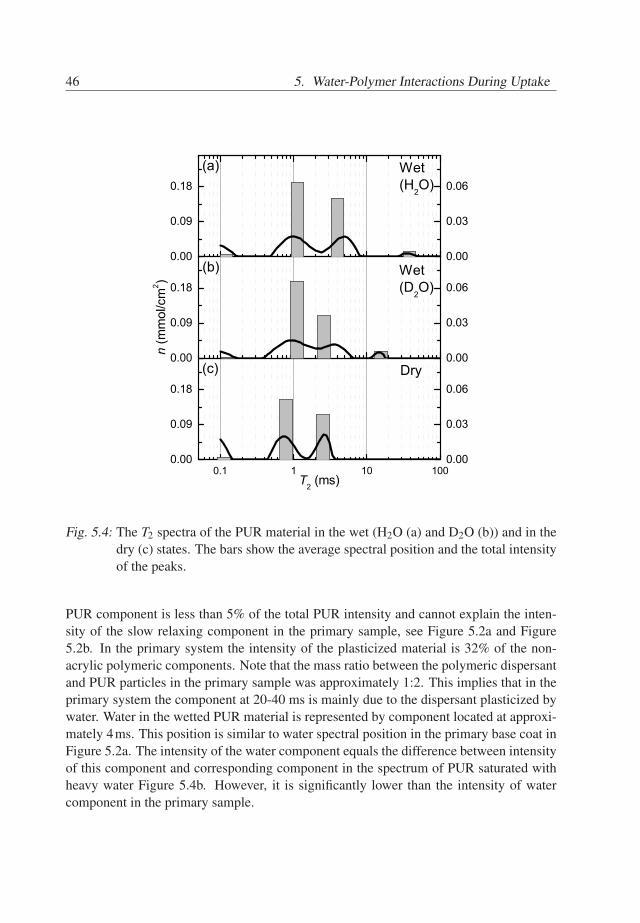
Fig. 5.4: The T2 spectra of the PUR material in the wet (H2O (a) and D2O (b)) and in thedry (c) states. The bars show the average spectral position and the total intensityof the peaks.
PUR component is less than 5% of the total PUR intensity and cannot explain the inten-sity of the slow relaxing component in the primary sample, see Figure 5.2a and Figure5.2b. In the primary system the intensity of the plasticized material is 32% of the non-acrylic polymeric components. Note that the mass ratio between the polymeric dispersantand PUR particles in the primary sample was approximately 1:2. This implies that in theprimary system the component at 20-40 ms is mainly due to the dispersant plasticized bywater. Water in the wetted PUR material is represented by component located at approxi-mately 4ms. This position is similar to water spectral position in the primary base coat inFigure 5.2a. The intensity of the water component equals the difference between intensityof this component and corresponding component in the spectrum of PUR saturated withheavy water Figure 5.4b. However, it is significantly lower than the intensity of watercomponent in the primary sample.
46
5.3. Results 47
A summary of the assignments of the T2 components is given in Table 5.1. Thus,in the spectrum of the wet primary base coat, see Figure 5.2a, we assign the spectralcomponent at 0.1ms to acrylic core/shell material, the components at 0.8 − 2.5ms tothe PUR material and the dry dispersant. The component at 20− 40ms mainly belongsto the plasticized dispersant with possibly a very small contribution of plasticized PUR.The spectral component at T2 ≃ 6ms represents mainly water. Note, that the T2 of waterhas a smaller value than of the plasticized dispersant. Normally, one would expect thatthe plasticizer has a similar or higher T2 value than the plasticized material. The reasonmay be that either diffusion of water in the field gradient dominates the T2 relaxationof the water or that protons of water are present at least in two different environmentswith different mobilities. In the latter case, the measured T2 time may be affected by arapid exchange between these environments [71]. Whether or not diffusion explains thisobservation is discussed in the next section.
An important observation is that the intensity of the water components in the spectraof wet acrylic (Figure 5.3a) and wet PUR (Figure 5.4a) materials cannot explain the highintensity of water spectral component in the primary system (Figure 5.2a). Thereforewe conclude that the hydrophilic PEO/PPO hairs of the polymeric dispersant absorb asignificant amount of water.
Spectral position 0.1ms 0.8−2.5ms 6ms 20−40msCompound Acrylic PUR & dispersant water plasticized dispersant
Tab. 5.1: Identified compounds in the wet primary base coat of the primary sample andtheir spectral positions, for te = 0.1ms.
5.3.2 The diffusivity of water in the base coat
Water in the base coat is either strongly bonded to the polymer or highly mobile. Thebinding of water to the polymer is reflected by the T2S time, whereas diffusion is describedby T2D in Eq. 3.8. If water molecules are highly mobile and have a high self-diffusioncoefficient, then T2D ≪ T2S and T2 ≃ T2D. The goal of this section is to find out whetherwater binding to the polymer lattice or water diffusion dominates the T2 value.
Therefore, a primary sample, in fully or partially saturated state, was measured withvarious echo times ranging from 0.1 to 0.6ms. The relaxivity T−1
2 of water as a functionof t2
e obtained from the total signal of the fully saturated base coat is shown in Figure 5.5(squares). The inverse T2 increases linearly with t2
e and has an offset. This offset seemsto be the only influence of T2S in this case and the echo time dependency of the waterrelaxation is only determined by diffusion in the field gradient. The slope of the curve ofthe wet system in Figure 5.5 equals 2.7×10⁹ s−3, which leads to a self-diffusion constant
47
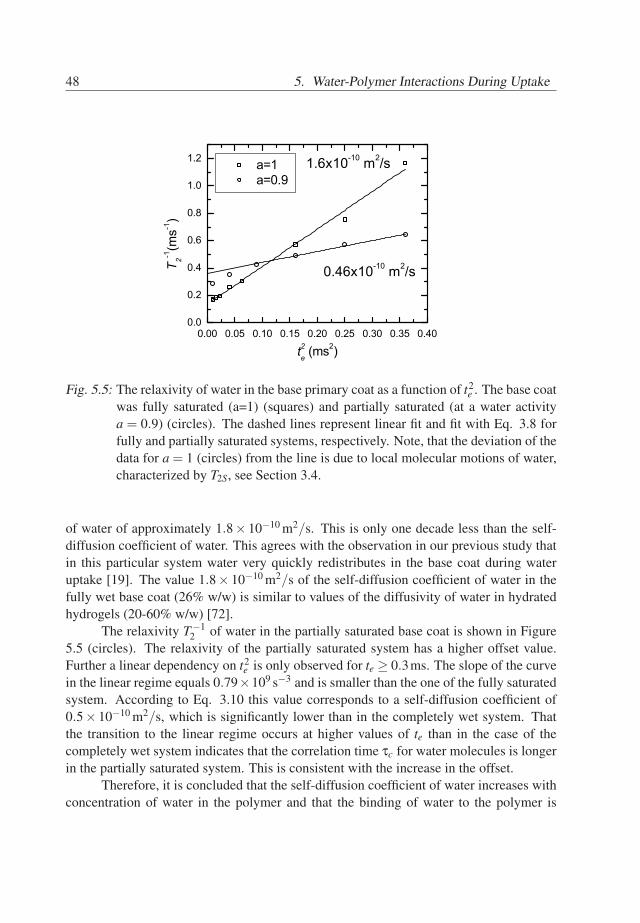
48 5. Water-Polymer Interactions During Uptake
0.00 0.05 0.10 0.15 0.20 0.25 0.30 0.35 0.400.0
0.2
0.4
0.6
0.8
1.0
1.2
0.46x10⁻¹⁰ m2/s
a=1 a=0.9
T 2-1(m
s-1)
t2e (ms2)
1.6x10⁻¹⁰ m2/s
Fig. 5.5: The relaxivity of water in the base primary coat as a function of t2e . The base coat
was fully saturated (a=1) (squares) and partially saturated (at a water activitya = 0.9) (circles). The dashed lines represent linear fit and fit with Eq. 3.8 forfully and partially saturated systems, respectively. Note, that the deviation of thedata for a = 1 (circles) from the line is due to local molecular motions of water,characterized by T2S, see Section 3.4.
of water of approximately 1.8× 10⁻¹⁰ m2/s. This is only one decade less than the self-diffusion coefficient of water. This agrees with the observation in our previous study thatin this particular system water very quickly redistributes in the base coat during wateruptake [19]. The value 1.8× 10⁻¹⁰ m2/s of the self-diffusion coefficient of water in thefully wet base coat (26% w/w) is similar to values of the diffusivity of water in hydratedhydrogels (20-60% w/w) [72].
The relaxivity T−12 of water in the partially saturated base coat is shown in Figure
5.5 (circles). The relaxivity of the partially saturated system has a higher offset value.Further a linear dependency on t2
e is only observed for te ≥ 0.3ms. The slope of the curvein the linear regime equals 0.79×10⁹ s−3 and is smaller than the one of the fully saturatedsystem. According to Eq. 3.10 this value corresponds to a self-diffusion coefficient of0.5× 10−10 m2/s, which is significantly lower than in the completely wet system. Thatthe transition to the linear regime occurs at higher values of te than in the case of thecompletely wet system indicates that the correlation time τc for water molecules is longerin the partially saturated system. This is consistent with the increase in the offset.
Therefore, it is concluded that the self-diffusion coefficient of water increases withconcentration of water in the polymer and that the binding of water to the polymer is
48
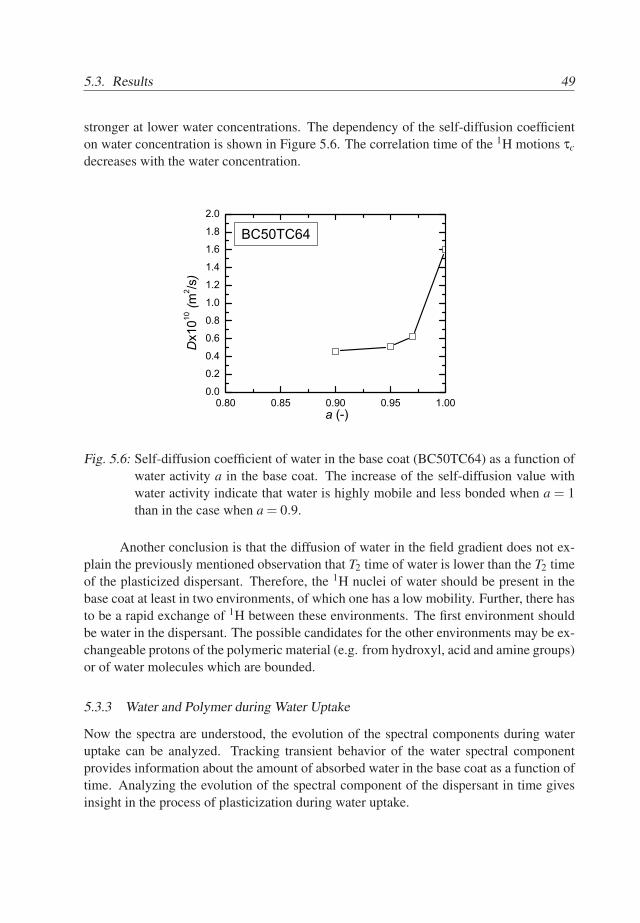
5.3. Results 49
stronger at lower water concentrations. The dependency of the self-diffusion coefficienton water concentration is shown in Figure 5.6. The correlation time of the 1H motions τc
decreases with the water concentration.
0.80 0.85 0.90 0.95 1.000.0
0.2
0.4
0.6
0.8
1.0
1.2
1.4
1.6
1.8
2.0
Dx1010
(m2 /s
)
a (-)
BC50TC64
Fig. 5.6: Self-diffusion coefficient of water in the base coat (BC50TC64) as a function ofwater activity a in the base coat. The increase of the self-diffusion value withwater activity indicate that water is highly mobile and less bonded when a = 1than in the case when a = 0.9.
Another conclusion is that the diffusion of water in the field gradient does not ex-plain the previously mentioned observation that T2 time of water is lower than the T2 timeof the plasticized dispersant. Therefore, the 1H nuclei of water should be present in thebase coat at least in two environments, of which one has a low mobility. Further, there hasto be a rapid exchange of 1H between these environments. The first environment shouldbe water in the dispersant. The possible candidates for the other environments may be ex-changeable protons of the polymeric material (e.g. from hydroxyl, acid and amine groups)or of water molecules which are bounded.
5.3.3 Water and Polymer during Water Uptake
Now the spectra are understood, the evolution of the spectral components during wateruptake can be analyzed. Tracking transient behavior of the water spectral componentprovides information about the amount of absorbed water in the base coat as a function oftime. Analyzing the evolution of the spectral component of the dispersant in time givesinsight in the process of plasticization during water uptake.
49
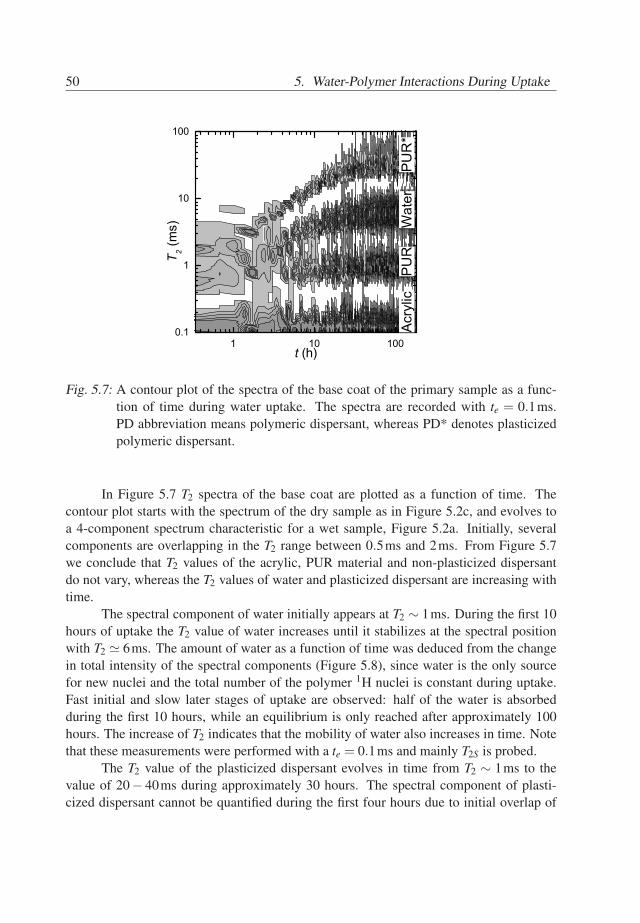
50 5. Water-Polymer Interactions During Uptake
Fig. 5.7: A contour plot of the spectra of the base coat of the primary sample as a func-tion of time during water uptake. The spectra are recorded with te = 0.1ms.PD abbreviation means polymeric dispersant, whereas PD* denotes plasticizedpolymeric dispersant.
In Figure 5.7 T2 spectra of the base coat are plotted as a function of time. Thecontour plot starts with the spectrum of the dry sample as in Figure 5.2c, and evolves toa 4-component spectrum characteristic for a wet sample, Figure 5.2a. Initially, severalcomponents are overlapping in the T2 range between 0.5ms and 2ms. From Figure 5.7we conclude that T2 values of the acrylic, PUR material and non-plasticized dispersantdo not vary, whereas the T2 values of water and plasticized dispersant are increasing withtime.
The spectral component of water initially appears at T2 ∼ 1ms. During the first 10hours of uptake the T2 value of water increases until it stabilizes at the spectral positionwith T2 ≃ 6ms. The amount of water as a function of time was deduced from the changein total intensity of the spectral components (Figure 5.8), since water is the only sourcefor new nuclei and the total number of the polymer 1H nuclei is constant during uptake.Fast initial and slow later stages of uptake are observed: half of the water is absorbedduring the first 10 hours, while an equilibrium is only reached after approximately 100hours. The increase of T2 indicates that the mobility of water also increases in time. Notethat these measurements were performed with a te = 0.1ms and mainly T2S is probed.
The T2 value of the plasticized dispersant evolves in time from T2 ∼ 1ms to thevalue of 20− 40ms during approximately 30 hours. The spectral component of plasti-cized dispersant cannot be quantified during the first four hours due to initial overlap of
50
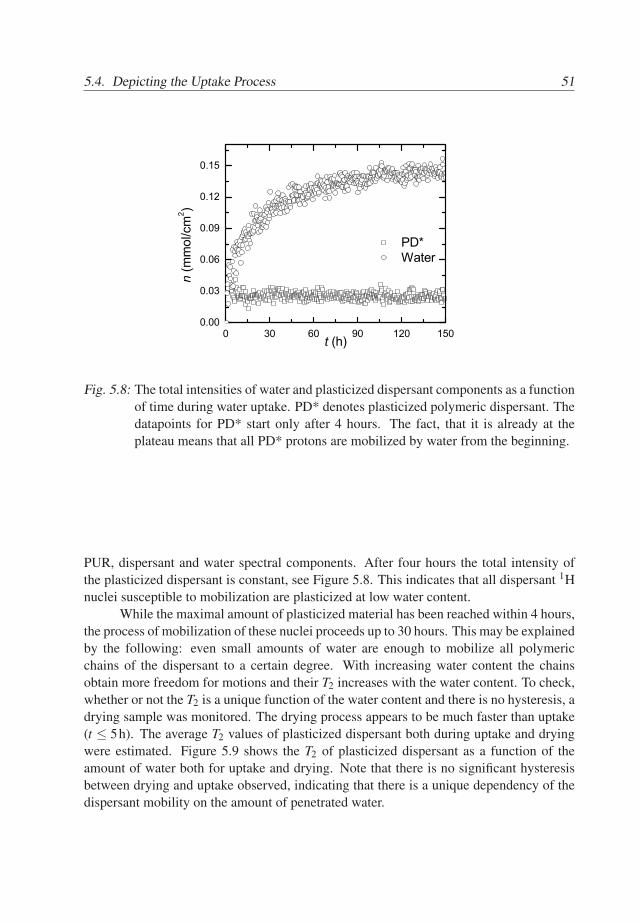
5.4. Depicting the Uptake Process 51
0 30 60 90 120 1500.00
0.03
0.06
0.09
0.12
0.15
PD* Water
n (m
mol
/cm
2 )
t (h)
Fig. 5.8: The total intensities of water and plasticized dispersant components as a functionof time during water uptake. PD* denotes plasticized polymeric dispersant. Thedatapoints for PD* start only after 4 hours. The fact, that it is already at theplateau means that all PD* protons are mobilized by water from the beginning.
PUR, dispersant and water spectral components. After four hours the total intensity ofthe plasticized dispersant is constant, see Figure 5.8. This indicates that all dispersant 1Hnuclei susceptible to mobilization are plasticized at low water content.
While the maximal amount of plasticized material has been reached within 4 hours,the process of mobilization of these nuclei proceeds up to 30 hours. This may be explainedby the following: even small amounts of water are enough to mobilize all polymericchains of the dispersant to a certain degree. With increasing water content the chainsobtain more freedom for motions and their T2 increases with the water content. To check,whether or not the T2 is a unique function of the water content and there is no hysteresis, adrying sample was monitored. The drying process appears to be much faster than uptake(t ≤ 5h). The average T2 values of plasticized dispersant both during uptake and dryingwere estimated. Figure 5.9 shows the T2 of plasticized dispersant as a function of theamount of water both for uptake and drying. Note that there is no significant hysteresisbetween drying and uptake observed, indicating that there is a unique dependency of thedispersant mobility on the amount of penetrated water.
51
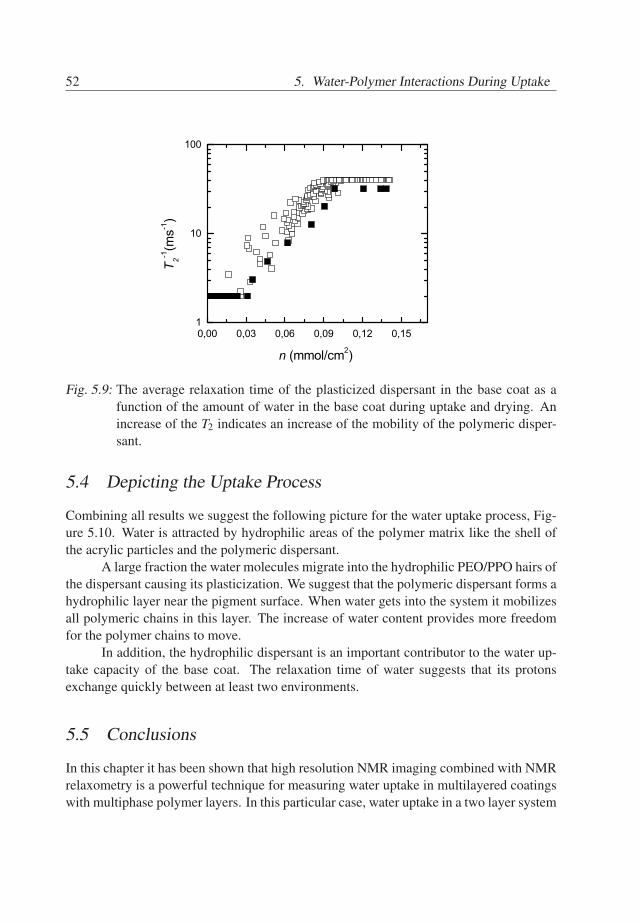
52 5. Water-Polymer Interactions During Uptake
0,00 0,03 0,06 0,09 0,12 0,151
10
100
n (mmol/cm2)
T 2-1(m
s-1)
Fig. 5.9: The average relaxation time of the plasticized dispersant in the base coat as afunction of the amount of water in the base coat during uptake and drying. Anincrease of the T2 indicates an increase of the mobility of the polymeric disper-sant.
5.4 Depicting the Uptake Process
Combining all results we suggest the following picture for the water uptake process, Fig-ure 5.10. Water is attracted by hydrophilic areas of the polymer matrix like the shell ofthe acrylic particles and the polymeric dispersant.
A large fraction the water molecules migrate into the hydrophilic PEO/PPO hairs ofthe dispersant causing its plasticization. We suggest that the polymeric dispersant forms ahydrophilic layer near the pigment surface. When water gets into the system it mobilizesall polymeric chains in this layer. The increase of water content provides more freedomfor the polymer chains to move.
In addition, the hydrophilic dispersant is an important contributor to the water up-take capacity of the base coat. The relaxation time of water suggests that its protonsexchange quickly between at least two environments.
5.5 Conclusions
In this chapter it has been shown that high resolution NMR imaging combined with NMRrelaxometry is a powerful technique for measuring water uptake in multilayered coatingswith multiphase polymer layers. In this particular case, water uptake in a two layer system
52
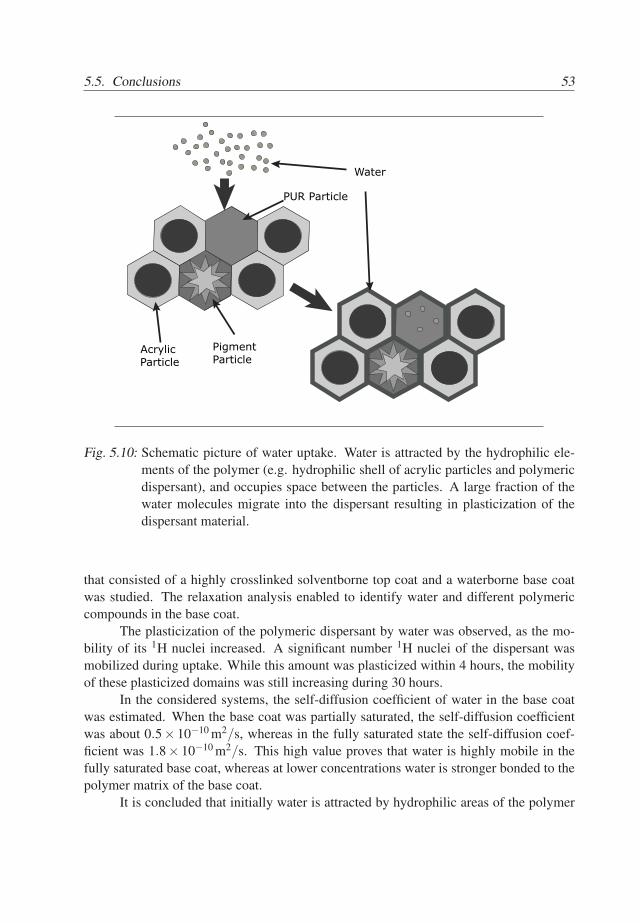
5.5. Conclusions 53
Acrylic Particle
PUR Particle
PigmentParticle
Water
Fig. 5.10: Schematic picture of water uptake. Water is attracted by the hydrophilic ele-ments of the polymer (e.g. hydrophilic shell of acrylic particles and polymericdispersant), and occupies space between the particles. A large fraction of thewater molecules migrate into the dispersant resulting in plasticization of thedispersant material.
that consisted of a highly crosslinked solventborne top coat and a waterborne base coatwas studied. The relaxation analysis enabled to identify water and different polymericcompounds in the base coat.
The plasticization of the polymeric dispersant by water was observed, as the mo-bility of its 1H nuclei increased. A significant number 1H nuclei of the dispersant wasmobilized during uptake. While this amount was plasticized within 4 hours, the mobilityof these plasticized domains was still increasing during 30 hours.
In the considered systems, the self-diffusion coefficient of water in the base coatwas estimated. When the base coat was partially saturated, the self-diffusion coefficientwas about 0.5× 10⁻¹⁰ m2/s, whereas in the fully saturated state the self-diffusion coef-ficient was 1.8× 10⁻¹⁰ m2/s. This high value proves that water is highly mobile in thefully saturated base coat, whereas at lower concentrations water is stronger bonded to thepolymer matrix of the base coat.
It is concluded that initially water is attracted by hydrophilic areas of the polymer
53
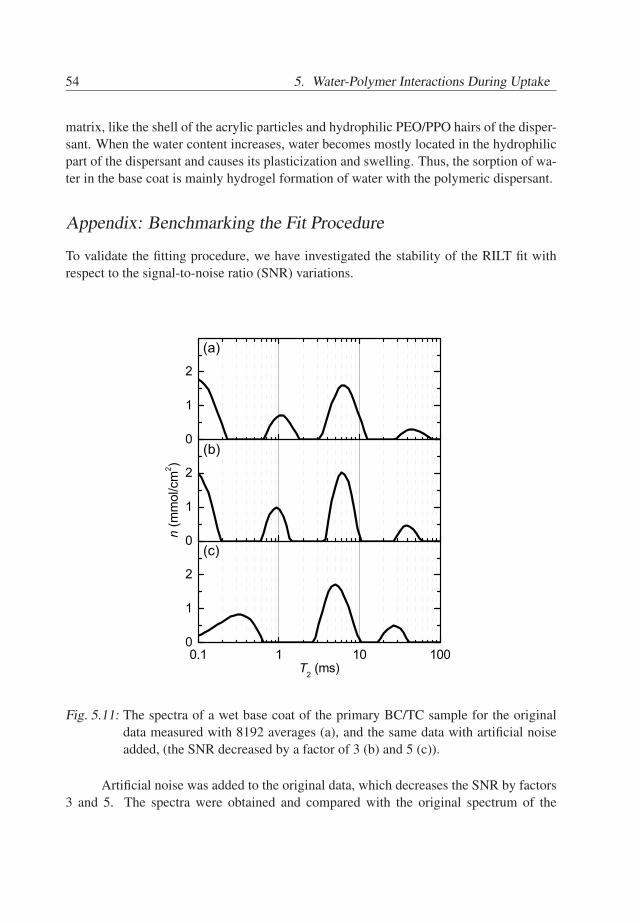
54 5. Water-Polymer Interactions During Uptake
matrix, like the shell of the acrylic particles and hydrophilic PEO/PPO hairs of the disper-sant. When the water content increases, water becomes mostly located in the hydrophilicpart of the dispersant and causes its plasticization and swelling. Thus, the sorption of wa-ter in the base coat is mainly hydrogel formation of water with the polymeric dispersant.
Appendix: Benchmarking the Fit Procedure
To validate the fitting procedure, we have investigated the stability of the RILT fit withrespect to the signal-to-noise ratio (SNR) variations.
0.1 1 10 1000
1
2
0
1
2
0
1
2
T2 (ms)
(c)
n (m
mol
/cm
2 )
(b)
(a)
Fig. 5.11: The spectra of a wet base coat of the primary BC/TC sample for the originaldata measured with 8192 averages (a), and the same data with artificial noiseadded, (the SNR decreased by a factor of 3 (b) and 5 (c)).
Artificial noise was added to the original data, which decreases the SNR by factors3 and 5. The spectra were obtained and compared with the original spectrum of the
54
5.5. Conclusions 55
sample, see Figure 5.11. A decrease of the SNR by a factor of three does not significantlychange the number, positions and amplitudes of the T2 components. If the SNR is fivetimes smaller than in the original data, two components merge to one.
Note, that in this study relaxation measurements were performed with 8192 av-erages and uptake experiments with 2048, Figure 5.11a. Therefore, uptake experimentswere performed with SNR, which is a factor of two lower than SNR in relaxation mea-surements. Our stability analysis indicates that the SNR during the uptake measurementsis suitable for a proper resolution of the T2 spectra.
55

56 5. Water-Polymer Interactions During Uptake
56
6. Modeling Water Transport Kinetics
6.1 Introduction
In the previous chapters an empirical basis for understanding water uptake in a specificbase coat/top coat systems has been obtained. It was found that water redistributes inthe base coat instantly, i.e. becomes homogeneously distributed much quicker than thetime resolution of the measurements. It was concluded that the rate of water transportis limited by penetration through the barrier, i.e. the top coat. Finally, it was concludedthat the polymeric dispersant in the base coat plays a key role in water uptake by thecoatings. The next step in the study of water uptake by two-layered systems is to developa theoretical model connecting the properties of the sample and water transport kinetics.Presently, published studies have mostly focused on modeling water transport in singlelayer coatings.
This chapter introduces a model for water transport in the base coat/top coat sys-tems. The presented theory describes the process as Fickian diffusion with constant diffu-sivity through the top coat to the base coat. The latter acts as an instantaneous reservoir.The chapter starts with a description of the conceptual model for water transport. Themodel includes the barrier properties of the top coat, which define the timescale of theprocess, and the base coat sorption isotherm, which defines the actual transport kinetics.The chapter proceeds with an investigation of the barrier properties of the top coat andverifies their relation with the timescale of the process. Further, the sorption isothermof the base coat is studied on the basis of gravimetry. This compared with the isotherm,extracted from the uptake data via the model to confirm its role in defining the drivingforce of water transport. The state of water in the base coat, reflected by the shape of theisotherm is discussed. Finally, the ability of the model to predict water transport is verifiedby a comparison of water transport, simulated via the model, with the experimental data.
6.2 Experimental Details
6.2.1 Samples
The investigated polymeric systems are two-layered base coat/top coat systems. Fora detailed description of the samples we refer to Section 4.2 in Chapter 4. Here, we
57
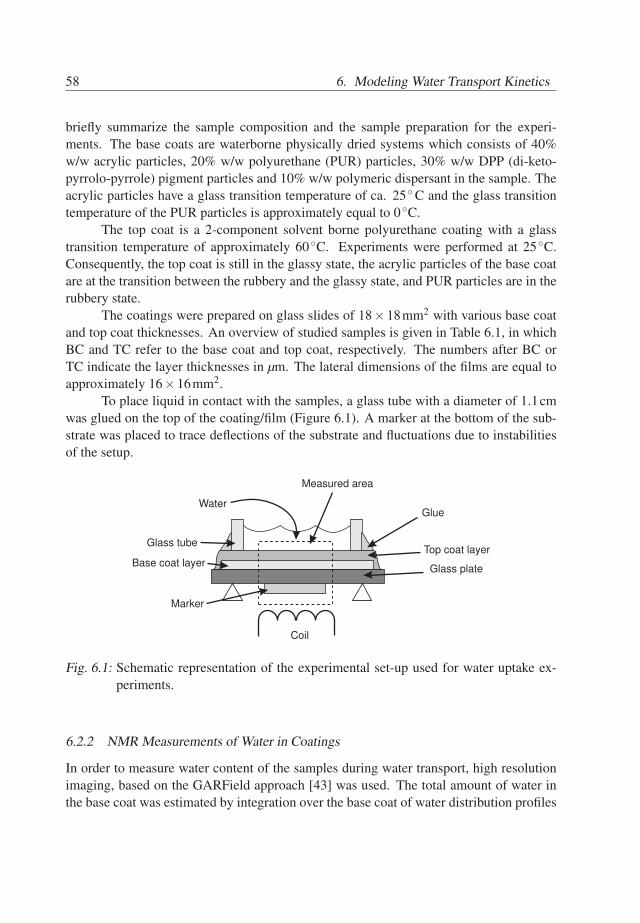
58 6. Modeling Water Transport Kinetics
briefly summarize the sample composition and the sample preparation for the experi-ments. The base coats are waterborne physically dried systems which consists of 40%w/w acrylic particles, 20% w/w polyurethane (PUR) particles, 30% w/w DPP (di-keto-pyrrolo-pyrrole) pigment particles and 10% w/w polymeric dispersant in the sample. Theacrylic particles have a glass transition temperature of ca. 25 C and the glass transitiontemperature of the PUR particles is approximately equal to 0 C.
The top coat is a 2-component solvent borne polyurethane coating with a glasstransition temperature of approximately 60 C. Experiments were performed at 25 C.Consequently, the top coat is still in the glassy state, the acrylic particles of the base coatare at the transition between the rubbery and the glassy state, and PUR particles are in therubbery state.
The coatings were prepared on glass slides of 18×18mm2 with various base coatand top coat thicknesses. An overview of studied samples is given in Table 6.1, in whichBC and TC refer to the base coat and top coat, respectively. The numbers after BC orTC indicate the layer thicknesses in µm. The lateral dimensions of the films are equal toapproximately 16×16mm2.
To place liquid in contact with the samples, a glass tube with a diameter of 1.1cmwas glued on the top of the coating/film (Figure 6.1). A marker at the bottom of the sub-strate was placed to trace deflections of the substrate and fluctuations due to instabilitiesof the setup.
Glass tube
Glue
Top coat layer
Base coat layerGlass plate
Marker
Water
Coil
Measured area
Fig. 6.1: Schematic representation of the experimental set-up used for water uptake ex-periments.
6.2.2 NMR Measurements of Water in Coatings
In order to measure water content of the samples during water transport, high resolutionimaging, based on the GARField approach [43] was used. The total amount of water inthe base coat was estimated by integration over the base coat of water distribution profiles
58
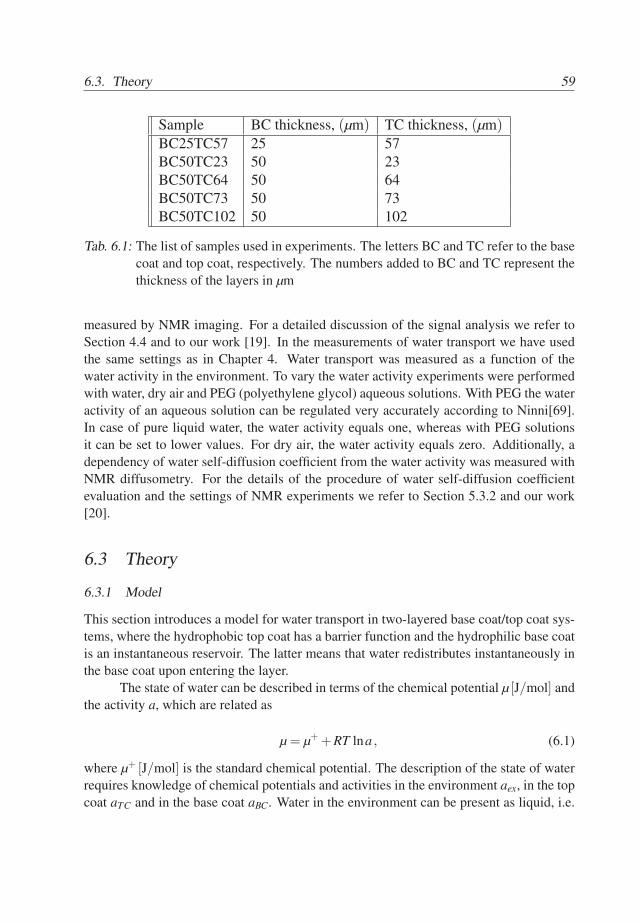
6.3. Theory 59
Sample BC thickness, (µm) TC thickness, (µm)BC25TC57 25 57BC50TC23 50 23BC50TC64 50 64BC50TC73 50 73BC50TC102 50 102
Tab. 6.1: The list of samples used in experiments. The letters BC and TC refer to the basecoat and top coat, respectively. The numbers added to BC and TC represent thethickness of the layers in µm
measured by NMR imaging. For a detailed discussion of the signal analysis we refer toSection 4.4 and to our work [19]. In the measurements of water transport we have usedthe same settings as in Chapter 4. Water transport was measured as a function of thewater activity in the environment. To vary the water activity experiments were performedwith water, dry air and PEG (polyethylene glycol) aqueous solutions. With PEG the wateractivity of an aqueous solution can be regulated very accurately according to Ninni[69].In case of pure liquid water, the water activity equals one, whereas with PEG solutionsit can be set to lower values. For dry air, the water activity equals zero. Additionally, adependency of water self-diffusion coefficient from the water activity was measured withNMR diffusometry. For the details of the procedure of water self-diffusion coefficientevaluation and the settings of NMR experiments we refer to Section 5.3.2 and our work[20].
6.3 Theory
6.3.1 Model
This section introduces a model for water transport in two-layered base coat/top coat sys-tems, where the hydrophobic top coat has a barrier function and the hydrophilic base coatis an instantaneous reservoir. The latter means that water redistributes instantaneously inthe base coat upon entering the layer.
The state of water can be described in terms of the chemical potential µ [J/mol] andthe activity a, which are related as
µ = µ++RT lna , (6.1)
where µ+ [J/mol] is the standard chemical potential. The description of the state of waterrequires knowledge of chemical potentials and activities in the environment aex, in the topcoat aTC and in the base coat aBC. Water in the environment can be present as liquid, i.e.
59
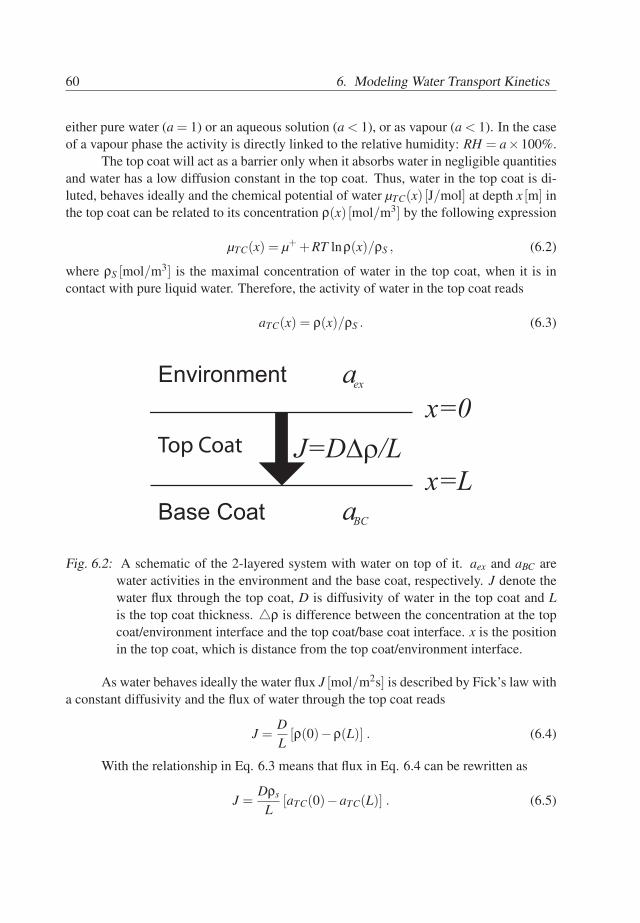
60 6. Modeling Water Transport Kinetics
either pure water (a = 1) or an aqueous solution (a < 1), or as vapour (a < 1). In the caseof a vapour phase the activity is directly linked to the relative humidity: RH = a×100%.
The top coat will act as a barrier only when it absorbs water in negligible quantitiesand water has a low diffusion constant in the top coat. Thus, water in the top coat is di-luted, behaves ideally and the chemical potential of water µTC(x) [J/mol] at depth x [m] inthe top coat can be related to its concentration ρ(x) [mol/m3] by the following expression
µTC(x) = µ++RT lnρ(x)/ρS , (6.2)
where ρS [mol/m3] is the maximal concentration of water in the top coat, when it is incontact with pure liquid water. Therefore, the activity of water in the top coat reads
aTC(x) = ρ(x)/ρS . (6.3)
Environment
Base Coat
Top Coat J=D∆ρ/L
x=0
x=L
aBC
aex
Fig. 6.2: A schematic of the 2-layered system with water on top of it. aex and aBC arewater activities in the environment and the base coat, respectively. J denote thewater flux through the top coat, D is diffusivity of water in the top coat and Lis the top coat thickness. ρ is difference between the concentration at the topcoat/environment interface and the top coat/base coat interface. x is the positionin the top coat, which is distance from the top coat/environment interface.
As water behaves ideally the water flux J [mol/m2s] is described by Fick’s law witha constant diffusivity and the flux of water through the top coat reads
J =DL[ρ(0)−ρ(L)] . (6.4)
With the relationship in Eq. 6.3 means that flux in Eq. 6.4 can be rewritten as
J =Dρs
L[aTC(0)−aTC(L)] . (6.5)
60
6.3. Theory 61
When the base coat acts as an instantaneous reservoir the water concentration andthe water activity in the base coat are homogeneous during the water transport. Thisimplies that the water activity is a unique function of the total water content in the basecoat
aBC ≡ aBC(n/nmax) (6.6)
where n [mol] and nmax [mol] are the total amount of water and the water uptake capacityof the base coat, respectively.
We assume that water instantaneously equilibrates at the interfaces. This impliesthe following boundary conditions: aTC(0) = aex for the TC/environment interface andaTC(L) = aBC(n/nmax) for the BC/TC interface.
The rate of change in the total amount of water in the base coat follows from theconservation law
dndt
= AJ , (6.7)
where A [m2] is the area of penetrationThe combination of Eq. 6.5 and Eq. 6.7 results in the equation for water content in
the base coat during water transport
dn/nmax
dt=
1τ[aex −aBC(n/nmax)] , (6.8)
where the timescale τ assimilates both characteristics of the top coat (D, ρS, L) and thebase coat (nmax)
τ =Lnmax
ADρs(6.9)
Note, that DρS equals the permeability [12] of the top coat to water.According to the model, water uptake in the systems of interest is governed by two
system-related parameters: the timescale τ, which is determined by the barrier proper-ties of the top coat and the capacity of the base coat (Eq. 6.9) and the inverse sorptionisotherm of the base coat aBC(n/nmax). The way, how the parameter τ is present in thetransport equation (Eq. 6.8), implies that it defines the timescale of the process. The in-verse isotherm aBC(n/nmax) defines the transport process kinetics (i.e. time dependencyof the water content n(t/τ)), in particular the sorption and desorption kinetics.
6.3.2 Influence Sorption Isotherms on Water Transport Kinetics
To explore how the shape of the sorption isotherms influences the transport kinetics, typ-ical isotherms for polymeric materials, were used to simulate uptake (aex = 1) and drying
61
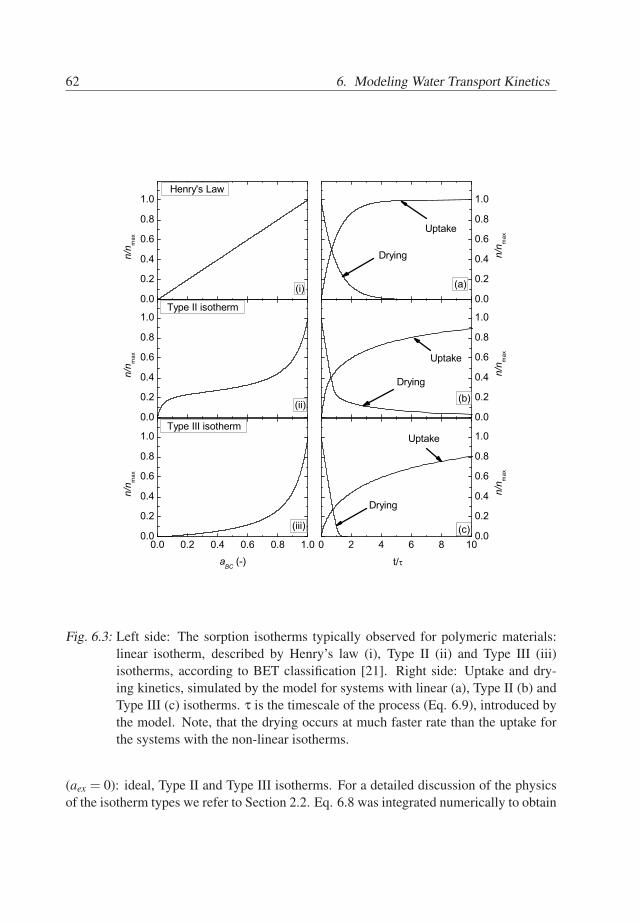
62 6. Modeling Water Transport Kinetics
0.0
0.2
0.4
0.6
0.8
1.0
0.0
0.2
0.4
0.6
0.8
1.0
0 2 4 6 8 100.0
0.2
0.4
0.6
0.8
1.0
0.0
0.2
0.4
0.6
0.8
1.0
0.0
0.2
0.4
0.6
0.8
1.0
0.0 0.2 0.4 0.6 0.8 1.00.0
0.2
0.4
0.6
0.8
1.0
n/n
max
Uptake
Uptake
Drying
Drying
Drying
Uptake
(d)
(a)
(d)
n/n
max
(c)
(b)
t/
n/n
max
(iii)
(ii)
(i)
n/n m
ax
Henry's Law
n/n m
ax
Type II isotherm
aBC
(-)
n/n m
ax
Type III isotherm
Fig. 6.3: Left side: The sorption isotherms typically observed for polymeric materials:linear isotherm, described by Henry’s law (i), Type II (ii) and Type III (iii)isotherms, according to BET classification [21]. Right side: Uptake and dry-ing kinetics, simulated by the model for systems with linear (a), Type II (b) andType III (c) isotherms. τ is the timescale of the process (Eq. 6.9), introduced bythe model. Note, that the drying occurs at much faster rate than the uptake forthe systems with the non-linear isotherms.
(aex = 0): ideal, Type II and Type III isotherms. For a detailed discussion of the physicsof the isotherm types we refer to Section 2.2. Eq. 6.8 was integrated numerically to obtain
62
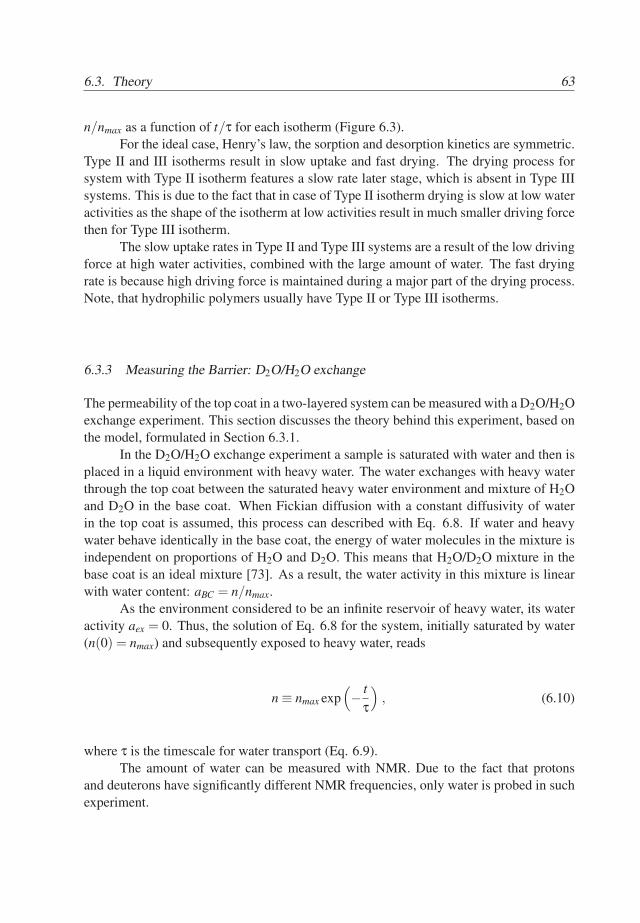
6.3. Theory 63
n/nmax as a function of t/τ for each isotherm (Figure 6.3).For the ideal case, Henry’s law, the sorption and desorption kinetics are symmetric.
Type II and III isotherms result in slow uptake and fast drying. The drying process forsystem with Type II isotherm features a slow rate later stage, which is absent in Type IIIsystems. This is due to the fact that in case of Type II isotherm drying is slow at low wateractivities as the shape of the isotherm at low activities result in much smaller driving forcethen for Type III isotherm.
The slow uptake rates in Type II and Type III systems are a result of the low drivingforce at high water activities, combined with the large amount of water. The fast dryingrate is because high driving force is maintained during a major part of the drying process.Note, that hydrophilic polymers usually have Type II or Type III isotherms.
6.3.3 Measuring the Barrier: D2O/H2O exchange
The permeability of the top coat in a two-layered system can be measured with a D2O/H2Oexchange experiment. This section discusses the theory behind this experiment, based onthe model, formulated in Section 6.3.1.
In the D2O/H2O exchange experiment a sample is saturated with water and then isplaced in a liquid environment with heavy water. The water exchanges with heavy waterthrough the top coat between the saturated heavy water environment and mixture of H2Oand D2O in the base coat. When Fickian diffusion with a constant diffusivity of waterin the top coat is assumed, this process can described with Eq. 6.8. If water and heavywater behave identically in the base coat, the energy of water molecules in the mixture isindependent on proportions of H2O and D2O. This means that H2O/D2O mixture in thebase coat is an ideal mixture [73]. As a result, the water activity in this mixture is linearwith water content: aBC = n/nmax.
As the environment considered to be an infinite reservoir of heavy water, its wateractivity aex = 0. Thus, the solution of Eq. 6.8 for the system, initially saturated by water(n(0) = nmax) and subsequently exposed to heavy water, reads
n ≡ nmax exp(− t
τ
), (6.10)
where τ is the timescale for water transport (Eq. 6.9).The amount of water can be measured with NMR. Due to the fact that protons
and deuterons have significantly different NMR frequencies, only water is probed in suchexperiment.
63
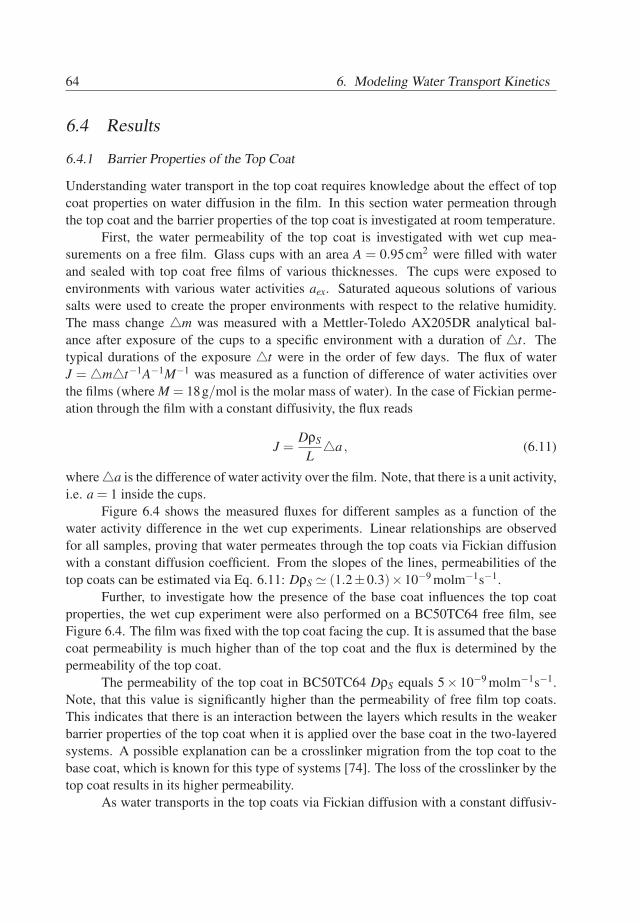
64 6. Modeling Water Transport Kinetics
6.4 Results
6.4.1 Barrier Properties of the Top Coat
Understanding water transport in the top coat requires knowledge about the effect of topcoat properties on water diffusion in the film. In this section water permeation throughthe top coat and the barrier properties of the top coat is investigated at room temperature.
First, the water permeability of the top coat is investigated with wet cup mea-surements on a free film. Glass cups with an area A = 0.95cm2 were filled with waterand sealed with top coat free films of various thicknesses. The cups were exposed toenvironments with various water activities aex. Saturated aqueous solutions of varioussalts were used to create the proper environments with respect to the relative humidity.The mass change m was measured with a Mettler-Toledo AX205DR analytical bal-ance after exposure of the cups to a specific environment with a duration of t. Thetypical durations of the exposure t were in the order of few days. The flux of waterJ = mt−1A−1M−1 was measured as a function of difference of water activities overthe films (where M = 18g/mol is the molar mass of water). In the case of Fickian perme-ation through the film with a constant diffusivity, the flux reads
J =DρS
La , (6.11)
where a is the difference of water activity over the film. Note, that there is a unit activity,i.e. a = 1 inside the cups.
Figure 6.4 shows the measured fluxes for different samples as a function of thewater activity difference in the wet cup experiments. Linear relationships are observedfor all samples, proving that water permeates through the top coats via Fickian diffusionwith a constant diffusion coefficient. From the slopes of the lines, permeabilities of thetop coats can be estimated via Eq. 6.11: DρS ≃ (1.2±0.3)×10−9 molm−1s−1.
Further, to investigate how the presence of the base coat influences the top coatproperties, the wet cup experiment were also performed on a BC50TC64 free film, seeFigure 6.4. The film was fixed with the top coat facing the cup. It is assumed that the basecoat permeability is much higher than of the top coat and the flux is determined by thepermeability of the top coat.
The permeability of the top coat in BC50TC64 DρS equals 5× 10⁻⁹ molm−1s−1.Note, that this value is significantly higher than the permeability of free film top coats.This indicates that there is an interaction between the layers which results in the weakerbarrier properties of the top coat when it is applied over the base coat in the two-layeredsystems. A possible explanation can be a crosslinker migration from the top coat to thebase coat, which is known for this type of systems [74]. The loss of the crosslinker by thetop coat results in its higher permeability.
As water transports in the top coats via Fickian diffusion with a constant diffusiv-
64
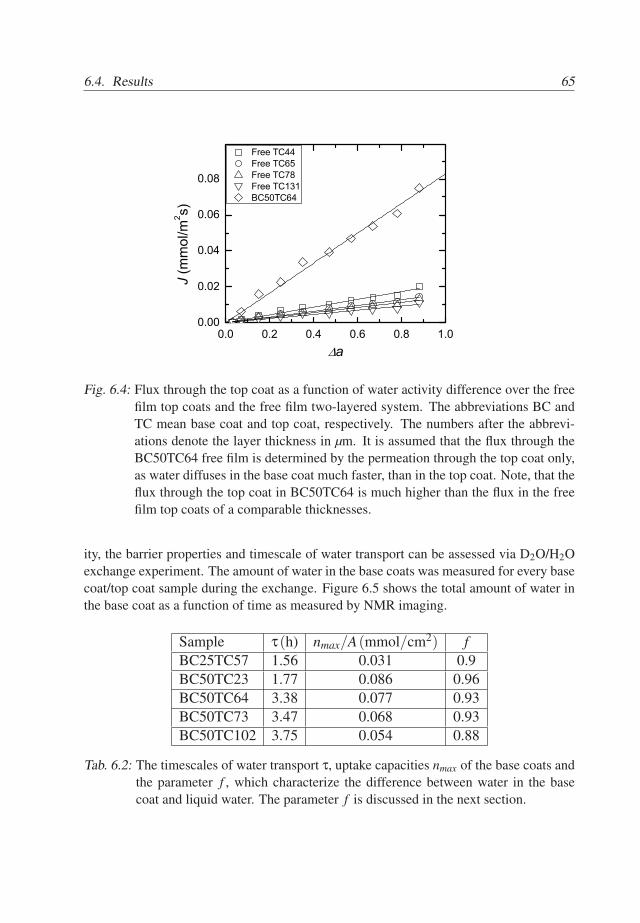
6.4. Results 65
0.0 0.2 0.4 0.6 0.8 1.00.00
0.02
0.04
0.06
0.08
Free TC44 Free TC65 Free TC78 Free TC131 BC50TC64
J (m
mol
/m2 s)
a
Fig. 6.4: Flux through the top coat as a function of water activity difference over the freefilm top coats and the free film two-layered system. The abbreviations BC andTC mean base coat and top coat, respectively. The numbers after the abbrevi-ations denote the layer thickness in µm. It is assumed that the flux through theBC50TC64 free film is determined by the permeation through the top coat only,as water diffuses in the base coat much faster, than in the top coat. Note, that theflux through the top coat in BC50TC64 is much higher than the flux in the freefilm top coats of a comparable thicknesses.
ity, the barrier properties and timescale of water transport can be assessed via D2O/H2Oexchange experiment. The amount of water in the base coats was measured for every basecoat/top coat sample during the exchange. Figure 6.5 shows the total amount of water inthe base coat as a function of time as measured by NMR imaging.
Sample τ(h) nmax/A(mmol/cm2) fBC25TC57 1.56 0.031 0.9BC50TC23 1.77 0.086 0.96BC50TC64 3.38 0.077 0.93BC50TC73 3.47 0.068 0.93BC50TC102 3.75 0.054 0.88
Tab. 6.2: The timescales of water transport τ, uptake capacities nmax of the base coats andthe parameter f , which characterize the difference between water in the basecoat and liquid water. The parameter f is discussed in the next section.
65
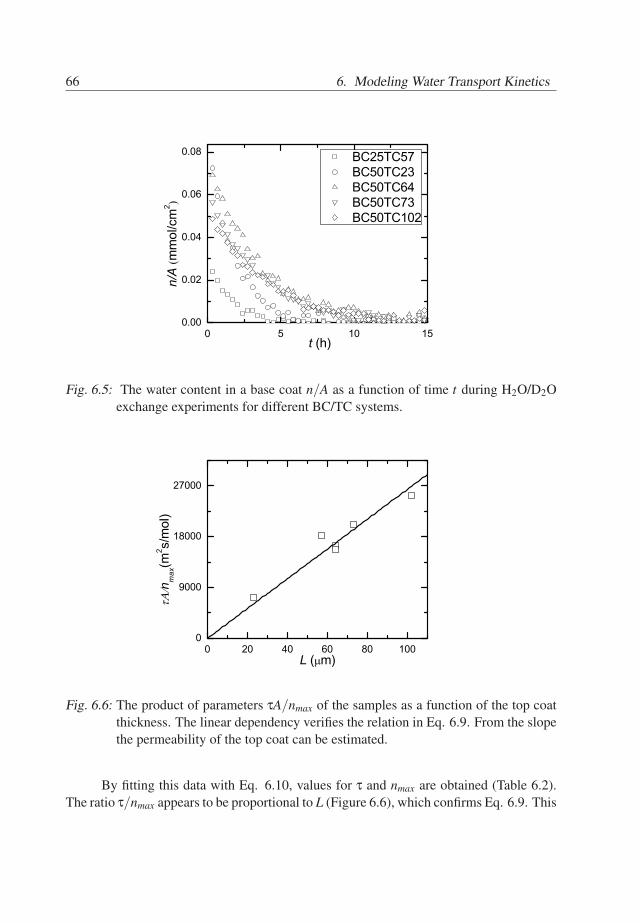
66 6. Modeling Water Transport Kinetics
0 5 10 150.00
0.02
0.04
0.06
0.08 BC25TC57 BC50TC23 BC50TC64 BC50TC73 BC50TC102
n/A
(mmol/cm
2 )
t (h)
Fig. 6.5: The water content in a base coat n/A as a function of time t during H2O/D2Oexchange experiments for different BC/TC systems.
0 20 40 60 80 1000
9000
18000
27000
n max(m
2 s/m
ol)
L ( m)
Fig. 6.6: The product of parameters τA/nmax of the samples as a function of the top coatthickness. The linear dependency verifies the relation in Eq. 6.9. From the slopethe permeability of the top coat can be estimated.
By fitting this data with Eq. 6.10, values for τ and nmax are obtained (Table 6.2).The ratio τ/nmax appears to be proportional to L (Figure 6.6), which confirms Eq. 6.9. This
66
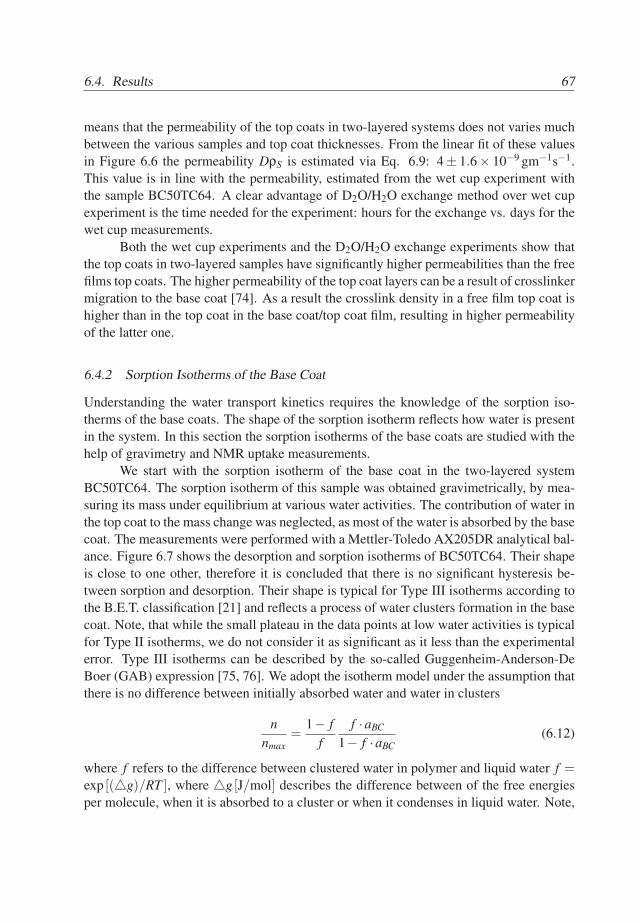
6.4. Results 67
means that the permeability of the top coats in two-layered systems does not varies muchbetween the various samples and top coat thicknesses. From the linear fit of these valuesin Figure 6.6 the permeability DρS is estimated via Eq. 6.9: 4± 1.6× 10⁻⁹ gm−1s−1.This value is in line with the permeability, estimated from the wet cup experiment withthe sample BC50TC64. A clear advantage of D2O/H2O exchange method over wet cupexperiment is the time needed for the experiment: hours for the exchange vs. days for thewet cup measurements.
Both the wet cup experiments and the D2O/H2O exchange experiments show thatthe top coats in two-layered samples have significantly higher permeabilities than the freefilms top coats. The higher permeability of the top coat layers can be a result of crosslinkermigration to the base coat [74]. As a result the crosslink density in a free film top coat ishigher than in the top coat in the base coat/top coat film, resulting in higher permeabilityof the latter one.
6.4.2 Sorption Isotherms of the Base Coat
Understanding the water transport kinetics requires the knowledge of the sorption iso-therms of the base coats. The shape of the sorption isotherm reflects how water is presentin the system. In this section the sorption isotherms of the base coats are studied with thehelp of gravimetry and NMR uptake measurements.
We start with the sorption isotherm of the base coat in the two-layered systemBC50TC64. The sorption isotherm of this sample was obtained gravimetrically, by mea-suring its mass under equilibrium at various water activities. The contribution of water inthe top coat to the mass change was neglected, as most of the water is absorbed by the basecoat. The measurements were performed with a Mettler-Toledo AX205DR analytical bal-ance. Figure 6.7 shows the desorption and sorption isotherms of BC50TC64. Their shapeis close to one other, therefore it is concluded that there is no significant hysteresis be-tween sorption and desorption. Their shape is typical for Type III isotherms according tothe B.E.T. classification [21] and reflects a process of water clusters formation in the basecoat. Note, that while the small plateau in the data points at low water activities is typicalfor Type II isotherms, we do not consider it as significant as it less than the experimentalerror. Type III isotherms can be described by the so-called Guggenheim-Anderson-DeBoer (GAB) expression [75, 76]. We adopt the isotherm model under the assumption thatthere is no difference between initially absorbed water and water in clusters
nnmax
=1− f
ff ·aBC
1− f ·aBC(6.12)
where f refers to the difference between clustered water in polymer and liquid water f =exp [(g)/RT ], where g [J/mol] describes the difference between of the free energiesper molecule, when it is absorbed to a cluster or when it condenses in liquid water. Note,
67
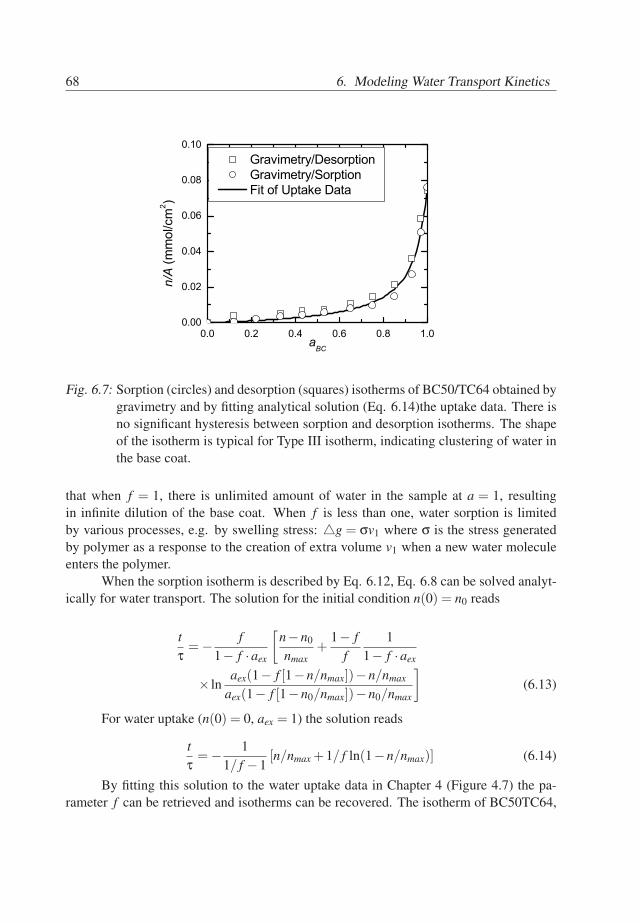
68 6. Modeling Water Transport Kinetics
0.0 0.2 0.4 0.6 0.8 1.00.00
0.02
0.04
0.06
0.08
0.10
n/A
(mmol/cm
2 )
aBC
Gravimetry/Desorption Gravimetry/Sorption Fit of Uptake Data
Fig. 6.7: Sorption (circles) and desorption (squares) isotherms of BC50/TC64 obtained bygravimetry and by fitting analytical solution (Eq. 6.14)the uptake data. There isno significant hysteresis between sorption and desorption isotherms. The shapeof the isotherm is typical for Type III isotherm, indicating clustering of water inthe base coat.
that when f = 1, there is unlimited amount of water in the sample at a = 1, resultingin infinite dilution of the base coat. When f is less than one, water sorption is limitedby various processes, e.g. by swelling stress: g = σv1 where σ is the stress generatedby polymer as a response to the creation of extra volume v1 when a new water moleculeenters the polymer.
When the sorption isotherm is described by Eq. 6.12, Eq. 6.8 can be solved analyt-ically for water transport. The solution for the initial condition n(0) = n0 reads
tτ=− f
1− f ·aex
[n−n0
nmax+
1− ff
11− f ·aex
× lnaex(1− f [1−n/nmax])−n/nmax
aex(1− f [1−n0/nmax])−n0/nmax
](6.13)
For water uptake (n(0) = 0, aex = 1) the solution reads
tτ=− 1
1/ f −1[n/nmax +1/ f ln(1−n/nmax)] (6.14)
By fitting this solution to the water uptake data in Chapter 4 (Figure 4.7) the pa-rameter f can be retrieved and isotherms can be recovered. The isotherm of BC50TC64,
68
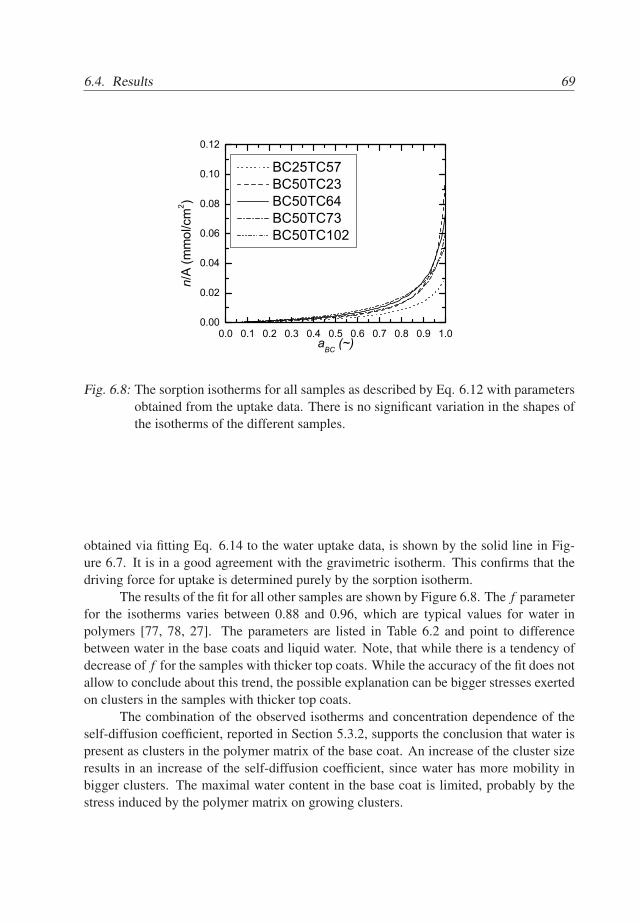
6.4. Results 69
0.0 0.1 0.2 0.3 0.4 0.5 0.6 0.7 0.8 0.9 1.00.00
0.02
0.04
0.06
0.08
0.10
0.12
BC25TC57 BC50TC23 BC50TC64 BC50TC73 BC50TC102
n/A
(mm
ol/c
m2 )
aBC
(~)
Fig. 6.8: The sorption isotherms for all samples as described by Eq. 6.12 with parametersobtained from the uptake data. There is no significant variation in the shapes ofthe isotherms of the different samples.
obtained via fitting Eq. 6.14 to the water uptake data, is shown by the solid line in Fig-ure 6.7. It is in a good agreement with the gravimetric isotherm. This confirms that thedriving force for uptake is determined purely by the sorption isotherm.
The results of the fit for all other samples are shown by Figure 6.8. The f parameterfor the isotherms varies between 0.88 and 0.96, which are typical values for water inpolymers [77, 78, 27]. The parameters are listed in Table 6.2 and point to differencebetween water in the base coats and liquid water. Note, that while there is a tendency ofdecrease of f for the samples with thicker top coats. While the accuracy of the fit does notallow to conclude about this trend, the possible explanation can be bigger stresses exertedon clusters in the samples with thicker top coats.
The combination of the observed isotherms and concentration dependence of theself-diffusion coefficient, reported in Section 5.3.2, supports the conclusion that water ispresent as clusters in the polymer matrix of the base coat. An increase of the cluster sizeresults in an increase of the self-diffusion coefficient, since water has more mobility inbigger clusters. The maximal water content in the base coat is limited, probably by thestress induced by the polymer matrix on growing clusters.
69
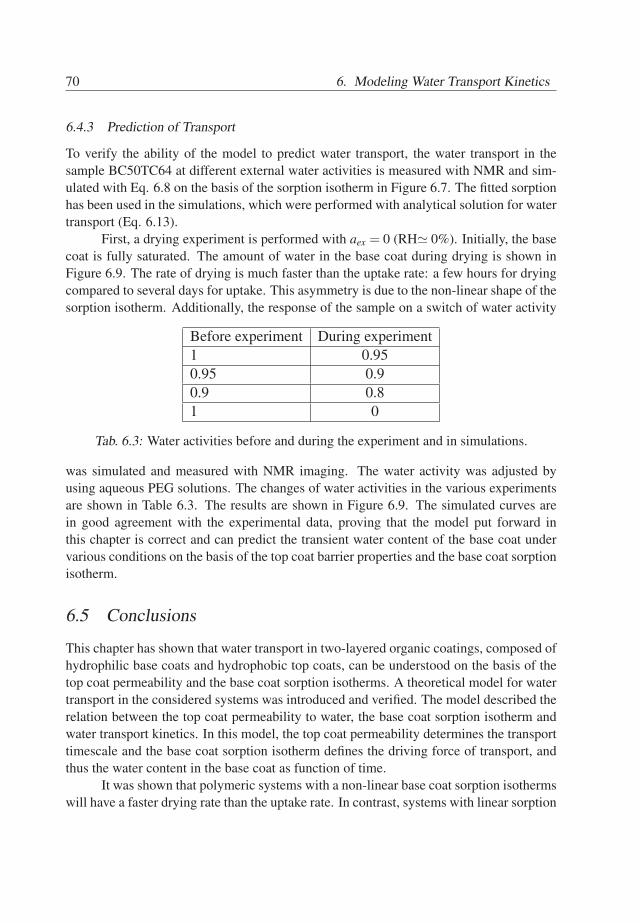
70 6. Modeling Water Transport Kinetics
6.4.3 Prediction of Transport
To verify the ability of the model to predict water transport, the water transport in thesample BC50TC64 at different external water activities is measured with NMR and sim-ulated with Eq. 6.8 on the basis of the sorption isotherm in Figure 6.7. The fitted sorptionhas been used in the simulations, which were performed with analytical solution for watertransport (Eq. 6.13).
First, a drying experiment is performed with aex = 0 (RH≃ 0%). Initially, the basecoat is fully saturated. The amount of water in the base coat during drying is shown inFigure 6.9. The rate of drying is much faster than the uptake rate: a few hours for dryingcompared to several days for uptake. This asymmetry is due to the non-linear shape of thesorption isotherm. Additionally, the response of the sample on a switch of water activity
Before experiment During experiment1 0.950.95 0.90.9 0.81 0
Tab. 6.3: Water activities before and during the experiment and in simulations.
was simulated and measured with NMR imaging. The water activity was adjusted byusing aqueous PEG solutions. The changes of water activities in the various experimentsare shown in Table 6.3. The results are shown in Figure 6.9. The simulated curves arein good agreement with the experimental data, proving that the model put forward inthis chapter is correct and can predict the transient water content of the base coat undervarious conditions on the basis of the top coat barrier properties and the base coat sorptionisotherm.
6.5 Conclusions
This chapter has shown that water transport in two-layered organic coatings, composed ofhydrophilic base coats and hydrophobic top coats, can be understood on the basis of thetop coat permeability and the base coat sorption isotherms. A theoretical model for watertransport in the considered systems was introduced and verified. The model described therelation between the top coat permeability to water, the base coat sorption isotherm andwater transport kinetics. In this model, the top coat permeability determines the transporttimescale and the base coat sorption isotherm defines the driving force of transport, andthus the water content in the base coat as function of time.
It was shown that polymeric systems with a non-linear base coat sorption isothermswill have a faster drying rate than the uptake rate. In contrast, systems with linear sorption
70
6.5. Conclusions 71
0.04
0.05
0.06
0.07
0.080 20 40 60 80 0 10 20 30 40
0.03
0.04
0.05
0 2 4 6 8 10 12 140.01
0.02
0.03
0 2 4 6 8 100.00
0.02
0.04
0.06
0.08From 1 to 0 Data Simulation
From 0.9 to 0.8 Data Simulation
From 0.95 to 0.9 Data Simulation
t (h)
From 1 to 0.95 Data Simulation
n/A
(mm
ol/c
m2 )
t (h)
n/A
(mm
ol/c
m2 )
n/A
(mm
ol/c
m2 )
t (h)
n/A
(mm
ol/c
m2 )
t (h)
Fig. 6.9: Amount of water in the base coat of BC50TC64 during desorption processes.The results of the simulations with the model are shown with solid lines, whereasthe NMR data is shown by squares.
isotherms, which obey Henry’s lay, show a symmetry between the time dependencies ofuptake and drying.
It was found in the study of the top coat barrier properties that the interplay betweenthe layers results in reduction of the top coat barrier properties. The permeability to waterof the top coat in two-layered systems was approximately 4 times higher that of free filmtop coats. Additionally, the introduced D2O/H2O experiment proved to be a fast methodto estimate the top coat permeabilities.
The study of sorption isotherms of the base coats in the systems of interest hasshown that water absorption is a process of water clustering in the base coats. This con-clusion is supported by the concentration dependency of water self-diffusion coefficientin the base coat, which was measured in Chapter 5.
Practically, these findings mean that to understand water transport kinetics in the
71
72 6. Modeling Water Transport Kinetics
considered of two-layered coating systems, it is sufficient to measure the top coat perme-ability to water and the sorption isotherm of the system. The introduced model can beused to predict water transport kinetics on the basis of these parameters, which are easyto measure with balance and wet cup experiments. This is an important result, because itenables an efficient screening of the water uptake properties in practice.
72
7. Water Transport and Humidity Fluctuations
7.1 Introduction
Coatings are frequently applied in multiple layers with distinct properties to meet the re-quired specifications. During their service these systems are exposed to UV light, humid-ity and heat, resulting in weathering and reduction of their lifetime[79, 80]. The failure ofsystems subjected to weathering occurs as a result of a complex interplay of UV exposure,temperature and humidity. Water can be present in the form of water vapor or liquid, e.g.rain or dew, and can promote deterioration of coatings, both as a single factor and in com-bination with UV light and heat. Carfagna et al. [81] showed how hygrothermal agingaffects mechanical properties of epoxy-based coatings. Martin et al. [82] and Nguyen etal. [83, 84, 85] concluded that water damages acrylic melamine coatings both alone andin combination with UV light and heat during artificial and natural weathering.
Natural, accelerated and artificial weathering exposures are standard durability testsfor polymeric materials [79, 80, 86]. Natural weathering means that samples are subjectedto natural conditions, i.e. direct sunlight, ambient outdoor temperature and moisture. Ac-celerated and artificial weathering are applied to perform durability tests in a shorter timethan in natural weathering tests. Accelerated weathering tests are performed outdoor, likenatural weathering tests, with the sole difference that the timescale of exposure is accel-erated by concentrating natural sunlight and by applying artificial heating and cooling,wetting and drying of the samples. Artificial weathering tests are performed under labo-ratory exposure of the samples to artificial UV light, heat and water. Natural weatheringincludes a broad range of timescales, e.g. rainfall and day/night cycles introduce typi-cal timescales in the order of hours and days, while humidity variations due to seasonalchange have timescales in the order of months. In accelerated and artificial weathering,typical timescales are usually in the order of hours [80, 87]. Shi et al. [88] pointed out thatresults from accelerated tests may differ from natural weathering if the exposure cyclesto water in accelerated tests become shorter than the drying timescale. In such case wa-ter accumulates in the sample, which would not occur in natural weathering conditions.Since moisture significantly contributes to weathering, understanding how the frequencyof ambient humidity fluctuations influences the water migration in multilayer coatings iscrucial.
This thesis is mostly focused on water transport in hydrophilic base coat/hydrophobic
73
74 7. Water Transport and Humidity Fluctuations
top coat systems. In Chapter 4 it was found that the transport rate is limited by the pen-etration rate through the top coat and that water causes significant swelling of the basecoat. Chapter 5 has shown that polymeric dispersant in the base coat plays a key rolein promoting water uptake. Water plasticizes the dispersant and forms a hydrogel withthe dispersant. Chapter 6 proved that in this type of multilayer coating can be describedon the sole basis of the top coat permeability and the base coat sorption isotherm, ac-cordingly to an introduced theoretical model. The top coat permeability determines thetypical timescale of water transport and the sorption isotherm defines the process kinetics.This theoretical model can be used to investigate the response of the systems of interestto ambient time-dependent humidity fluctuations.
The present chapter aims to gain insight in the influence of the layer properties ofbase coat/top coat systems on the multilayer coating response to humidity fluctuations.A basic description of the fluctuations is introduced in the model, in which the fluctua-tions are considered as harmonic oscillations of water activity. Special attention will bepaid to the influence of the shape of the base coat sorption isotherm on the response tofluctuations. In order to understand the physics of the response, a linear model will bediscussed, which is applicable in case that the sorption isotherm is linear or the amplitudeof the humidity fluctuations is small. Second, a full non-linear model will be studied tounderstand its consequences on the response.
7.2 Theory
7.2.1 Model
The aim of this section is to formulate a model for water transport in 2-layered coat-ings with hydrophilic base coats and hydrophobic top coats that are subjected to time-dependent humidity fluctuations. Specifically, the water content of the base coat θ ≡n/nmax is considered, where n [mol] and nmax [mol] are the actual amount of water in thebase coat and the water uptake capacity of the base coat, respectively. The rate of changeof the water content in the base coat can be connected with the difference in water activityin the environment aex and in the base coat aBC, see Eq. 6.8. The time-dependency of thewater activity is taken into account by making aex in Eq. 6.8 time dependent:
dθdt
=1τ[aex(t)−aBC(θ)] , (7.1)
where aBC(θ) is the inverse sorption isotherm of the base coat and τ ≡ nmaxL/ADρS is thetimescale of water transport, see Eq. 6.9. L [m] is the thickness of the top coat, A [m2] isarea of water penetration and DρS [mol ·m−1s−1] is the permeability to water of the topcoat.
In this study the fluctuations of water activity in the environment are modeled asharmonic oscillations
74
7.2. Theory 75
aex(t) = a0 +asinωt , (7.2)
where a0 is the average external water activity and a and ω are the amplitude and radialfrequency of the water activity fluctuations, respectively. Note, that the activity variesby definition between 0 and 1. Consequently, this restricts the parameters: a ≤ a0 anda ≤ 1−a0. Fluctuations in the water activity can be characterized by the average wateractivity a0, the activity range 2a and their period 2π/ω. It is to be mentioned that everyfluctuation can be decomposed in harmonic functions of the type of Eq. 7.2.
7.2.2 Systems with linearized sorption isotherms: Understanding the Response
First, to understand the physics of the response to the activity fluctuations, we investigatewith linearized sorption isotherms. Linearizing the problem allows to obtain an analyticalsolution for water content of the base coat during fluctuations and to get insight into howthe layers properties influence the response to the fluctuations.
A linear sorption isotherm can be written as follows
θ = kaBC , (7.3)
where k is the solubility of water in the base coat. By combining Eq. 7.1, 7.2 and 7.3 thefollowing expression for the water content oscillations are obtained
θ(t) = θ0 +ka√
1+ω2τ2k2sin(ωt − arctanωτk) (7.4)
where θ0 ≡ ka0 is the water content, when the system is in equilibrium with the averagewater activity a0. The water content in the base coat varies as a sine function with a phasedelay of ϕ = arctanωτk.
The amplitude of the oscillations is proportional to the amplitude of the activityfluctuations and the factor 1/
√1+ω2τ2k2 describes the damping of the oscillations, see
Figure 7.1. Note that ka equals the amplitude of the water content fluctuations solelywhen the base coat is able to responde instantly to the environment. The damping is due tothe inertia of the system, which is determined by τk. Note the similarity with a RC-circuit,where the top coat has the role ofresistor and the base coat plays the role of capacitor. Anincrease of τ results in a higher inertia of the sample, since it takes longer for water topermeate through the top coat. An increase in the solubility in the base coat k leads to adecrease in the amplitude since more water has to be stored. When the radial frequencyof the fluctuations becomes in order 1/τk a transition between damped and non-dampedoscillations occurs and vice versa. Thus, the damping occurs for oscillations with periodsmuch less than the transition point T ∗ ≡ 2πτk.
75
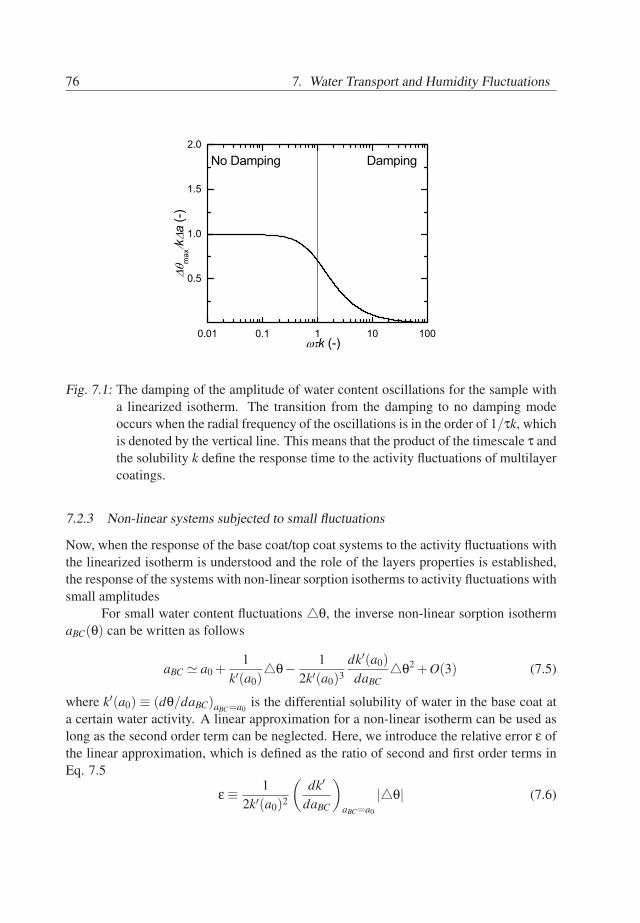
76 7. Water Transport and Humidity Fluctuations
0.01 0.1 1 10 100
0.5
1.0
1.5
2.0
Dampingmaxk
a(-)
k (-)
No Damping
Fig. 7.1: The damping of the amplitude of water content oscillations for the sample witha linearized isotherm. The transition from the damping to no damping modeoccurs when the radial frequency of the oscillations is in the order of 1/τk, whichis denoted by the vertical line. This means that the product of the timescale τ andthe solubility k define the response time to the activity fluctuations of multilayercoatings.
7.2.3 Non-linear systems subjected to small fluctuations
Now, when the response of the base coat/top coat systems to the activity fluctuations withthe linearized isotherm is understood and the role of the layers properties is established,the response of the systems with non-linear sorption isotherms to activity fluctuations withsmall amplitudes
For small water content fluctuations θ, the inverse non-linear sorption isothermaBC(θ) can be written as follows
aBC ≃ a0 +1
k′(a0)θ− 1
2k′(a0)3dk′(a0)
daBCθ2 +O(3) (7.5)
where k′(a0) ≡ (dθ/daBC)aBC=a0is the differential solubility of water in the base coat at
a certain water activity. A linear approximation for a non-linear isotherm can be used aslong as the second order term can be neglected. Here, we introduce the relative error ε ofthe linear approximation, which is defined as the ratio of second and first order terms inEq. 7.5
ε ≡ 12k′(a0)2
(dk′
daBC
)aBC=a0
|θ| (7.6)
76
7.3. Behavior of BC/TC systems 77
By definition, this parameter should be small: ε≪ 1, implying that a linear approximationcan be used, when there is little variation in the differential solubility in the consideredactivity range.
When the linear approximation holds, the fluctuations of water content can be de-scribed with Eq. 7.4, where the constant solubility k has to be replaced by the differentialsolubility k′(a0). Since the maximal amplitude of water content fluctuations θmax for thelinear solution reads k′(a0)a/
√1+ω2τ2k′2(a0), Eq. 7.6 can be used to formulate a cri-
terion for judging whether the humidity fluctuations are small enough to use a linearizedapproach can be used
aε
= 2k′(a0)
(dk′
daBC
)−1
aBC/=a0
√(1+ω2τ2k′(a0)2) . (7.7)
This condition defines what values of the activity amplitude a0 are acceptablefor using the linear approximation. The condition is visualized in Figure 7.2, where theshaded region shows the amplitude values a as a function of the radial frequency, whichresult in a relative error less than ε in case of using the linear approximation. The linear ap-proximation can always be used for damped oscillations, because the water content varia-tion in the sample becomes smaller at higher frequencies leading to a smaller relative error.If the solubility varies little with water activity, thus the plateau 2k′(a0)(dk′/daBC)
−1aBC=a0
will have higher values allowing to use linear solution at a broader range of values forhumidity fluctuations amplitude.
Regarding the frequency dependence, there are two modes of oscillations: dampedand non-damped. The damped mode occurs at high frequencies, for ω ≫ 1/τk′(a0) theoscillations are damped. In this case the condition in Eq. 7.7 is met because the dampingat high frequencies will result in small water content variations. In this case the solutionfor the water content is described by Eq. 7.4 with k = k′(a0). For low frequencies, ω ≪1/τk′(a0), when the period of humidity oscillations 2π/ω is less than the response time2πτk′(a0), needed for the base coat to equilibrate with the environment, no damping willoccur. In this case the solution for the water content reads
θ(t) = θ(aBC)|aBC=aex(t) . (7.8)
7.3 Behavior of BC/TC systems
The aim of this section is to investigate how specific type of systems of interest, i.e. thebase coat/top coat systems, respond to humidity fluctuations. First, a brief description ofthe samples is given. Further, the analysis, presented in the previous sections, is appliedto the systems and the response of the samples when variation of differential solubility issignificant.
77
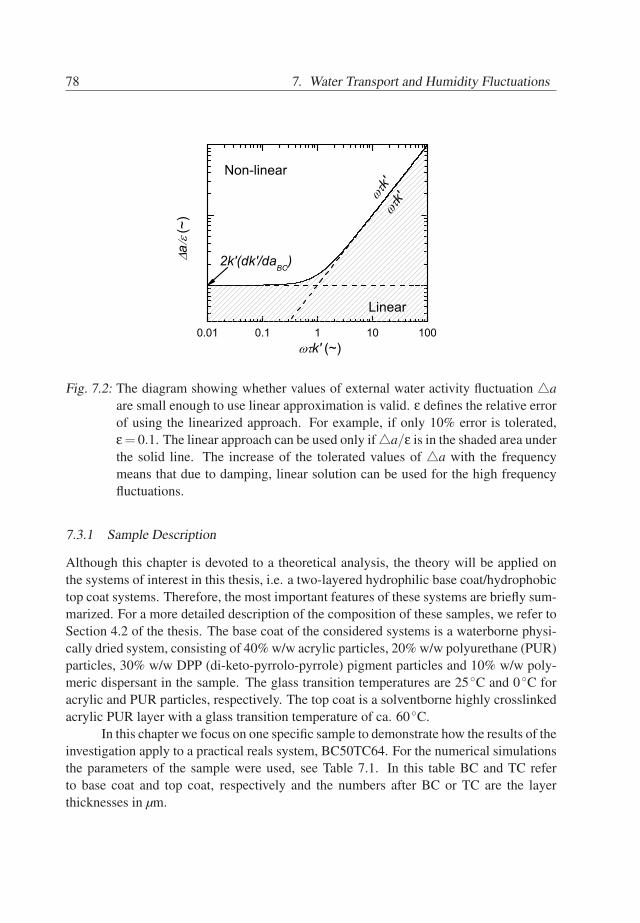
78 7. Water Transport and Humidity Fluctuations
0.01 0.1 1 10 100
2k'(dk'/daBC)
k'k'
Non-lineara
(~)
k' (~)
Linear
Fig. 7.2: The diagram showing whether values of external water activity fluctuation aare small enough to use linear approximation is valid. ε defines the relative errorof using the linearized approach. For example, if only 10% error is tolerated,ε= 0.1. The linear approach can be used only if a/ε is in the shaded area underthe solid line. The increase of the tolerated values of a with the frequencymeans that due to damping, linear solution can be used for the high frequencyfluctuations.
7.3.1 Sample Description
Although this chapter is devoted to a theoretical analysis, the theory will be applied onthe systems of interest in this thesis, i.e. a two-layered hydrophilic base coat/hydrophobictop coat systems. Therefore, the most important features of these systems are briefly sum-marized. For a more detailed description of the composition of these samples, we refer toSection 4.2 of the thesis. The base coat of the considered systems is a waterborne physi-cally dried system, consisting of 40% w/w acrylic particles, 20% w/w polyurethane (PUR)particles, 30% w/w DPP (di-keto-pyrrolo-pyrrole) pigment particles and 10% w/w poly-meric dispersant in the sample. The glass transition temperatures are 25 C and 0 C foracrylic and PUR particles, respectively. The top coat is a solventborne highly crosslinkedacrylic PUR layer with a glass transition temperature of ca. 60 C.
In this chapter we focus on one specific sample to demonstrate how the results of theinvestigation apply to a practical reals system, BC50TC64. For the numerical simulationsthe parameters of the sample were used, see Table 7.1. In this table BC and TC referto base coat and top coat, respectively and the numbers after BC or TC are the layerthicknesses in µm.
78
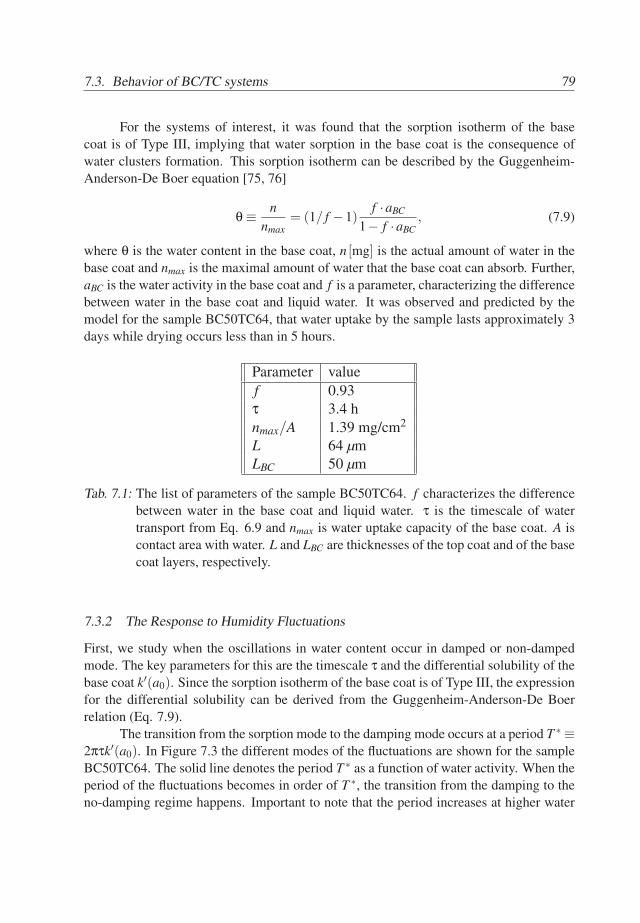
7.3. Behavior of BC/TC systems 79
For the systems of interest, it was found that the sorption isotherm of the basecoat is of Type III, implying that water sorption in the base coat is the consequence ofwater clusters formation. This sorption isotherm can be described by the Guggenheim-Anderson-De Boer equation [75, 76]
θ ≡ nnmax
= (1/ f −1)f ·aBC
1− f ·aBC, (7.9)
where θ is the water content in the base coat, n [mg] is the actual amount of water in thebase coat and nmax is the maximal amount of water that the base coat can absorb. Further,aBC is the water activity in the base coat and f is a parameter, characterizing the differencebetween water in the base coat and liquid water. It was observed and predicted by themodel for the sample BC50TC64, that water uptake by the sample lasts approximately 3days while drying occurs less than in 5 hours.
Parameter valuef 0.93τ 3.4 hnmax/A 1.39 mg/cm2
L 64 µmLBC 50 µm
Tab. 7.1: The list of parameters of the sample BC50TC64. f characterizes the differencebetween water in the base coat and liquid water. τ is the timescale of watertransport from Eq. 6.9 and nmax is water uptake capacity of the base coat. A iscontact area with water. L and LBC are thicknesses of the top coat and of the basecoat layers, respectively.
7.3.2 The Response to Humidity Fluctuations
First, we study when the oscillations in water content occur in damped or non-dampedmode. The key parameters for this are the timescale τ and the differential solubility of thebase coat k′(a0). Since the sorption isotherm of the base coat is of Type III, the expressionfor the differential solubility can be derived from the Guggenheim-Anderson-De Boerrelation (Eq. 7.9).
The transition from the sorption mode to the damping mode occurs at a period T ∗ ≡2πτk′(a0). In Figure 7.3 the different modes of the fluctuations are shown for the sampleBC50TC64. The solid line denotes the period T ∗ as a function of water activity. When theperiod of the fluctuations becomes in order of T ∗, the transition from the damping to theno-damping regime happens. Important to note that the period increases at higher water
79
80 7. Water Transport and Humidity Fluctuations
0.0 0.2 0.4 0.6 0.8 1.00.1
1
10
100
1000T*
(h)
a0 (~)
No Damping
Damping
Fig. 7.3: The transition line T ∗ ≡ 2πτk′ for the sample BC50TC64. This line does not de-fine sharp transition, rather damping occurs when the periods of the fluctuationsare much less than T ∗ and no damping happens when the period is bigger thanthe T ∗ value. Important to note, that the increase of T ∗ with the water activitymeans that at high humidities fluctuations with periods in the order of days willhave non-damped response in the water content.
activities. The values for the transition point T ∗ at low relative humidity are less thanseveral hours when the RH is less than 50%. This means that fluctuations are not dampedat this humidity range, except for the fluctuations with timescales less than few hours.
As the most of humidity fluctuations have timescales starting from few hours, mostof realistic humidity fluctuations are not damped. In contrast, for humidities above 50%the fluctuations with the periods more than a day are not damped.
The conclusion that at high humidities only slow humidity fluctuations, i.e. withthe periods in the order of days or weeks, are not damped at high humidities is valid forthe majority of polymeric systems. It is known that sorption isotherms of hydrophilicpolymeric materials have either Type II or Type III shape. In these cases , the differentialsolubility k′ increases with increasing activity, leading to a shift of the value of T ∗.
To illustrate the response of the base coat/top coat systems in water content to fluc-tuations with large amplitudes, i.e. when the linear approach does not work, the numericalsolutions for water content in the base coat of a specific sample, BC50TC64, were calcu-lated. The solutions were obtained for low, high and full humidity range, i.e for activityvariations between 0 and 0.5, between 0.5 and 1 and between 0 and one, respectively.The whole activity range is considered to study how variation of the differential solubility
80
7.4. Conclusions 81
influences the response of the samples. The low activity range mimics natural conditionsof the desert in Arizona. The high activity range refers to tropical regions such as Florida.
The solutions for the response in water content in the BC50TC64 for activity vari-ations between 0 and 0.5, between 0.5 and 1 and the whole activity range, are shown inFigure 7.4a, b and c, respectively. Note, the values of transition period T ∗ are 3.3 hoursfor the case with a0 = 0.25, 6.5 hours for a0 = 0.5 and 19 hours for a0 = 0.75, which isconsistent with the obtained solutions: the fluctuations with oscillation periods less thanT ∗ are damped and the slower humidity fluctuations induce bigger water content varia-tions. The narrow ’hills’ in the oscillations and broad ’valleys’ for the high and wholehumidity ranges (Figure 7.4b and Figure 7.4c, respectively) are the consequence of theasymmetry between uptake and drying for these samples. The drying of the samples takeshours while days are needed to equilibrate the sample with high humidity.
7.4 Conclusions
In this chapter it was shown that the response of two-layered hydrophilic base coat/hydro-phobic top coat systems to humidity fluctuations can be damped. The response time isdetermined by the product of the timescale of permeation through top coats and solubilityof the base coat and draws the borderline between regimes of damped and non-damped os-cillations. Humidity fluctuations with timescales less than the response time are damped.
The response time depends on the considered humidity range for systems with non-linear sorption isotherms, as water solubility varies with the water activity. For poly-meric systems with non-linear sorption isotherms this means that at high humidity range(RH>50%) only humidity fluctuations with timescales in order of days or weeks will havean non-damped response. Particularly for the specific systems of interest, studied in thisthesis, only humidity fluctuations with periods more than a day, will result in a significantvariations of water content in the coating. In contrast, for low humidity range, i.e. withRH less than 50%, the most of fluctuations are non-damped.
The practical outcome of this investigation is that at high humidity range, only slowhumidity fluctuations, i.e. with a timescale of days or weeks, will result in significantwater content variations and hygroscopic stresses for the systems of interest. This appliesto the majority of two-layered systems with hydrophilic base coats: hydrophilic polymersnormally have Type II or III isotherms, thus their differential solubilities increase withwater activity.
The damping of short timescale humidity oscillations, i.e. with periods less than aday, implies that a most of the humidity fluctuations in accelerated/artificial weatheringwill have limited influence on the water content in the samples due to damping. As aconsequence, accelerated or artificial weathering does not represent natural weathering interms of moisture exposure, especially at the high humidity range.
81
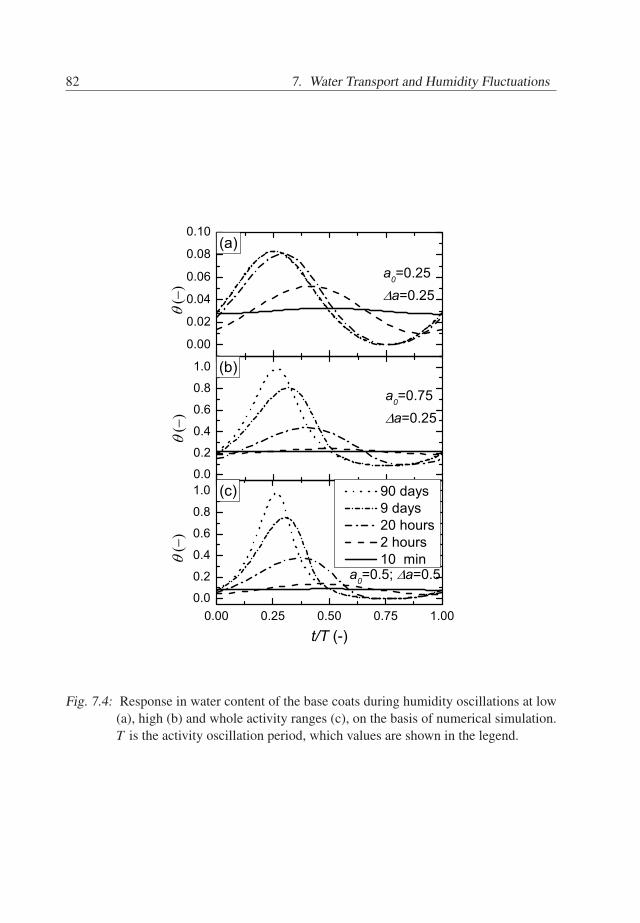
82 7. Water Transport and Humidity Fluctuations
0.00
0.02
0.04
0.06
0.08
0.10
0.0
0.2
0.4
0.6
0.8
1.0
0.00 0.25 0.50 0.75 1.000.0
0.2
0.4
0.6
0.8
1.0
a0=0.5; a=0.5
a0=0.75a=0.25
a0=0.25a=0.25
(c)
(b)
(a)
t/T (-)
90 days 9 days 20 hours 2 hours 10 min
Fig. 7.4: Response in water content of the base coats during humidity oscillations at low(a), high (b) and whole activity ranges (c), on the basis of numerical simulation.T is the activity oscillation period, which values are shown in the legend.
82
8. Plasticizer in Top Coats: Influence of Stress Relaxation onTransport
8.1 Introduction
Penetration of hydraulic fluids in multilayer coatings, used in aerospace applications, pro-motes deterioration of these systems. Presently, phosphate-ester based hydraulic fluidsare commonly used in aircrafts, for example SkydrolTM, and dominate the market. It isknown that the exposure to Skydrol fluids results in plasticization and deterioration evenof highly crosslinked systems, like aerospace top coats [89]. Immersion in Skydrol isa standard test for paints and coatings, described by ISO 2812 and ASTM D1308-02.Furthermore, it is known that Skydrol absorption can result in a depression of the glasstransition temperature of polymers[90]. It acts as an organic solvent [91] and causes adecrease in mechanical performance [92].
Little is known about how Skydrol penetrates into organic coatings.The main com-ponent of Skydrol fluids is TBP (tri-butyl phosphate), which constitute more than 60%w/w in the latest generations. TBP is a plasticizer and an organic solvent, and it is ex-pected that it plays a key role in Skydrol absorption. Therefore, TBP uptake by coatingsis one of the first steps in understanding Skydrol uptake.
It is well known that solvent penetration in polymeric systems is accompaniedby structural relaxation processes, this may result in non-Fickian kinetics of the process[93, 94, 33]. A notable example of diffusion in presence of relaxation processes is CaseII diffusion [34]. Since the top coat can be plasticized by the forementioned type of pen-etrants, TBP uptake by multilayer coatings differs from the water uptake by multilayersystems with hydrophobic top coats considered in the previous chapters. Therefore, theinvestigation of TBP penetration in multilayer coatings starts from understanding TBPuptake by the top coat layers only.
This chapter aims to understand the TBP penetration into a highly crosslinked topcoat and to investigate how relaxation processes influence the uptake kinetics. The pene-tration is studied at a temperature near the glass transition temperature of the coating asan extreme case with the faster uptake. A combination high resolution NMR imaging andNMR relaxometry was used to measure TBP uptake. TBP redistribution in the coating,kinetics of uptake, swelling and plasticization of the coating were studied.
83
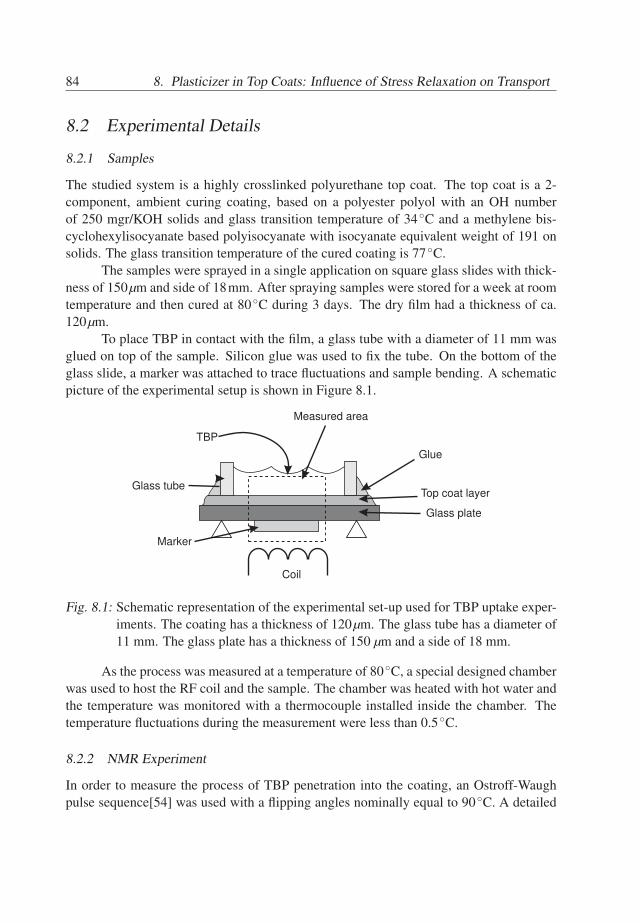
84 8. Plasticizer in Top Coats: Influence of Stress Relaxation on Transport
8.2 Experimental Details
8.2.1 Samples
The studied system is a highly crosslinked polyurethane top coat. The top coat is a 2-component, ambient curing coating, based on a polyester polyol with an OH numberof 250 mgr/KOH solids and glass transition temperature of 34 C and a methylene bis-cyclohexylisocyanate based polyisocyanate with isocyanate equivalent weight of 191 onsolids. The glass transition temperature of the cured coating is 77 C.
The samples were sprayed in a single application on square glass slides with thick-ness of 150µm and side of 18mm. After spraying samples were stored for a week at roomtemperature and then cured at 80 C during 3 days. The dry film had a thickness of ca.120µm.
To place TBP in contact with the film, a glass tube with a diameter of 11 mm wasglued on top of the sample. Silicon glue was used to fix the tube. On the bottom of theglass slide, a marker was attached to trace fluctuations and sample bending. A schematicpicture of the experimental setup is shown in Figure 8.1.
Glass tube
Glue
Top coat layer
Glass plate
Marker
TBP
Coil
Measured area
Fig. 8.1: Schematic representation of the experimental set-up used for TBP uptake exper-iments. The coating has a thickness of 120µm. The glass tube has a diameter of11 mm. The glass plate has a thickness of 150 µm and a side of 18 mm.
As the process was measured at a temperature of 80 C, a special designed chamberwas used to host the RF coil and the sample. The chamber was heated with hot water andthe temperature was monitored with a thermocouple installed inside the chamber. Thetemperature fluctuations during the measurement were less than 0.5 C.
8.2.2 NMR Experiment
In order to measure the process of TBP penetration into the coating, an Ostroff-Waughpulse sequence[54] was used with a flipping angles nominally equal to 90 C. A detailed
84
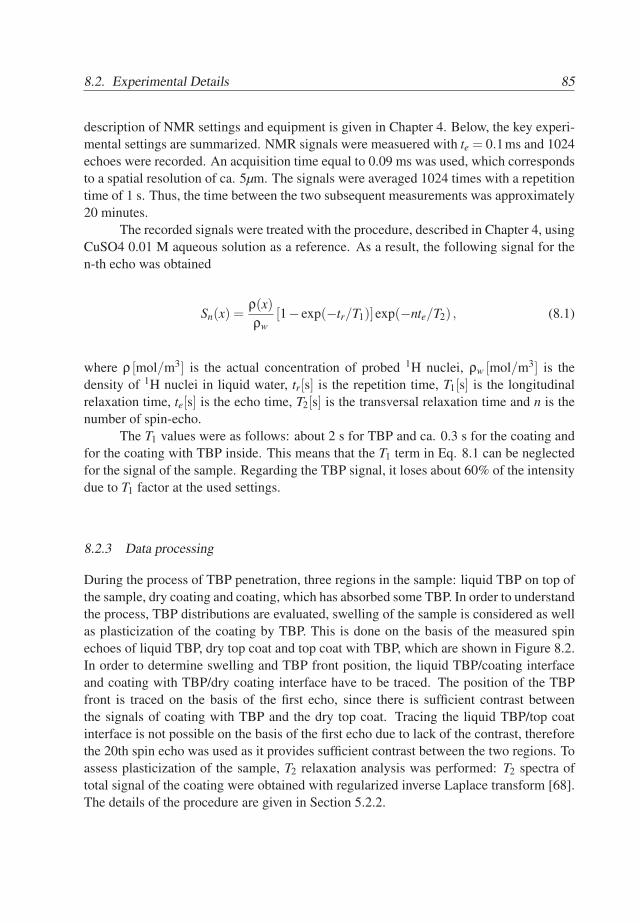
8.2. Experimental Details 85
description of NMR settings and equipment is given in Chapter 4. Below, the key experi-mental settings are summarized. NMR signals were measuered with te = 0.1ms and 1024echoes were recorded. An acquisition time equal to 0.09 ms was used, which correspondsto a spatial resolution of ca. 5µm. The signals were averaged 1024 times with a repetitiontime of 1 s. Thus, the time between the two subsequent measurements was approximately20 minutes.
The recorded signals were treated with the procedure, described in Chapter 4, usingCuSO4 0.01 M aqueous solution as a reference. As a result, the following signal for then-th echo was obtained
Sn(x) =ρ(x)ρw
[1− exp(−tr/T1)]exp(−nte/T2) , (8.1)
where ρ [mol/m3] is the actual concentration of probed 1H nuclei, ρw [mol/m3] is thedensity of 1H nuclei in liquid water, tr[s] is the repetition time, T1[s] is the longitudinalrelaxation time, te[s] is the echo time, T2[s] is the transversal relaxation time and n is thenumber of spin-echo.
The T1 values were as follows: about 2 s for TBP and ca. 0.3 s for the coating andfor the coating with TBP inside. This means that the T1 term in Eq. 8.1 can be neglectedfor the signal of the sample. Regarding the TBP signal, it loses about 60% of the intensitydue to T1 factor at the used settings.
8.2.3 Data processing
During the process of TBP penetration, three regions in the sample: liquid TBP on top ofthe sample, dry coating and coating, which has absorbed some TBP. In order to understandthe process, TBP distributions are evaluated, swelling of the sample is considered as wellas plasticization of the coating by TBP. This is done on the basis of the measured spinechoes of liquid TBP, dry top coat and top coat with TBP, which are shown in Figure 8.2.In order to determine swelling and TBP front position, the liquid TBP/coating interfaceand coating with TBP/dry coating interface have to be traced. The position of the TBPfront is traced on the basis of the first echo, since there is sufficient contrast betweenthe signals of coating with TBP and the dry top coat. Tracing the liquid TBP/top coatinterface is not possible on the basis of the first echo due to lack of the contrast, thereforethe 20th spin echo was used as it provides sufficient contrast between the two regions. Toassess plasticization of the sample, T2 relaxation analysis was performed: T2 spectra oftotal signal of the coating were obtained with regularized inverse Laplace transform [68].The details of the procedure are given in Section 5.2.2.
85
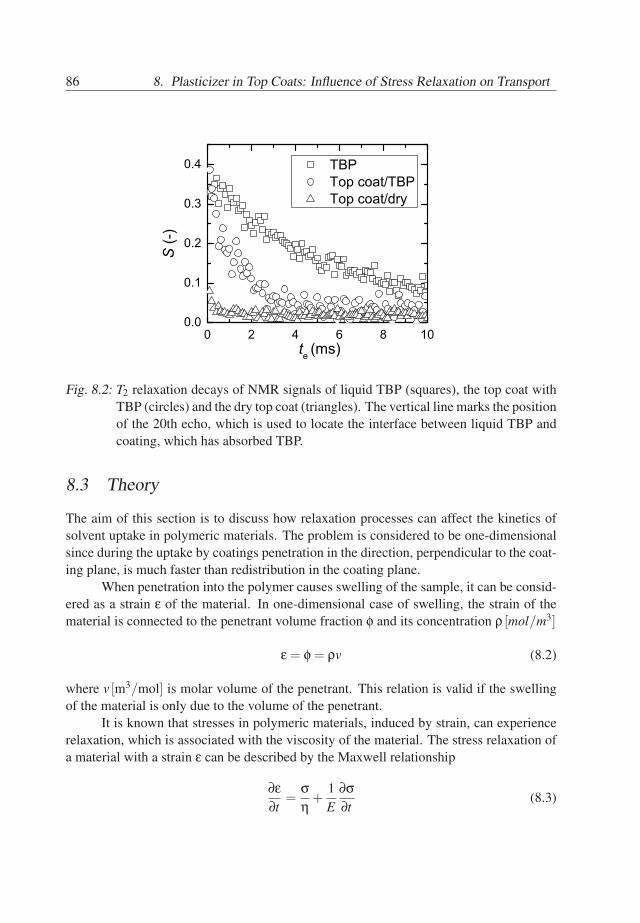
86 8. Plasticizer in Top Coats: Influence of Stress Relaxation on Transport
0 2 4 6 8 100.0
0.1
0.2
0.3
0.4
TBP Top coat/TBP Top coat/dry
S (-
)
te (ms)
Fig. 8.2: T2 relaxation decays of NMR signals of liquid TBP (squares), the top coat withTBP (circles) and the dry top coat (triangles). The vertical line marks the positionof the 20th echo, which is used to locate the interface between liquid TBP andcoating, which has absorbed TBP.
8.3 Theory
The aim of this section is to discuss how relaxation processes can affect the kinetics ofsolvent uptake in polymeric materials. The problem is considered to be one-dimensionalsince during the uptake by coatings penetration in the direction, perpendicular to the coat-ing plane, is much faster than redistribution in the coating plane.
When penetration into the polymer causes swelling of the sample, it can be consid-ered as a strain ε of the material. In one-dimensional case of swelling, the strain of thematerial is connected to the penetrant volume fraction ϕ and its concentration ρ [mol/m3]
ε = ϕ = ρv (8.2)
where v [m3/mol] is molar volume of the penetrant. This relation is valid if the swellingof the material is only due to the volume of the penetrant.
It is known that stresses in polymeric materials, induced by strain, can experiencerelaxation, which is associated with the viscosity of the material. The stress relaxation ofa material with a strain ε can be described by the Maxwell relationship
∂ε∂t
=ση+
1E
∂σ∂t
(8.3)
86
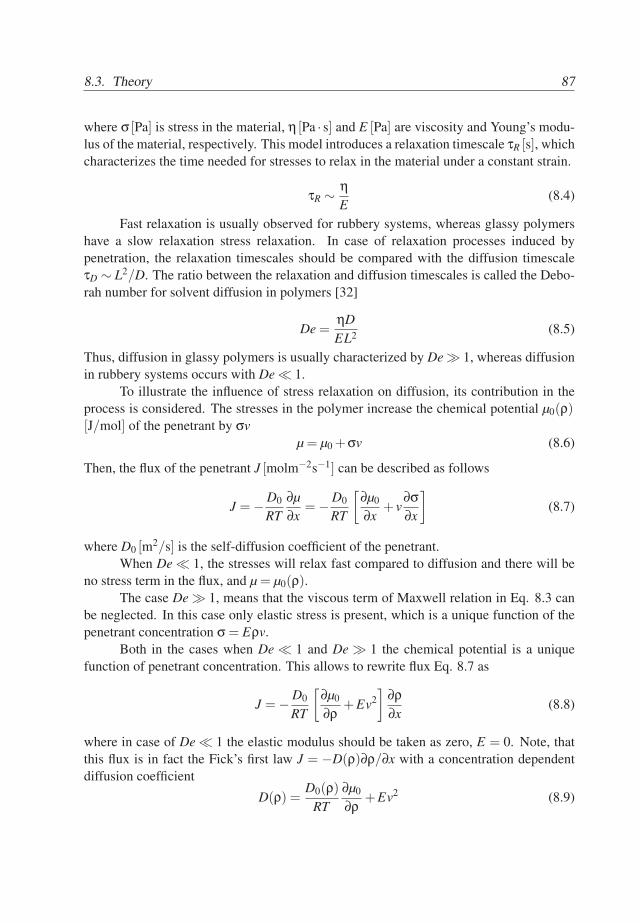
8.3. Theory 87
where σ [Pa] is stress in the material, η [Pa · s] and E [Pa] are viscosity and Young’s modu-lus of the material, respectively. This model introduces a relaxation timescale τR [s], whichcharacterizes the time needed for stresses to relax in the material under a constant strain.
τR ∼ ηE
(8.4)
Fast relaxation is usually observed for rubbery systems, whereas glassy polymershave a slow relaxation stress relaxation. In case of relaxation processes induced bypenetration, the relaxation timescales should be compared with the diffusion timescaleτD ∼ L2/D. The ratio between the relaxation and diffusion timescales is called the Debo-rah number for solvent diffusion in polymers [32]
De =ηDEL2 (8.5)
Thus, diffusion in glassy polymers is usually characterized by De ≫ 1, whereas diffusionin rubbery systems occurs with De ≪ 1.
To illustrate the influence of stress relaxation on diffusion, its contribution in theprocess is considered. The stresses in the polymer increase the chemical potential µ0(ρ)[J/mol] of the penetrant by σv
µ = µ0 +σv (8.6)
Then, the flux of the penetrant J [molm−2s−1] can be described as follows
J =− D0
RT∂µ∂x
=− D0
RT
[∂µ0
∂x+ v
∂σ∂x
](8.7)
where D0 [m2/s] is the self-diffusion coefficient of the penetrant.When De ≪ 1, the stresses will relax fast compared to diffusion and there will be
no stress term in the flux, and µ = µ0(ρ).The case De ≫ 1, means that the viscous term of Maxwell relation in Eq. 8.3 can
be neglected. In this case only elastic stress is present, which is a unique function of thepenetrant concentration σ = Eρv.
Both in the cases when De ≪ 1 and De ≫ 1 the chemical potential is a uniquefunction of penetrant concentration. This allows to rewrite flux Eq. 8.7 as
J =− D0
RT
[∂µ0
∂ρ+Ev2
]∂ρ∂x
(8.8)
where in case of De ≪ 1 the elastic modulus should be taken as zero, E = 0. Note, thatthis flux is in fact the Fick’s first law J = −D(ρ)∂ρ/∂x with a concentration dependentdiffusion coefficient
D(ρ) =D0(ρ)
RT∂µ0
∂ρ+Ev2 (8.9)
87
88 8. Plasticizer in Top Coats: Influence of Stress Relaxation on Transport
Therefore, when the stress relaxation term can be neglected or the relaxation pro-cess happens much faster than diffusion, Fickian kinetics of the process will be observed.This implies that in these extreme cases the concentration profiles should be a function ofx/t1/2, where x is the distance from the solvent/coating interface.
The situations, when De ∼ 1, the relaxation of the stress, has to be taken into ac-count. In general, analytical solution for the stress of Eq. 8.3 reads
σ(x, t) = exp(−E(ρ(x, t)t)
η(ρ(x, t))
)
×t∫
0
E(ρ(x, t ′))v∂ρ/∂t ′ exp(
E(ρ(x, t ′)t ′)η(ρ(x, t ′))
)dt ′ (8.10)
Note, that the stress includes history term.Substituting this stress into the flux in Eq. 8.7 will cause its modification. The
resulting flux will not be invariant to Fick’s law, and consequently, the uptake kineticswill differ from Fickian kinetics.
8.4 Results
The aim of this section is to get an insight into TBP penetration in the coating. This isdone with high resolution NMR imaging, which is used to assess TBP distributions andswelling during the process. Additionally, T2 relaxation analysis is performed to evaluatemobilities of TBP and polymer chains of the coating.
First, to assess the TBP penetration, signal profiles of the sample during the uptakewere measured, see Figure 8.3. The interface between liquid TBP and and the top coatwas set at 0µm by repositioning the profiles and is denoted by the vertical line. The timebetween the two subsequent profiles is approximately 20 minutes. The light grey linesare the profiles during the first 50 hours of the uptake and the dark grey profiles weremeasured beyond 50 hours. For t < 50h a sharp progressing front is observed, denotedby the upper horizontal arrow. Further, little signal variation is observed behind the front,while it moves through the sample. After the front has reached the substrate (t > 50h),the signal increase is observed everywhere in the sample, which is shown by the verticalarrow. Swelling occurs during the whole uptake, and is denoted by the lower horizontalarrow.
To evaluate the kinetics of the uptake, the front position is analyzed. The positionof the front f [µm] is estimated as the distance of this front to the TBP/coating interface,see Figure 8.4. The front progresses into the sample, until it reaches the substrate at ca. 50hours. The observed front position is compared with the two extreme cases of penetrationkinetics: Fickian diffusion ( f ∼ t1/2) and Case II diffusion ( f ∼ t) [34]. Apparently, the
88
8.4. Results 89
-30 0 30 60 90 120 150 1800.0
0.2
0.4
0.6
0.8
1.0GlassCoating
S (-
)
x ( m)
TBP
Fig. 8.3: Signal profiles of the coating during the TBP penetration. The bold line showsthe signal profile of the dry coating. The signal profiles during the first 50 hoursof the uptake are shown by dark grey lines and the dark grey lines show signalprofiles after 50 hours. The time between two subsequent profiles is 2.5 hours.The arrows denote the TBP fronts progression during the first 50 hours (upperhorizontal arrow), swelling (lower horizontal arrow) and the signal increase inthe sample after 50 hours (vertical arrow). The vertical line denote the positionof liquid TBP/top coat interface.
front progression rate is between these two extremes. By fitting a power law, it has beenfound that power equals 0.63, i.e. f ∼ t0.63. Therefore, it is concluded that the uptake ratehas non-Fickian kinetics.
In order to evaluate the amount of absorbed TBP and its influence on the sample, theswelling of the sample during the penetration is estimated, see Figure 8.5. The swellingwas estimated from the change in the distance between the marker and the TBP/coatinginterface. The swelling increases until 70 hours and its end value is ca. 35 µm, which is29% of the initial thickness of the sample. The amount of absorbed TBP, nT BP [mol], iscalculated as follows
nT BP/A = 27× HvT BP
, (8.11)
where H [m] is swelling of the coating, vT BP = 274cm3/mol is molar volume of liquidTBP and A [m] is the area of TBP penetration. The number 27 is the number of protonsin a single TBP molecule. In the calculation it is assumed that the extra volume of the
89
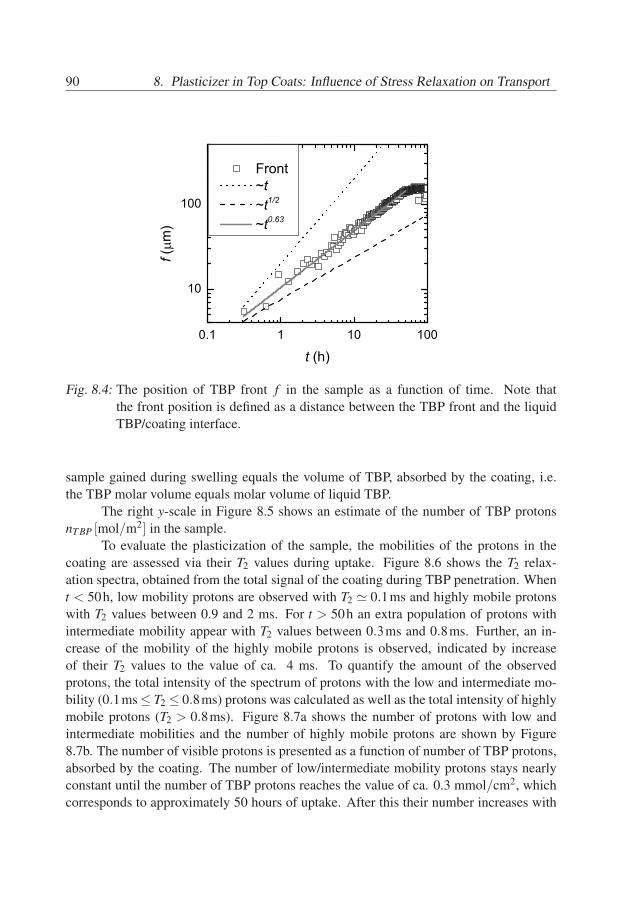
90 8. Plasticizer in Top Coats: Influence of Stress Relaxation on Transport
0.1 1 10 100
10
100
Front ~t ~t1/2
~t0.63
f (m
)
t (h)
Fig. 8.4: The position of TBP front f in the sample as a function of time. Note thatthe front position is defined as a distance between the TBP front and the liquidTBP/coating interface.
sample gained during swelling equals the volume of TBP, absorbed by the coating, i.e.the TBP molar volume equals molar volume of liquid TBP.
The right y-scale in Figure 8.5 shows an estimate of the number of TBP protonsnT BP [mol/m2] in the sample.
To evaluate the plasticization of the sample, the mobilities of the protons in thecoating are assessed via their T2 values during uptake. Figure 8.6 shows the T2 relax-ation spectra, obtained from the total signal of the coating during TBP penetration. Whent < 50h, low mobility protons are observed with T2 ≃ 0.1ms and highly mobile protonswith T2 values between 0.9 and 2 ms. For t > 50h an extra population of protons withintermediate mobility appear with T2 values between 0.3ms and 0.8ms. Further, an in-crease of the mobility of the highly mobile protons is observed, indicated by increaseof their T2 values to the value of ca. 4 ms. To quantify the amount of the observedprotons, the total intensity of the spectrum of protons with the low and intermediate mo-bility (0.1ms ≤ T2 ≤ 0.8ms) protons was calculated as well as the total intensity of highlymobile protons (T2 > 0.8ms). Figure 8.7a shows the number of protons with low andintermediate mobilities and the number of highly mobile protons are shown by Figure8.7b. The number of visible protons is presented as a function of number of TBP protons,absorbed by the coating. The number of low/intermediate mobility protons stays nearlyconstant until the number of TBP protons reaches the value of ca. 0.3 mmol/cm2, whichcorresponds to approximately 50 hours of uptake. After this their number increases with
90
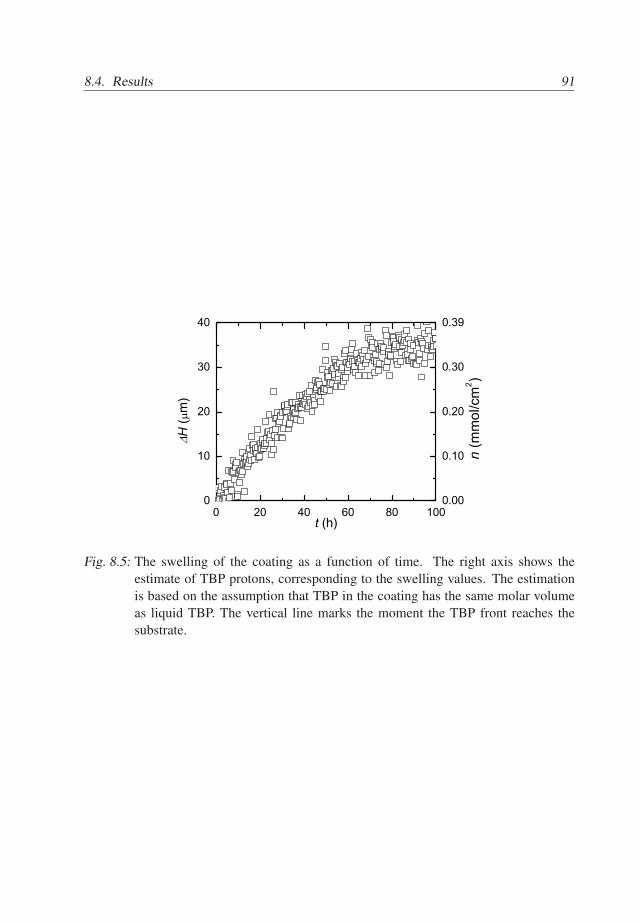
8.4. Results 91
0 20 40 60 80 1000
10
20
30
40
0.00
0.10
0.20
0.30
0.39
n (m
mol
/cm
2 )
H (
m)
t (h)
Fig. 8.5: The swelling of the coating as a function of time. The right axis shows theestimate of TBP protons, corresponding to the swelling values. The estimationis based on the assumption that TBP in the coating has the same molar volumeas liquid TBP. The vertical line marks the moment the TBP front reaches thesubstrate.
91
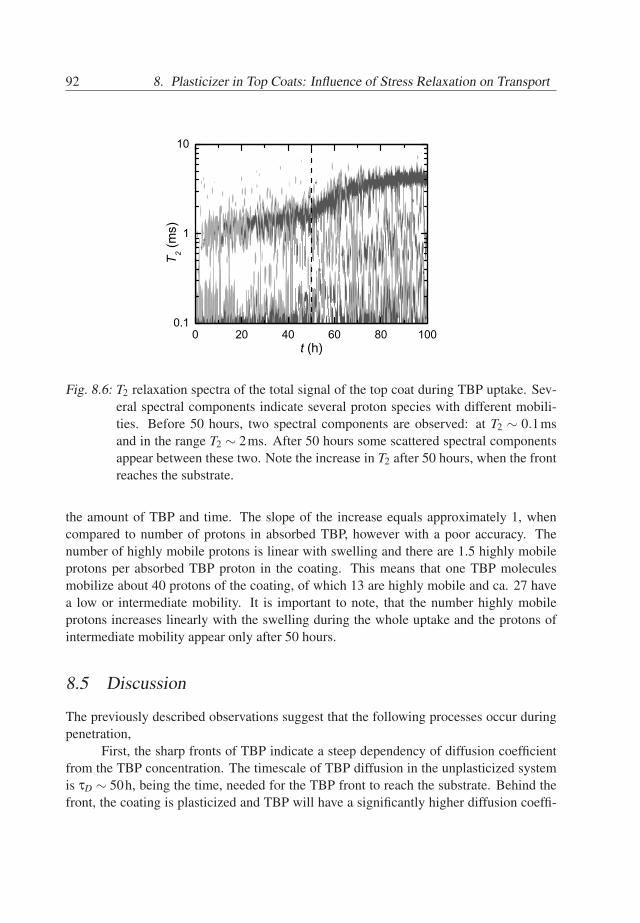
92 8. Plasticizer in Top Coats: Influence of Stress Relaxation on Transport
Fig. 8.6: T2 relaxation spectra of the total signal of the top coat during TBP uptake. Sev-eral spectral components indicate several proton species with different mobili-ties. Before 50 hours, two spectral components are observed: at T2 ∼ 0.1msand in the range T2 ∼ 2ms. After 50 hours some scattered spectral componentsappear between these two. Note the increase in T2 after 50 hours, when the frontreaches the substrate.
the amount of TBP and time. The slope of the increase equals approximately 1, whencompared to number of protons in absorbed TBP, however with a poor accuracy. Thenumber of highly mobile protons is linear with swelling and there are 1.5 highly mobileprotons per absorbed TBP proton in the coating. This means that one TBP moleculesmobilize about 40 protons of the coating, of which 13 are highly mobile and ca. 27 havea low or intermediate mobility. It is important to note, that the number highly mobileprotons increases linearly with the swelling during the whole uptake and the protons ofintermediate mobility appear only after 50 hours.
8.5 Discussion
The previously described observations suggest that the following processes occur duringpenetration,
First, the sharp fronts of TBP indicate a steep dependency of diffusion coefficientfrom the TBP concentration. The timescale of TBP diffusion in the unplasticized systemis τD ∼ 50h, being the time, needed for the TBP front to reach the substrate. Behind thefront, the coating is plasticized and TBP will have a significantly higher diffusion coeffi-
92
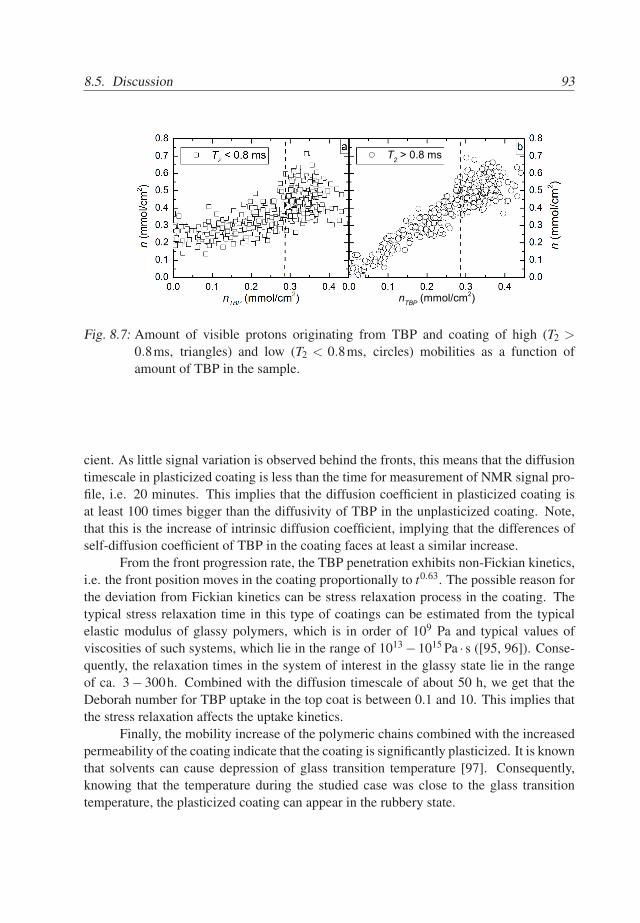
8.5. Discussion 93
T2 > 0.8 ms
nTBP (mmol/cm2)
Fig. 8.7: Amount of visible protons originating from TBP and coating of high (T2 >0.8ms, triangles) and low (T2 < 0.8ms, circles) mobilities as a function ofamount of TBP in the sample.
cient. As little signal variation is observed behind the fronts, this means that the diffusiontimescale in plasticized coating is less than the time for measurement of NMR signal pro-file, i.e. 20 minutes. This implies that the diffusion coefficient in plasticized coating isat least 100 times bigger than the diffusivity of TBP in the unplasticized coating. Note,that this is the increase of intrinsic diffusion coefficient, implying that the differences ofself-diffusion coefficient of TBP in the coating faces at least a similar increase.
From the front progression rate, the TBP penetration exhibits non-Fickian kinetics,i.e. the front position moves in the coating proportionally to t0.63. The possible reason forthe deviation from Fickian kinetics can be stress relaxation process in the coating. Thetypical stress relaxation time in this type of coatings can be estimated from the typicalelastic modulus of glassy polymers, which is in order of 109 Pa and typical values ofviscosities of such systems, which lie in the range of 1013 −1015 Pa · s ([95, 96]). Conse-quently, the relaxation times in the system of interest in the glassy state lie in the rangeof ca. 3− 300h. Combined with the diffusion timescale of about 50 h, we get that theDeborah number for TBP uptake in the top coat is between 0.1 and 10. This implies thatthe stress relaxation affects the uptake kinetics.
Finally, the mobility increase of the polymeric chains combined with the increasedpermeability of the coating indicate that the coating is significantly plasticized. It is knownthat solvents can cause depression of glass transition temperature [97]. Consequently,knowing that the temperature during the studied case was close to the glass transitiontemperature, the plasticized coating can appear in the rubbery state.
93
94 8. Plasticizer in Top Coats: Influence of Stress Relaxation on Transport
8.6 Conclusions
In this study it was found that relaxation of stress due to swelling by TBP (tributyl phos-phate) plays a key role in the uptake by highly crosslinked top coat, resulting in non-Fickian kinetics of penetration. The stress relaxation time is comparable to TBP diffusiontimescales, resulting in modification of driving force in such a way, that it departs fromFickian diffusion.
Further, it was concluded that TBP absorption significantly increases the perme-ability of the top coat. The possible implications of are that the top coat becomes prone toother penetrants and cannot perform well as a barrier in multilayer coating when exposedto hydraulic fluids, which comprise TBP in significant quantities.
Finally, it was concluded that the presence of TBP forces the top coat to appear inrubbery state due to depression of glass transition temperature. This can result in degra-dation of the mechanical properties of the systems and loss of protective properties of thetop coat.
94
9. Conclusions and Outlook
9.1 Conclusions
In this thesis it has been shown that for understanding water transport in a hydrophilicbase coat/hydrophobic top coat system, knowledge of the sorption isotherm of the basecoat and of the permeability of the top coat is sufficient. The permeability of the top coatdetermines the timescale of the transport, whereas the sorption isotherm of the base coatdefines the driving force of water transport and the details of the time-dependency of theprocess.
Practically, this implies that quantitative, simple and cost-efficient tests of wa-ter transport in such type of multilayer coatings can be performed by gravimetricmeasurements of the base coat sorption isotherm and the top coat permeability andby using these parameters to estimate the water content of the sample as a functionof time.
It was found that two-layered polymeric systems with non-linear base coat sorp-tion isotherms (i.e. Type II or Type III) dry much faster than they take up water. Thisimplies that mostly incidental penetration of water will have little consequences in termsof presence of water in the coating, as water will rapidly escape the sample when dryingstarts.
A theoretical investigation showed that in most of the considered systems subjectedto humidity fluctuations, the response time is in the order of days for high humidities andhas values of a few hours at low humidities. The response time is determined by the prod-uct of the timescale of penetration through the top coat and the differential solubility ofthe base coat. This means that most two-layered polymeric base coat/top coat systemswith hydrophilic base coats are relatively inert to most humidity fluctuations, as the re-sponse in terms of water content will be damped. As accelerated and artificial weatheringtests include only humidity fluctuations with typical timescales less than a day, this raisesconcerns if these tests can be compared to natural moisture exposure.
Furthermore, it was found that the polymeric dispersant in the base coat is a keycontributor to the water uptake. Water absorption by the base coat is mainly a process ofhydrogel formation of water with the dispersant in the base coat. This indicates that watersoluble and hydrophilic components of the base coat are promoters for water absorption.
Finally, it was shown that stress relaxation is a key contributor to the driving force
95
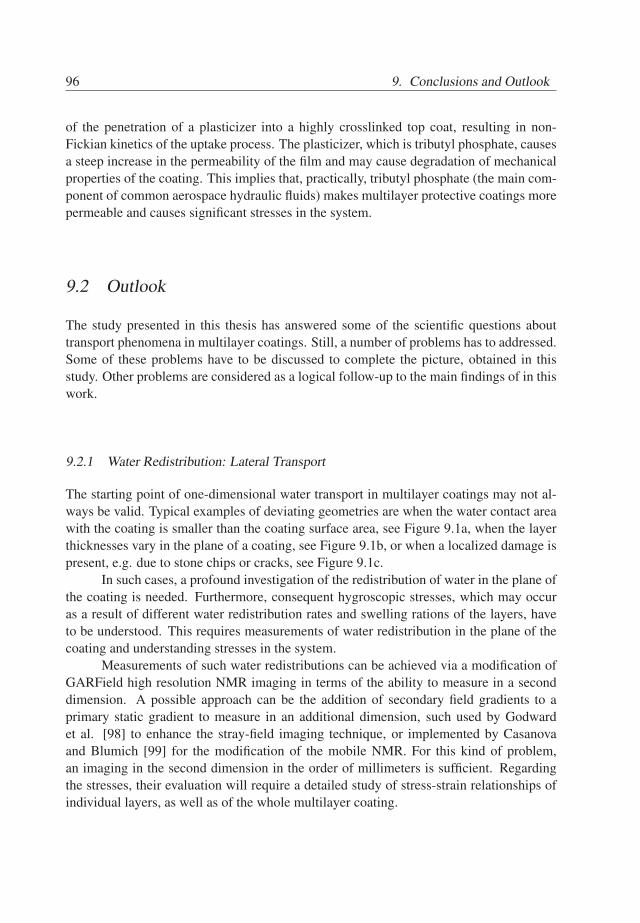
96 9. Conclusions and Outlook
of the penetration of a plasticizer into a highly crosslinked top coat, resulting in non-Fickian kinetics of the uptake process. The plasticizer, which is tributyl phosphate, causesa steep increase in the permeability of the film and may cause degradation of mechanicalproperties of the coating. This implies that, practically, tributyl phosphate (the main com-ponent of common aerospace hydraulic fluids) makes multilayer protective coatings morepermeable and causes significant stresses in the system.
9.2 Outlook
The study presented in this thesis has answered some of the scientific questions abouttransport phenomena in multilayer coatings. Still, a number of problems has to addressed.Some of these problems have to be discussed to complete the picture, obtained in thisstudy. Other problems are considered as a logical follow-up to the main findings of in thiswork.
9.2.1 Water Redistribution: Lateral Transport
The starting point of one-dimensional water transport in multilayer coatings may not al-ways be valid. Typical examples of deviating geometries are when the water contact areawith the coating is smaller than the coating surface area, see Figure 9.1a, when the layerthicknesses vary in the plane of a coating, see Figure 9.1b, or when a localized damage ispresent, e.g. due to stone chips or cracks, see Figure 9.1c.
In such cases, a profound investigation of the redistribution of water in the plane ofthe coating is needed. Furthermore, consequent hygroscopic stresses, which may occuras a result of different water redistribution rates and swelling rations of the layers, haveto be understood. This requires measurements of water redistribution in the plane of thecoating and understanding stresses in the system.
Measurements of such water redistributions can be achieved via a modification ofGARField high resolution NMR imaging in terms of the ability to measure in a seconddimension. A possible approach can be the addition of secondary field gradients to aprimary static gradient to measure in an additional dimension, such used by Godwardet al. [98] to enhance the stray-field imaging technique, or implemented by Casanovaand Blumich [99] for the modification of the mobile NMR. For this kind of problem,an imaging in the second dimension in the order of millimeters is sufficient. Regardingthe stresses, their evaluation will require a detailed study of stress-strain relationships ofindividual layers, as well as of the whole multilayer coating.
96
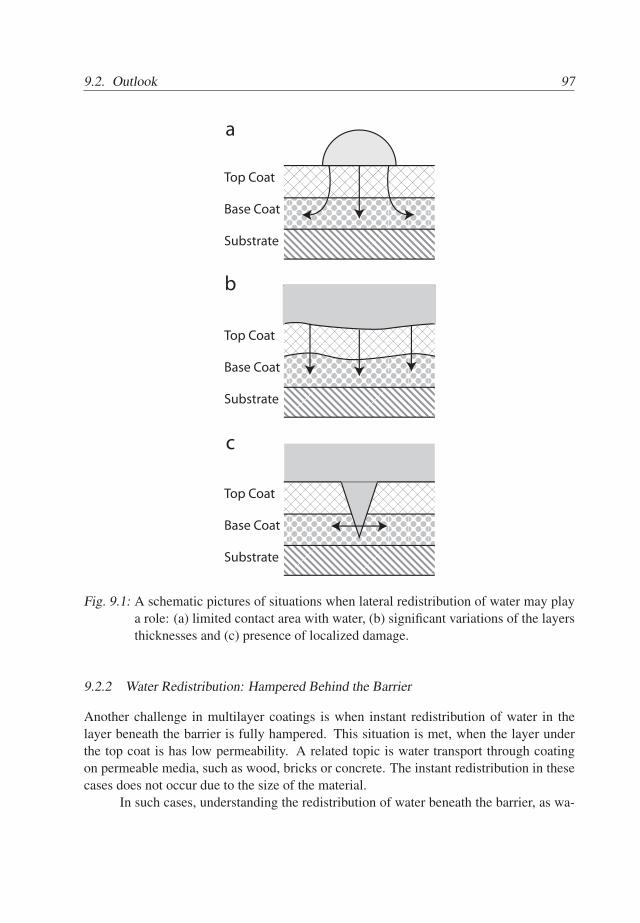
9.2. Outlook 97
Substrate
Base Coat
Top Coat
Substrate
Base Coat
Top Coat
Substrate
Base Coat
Top Coat
a
b
c
Fig. 9.1: A schematic pictures of situations when lateral redistribution of water may playa role: (a) limited contact area with water, (b) significant variations of the layersthicknesses and (c) presence of localized damage.
9.2.2 Water Redistribution: Hampered Behind the Barrier
Another challenge in multilayer coatings is when instant redistribution of water in thelayer beneath the barrier is fully hampered. This situation is met, when the layer underthe top coat is has low permeability. A related topic is water transport through coatingon permeable media, such as wood, bricks or concrete. The instant redistribution in thesecases does not occur due to the size of the material.
In such cases, understanding the redistribution of water beneath the barrier, as wa-
97
98 9. Conclusions and Outlook
ter is associated with various damage mechanisms in coatings and porous media. Fur-thermore, the failure mechanisms of the barrier layer in such systems have to be studied.When coated porous media are concerned, it is known that blister formation or adhesionloss are frequent failure phenomena. The redistribution in multilayer coatings can be stud-ied with high resolution NMR imaging, used in this thesis, while coated bulk media canbe assessed with NMR imaging with resolution of millimeters [65].
9.2.3 Behind the Sorption Isotherm: The Influence of the Composition
Knowing that the sorption isotherm of the base coat is a key feature that determines theresponse of multilayer coatings to moisture, the obvious research challenge is to determinehow the sorption isotherm depends on the composition. This knowledge is important forfurther development of coatings with respect to their water resistance.
Regarding the cases, when base coats comprise multiple polymer phases, the firststep should be studying sorption isotherms of the individual phases. A next step addressesthe question how sorption isotherms of the single phases result in sorption isotherm ofa multiphase layer. Note that hygroscopic stresses can result in complex interactionsbetween multiple polymer phases, since water induced swelling of one phase can inducestress on other phases, influencing their water sorption. It is known that the stressescan significantly influence sorption in composites of multiple polymer phases [100, 101].Thus, one of the key challenges is to verify to what extent interaction between coatinglayers occurs, and to determine interactions between polymer phases of multiphase layers.The objective is verifying if there is an interaction between the layers of the coating andto determine the nature of interactions between the polymer phases of multiphase layers.
Such investigation requires accurate measurements and modeling of the water sorp-tion isotherm for each polymer phase. Furthermore, this study may benefit from study-ing enthalpy and entropy of sorption, which can be performed with sorption calorimetry[102]. Knowledge of these parameters is an important empirical basis for modeling theisotherms.
9.2.4 The Temperature: Key Parameter in Transport
The present study was done under isothermal conditions at room temperature. It is knownthat temperature strongly influence the rates of transport, the absorption capacities andeven water-polymer interactions. Therefore, evident follow-up is concern the role of thetemperature. The aim of such study is understanding temperature dependency of watertransport, the combination of temperature variations in time and water water transport,and the response of multilayer coatings to a combination of temperature and humidityfluctuations.
The temperature dependency of water transport is most evident in the potentialeffect on the top coat permeability and the base coat water absorption. The model intro-
98
9.2. Outlook 99
duced in Chapter 6 should be verified over a wider temperature range, i.e. if the diffusivityof water in the top coat remains constant at all temperatures. The question to consider iswhether supersaturation of water can occur in the sample, e.g. as a consequence of tem-perature decrease of a coating saturated with water, and its consequences for multilayercoatings. Consequently, measurements of top coat permeabilities and the base coat sorp-tion isotherms have to be performed at different temperatures. Further, a model for thehygrothermal response of multilayer coatings has to be developed.
9.2.5 Ion Transport in Multilayer Coatings: The Influence of Water
Water in coatings can facilitate ion transport to the substrate. This process can be criticalfor the coating performance, since the presence of ions is an important ingredient of cor-rosion mechanism. Obvious follow-up of the present study is to answer the question howions migrate in multilayer coatings in the presence of water.
Furthermore, it should be evaluated if ions can accumulate in multilayer coatingsdue to trapping of permeated ions during drying.
9.2.6 Plasticizer Ingress in Multilayer Coatings and Composites: Effects of StressRelaxation
This thesis presented a study of the penetration of phosphate-ester hydraulic fluids pene-trate into multilayer coatings. There is still a number of open questions to be answered.
First, to understand the transport it should be known how TBP (tributyl phosphate)is present in the polymeric material and how does it interact with the coating. This willrequire evaluation of TBP sorption isotherms, TBP self-diffusion coefficients and an anal-ysis of the dependency of the viscoelastic properties of the material as a function of theTBP content. The self-diffusion coefficients can be measured with NMR, whereas theviscoelastic properties, i.e. elastic modulus and Maxwell’s relaxation time can be ana-lyzed with DMA (dynamic mechanical analysis). Measurements of sorption isotherms isan experimental challenge as the TBP vapor pressure is low. It makes difficult to controlits activity.
Second, follow-up should address non-isothermal conditions, i.e. determining howtemperature influences transport of plasticizer. Such study should include the investiga-tion how temperature regulates diffusion and the stress relaxation rates.
Third, the present study has only considered the top coat layer. Even when theplasticizer migration in the top coat is fully understood, an open question is how plasticizerwill penetrate into a multilayer coating. One of the key questions then concerns the effectof stress relaxation in multilayered structure.
99

100 9. Conclusions and Outlook
100
Bibliography
[1] R.J. Irwin, M. VanMouwerik, L. Stevens, M.D. Seese, and W. Basham. Environ-mental Contaminants Encyclopedia. National Park Service, Water Resources Di-vision, Fort Collins, Colorado, Distributed within the federal government as elec-tronic document, 1997.
[2] E. Brodkin, R. Copes, A. Mattman, J. Kennedy, R. Kling, and A. Yassi. Leadand mercury exposures: interpretation and action. Canadian Medical Associationjournal, 176:59–63, 2007.
[3] V.L.D. Badisa, L.M. Latinwo, C.O. Odewumi, C.O. Ikediobi, R.B. Badisa, L.T.Ayuk-Takem, Jude Nwoga, and John West. Mechanism of DNA damage by cad-mium and interplay of antioxidant enzymes and agents. Environmental toxicology,22:144–151, 2007.
[4] Jie Liu, Wei Qu, and M.B. Kadiiska. Role of oxidative stress in cadmium toxicityand carcinogenesis. Toxicology and applied pharmacology, 238:209–14, 2009.
[5] P.J. Lioy. Exposure science: a view of the past and milestones for the future.Environmental health perspectives, 118:1081–90, 2010.
[6] B. Turpin, R. Saxena, and E. Andrews. Measuring and simulating particulateorganics in the atmosphere: problems and prospects. Atmospheric Environment,34:2983–3013, 2000.
[7] H.R. Cheng, H. Guo, S.M. Saunders, S.H.M. Lam, F. Jiang, X.M. Wang, I.J. Simp-son, D.R. Blake, P.K.K. Louie, and T.J. Wang. Assessing photochemical ozoneformation in the Pearl River Delta with a photochemical trajectory model. Atmo-spheric Environment, 44:4199–4208, 2010.
[8] J. Fenger. Air pollution in the last 50 years From local to global. AtmosphericEnvironment, 43:13–22, 2009.
[9] EU RoHs. Directive 2002/95/Ec Of The European Parliament and of the Councilof 27 January 2003 on the restriction of the use of certain hazardous substances in
101
102 Bibliography
electrical and electronic equipment. Official Journal of the European Union, pages6–10, 2003.
[10] Commission European Communities (CEC). Regulation (EC) No 1907/2006 of theEuropean Parliament and of the Council. Official Journal of the European Union,396:1–849, 2006.
[11] R Lambourne and TA Strivens, editors. Paint and Surface Coatings: Theory andpractice. Woodhead Publishing Ltd, 1999.
[12] R. Blahnik. Problems of Measuring Water Sorption in Organic Coatings and Films,and Calculations of Complicated Instances of Moistening. Progress in organiccoatings, 11:353–392, 1983.
[13] M. Hulden and C.M. Hansen. Water permeation in coatings. Progress in OrganicCoatings, 13:171–194, 1985.
[14] G. van Der Wel and O.C.G. Adan. Moisture in organic coatings: A review. Progressin Organic Coatings, 37:1–14, 1999.
[15] P. Carbonini, T. Monetta, L. Nicodemo, P. Mastronardi, B. Scatteia, and F. Belucci.Electrochemical Characterization of Multilayer Organic Coatings. Progress in Or-ganic Coatings, 29:13–20, 1996.
[16] J.H. Park, G.D. Lee, H. Ooshige, A. Nishikata, and T. Tsuru. Monitoring of wa-ter uptake in organic coatings under cyclic wetdry condition. Corrosion Science,45:1881–1894, 2003.
[17] S. Devasahayam. Effect of moisture-ingress on adhesion energy in a metal oxide-polymer system. Journal of Applied Polymer Science, 99:2052–2061, 2006.
[18] K.N. Allahar, B.R. Hinderliter, D.E. Tallman, and G.P. Bierwagen. Water Trans-port in Multilayer Organic Coatings. Journal of The Electrochemical Society,155(8):F201–F208, 2008.
[19] V. Baukh, H.P. Huinink, O.C.G. Adan, S.J.F. Erich, and L.G.J. van der Ven. NMRImaging of Water Uptake in Multilayer Polymeric Films: Stressing the Role ofMechanical Stress. Macromolecules, 43:3882–3889, 2010.
[20] V. Baukh, H.P. Huinink, O.C.G. Adan, S.J.F. Erich, and L.G.J. van der Ven. Water-Polymer Interaction during Water Uptake. Macromolecules, 44:4863–4871, 2011.
[21] S. Brunauer, L.S. Deming, W.E. Deming, and E. Teller. On a theory of the van derWaals adsorption of gases. Journal of the American Chemical Society, 62:1723–1732, 1940.
102
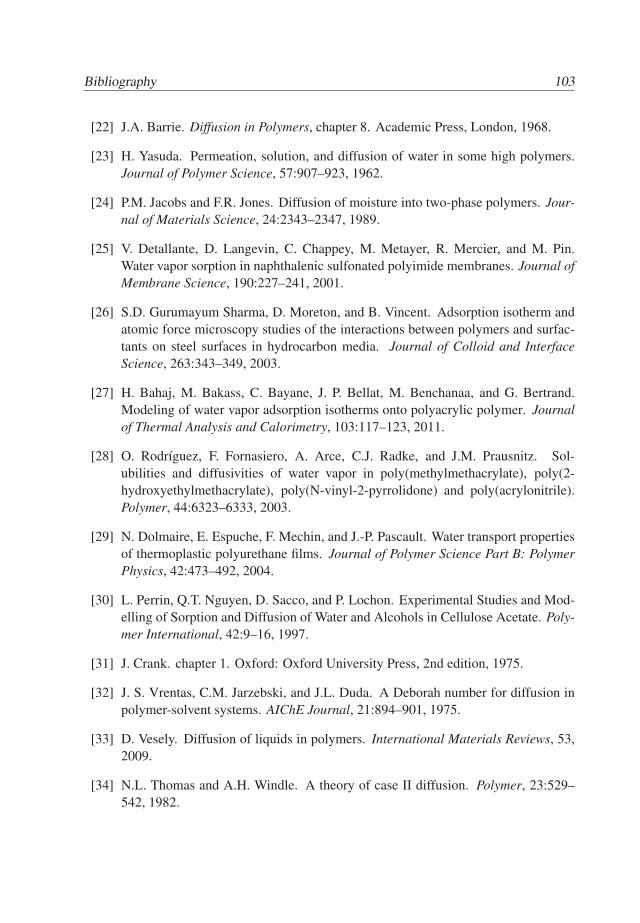
Bibliography 103
[22] J.A. Barrie. Diffusion in Polymers, chapter 8. Academic Press, London, 1968.
[23] H. Yasuda. Permeation, solution, and diffusion of water in some high polymers.Journal of Polymer Science, 57:907–923, 1962.
[24] P.M. Jacobs and F.R. Jones. Diffusion of moisture into two-phase polymers. Jour-nal of Materials Science, 24:2343–2347, 1989.
[25] V. Detallante, D. Langevin, C. Chappey, M. Metayer, R. Mercier, and M. Pin.Water vapor sorption in naphthalenic sulfonated polyimide membranes. Journal ofMembrane Science, 190:227–241, 2001.
[26] S.D. Gurumayum Sharma, D. Moreton, and B. Vincent. Adsorption isotherm andatomic force microscopy studies of the interactions between polymers and surfac-tants on steel surfaces in hydrocarbon media. Journal of Colloid and InterfaceScience, 263:343–349, 2003.
[27] H. Bahaj, M. Bakass, C. Bayane, J. P. Bellat, M. Benchanaa, and G. Bertrand.Modeling of water vapor adsorption isotherms onto polyacrylic polymer. Journalof Thermal Analysis and Calorimetry, 103:117–123, 2011.
[28] O. Rodrıguez, F. Fornasiero, A. Arce, C.J. Radke, and J.M. Prausnitz. Sol-ubilities and diffusivities of water vapor in poly(methylmethacrylate), poly(2-hydroxyethylmethacrylate), poly(N-vinyl-2-pyrrolidone) and poly(acrylonitrile).Polymer, 44:6323–6333, 2003.
[29] N. Dolmaire, E. Espuche, F. Mechin, and J.-P. Pascault. Water transport propertiesof thermoplastic polyurethane films. Journal of Polymer Science Part B: PolymerPhysics, 42:473–492, 2004.
[30] L. Perrin, Q.T. Nguyen, D. Sacco, and P. Lochon. Experimental Studies and Mod-elling of Sorption and Diffusion of Water and Alcohols in Cellulose Acetate. Poly-mer International, 42:9–16, 1997.
[31] J. Crank. chapter 1. Oxford: Oxford University Press, 2nd edition, 1975.
[32] J. S. Vrentas, C.M. Jarzebski, and J.L. Duda. A Deborah number for diffusion inpolymer-solvent systems. AIChE Journal, 21:894–901, 1975.
[33] D. Vesely. Diffusion of liquids in polymers. International Materials Reviews, 53,2009.
[34] N.L. Thomas and A.H. Windle. A theory of case II diffusion. Polymer, 23:529–542, 1982.
103
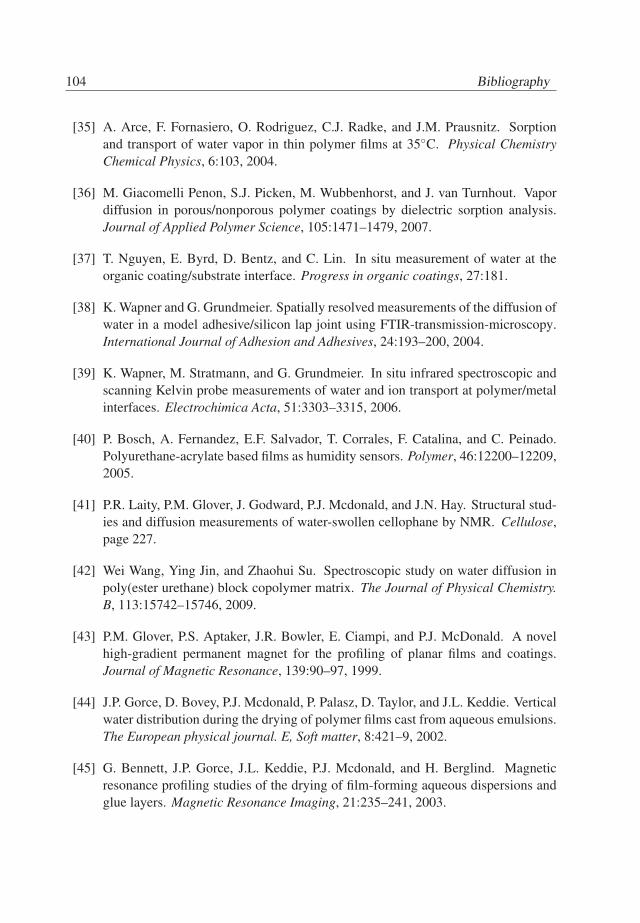
104 Bibliography
[35] A. Arce, F. Fornasiero, O. Rodriguez, C.J. Radke, and J.M. Prausnitz. Sorptionand transport of water vapor in thin polymer films at 35C. Physical ChemistryChemical Physics, 6:103, 2004.
[36] M. Giacomelli Penon, S.J. Picken, M. Wubbenhorst, and J. van Turnhout. Vapordiffusion in porous/nonporous polymer coatings by dielectric sorption analysis.Journal of Applied Polymer Science, 105:1471–1479, 2007.
[37] T. Nguyen, E. Byrd, D. Bentz, and C. Lin. In situ measurement of water at theorganic coating/substrate interface. Progress in organic coatings, 27:181.
[38] K. Wapner and G. Grundmeier. Spatially resolved measurements of the diffusion ofwater in a model adhesive/silicon lap joint using FTIR-transmission-microscopy.International Journal of Adhesion and Adhesives, 24:193–200, 2004.
[39] K. Wapner, M. Stratmann, and G. Grundmeier. In situ infrared spectroscopic andscanning Kelvin probe measurements of water and ion transport at polymer/metalinterfaces. Electrochimica Acta, 51:3303–3315, 2006.
[40] P. Bosch, A. Fernandez, E.F. Salvador, T. Corrales, F. Catalina, and C. Peinado.Polyurethane-acrylate based films as humidity sensors. Polymer, 46:12200–12209,2005.
[41] P.R. Laity, P.M. Glover, J. Godward, P.J. Mcdonald, and J.N. Hay. Structural stud-ies and diffusion measurements of water-swollen cellophane by NMR. Cellulose,page 227.
[42] Wei Wang, Ying Jin, and Zhaohui Su. Spectroscopic study on water diffusion inpoly(ester urethane) block copolymer matrix. The Journal of Physical Chemistry.B, 113:15742–15746, 2009.
[43] P.M. Glover, P.S. Aptaker, J.R. Bowler, E. Ciampi, and P.J. McDonald. A novelhigh-gradient permanent magnet for the profiling of planar films and coatings.Journal of Magnetic Resonance, 139:90–97, 1999.
[44] J.P. Gorce, D. Bovey, P.J. Mcdonald, P. Palasz, D. Taylor, and J.L. Keddie. Verticalwater distribution during the drying of polymer films cast from aqueous emulsions.The European physical journal. E, Soft matter, 8:421–9, 2002.
[45] G. Bennett, J.P. Gorce, J.L. Keddie, P.J. Mcdonald, and H. Berglind. Magneticresonance profiling studies of the drying of film-forming aqueous dispersions andglue layers. Magnetic Resonance Imaging, 21:235–241, 2003.
104
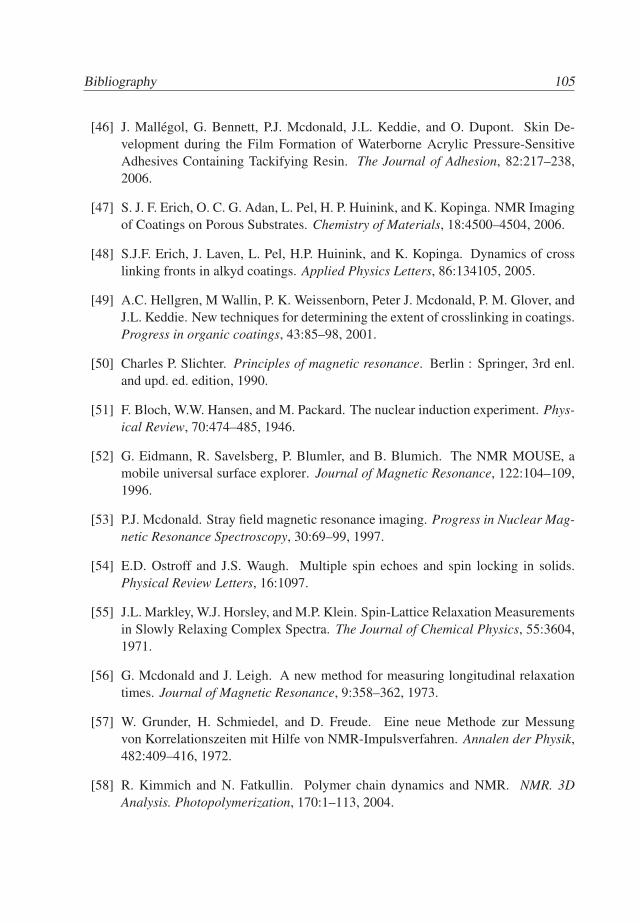
Bibliography 105
[46] J. Mallegol, G. Bennett, P.J. Mcdonald, J.L. Keddie, and O. Dupont. Skin De-velopment during the Film Formation of Waterborne Acrylic Pressure-SensitiveAdhesives Containing Tackifying Resin. The Journal of Adhesion, 82:217–238,2006.
[47] S. J. F. Erich, O. C. G. Adan, L. Pel, H. P. Huinink, and K. Kopinga. NMR Imagingof Coatings on Porous Substrates. Chemistry of Materials, 18:4500–4504, 2006.
[48] S.J.F. Erich, J. Laven, L. Pel, H.P. Huinink, and K. Kopinga. Dynamics of crosslinking fronts in alkyd coatings. Applied Physics Letters, 86:134105, 2005.
[49] A.C. Hellgren, M Wallin, P. K. Weissenborn, Peter J. Mcdonald, P. M. Glover, andJ.L. Keddie. New techniques for determining the extent of crosslinking in coatings.Progress in organic coatings, 43:85–98, 2001.
[50] Charles P. Slichter. Principles of magnetic resonance. Berlin : Springer, 3rd enl.and upd. ed. edition, 1990.
[51] F. Bloch, W.W. Hansen, and M. Packard. The nuclear induction experiment. Phys-ical Review, 70:474–485, 1946.
[52] G. Eidmann, R. Savelsberg, P. Blumler, and B. Blumich. The NMR MOUSE, amobile universal surface explorer. Journal of Magnetic Resonance, 122:104–109,1996.
[53] P.J. Mcdonald. Stray field magnetic resonance imaging. Progress in Nuclear Mag-netic Resonance Spectroscopy, 30:69–99, 1997.
[54] E.D. Ostroff and J.S. Waugh. Multiple spin echoes and spin locking in solids.Physical Review Letters, 16:1097.
[55] J.L. Markley, W.J. Horsley, and M.P. Klein. Spin-Lattice Relaxation Measurementsin Slowly Relaxing Complex Spectra. The Journal of Chemical Physics, 55:3604,1971.
[56] G. Mcdonald and J. Leigh. A new method for measuring longitudinal relaxationtimes. Journal of Magnetic Resonance, 9:358–362, 1973.
[57] W. Grunder, H. Schmiedel, and D. Freude. Eine neue Methode zur Messungvon Korrelationszeiten mit Hilfe von NMR-Impulsverfahren. Annalen der Physik,482:409–416, 1972.
[58] R. Kimmich and N. Fatkullin. Polymer chain dynamics and NMR. NMR. 3DAnalysis. Photopolymerization, 170:1–113, 2004.
105
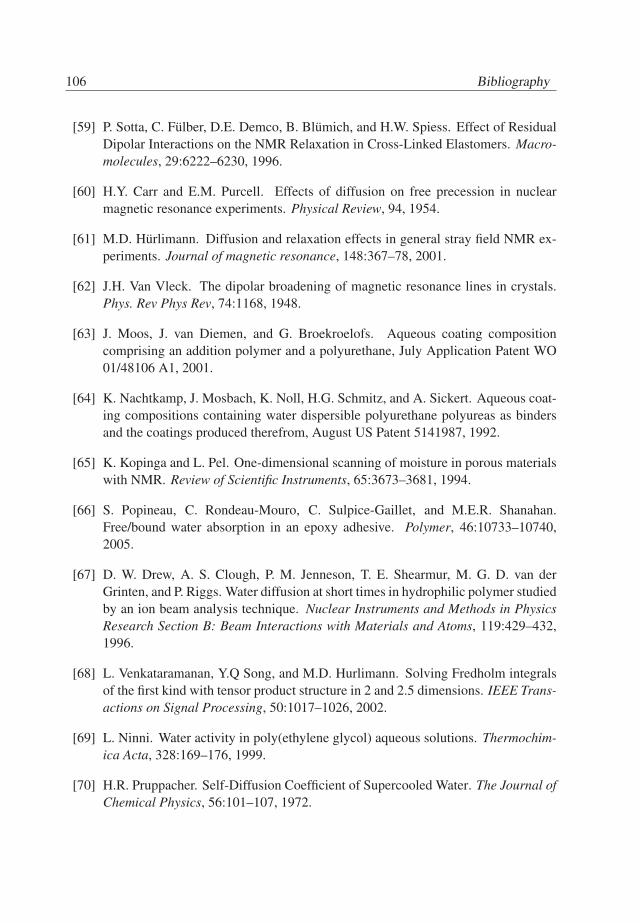
106 Bibliography
[59] P. Sotta, C. Fulber, D.E. Demco, B. Blumich, and H.W. Spiess. Effect of ResidualDipolar Interactions on the NMR Relaxation in Cross-Linked Elastomers. Macro-molecules, 29:6222–6230, 1996.
[60] H.Y. Carr and E.M. Purcell. Effects of diffusion on free precession in nuclearmagnetic resonance experiments. Physical Review, 94, 1954.
[61] M.D. Hurlimann. Diffusion and relaxation effects in general stray field NMR ex-periments. Journal of magnetic resonance, 148:367–78, 2001.
[62] J.H. Van Vleck. The dipolar broadening of magnetic resonance lines in crystals.Phys. Rev Phys Rev, 74:1168, 1948.
[63] J. Moos, J. van Diemen, and G. Broekroelofs. Aqueous coating compositioncomprising an addition polymer and a polyurethane, July Application Patent WO01/48106 A1, 2001.
[64] K. Nachtkamp, J. Mosbach, K. Noll, H.G. Schmitz, and A. Sickert. Aqueous coat-ing compositions containing water dispersible polyurethane polyureas as bindersand the coatings produced therefrom, August US Patent 5141987, 1992.
[65] K. Kopinga and L. Pel. One-dimensional scanning of moisture in porous materialswith NMR. Review of Scientific Instruments, 65:3673–3681, 1994.
[66] S. Popineau, C. Rondeau-Mouro, C. Sulpice-Gaillet, and M.E.R. Shanahan.Free/bound water absorption in an epoxy adhesive. Polymer, 46:10733–10740,2005.
[67] D. W. Drew, A. S. Clough, P. M. Jenneson, T. E. Shearmur, M. G. D. van derGrinten, and P. Riggs. Water diffusion at short times in hydrophilic polymer studiedby an ion beam analysis technique. Nuclear Instruments and Methods in PhysicsResearch Section B: Beam Interactions with Materials and Atoms, 119:429–432,1996.
[68] L. Venkataramanan, Y.Q Song, and M.D. Hurlimann. Solving Fredholm integralsof the first kind with tensor product structure in 2 and 2.5 dimensions. IEEE Trans-actions on Signal Processing, 50:1017–1026, 2002.
[69] L. Ninni. Water activity in poly(ethylene glycol) aqueous solutions. Thermochim-ica Acta, 328:169–176, 1999.
[70] H.R. Pruppacher. Self-Diffusion Coefficient of Supercooled Water. The Journal ofChemical Physics, 56:101–107, 1972.
106
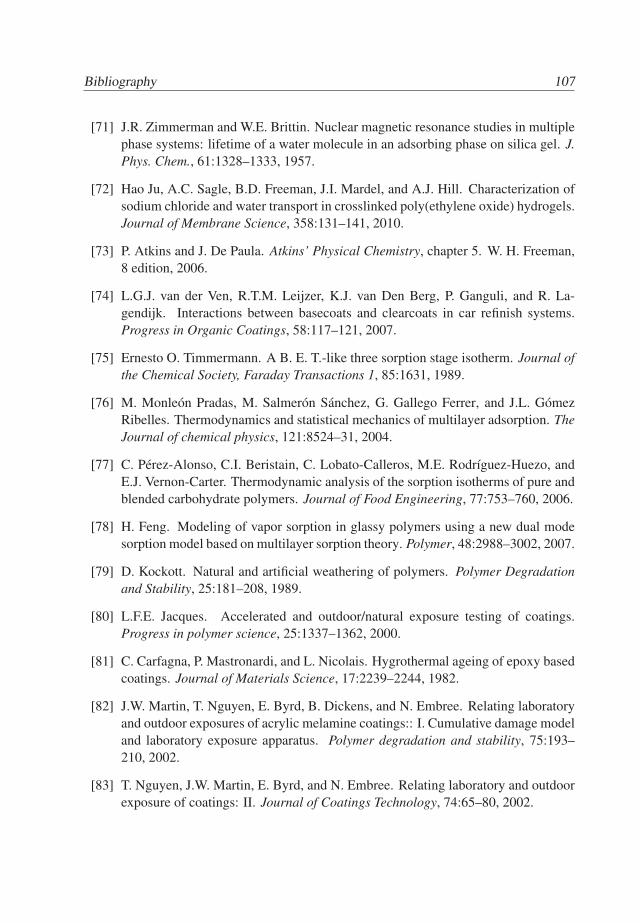
Bibliography 107
[71] J.R. Zimmerman and W.E. Brittin. Nuclear magnetic resonance studies in multiplephase systems: lifetime of a water molecule in an adsorbing phase on silica gel. J.Phys. Chem., 61:1328–1333, 1957.
[72] Hao Ju, A.C. Sagle, B.D. Freeman, J.I. Mardel, and A.J. Hill. Characterization ofsodium chloride and water transport in crosslinked poly(ethylene oxide) hydrogels.Journal of Membrane Science, 358:131–141, 2010.
[73] P. Atkins and J. De Paula. Atkins’ Physical Chemistry, chapter 5. W. H. Freeman,8 edition, 2006.
[74] L.G.J. van der Ven, R.T.M. Leijzer, K.J. van Den Berg, P. Ganguli, and R. La-gendijk. Interactions between basecoats and clearcoats in car refinish systems.Progress in Organic Coatings, 58:117–121, 2007.
[75] Ernesto O. Timmermann. A B. E. T.-like three sorption stage isotherm. Journal ofthe Chemical Society, Faraday Transactions 1, 85:1631, 1989.
[76] M. Monleon Pradas, M. Salmeron Sanchez, G. Gallego Ferrer, and J.L. GomezRibelles. Thermodynamics and statistical mechanics of multilayer adsorption. TheJournal of chemical physics, 121:8524–31, 2004.
[77] C. Perez-Alonso, C.I. Beristain, C. Lobato-Calleros, M.E. Rodrıguez-Huezo, andE.J. Vernon-Carter. Thermodynamic analysis of the sorption isotherms of pure andblended carbohydrate polymers. Journal of Food Engineering, 77:753–760, 2006.
[78] H. Feng. Modeling of vapor sorption in glassy polymers using a new dual modesorption model based on multilayer sorption theory. Polymer, 48:2988–3002, 2007.
[79] D. Kockott. Natural and artificial weathering of polymers. Polymer Degradationand Stability, 25:181–208, 1989.
[80] L.F.E. Jacques. Accelerated and outdoor/natural exposure testing of coatings.Progress in polymer science, 25:1337–1362, 2000.
[81] C. Carfagna, P. Mastronardi, and L. Nicolais. Hygrothermal ageing of epoxy basedcoatings. Journal of Materials Science, 17:2239–2244, 1982.
[82] J.W. Martin, T. Nguyen, E. Byrd, B. Dickens, and N. Embree. Relating laboratoryand outdoor exposures of acrylic melamine coatings:: I. Cumulative damage modeland laboratory exposure apparatus. Polymer degradation and stability, 75:193–210, 2002.
[83] T. Nguyen, J.W. Martin, E. Byrd, and N. Embree. Relating laboratory and outdoorexposure of coatings: II. Journal of Coatings Technology, 74:65–80, 2002.
107
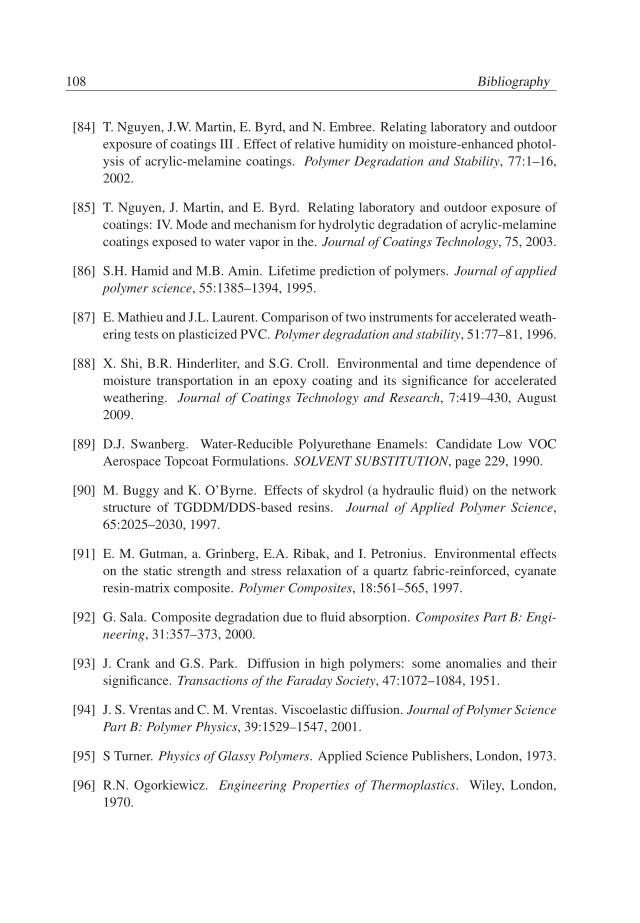
108 Bibliography
[84] T. Nguyen, J.W. Martin, E. Byrd, and N. Embree. Relating laboratory and outdoorexposure of coatings III . Effect of relative humidity on moisture-enhanced photol-ysis of acrylic-melamine coatings. Polymer Degradation and Stability, 77:1–16,2002.
[85] T. Nguyen, J. Martin, and E. Byrd. Relating laboratory and outdoor exposure ofcoatings: IV. Mode and mechanism for hydrolytic degradation of acrylic-melaminecoatings exposed to water vapor in the. Journal of Coatings Technology, 75, 2003.
[86] S.H. Hamid and M.B. Amin. Lifetime prediction of polymers. Journal of appliedpolymer science, 55:1385–1394, 1995.
[87] E. Mathieu and J.L. Laurent. Comparison of two instruments for accelerated weath-ering tests on plasticized PVC. Polymer degradation and stability, 51:77–81, 1996.
[88] X. Shi, B.R. Hinderliter, and S.G. Croll. Environmental and time dependence ofmoisture transportation in an epoxy coating and its significance for acceleratedweathering. Journal of Coatings Technology and Research, 7:419–430, August2009.
[89] D.J. Swanberg. Water-Reducible Polyurethane Enamels: Candidate Low VOCAerospace Topcoat Formulations. SOLVENT SUBSTITUTION, page 229, 1990.
[90] M. Buggy and K. O’Byrne. Effects of skydrol (a hydraulic fluid) on the networkstructure of TGDDM/DDS-based resins. Journal of Applied Polymer Science,65:2025–2030, 1997.
[91] E. M. Gutman, a. Grinberg, E.A. Ribak, and I. Petronius. Environmental effectson the static strength and stress relaxation of a quartz fabric-reinforced, cyanateresin-matrix composite. Polymer Composites, 18:561–565, 1997.
[92] G. Sala. Composite degradation due to fluid absorption. Composites Part B: Engi-neering, 31:357–373, 2000.
[93] J. Crank and G.S. Park. Diffusion in high polymers: some anomalies and theirsignificance. Transactions of the Faraday Society, 47:1072–1084, 1951.
[94] J. S. Vrentas and C. M. Vrentas. Viscoelastic diffusion. Journal of Polymer SciencePart B: Polymer Physics, 39:1529–1547, 2001.
[95] S Turner. Physics of Glassy Polymers. Applied Science Publishers, London, 1973.
[96] R.N. Ogorkiewicz. Engineering Properties of Thermoplastics. Wiley, London,1970.
108
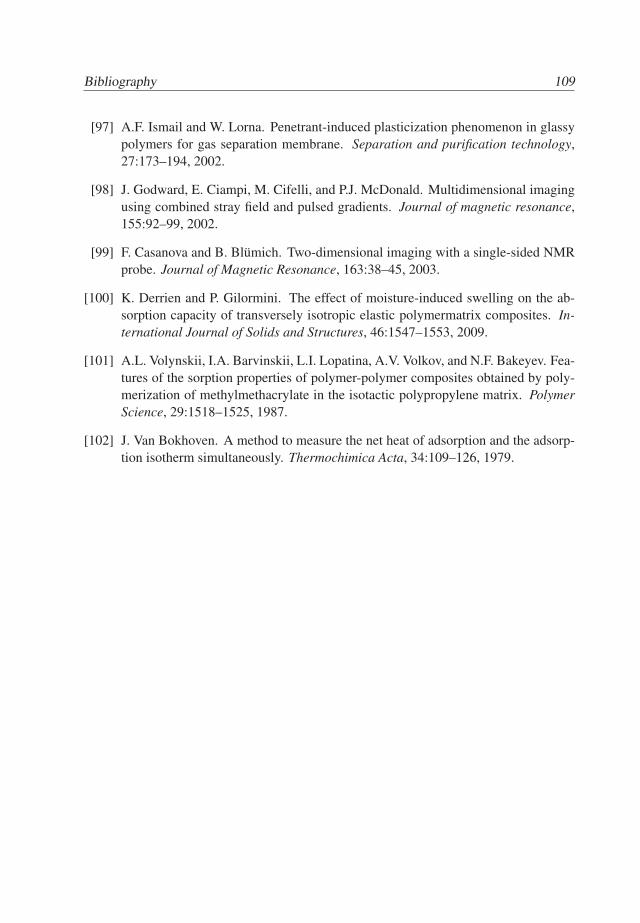
Bibliography 109
[97] A.F. Ismail and W. Lorna. Penetrant-induced plasticization phenomenon in glassypolymers for gas separation membrane. Separation and purification technology,27:173–194, 2002.
[98] J. Godward, E. Ciampi, M. Cifelli, and P.J. McDonald. Multidimensional imagingusing combined stray field and pulsed gradients. Journal of magnetic resonance,155:92–99, 2002.
[99] F. Casanova and B. Blumich. Two-dimensional imaging with a single-sided NMRprobe. Journal of Magnetic Resonance, 163:38–45, 2003.
[100] K. Derrien and P. Gilormini. The effect of moisture-induced swelling on the ab-sorption capacity of transversely isotropic elastic polymermatrix composites. In-ternational Journal of Solids and Structures, 46:1547–1553, 2009.
[101] A.L. Volynskii, I.A. Barvinskii, L.I. Lopatina, A.V. Volkov, and N.F. Bakeyev. Fea-tures of the sorption properties of polymer-polymer composites obtained by poly-merization of methylmethacrylate in the isotactic polypropylene matrix. PolymerScience, 29:1518–1525, 1987.
[102] J. Van Bokhoven. A method to measure the net heat of adsorption and the adsorp-tion isotherm simultaneously. Thermochimica Acta, 34:109–126, 1979.
109

110 Bibliography
110
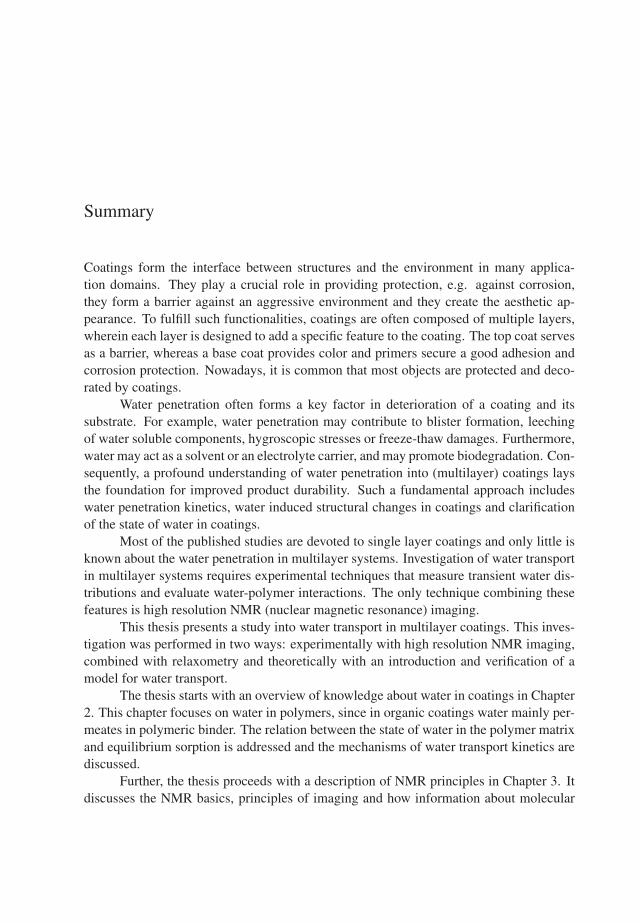
Summary
Coatings form the interface between structures and the environment in many applica-tion domains. They play a crucial role in providing protection, e.g. against corrosion,they form a barrier against an aggressive environment and they create the aesthetic ap-pearance. To fulfill such functionalities, coatings are often composed of multiple layers,wherein each layer is designed to add a specific feature to the coating. The top coat servesas a barrier, whereas a base coat provides color and primers secure a good adhesion andcorrosion protection. Nowadays, it is common that most objects are protected and deco-rated by coatings.
Water penetration often forms a key factor in deterioration of a coating and itssubstrate. For example, water penetration may contribute to blister formation, leechingof water soluble components, hygroscopic stresses or freeze-thaw damages. Furthermore,water may act as a solvent or an electrolyte carrier, and may promote biodegradation. Con-sequently, a profound understanding of water penetration into (multilayer) coatings laysthe foundation for improved product durability. Such a fundamental approach includeswater penetration kinetics, water induced structural changes in coatings and clarificationof the state of water in coatings.
Most of the published studies are devoted to single layer coatings and only little isknown about the water penetration in multilayer systems. Investigation of water transportin multilayer systems requires experimental techniques that measure transient water dis-tributions and evaluate water-polymer interactions. The only technique combining thesefeatures is high resolution NMR (nuclear magnetic resonance) imaging.
This thesis presents a study into water transport in multilayer coatings. This inves-tigation was performed in two ways: experimentally with high resolution NMR imaging,combined with relaxometry and theoretically with an introduction and verification of amodel for water transport.
The thesis starts with an overview of knowledge about water in coatings in Chapter2. This chapter focuses on water in polymers, since in organic coatings water mainly per-meates in polymeric binder. The relation between the state of water in the polymer matrixand equilibrium sorption is addressed and the mechanisms of water transport kinetics arediscussed.
Further, the thesis proceeds with a description of NMR principles in Chapter 3. Itdiscusses the NMR basics, principles of imaging and how information about molecular
111
112 Summary
motions of the measured species is present in the NMR signal.The key results of the study are presented in the Chapters 4-8.First, water uptake was studied in two-layer systems consisting of hydrophilic base
coats and hydrophobic top coats. The base coat consisted of acrylic, polyurethane andpigment particles and the formulation included a polymeric pigment dispersant.
Chapter 4 presents the results of visualization of water transport in the two-layeredsystems on the basis of high resolution NMR imaging. The water transport rate in thestudied systems appeared to be barrier limited. Mainly the base coat absorbed water,where it quickly redistributed. The swelling of the base coat showed to be linearly relatedwith the absorbed water quantity.
Further, Chapter 5 presents the results of a relaxation analysis of the NMR signal,which was introduced to identify water and polymeric phases in the base coat. Polymericdispersant plasticization was observed. This polymeric dispersant appeared to be a majorcontributor to the water uptake capacity of the base coat. It was found with NMR diffu-sometry that high water mobility occurred under saturated conditions, whereas in partiallysaturated systems water mobility decreased and bonding to the polymer played a key role.
In Chapter 6 a theoretical model was formulated for the transport in multilayercoatings, composed of a hydrophobic top coat and a hydrophilic base coat. This modelbasically assumed instantaneous equilibration of water in the base coat and Fickian watertransport in the top coat. According to the model, the sorption isotherm of the base coatis the driving force of the process and the top coat permeability to water determines thetimescale of transport. The asymmetry of the observed uptake/drying rates appeared to bedue to the non-linear sorption isotherm of the base coat. Furthermore, top coats appliedon base coats showed a higher permeability than free films and water uptake capacitiesof base coats decreased, when thicker top coats were applied. The ability of the modelto predict water transport using the base coat sorption isotherm and the top coat perme-ability was validated experimentally. Practically, it is sufficient to measure the base coatsorption isotherm and the top coat permeability to understand water transport. Thisenables design of a simple and efficient procedure to test water resistance of this typeof coatings. Such procedure will include only basic and cost-efficient equipment, likebalances for gravimetric measurements of sorption isotherms and permeability.
In the next step, the model was used for a theoretical investigation of the response ofmultilayer coatings to relative humidity fluctuations, which is presented in Chapter 7. Thetheoretical investigation showed that in most of the considered systems the response timeis in the order of days for high humidities and has values of a few hours at low humidities.The response time is determined by the product of the timescale of penetration through thetop coat and the differential solubility of the base coat. This means that most two-layerpolymeric base coat/top coat systems with hydrophilic base coats are relatively inert tomost humidity fluctuations, as the response in terms of water content will be damped. Asaccelerated and artificial weathering tests include only humidity fluctuations with typical
112

Summary 113
timescales less than a day, this raises concerns if these tests can be compared to naturalmoisture exposure. Finally, the thesis addresses migration of plasticizer into a top coat.It was found that stress relaxation results in non-Fickian kinetics of the uptake process.The plasticizer, which is tributyl phosphate, causes a steep increase in the permeabilityof the film and may cause degradation of mechanical properties of the coating. This im-plies that, practically, that tributyl phosphate (the main component of common aerospacehydraulic fluids) makes multilayer protective coatings more permeable and causes signif-icant stresses in the system.
113

114 Summary
114
List of publications
• V. Baukh, H.P. Huinink, O.C.G. Adan, S.J.F. Erich, and L.G.J. van der Ven. NMRImaging of Water Uptake in Multilayer Polymeric Films: Stressing the Role ofMechanical Stress. Macromolecules, 43:3882-3889, 2010.
• V. Baukh, H.P. Huinink, O.C.G. Adan, S.J.F. Erich, and L.G.J. van der Ven. Water-Polymer Interaction during Water Uptake. Macromolecules, 44:4863-4871, 2011.
• H. Zhu, H.P. Huinink, S.J.F. Erich, V. Baukh, O.C.G. Adan, K. Kopinga. Highspatial resolution NMR imaging of polymer layers on metallic substrates. Journalof Magnetic Resonance, 214:227–236
• V. Baukh, H.P. Huinink, O.C.G. Adan, S.J.F. Erich and L. van der Ven. PredictingWater Transport in Multilayer Coatingssubmitted to Macromolecules
• V. Baukh, H.P. Huinink, O.C.G. Adan, S.J.F. Erich and L. van der Ven. Influenceof Water Activity Fluctuations on Multilayer Coatingsin preparation
• V. Baukh, H.P. Huinink, O.C.G. Adan, S.J.F. Erich and L. van der Ven. Plasticizerin Top Coats: Influence of Stress Relaxation on Transportin preparation
115

116 List of publications
116
Dankwoord
Tackling the challenges related to this PhD project has required significant collaborativeefforts. First of all, I want to praise and thank the God for making these efforts successful.
Henk, thank you for your supervision. Your example has helped me to make a bigstep forward towards being a scientist and a better person.
Olaf, I appreciate your supervision and guidance. Each meeting with you had ahuge impact on my perception of things, not only related to the work itself. Thank you.
Peter McDonald, I am grateful for your commitment as my second supervisor. Dis-cussions with you and your feedback were very important for me.
Bart, thank you for your assistance and guidance and showing good examples.From the beginning of my PhD you became a role model for me as an innovator in scienceand technology.
Leo, I thank you for your contribution to my study during our meetings. Further-more, your efforts as a representative of and contact in AkzoNobel have allowed tacklingmany problems I met.
Klaas, we were rarely interacting during the project, but those few interactions hasreally helped to reach certain milestones. I would like to express my gratitudes to you.
Leo, sometimes I dropped in your room, getting valuable advices, when I had ques-tions. Thank you for this and your questions during my reports at Group Meetings.
I also thank my committee members, Bert de With, Hans de Wit and Manuel Mon-leon Pradas for devoting their time and efforts to reading and evaluating my thesis and foragreeing to participate in my defence.
Peter Geurink, thank you for your invaluable help and efforts, which helped to initi-ate this project, your participation in meetings and discussions and your work to promoteour collaborative efforts.
Hans, your commitment and enthusiasm in helping me were always amazing. Manythings would have been more difficult, if even possible to achieve, without your assistance.Thank you.
Jef, thank you for your help with electronic equipment. Furthermore, I am gratefulfor your always optimistic attitude - it really inspires.
I want to thank Taco Scherer and Ruud van Overbeek from AkzoNobel Automotive& Aerospace Coatings for the useful discussions and Kenny Raghosing and Fred Rousfrom AkzoNobel Automotive & Aerospace Coatings for samples preparation. Also I
117
118 Acknowledgements
thank Brenda Rossenaar from AkzoNobel RD&I for the TEM study.Erik, Kristel, thank you for your work related to the Skydrol study. What have you
done are milestones in my workVica, thank you for our discussions and interesting conversations. Tamerlan, our
friendship is very important for me. Thank you for this and your support.Gijs, Thank you for your advices and discussions, which I was getting from the
beginning. They helped me to pave my way.Nico, thank you for the discussions, which we had almost daily. They were really
helpful.Pim, thank you for our discussions and conversations. I appreciate your motivation
in your work, it is a good example for me.Kashif, I want to express my gratitude for the conversations we had. We discussed
a lot of interesting topics.Mirjam, thank you for our discussions, which have helped me to broaden my scope.Sonia, I am grateful for our discussions. Also you are a good example that people
should not hesitate to ask questions. Furthermore, you are a nice officemate.Michiel, thank you for our discussions and points you have made.Haijin, thank you for our discussions. Your background in polymers also has helped
me to understand many things.Marlouke, Ria, your support and help were always making things smooth for me.
Thank you for this.Frank, Ginny, Han, Henk and Marius, I am thankful for your help in building criti-
cal components of my equipment.I thank Rienk Hettema, Anthonie Stuivers, Epco and Remco Kopps for the discus-
sions during our project meetings.Jos Laven, Catarina Esteves, thank you for your help with Infrared Spectroscopy
and the discussions.Jeannette, thank you for your assistance in communications with Olaf.I am thankful TNO, TU/e and AkzoNobel Automotive and Aerospace Coatings for
sponsoring this project and collaboration.I am very thankful to my wife Gyulnara, my parents and mother and other members
of my family for their support. Gyulnara, my gratitudes for your patience during theevenings I was working on this thesis. It would have been hard for me to complete thisjob without your support.
All others I have forgot to mention in these acknowledgements, thank you for yoursupport and assistance.
118
Curriculum vitae
Viktor Baukh was born on 10th of March, 1983, in Komsomolsk on Amur, Russia. Af-ter the graduation in 2000 from Secondary School 25 in Odessa, Ukraine, he started hisstudy in Department of Physics in Odessa National University, Ukraine. In 2005 he hasobtained Master degree in theoretical physics under supervision of Alexander Zhuk. Dur-ing the master studentship he was performing a theoretical study of accelerated expansionof multidimensional universe with compacticified extra dimensions. In 2007 Viktor hasstarted a PhD project at the Eindhoven University of Technology in the group Transportin Permeable Media. The PhD project aimed to investigate a water transport phenomenonin multilayer coatings.
119


![Surface and Coatings Technology Volume 251 issue 2014 [doi 10.1016_j.surfcoat.2014.03.049] Schmitt, Michael P.; Rai, Amarendra K.; Bhattacharya, Rabi; Zhu, -- “Multilayer thermal](https://img.pdfslide.us/doc/110x75/55cf8569550346484b8db1ac/surface-and-coatings-technology-volume-251-issue-2014-doi-101016jsurfcoat201403049.jpg)