Embed Size (px)
Citation preview
Water Stress Increases Winter Injury - Leucaena leucocephala
0
20
40
60
80
100
1 2 3 4 5 6 7 8 9 10
Distance from runoff water (m)
Dieback (% of maximum)

Tree nutrition / vs Winter Injury
0
20
40
60
80
100
5 10 20 30
2.5/
.17
2.5/
.11
2.2/
.17
2.2/
.11
1.9/
.17
1.9/
.11
Winter Injury (%)
Pecan Yield (kg/tree)%
N /%P

Cold-hardiness of Lagerstroemia hybrids/Johnson et al. SNA Res. Conf. 45:467:2000
-25
-20
-15
-10
-5
0
Oct Nov Dec Jan Feb Mar Apr
'Acoma'-AL'Acoma'-DC
Low
est
Su
rviv
al T
emp
erat
ure
(C
)
-25
-20
-15
-10
-5
0
Oct Nov Dec Jan Feb Mar Apr
'Comanche'-AL'Comanche'-DC
AL = 32o N. latitudeDC = 37o N. latitude

Root growth after planting/ Barnett 1986
21 wks
9 wks
0 wks
Privet12 24 36 cm
15 cm
30
45
0
2
4
6
8
10
12
0 5 10 15 20 25
Weeks after Planting
Days without Water
21 wks
9 wks
0 wks
12 24 36 cm
15 cm
30
45
Well-watered
Droughted

Compaction increases soil strength &
decreases root growth Brais SSSAJ 65:1263:2001
60% Reduction 60% Reduction
No Growth
0
1
2
3
4
5
6
0 5 10 15 20
2.5 cm
5 cm
10 cm
0
1
2
3
4
5
6
0 5 10 15 20
2.5 cm
5 cm
10 cm
Number of tractor passes
Soil Strength (MPa) Soil Strength (MPa)
Fine-textured soil Coarse-textured soil
MPa = 5.58BD - 3.24
R 2 = 0.66
0
1
2
3
4
5
6
0.7 0.9 1.1 1.3 1.5
FineCoarse
BD (g/cc)
Strength (MPa)
No Growth

A History of Tree Planting in LC
• Timeline– 1950s Mulberry– 1960s Ash– 1970s Afghan pine– 1980s Oaks– 1990s Chilean mesquite
– 2000s Chitalpa– 2010s ??
• Issues– Allergenic, water hog– 1994-itis? Emerald ash borer?– Alleppo pine mite– Sudden Oak Death, Oak wilt?– Brittle branches, toppling– Frost/Drought cracks– “Plant it & they will come!!’
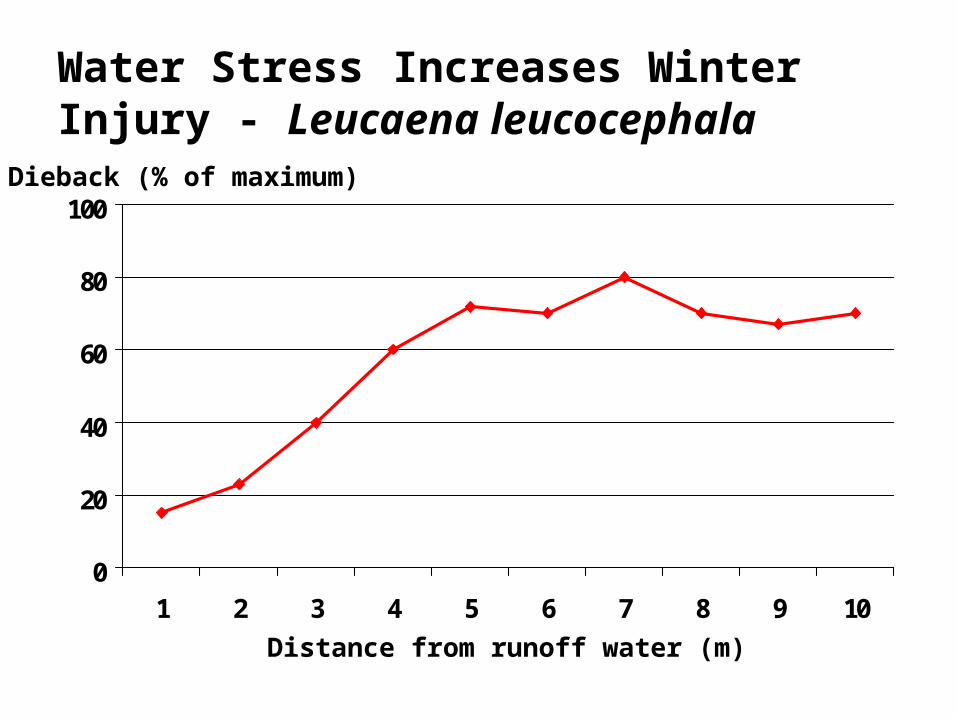
Bark Beetles
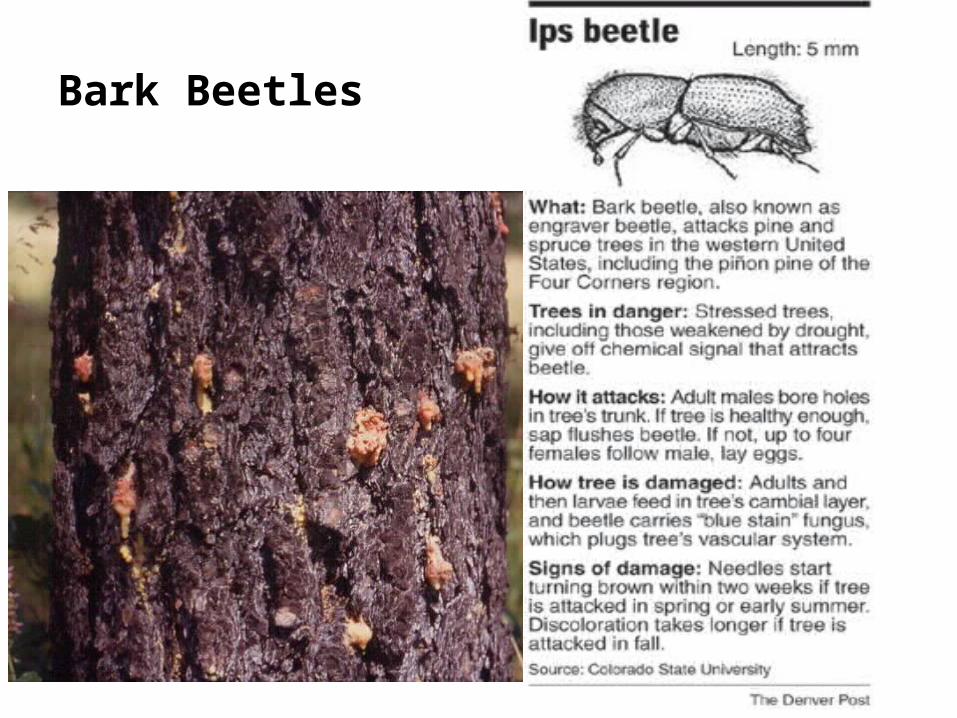
Apple
Mimosa
-14
-12
-10
-8
-6
-4
-2
0
2
4
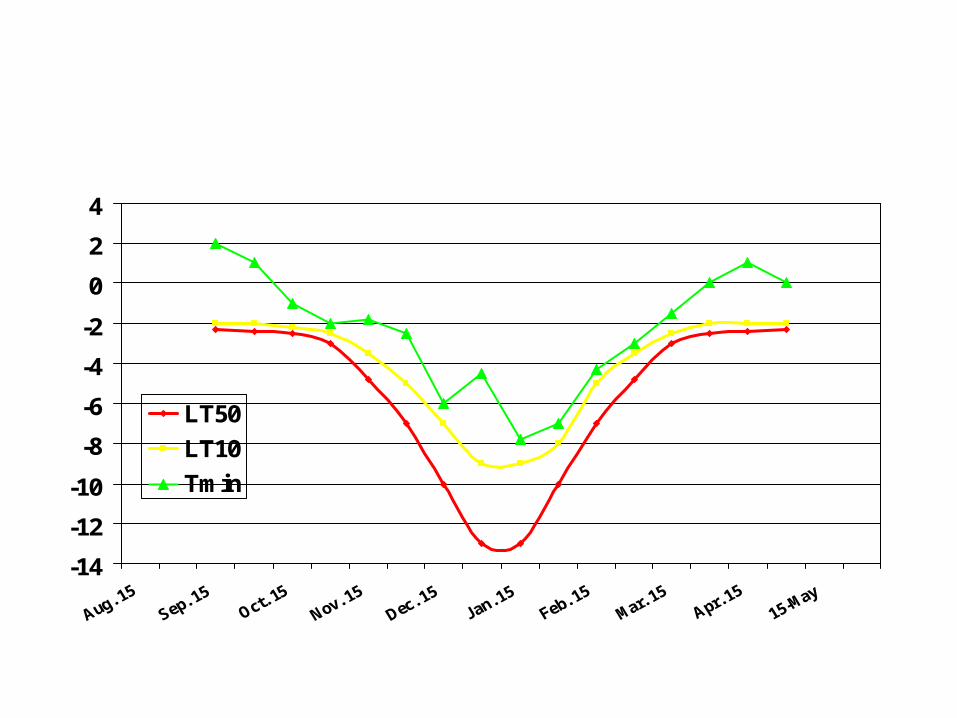
LT50
LT10
Tmin

-14
-12
-10
-8
-6
-4
-2
0
2
4
LT50
LT10
Tmin

-14
-12
-10
-8
-6
-4
-2
0
2
4
LT50
LT10
Tmin
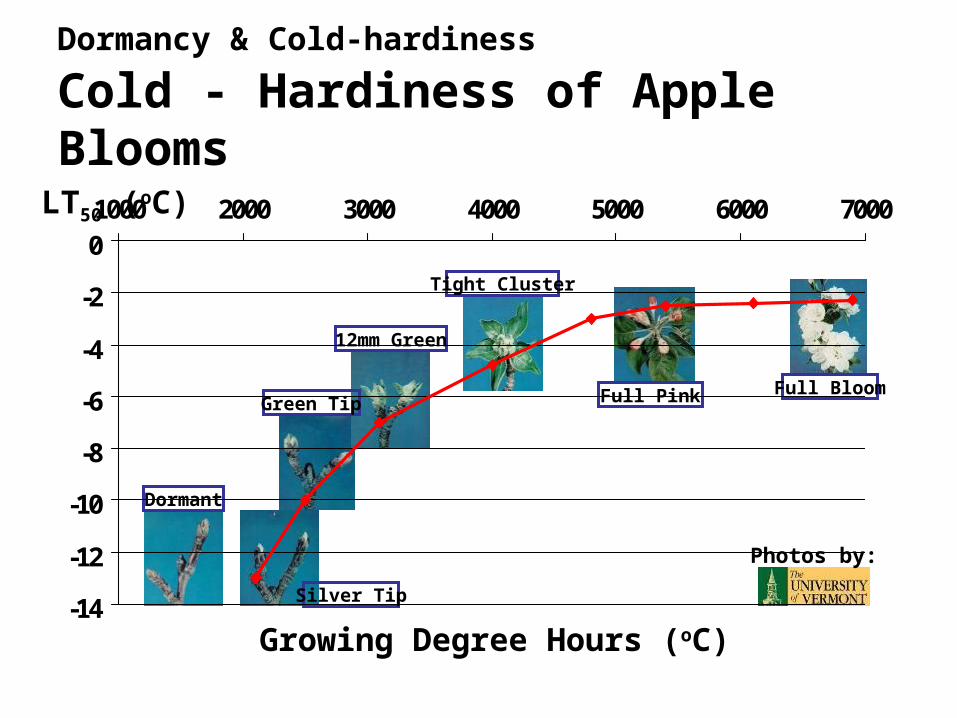
Dormancy & Cold-hardiness Cold - Hardiness of Apple Blooms
Dormant
Silver Tip
12mm Green
Green Tip
Tight Cluster
Full Pink Full Bloom
Growing Degree Hours (oC)
LT50 (oC)
Photos by:
-14
-12
-10
-8
-6
-4
-2
01000 2000 3000 4000 5000 6000 7000
-14
-12
-10
-8
-6
-4
-2
01000 2000 3000 4000 5000 6000 7000 8000
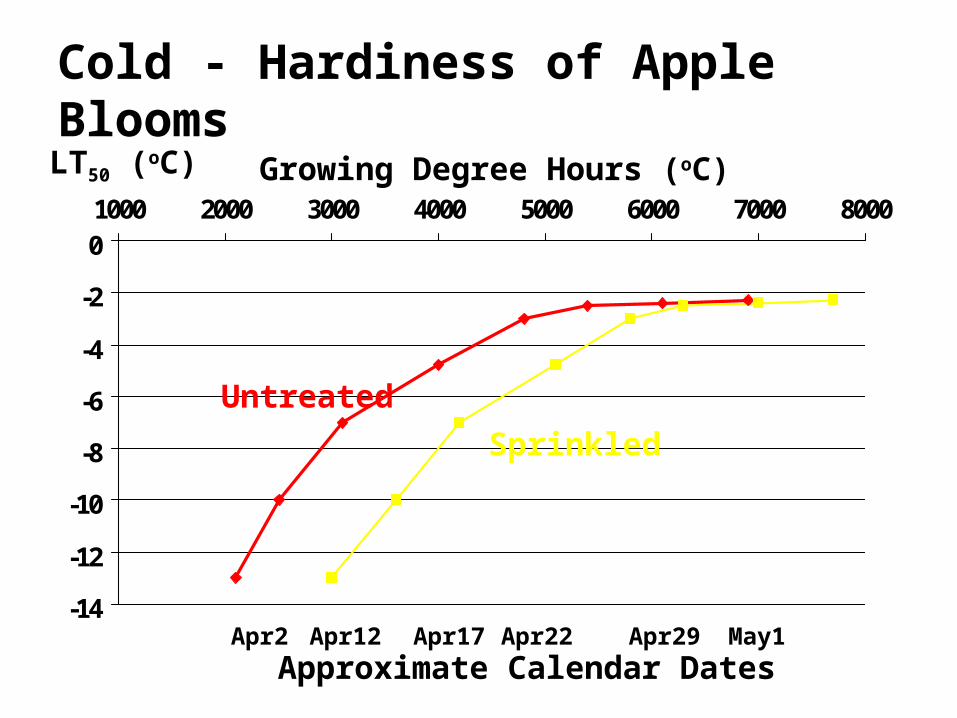
Cold - Hardiness of Apple Blooms
Growing Degree Hours (oC)LT50 (oC)
Apr12 Apr17 Apr22 Apr29Apr2 May1
Approximate Calendar Dates
Untreated
Sprinkled
Rules of Thumb
• A 1oF increase, increases ET by 1%• To reduce water use—reduce canopy coverage
– Under nonstressed conditions, a full canopy uses the same amount of water, i.e. Kentucky bluegrass = pecan = mesquite, etc.
– Management issues: growing season, level of stress tolerance
• Rain is a good thing—don’t waste it! – Clean irrigation water (300 mg/L) adds about 1 ton of salt per
acre per year. Plants will use less than ½ of that.

Dormancy & Cold-hardiness Cold-hardiness of Lagerstroemia hybrids/Johnson et al. SNA Res. Conf. 45:467:2000
-25
-20
-15
-10
-5
0
Oct Nov Dec Jan Feb Mar Apr
'Acoma'-AL
'Comanche'-AL
Low
est
Su
rviv
al T
emp
erat
ure
(C
)
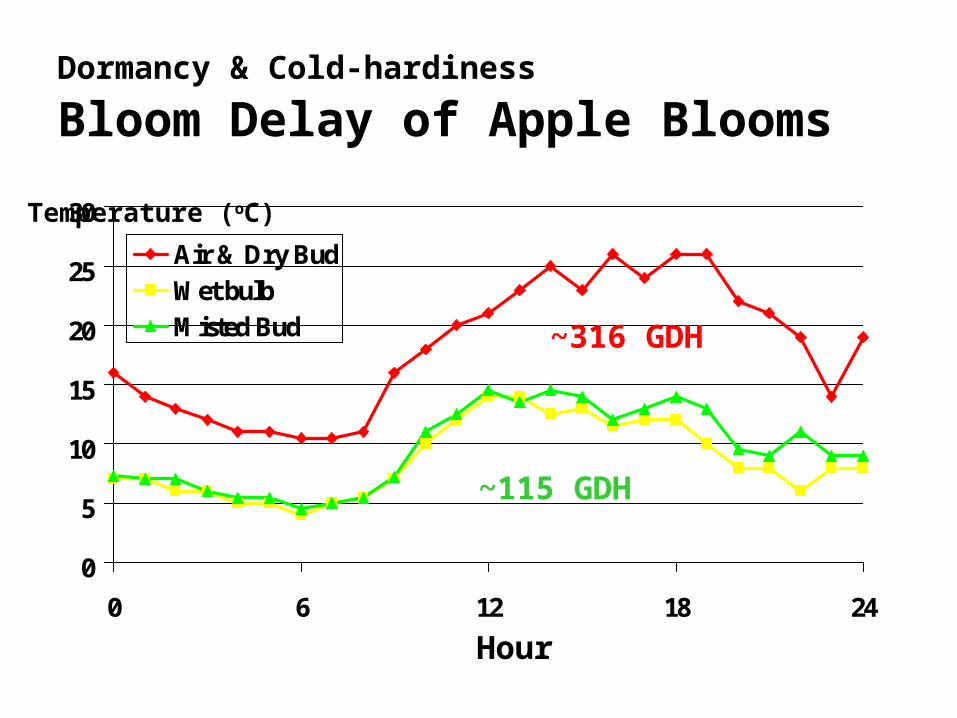
Dormancy & Cold-hardiness Bloom Delay of Apple Blooms
0
5
10
15
20
25
30
0 6 12 18 24
Air & Dry BudWet bulbMisted Bud
Hour
Temperature (oC)
~115 GDH
~316 GDH

Frost Protection Requires Little Water
-2
0
2
4
6
8
10
12
0 1 2 3 4 5 6 7 8 9 10
103 L/min/ha495 L/min/ha
Time of Day (hr)
Bud Temperature (oC)
4 to 20 mm/frost event

What’s Killing Your Trees
Factors Affecting Acclimation-Size
Spring• Buds = -3o
• Cambium = -4o
• Roots = -4o
• Seedling = -3o
• Germinant = -2o
Winter• Buds = -25o
• Cambium = -50o
• Roots = -10o
• Seedling = -30o
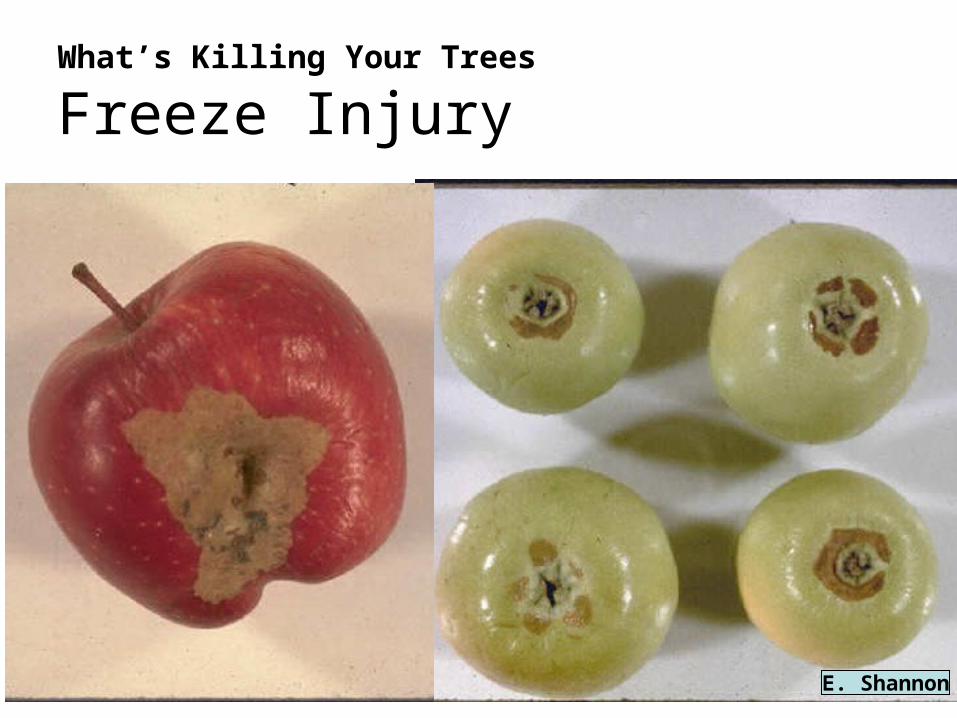
What’s Killing Your Trees
Freeze Injury
E. Shannon

What’s Killing Your Trees
Freeze Injury
Apple
PecanPecan
E. Shannon
Eucalyptus
FreezeRing
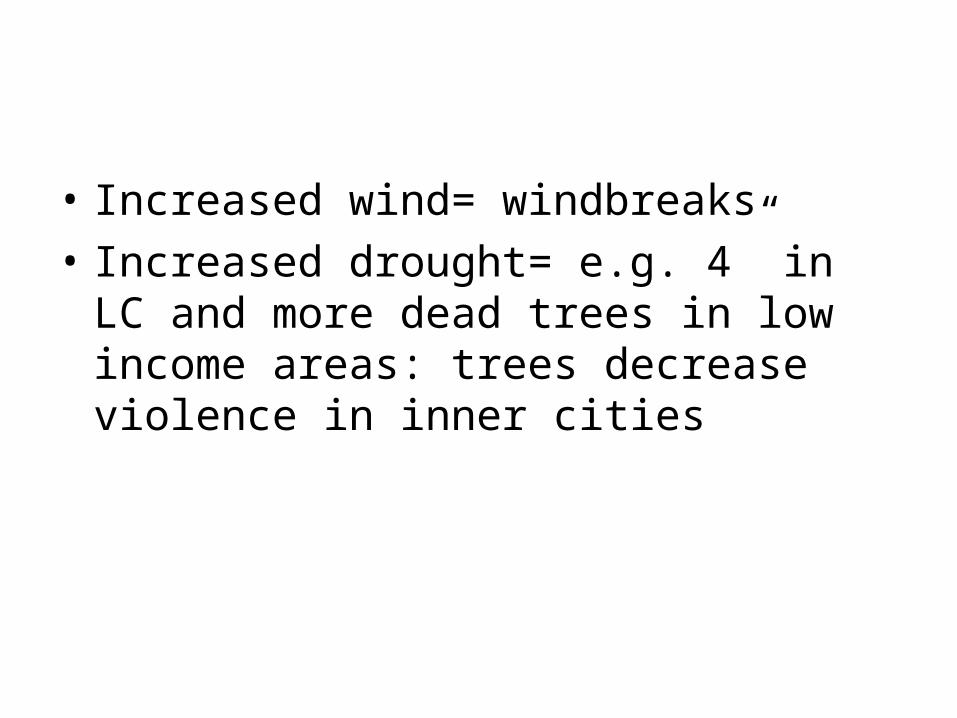
• Increased wind= windbreaks
• Increased drought= e.g. 4” in LC and more dead trees in low income areas: trees decrease violence in inner cities

J. Mexal
What is wrong with this picture?

Pine Issues in Las Cruces
• Abiotic– Physcial Factors
• Temperature• Moisture
• Biotic– Biological
• Disease• Insect
• DPD- human
Not Found in NM landscapes—Yet?•White pine blister rust•Sudden oak death (P. ramorum)•Diplodia blight•Pine knot nematode
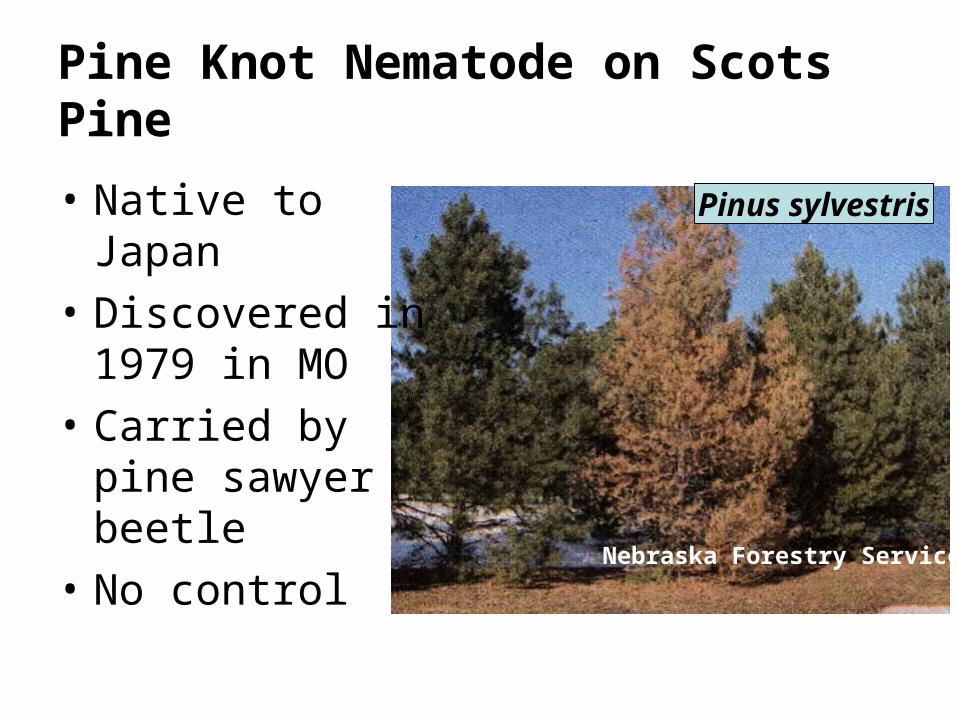
Nebraska Forestry Service
Pinus sylvestris
Pine Knot Nematode on Scots Pine
• Native to Japan
• Discovered in 1979 in MO
• Carried by pine sawyer beetle
• No control

Dothistroma pini (Red band needle blight) [Small dark brown fruiting bodies]
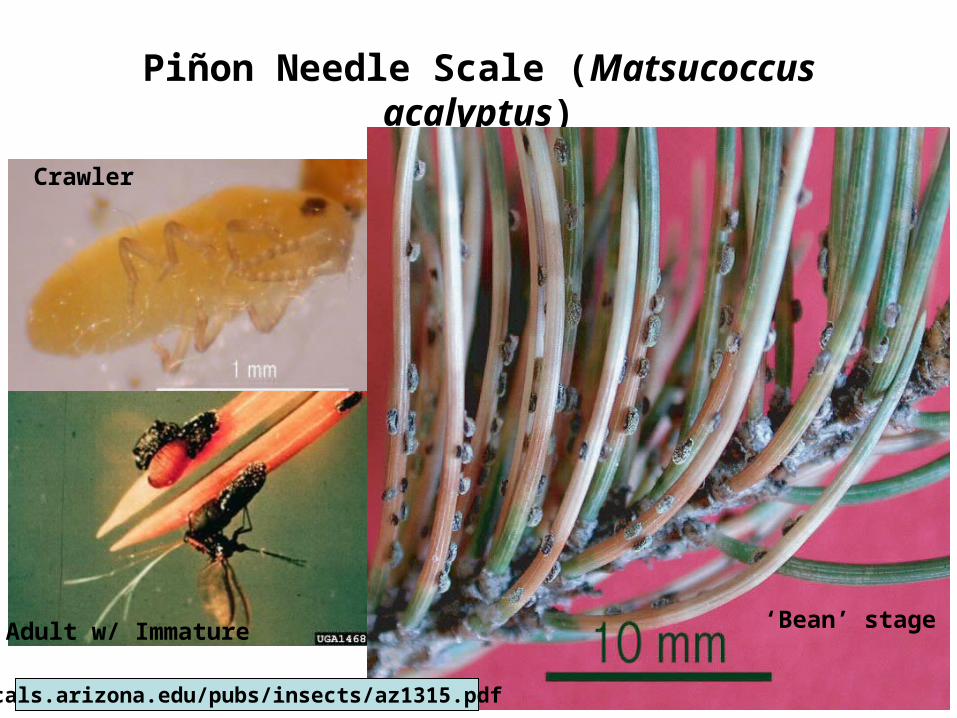
Piñon Needle Scale (Matsucoccus acalyptus)
Crawler
Adult w/ Immature ‘Bean’ stage
cals.arizona.edu/pubs/insects/az1315.pdf

E. Shannon
Nantucket Pine Tipmoth
This is a young tree affliction (<10 ft tall)

Phytopthora pinifolia on Pinus radiata / Michael J. Wingfield
http://www.fabinet.up.ac.za/tpcp/pinifolia

0
20
40
60
80
100
6000 6500 7000 7500 8000 8500
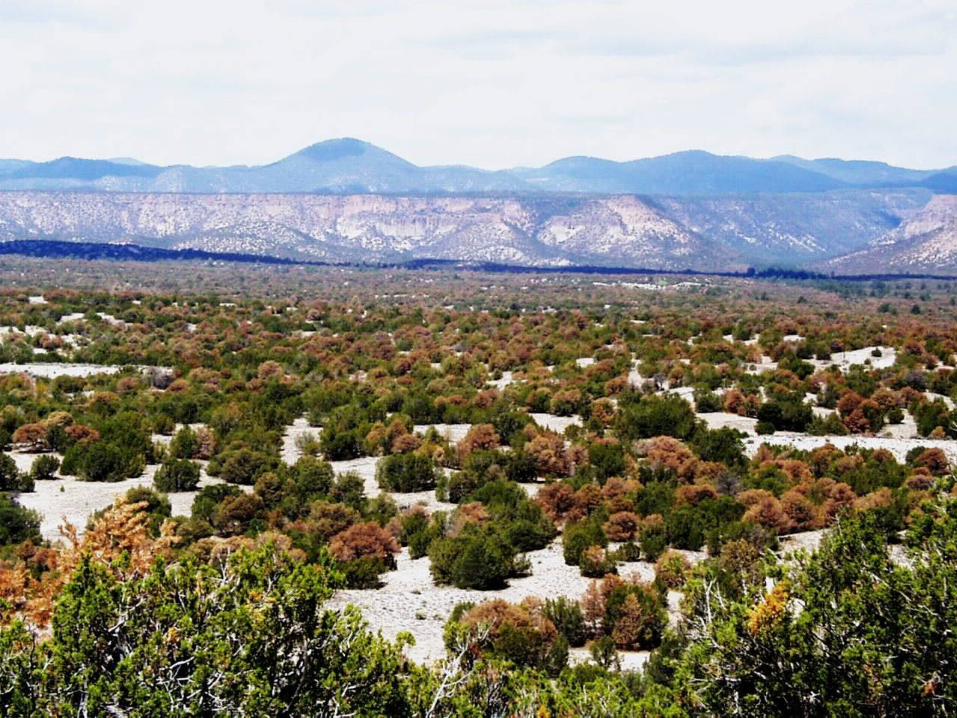
Elevation (ft)
Piñon Mortality (%)Stocking (% Piñon )
Piñon is moving up the hill/ after Ryerson 2006

0
20
40
60
80
100
6000 6500 7000 7500 8000 8500


What’s Killing Your Trees
DPD =
N. Goldberg


Climate Change in the SW USYear Arizona New MexicoAZ - C NM - C1970 58.9 52.3 14.9 11.31971 58.6 52.2 14.8 11.21972 58.7 52.3 14.8 11.31973 59.1 52.7 15.1 11.51974 59 52.6 15.0 11.41975 59.5 52.8 15.3 11.61976 60.2 53.5 15.7 11.91977 60 53.4 15.6 11.91978 59.9 53.2 15.5 11.81979 60.1 53.3 15.6 11.81980 59.9 53.1 15.5 11.71981 60.2 53 15.7 11.71982 60.5 53 15.8 11.71983 60.6 53.2 15.9 11.81984 60.4 53.3 15.8 11.81985 60.5 53.1 15.8 11.71986 60.4 53.1 15.8 11.71987 60.7 53.2 15.9 11.81988 61.4 53.4 16.3 11.91989 61.5 53.9 16.4 12.21990 61.4 54 16.3 12.21991 61.4 54.2 16.3 12.31992 61.5 54.1 16.4 12.31993 61.4 54.3 16.3 12.41994 61.5 54.2 16.4 12.31995 62 54.5 16.7 12.5
y = 0.067x - 116.46
R2 = 0.94
y = 0.044x - 75.386
R2 = 0.839
0
10
20
30
40
50
60
70
1960 1970 1980 1990 2000
Arizona
New Mexico
AZ - C
NM - C
Linear (AZ - C)
Linear (NM - C)
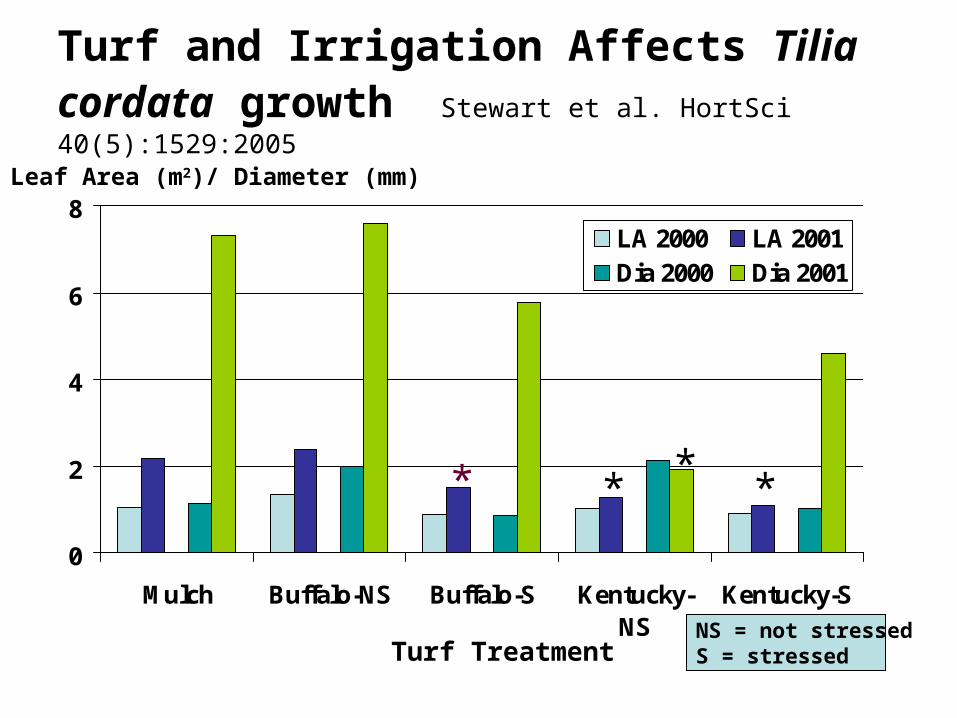
Turf and Irrigation Affects Tilia cordata growth Stewart et al. HortSci 40(5):1529:2005
0
2
4
6
8
Mulch Buffalo-NS Buffalo-S Kentucky-NS
Kentucky-S
LA 2000 LA 2001Dia 2000 Dia 2001
* * * *
Leaf Area (m2)/ Diameter (mm)
Turf TreatmentNS = not stressedS = stressed

Global Temperature

0
20
40
60
80
100
2000s 1990s 1980s 1970s 1960s 1950s 1940s 1930s 1920s

Change in vegetation with climate change/ Aber et al. Biosci. 51(9):735:2001
Canadian Global Coupled ModelHadley Centre for Climate Prediction
ΔT = 2.8C ΔT = 5.2C

-18
-16
-14
-12
-10
-8
-6
-4
-2
0
LT50
LT10
LT90
What’s Killing Your Trees
Cold - Hardiness of Apple Blooms
Approximate Calendar Date
LT50 (oC)
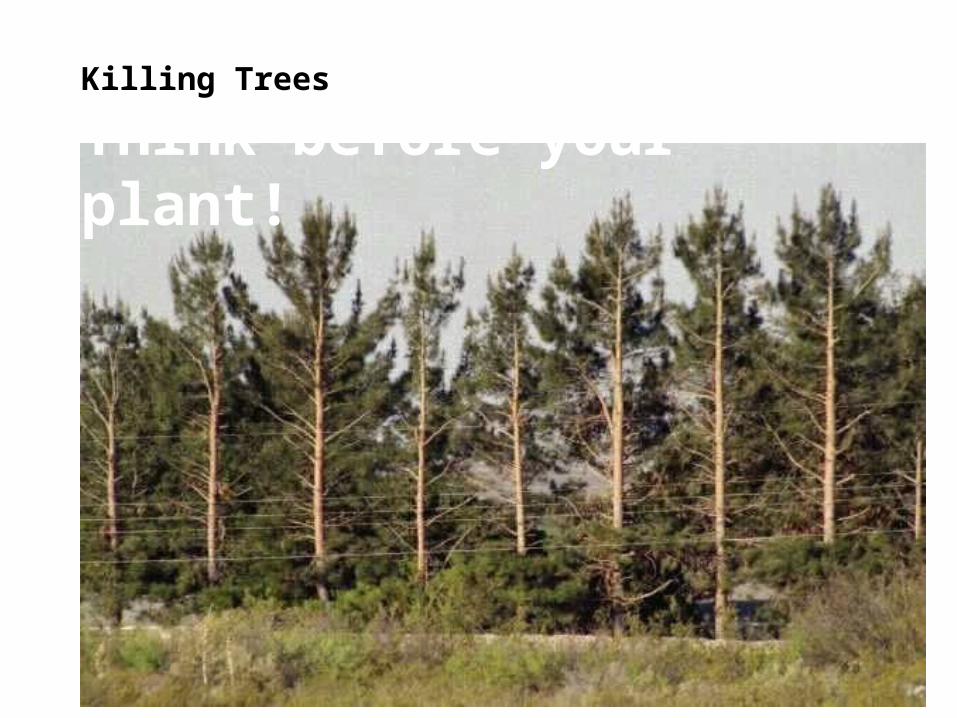
Killing Trees
Think before your plant!