Embed Size (px)
Citation preview
Water Services DepartmentArizona Mexico Commission Bi-National Meeting
March 9-11, 2008
David CavazosDeputy City Manager
Water Services DepartmentArizona Mexico Commission Bi-National Meeting
March 9-11, 2008
David CavazosDeputy City Manager
City Of PhoenixCity Of Phoenix
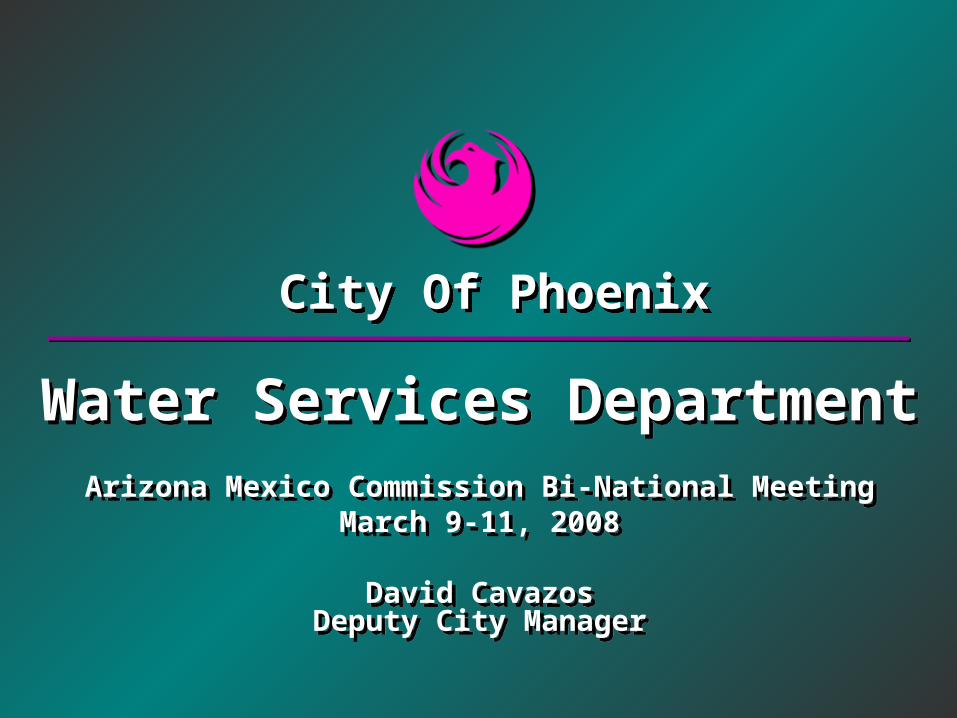
City of Phoenix OverviewCity of Phoenix Overview
• Population of 1.5 Million• Council-Manager Form of
Government• 30 Departments• Over 14,000 Employees• FY 07-08 Budget: $3.6 Billion
• Population of 1.5 Million• Council-Manager Form of
Government• 30 Departments• Over 14,000 Employees• FY 07-08 Budget: $3.6 Billion
The City of Phoenix is the 5th largest city in the U.S., and one of the fastest growing over the past decade.
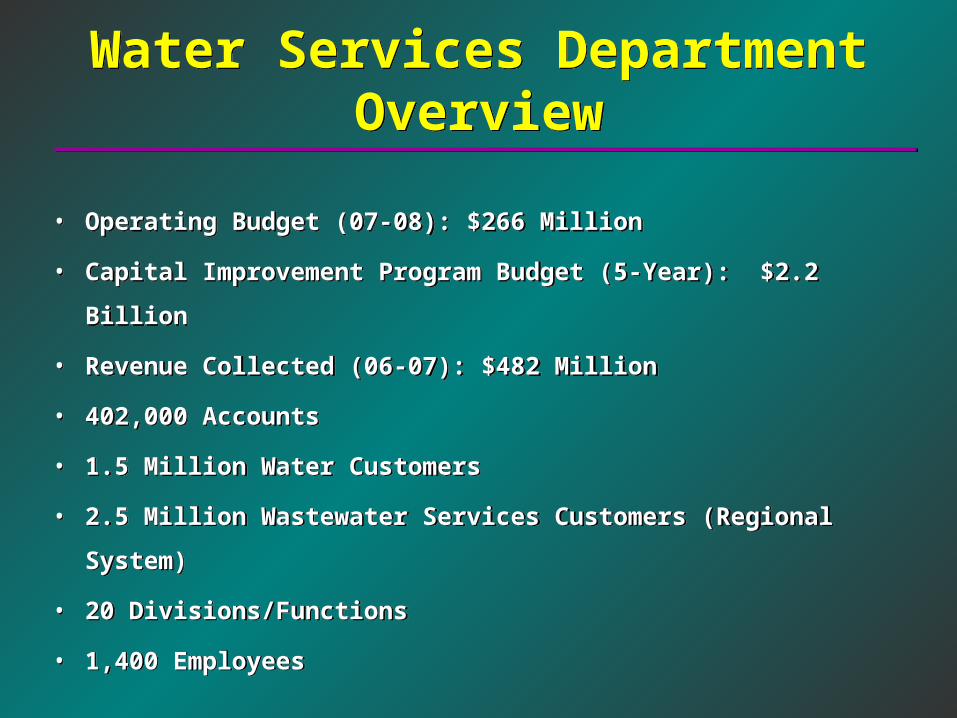
Water Services Department OverviewWater Services Department Overview
• Operating Budget (07-08): $266 Million
• Capital Improvement Program Budget (5-Year): $2.2 Billion
• Revenue Collected (06-07): $482 Million
• 402,000 Accounts
• 1.5 Million Water Customers
• 2.5 Million Wastewater Services Customers (Regional System)
• 20 Divisions/Functions
• 1,400 Employees
• Operating Budget (07-08): $266 Million
• Capital Improvement Program Budget (5-Year): $2.2 Billion
• Revenue Collected (06-07): $482 Million
• 402,000 Accounts
• 1.5 Million Water Customers
• 2.5 Million Wastewater Services Customers (Regional System)
• 20 Divisions/Functions
• 1,400 Employees
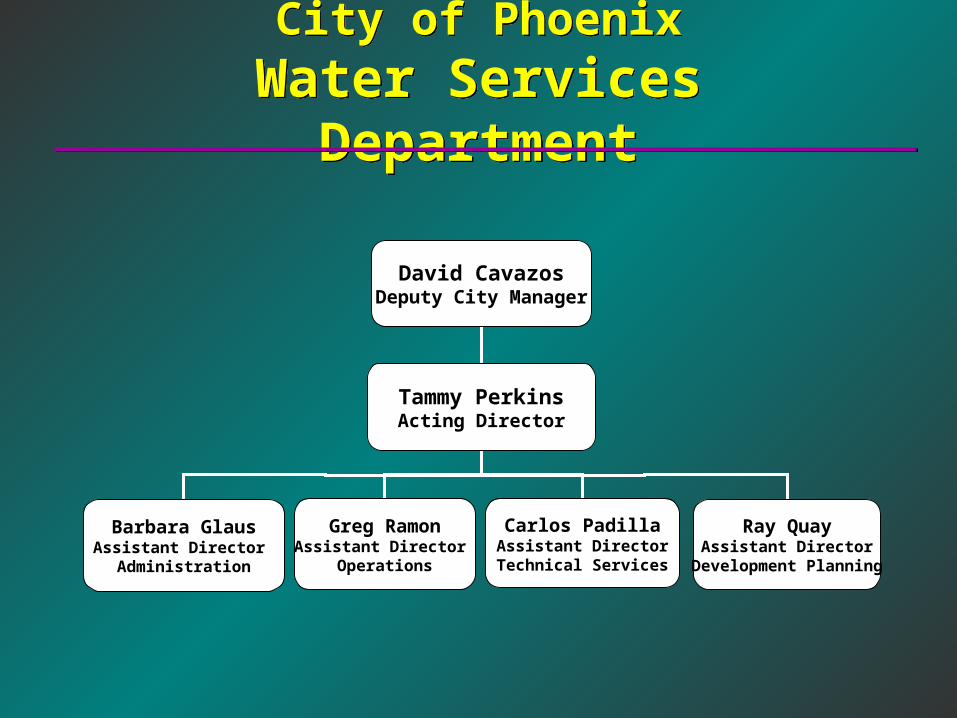
City of PhoenixWater Services Department
City of PhoenixWater Services Department
David CavazosDeputy City Manager
Tammy PerkinsActing Director
Barbara GlausAssistant Director
Administration
Greg RamonAssistant Director
Operations
Carlos PadillaAssistant DirectorTechnical Services
Ray QuayAssistant Director
Development Planning
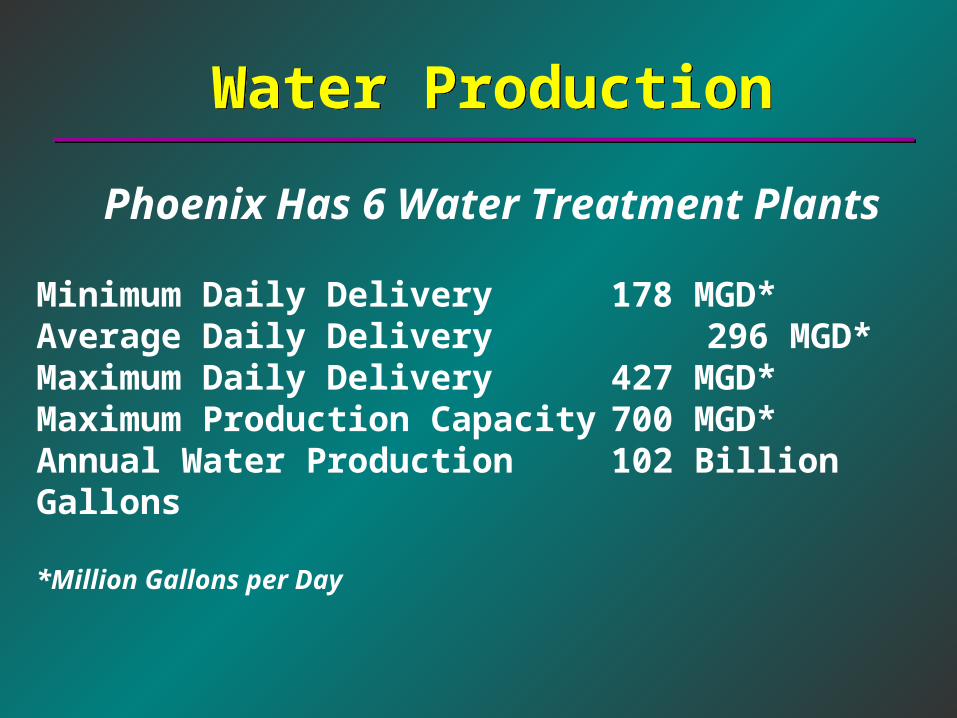
Water ProductionWater Production
Phoenix Has 6 Water Treatment Plants
Minimum Daily Delivery 178 MGD* Average Daily Delivery 296 MGD*Maximum Daily Delivery 427 MGD*Maximum Production Capacity 700 MGD*Annual Water Production 102 Billion Gallons
*Million Gallons per Day
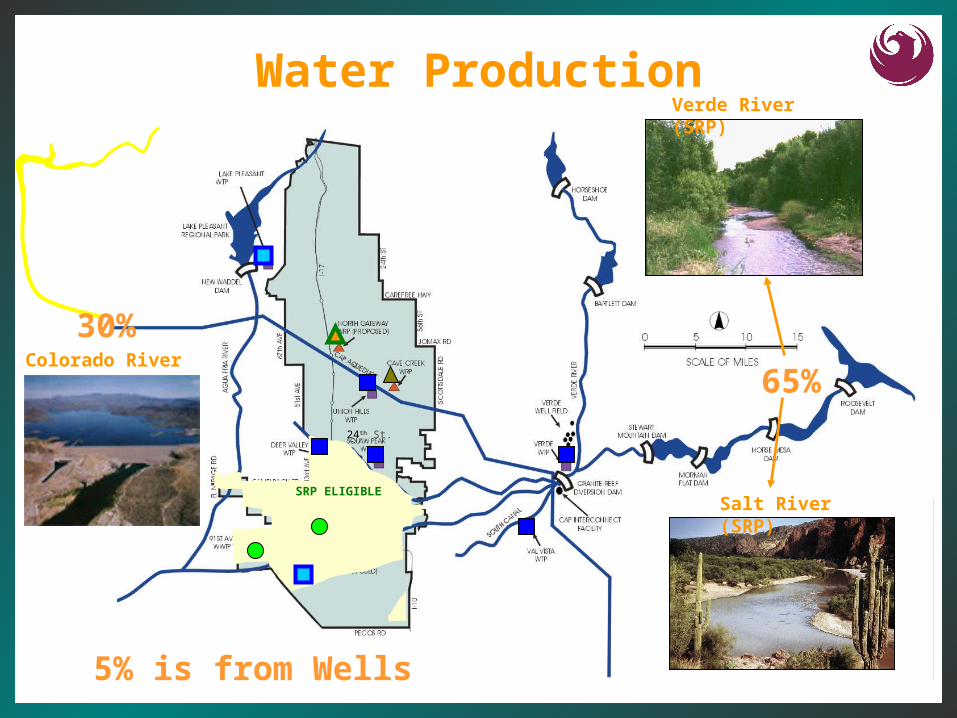
Water Production
Colorado River (CAP)
Salt River (SRP)
Verde River (SRP)
SRP ELIGIBLE
24th St.
30%
65%
5% is from Wells
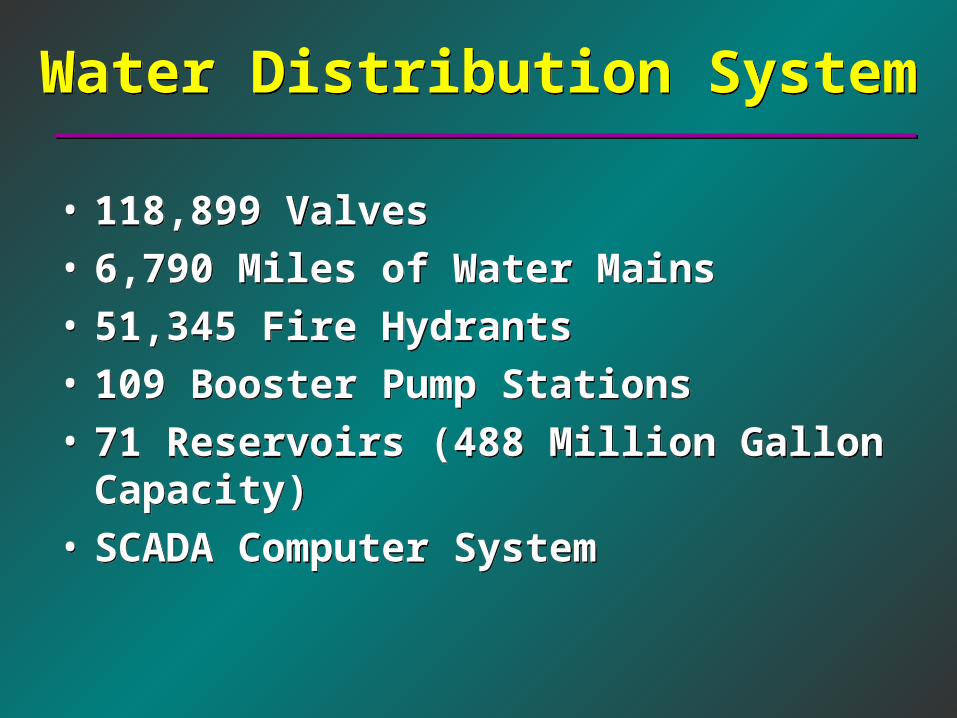
Water Distribution SystemWater Distribution System
• 118,899 Valves
• 6,790 Miles of Water Mains
• 51,345 Fire Hydrants
• 109 Booster Pump Stations
• 71 Reservoirs (488 Million Gallon Capacity)
• SCADA Computer System
• 118,899 Valves
• 6,790 Miles of Water Mains
• 51,345 Fire Hydrants
• 109 Booster Pump Stations
• 71 Reservoirs (488 Million Gallon Capacity)
• SCADA Computer System
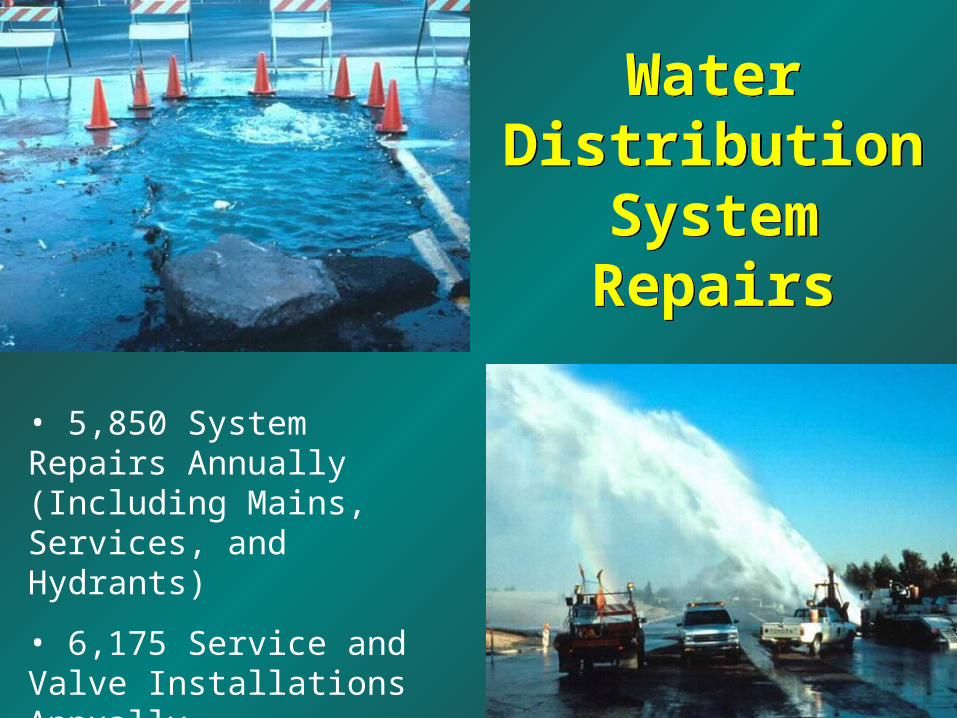
• 5,850 System Repairs Annually (Including Mains, Services, and Hydrants)
• 6,175 Service and Valve Installations Annually
Water Distribution
SystemRepairs
Water Distribution
SystemRepairs
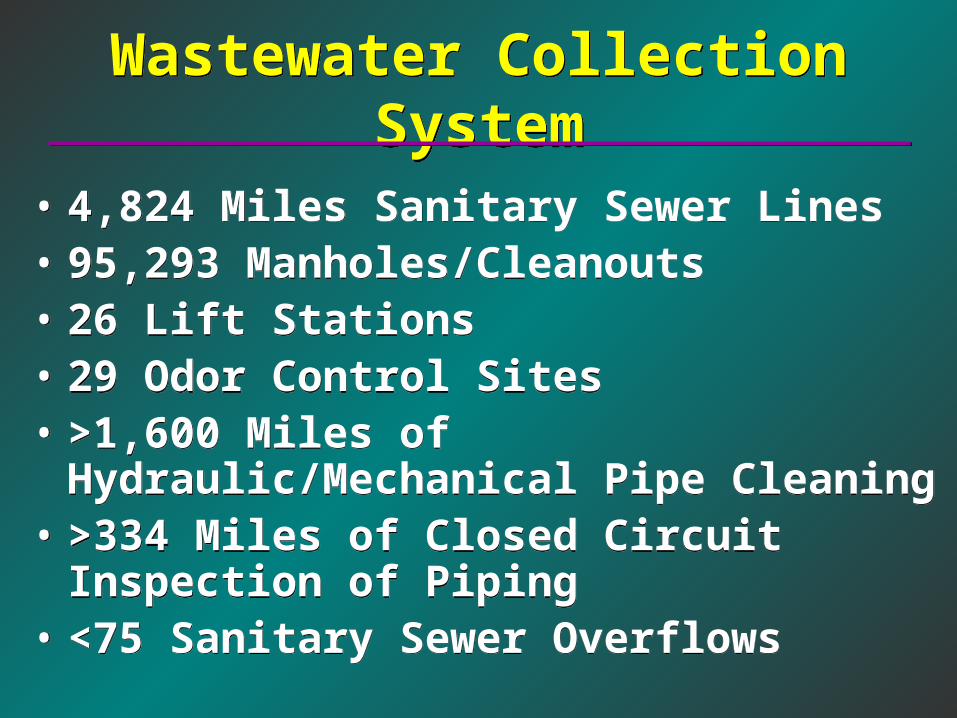
Wastewater Collection SystemWastewater Collection System
• 4,824 Miles Sanitary Sewer Lines• 95,293 Manholes/Cleanouts• 26 Lift Stations• 29 Odor Control Sites• >1,600 Miles of Hydraulic/Mechanical Pipe
Cleaning• >334 Miles of Closed Circuit Inspection of
Piping• <75 Sanitary Sewer Overflows
• 4,824 Miles Sanitary Sewer Lines• 95,293 Manholes/Cleanouts• 26 Lift Stations• 29 Odor Control Sites• >1,600 Miles of Hydraulic/Mechanical Pipe
Cleaning• >334 Miles of Closed Circuit Inspection of
Piping• <75 Sanitary Sewer Overflows
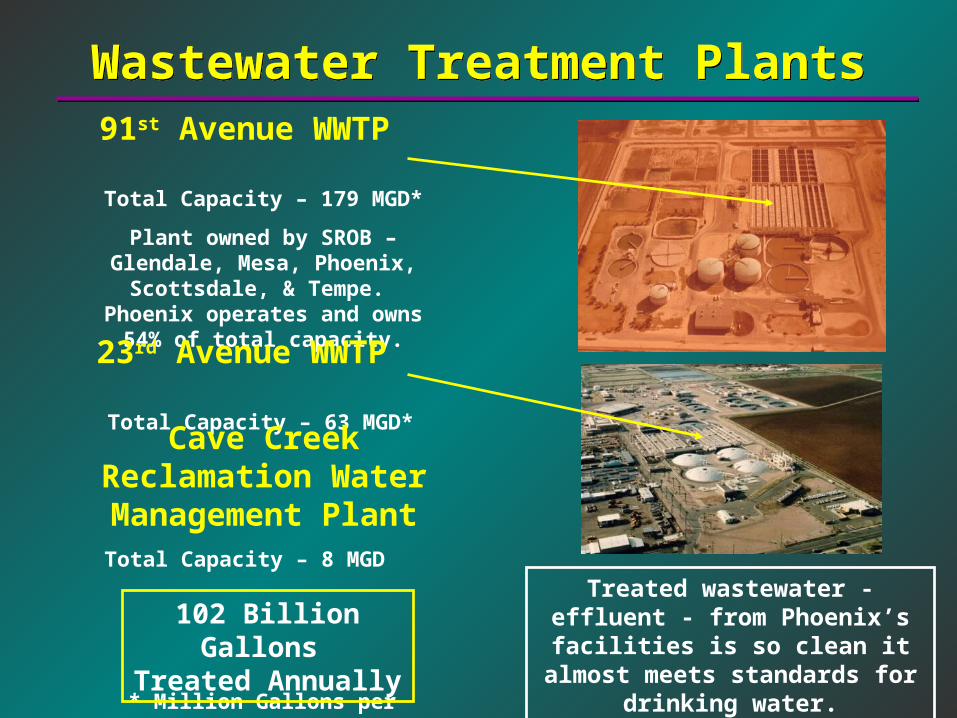
Wastewater Treatment PlantsWastewater Treatment Plants91st Avenue WWTP
Total Capacity – 179 MGD*
Plant owned by SROB – Glendale, Mesa, Phoenix,
Scottsdale, & Tempe. Phoenix operates and owns 54% of total
capacity.23rd Avenue WWTP
Total Capacity – 63 MGD*
Treated wastewater - effluent - from Phoenix’s facilities is so
clean it almost meets standards for drinking water.
* Million Gallons per Day
Cave Creek Reclamation Water Management Plant
Total Capacity – 8 MGD
102 Billion Gallons Treated Annually

Challenges Facing Water ServicesChallenges Facing Water Services
• Aging Infrastructure
• Water and Wastewater Master Plans
• Drought/Conservation Efforts
• Growth
• Capital Improvement Funding
• Workforce Planning
• Water Resource Management
• Aging Infrastructure
• Water and Wastewater Master Plans
• Drought/Conservation Efforts
• Growth
• Capital Improvement Funding
• Workforce Planning
• Water Resource Management
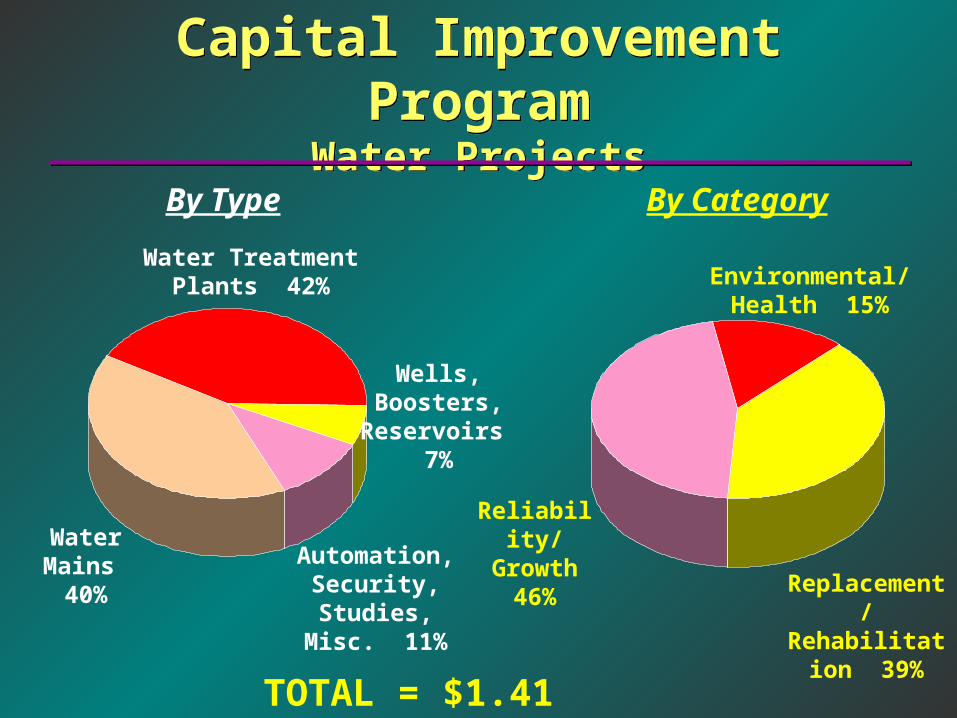
Capital Improvement ProgramWater Projects
Capital Improvement ProgramWater Projects
By Type By Category
Water Treatment Plants 42%
Wells, Boosters,
Reservoirs 7%
Automation, Security,
Studies, Misc. 11%
Water Mains
40%
Environmental/Health 15%
Reliability/Growth
46%Replacement/ Rehabilitation
39%
TOTAL = $1.41 BILLION
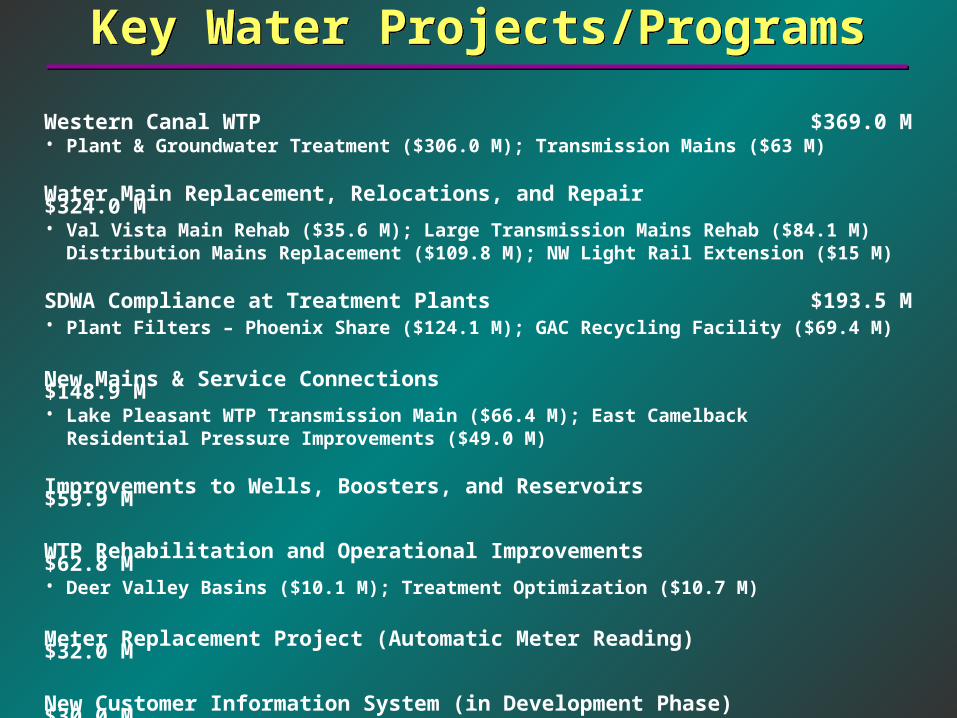
Key Water Projects/ProgramsKey Water Projects/Programs
Western Canal WTP $369.0 M• Plant & Groundwater Treatment ($306.0 M); Transmission Mains ($63 M)
Water Main Replacement, Relocations, and Repair $324.0 M• Val Vista Main Rehab ($35.6 M); Large Transmission Mains Rehab ($84.1 M) Distribution Mains Replacement ($109.8 M); NW Light Rail Extension ($15 M)
SDWA Compliance at Treatment Plants $193.5 M• Plant Filters – Phoenix Share ($124.1 M); GAC Recycling Facility ($69.4 M)
New Mains & Service Connections $148.9 M• Lake Pleasant WTP Transmission Main ($66.4 M); East Camelback Residential Pressure Improvements ($49.0 M)
Improvements to Wells, Boosters, and Reservoirs $59.9 M
WTP Rehabilitation and Operational Improvements $62.8 M• Deer Valley Basins ($10.1 M); Treatment Optimization ($10.7 M)
Meter Replacement Project (Automatic Meter Reading) $32.0 M
New Customer Information System (in Development Phase) $30.0 M
TOTAL $1.2 B
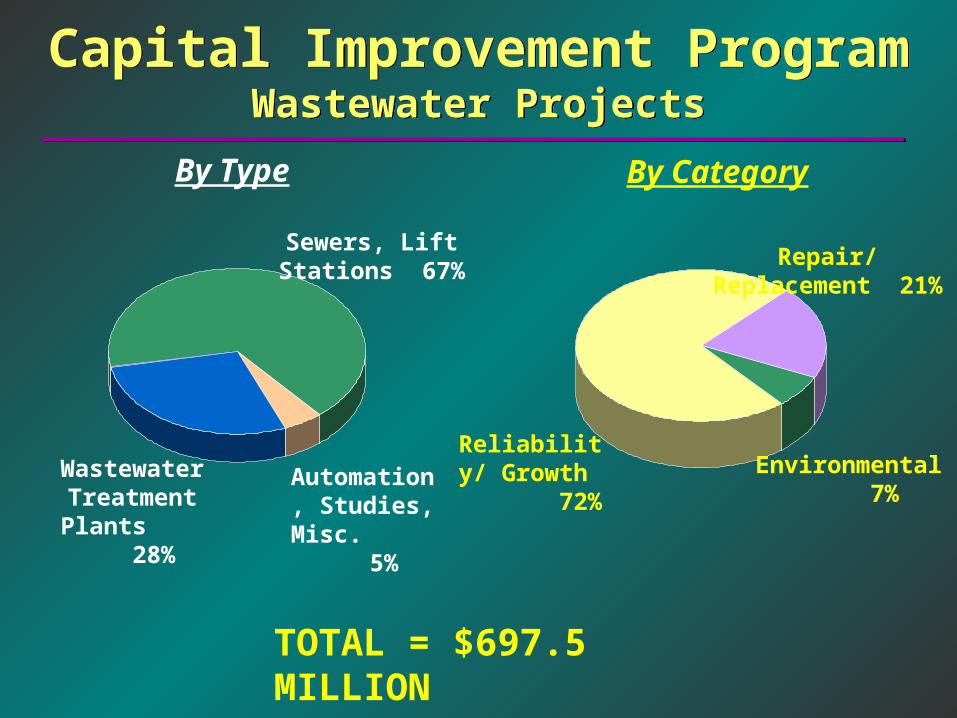
Capital Improvement ProgramWastewater Projects
Capital Improvement ProgramWastewater Projects
By Type By Category
Sewers, Lift Stations 67%
Automation, Studies,
Misc. 5%
Wastewater Treatment Plants
28%
Repair/Replacement 21%
Environmental 7%Reliability/
Growth 72%
TOTAL = $697.5 MILLION
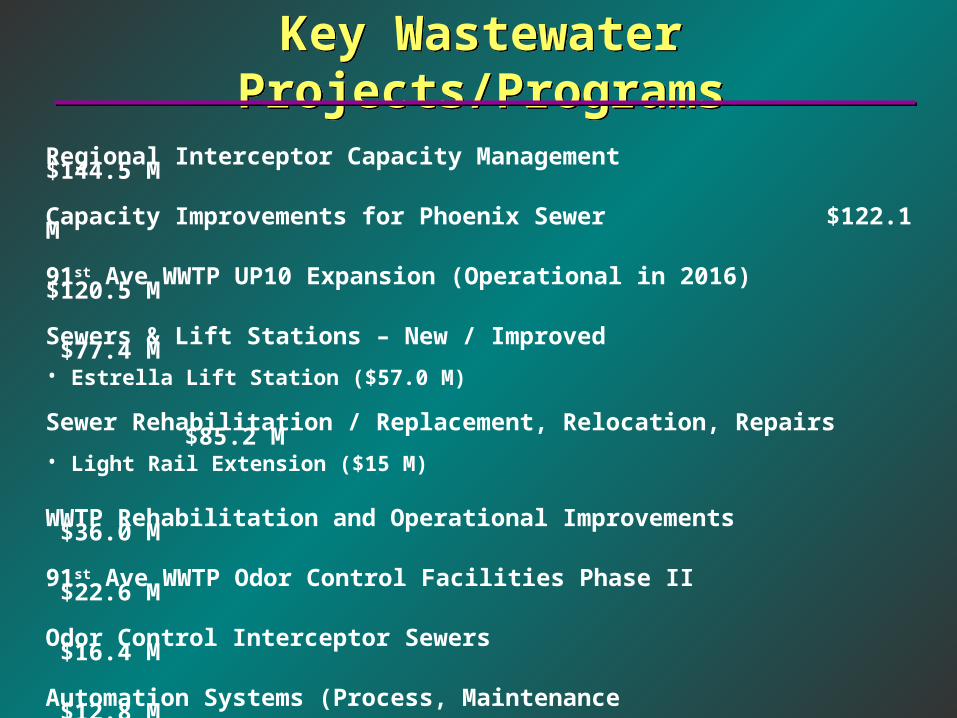
Key Wastewater Projects/ProgramsKey Wastewater Projects/Programs
Regional Interceptor Capacity Management $144.5 M
Capacity Improvements for Phoenix Sewer $122.1 M
91st Ave WWTP UP10 Expansion (Operational in 2016) $120.5 M
Sewers & Lift Stations – New / Improved $77.4 M• Estrella Lift Station ($57.0 M)
Sewer Rehabilitation / Replacement, Relocation, Repairs $85.2 M• Light Rail Extension ($15 M)
WWTP Rehabilitation and Operational Improvements $36.0 M
91st Ave WWTP Odor Control Facilities Phase II $22.6 M
Odor Control Interceptor Sewers $16.4 M
Automation Systems (Process, Maintenance $12.8 MManagement, Customer Information)
TOTAL $637.5 M
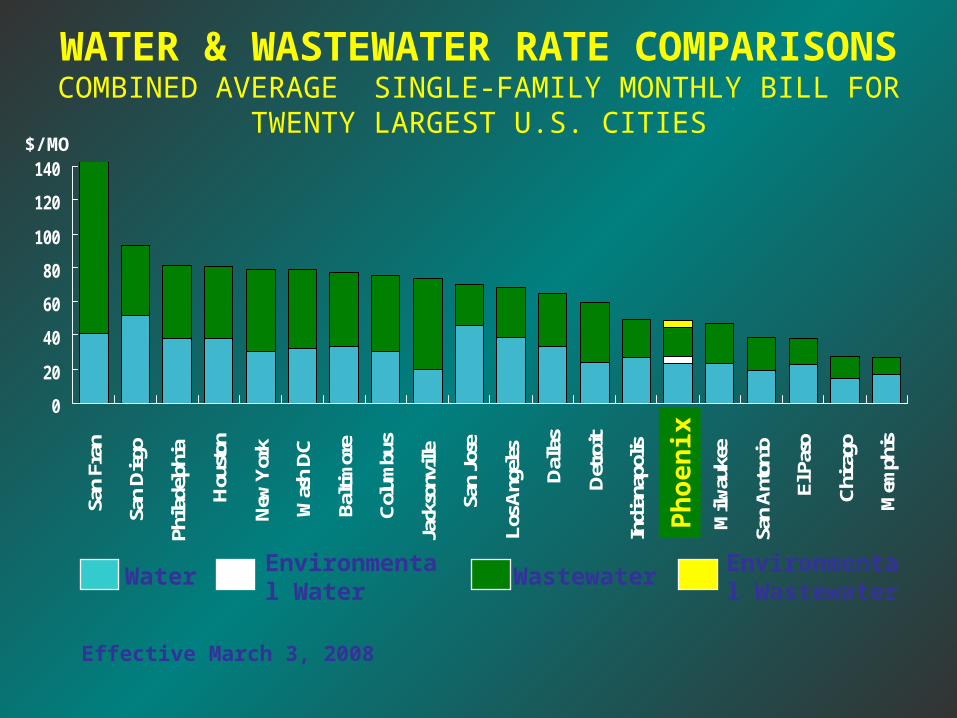
WATER & WASTEWATER RATE COMPARISONSCOMBINED AVERAGE SINGLE-FAMILY MONTHLY BILL FOR
TWENTY LARGEST U.S. CITIES
0
20
40
60
80
100
120
140
San
Fran
San
Dieg
o
Phila
delp
hia
Hou
ston
New
Yor
k
Was
h D
C
Balti
mor
e
Col
umbu
s
Jack
sonv
ille
San
Jose
Los A
ngele
s
Dal
las
Det
roit
Indi
anap
olis
Phoe
nix
Milw
auke
e
San
Ant
onio
El P
aso
Chi
cago
Mem
phis
WaterEnvironmental Water
$/MO
WastewaterEnvironmental Wastewater
Effective March 3, 2008P
ho
enix
0
10
20
30
40
50
60
Peoria Mesa Scottsdale Glendale Phoenix Chandler Tempe
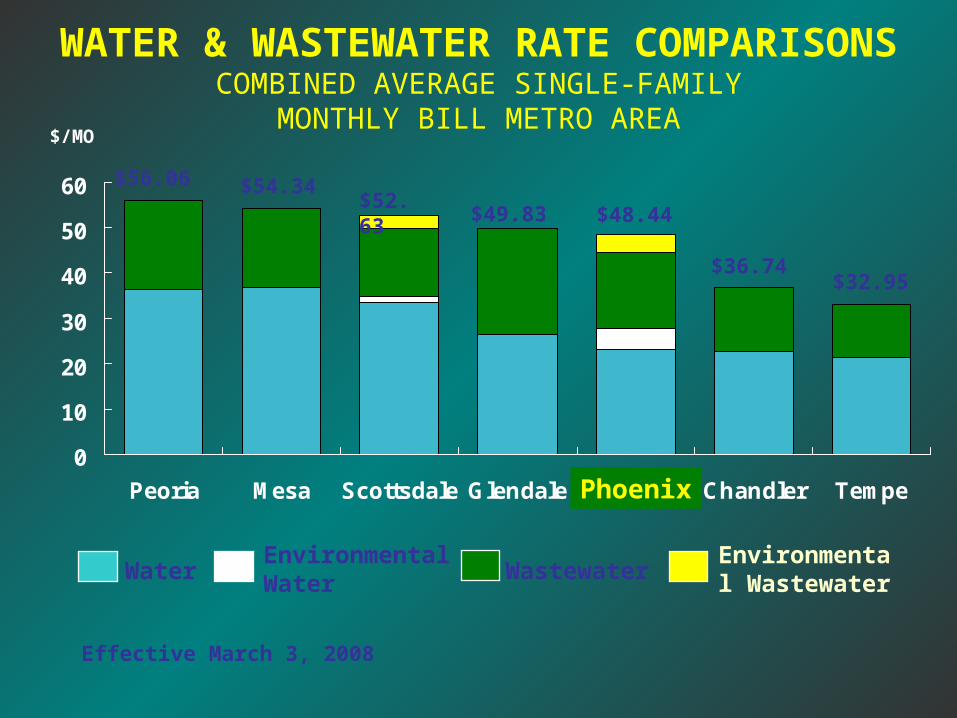
WATER & WASTEWATER RATE COMPARISONSCOMBINED AVERAGE SINGLE-FAMILY
MONTHLY BILL METRO AREA
WaterEnvironmental Water
$/MO
WastewaterEnvironmental Wastewater
$54.34$52.63
$49.83 $48.44
$36.74$32.95
$56.06
Effective March 3, 2008
Phoenix

Questions?Questions?