Embed Size (px)
Citation preview

EO data use forWater Resource Management in India
57th Session of UN COPUOS, 11-20 June, 2014, Vienna
Vinay K Dadhwal
Director
National Remote Sensing Centre (NRSC), ISROHyderabad, INDIA

India: Water Resources At a Glance • Area as % of World Area: 2.4%
• Population as % of World Population: 17.1%
• Water as % of World Water: 4%
Rainfall
Pattern
• Average annual rainfall 1160 mm (world 1110 mm)
• 132 in per capita availability
• 122 in water quality
• Range 150 -11690 mm
• Rainy days 5-150,
• Most rain 15 days in 100 hrs
• PET 1500-3500 mm
Source : Earth trends 2003, IEA 2005, NIH 2005, CWC 2011
Water Resource at a glance Quantity
(BCM)
%
� Ann. precipitation (Incl. snowfall) 4000 100
� Avg ann. potential flow in rivers 1869 46.7
� Estimated utilizable water resources 1123 28.1
� Surface water 690 17.3
� Replenishable GW 433 10.8
� Current utilization (of total) 634 15.85
� Current utilization (of utilizable ) 634 56.45
� Storage created /utilizable water 225 20.03
� Storage ( under construction) 171 15.22
� Water need in 2050 1450 129
� Deficit 327 29
� Interlinking can give us 200 17.8

Resourcesat – 2 LISS III, LISS IV, AWiFS
Oceansat-2OCM, SCAT, ROSA
CARTOSAT-2B PAN
MEGHA-TROPIQUESSAPHIR, SCARAB & MADRAS
RISAT-2X-band
Indian EO Missions
RISAT-1C-band
Oceansat-3OCM, SCAT, ROSA
INSAT-3D Imager, Sounder
SARALAltika & Argos
CARTOSAT- 3 0.25 m PAN, 1m MX, HySI
Resourcesat-2ALISS III, LSS IV , AWiFS
GISATMX, Hyperspectral, Thermal
CARTOSAT- 2E0.65 m PAN; 2m MX
CURRENT Planned Planned

EO for Water Resources
Assessment
Planning
Development
Monitoring
Evaluation
• interlinking of rivers
• Canal alignment & Land irrigability
(Pre-feasibility)
• Ranking of hydropower sites
• Dams Submergence Area Analysis
• Catchment area analysis
• Flood Hazard Zone Mapping
• Water Resources Assessment
• Inventory - Glacial Lakes/Water bodies
• Water Budgeting & Water Balance Modelling
• Hydrological & Snowmelt Runoff Modeling
• Irrigation Performance Evaluation
• Surface Water Logging & Soil
Salinity/Alkalinity Mapping
• Reservoir Sedimentation
• Flood Mapping & Damage
Assessment
• Flood Forecasting &
Inundation Simulation
• Rehabilitation & Relocation Studies
• Irrigation Infrastructure Mapping &
• Assessment Potential Created
… GEOSPATIAL INFORMATION SYSTEM & DSS PLATFORM

Water Resource Assessment• Water Resources Assessment
– Reassessment with new & EO inputs
• Water Budgeting & Water Balance Modelling
– Use Spatial distributed modeling
• Inventory - Glacial Lakes/Water bodies
• Hydrological & Snowmelt Runoff Modeling

Estimation of Water Balance Components
Water resources assessment ; Water management;
Drought Assessment; Weather research & forecast;
Climate change studies
Systematic estimation of Water balance components is useful
for
Open source; Grid-wise water and energy
balance; Daily / sub-daily time step; Variable
infiltration capacity along soil column;
Vegetation phenology
Input Data
Terrain - Topographic, Soil, LULC, LAI, Albedo,
Irrigation, Census
Meteorological – Rainfall, Temperature, …
Hydrological - River discharge, Reservoir Storage /
Releases, GW levels, …
Hydrological Model Setup - VIC Model
Daily Discharge at Siripur
3568 mm
0
Rainfall ET Runoff
0
1486 mm
0
1185 mm
Seasonal Water Balance Components
3 min x 3 min (~5.5km) Grid-wise data base
Initial Results – Godavari River Basin – Jun to Oct 2007
To develop and setup frame work for generation
of grid-wise, water balance components
To conduct field experimentation for calibration
and validation of model outputs
To generate periodic geo-spatial products
describing grid-wise water balance components
for the entire country
Objectives

Hydrology Services
Time Series Visualisation: 1/Jun/2014 to 15/Jun/2014
Surface Soil Moisture (m3/m3) Evapotranspiration (mm/day)Surface Runoff (mm/day)
• Experimental model computed hydrological
products (Version 1.0)
• Water balance computations using VIC-3L
hydrological model using geo-spatial data & near
real time meteorological data
• 9 min (~16.5 km) resolution at 24 hr time-step
http://bhuvan.nrsc.gov.in/nices/

Inventory & Monitoring of Glacial Lakes/Water Bodies
• Inventory of glacial lakes/water bodies in the Himalayan
region of Indian River basins using satellite data (spatial
extent > 10ha)
• Monitoring the spatial extent changes of the lakes/water
bodies (> 50ha) on monthly basis during June to October
months for 5 years, succeeding the inventorying year
Inventory of glacial lakes/water bodies - AWiFS 2009
South Lhonak Lake

Chenab
Yamuna
Sutlej
Alaknanda
Bhagirathi
Beas
Rudraprayag
Uttarkashi
Bhuntar
Premnagar
Bhakra
Hatnikund
65843 watt-hour
529 watt-hour
Insolation during 1-8 May 2013 Land Cover
Snow cover during 1-8 May 2013Snow Albedo during
1-8 May 2013
Basin Seasonal Forecast
Apr-Jun 2013 (MCM)
Alaknanda 2,320
Bhagirathi 1,040
Beas 800
Chenab 6,520
Sutlej 3,700
Yamuna 960
Seasonal Snowmelt Forecast (April-May-June)
RS2 AWiFS
21-Jun-2013
100 %
1 %
Snowmelt Runoff Forecasting

Water Resources Planning
• interlinking of rivers
• Canal alignment & Land irrigability (Pre-feasibility)
• Ranking of hydropower sites
• Dams Submergence Area Analysis
• Catchment area analysis
• Flood Hazard Zone Mapping

LISS IV (5.8m) Cartosat-1 (2.5m)
DEM
Land use
Ken Betwa Submergence Contours
Irrigation command
Terrain and Topographic information derived from high resolution data from Cartosat-1 PAN and LISS IV MX supports –
Effective implementation of R & R program, Infrastructure Planning, Rehabilitation Management and Foreshore Regulation
Sardar Sarovar
Project Reservoir
R & R Site
DharampuriDharampuri
SSP
Omkareswar
Digital elevation and land use / land
cover information derived from high
resolution data from Cartosat-1 PAN
and LISS IV MX supports –
Pre-feasibility analysis, site evaluation and inputs for DPR preparation
Satellite data prior to
first impoundment of
reservoir provides –
Status of ground conditions and their suitability & readiness for impoundment
Prior to impoundment - Jan, 2007
After impoundment –Jan, 2008
Water Resources Planning - New Projects
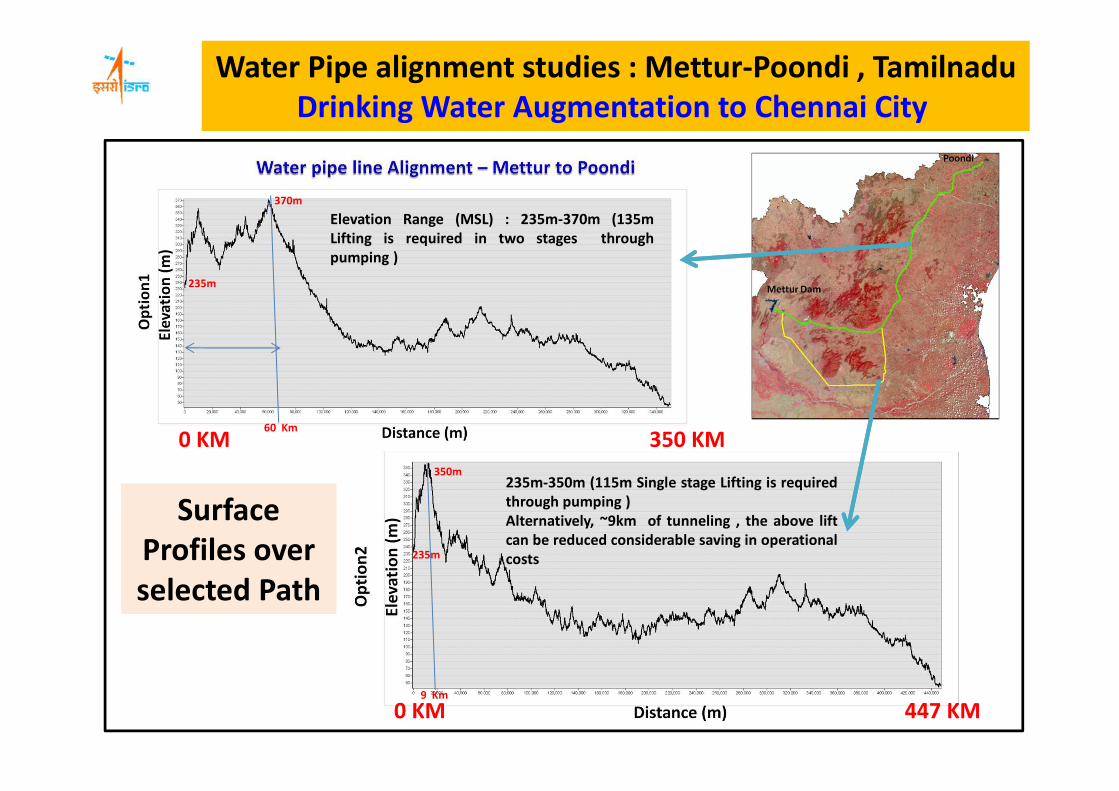
Water Pipe alignment studies : Mettur-Poondi , Tamilnadu
Drinking Water Augmentation to Chennai City
Surface
Profiles over
selected Path
0 KM 350 KM
0 KM 447 KM
Elevation Range (MSL) : 235m-370m (135m
Lifting is required in two stages through
pumping )
235m-350m (115m Single stage Lifting is required
through pumping )
Alternatively, ~9km of tunneling , the above lift
can be reduced considerable saving in operational
costs
235m
370m
235m
350m
60 Km
9 Km
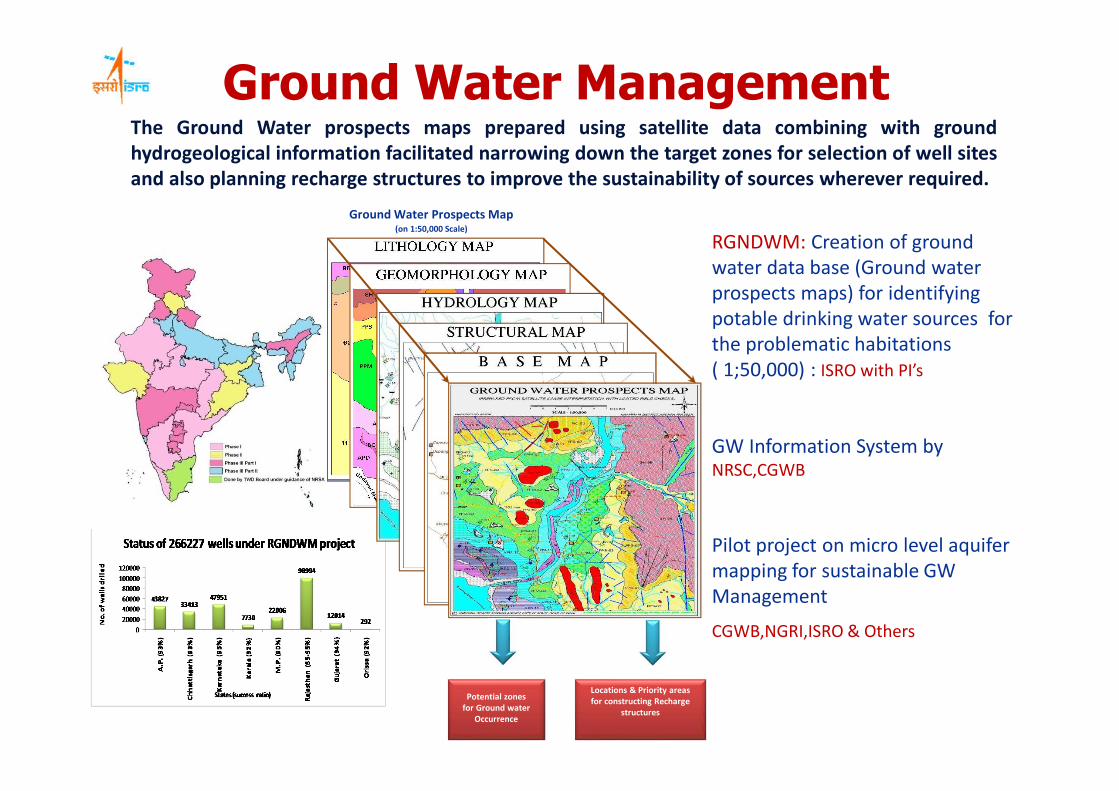
Ground Water Management
RGNDWM: Creation of ground
water data base (Ground water
prospects maps) for identifying
potable drinking water sources for
the problematic habitations
( 1;50,000) : ISRO with PI’s
GW Information System by NRSC,CGWB
Pilot project on micro level aquifer
mapping for sustainable GW
Management
CGWB,NGRI,ISRO & Others
Potential zones
for Ground water
Occurrence
Locations & Priority areas
for constructing Recharge
structures
Ground Water Prospects Map (on 1:50,000 Scale)
The Ground Water prospects maps prepared using satellite data combining with ground
hydrogeological information facilitated narrowing down the target zones for selection of well sites
and also planning recharge structures to improve the sustainability of sources wherever required.

National Project on Aquifer Management
Delineation and characterisation of Aquifers in 3D on 1:50,000
scale in priority areas and on 1:10,000 scale in limited areas
Formulation of Aquifer Management Plans
Area identified for aquifer
mapping - 23.25 Lakh Km2
XII Plan - 8.89 Lakh Km2
XIII Plan - 14.36 Lakh Km2
CGWB has taken up pilot projects on aquifer mapping in
six areas spread over five states Rajasthan, Bihar,
Maharashtra, Karnataka and Tamil Nadu.
These pilot studies are expected to yield standard
methodologies and protocols for up-scaling the project to
National Level.
Pilot Study
Objectives

WR Monitoring & Hazard Forcasting
• Reservoir Sedimentation
• Flood Mapping & Damage Assessment
• Flood Forecasting & Inundation Simulation

Reservoir Sedimentation AssessmentSatellite Image (FCC) of SRSP Reservoir
Waterspread area depletion pattern during 2001-02
Elevation-Capacity curve of SRSP Reservoir
0
500
1000
1500
2000
2500
3000
3500
306 308 310 312 314 316 318 320 322 324 326 328 330 332 334
Elevation (m)
Cap
acity
(M
.cu.
m)
SRS survey (2002)
Hydrograhic (1994)
Original (1970)
• Gross capacity assessed to be
2070.164 M.Cu.m. in year 2002
• 34.74 % capacity (1101.773 MCM)is
lost since impoundment in 1970.
National Action Plan for Sedimentation
Assessment of 124 Reservoirs

Assessment of Irrigation Potential Created
LBMC
30000
32000
34000
36000
38000
40000
AIBP Target
(proposed)
Field
reported
(created)
Satellite
assessed
(created)
37611 3761136727
Irrigation Potential ( Ha)
Upperwardha Project
Maharashtra State
RBMC
Balance I.P
Satellite assessed Irrigation Potential created is slightly lower than field reportedBalance irrigation potential
Main canal Minor
Aqueduct
Structure
pending
Canal in progress
CD structure
Canal lining in
progress
CD structure

Flood ManagementFlood Hazard Zonation River Morphological Studies
Assam State
(River configuration &
Bank erosion studies )So far few selected
rivers in selected
stretches have been
studied by CWC & ISRO
A Comprehensive
morphological studies
for 15 vulnerable rivers
is initiated by CWC with
ISRO’s guidance
involving Academia

Flood ForecastingStatic Data
-Land use/land cover, Soil texture, DEM
-Topographic and Hydraulic Parameters of sub-basins and Channels
Dynamic Data
- Real-time 3 hr. Rainfall and discharge data
- Daily Rainfall Data in near real-time
- Rainfall forecast grids at 3 hr frequency
- Monthly ET data, and Rating curves
Real-time validation
- The model was calibrated, validated & operationally used in 2010 and 2012
using real-time hydro- met. data obtained from CWC and IMD
- Flood alerts were given during the 2012 monsoon season
- Inundation simulations were done using ALTM DEM of Sabari Floodplains
Computed Discharge
Observed Discharge
Flood Stage
Flood Forecast Hydrograph at Perur Inundation simulation in Sabari River
using ALTM DEM (on Bhuvan)
Modelling Environment:
HEC-HMS, HEC-Geo HMS, HEC-RAS, HEC-
Geao RAS (public domin softwares)
Development of similar models to other
frequent flood prone rivers of the country.
Mahanadi
Brahmani-Baitarani,
Kosi
Ghagra
Gandak, and
Krishna River Basins
Godavari Basin

WR Program/ Project Evaluation
• Irrigation Performance Evaluation
• Surface Water Logging & Soil Salinity/Alkalinity Mapping
• Tank Irrigation Rehabilitation evaluation
Overall Performance of 742 Tanks
544
102
96
Improve
No Change
Decrease
76414
98138
0
20000
40000
60000
80000
100000
120000
Annual Irrigation Utilization
hect
are
2004-05 2007-08

0
10000
20000
30000
40000
50000
60000
70000
80000
90000
100000
1 2 3 4 5 6 7 8 9 10
Incr
emen
tal a
rea
(ha)
0
10000
20000
30000
40000
50000
60000
70000
80000
90000
100000
Cum
ulat
ive
area
(ha
)
Incremental area Cumulative area
10 -15Feb
15 -20Feb
20-25 Feb
25-29 Feb
29 Feb-05 M ar
05-10 M ar
10-15 Mar
15-20 Mar
20-25 Mar
25-29Mar
Progression of 2003-04 Rabi Season Crop Area
Impact of Improvement Interventions
Irrigation System Performance Evaluation
In-Season Inputs for Improved Water Distribution

India-Water Resources Information System (India-WRIS)
A 'Single Window solution’ for comprehensive, authoritative and consistent data & information of India's water resources
GUI of India-WRIS V 4.0
6 modules - WRIS In
12 Main information
systems and
36 Sub-information
systems
95 Spatial layers
more than 700
attributes,
5-100 years data
http://www.india-wris.nrsc.gov.in
12 Main Information Systems
• Meteorological Data / Hydro-met
• Environmental Data & Pollution Data
• Surface Water Information System
• Ground Water Information System
• Water Resources Projects
• Meteorological Data
• Environmental Data & Pollution Data etc.
ISRO Projects Legacy data
• Landuse/ Land cover
• Land degradation
• Wastelands
• Flood inundation
• RGNDWM etc.
• International, States, Districts, Tehsils / Taluks
Village boundaries
• Town / Villages location and extent
• Infrastructure layers (Road and Rail)
• Basins, Sub-basins & Watersheds
• Hydro features/Assets – Rivers & Water
bodies
• Water Infrastructure – Dams, Canals &
Inland navigation
• Monitoring Stations- G/GD/GDQ/GDSQ/
GD/FF station/Rainfall/Snow
Real
Time
Database
Dynamic
Time series
datasets
Related
Thematic Database
Foundation Geo-database Generation
Administrative
Foundation Geo-database generation
Water Resources
Data types & Designing information System
India-WRIS Publications

http://bhuvan.nrsc.gov.inhttp://www.india-wris.gov.in
http://www.nrsc.gov.inhttp://www.isro.gov.in
Thank You