Embed Size (px)
Citation preview

4/27/2010
1
Overview of Water Quality Issues Overview of Water Quality Issues
on California Rangelandson California Rangelands
Core Research Team
• Barbara Allen-Diaz
• Rob Atwill
• Randy Dahlgren
• John Harper
• David Lewis
• Toby O’Geen
• Mike Singer
• Ken Tate
Urban-Wildland-Agricultural Interface
80% of Reservoirs
4/27/2010
2
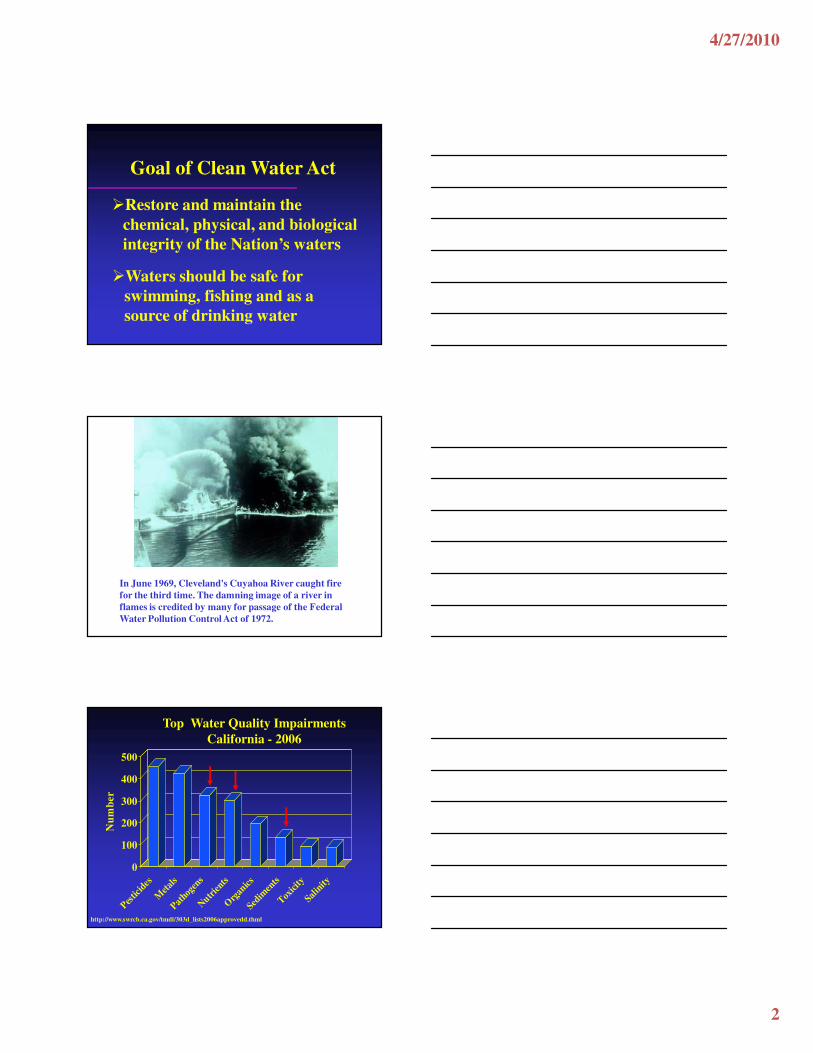
Goal of Clean Water Act
�Restore and maintain the
chemical, physical, and biological
integrity of the Nation’s waters
�Waters should be safe for
swimming, fishing and as a
source of drinking water
In June 1969, Cleveland's Cuyahoa River caught fire
for the third time. The damning image of a river in
flames is credited by many for passage of the Federal
Water Pollution Control Act of 1972.
0
100
200
300
400
500
Nu
mb
er
Pestic
ides
Met
als
Pathog
ens
Nutr
ients
Org
anic
s
Sedim
ents
Tox
icity
Salin
ity
Top Water Quality Impairments
California - 2006
http://www.swrcb.ca.gov/tmdl/303d_lists2006approvedd.thml

4/27/2010
3
Sources of Water Contaminants
Point source pollutants - originate
from an identifiable source
Non-point source pollutants -
originate from diffuse and hard-
to-identify sources
Natural sources - originate from
naturally occurring sources in the
environment (sediment, nutrients, E. coli)
State-wide Survey
24 streams2000 and 2001 water years
mg
/L
0
1
2
3
4
5
Total N NO3
NH4
Total P PO4
Nutrient Concentrations
90th
75th
50th
25th
10th
n = 947

4/27/2010
4
Rain Rain & Snow Snow
Co
nc
en
trati
on
(c
fu/1
00
mL
)
0
1000
2000
3000
4000
E. coli
fecal colifom
EPA StandardE. Coli = 126
n = 947
Pathogens
Photo Credit: H.D.A Lindquist, U.S. EPA
Cryptosporidium parvumE. coli
Nutrients (N/P)
Pathogens
Sediments
Stream Temperature – Heat Pollution
1. Diversion
3. Return
2. Flood-irrigated pasture
86o F
54o F

4/27/2010
5
Grazing and Stream Temperature/Habitat
Excessive Grazing Reduced Shade
Both livestock and wildlife can be significant
sources of waterborne pathogens
Source of Microbial Pathogens?
Andesitic mud flow
Intrusive igneous rock
Metavolcanic rock
Metasedimentary rock
0.130.12
0.11
0.13
0.09
0.100.14
0.18
0.09
0.110.13
0.10
4.98
0.39
8.75
6.763.43
0.55
5.052.39
1.62
2.952.37
1.64
<0.01
Stream Water NO3-N (ppm) in
the Mokelumne River Watershed
Maximum values
during 3-yr study

4/27/2010
6
Thermal Spring Water from
California’s Coast Range
Sulfur Bank mine 460
Elgin mine 271
Wilbur springs 266
NH4-N (ppm)
Sediment
Generation in
Northern
Coast Ranges
99 % associated with
historic land management
or natural sources
1% due to current
management practices
Hopland Research & Extension Center
vegetation conversion 20 years later
4/27/2010
7
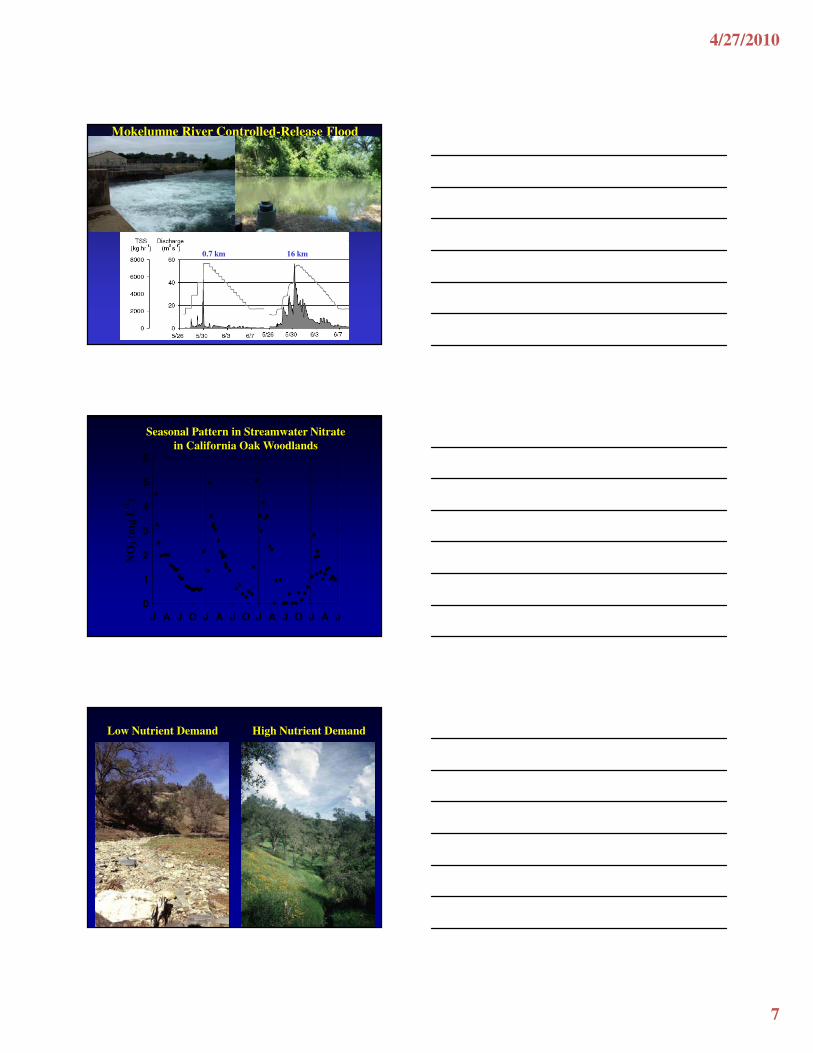
Mokelumne River Controlled-Release Flood
0.7 km 16 km
J A J O J A J O J A J O J A J
NO
3 (
mg
L-1
)
0
1
2
3
4
5
6
Seasonal Pattern in Streamwater Nitrate
in California Oak Woodlands
Low Nutrient Demand High Nutrient Demand

4/27/2010
8
Assimilative Capacity
Capacity of a water body to receive a pollutant,
without harmful effects and damage to aquatic life
and to humans who consume its water.
Nutrient Attenuation – Deer Creek
0
5
10
15
20
Nitrate Phosphate
NO
3-N
o
r P
O4-P
(p
pm
)
Mile 2
Mile 5
Assimilative Capacity

4/27/2010
9
J A J O J A J O J A J O J A J
NO
3 (
mg
L-1
)
0
1
2
3
4
5
6
Seasonal Pattern in Streamwater Nitrate
in California Oak Woodlands
Yuba River - Nitrate
Oct Apr Oct Apr Oct Apr Oct Apr Oct
NO
3-N
(m
g/L
)
0.00
0.05
0.10
0.15
0.20
0.25
1999 2000 2001 20032002
~ 5 mg/L maximum in
oak woodland stream
Water Quality Monitoring
Considerations

4/27/2010
10
Small watershed
� management unit
Regional scale
� provides context
Issues of Scale
Hillslope/Plot/Soil horizon/Colloids
� processes and mechanisms
Cosumnes River Watershed
Nitrate – Annual Loads
0 – 0.06
0.06 – 0.12
0.12 – 0.24
0.24 – 0.37
0.37 – 0.50
0.50 – 0.64
0.64 – 0.77
10 km
Schubert Watershed; Annual N Load
0.0
0.5
1.0
1.5
2.0
2.5
3.0
3.5
4.0
4.5
1981
1982
1983
1984
1985
1986
1987
1988
1989
1990
1991
1992
1993
1994
1995
1996
1997
1998
Water Year
Mineral N (kg/ha/yr)

4/27/2010
11
J A J O J A J O J A J O J A J
NO
3 (
mg
L-1
)
0
1
2
3
4
5
6
Seasonal Pattern in Streamwater Nitrate
in California Oak Woodlands
NO
3 (
mg N
L-1
)
0
2
4
6
8
10
Hours
0 5 10 15 20 25 30
Flo
w (
m3 s
-1)
0
1
2
3
4
5
Hours
0 5 10 15 20 25 30
c
Storm-Event Dynamics
nitrate
water
Slide courtesy of David Lewis
Pre-storm Post-stormStorm peak
Change in Suspended
Sediments during Storm Event

4/27/2010
12
Nov Dec Jan Feb Mar Apr May
Str
ea
mflow
(cfs
)
0
3
6
9
Streamflow (cfs)
E. coli
(cfu
/10
0m
L)
0
5000
10000
15000
20000
E. coli
E. coli - 500 lbs/acre RDM
Stemple Creek Ammonia Ammonia and Flow for Site 1 during New Years Flood
0
50
100
150
200
250
300
350
400
12/25/05 12/26/05 12/27/05 12/28/05 12/29/05 12/30/05 12/31/05 1/1/06 1/2/06 1/3/06
Date
Flo
w (
cfs
)
0
1
2
3
Un
-Io
niz
ed
NH
3 (
mg
/L)
Flow Site 1, 2006
NH3 Site 1, 2006
Slide courtesy of David Lewis
N M N M N
DO
(m
g L
-1)
6
8
10
12
14
16
18
Diel Cycle Dissolved Oxygen –
San Joaquin River
4/27/2010
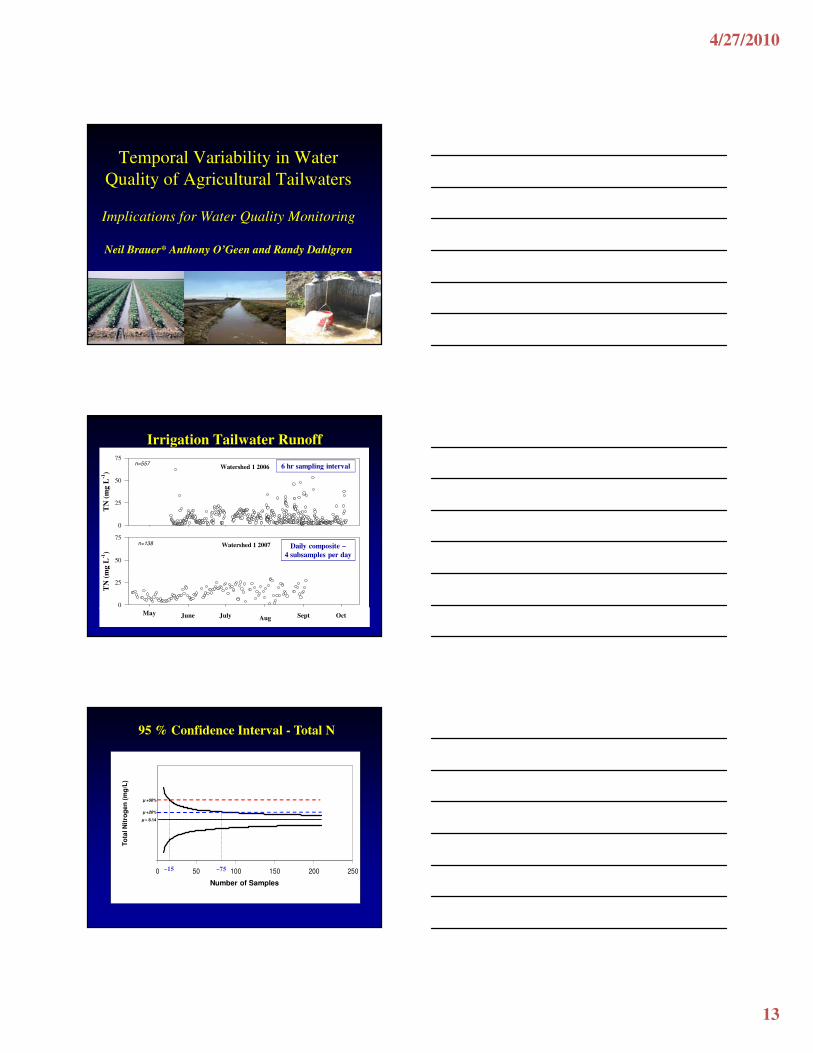
13
Temporal Variability in Water
Quality of Agricultural Tailwaters
Implications for Water Quality Monitoring
Neil Brauer* Anthony O’Geen and Randy Dahlgren
Irrigation Tailwater Runoff
6
8
4
TN
(m
g L
-1)
0
25
50
75
TN
(m
g L
-1)
0
25
50
75
Watershed 1 2006
Watershed 1 2007
n=557
n=138
May June July Aug Sept Oct
6 hr sampling interval
Daily composite –
4 subsamples per day
0.00
0 50 100 150 200 250
Number of Samples
To
tal N
itro
ge
n (
mg
/L)
µ +50%
µ +20%
µ = 8.14
95 % Confidence Interval - Total N
~75~15

4/27/2010
14
Water quality standards are
developed for each water body to meet
a designated use (e.g. drinking water, recreation)
If water quality standards are not met,
the water body is considered impaired
Water Quality Standards &
Impairment

4/27/2010
15
4
5
6
7
8
9
10
11
12
0 1000 2000 3000 4000 5000 6000
Elevation (ffet)
Dis
solv
ed O
xy
gen
Sa
turati
on
Co
nce
ntr
ati
on
(m
g/L
)
10 C
20 C
30 C
Dissolved Oxygen Water
Quality Standard
Human-induced alteration of the
chemical, physical or biological
integrity of water
Water Pollution
+ Chlorine
Disinfection
Byproducts
Dissolved Organic
Carbon (DOC)

4/27/2010
16
Disinfection Byproducts
form during Chlorination
HANs
THMs
Instream DOC Dynamics
�Photodegradation
�Biodegradation
�Production - algae
DOC
Status of 303(d) List(California Surface Waters - 2006)
� ~ 779 listed waters
� ~ 2237 impairments
� ~ 167 pollutant categories
� ~ 26,700 river/coastal miles
� ~ 255,000 lake/reservoir acres

4/27/2010
17
Seasonal DOC Dynamics in Streamwaters from California Rangelands
O N D J F M A M J J A S
DO
C (
mg/L
)
0
2
4
6
8
3 mg/L
Yuba River - DOC
Oct Apr Oct Apr Oct Apr Oct Apr Oct
DO
C (
mg
/L)
0.0
0.5
1.0
1.5
2.0
2.5
3.0
1999 2000 2001 20032002

4/27/2010
18
Stream Habitat