Embed Size (px)
Citation preview
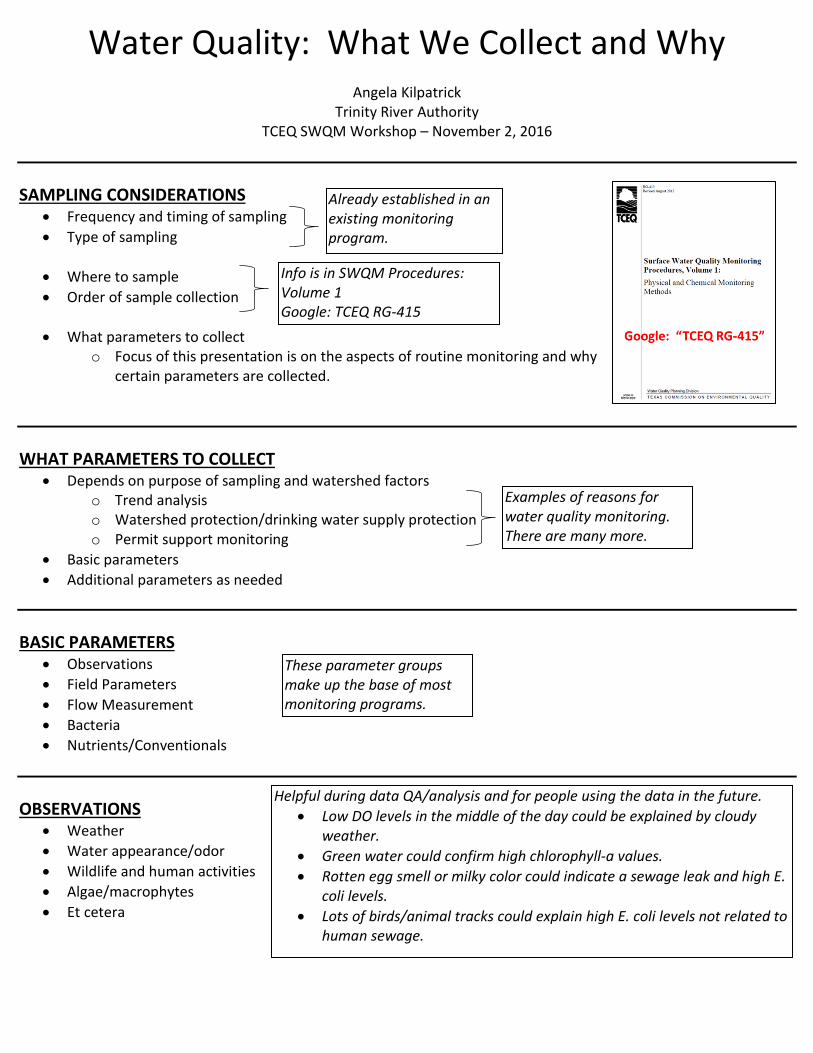
Water Quality: What We Collect and Why
Angela Kilpatrick Trinity River Authority
TCEQ SWQM Workshop – November 2, 2016 SAMPLING CONSIDERATIONS
• Frequency and timing of sampling • Type of sampling
• Where to sample • Order of sample collection
• What parameters to collect
o Focus of this presentation is on the aspects of routine monitoring and why certain parameters are collected.
WHAT PARAMETERS TO COLLECT
• Depends on purpose of sampling and watershed factors o Trend analysis o Watershed protection/drinking water supply protection o Permit support monitoring
• Basic parameters • Additional parameters as needed
BASIC PARAMETERS
• Observations • Field Parameters • Flow Measurement • Bacteria • Nutrients/Conventionals
OBSERVATIONS
• Weather • Water appearance/odor • Wildlife and human activities • Algae/macrophytes • Et cetera
Already established in an existing monitoring program.
Info is in SWQM Procedures: Volume 1 Google: TCEQ RG-415
Helpful during data QA/analysis and for people using the data in the future. • Low DO levels in the middle of the day could be explained by cloudy
weather. • Green water could confirm high chlorophyll-a values. • Rotten egg smell or milky color could indicate a sewage leak and high E.
coli levels. • Lots of birds/animal tracks could explain high E. coli levels not related to
human sewage.
Examples of reasons for water quality monitoring. There are many more.
These parameter groups make up the base of most monitoring programs.
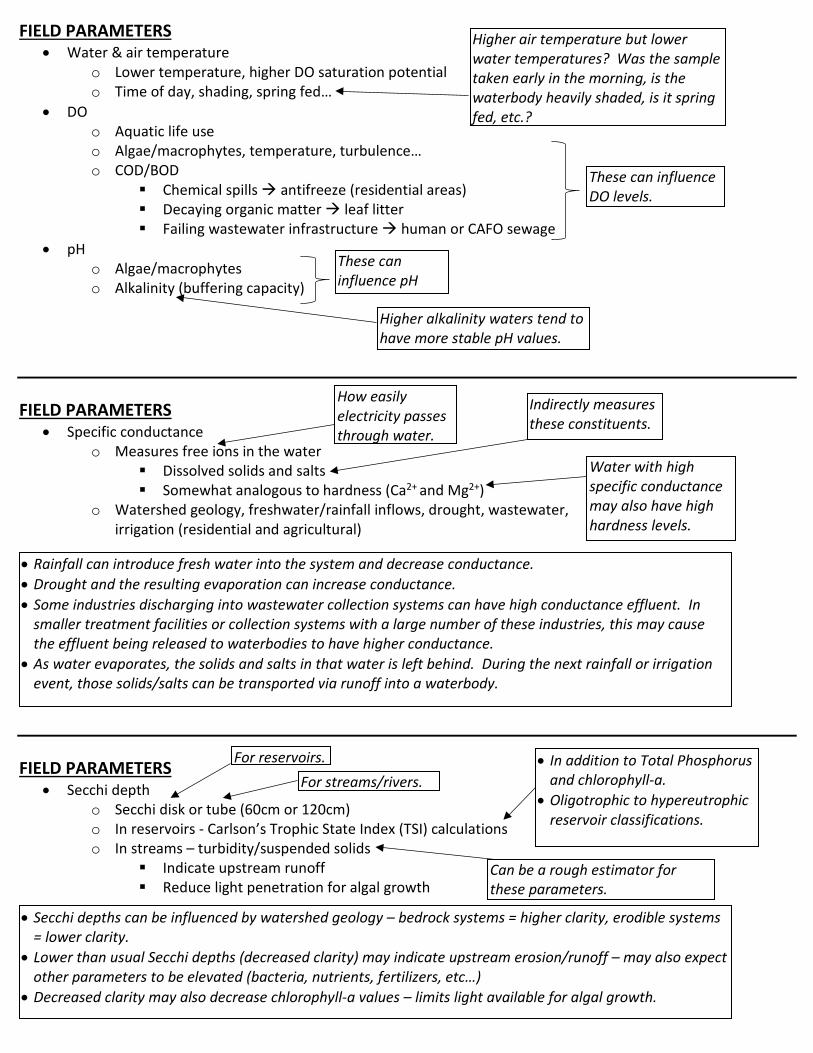
FIELD PARAMETERS • Water & air temperature
o Lower temperature, higher DO saturation potential o Time of day, shading, spring fed…
• DO o Aquatic life use o Algae/macrophytes, temperature, turbulence… o COD/BOD
Chemical spills antifreeze (residential areas) Decaying organic matter leaf litter Failing wastewater infrastructure human or CAFO sewage
• pH o Algae/macrophytes o Alkalinity (buffering capacity)
FIELD PARAMETERS
• Specific conductance o Measures free ions in the water
Dissolved solids and salts Somewhat analogous to hardness (Ca2+ and Mg2+)
o Watershed geology, freshwater/rainfall inflows, drought, wastewater, irrigation (residential and agricultural)
FIELD PARAMETERS
• Secchi depth o Secchi disk or tube (60cm or 120cm) o In reservoirs - Carlson’s Trophic State Index (TSI) calculations o In streams – turbidity/suspended solids
Indicate upstream runoff Reduce light penetration for algal growth
Higher air temperature but lower water temperatures? Was the sample taken early in the morning, is the waterbody heavily shaded, is it spring fed, etc.?
These can influence DO levels.
These can influence pH
How easily electricity passes through water.
For streams/rivers. • In addition to Total Phosphorus
and chlorophyll-a. • Oligotrophic to hypereutrophic
reservoir classifications.
• Secchi depths can be influenced by watershed geology – bedrock systems = higher clarity, erodible systems = lower clarity.
• Lower than usual Secchi depths (decreased clarity) may indicate upstream erosion/runoff – may also expect other parameters to be elevated (bacteria, nutrients, fertilizers, etc…)
• Decreased clarity may also decrease chlorophyll-a values – limits light available for algal growth.
Higher alkalinity waters tend to have more stable pH values.
Indirectly measures these constituents.
Water with high specific conductance may also have high hardness levels.
• Rainfall can introduce fresh water into the system and decrease conductance. • Drought and the resulting evaporation can increase conductance. • Some industries discharging into wastewater collection systems can have high conductance effluent. In
smaller treatment facilities or collection systems with a large number of these industries, this may cause the effluent being released to waterbodies to have higher conductance.
• As water evaporates, the solids and salts in that water is left behind. During the next rainfall or irrigation event, those solids/salts can be transported via runoff into a waterbody.
For reservoirs.
Can be a rough estimator for these parameters.
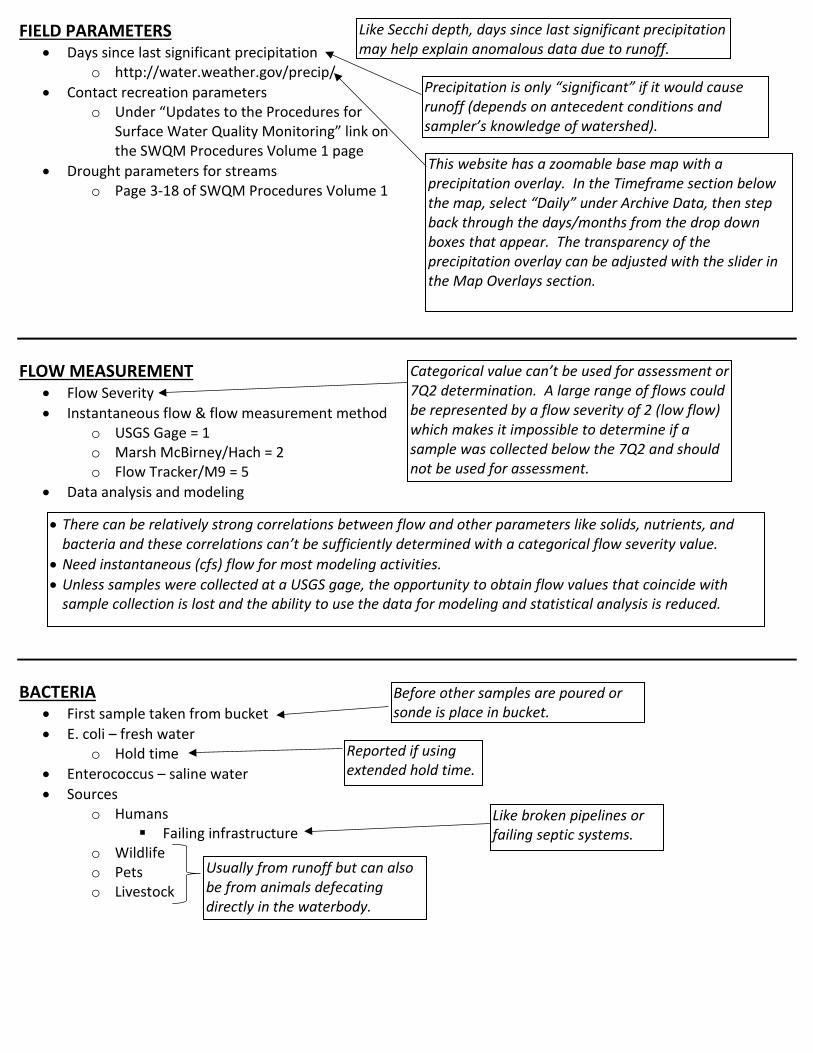
FIELD PARAMETERS • Days since last significant precipitation
o http://water.weather.gov/precip/ • Contact recreation parameters
o Under “Updates to the Procedures for Surface Water Quality Monitoring” link on the SWQM Procedures Volume 1 page
• Drought parameters for streams o Page 3-18 of SWQM Procedures Volume 1
FLOW MEASUREMENT
• Flow Severity • Instantaneous flow & flow measurement method
o USGS Gage = 1 o Marsh McBirney/Hach = 2 o Flow Tracker/M9 = 5
• Data analysis and modeling
BACTERIA
• First sample taken from bucket • E. coli – fresh water
o Hold time • Enterococcus – saline water • Sources
o Humans Failing infrastructure
o Wildlife o Pets o Livestock
Precipitation is only “significant” if it would cause runoff (depends on antecedent conditions and sampler’s knowledge of watershed).
Categorical value can’t be used for assessment or 7Q2 determination. A large range of flows could be represented by a flow severity of 2 (low flow) which makes it impossible to determine if a sample was collected below the 7Q2 and should not be used for assessment.
• There can be relatively strong correlations between flow and other parameters like solids, nutrients, and bacteria and these correlations can’t be sufficiently determined with a categorical flow severity value.
• Need instantaneous (cfs) flow for most modeling activities. • Unless samples were collected at a USGS gage, the opportunity to obtain flow values that coincide with
sample collection is lost and the ability to use the data for modeling and statistical analysis is reduced.
Before other samples are poured or sonde is place in bucket.
Reported if using extended hold time.
Usually from runoff but can also be from animals defecating directly in the waterbody.
This website has a zoomable base map with a precipitation overlay. In the Timeframe section below the map, select “Daily” under Archive Data, then step back through the days/months from the drop down boxes that appear. The transparency of the precipitation overlay can be adjusted with the slider in the Map Overlays section.
Like Secchi depth, days since last significant precipitation may help explain anomalous data due to runoff.
Like broken pipelines or failing septic systems.
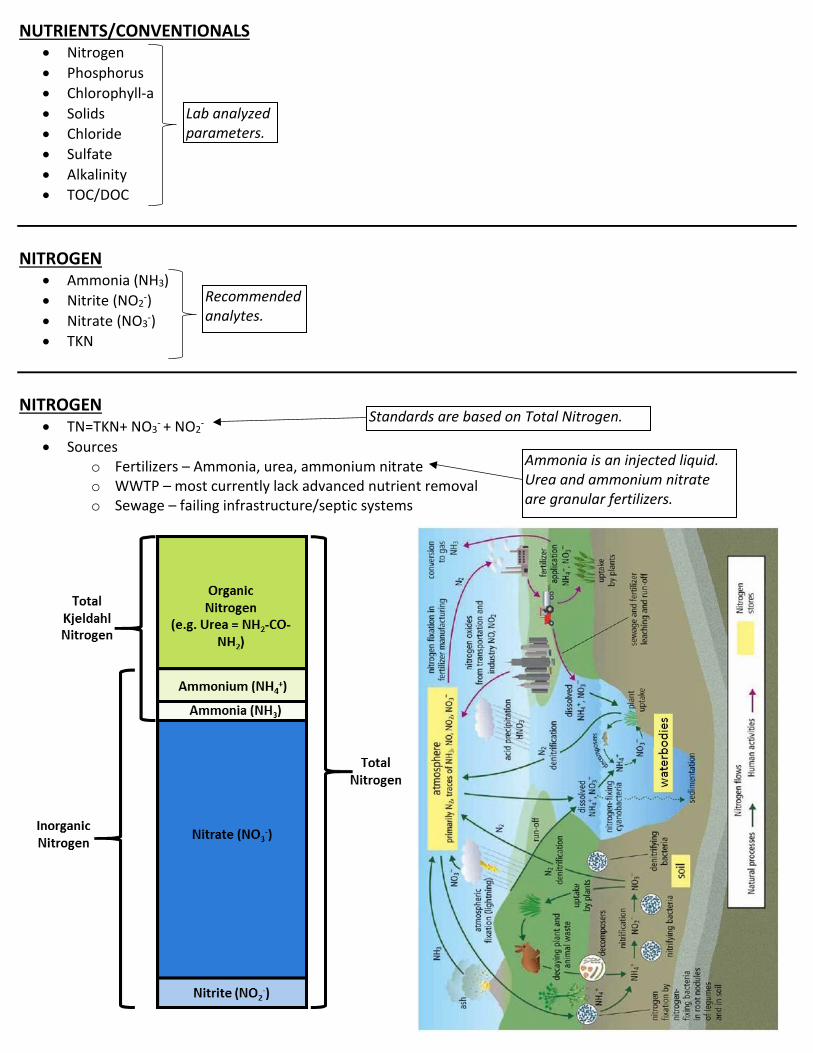
NUTRIENTS/CONVENTIONALS • Nitrogen • Phosphorus • Chlorophyll-a • Solids • Chloride • Sulfate • Alkalinity • TOC/DOC
NITROGEN
• Ammonia (NH3) • Nitrite (NO2-) • Nitrate (NO3-) • TKN
NITROGEN
• TN=TKN+ NO3- + NO2- • Sources
o Fertilizers – Ammonia, urea, ammonium nitrate o WWTP – most currently lack advanced nutrient removal o Sewage – failing infrastructure/septic systems
Lab analyzed parameters.
Recommended analytes.
Standards are based on Total Nitrogen.
Ammonia is an injected liquid. Urea and ammonium nitrate are granular fertilizers.
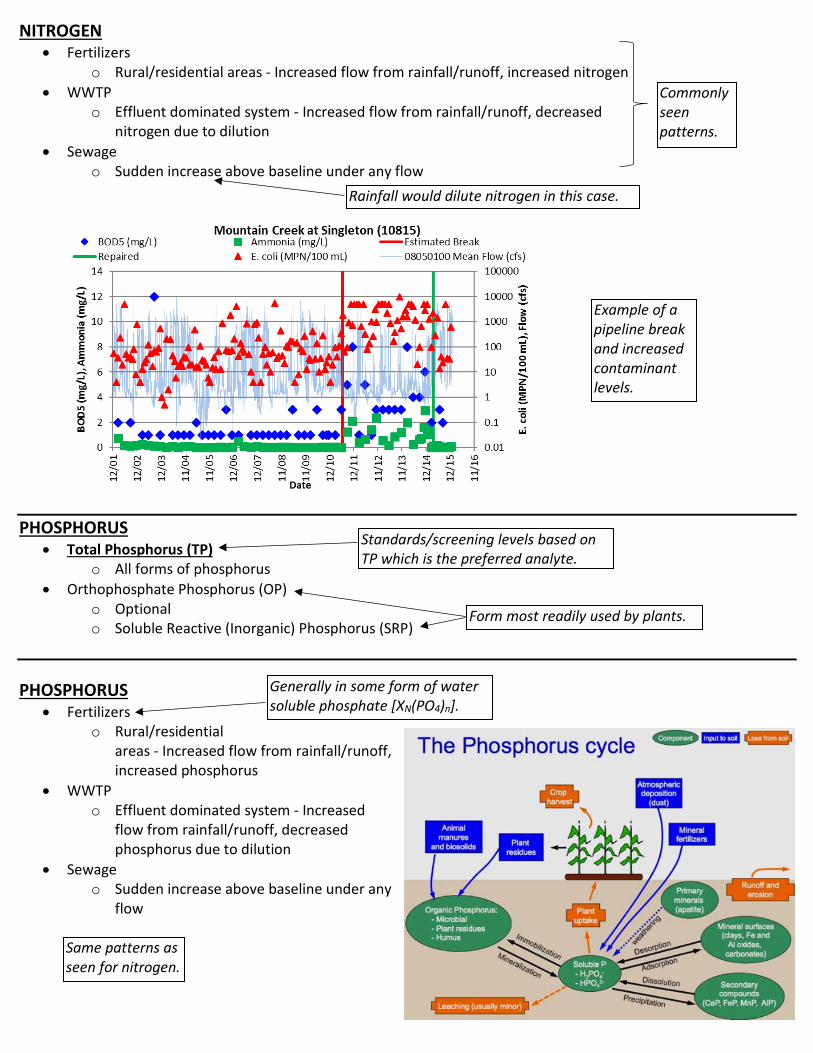
NITROGEN • Fertilizers
o Rural/residential areas - Increased flow from rainfall/runoff, increased nitrogen • WWTP
o Effluent dominated system - Increased flow from rainfall/runoff, decreased nitrogen due to dilution
• Sewage o Sudden increase above baseline under any flow
PHOSPHORUS • Total Phosphorus (TP)
o All forms of phosphorus • Orthophosphate Phosphorus (OP)
o Optional o Soluble Reactive (Inorganic) Phosphorus (SRP)
PHOSPHORUS
• Fertilizers o Rural/residential
areas - Increased flow from rainfall/runoff, increased phosphorus
• WWTP o Effluent dominated system - Increased
flow from rainfall/runoff, decreased phosphorus due to dilution
• Sewage o Sudden increase above baseline under any
flow
Commonly seen patterns.
Rainfall would dilute nitrogen in this case.
Example of a pipeline break and increased contaminant levels.
Standards/screening levels based on TP which is the preferred analyte.
Form most readily used by plants.
Same patterns as seen for nitrogen.
Generally in some form of water soluble phosphate [XN(PO4)n].
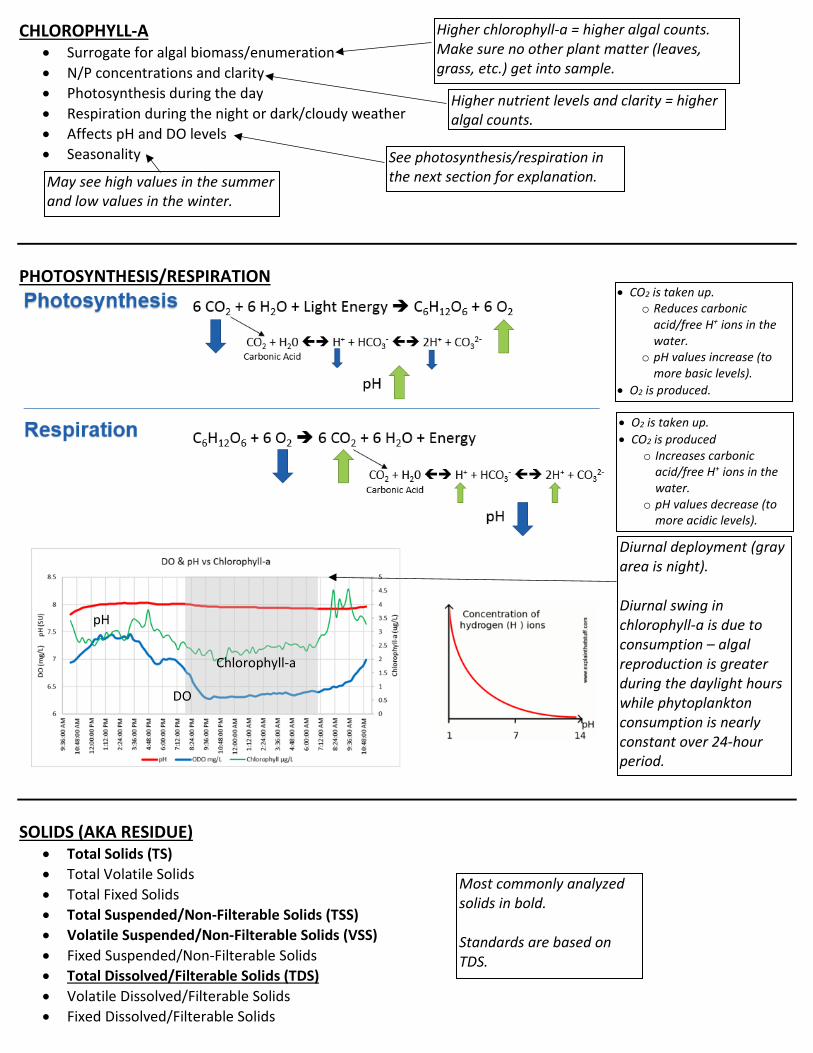
CHLOROPHYLL-A • Surrogate for algal biomass/enumeration • N/P concentrations and clarity • Photosynthesis during the day • Respiration during the night or dark/cloudy weather • Affects pH and DO levels • Seasonality
PHOTOSYNTHESIS/RESPIRATION
SOLIDS (AKA RESIDUE)
• Total Solids (TS) • Total Volatile Solids • Total Fixed Solids • Total Suspended/Non-Filterable Solids (TSS) • Volatile Suspended/Non-Filterable Solids (VSS) • Fixed Suspended/Non-Filterable Solids • Total Dissolved/Filterable Solids (TDS) • Volatile Dissolved/Filterable Solids • Fixed Dissolved/Filterable Solids
Higher chlorophyll-a = higher algal counts. Make sure no other plant matter (leaves, grass, etc.) get into sample.
Higher nutrient levels and clarity = higher algal counts.
DO
pH
Chlorophyll-a
Diurnal deployment (gray area is night). Diurnal swing in chlorophyll-a is due to consumption – algal reproduction is greater during the daylight hours while phytoplankton consumption is nearly constant over 24-hour period.
Most commonly analyzed solids in bold. Standards are based on TDS.
May see high values in the summer and low values in the winter.
See photosynthesis/respiration in the next section for explanation.
• CO2 is taken up. o Reduces carbonic
acid/free H+ ions in the water.
o pH values increase (to more basic levels).
• O2 is produced.
• O2 is taken up. • CO2 is produced
o Increases carbonic acid/free H+ ions in the water.
o pH values decrease (to more acidic levels).
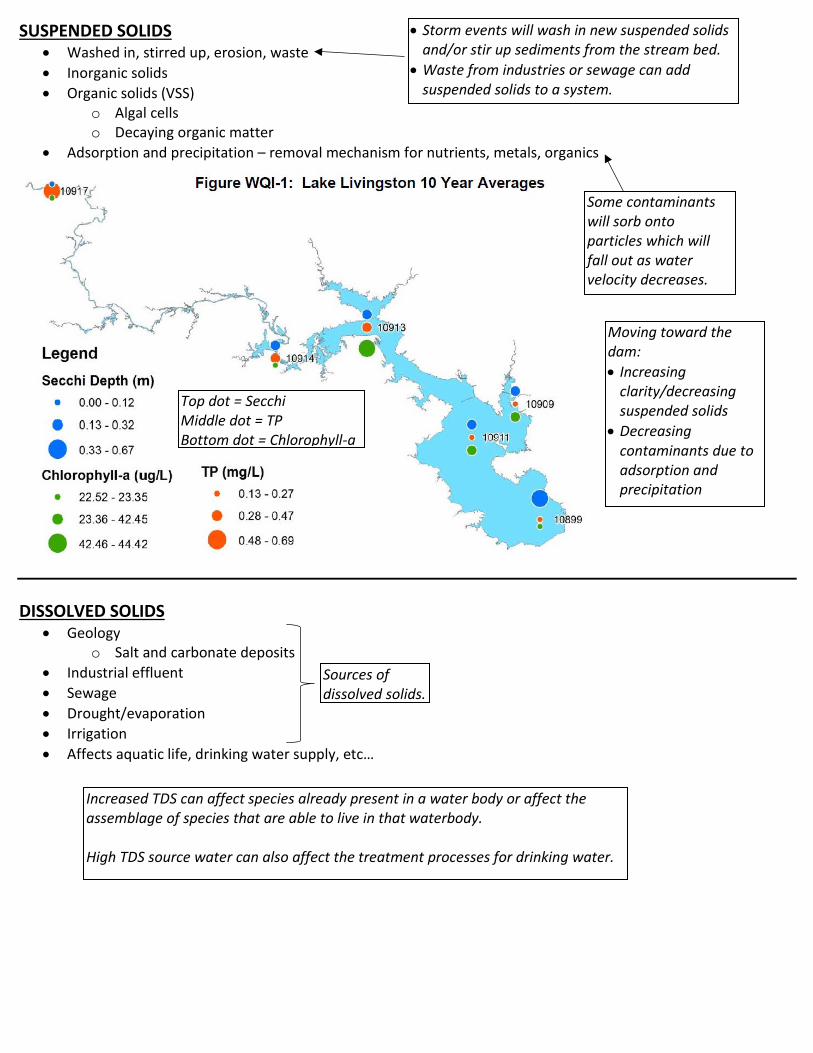
SUSPENDED SOLIDS • Washed in, stirred up, erosion, waste • Inorganic solids • Organic solids (VSS)
o Algal cells o Decaying organic matter
• Adsorption and precipitation – removal mechanism for nutrients, metals, organics
DISSOLVED SOLIDS
• Geology o Salt and carbonate deposits
• Industrial effluent • Sewage • Drought/evaporation • Irrigation • Affects aquatic life, drinking water supply, etc…
Top dot = Secchi Middle dot = TP Bottom dot = Chlorophyll-a
Moving toward the dam: • Increasing
clarity/decreasing suspended solids
• Decreasing contaminants due to adsorption and precipitation
Sources of dissolved solids.
Increased TDS can affect species already present in a water body or affect the assemblage of species that are able to live in that waterbody. High TDS source water can also affect the treatment processes for drinking water.
• Storm events will wash in new suspended solids and/or stir up sediments from the stream bed.
• Waste from industries or sewage can add suspended solids to a system.
Some contaminants will sorb onto particles which will fall out as water velocity decreases.
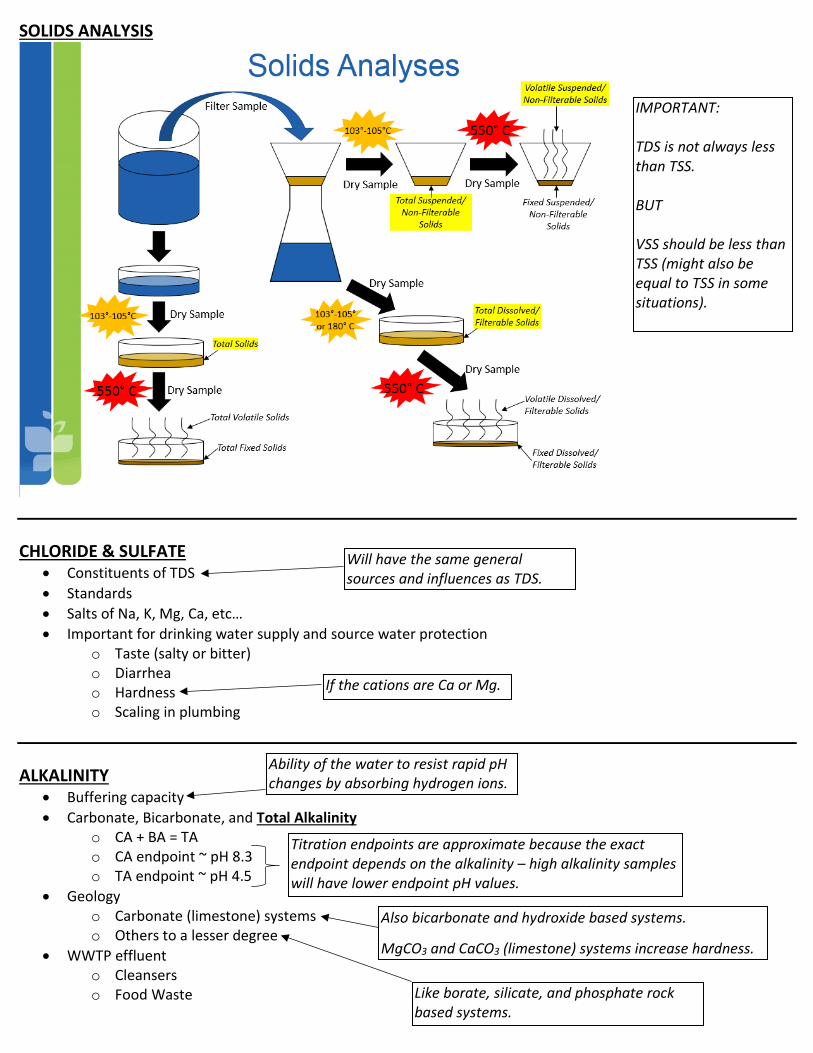
SOLIDS ANALYSIS
CHLORIDE & SULFATE
• Constituents of TDS • Standards • Salts of Na, K, Mg, Ca, etc… • Important for drinking water supply and source water protection
o Taste (salty or bitter) o Diarrhea o Hardness o Scaling in plumbing
ALKALINITY
• Buffering capacity • Carbonate, Bicarbonate, and Total Alkalinity
o CA + BA = TA o CA endpoint ~ pH 8.3 o TA endpoint ~ pH 4.5
• Geology o Carbonate (limestone) systems o Others to a lesser degree
• WWTP effluent o Cleansers o Food Waste
IMPORTANT: TDS is not always less than TSS. BUT VSS should be less than TSS (might also be equal to TSS in some situations).
Will have the same general sources and influences as TDS.
If the cations are Ca or Mg.
Titration endpoints are approximate because the exact endpoint depends on the alkalinity – high alkalinity samples will have lower endpoint pH values.
Also bicarbonate and hydroxide based systems.
MgCO3 and CaCO3 (limestone) systems increase hardness.
Like borate, silicate, and phosphate rock based systems.
Ability of the water to resist rapid pH changes by absorbing hydrogen ions.
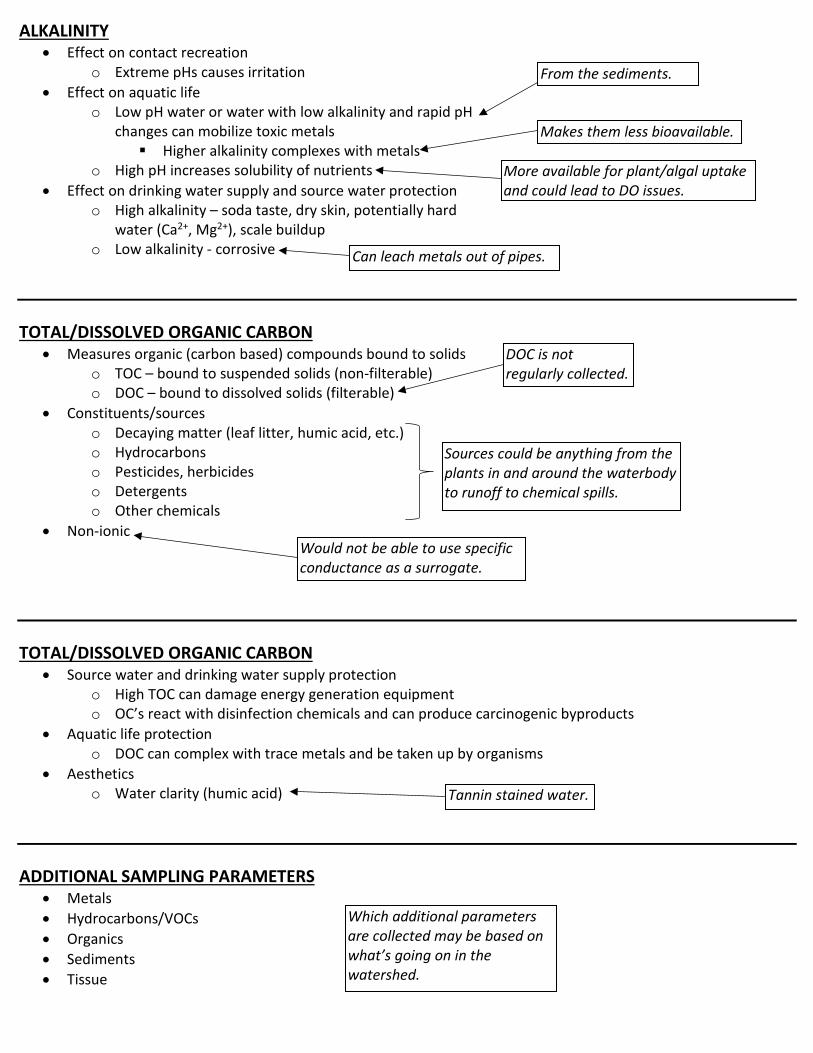
ALKALINITY • Effect on contact recreation
o Extreme pHs causes irritation • Effect on aquatic life
o Low pH water or water with low alkalinity and rapid pH changes can mobilize toxic metals Higher alkalinity complexes with metals
o High pH increases solubility of nutrients • Effect on drinking water supply and source water protection
o High alkalinity – soda taste, dry skin, potentially hard water (Ca2+, Mg2+), scale buildup
o Low alkalinity - corrosive TOTAL/DISSOLVED ORGANIC CARBON
• Measures organic (carbon based) compounds bound to solids o TOC – bound to suspended solids (non-filterable) o DOC – bound to dissolved solids (filterable)
• Constituents/sources o Decaying matter (leaf litter, humic acid, etc.) o Hydrocarbons o Pesticides, herbicides o Detergents o Other chemicals
• Non-ionic TOTAL/DISSOLVED ORGANIC CARBON
• Source water and drinking water supply protection o High TOC can damage energy generation equipment o OC’s react with disinfection chemicals and can produce carcinogenic byproducts
• Aquatic life protection o DOC can complex with trace metals and be taken up by organisms
• Aesthetics o Water clarity (humic acid)
ADDITIONAL SAMPLING PARAMETERS
• Metals • Hydrocarbons/VOCs • Organics • Sediments • Tissue
From the sediments.
Can leach metals out of pipes.
More available for plant/algal uptake and could lead to DO issues.
Would not be able to use specific conductance as a surrogate.
Which additional parameters are collected may be based on what’s going on in the watershed.
DOC is not regularly collected.
Makes them less bioavailable.
Sources could be anything from the plants in and around the waterbody to runoff to chemical spills.
Tannin stained water.
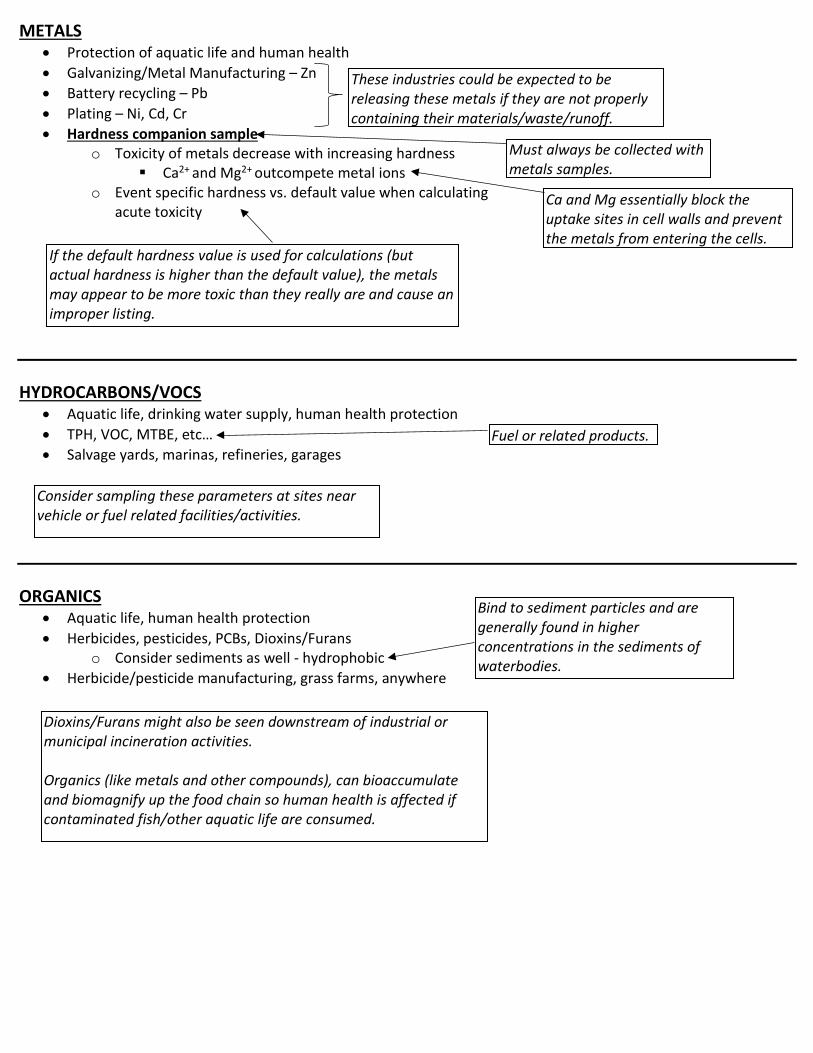
METALS • Protection of aquatic life and human health • Galvanizing/Metal Manufacturing – Zn • Battery recycling – Pb • Plating – Ni, Cd, Cr • Hardness companion sample
o Toxicity of metals decrease with increasing hardness Ca2+ and Mg2+ outcompete metal ions
o Event specific hardness vs. default value when calculating acute toxicity
HYDROCARBONS/VOCS
• Aquatic life, drinking water supply, human health protection • TPH, VOC, MTBE, etc… • Salvage yards, marinas, refineries, garages
ORGANICS
• Aquatic life, human health protection • Herbicides, pesticides, PCBs, Dioxins/Furans
o Consider sediments as well - hydrophobic • Herbicide/pesticide manufacturing, grass farms, anywhere
These industries could be expected to be releasing these metals if they are not properly containing their materials/waste/runoff.
Must always be collected with metals samples.
If the default hardness value is used for calculations (but actual hardness is higher than the default value), the metals may appear to be more toxic than they really are and cause an improper listing.
Fuel or related products.
Bind to sediment particles and are generally found in higher concentrations in the sediments of waterbodies.
Dioxins/Furans might also be seen downstream of industrial or municipal incineration activities. Organics (like metals and other compounds), can bioaccumulate and biomagnify up the food chain so human health is affected if contaminated fish/other aquatic life are consumed.
Ca and Mg essentially block the uptake sites in cell walls and prevent the metals from entering the cells.
Consider sampling these parameters at sites near vehicle or fuel related facilities/activities.
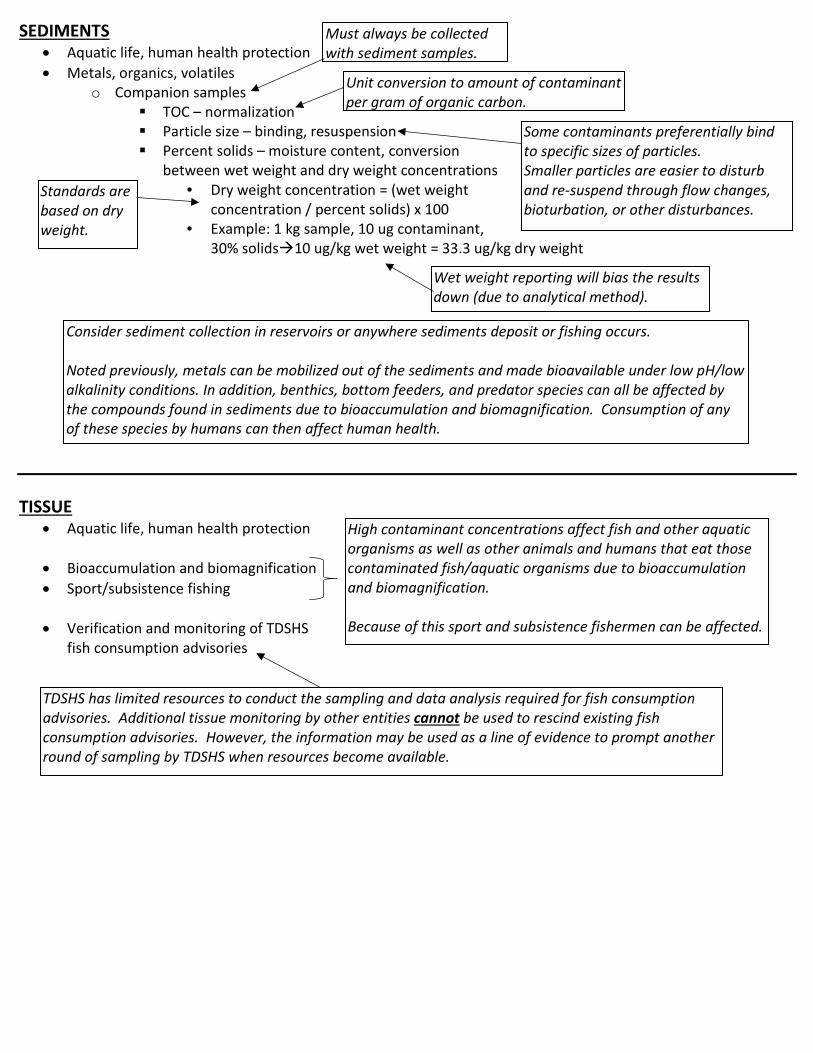
SEDIMENTS • Aquatic life, human health protection • Metals, organics, volatiles
o Companion samples TOC – normalization Particle size – binding, resuspension Percent solids – moisture content, conversion
between wet weight and dry weight concentrations • Dry weight concentration = (wet weight
concentration / percent solids) x 100 • Example: 1 kg sample, 10 ug contaminant,
30% solids10 ug/kg wet weight = 33.3 ug/kg dry weight TISSUE
• Aquatic life, human health protection
• Bioaccumulation and biomagnification • Sport/subsistence fishing
• Verification and monitoring of TDSHS
fish consumption advisories
Consider sediment collection in reservoirs or anywhere sediments deposit or fishing occurs. Noted previously, metals can be mobilized out of the sediments and made bioavailable under low pH/low alkalinity conditions. In addition, benthics, bottom feeders, and predator species can all be affected by the compounds found in sediments due to bioaccumulation and biomagnification. Consumption of any of these species by humans can then affect human health.
Must always be collected with sediment samples.
Standards are based on dry weight.
Wet weight reporting will bias the results down (due to analytical method).
High contaminant concentrations affect fish and other aquatic organisms as well as other animals and humans that eat those contaminated fish/aquatic organisms due to bioaccumulation and biomagnification. Because of this sport and subsistence fishermen can be affected.
TDSHS has limited resources to conduct the sampling and data analysis required for fish consumption advisories. Additional tissue monitoring by other entities cannot be used to rescind existing fish consumption advisories. However, the information may be used as a line of evidence to prompt another round of sampling by TDSHS when resources become available.
Unit conversion to amount of contaminant per gram of organic carbon. Some contaminants preferentially bind
to specific sizes of particles. Smaller particles are easier to disturb and re-suspend through flow changes, bioturbation, or other disturbances.
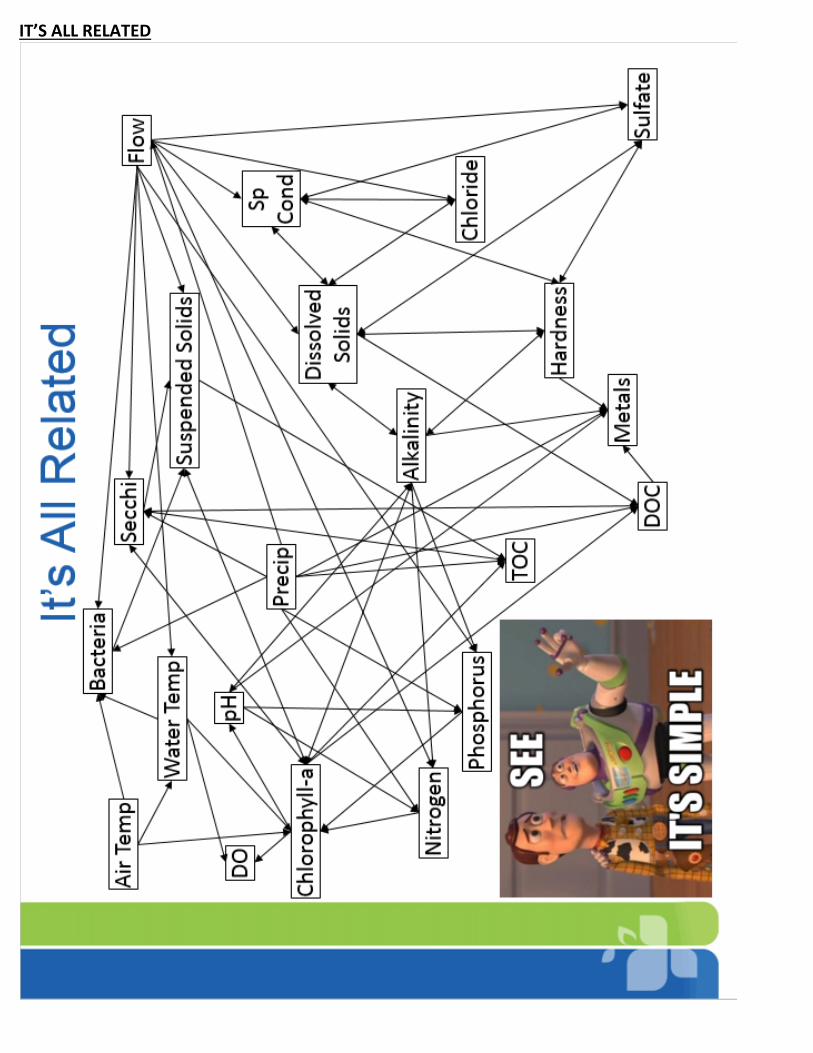
IT’S ALL RELATED