Embed Size (px)
Citation preview

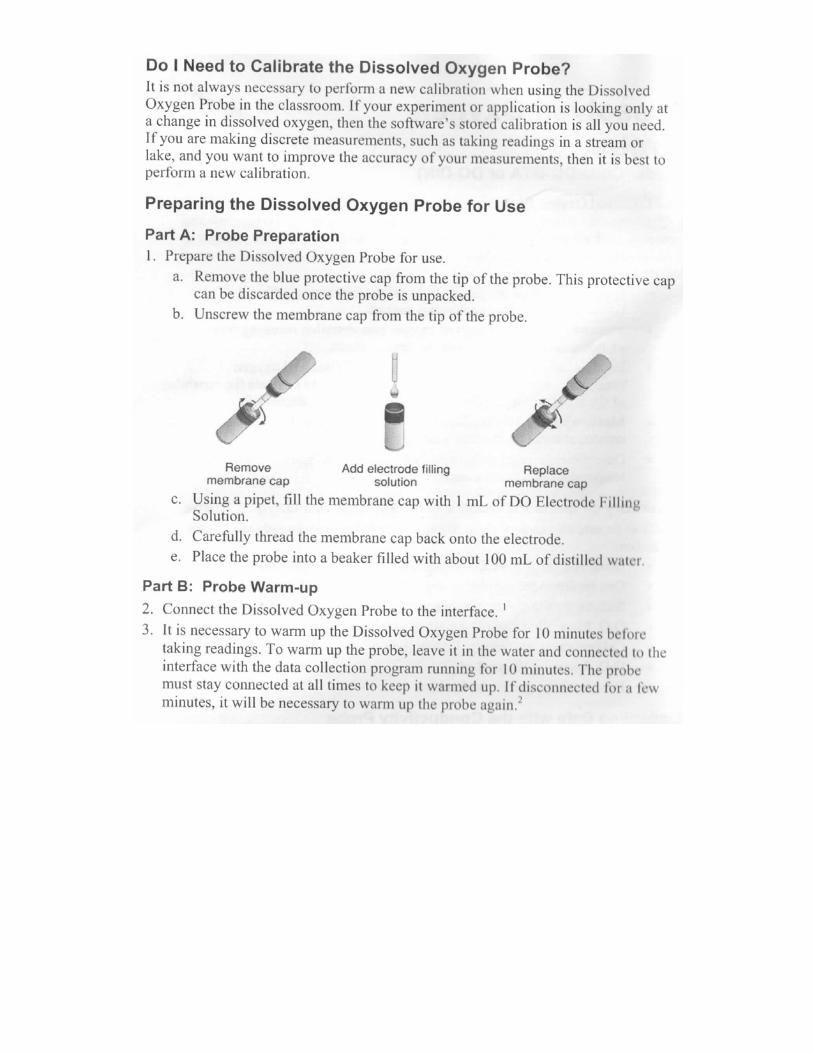
How pure is our Water? (Based on Vernier Environmental Science - 4.1)
From VernierIn the early 1970s, the National Sanitation Foundation, in cooperation with over 100 waterquality experts, devised a standard index for measuring water quality. This index, known as theWater Quality Index, or WQI, consists of nine tests to determine water quality. These nine testsare: temperature, pH, turbidity, total solids, dissolved oxygen, biochemical oxygen demand,phosphates, nitrate, and fecal coliform. A table (or graph) for each of the nine tests indicates thewater quality value (or Q-value) corresponding to the data obtained. Once the Q-value for a testhas been determined, it is multiplied by a weighting factor. Each of the tests is weighted basedon its relative importance to overall water quality.
Initiative #1 - Where have all the fishes gone?Four southern states - Louisiana, Mississippi, Alabama and Florida have claimed that the sea-water on their beaches has been has been ruined by oil leaks - they are asking us - theNDSMSTWPTF - the Notre Dame Special Middle School Teacher Water-Purity Task Force - totest the purity of their samples of water. Although the standard of WQI was established by theFederal government in 1977, they believe that our revision to these standards (see reference25)to incorporate more realistic and more easily measured parameters would be particularlyappropriate in these unique circumstances. Samples to be tested have been carefully packaged,and shipped to Notre Dame. They are hoping for an immediate response, so that the fishermenand fisherwomen of their states can be recompensed for the loss of their life’s work to the fullestextent possible.
Samples from 4 Southern Gulf states - Can the shrimp and the sea-turtles survive in this water?
Initiative #2 - Where have all the froggies gone?
The gradual disappearance in the past few years of Indiana’s Giant Jumping Frogs remains amystery. The State government is blaming the increased numbers of red-tailed deer, which seemto believe that “a frog a day keeps the hunter away”. However, the Indiana Giant-Jumping FrogSociety - the IGJFS - believes it is the lack of control of industrial emission into the 4 mainrivers of Indiana that is the root of the problem. The IGJFS has recently heard about theexpertise and efficiency of the NDSMSTWPTF - the Notre Dame Special Middle SchoolTeacher water-purity task force - in their rapid and effective analysis of oily gulf water. Theyhope that our analysis will justify their appeal to the State to clean up Indiana’s rivers.
Samples from 4 Indiana rivers - Can the Indiana Giant-Jumping frogs survive in this water?
Problem: We lost the labels on all these samples - what can we do?How can we rescue our agency’s good name by completing the evaluations of all these
samples?We need to report back to these agencies our estimation of the WQI of their samples BEFORE THE END OF TODAY!!

Unfortunately, all our trained science analysts have left for two weeks to watch the World Cup inSouth Africa. Here is a possible solution which involves training new water-purity analysts...
Plan of Lesson -
Engaging the studentsThe above story: also, reading the “research section” below; discussion of water quality - what factors could be important?Can we define what we mean by water quality? (Checking out/completing the WQI table)
[ Materials...]1. set up the testing stations
pH Dissolved oxygen Conductivity TurbidityIon concentration (4) Spectral absorption (2).
2. The 8 water samples - 1 from each “State” and “River” (divided into 2 samples each)
Preliminary Investigation Calibrating the Water Quality probes# Each group will learn how to calibrate one of 5 different Vernier sensors
pH Dissolved oxygen Conductivity Turbidity Spectral absorption (2)# That group will explain to the other groups how to do the calibration of their sensor
Helpful Note: An instruction manual is available for each sensor;2 sensors of each type are set up on separate tables; each group can calibrate one sensor, andthen use the second sensor to illustrate the calibration technique.
# FOUR groups will each calibrate one of the additional 4 ion concentration sensors.
Investigation:(helping NDSMSTWPTF)Students work in their groups to test one sample at each of the testing stations
Preliminary Analysis:Each group develops a report/table describing the water quality (the WQI) of their sample[whiteboard report]Students compare and discuss their results:
Follow-up investigation:The groups return to analyze further samples to complete all measurements necessary for thefinal report
Conclusion: Analysis and discussion of all the results in terms of a single WQI number for each sample.Final report of the whole class (the rescue of NDSMSTWPTF’s good name)
Research section - what do we mean by water quality... follow-ups: chemistry, social studies, clean up......
The resulting values for all tests are used to gauge the health of the water source(excellent, good, medium or average, fair, or poor).In this experiment, you will be performing five core WQI tests: dissolved oxygen, pH, totalturbidity, etc.... A modified version of NSF WQI Worksheet for these tests will allow you to determine the generalquality of the water source being sampled.In the Preliminary Activity, you will gain experience using a Dissolved Oxygen Probe whilemeasuring the concentration of dissolved oxygen (DO) in a water sample provided by yourteacher and then using that DO to determine the percent saturation of DO. You will also gainexperience using other probe, a Conductivity Probe, a Turbidity Sensor, several ionconcentration sensors, two spectrometers, and a pH Sensor. After completing the Preliminary Activity, you will first use reference sources to find out moreabout water quality issues before you choose and investigate a researchable question dealingwith water quality. Some topics to consider in your reference search are:
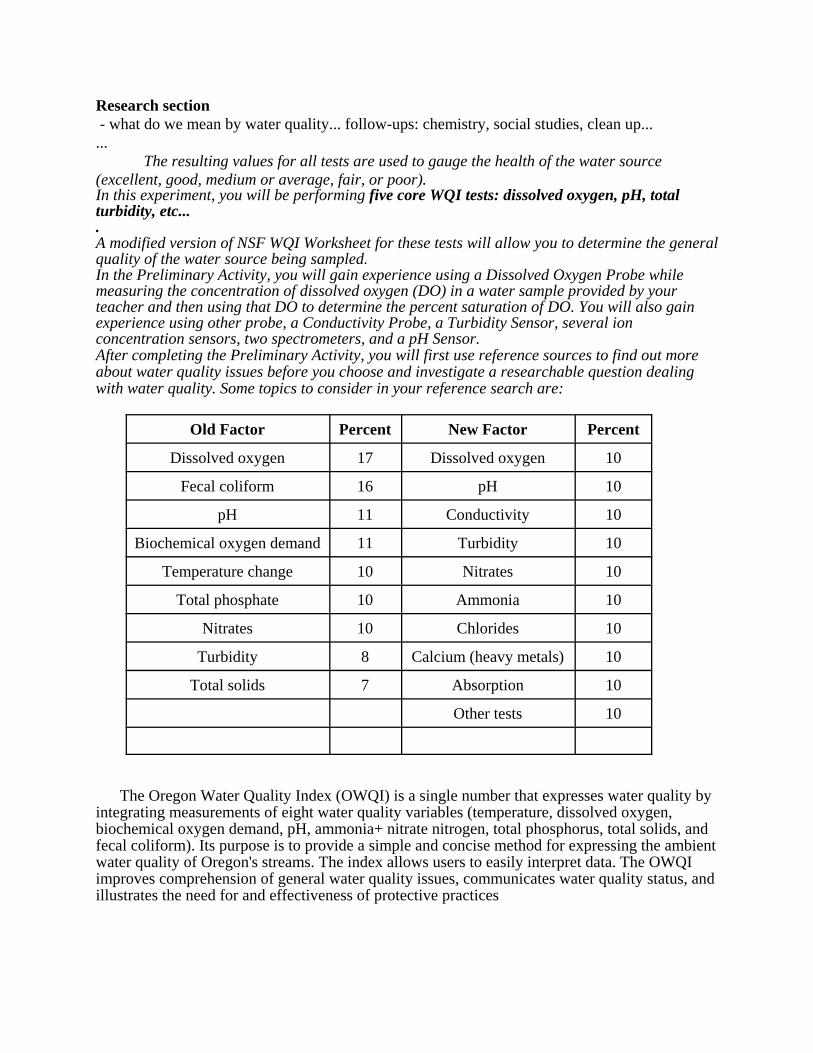
Old Factor Percent New Factor Percent
Dissolved oxygen 17 Dissolved oxygen 10
Fecal coliform 16 pH 10
pH 11 Conductivity 10
Biochemical oxygen demand 11 Turbidity 10
Temperature change 10 Nitrates 10
Total phosphate 10 Ammonia 10
Nitrates 10 Chlorides 10
Turbidity 8 Calcium (heavy metals) 10
Total solids 7 Absorption 10
Other tests 10
The Oregon Water Quality Index (OWQI) is a single number that expresses water quality byintegrating measurements of eight water quality variables (temperature, dissolved oxygen,biochemical oxygen demand, pH, ammonia+ nitrate nitrogen, total phosphorus, total solids, andfecal coliform). Its purpose is to provide a simple and concise method for expressing the ambientwater quality of Oregon's streams. The index allows users to easily interpret data. The OWQIimproves comprehension of general water quality issues, communicates water quality status, andillustrates the need for and effectiveness of protective practices

The Components of the Water Quality Index (WQI) From http://www.water-research.net/watrqualindex/index.htm
The Water Quality Index is a 100 point scale that summarizes results from a total of ninedifferent measurements when complete:
The data of each component is transformed into a 0 to 100 scale, called the Q-value - - usually by comparing the results with a graph:Here are some examples of Q-values -
1. Dissolved Oxygen (100 saturation . 10mg/L) 2. PH value
3. Turbidity 4. Nitrate Ions
Appendix about some of the probes follows:
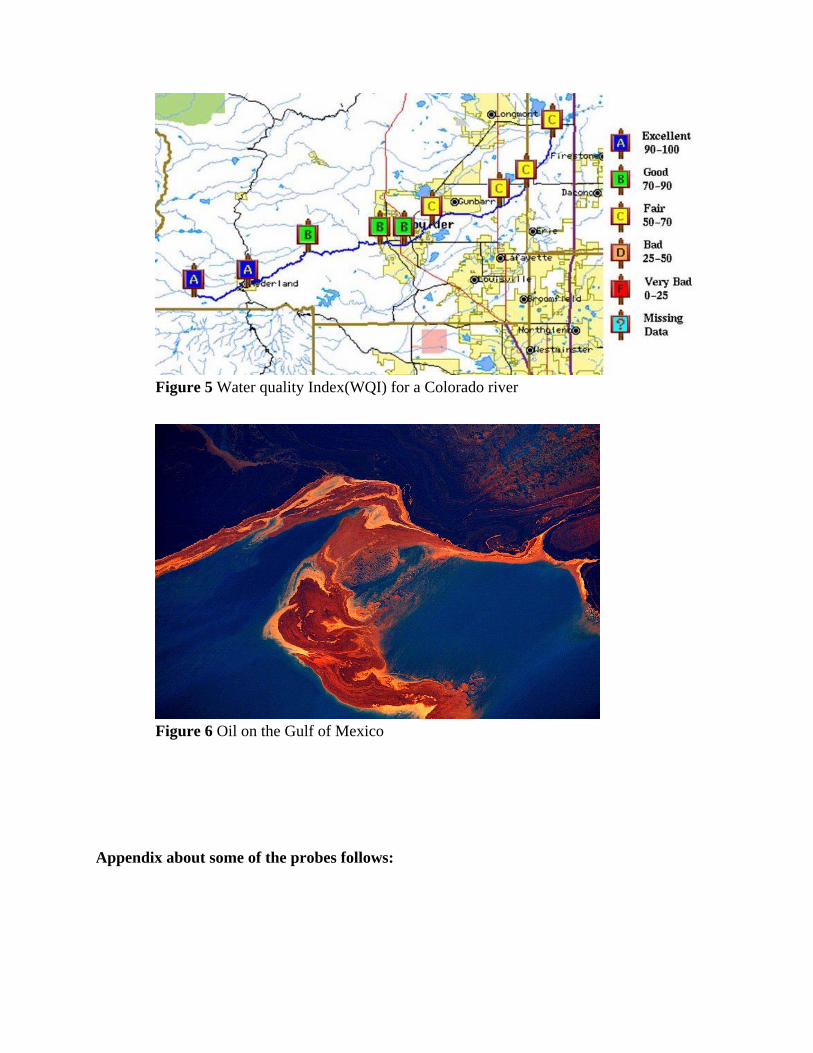
Figure 5 Water quality Index(WQI) for a Colorado river
Figure 6 Oil on the Gulf of Mexico