Embed Size (px)
Citation preview
I N T E G R A T E D W A T E R M A N A G E M E N T
VolumeRegional Reports3
California Water PlanUpdate 2009
B u l l e t i n 1 6 0 - 0 9 • D e p a r t m e n t o f W a t e r R e s o u r c e s
Colorado River
Arnold SchwarzeneggerGovernor
State of California
Lester A. SnowSecretary for Natural ResourcesThe Natural Resources Agency
Mark W. CowinDirector
Department of Water Resources
DEPA
RTMENT OF WATER RESOURCES
STATE OF CALIFORNIA
**Insert holder for CD inside of back cover**
California Water Plan Update 2009 I n t e g ra t e d Wa t e r M a n a g e m e n t
NORTHLAHONTAN
SOUTHLAHONTANTULARE
LAKE
S A N J O A Q U I NR I V E R
S A NF R A N C I S C O
B A Y
CENTRALCOAST
N O R T HC O A S T
SACRAMENTORIVER
COLORADORIVER
SOUTH COAST
NorthernRegion
North CentralRegion
South CentralRegion
SouthernRegion
San Bernardino
Imperial
Riverside
San Diego
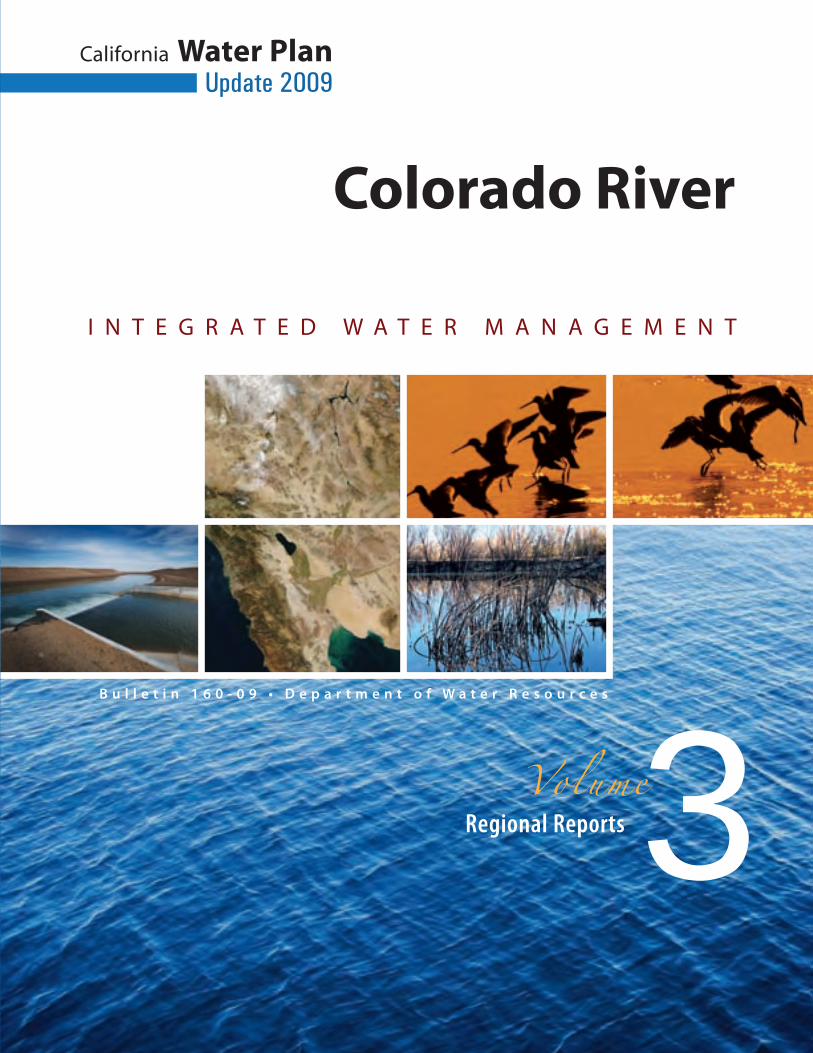
Southern Region Office The Division of Integrated Regional Water Management assists public and private agencies and the general public with water issues throughout the state. Four regional offices are located throughout California to maintain close contact with local interests to facilitate communication and to work on water-related matters. The offices are:
Northern Region in Red Bluff, • North Central Region in West Sacramento, • South Central Region in Fresno, and • Southern Region in Glendale. •
Each of the regional offices offers technical guidance and assistance in water resource engineering, project management, hydrology, groundwater, water quality, environmental analysis and restoration, surveying, mapping, water conservation, and other related areas within the boundaries of their offices. Because of the regional offices’ close ties with local interests, DWR regional coordinators in each office facilitate overall communication between DWR divisions and local partners to ensure coordinated efforts throughout all DWR programs and projects.
For more information on DWR and DWR projects, please contact the Regional Coordinators at: [email protected]
Southern Region Office address: 770 Fairmont Avenue, Suite 102Glendale, CA 91203-1035Southern Region Office phone number:(818) 500-1645Department of Water Resources’ website:http://www.water.ca.gov/
The California Water Plan provides a framework for resource managers, legislators, Tribes, other decision-makers, and the public to consider options and make decisions regarding California’s water future. Our goal is that this document meet Water Code requirements, receive broad support among those participating in California’s water planning, and be a useful document. With its partners, DWR completed the final Update 2009 volumes and Highlights in December 2009.
The first four volumes of the update and the Highlights booklet are contained on the CD attached below. All five volumes of the update and related materials are also available online at www.waterplan.water.ca.gov.
Volume 1: The Strategic Plan Volume 2: Resource Management Strategies Volume 3: Regional ReportsVolume 4: Reference GuideVolume 5: Technical Guide
For printed copies of the Highlights, Volume 1, 2, or 3, call 1-916-653-1097. If you need this publication in alternate form, contact the Public Affairs Office at 1-800-272-8869.
Cover Photos:1. 5. Aerial view of Salton Sea2. 3. Birds on Salton Sea4. Newly lined All American Canal6. Pond in burn area of Salton Sea
1
4
2
5
3
6
C a l i f o r n i a w a t e r p l a n | u p d a t e 2 0 0 9
Colorado r iver Hydrologic region
C R - 1
ContentsColorado River Hydrologic Region .........................................................................CR-3
Setting ..................................................................................................................... CR-3Watersheds ...................................................................................................... CR-5Ecosystems ...................................................................................................... CR-8Climate ............................................................................................................ CR-9Population ..................................................................................................... CR-10Land Use Patterns ......................................................................................... CR-11
Regional Water Conditions ................................................................................... CR-13Environmental Water ..................................................................................... CR-13Water Supplies............................................................................................... CR-15Water Uses..................................................................................................... CR-18Water Balance Summary ............................................................................... CR-21Water Quality ................................................................................................ CR-23Water Governance ......................................................................................... CR-25
Flood Management ............................................................................................... CR-26Flood Hazards ............................................................................................... CR-26Historic Floods .............................................................................................. CR-26Flood Governance ......................................................................................... CR-26Flood Risk Management ............................................................................... CR-26
Regional Water and Flood Planning and Management ......................................... CR-30Integrated Regional Water Management ....................................................... CR-31Recent Accomplishments .............................................................................. CR-31Challenges ..................................................................................................... CR-37Drought and Flood Planning ......................................................................... CR-38
Looking to the Future ............................................................................................ CR-39Future Scenarios ............................................................................................ CR-39Response Strategies ....................................................................................... CR-42
Appendix A. Flood Management ..........................................................................CRA-1Historic Floods ............................................................................................. CRA-1Flood Governance ........................................................................................ CRA-2Flood Risk Management .............................................................................. CRA-4
Regional Water and Flood Planning and Management ........................................ CRA-4Integrated Regional Water Management ...................................................... CRA-4
Appendix B. Selected References ..........................................................................CRB-1Watersheds ................................................................................................... CRB-1Ecosystems ................................................................................................... CRB-1Climate ......................................................................................................... CRB-1Water Use .................................................................................................... CRB-1Water Quality ............................................................................................... CRB-2Water Governance ........................................................................................ CRB-2Flood Management ....................................................................................... CRB-2Relationships with Other Regions ................................................................ CRB-3Accomplishments ......................................................................................... CRB-3Challenges .................................................................................................... CRB-3
C a l i f o r n i a w a t e r p l a n | u p d a t e 2 0 0 9
Volume 3 - Regional Repor ts
C R - 2
FiguresFigure CR-1 Colorado River Hydrologic Region 2005 inflows and outflows .......... CR-4Figure CR-2 Watersheds in the Colorado River Hydrologic Region ......................... CR-5Figure CR-3 Colorado River Hydrologic Region water balance summary,
1998-2005 ........................................................................................... CR-22Figure CR-4 Regional acceptance process IRWM regions, Colorado River
Hydrologic Region .............................................................................. CR-32Figure CR-5 2050 Water demand changes, Colorado River Hydrologic Region .... CR-41
TablesTable CR-1 Granted Tribal lands with acreage, Colorado River Hydrologic
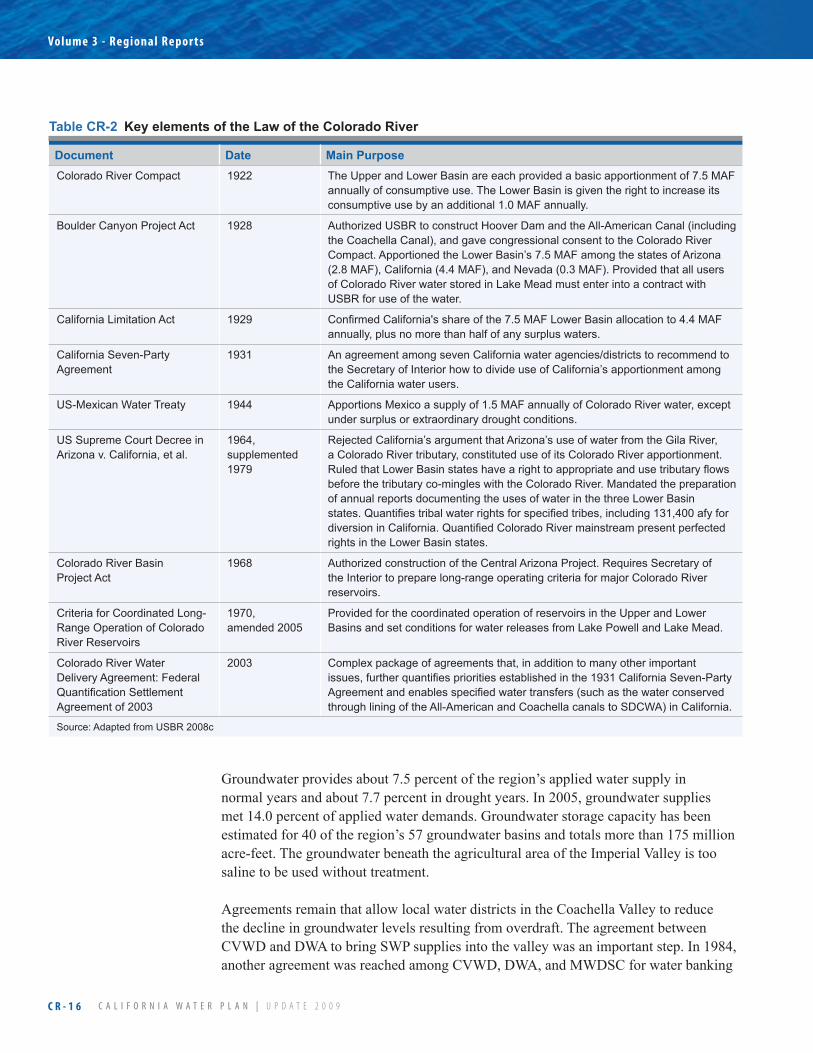
Region .................................................................................................. CR-14Table CR-2 Key elements of the Law of the Colorado River .................................. CR-16Table CR-3 Annual intrastate apportionment of water from the Colorado River
mainstream within California under the Seven Party Agreementa .....................CR-17
Table CR-4 Annual apportionment of use of Colorado River water........................ CR-17Table CR-5 Colorado River water delivery agreement: Federal Quantification
Settlement Agreement of 2003 for Priorities 1-3. Quantification and annual approved net consumptive use of Colorado River water by California agricultural agencies ............................................................ CR-19
Table CR-6 Water sales, Imperial Irrigation District ............................................... CR-19Table CR-7 Colorado River Hydrologic Region water balance for 1998-2005
(thousand acre-feet) .............................................................................. CR-24Table CR-8 Strategies for integrated regional water management efforts,
Colorado River Hydrologic Region ..................................................... CR-33Table CRA-1 Record floods for selected streams ................................................... CRA-1Table CRA-2 Flood management participants ........................................................ CRA-3Table CRA-3 Flood control facilities, Colorado River Hydrologic Region ........... CRA-5Table CRA-4 Flood emergency responders, Colorado River Hydrologic Region . CRA-5
BoxesBox CR-1 Acronyms and Abbreviations Used in This Report .................................. CR-6Box CR-2 California Native American Tribal Information, Colorado River
Hydrologic Region ................................................................................. CR-11Box CR-3 Implementation of the Federal Quantification Settlement Agreement ... CR-18Box CR-4 Flood Management Agencies ................................................................. CR-27Box CR-5 Scenario Descriptions ............................................................................. CR-40Box CRA-1 Selection Criteria ................................................................................. CRA-1
C a l i f o r n i a w a t e r p l a n | u p d a t e 2 0 0 9
Colorado r iver Hydrologic region
C R - 3
Colorado River Hydrologic Region
Setting
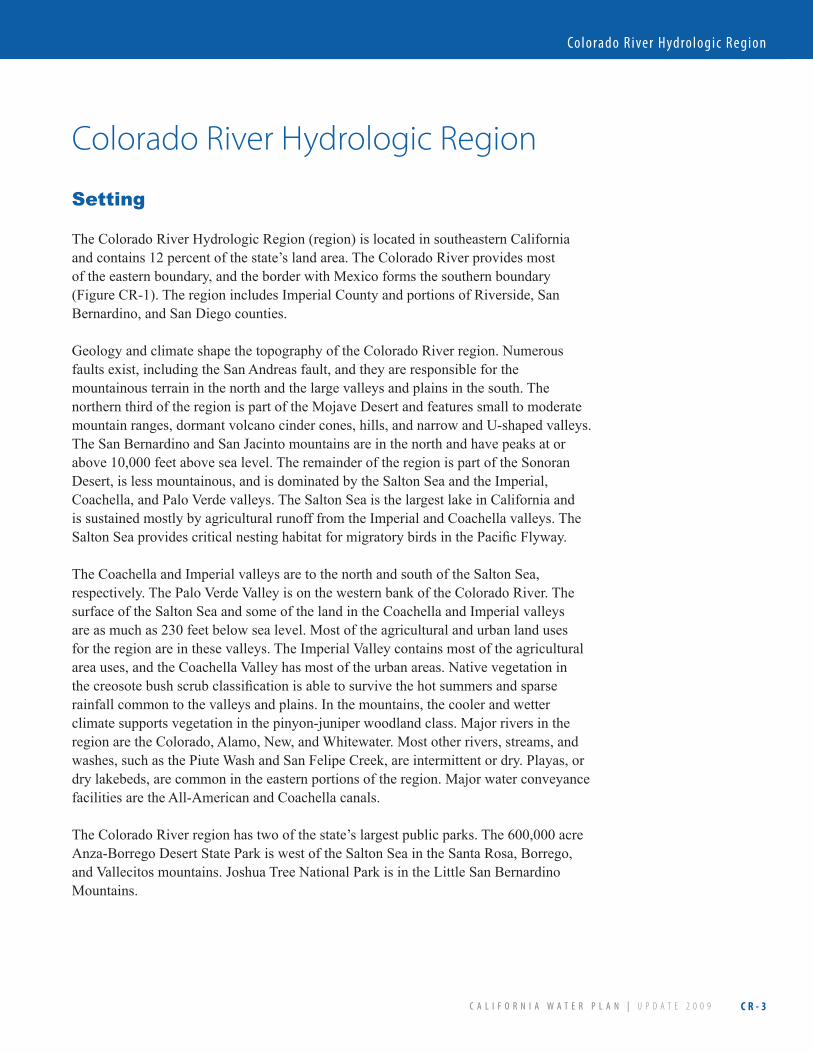
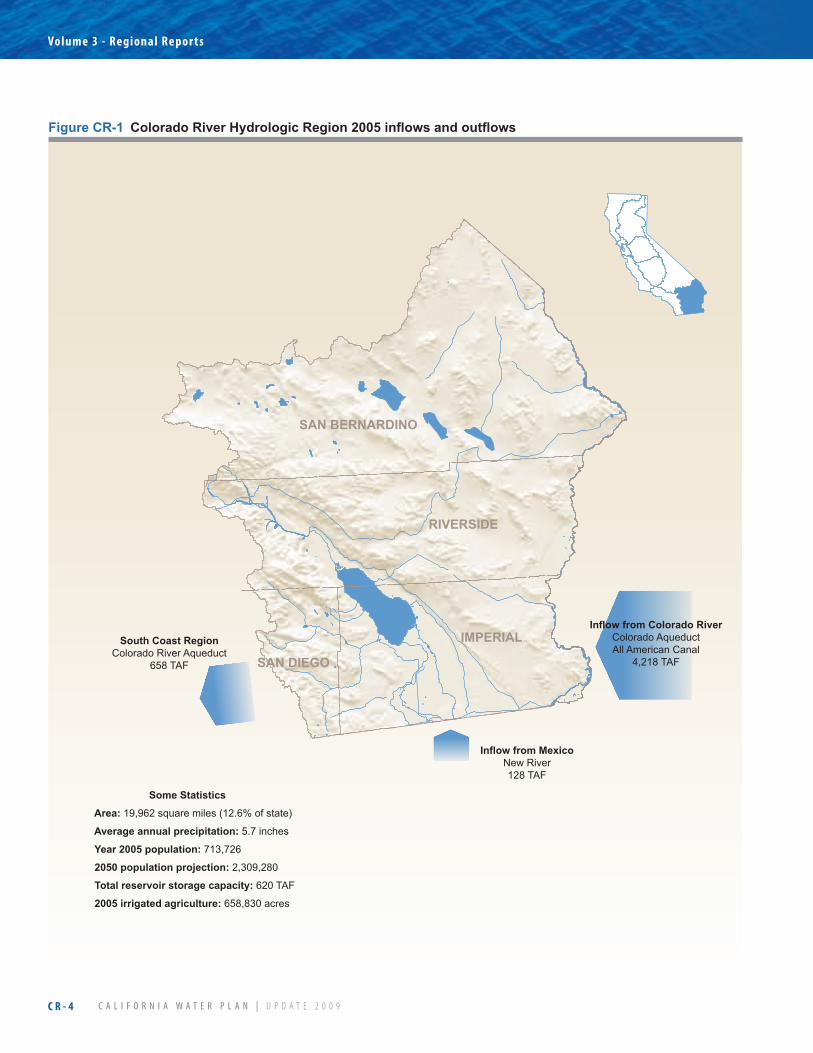
The Colorado River Hydrologic Region (region) is located in southeastern California and contains 12 percent of the state’s land area. The Colorado River provides most of the eastern boundary, and the border with Mexico forms the southern boundary (Figure CR-1). The region includes Imperial County and portions of Riverside, San Bernardino, and San Diego counties.
Geology and climate shape the topography of the Colorado River region. Numerous faults exist, including the San Andreas fault, and they are responsible for the mountainous terrain in the north and the large valleys and plains in the south. The northern third of the region is part of the Mojave Desert and features small to moderate mountain ranges, dormant volcano cinder cones, hills, and narrow and U-shaped valleys. The San Bernardino and San Jacinto mountains are in the north and have peaks at or above 10,000 feet above sea level. The remainder of the region is part of the Sonoran Desert, is less mountainous, and is dominated by the Salton Sea and the Imperial, Coachella, and Palo Verde valleys. The Salton Sea is the largest lake in California and is sustained mostly by agricultural runoff from the Imperial and Coachella valleys. The Salton Sea provides critical nesting habitat for migratory birds in the Pacific Flyway.
The Coachella and Imperial valleys are to the north and south of the Salton Sea, respectively. The Palo Verde Valley is on the western bank of the Colorado River. The surface of the Salton Sea and some of the land in the Coachella and Imperial valleys are as much as 230 feet below sea level. Most of the agricultural and urban land uses for the region are in these valleys. The Imperial Valley contains most of the agricultural area uses, and the Coachella Valley has most of the urban areas. Native vegetation in the creosote bush scrub classification is able to survive the hot summers and sparse rainfall common to the valleys and plains. In the mountains, the cooler and wetter climate supports vegetation in the pinyon-juniper woodland class. Major rivers in the region are the Colorado, Alamo, New, and Whitewater. Most other rivers, streams, and washes, such as the Piute Wash and San Felipe Creek, are intermittent or dry. Playas, or dry lakebeds, are common in the eastern portions of the region. Major water conveyance facilities are the All-American and Coachella canals.
The Colorado River region has two of the state’s largest public parks. The 600,000 acre Anza-Borrego Desert State Park is west of the Salton Sea in the Santa Rosa, Borrego, and Vallecitos mountains. Joshua Tree National Park is in the Little San Bernardino Mountains.
C a l i f o r n i a w a t e r p l a n | u p d a t e 2 0 0 9
Volume 3 - Regional Repor ts
C R - 4
Figure CR-1 �Colorado�River�Hydrologic�Region�2005�inflows�and�outflows�
IMPERIAL
RIVERSIDE
SAN BERNARDINO
SAN DIEGO
Some Statistics
Area: 19,962 square miles (12.6% of state)
Average annual precipitation: 5.7 inches
Year 2005 population: 713,726
2050 population projection: 2,309,280
Total reservoir storage capacity: 620 TAF
2005 irrigated agriculture: 658,830 acres
Inflow from Colorado RiverColorado AqueductAll American Canal
4,218 TAF
Inflow from MexicoNew River128 TAF
South Coast RegionColorado River Aqueduct
658 TAF
C a l i f o r n i a w a t e r p l a n | u p d a t e 2 0 0 9
Colorado r iver Hydrologic region
C R - 5
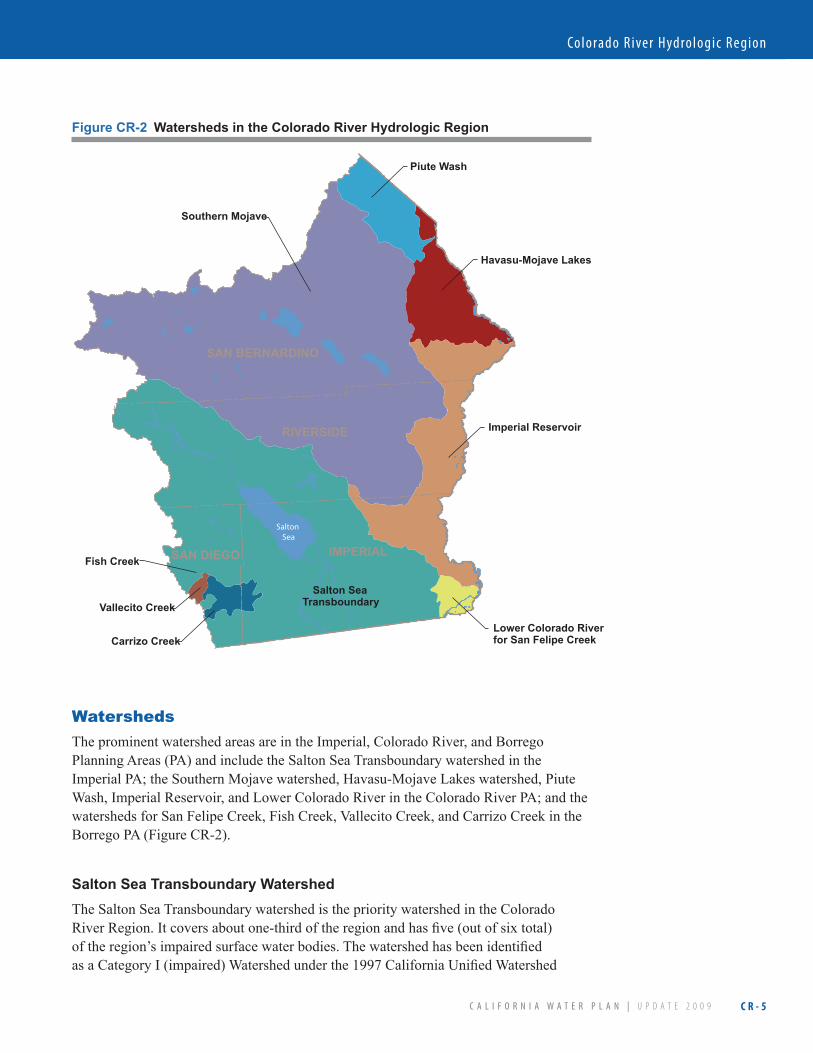
WatershedsThe prominent watershed areas are in the Imperial, Colorado River, and Borrego Planning Areas (PA) and include the Salton Sea Transboundary watershed in the Imperial PA; the Southern Mojave watershed, Havasu-Mojave Lakes watershed, Piute Wash, Imperial Reservoir, and Lower Colorado River in the Colorado River PA; and the watersheds for San Felipe Creek, Fish Creek, Vallecito Creek, and Carrizo Creek in the Borrego PA (Figure CR-2).
Salton�Sea�Transboundary�WatershedThe Salton Sea Transboundary watershed is the priority watershed in the Colorado River Region. It covers about one-third of the region and has five (out of six total) of the region’s impaired surface water bodies. The watershed has been identified as a Category I (impaired) Watershed under the 1997 California Unified Watershed
Figure CR-2 �Watersheds�in�the�Colorado�River�Hydrologic�Region
SAN BERNARDINO
RIVERSIDE
IMPERIALSAN DIEGO
Piute Wash
Southern Mojave
Havasu-Mojave Lakes
Imperial Reservoir
Fish Creek
Vallecito Creek
Carrizo CreekLower Colorado Riverfor San Felipe Creek
Salton SeaTransboundary
SaltonSea
C a l i f o r n i a w a t e r p l a n | u p d a t e 2 0 0 9
Volume 3 - Regional Repor ts
C R - 6
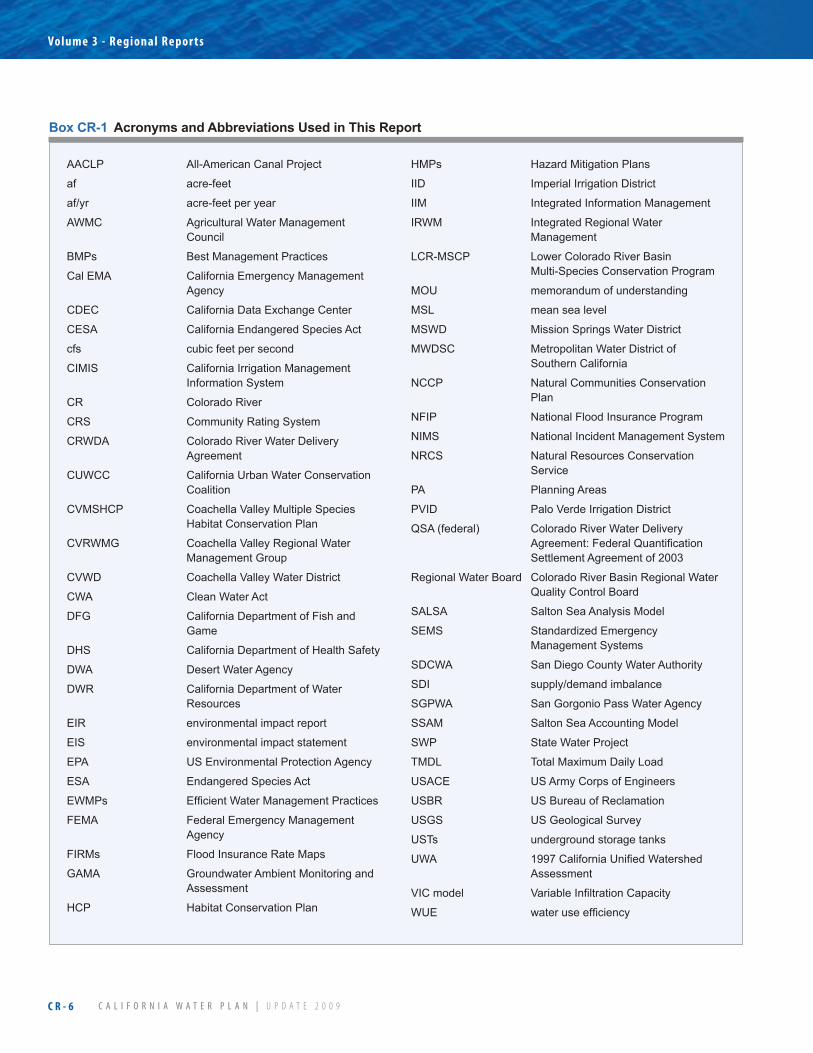
AACLP All-American Canal Project
af acre-feet
af/yr acre-feet per year
AWMC Agricultural Water Management Council
BMPs Best Management Practices
Cal EMA California Emergency Management Agency
CDEC California Data Exchange Center
CESA California Endangered Species Act
cfs cubic feet per second
CIMIS California Irrigation Management Information System
CR Colorado River
CRS Community Rating System
CRWDA Colorado River Water Delivery Agreement
CUWCC California Urban Water Conservation Coalition
CVMSHCP Coachella Valley Multiple Species Habitat Conservation Plan
CVRWMG Coachella Valley Regional Water Management Group
CVWD Coachella Valley Water District
CWA Clean Water Act
DFG California Department of Fish and Game
DHS California Department of Health Safety
DWA Desert Water Agency
DWR California Department of Water Resources
EIR environmental impact report
EIS environmental impact statement
EPA US Environmental Protection Agency
ESA Endangered Species Act
EWMPs EfficientWaterManagementPractices
FEMA Federal Emergency Management Agency
FIRMs Flood Insurance Rate Maps
GAMA Groundwater Ambient Monitoring and Assessment
HCP Habitat Conservation Plan
HMPs Hazard Mitigation Plans
IID Imperial Irrigation District
IIM Integrated Information Management
IRWM Integrated Regional Water Management
LCR-MSCP Lower Colorado River Basin Multi-Species Conservation Program
MOU memorandum of understanding
MSL mean sea level
MSWD Mission Springs Water District
MWDSC Metropolitan Water District of Southern California
NCCP Natural Communities Conservation Plan
NFIP National Flood Insurance Program
NIMS National Incident Management System
NRCS Natural Resources Conservation Service
PA Planning Areas
PVID Palo Verde Irrigation District
QSA (federal) Colorado River Water Delivery Agreement:FederalQuantificationSettlement Agreement of 2003
Regional Water Board Colorado River Basin Regional Water Quality Control Board
SALSA Salton Sea Analysis Model
SEMS Standardized Emergency Management Systems
SDCWA San Diego County Water Authority
SDI supply/demand imbalance
SGPWA San Gorgonio Pass Water Agency
SSAM Salton Sea Accounting Model
SWP State Water Project
TMDL Total Maximum Daily Load
USACE US Army Corps of Engineers
USBR US Bureau of Reclamation
USGS US Geological Survey
USTs underground storage tanks
UWA 1997CaliforniaUnifiedWatershed Assessment
VICmodel VariableInfiltrationCapacity
WUE wateruseefficiency
Box CR-1 Acronyms�and�Abbreviations�Used�in�This�Report
C a l i f o r n i a w a t e r p l a n | u p d a t e 2 0 0 9
Colorado r iver Hydrologic region
C R - 7
Assessment. A priority watershed is one where management has agreed to focus resources to protect and restore waters. The watershed is in both Riverside and Imperial counties.
Major agricultural operations occur in the Coachella Valley (Riverside County) and in Imperial Valley (Imperial County). Most of the agricultural crop and land acres are in Imperial Valley. A mix of urban and agricultural land use activities occur in the Coachella Valley with the urban area undergoing expansion over the last two decades. Major cities in the watershed include Palm Springs and Indio in the north and El Centro and Calexico in the south. Colorado River water supplies are imported into the watershed through the All-American and Coachella canals and are used to meet the urban, commercial, industrial, and agricultural demands. Groundwater basins are the primary source of water for urban and agricultural water users in the Coachella Valley.
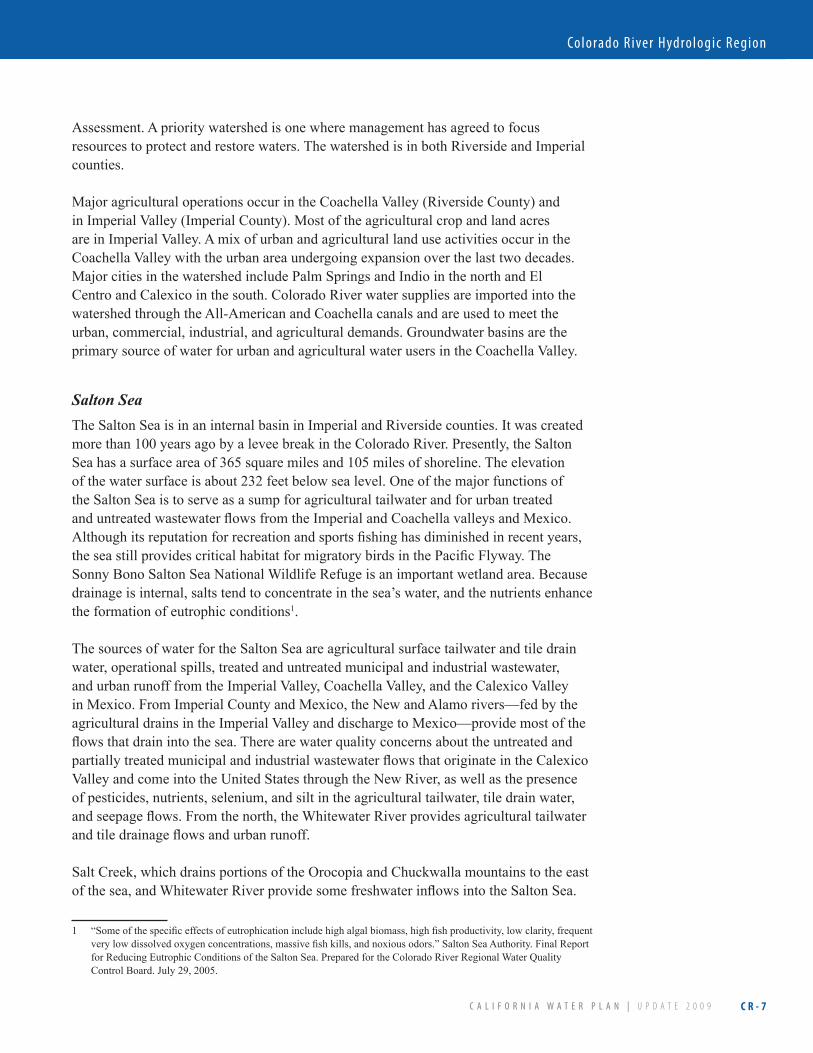
Salton SeaThe Salton Sea is in an internal basin in Imperial and Riverside counties. It was created more than 100 years ago by a levee break in the Colorado River. Presently, the Salton Sea has a surface area of 365 square miles and 105 miles of shoreline. The elevation of the water surface is about 232 feet below sea level. One of the major functions of the Salton Sea is to serve as a sump for agricultural tailwater and for urban treated and untreated wastewater flows from the Imperial and Coachella valleys and Mexico. Although its reputation for recreation and sports fishing has diminished in recent years, the sea still provides critical habitat for migratory birds in the Pacific Flyway. The Sonny Bono Salton Sea National Wildlife Refuge is an important wetland area. Because drainage is internal, salts tend to concentrate in the sea’s water, and the nutrients enhance the formation of eutrophic conditions1.
The sources of water for the Salton Sea are agricultural surface tailwater and tile drain water, operational spills, treated and untreated municipal and industrial wastewater, and urban runoff from the Imperial Valley, Coachella Valley, and the Calexico Valley in Mexico. From Imperial County and Mexico, the New and Alamo rivers—fed by the agricultural drains in the Imperial Valley and discharge to Mexico—provide most of the flows that drain into the sea. There are water quality concerns about the untreated and partially treated municipal and industrial wastewater flows that originate in the Calexico Valley and come into the United States through the New River, as well as the presence of pesticides, nutrients, selenium, and silt in the agricultural tailwater, tile drain water, and seepage flows. From the north, the Whitewater River provides agricultural tailwater and tile drainage flows and urban runoff.
Salt Creek, which drains portions of the Orocopia and Chuckwalla mountains to the east of the sea, and Whitewater River provide some freshwater inflows into the Salton Sea.
1 “Some of the specific effects of eutrophication include high algal biomass, high fish productivity, low clarity, frequent very low dissolved oxygen concentrations, massive fish kills, and noxious odors.” Salton Sea Authority. Final Report for Reducing Eutrophic Conditions of the Salton Sea. Prepared for the Colorado River Regional Water Quality Control Board. July 29, 2005.
C a l i f o r n i a w a t e r p l a n | u p d a t e 2 0 0 9
Volume 3 - Regional Repor ts
C R - 8
San�Felipe�Creek,�Fish�Creek,�Vallecito�Creek,�and�Carrizo�Creek�WatershedsThe watersheds associated with San Felipe, Fish, Vallecito, and Carrizo creeks are within and outside of the Anza-Borrego Desert State Park in eastern San Diego County with portions extending into Imperial County and north into Riverside County. These areas provide natural habitat for migratory birds and other wildlife, including 12 State- or federal-listed rare, threatened, or endangered species. Including land within the State park, the combined watersheds cover over 700,000 acres.
The riparian areas have been identified as key habitat for the birds and other wildlife. These include the natural groves of the California Fan Palms, mesquite woodland, and wet meadows or marshes. Management efforts are under way to preserve and improve the critical habitat areas, which include removal of invasive plant species to allow the native plants and animals to redevelop.
Other WatershedsWatersheds have been recognized in the Colorado River, Twentynine Palms-Lanfair, and Chuckwalla PAs. For the Colorado River PA, watersheds include the Havasu-Mojave Lakes, Piute Wash, Imperial Reservoir, and the Lower Colorado River; these watersheds extend eastward into Nevada and Arizona. Scattered urban land uses exist in each watershed. Agricultural uses are prominent in the Imperial Reservoir and Lower Colorado River areas. Minor water quality concerns are in the Havasu-Mohave Lakes and Piute Wash areas.
The Southern Mojave watershed is in both the Twentynine Palms-Lanfair and Chuckwalla PAs. Portions of the San Bernardino and San Jacinto mountains and several smaller mountain ranges provide most of the boundaries for this watershed. Much of the watershed is devoid of urban and agricultural land uses. The exceptions are Lucerne Valley, which has urban areas and agriculture, and Yucca Valley, which has urban areas exclusively.
Ecosystems
Coachella�Valley�Multiple�Species�Habitat�Conservation�PlanThe Coachella Valley Multiple Species Habitat Conservation Plan (CVMSHCP) is a strategic plan that will protect over 240,000 acres of open space and 27 species. It is designed to meet State and federal endangered species laws, will assist in the construction of transportation improvement projects and will offer opportunities for recreation, tourism, and economic growth.
Lower�Colorado�River�Basin�Multi-Species�Conservation�Program�The Lower Colorado River Basin Multi-Species Conservation Program (LCR-MSCP) is a long-term, multi-agency comprehensive program that manages and assists with the
C a l i f o r n i a w a t e r p l a n | u p d a t e 2 0 0 9
Colorado r iver Hydrologic region
C R - 9
recovery of endangered species and wildlife habitat along the Colorado River. Specific projects to be undertaken include the establishment of slightly more than 8,100 acres of new aquatic, wetland, and native broadleaf riparian habitat along the Lower Colorado River from Lake Mead to the border with Mexico. These new habitats are expected to provide ecological benefits and mitigate potential impacts to 26 federal- and State-listed candidate and sensitive species and their associated habitats. In addition, the LCR-MSCP stakeholders plan to produce 660,000 razorback sucker and 620,000 bonytail to enhance existing populations.
Mojave�Desert�Natural�ReserveThe southeastern portion of the Mojave Natural Preserve is located in the Twentynine Palms-Lanfair PA. Despite the arid conditions, a diverse collection of animals and plants have been able to settle and continue to flourish in the preserve. Natural seeps and springs are sufficient enough to support the native vegetation. This includes yucca, creosote bush, cactus, relict white firs and chaparral, and the Joshua tree. The vegetation provides habitat to numerous animals and birds, including the Big Horn Sheep, desert tortoises, hawks, and eagles.
Environmental�and�Habitat�Protection�and�Improvement�Elements of the biological mitigation measures from the Imperial Irrigation District’s (IID) 2002 Draft Habitat Conservation Plan are being used as the agency implements its Water Conservation and Transfer Project in compliance with the provisions of the Colorado River Water Delivery Agreement: Federal Quantification Settlement Agreement of 2003 (federal QSA). The measures are required under the existing incidental take authorizations pursuant to the Endangered Species Act (ESA) and California Endangered Species Act (CESA). The IID is now preparing the Habitat Conservation Plan (HCP) and Natural Communities Conservation Plan (NCCP) that will contain modified or new mitigation and conservation measures not included in the 2002 Draft HCP and not evaluated in the Transfer Project Final Environmental Impact Report/Environmental Impact Statement (EIR/EIS).
Although the draft HCP/NCCP is still being reviewed, IID is establishing a managed marsh complex that will be nearly 1,000 acres in size pursuant to the existing biological mitigation measures and ESA/CESA approvals. The IID has prepared a Supplement to the Transfer Project Final EIR/EIS to provide any additional environmental assessment required to designate, construct, and manage a specific site for the expanded marsh complex. However, the implementation of the project is contingent on final approval of the HCP/NCCP by IID, US Fish and Wildlife Service, and the California Department of Fish and Game (DFG).
ClimateMost of the Colorado River Region has a subtropical desert climate with hot summers and short, mild winters. The mountain ranges on the northern and western borders, in
C a l i f o r n i a w a t e r p l a n | u p d a t e 2 0 0 9
Volume 3 - Regional Repor ts
C R - 1 0
particular the San Bernardino and San Jacinto mountains, create a rainshadow effect for most of the region. Annual rainfall amounts range between a little over 6 inches to less than 3 inches. Most of the precipitation for the region occurs in the winter and spring. However, monsoonal thunderstorms, spawned by the movement of subtropical air from the south, do occur in the summer and can generate significant rainfall in some years. Higher annual rainfall amounts and milder summer temperatures occur in the mountains to the north and west. Clear and sunny conditions typically prevail, and the region receives 85 to 90 percent of the maximum possible sunshine each year; the highest value in the United States.
From 1999 to the present, the Colorado River watershed has experienced drier than normal hydrologic conditions. Despite these conditions, supplies from the Colorado River and groundwater have remained constant through the period. Annual maximum and minimum temperatures were slightly higher than long-term averages at many weather stations between 2000 and 2005. Precipitation amounts were generally lower than average between 2000 and 2003, with 2002 being extremely dry. However, rainfall totals were above average for 2005.
PopulationThe Colorado River Region had 713,726 people in 2005. About 2 percent of the state’s total population lives in this region, and 71 percent of the region’s population lives in incorporated cities. Between 2000 and 2005, the region grew by 107,191 people, a growth of 18 percent over the 5-year period. For historical population data, 1960–2005, see Volume 5 Technical Guide.
In Water Plan Update 2009, we project population growth based on the assumptions of future scenarios. Discussion of the three scenarios used in this Water Plan and how the region’s population may change through 2050 can be found later in this report under Looking to the Future.
Native American Tribes with territory in the Colorado River region include the Agua Caliente Band of Cahuilla Indians, Augustine Band of Mission Indians (Cahuilla), Cabazon Band of Mission Indians, Chemehuevi Tribal Council, Fort Mohave Tribe, Morongo Band of Mission Indians, Torres-Martinez Band of Desert Cahuilla Indians, and the Twenty-Nine Palms Band of Mission Indians. In the Coachella Valley, Tribal land alternates with those that are publicly and privately owned. One-mile square Tribal parcels alternate with one-mile square municipal parcels.
Senate Bill 18 (Chapter 905, Statutes of 2004) requires cities and counties to consult with Native American Indian Tribes during the adoption or amendment of local general plans or specific plans. A contact list of appropriate Tribes and representatives within a region is maintained by the Native American Heritage Commission. A Tribal Consultation Guideline, prepared by the Governor’s Office of Planning and Research, is available online at http://www.opr.ca.gov/programs/docs/09_14_05%20Updated%20

C a l i f o r n i a w a t e r p l a n | u p d a t e 2 0 0 9
Colorado r iver Hydrologic region
C R - 1 1
Guidelines%20(922).pdf. (See Box CR-2 for information about regional Tribal concerns.)
Land Use PatternsAgriculture accounts for the majority of land uses for the Colorado River Region. Agriculture is dominant in the Imperial Valley in the south, in the Palo Verde and Bard valleys along the Colorado River in the east, and in the Coachella Valley. Most of the urban uses are concentrated in Coachella Valley although urban uses are scattered throughout the region.
Agricultural activities occur year-round in the region. Although the hot temperatures in the summer do impose some limitations, reliable water supplies and good soils allow the cultivation of a wide range of permanent and row crops year-round. These crops include table grapes, dates, citrus fruit, fresh market vegetables, grains, forage crops, and specialty crops such as bamboo, sugar cane, and mangoes. The peak year in harvested crop acres was 2001 with 739,800 acres. A gradual decline in harvested acres occurred between 2002 and 2005, due mostly to land fallowing programs. The total harvested crop acres in 2005 for the region was 657,400 acres.
Alfalfa remains the top crop in the Colorado River region with 193,800 acres planted in 2005. Truck crops had the next highest planted acres with 156,000 acres. Other important crop categories were pasture grass, field crops, grains (mainly durum wheat), citrus and subtropical fruit including dates, and vineyards. Truck crops include
Demographics: Tribes with historic or cultural ties to the •Colorado River region are primarily the different bands of the Mission Indians (Cahuilla, Cupeno, Diegueno, Kumeyaay, and Luiseno), Mojave, Chemeheuvi, and Quechan.
Currently, Tribal landholdings located in this region ○include: Agua Caliente, Augustine (in Thermal), Cabazon, Morongo, Torres-Martinez Band of Desert Cahuilla Indians, and Twenty-Nine Palms. Four areas of Tribal landholdings are along the Colorado River, consisting of Fort Mojave, Chemehuevi, Colorado River Indian Tribes, and Quechan (Fort Yuma). Located on the boundary with the South Coast region are the Santa Rosa, Cahuilla, Los Coyotes, Ewiiaapaayp (Cuyapaipe), and Manzanita reservations.
Collaborative Efforts:•
Multiple agencies (Tribal, federal, Arizona, State, ○and local) are closely monitoring levels of hexavalent chromium, a legacy pollutant from the 1950s and 1960s.
Concerns and Priorities:•
Water rights are tied to the 1962 court decision (Arizona ○v. California) determining Colorado River water allocations. The current system of water rights constrains Tribes from moving water to meet their needs.
Inadequate capacity of the Parker Strip wastewater ○treatment facility to meet current development needs, thereby diminishing water quality in the Colorado.
Accomplishments:•
Tribes are focusing on economic and housing ○development, including increased attention to water supplies and management and regional water planning.
NOTE: Above information was gathered from Tribal input at the California Water Plan Update regional workshops and the Tribal water plenary sessions that are supporting the California Tribal Water Summit.
Box CR-2 California�Native�American�Tribal�Information,�Colorado�River�Hydrologic�Region
C a l i f o r n i a w a t e r p l a n | u p d a t e 2 0 0 9
Volume 3 - Regional Repor ts
C R - 1 2
vegetables, corn, and nursery products and pasture grass including Bermuda grass grown for seed. Multiple-cropping remains prevalent in the major agricultural areas.
The Imperial Valley is not only the largest agricultural area in the region, it is one of the important agricultural areas in the country. More than 450,000 acres of land are cultivated annually to grow a wide variety of forage, fresh market vegetables, field crops, and grains. In 2005, about 467,000 acres of crops were planted and harvested in the valley, which is down slightly from its peak year in 2002 when 517,900 acres of crops were planted and harvested. From early fall through spring, almost 100,000 acres of fresh market vegetables are planted and harvested annually in Imperial Valley. Major vegetables include lettuce, broccoli, cauliflower, melons, onions, and carrots.
Smaller agricultural operations are scattered throughout the remainder of the region. About 3,000 acres of mostly field crops are grown in the Mojave Valley of San Bernardino County, which is north of the City of Needles. In the Borrego Valley of San Diego County, about 3,000 acres of citrus fruit orchards, palm groves, and potatoes are grown, and about 1,000 acres of grape and citrus crops are in production in the Cadiz Valley in San Bernardino County.
Alfalfa remains the top crop in the Imperial Valley. In 2005, about 190,000 acres of alfalfa were grown, which is about 30 percent of the total planted and harvested crop acres for the region. Several large cattle feedlots are in operation, which handle about 360,000 head each year. Sheep grazing is a component of the local livestock industry with 190,000 head passing through in 2005. The alfalfa grown in Imperial Valley not only helps support the local livestock and dairy operations, but those statewide and internationally. About 80 percent of the harvest is exported from the valley, and 2 percent is exported internationally.
Alfalfa and a mix of vegetables, field, and grain crops are grown in the Palo Verde, Coachella, and Bard valleys. It should be noted that most of the cotton and pasture grass in the Colorado River region is grown in the Palo Verde Valley. Most all citrus and subtropical fruit and all date orchards are located in the Coachella and Bard valleys. Most of the dates consumed internationally are harvested from the orchards in these valleys. The region’s table grapes are produced from vineyards in the Coachella Valley.
Land fallowing programs have affected the planted and harvested acres in the region. In the Imperial Valley, land in production has declined from about 440,000 acres annually to about 432,000 acres in 2005 and 423,000 acres in 2007. The land fallowing helps IID meet water transfer obligations from the federal QSA. Land fallowing also occurs in the Palo Verde Valley as a result of an agreement between the Metropolitan Water District of Southern California (MWDSC) and the Palo Verde Irrigation District (PVID).
Most of the urban land uses in the Colorado River region are located in the Coachella Valley. For the past two decades, the urban area has shown remarkable growth in support of the local recreation and tourism industries. This includes the construction of single-family and multi-family housing, malls, office buildings, country clubs, and golf
C a l i f o r n i a w a t e r p l a n | u p d a t e 2 0 0 9
Colorado r iver Hydrologic region
C R - 1 3
courses. While in-filling continues to occur, the urban area now stretches from Palm Springs on the west to Indio and Coachella on the east along Highway 111 in the valley. Urban areas continue to expand northward to Interstate 10.
Other important, but smaller, urban areas are the corridor between the cities of Brawley and Calexico in Imperial County, Needles in San Bernardino County, Blythe in Riverside County, Borrego Springs in San Diego County, and the community of Winterhaven in Bard Valley. Expansion of the urban areas in the Imperial Valley is occurring, but at a slow pace.
Naval and military training facilities and other preserved or managed public lands are conspicuous in the region, including several large national and State parks, recreation and wilderness areas, and wildlife refuges. Indian Tribes and associated reservations also maintain a significant presence. They operate casinos and resorts along the Colorado River north of Needles, north of the City of Palm Springs, and near the community of Cabazon west of Palm Springs.
Nationally known parks in the region include Joshua Tree National Park, the Mojave National Scenic Preserve, Anza-Borrego Desert State Park, and the Salton Sea and Picacho State Recreation Areas. Several areas are also set aside for preservation or other land management purposes, including national recreation and wilderness areas, wildlife refuges, Tribal reservations, and US Navy facilities.
Tribal�LandsA Native American Tribe may be federally recognized, and the federal government may set aside lands for Tribes as reservations. In California these reservations are often named “Rancherias.” One interpretation of the Spanish term Rancheria is small Indian settlement. Granted Tribal lands are listed in Table CR-1.
Regional Water Conditions
Environmental WaterThe largest water body in the region is the Salton Sea, a saline body of water about 50 feet deep. The concentration of total dissolved solids in the sea is about 46,000 milligrams per liter, which is about 40 percent greater than that of ocean water. Most of the environmental applied water demands in the region are for the Sonny Bono Salton Sea National Wildlife Refuge, DFG’s Imperial Wildlife Area, and wetland areas on the shore of the Salton Sea; and to maintain the viability of the sea under the federal QSA through 2017. IID will fallow ground to meet Salton Sea mitigation conditions identified in the IID/San Diego County Water Authority (SDCWA) Water Transfer, which was approved under the federal QSA. From 2003 through 2017, IID will fallow enough ground to provide 800,000 acre-feet of water to the Salton Sea as mitigation for transferring water to San Diego.

C a l i f o r n i a w a t e r p l a n | u p d a t e 2 0 0 9
Volume 3 - Regional Repor ts
C R - 1 4
The Salton Sea ecosystem is considered a critical link on the international Pacific Flyway, providing wintering habitat for migratory birds, including some species whose diets are based exclusively on fish. The expected average annual inflows to the Salton Sea during the 25-year time frame of the California Water Plan Update 2009 are expected to be about 962,000 acre-feet per year, based on estimates using the Salton Sea Accounting Model (SSAM).
Table�CR-1� �Granted�Tribal�lands�with�acreage,�Colorado�River�Hydrologic�Region
Federal�trust�lands� Acres Tribal�owner(s)Morongo Reservation (Splits with SC Region, but almost entirely in CR Region, appears to have some alternating land sections)
32,362 Cahuilla, Serrano, and Cupeño Indians
Twenty-Nine Palms Reservation (4 separate locations) 160 Luiseño Indians
Agua Caliente Reservation 31,610 Agua Caliente Band of Cahuilla Indians (Mission Indians)
Torres-Martinez Reservation (Appears to be mostly alternating land sections)
24,024 Cahuilla Indians
Fort Yuma Reservation (Reservation is located in both California and Yuma County, Arizona along the Colorado River and appears to also border Mexico - Total acres in California unknown at this time)
43,942 Quechan Indians
Colorado River Reservation (Majority of Reservation is in Arizona - 226,000 acres in Arizona, and 42,700 acres in California)
42,700 in CA only
Mohave, Chemehuevi, Hopi and Navajo Indians
Chemehuevi Reservation (Borders AZ) 30,653 Chemehuevi Indians
Fort Mojave Reservation (Majority of the reservation appears to be in Arizona and/or Nevada - Total California acres unknown at this time)
33,000 Fort Mohave Indian Tribe
Campo Reservation (Splits with SC Region, but mostly in SC) See SC Region for acres
Manzanita Reservation (Splits with SC Region, but mostly in CR) 3,579 Kuymeyaay (Diegueño) Indians
Cuyapaipe Reservation (Splits with SC Region, but appears to have the majority of land in the CR Region)
4,103 Kumeyaay (Diegueño) Indians - Cuyapaipe General Council administers the land
Los Coyotes Reservation (Splits with CR Region, but mostly in SC Region)
See SC Region for acres
Augustine Reservation 500 Augustine Band of Cahuilla Indians
Cahuilla Reservation (Splits with SC Region, but mostly in SC) 18,884 Cahuilla Indians
Santa Rosa Reservation (Splits with SC Region, but almost entirely in CR Region)
11,092 Cahuilla Indians
Santa Ysabel Reservation (Splits with SC Region, but almost entirely in SC Region)
See SC region for acres
SC = South Coast Hydrologic Region
* As per data taken from the San Diego State University’s online library and information access (http://infodome.sdsu.edu/research/guides/calindians/calinddict.shtml#a)

C a l i f o r n i a w a t e r p l a n | u p d a t e 2 0 0 9
Colorado r iver Hydrologic region
C R - 1 5
Water SuppliesWater demands in the Colorado River region are met through a combination of imported surface water, supplies from the Colorado River, local groundwater basins, and recycled water supplies. Colorado River supplies meet either all or most of the agricultural and urban water demands in the Imperial, Palo Verde, Coachella, and Bard valleys. The PVID and Bard Water District operate facilities that divert water supplies from the river directly to agricultural users in their respective service areas. The All-American Canal is used to import water supplies from the river to IID for its agricultural customers and for the urban customers of the public and investor-owned water agencies in the valley. The recently concrete-lined Coachella Canal transports river water, taken at Drop 1 along the All-American Canal, into the Coachella Valley for agricultural and some urban uses. The Colorado River is an interstate and international river with use apportioned among the seven Colorado River Basin states and Mexico by a complex body of statutes, decrees, and court decisions known collectively as the “Law of the River.” (Table CR-2 Key elements of the Law of the River; Table CR-3 Annual intrastate apportionment of water from the Colorado River mainstream within California under the Seven Party Agreement).
Many of the alluvial valleys in the region are underlain by groundwater aquifers that are the sole source of water for local communities and farming operations. Not all groundwater sources are suitable for potable uses because of water quality issues. In the Coachella Valley, public agencies such as Desert Water Agency (DWA) and Mission Springs Water District (MSWD) and private parties pump groundwater to meet urban and agricultural water demands. Groundwater is used to meet much of the urban demand along the Colorado River, serves as the sole source of water for the urban and agricultural users in the Borrego Valley and the community of Desert Center, and supports the agricultural operation in the Cadiz Valley.
The State Water Project (SWP) and recycled and local surface water supplies provide the remainder of water to the region. SWP supplies are obtained through an exchange agreement between the Coachella Valley Water District (CVWD), DWA, and MWDSC. No facilities exist today to deliver SWP supplies to the Coachella Valley contractors. However, through the agreement, the MWDSC releases the combined SWP allocations for the CVWD and DWA into the Whitewater River from its Colorado River Aqueduct. These releases recharge the upper groundwater basin of the Coachella Valley. In exchange, MWDSC receives the agencies’ annual allocations through SWP facilities. The CVWD treats urban wastewater flows and makes the recycled water supplies available for non-potable uses such as irrigations of golf courses.
In 2005, the Colorado River region used 3,420 thousand acre-feet of Colorado River supplies, 429 thousand acre-feet of groundwater, 134 thousand acre-feet from SWP, 6 thousand acre-feet of surface supplies, and 7 thousand acre-feet of recycled water supplies. (See Table CR-4 Annual apportionment of use of the Colorado River water, Box CR-3 Implementation of the federal QSA, and Figure CR-3 Colorado River Hydrologic Region water balance summary, 1998-2005.)
C a l i f o r n i a w a t e r p l a n | u p d a t e 2 0 0 9
Volume 3 - Regional Repor ts
C R - 1 6
Groundwater provides about 7.5 percent of the region’s applied water supply in normal years and about 7.7 percent in drought years. In 2005, groundwater supplies met 14.0 percent of applied water demands. Groundwater storage capacity has been estimated for 40 of the region’s 57 groundwater basins and totals more than 175 million acre-feet. The groundwater beneath the agricultural area of the Imperial Valley is too saline to be used without treatment.
Agreements remain that allow local water districts in the Coachella Valley to reduce the decline in groundwater levels resulting from overdraft. The agreement between CVWD and DWA to bring SWP supplies into the valley was an important step. In 1984, another agreement was reached among CVWD, DWA, and MWDSC for water banking
Table�CR-2� �Key�elements�of�the�Law�of�the�Colorado�River
Document Date Main�PurposeColorado River Compact 1922 The Upper and Lower Basin are each provided a basic apportionment of 7.5 MAF
annually of consumptive use. The Lower Basin is given the right to increase its consumptive use by an additional 1.0 MAF annually.
Boulder Canyon Project Act 1928 Authorized USBR to construct Hoover Dam and the All-American Canal (including the Coachella Canal), and gave congressional consent to the Colorado River Compact. Apportioned the Lower Basin’s 7.5 MAF among the states of Arizona (2.8 MAF), California (4.4 MAF), and Nevada (0.3 MAF). Provided that all users of Colorado River water stored in Lake Mead must enter into a contract with USBR for use of the water.
California Limitation Act 1929 ConfirmedCalifornia'sshareofthe7.5MAFLowerBasinallocationto4.4MAFannually, plus no more than half of any surplus waters.
California Seven-Party Agreement
1931 An agreement among seven California water agencies/districts to recommend to the Secretary of Interior how to divide use of California’s apportionment among the California water users.
US-Mexican Water Treaty 1944 Apportions Mexico a supply of 1.5 MAF annually of Colorado River water, except under surplus or extraordinary drought conditions.
US Supreme Court Decree in Arizona v. California, et al.
1964, supplemented 1979
Rejected California’s argument that Arizona’s use of water from the Gila River, a Colorado River tributary, constituted use of its Colorado River apportionment. RuledthatLowerBasinstateshavearighttoappropriateandusetributaryflowsbefore the tributary co-mingles with the Colorado River. Mandated the preparation of annual reports documenting the uses of water in the three Lower Basin states.Quantifiestribalwaterrightsforspecifiedtribes,including131,400afyfordiversioninCalifornia.QuantifiedColoradoRivermainstreampresentperfectedrights in the Lower Basin states.
Colorado River Basin Project Act
1968 Authorized construction of the Central Arizona Project. Requires Secretary of the Interior to prepare long-range operating criteria for major Colorado River reservoirs.
Criteria for Coordinated Long-Range Operation of Colorado River Reservoirs
1970, amended 2005
Provided for the coordinated operation of reservoirs in the Upper and Lower Basins and set conditions for water releases from Lake Powell and Lake Mead.
Colorado River Water Delivery Agreement: Federal QuantificationSettlementAgreement of 2003
2003 Complex package of agreements that, in addition to many other important issues,furtherquantifiesprioritiesestablishedinthe1931CaliforniaSeven-PartyAgreementandenablesspecifiedwatertransfers(suchasthewaterconservedthrough lining of the All-American and Coachella canals to SDCWA) in California.
Source: Adapted from USBR 2008c
C a l i f o r n i a w a t e r p l a n | u p d a t e 2 0 0 9
Colorado r iver Hydrologic region
C R - 1 7
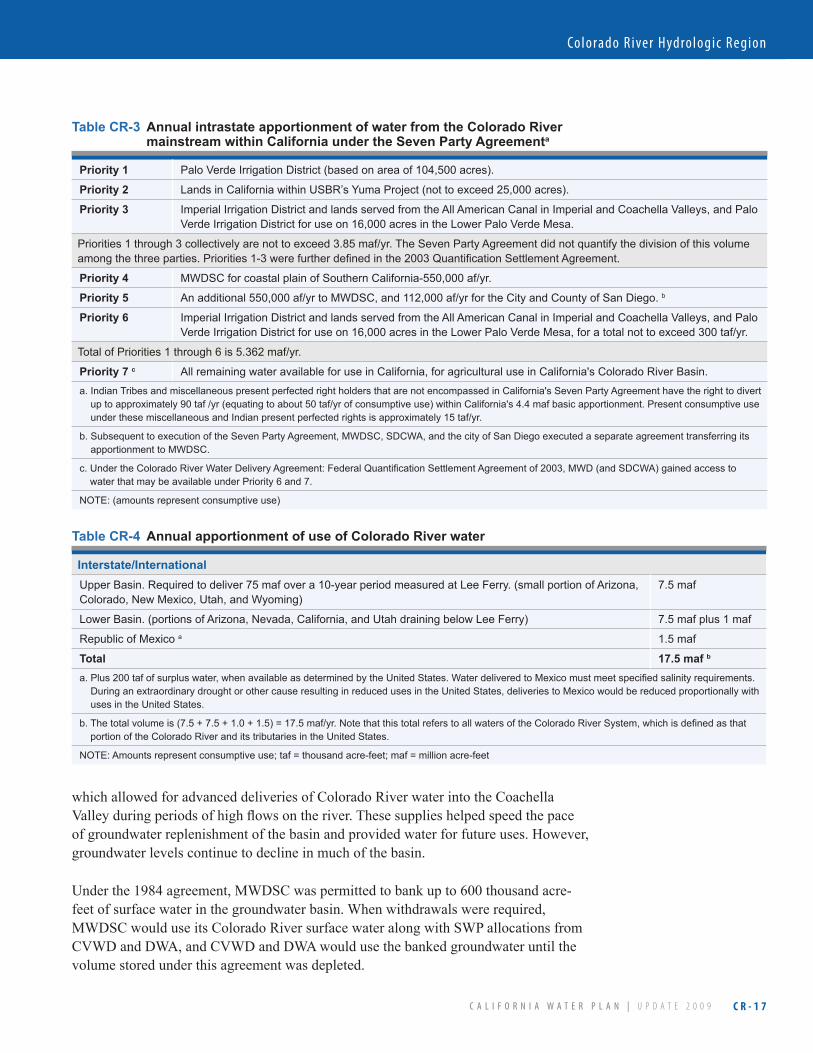
Table�CR-3� �Annual�intrastate�apportionment�of�water�from�the�Colorado�River�mainstream�within�California�under�the�Seven�Party�Agreementa
Priority�1 Palo Verde Irrigation District (based on area of 104,500 acres).
Priority�2 Lands in California within USBR’s Yuma Project (not to exceed 25,000 acres).
Priority�3 Imperial Irrigation District and lands served from the All American Canal in Imperial and Coachella Valleys, and Palo Verde Irrigation District for use on 16,000 acres in the Lower Palo Verde Mesa.
Priorities 1 through 3 collectively are not to exceed 3.85 maf/yr. The Seven Party Agreement did not quantify the division of this volume amongthethreeparties.Priorities1-3werefurtherdefinedinthe2003QuantificationSettlementAgreement.
Priority�4 MWDSC for coastal plain of Southern California-550,000 af/yr.
Priority�5 An additional 550,000 af/yr to MWDSC, and 112,000 af/yr for the City and County of San Diego. b
Priority�6 Imperial Irrigation District and lands served from the All American Canal in Imperial and Coachella Valleys, and Palo Verde Irrigation District for use on 16,000 acres in the Lower Palo Verde Mesa, for a total not to exceed 300 taf/yr.
Total of Priorities 1 through 6 is 5.362 maf/yr.
Priority�7�c AllremainingwateravailableforuseinCalifornia,foragriculturaluseinCalifornia'sColoradoRiverBasin.a.IndianTribesandmiscellaneouspresentperfectedrightholdersthatarenotencompassedinCalifornia'sSevenPartyAgreementhavetherighttodivertuptoapproximately90taf/yr(equatingtoabout50taf/yrofconsumptiveuse)withinCalifornia's4.4mafbasicapportionment.Presentconsumptiveuseunder these miscellaneous and Indian present perfected rights is approximately 15 taf/yr.
b. Subsequent to execution of the Seven Party Agreement, MWDSC, SDCWA, and the city of San Diego executed a separate agreement transferring its apportionment to MWDSC.
c.UndertheColoradoRiverWaterDeliveryAgreement:FederalQuantificationSettlementAgreementof2003,MWD(andSDCWA)gainedaccesstowater that may be available under Priority 6 and 7.
NOTE: (amounts represent consumptive use)
which allowed for advanced deliveries of Colorado River water into the Coachella Valley during periods of high flows on the river. These supplies helped speed the pace of groundwater replenishment of the basin and provided water for future uses. However, groundwater levels continue to decline in much of the basin.
Under the 1984 agreement, MWDSC was permitted to bank up to 600 thousand acre-feet of surface water in the groundwater basin. When withdrawals were required, MWDSC would use its Colorado River surface water along with SWP allocations from CVWD and DWA, and CVWD and DWA would use the banked groundwater until the volume stored under this agreement was depleted.
Table�CR-4� �Annual�apportionment�of�use�of�Colorado�River�water
Interstate/InternationalUpper Basin. Required to deliver 75 maf over a 10-year period measured at Lee Ferry. (small portion of Arizona, Colorado, New Mexico, Utah, and Wyoming)
7.5 maf
Lower Basin. (portions of Arizona, Nevada, California, and Utah draining below Lee Ferry) 7.5 maf plus 1 maf
Republic of Mexico a 1.5 maf
Total 17.5�maf�b
a.Plus200tafofsurpluswater,whenavailableasdeterminedbytheUnitedStates.WaterdeliveredtoMexicomustmeetspecifiedsalinityrequirements.During an extraordinary drought or other cause resulting in reduced uses in the United States, deliveries to Mexico would be reduced proportionally with uses in the United States.
b.Thetotalvolumeis(7.5+7.5+1.0+1.5)=17.5maf/yr.NotethatthistotalreferstoallwatersoftheColoradoRiverSystem,whichisdefinedasthatportion of the Colorado River and its tributaries in the United States.
NOTE: Amounts represent consumptive use; taf = thousand acre-feet; maf = million acre-feet
C a l i f o r n i a w a t e r p l a n | u p d a t e 2 0 0 9
Volume 3 - Regional Repor ts
C R - 1 8
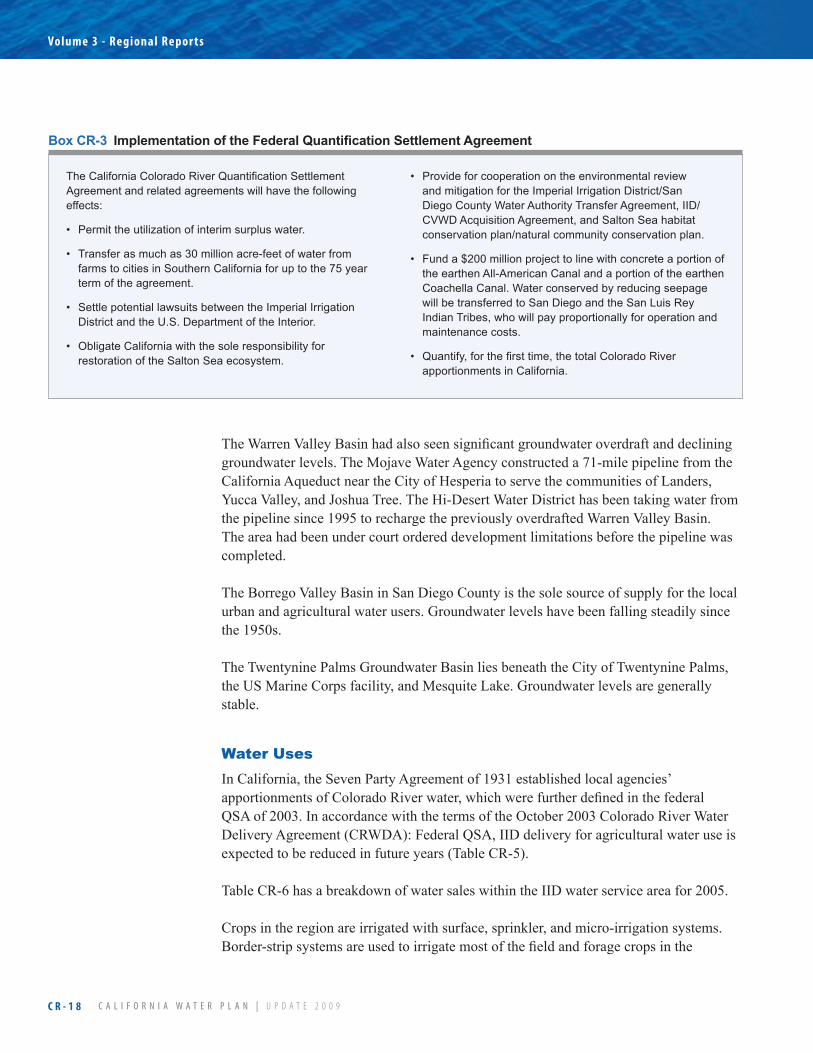
TheCaliforniaColoradoRiverQuantificationSettlementAgreement and related agreements will have the following effects:
Permit the utilization of interim surplus water.•
Transfer as much as 30 million acre-feet of water from •farms to cities in Southern California for up to the 75 year term of the agreement.
Settle potential lawsuits between the Imperial Irrigation •District and the U.S. Department of the Interior.
Obligate California with the sole responsibility for •restoration of the Salton Sea ecosystem.
Provide for cooperation on the environmental review •and mitigation for the Imperial Irrigation District/San Diego County Water Authority Transfer Agreement, IID/CVWD Acquisition Agreement, and Salton Sea habitat conservation plan/natural community conservation plan.
Fund a $200 million project to line with concrete a portion of •the earthen All-American Canal and a portion of the earthen Coachella Canal. Water conserved by reducing seepage will be transferred to San Diego and the San Luis Rey Indian Tribes, who will pay proportionally for operation and maintenance costs.
Quantify,forthefirsttime,thetotalColoradoRiver•apportionments in California.
Box�CR-3� �Implementation�of�the�Federal�Quantification�Settlement�Agreement
The Warren Valley Basin had also seen significant groundwater overdraft and declining groundwater levels. The Mojave Water Agency constructed a 71-mile pipeline from the California Aqueduct near the City of Hesperia to serve the communities of Landers, Yucca Valley, and Joshua Tree. The Hi-Desert Water District has been taking water from the pipeline since 1995 to recharge the previously overdrafted Warren Valley Basin. The area had been under court ordered development limitations before the pipeline was completed.
The Borrego Valley Basin in San Diego County is the sole source of supply for the local urban and agricultural water users. Groundwater levels have been falling steadily since the 1950s.
The Twentynine Palms Groundwater Basin lies beneath the City of Twentynine Palms, the US Marine Corps facility, and Mesquite Lake. Groundwater levels are generally stable.
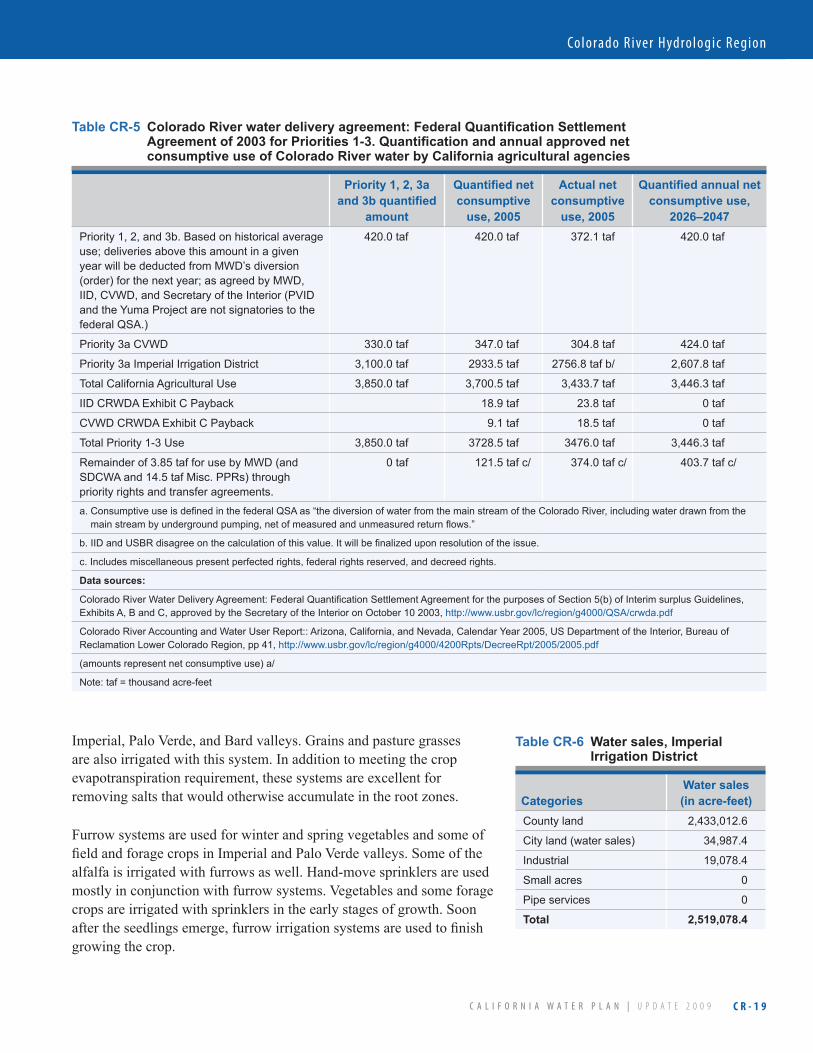
Water UsesIn California, the Seven Party Agreement of 1931 established local agencies’ apportionments of Colorado River water, which were further defined in the federal QSA of 2003. In accordance with the terms of the October 2003 Colorado River Water Delivery Agreement (CRWDA): Federal QSA, IID delivery for agricultural water use is expected to be reduced in future years (Table CR-5).
Table CR-6 has a breakdown of water sales within the IID water service area for 2005.
Crops in the region are irrigated with surface, sprinkler, and micro-irrigation systems. Border-strip systems are used to irrigate most of the field and forage crops in the
C a l i f o r n i a w a t e r p l a n | u p d a t e 2 0 0 9
Colorado r iver Hydrologic region
C R - 1 9
Imperial, Palo Verde, and Bard valleys. Grains and pasture grasses are also irrigated with this system. In addition to meeting the crop evapotranspiration requirement, these systems are excellent for removing salts that would otherwise accumulate in the root zones.
Furrow systems are used for winter and spring vegetables and some of field and forage crops in Imperial and Palo Verde valleys. Some of the alfalfa is irrigated with furrows as well. Hand-move sprinklers are used mostly in conjunction with furrow systems. Vegetables and some forage crops are irrigated with sprinklers in the early stages of growth. Soon after the seedlings emerge, furrow irrigation systems are used to finish growing the crop.
Table�CR-5� �Colorado�River�water�delivery�agreement:�Federal�Quantification�Settlement�Agreement�of�2003�for�Priorities�1-3.�Quantification�and�annual�approved�net�consumptive�use�of�Colorado�River�water�by�California�agricultural�agencies
Priority�1,�2,�3a�and�3b�quantified�
amount
Quantified�net�consumptive�use,�2005�
Actual�net�consumptive�use,�2005
Quantified�annual�net�consumptive�use,�
2026–2047Priority 1, 2, and 3b. Based on historical average use; deliveries above this amount in a given year will be deducted from MWD’s diversion (order) for the next year; as agreed by MWD, IID, CVWD, and Secretary of the Interior (PVID and the Yuma Project are not signatories to the federal QSA.)
420.0 taf 420.0 taf 372.1 taf 420.0 taf
Priority 3a CVWD 330.0 taf 347.0 taf 304.8 taf 424.0 taf
Priority 3a Imperial Irrigation District 3,100.0 taf 2933.5 taf 2756.8 taf b/ 2,607.8 taf
Total California Agricultural Use 3,850.0 taf 3,700.5 taf 3,433.7 taf 3,446.3 taf
IID CRWDA Exhibit C Payback 18.9 taf 23.8 taf 0 taf
CVWD CRWDA Exhibit C Payback 9.1 taf 18.5 taf 0 taf
Total Priority 1-3 Use 3,850.0 taf 3728.5 taf 3476.0 taf 3,446.3 taf
Remainder of 3.85 taf for use by MWD (and SDCWA and 14.5 taf Misc. PPRs) through priority rights and transfer agreements.
0 taf 121.5 taf c/ 374.0 taf c/ 403.7 taf c/
a.ConsumptiveuseisdefinedinthefederalQSAas“thediversionofwaterfromthemainstreamoftheColoradoRiver,includingwaterdrawnfromthemainstreambyundergroundpumping,netofmeasuredandunmeasuredreturnflows.”
b.IIDandUSBRdisagreeonthecalculationofthisvalue.Itwillbefinalizeduponresolutionoftheissue.
c. Includes miscellaneous present perfected rights, federal rights reserved, and decreed rights.
Data�sources:�
ColoradoRiverWaterDeliveryAgreement:FederalQuantificationSettlementAgreementforthepurposesofSection5(b)ofInterimsurplusGuidelines,Exhibits A, B and C, approved by the Secretary of the Interior on October 10 2003, http://www.usbr.gov/lc/region/g4000/QSA/crwda.pdf
Colorado River Accounting and Water User Report:: Arizona, California, and Nevada, Calendar Year 2005, US Department of the Interior, Bureau of Reclamation Lower Colorado Region, pp 41, http://www.usbr.gov/lc/region/g4000/4200Rpts/DecreeRpt/2005/2005.pdf
(amounts represent net consumptive use) a/
Note: taf = thousand acre-feet
Table�CR-6� �Water�sales,�Imperial�Irrigation�District
CategoriesWater�sales� (in�acre-feet)
County land 2,433,012.6
City land (water sales) 34,987.4
Industrial 19,078.4
Small acres 0
Pipe services 0
Total 2,519,078.4

C a l i f o r n i a w a t e r p l a n | u p d a t e 2 0 0 9
Volume 3 - Regional Repor ts
C R - 2 0
Despite the availability of a reliable and inexpensive water supply, water districts and users are cognizant of the importance of water conservation programs to efficiently use and manage water. Farmers and growers in all of the districts do precision land forming for specific crops and use plastic and other mulches to reduce evapotranspiration and improve productivity. In addition, to meet the terms of the federal QSA and related agreements, IID is to modify its delivery system starting in 2007, and growers will be able to participate voluntarily to modify their irrigation operations to be more efficient.
The use of surface and subsurface micro-irrigation hardware continues to expand. In the Coachella Valley, surface and subsurface drip irrigation systems are becoming more commonplace in the vegetable operations. Traditional surface and sprinkler systems are still used in about 75 percent of operations, but farmers are not hesitating to use drip systems for the remainder.
Most all citrus and subtropical fruit trees, with the exception of dates, and table grapes in Coachella Valley are irrigated with drip and micro-sprinkler systems. Drip systems are used for the grapes because they provide the most uniform and efficient method of delivering water to the individual plant. Micro-sprinkler systems are being used for the citrus trees because they can deliver greater volumes of water and irrigate a larger wetted area compared to the standard drip emitter.
In 2004, PVID and MWDSC entered into a 35-year agreement for land fallowing and water supply transfers. The program will develop between 29.5 thousand acre-feet and 118.0 thousand acre-feet of water supply for MWDSC annually, help stabilize the economy of the Palo Verde Valley, and provide financial assistance for specific local community improvement programs. The maximum amount of land that can be fallowed annually within the PVID service is 28 percent of the total irrigable land, or about 28,947 acres. Land fallowing began in early 2005.
Water agencies and the appropriate governmental agencies in the region continue to provide technical services in irrigation management to the local agricultural water users. IID and CVWD continue to collaborate with DWR in the operation of the network of California Irrigation Management Information System (CIMIS) stations in the region. Data from these stations are used by water users and districts, both agricultural and urban, to manage irrigation activities.
IID, PVID, and CVWD are signatories to the 1999 Memorandum of Understanding Regarding Efficient Water Management Practices by Agricultural Water Suppliers in California. By signing the MOU, the districts demonstrated their intention to adopt agricultural water management plans and to implement Efficient Water Management Practices (EWMPs) within their service areas that (1) optimize net water management benefits, (2) provide a significant financial benefit, and (3) do not have negative third party or environmental impacts. The Agricultural Water Management Council (AWMC) oversees the MOU and has endorsed the Agricultural Water Management Plans developed by IID and CVWD.

C a l i f o r n i a w a t e r p l a n | u p d a t e 2 0 0 9
Colorado r iver Hydrologic region
C R - 2 1
Water use efficiency programs are equally important for the urban users in the region. Many of the water districts are implementing or investigating the feasibility of implementing water use efficiency (WUE) programs within their service areas. Many of the urban suppliers in the region are members of the California Urban Water Conservation Council (CUWCC), which promotes the use of Best Management Practices (BMPs).
These conservation programs disseminate public information, assist customers, and implement building codes. Many of the water districts provide information on the status and issues about statewide and local water resources. They publish literature on landscape and general conservation tips, homeowner workshops, and demonstration gardens. MSWD has provided extensive outreach to public schools through its Groundwater Guardian program at the high school, middle school, and elementary school levels. It also sponsors water education events that include residential retrofit programs.
Customer assistance programs are also being implemented. CVWD provides water audit services for large landscape areas within its service area, including golf courses and parks. During the audit, the efficiency and uniformity of the irrigation systems are determined and recommendations are offered for improvements on the design, operation, and maintenance of these systems; for potential energy and water savings that could be achieved with these modifications; and for scheduling irrigation.
Amendments to local building codes have been made to conserve water supplies in landscaping. Since 2003, new housing developments in most Coachella Valley cities have been subject to landscape ordinances. These ordinances limit the amount of turf that can be used in new developments. For example, MSWD restricts turf in residential landscaping to about 30 percent of the front yard. Build-out of these new developments over the next 15 years should show a diminishing amount of landscape irrigation demands. MSWD’s water use per capita is less than that of other districts in the valley and the district’s goal is to maintain that efficiency as future growth occurs.
The Borrego Water District is also implementing a vigorous water conservation program with rebates and turf removal incentives. For IID water conservation program activities, see section on Integrated Regional Water Management.
Water Balance SummaryFigure CR-3 summarizes the total developed water supplies and distribution of the dedicated water uses within this hydrologic region for the eight years from 1998 through 2005. Because this region is heavily dependent on imported water from the Colorado River system, the yearly water usage shown by the horizontal bars does not vary significantly in relation to the wetness (1998 and 2005) or dryness (2002) of the individual water years. The more detailed numerical information about the developed water supplies and uses is presented in Volume 5 Technical Guide, which provides a
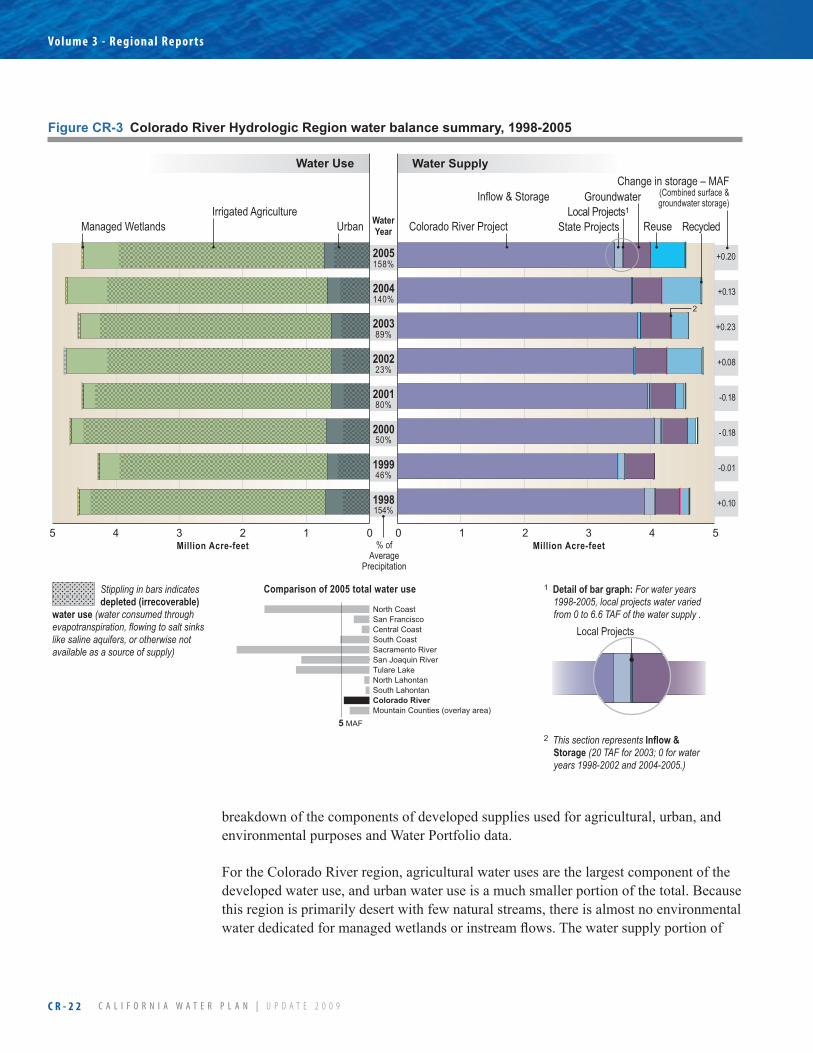
C a l i f o r n i a w a t e r p l a n | u p d a t e 2 0 0 9
Volume 3 - Regional Repor ts
C R - 2 2
Figure�CR-3� �Colorado�River�Hydrologic�Region�water�balance�summary,�1998-2005
WaterYear
158%
140%
89%
23%
80%
50%
46%
154%
+0.20
+0.13
+0.23
+0.08
-0.18
-0.18
-0.01
+0.10
Change in storage – MAF(Combined surface &groundwater storage)
012345
Instream
Recycled
Reuse
Inflow & Stor
Net GW
Local Imports
Local
State
Federal
Colorado0 1 2 3 4 5
Wild
Instream
Delta
Wetlands
Ag
Urban
Wild_D
Wild
Instream_D
Instream
Delta_D
Delta
Wetalnds_D
Wetlands
Ag_D
Ag
Urban_D
Urban
Water Use Water Supply
New note to Nikki: I ran out of room at the top when I added the “Change in Storage” label, so I put the“Inflow & Storage” label as a footnote. Is this acceptable, or too funky?
Colorado River ProjectManaged WetlandsIrrigated Agriculture
Urban
Groundwater
Reuse
Inflow & Storage
State Projects Recycled
2005
2004
2003
2002
2001
2000
1999
1998
Colorado River
1 Detail of bar graph: For water years 1998-2005, local projects water varied from 0 to 6.6 TAF of the water supply .
2 This section represents Inflow & Storage (20 TAF for 2003; 0 for water years 1998-2002 and 2004-2005.)
Local Projects
Local Projects1
Million Acre-feetMillion Acre-feet % ofAverage
Precipitation
2
Stippling in bars indicates depleted (irrecoverable)
water use (water consumed through evapotranspiration, flowing to salt sinks like saline aquifers, or otherwise not available as a source of supply)
Comparison of 2005 total water use
North CoastSan FranciscoCentral CoastSouth CoastSacramento RiverSan Joaquin RiverTulare LakeNorth LahontanSouth LahontanColorado RiverMountain Counties (overlay area)
5 MAF
breakdown of the components of developed supplies used for agricultural, urban, and environmental purposes and Water Portfolio data.
For the Colorado River region, agricultural water uses are the largest component of the developed water use, and urban water use is a much smaller portion of the total. Because this region is primarily desert with few natural streams, there is almost no environmental water dedicated for managed wetlands or instream flows. The water supply portion of
C a l i f o r n i a w a t e r p l a n | u p d a t e 2 0 0 9
Colorado r iver Hydrologic region
C R - 2 3
Figure CR-3 also indicates that most of the water supply in this region is from surface water imported from the Colorado River, with minor usage from groundwater sources.
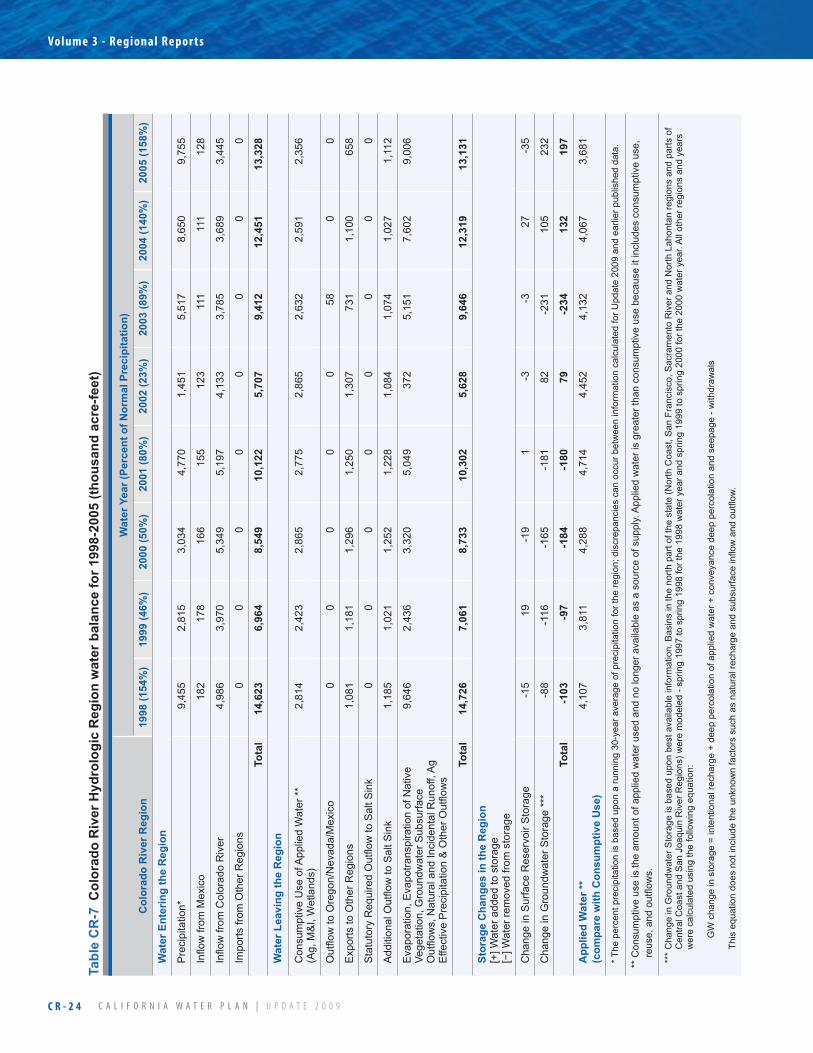
Table CR-7 presents information about the total water supply available to this region for the eight years from 1998 through 2005, and the estimated distribution of these water supplies to all uses. The annual change in the region’s surface and groundwater storage is also estimated, as part of the balance between supplies and uses. In wetter water years, water will usually be added to storage, while during drier water years storage volumes may be reduced. Of the total water supply to the region, more than half is either used by native vegetation; evaporates to the atmosphere; provides some of the water for agricultural crops and managed wetlands (effective precipitation); or flows to other states, the Pacific Ocean, and salt sinks like saline groundwater aquifers. The remaining portion, identified as consumptive use of applied water, is distributed among urban and agricultural uses and for diversions to managed wetlands. For some of the data values presented in Table CR-7, the numerical values were developed by estimation techniques, because actual measured data are not available for all categories of water supply and use.
Water Quality
Overarching�Water�Quality�IssuesThe Colorado River Basin Region (State Water Resources. Water Quality Control Board Region 72) includes 28 major watersheds or “hydrologic units,” and it has water bodies of statewide, national, and international significance (such as the Salton Sea and the Colorado River).
Water quality concerns exist in all of the watersheds in the Colorado River region. This section is intended to identify the highest priority water quality issues in the watersheds within this region. Some of the regional specific issues that have been identified, but not prioritized, are:
Surface water quality monitoring• Quality of imported water• On-site treatment systems • Nitrates• Leaking underground storage tanks (USTs)• Water quality impacts of animal feeding and dairy operations•
Imperial�Irrigation�DistrictWater quality is tested throughout IID’s water delivery and drain systems. Since 2004, IID has added 26 Total Maximum Daily Load (TMDL) sampling runs to comply with its Drain Water Quality Improvement Plan. IID collects samples of its water supply at numerous sites. Drain water is monitored at several sites and on the Alamo and New rivers. IID’s TMDL is for silt concentration in its drains and the New and Alamo rivers.
2 Same geographic configuration as DWR’s Colorado River Hydrologic Region
C a l i f o r n i a w a t e r p l a n | u p d a t e 2 0 0 9
Volume 3 - Regional Repor ts
C R - 2 4
Table�CR-7��C
olorado�River�Hydrologic�Region�water�balance�fo
r�1998-2005�(tho
usand�acre-fe
et)
Col
orad
o R
iver
Reg
ion
Water�Year�(Pe
rcent�o
f�Normal�Precipitatio
n)�
1998�(154%)
1999�(46%
)2000�(50%
)2001�(80%
)2002�(23%
)2003�(89%
)2004�(140%)
2005�(158%)
Water�Entering�the�Region
Pre
cipi
tatio
n*9,
455
2,81
53,
034
4,77
01,
451
5,51
78,
650
9,75
5
Inflowfrom
Mexico
182
178
166
155
123
111
111
128
Inflowfrom
ColoradoRiver
4,98
63,
970
5,34
95,
197
4,13
33,
785
3,68
93,
445
Impo
rts fr
om O
ther
Reg
ions
00
00
00
00
�Total�
14,623
6,964
8,549
10,122
5,707
9,412
12,451
13,328
Water�Leaving
�the�Region
Con
sum
ptiv
e U
se o
f App
lied
Wat
er *
*(A
g, M
&I,
Wet
land
s)2,
814
2,42
32,
865
2,77
52,
865
2,63
22,
591
2,35
6
OutflowtoOregon/Nevada/Mexico
00
00
058
00
Exp
orts
to O
ther
Reg
ions
1,08
11,
181
1,29
61,
250
1,30
773
11,
100
658
StatutoryRequiredOutflowtoSaltS
ink
00
00
00
00
AdditionalOutflowtoSaltS
ink
1,18
51,
021
1,25
21,
228
1,08
41,
074
1,02
71,
112
Eva
pora
tion,
Eva
potra
nspi
ratio
n of
Nat
ive
Vege
tatio
n, G
roun
dwat
er S
ubsu
rface
Outflows,NaturalandIncidentalRunoff,Ag
EffectivePrecipitation&OtherOutflows
9,6
46
2,4
36
3,3
20
5,0
49
372
5
,151
7
,602
9
,006
Total�
�14,726�
�7,061�
�8,733�
�10,302�
�5,628�
�9,646�
�12,319�
�13,131�
Storage�Chang
es�in�th
e�Region�
[+] W
ater
add
ed to
sto
rage
[−]W
aterremovedfrom
storage
Cha
nge
in S
urfa
ce R
eser
voir
Sto
rage
-15
19-1
91
-3-3
27-3
5
Cha
nge
in G
roun
dwat
er S
tora
ge *
**-8
8-1
16-1
65-1
8182
-231
105
232
Total�
-103
-97
-184
-180
79-234
132
197
App
lied�Water�**�
(com
pare�with
�Con
sumptive�Use)
4,10
73,
811
4,28
84,
714
4,45
24,
132
4,06
73,
681
* The
per
cent
pre
cipi
tatio
n is
bas
ed u
pon
a ru
nnin
g 30
-yea
r ave
rage
of p
reci
pita
tion
for t
he re
gion
; dis
crep
anci
es c
an o
ccur
bet
wee
n in
form
atio
n ca
lcul
ated
for U
pdat
e 20
09 a
nd e
arlie
r pub
lishe
d da
ta.
** C
onsu
mpt
ive
use
is th
e am
ount
of a
pplie
d w
ater
use
d an
d no
long
er a
vaila
ble
as a
sou
rce
of s
uppl
y. A
pplie
d w
ater
is g
reat
er th
an c
onsu
mpt
ive
use
beca
use
it in
clud
es c
onsu
mpt
ive
use,
reuse,andoutflows.
***
Cha
nge
in G
roun
dwat
er S
tora
ge is
bas
ed u
pon
best
ava
ilabl
e in
form
atio
n. B
asin
s in
the
north
par
t of t
he s
tate
(Nor
th C
oast
, San
Fra
ncis
co, S
acra
men
to R
iver
and
Nor
th L
ahon
tan
regi
ons
and
parts
of
Cen
tral C
oast
and
San
Joa
quin
Riv
er R
egio
ns) w
ere
mod
eled
- sp
ring
1997
to s
prin
g 19
98 fo
r the
199
8 w
ater
yea
r and
spr
ing
1999
to s
prin
g 20
00 fo
r the
200
0 w
ater
yea
r. A
ll ot
her r
egio
ns a
nd y
ears
w
ere
calc
ulat
ed u
sing
the
follo
win
g eq
uatio
n:
GW
cha
nge
in s
tora
ge =
inte
ntio
nal r
echa
rge
+ de
ep p
erco
latio
n of
app
lied
wat
er +
con
veya
nce
deep
per
cola
tion
and
seep
age
- with
draw
als
Thisequationdoesnotincludetheunknow
nfactorssuchasnaturalrechargeandsubsurfaceinflowandoutflow.
C a l i f o r n i a w a t e r p l a n | u p d a t e 2 0 0 9
Colorado r iver Hydrologic region
C R - 2 5
Coachella�Valley�Storm�Water�ChannelOn May 16, 2007, the Colorado River Basin Regional Water Quality Control Board (Regional Water Board) adopted Resolution No. R7-2007-0039 amending the basin plan to establish a TMDL and implementation plan for bacterial indicators in the Coachella Valley Storm Water Channel. This channel stretches from near Indio to the Salton Sea and it does not meet federal water quality standards due to elevated pathogen levels. The beneficial uses most sensitive to pathogen impairment in the channel are contact and non-contact water recreation uses. Potential pathogen sources include urban runoff, natural background, agricultural runoff, bacteria regrowth, and septic system discharges.
Mission�Springs�Water�District�The US Geological Survey (USGS) conducted a Groundwater Ambient Monitoring and Assessment (GAMA) study of the Coachella Valley aquifer system; MSWD participated in the study. USGS recently released its study on subsidence in other parts of the Coachella Valley.
Water GovernanceMore complete information on water governance will be developed for California Water Plan Update 2013. This will include identification of local, State, Tribal, and federal government agencies and institutions that are responsible for managing the region’s water resources, flood protection, and wastewater. A list of regional flood management participants is included in Appendix A Flood Management, and IRWM plans provide information about water planning organizations in this region.
Two groundwater basins in the region are bound by adjudication judgments: the Warren Valley and Beaumont groundwater basins.
The Warren Valley Groundwater Basin adjudication judgment was finalized in 1977. The court appointed Hi-Desert Water District as the watermaster and ordered the agency to develop a plan to halt the overdraft of the basin. In 1991, the Warren Valley Basin Management Plan was released with recommendations that included managing extractions, importing water supplies, conserving storm water flows, encouraging water conservation and recycling, and protecting the quality of the groundwater supplies.
The Beaumont (Groundwater) Basin adjudication judgment was finalized in 2004. The Superior Court appointed a committee to serve as the watermaster. The committee includes representatives from the cities of Banning and Beaumont, Beaumont-Cherry Valley Water District, South Mesa Mutual Water Company, and the Yucaipa Valley Water District. The judgment established the annual extraction quantities for the parties that were classified as either overlying owners or appropriators.
C a l i f o r n i a w a t e r p l a n | u p d a t e 2 0 0 9
Volume 3 - Regional Repor ts
C R - 2 6
Flood Management
Flood HazardsOf California’s 10 hydrologic regions, the Colorado River Hydrologic Region has the lowest annual precipitation. Consequently, most of the natural streams are ephemeral; the exceptions are the Colorado, New, and Alamo rivers. The low annual rainfall amounts and the sparse vegetation in the region’s watersheds give rise to braided streams with steep channel slopes. In these watercourses, short-duration, high intensity rainfall from summer monsoonal thunderstorms or winter storms can result in flash floods and debris flows. Many areas in the region are still vulnerable to flood-caused damages. Flood hazards in the region include these representative situations (for specific instances, see Challenges).
Some existing culverts and channels do not have sufficient capacity to carry flow • resulting from the runoff event having a 1 percent chance of being exceeded in any year.Population growth and the ensuing development increase the area of impervious • surface without sufficient mitigation, increasing peak runoff.High intensity storms are common and combine with steep stream gradients and • granular bed material to produce flash floods and debris flows.Alluvial fan flooding endangers some communities.• Some locations are threatened with ponding of runoff behind seaside dikes.•
Historic Floods
Damaging floods have occurred in the area since at least 1916. Notable events have occurred in 1927, 1938, 1965, 1969, 1976, 1995, and 2003. For more information on these floods see Appendix A, Flood Management. Flood records for selected flood-producing streams are listed in Appendix A in Table CRA-1, Record floods for selected streams.
Flood GovernanceFlood management is a cooperative effort in which federal, Tribal, State, and local governments all play significant parts. The principal participants are listed in Box CR-4. For more information on the agencies’ roles, see Table CRA-2, Flood management participants, in Appendix A.
Flood Risk ManagementFlood risk management includes a wide variety of projects and programs, which may be grouped as Structural Approaches (constructed facilities, coordination of flood operations, maintenance); Land Use Management (regulation, flood insurance); and Disaster Preparedness, Response, and Recovery (information and education, event management).
C a l i f o r n i a w a t e r p l a n | u p d a t e 2 0 0 9
Colorado r iver Hydrologic region
C R - 2 7
Structural�ApproachesConstructed Facilities. With the exception of Lake Mead on the Colorado Rover, flood control projects in the Colorado River Hydrologic Region are limited in scope. Most of the reservoirs, levees, channels, and debris basins address local problems.
Lake Mead is a multipurpose reservoir that was built by USBR. It protects Needles, Blythe, Palo Verde and areas along the Colorado River. Single-purpose reservoirs are Tahchevah Creek Detention Basin, a US Army Corps of Engineers (USACE) project protecting Palm Springs and the Caliente Indian Reservation, and Wide Canyon Reservoir, constructed by Riverside County Flood Control and Water Conservation District to protect Cathedral City and Desert Hot Springs.
Other USACE projects include levees on the San Gorgonio River at Banning and on Quail Wash at Joshua Tree, levees and channels on the Whitewater River at Palm Springs and on “S” Street Wash in Needles, slope protection for the Palm Springs Aerial Tramway, a debris basin and channel in West Magnesia Canyon at Rancho Mirage, and improved channels on Murrieta Creek at Temecula. The Natural Resources Conservation Service (NRCS) contributed construction funding for the McCoy Wash Flood Control District channel improvement project on McCoy Wash west of Blythe. The Whitewater River channel protects La Quinta, Indio, Coachella, and other communities. CVWD constructed channels in Deep Canyon and Palm Valley to reduce flooding in Palm Desert, Rancho Mirage, and Indian Wells. IID constructed dikes along the Salton Sea shoreline to protect shoreline towns from high lake levels.
Federal
Federal Emergency Management Agency•
National Weather Service•
Natural Resources Conservation Service•
US Geological Survey•
US Army Corps of Engineers•
US Bureau of Reclamation•
Tribal
Tribal governments of the region•
State
California Conservation Corps•
California Emergency Management Agency•
Department of Corrections•
Department of Forestry and Fire Protection•
Department of Water Resources•
Local
Riverside County Flood Control and Water Conservation •District
San Bernardino County Flood Control District•
San Diego County Flood Control District•
County and city emergency services units•
County and city planning departments•
County and city building departments•
Localfloodmaintenanceorganizations•
Local conservation corps•
Local emergency response agencies•
Local initial responders to emergencies•
Box�CR-4� �Flood�Management�Agencies
C a l i f o r n i a w a t e r p l a n | u p d a t e 2 0 0 9
Volume 3 - Regional Repor ts
C R - 2 8
Local sponsors and descriptions for reservoirs and non-storage flood control facilities in the region are listed in Appendix A in Table CRA-3, Flood control facilities.
Coordination and Reservoir Operations. The USACE prescribes formal emergency operating rules for Tahchevah Creek Detention Basin, which is operated by Riverside County Flood Control and Water Conservation District. There are no forecast-based operations agreements for operation of flood protection facilities in the region.
For information on flood control reservoirs, see Table CRA-3, Flood control facilities, in Appendix A.
Maintenance. Maintenance of flood control works is a critical activity that preserves the integrity of the facilities, ensuring continued protection for the public. This effort is made more difficult by two factors. Lack of adequate financing for many installations is the result of tax-management efforts of the late twentieth century which have placed controls on former sources of revenue, and heightened public awareness of the environment has resulted in new regulations making the permitting process lengthy and expensive. Compounding the problem, deferred maintenance can cause establishment of new habitat that then must be protected.
Maintenance of flood control facilities is usually the responsibility of the local maintaining agency, which is usually the local sponsor, or if there is none, the constructing agency. USACE projects are maintained by the sponsoring local maintaining agency in this region. NRCS projects follow a pattern of close cooperation with a local sponsor, with NRCS providing maintenance standards and the local sponsor performing the maintenance. USBR projects are invariably reservoirs, which may be maintained by USBR or the local maintaining agency. USBR maintains Lake Mead, Lake Powell, and their dams in this region. The local constructing agency maintains non-federal projects.
Land�Use�ManagementRegulation. Counties are the main agencies responsible for designating and regulating floodways. Imperial County requires a permit for construction below the negative 220-ft contour near the Salton Sea. The county and three of its incorporated cities also regulate construction on the New and Alamo rivers and El Centro Drain floodplains. San Bernardino and Riverside counties both regulate development within floodways through county ordinances. All local land use jurisdictions must adopt a floodplain management ordinance identifying 1percent floodplains and floodways in order to qualify for Federal Emergency Management Agency (FEMA) flood insurance.
Adopting designated floodways facilitates enforcement of floodplain building ordinances. Throughout the region most of the streams with flood control infrastructure have been designated floodways. Regulated floodways include the San Gorgonio, Whitewater, New, and Alamo rivers; Little Berdo, Lower Berdo, Gilman Home, and Indian Canyon channels; West Pershing, Mission, Tahquitz, and Tachevah creeks;
C a l i f o r n i a w a t e r p l a n | u p d a t e 2 0 0 9
Colorado r iver Hydrologic region
C R - 2 9
Lucerne and Rabbit lakes; and Morongo, Palm Pipes, Airport, S Street, Fox, and Sidewinder washes.
Flood Insurance. The National Flood Insurance Program (NFIP) is administered by FEMA. It enables property owners in participating communities to purchase insurance as protection against flood losses in exchange for State and community floodplain management regulations that reduce future flood damages. About 97 percent of California communities participate in NFIP. Of those, approximately 12 percent participate in the Community Rating System (CRS) Program, which encourages communities to go beyond minimum NFIP requirements in return for reduced insurance rates. Quality mapping is critical to administering an effective flood insurance program, developing hydrologic and hydraulic information for determining floodplain boundaries and allocating flood protection project funds.
FEMA has provided Flood Insurance Rate Maps (FIRMs) for all areas within the region. As of June 2009, maps in three of the region’s four counties are new since 2008, and one more is scheduled to be updated by 2010.
CRS rates communities from 1 to 10 on the effectiveness of flood protection activities. The lower ratings bring larger discounts on flood insurance. Of the 4 counties and 20 cities in the Colorado River Hydrologic Region, one county and one city participate in CRS. As of May 2009, San Diego County and Palm Springs are both in CRS Class 8. See http://www.fema.gov/business/nfip/crs.shtm for more information on the CRS system.
Disaster�Preparation,�Response,�and�RecoveryInformation and Education. The California Data Exchange Center (CDEC) provides real-time and historical hydrometeorological data for hundreds of stations statewide. For this region, CDEC provides gage data from the federal Bureau of Land Management (7 gages), the California Department of Forestry and Fire Protection (3 gages), National Weather Service (3 gages), and several other federal, State, and local agencies, for a total of 27 gages. For access to CDEC data, see http://cdec.water.ca.gov.
USGS maintains and publishes statistics for stream gages nationwide. USGS gages are the source of data for the eight stations listed in Appendix A, Table CRA-1, Flood parameters for principal streams. For access to USGS gage data, see http://waterdata.usgs.gov/nwis.
A few models are available that could provide information for flood management. The Salton Sea Analysis (SALSA) model predicts water surface elevation of the Salton Sea based on flows from rivers, drains, canals and channels, and from water storage in relevant reservoirs. The Variable Infiltration Capacity (VIC) model has been used to estimate flows in the Colorado River Basin by inputting results from climate and land-surface models. There are currently no hydrologic models that describe the relationship between meteorological conditions and flow for the Whitewater River.
C a l i f o r n i a w a t e r p l a n | u p d a t e 2 0 0 9
Volume 3 - Regional Repor ts
C R - 3 0
DWR’s Awareness Floodplain Mapping program provides an easy-to-use computer interface for viewing areas vulnerable to flooding by the flood event having a 1 percent probability of occurrence. For this region, maps have been completed for all of Riverside County, including the Palm Springs area. Lands west of the Salton Sea and adjacent to the Colorado River in Imperial County have also been mapped.
Event Management. Under the Standardized Emergency Management System (SEMS) and the National Incident Management System (NIMS), initial flood emergency response is made by the responsible party at the site. When its resources are exhausted, the county emergency management organization (operational area) provides support. If necessary, additional support is coordinated by Southern Region of the California Emergency Management Agency (Cal EMA). Through the Cal EMA region and Cal EMA headquarters, help can be obtained from any State agency. Cal EMA coordinates with federal agencies and private organizations as well. The State-Federal Flood Operations Center (a joint facility of DWR and the Sacramento Weather Office and California-Nevada River Forecast Center, both units of the National Weather Service) is normally called early in an event to provide weather and river forecasts, facilitate information flow, provide field situation analysis, and give flood fight expertise. Severe situations that require Cal EMA involvement may also require emergency response by USACE, which is obtained by request of DWR. Table CRA-4, Flood emergency response organizations, in Appendix A, lists specific response organizations.
Recovery after a flood event may involve the funding and construction services of USACE if the facilities are parts of federal projects. Availability of resources to repair local and private facilities, remove flood waters, and restore housing, businesses, and infrastructure often depends on the severity of the event and the allocation of event-specific federal or State funds.
Flood preparedness and mitigation efforts are promoted and funded by many organizations, including city and county governments, Cal EMA, DWR, National Weather Service, and USACE.
Regional Water and Flood Planning and Management
The Colorado River Hydrologic Region’s two main outside water resources, Northern California and the Colorado River, are of concern. The Coachella Valley’s share of SWP water from Northern California is being temporarily reduced by up to one-third after a 2008 federal court ruling affecting 25 million Californians. Simultaneously, the worst drought in 500 years has reduced flows on the Colorado River to about half of normal, and storage in Lake Mead and Lake Powell are also at about 50 percent.
Years after desert farmers reduced their water use, CVWD is building the $70 million Mid-Valley Pipeline. The pipeline will provide about 50 of the valley’s 124 golf courses with Colorado River water for irrigation, leaving higher-quality aquifer water for
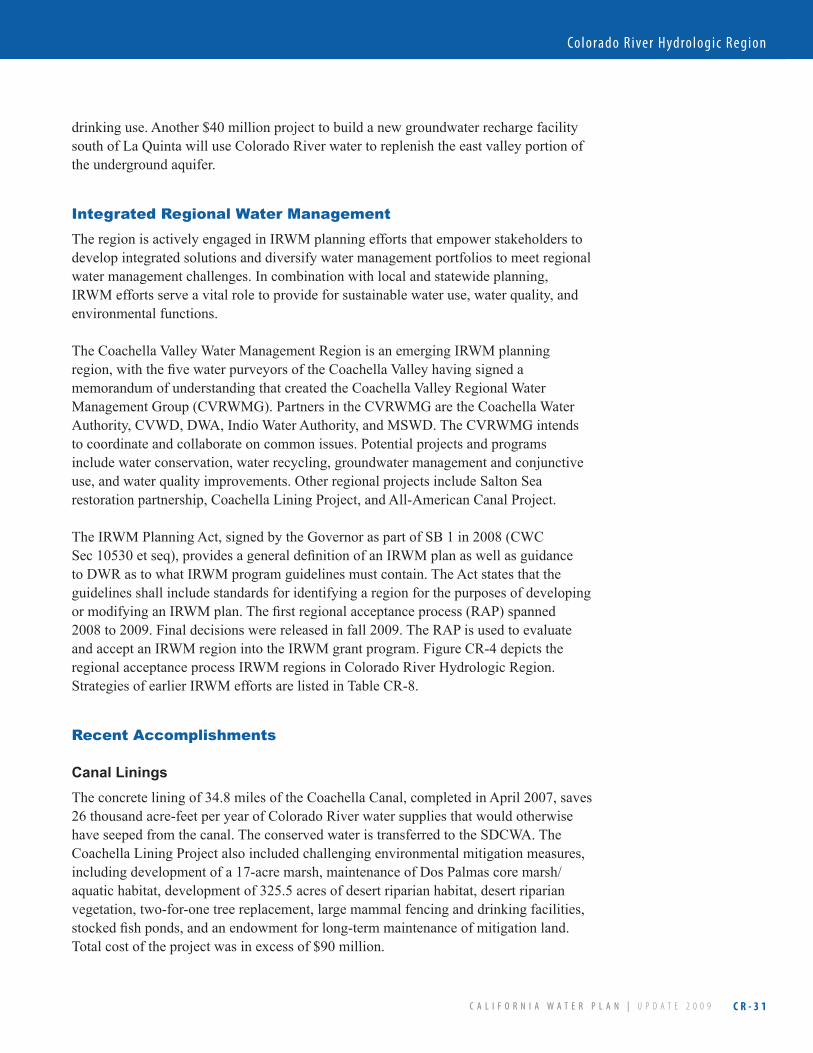
C a l i f o r n i a w a t e r p l a n | u p d a t e 2 0 0 9
Colorado r iver Hydrologic region
C R - 3 1
drinking use. Another $40 million project to build a new groundwater recharge facility south of La Quinta will use Colorado River water to replenish the east valley portion of the underground aquifer.
Integrated Regional Water ManagementThe region is actively engaged in IRWM planning efforts that empower stakeholders to develop integrated solutions and diversify water management portfolios to meet regional water management challenges. In combination with local and statewide planning, IRWM efforts serve a vital role to provide for sustainable water use, water quality, and environmental functions.
The Coachella Valley Water Management Region is an emerging IRWM planning region, with the five water purveyors of the Coachella Valley having signed a memorandum of understanding that created the Coachella Valley Regional Water Management Group (CVRWMG). Partners in the CVRWMG are the Coachella Water Authority, CVWD, DWA, Indio Water Authority, and MSWD. The CVRWMG intends to coordinate and collaborate on common issues. Potential projects and programs include water conservation, water recycling, groundwater management and conjunctive use, and water quality improvements. Other regional projects include Salton Sea restoration partnership, Coachella Lining Project, and All-American Canal Project.
The IRWM Planning Act, signed by the Governor as part of SB 1 in 2008 (CWC Sec 10530 et seq), provides a general definition of an IRWM plan as well as guidance to DWR as to what IRWM program guidelines must contain. The Act states that the guidelines shall include standards for identifying a region for the purposes of developing or modifying an IRWM plan. The first regional acceptance process (RAP) spanned 2008 to 2009. Final decisions were released in fall 2009. The RAP is used to evaluate and accept an IRWM region into the IRWM grant program. Figure CR-4 depicts the regional acceptance process IRWM regions in Colorado River Hydrologic Region. Strategies of earlier IRWM efforts are listed in Table CR-8.
Recent Accomplishments
Canal�LiningsThe concrete lining of 34.8 miles of the Coachella Canal, completed in April 2007, saves 26 thousand acre-feet per year of Colorado River water supplies that would otherwise have seeped from the canal. The conserved water is transferred to the SDCWA. The Coachella Lining Project also included challenging environmental mitigation measures, including development of a 17-acre marsh, maintenance of Dos Palmas core marsh/aquatic habitat, development of 325.5 acres of desert riparian habitat, desert riparian vegetation, two-for-one tree replacement, large mammal fencing and drinking facilities, stocked fish ponds, and an endowment for long-term maintenance of mitigation land. Total cost of the project was in excess of $90 million.
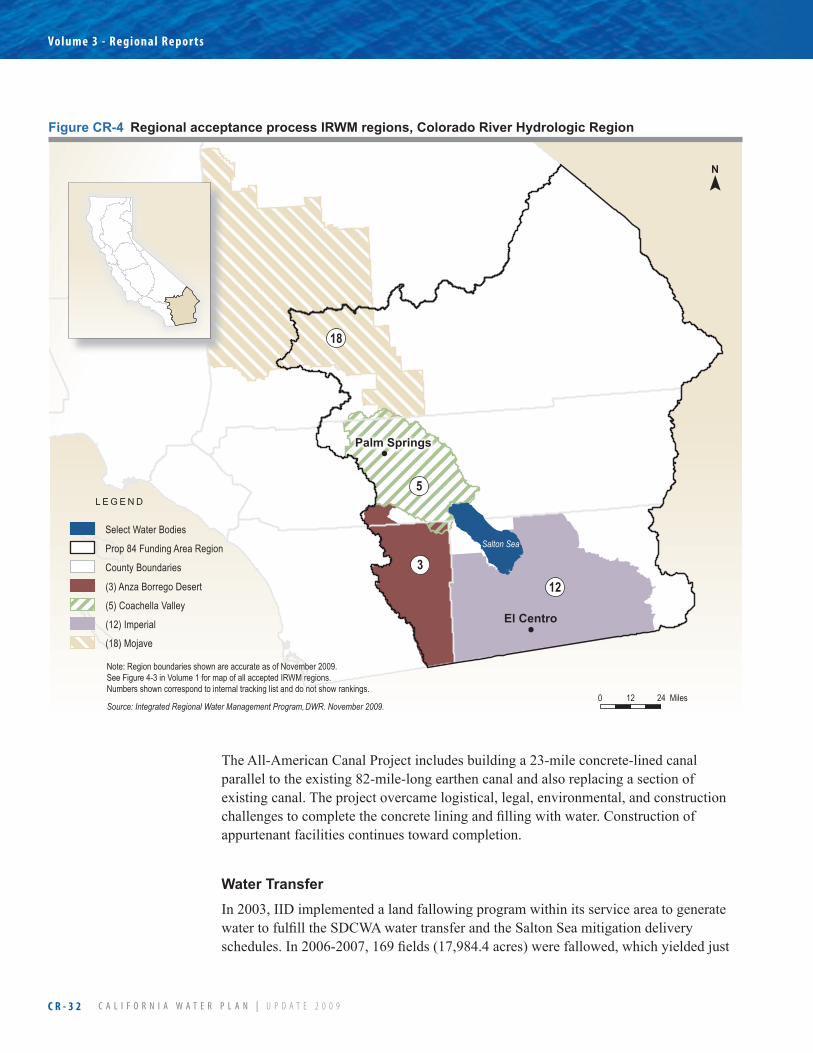
C a l i f o r n i a w a t e r p l a n | u p d a t e 2 0 0 9
Volume 3 - Regional Repor ts
C R - 3 2
The All-American Canal Project includes building a 23-mile concrete-lined canal parallel to the existing 82-mile-long earthen canal and also replacing a section of existing canal. The project overcame logistical, legal, environmental, and construction challenges to complete the concrete lining and filling with water. Construction of appurtenant facilities continues toward completion.
Water�TransferIn 2003, IID implemented a land fallowing program within its service area to generate water to fulfill the SDCWA water transfer and the Salton Sea mitigation delivery schedules. In 2006-2007, 169 fields (17,984.4 acres) were fallowed, which yielded just
Palm Springs
El Centro
18
3
5
12(3) Anza Borrego Desert
(5) Coachella Valley
(12) Imperial
(18) Mojave
Select Water Bodies
Prop 84 Funding Area Region
County Boundaries
L E G E N D
Salton Sea
N
0 12 24 Miles
Note: Region boundaries shown are accurate as of November 2009. See Figure 4-3 in Volume 1 for map of all accepted IRWM regions. Numbers shown correspond to internal tracking list and do not show rankings.
Source: Integrated Regional Water Management Program, DWR. November 2009.
Figure�CR-4� �Regional�acceptance�process�IRWM�regions,�Colorado�River�Hydrologic�Region
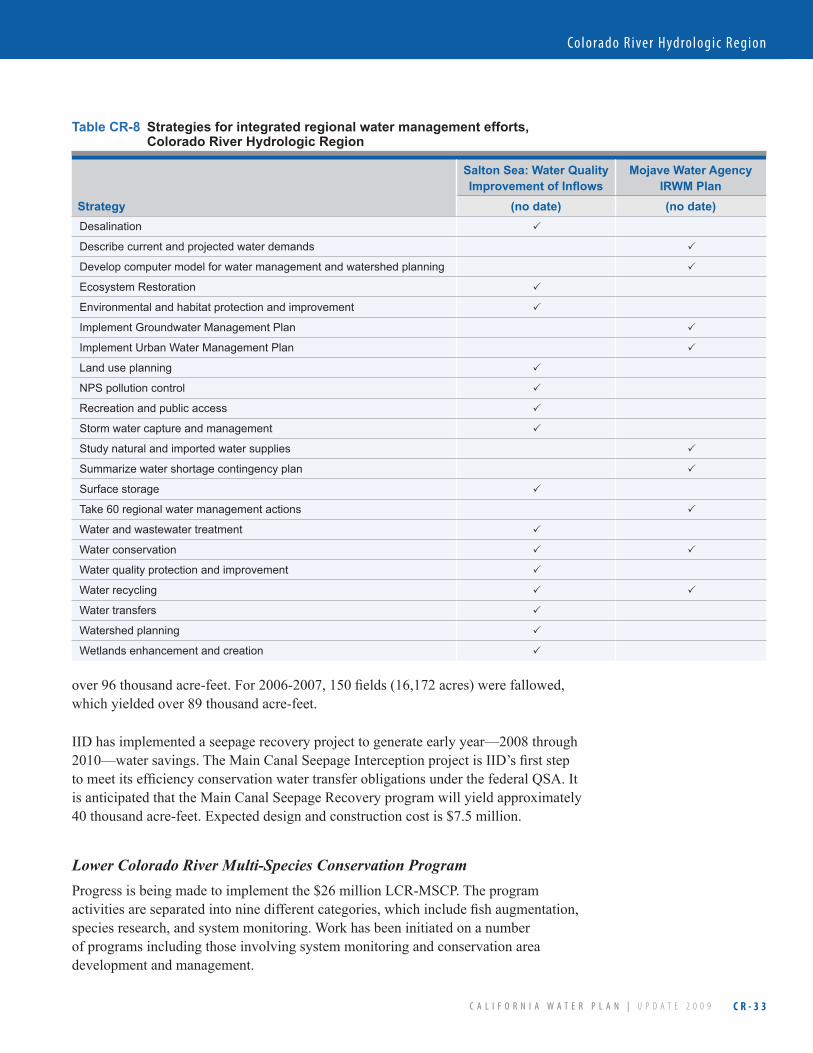
C a l i f o r n i a w a t e r p l a n | u p d a t e 2 0 0 9
Colorado r iver Hydrologic region
C R - 3 3
over 96 thousand acre-feet. For 2006-2007, 150 fields (16,172 acres) were fallowed, which yielded over 89 thousand acre-feet.
IID has implemented a seepage recovery project to generate early year—2008 through 2010—water savings. The Main Canal Seepage Interception project is IID’s first step to meet its efficiency conservation water transfer obligations under the federal QSA. It is anticipated that the Main Canal Seepage Recovery program will yield approximately 40 thousand acre-feet. Expected design and construction cost is $7.5 million.
Lower Colorado River Multi-Species Conservation ProgramProgress is being made to implement the $26 million LCR-MSCP. The program activities are separated into nine different categories, which include fish augmentation, species research, and system monitoring. Work has been initiated on a number of programs including those involving system monitoring and conservation area development and management.
Table�CR-8� �Strategies�for�integrated�regional�water�management�efforts, Colorado River Hydrologic Region
Strategy
Salton�Sea:�Water�Quality�Improvement�of�Inflows
Mojave�Water�Agency�IRWM�Plan�
(no�date) (no�date)Desalination
Describe current and projected water demands
Develop computer model for water management and watershed planning
Ecosystem Restoration
Environmental and habitat protection and improvement
Implement Groundwater Management Plan
Implement Urban Water Management Plan
Land use planning
NPS pollution control
Recreation and public access
Storm water capture and management
Study natural and imported water supplies
Summarize water shortage contingency plan
Surface storage
Take 60 regional water management actions
Water and wastewater treatment
Water conservation
Water quality protection and improvement
Water recycling
Water transfers
Watershed planning
Wetlands enhancement and creation
C a l i f o r n i a w a t e r p l a n | u p d a t e 2 0 0 9
Volume 3 - Regional Repor ts
C R - 3 4
Imperial Irrigation District Efficiency Conservation Definite PlanIID completed and released its Efficiency Conservation Definite Plan (Definite Plan) in 2007. The document identifies on-farm programs, delivery system improvements, and financial incentive packages that are intended to yield conserved water supplies for transfer under the provisions of the CRWDA: Federal QSA. Recommended programs that would help IID meet its objectives include:
Target on-farm savings in the range of 180 thousand acre-feet to 210 thousand acre-• feet per year and delivery system savings ranging from 93 thousand acre-feet to 123 thousand acre-feet at program build-out.Use the Scaled Pay-for-Measures Hybrid Incentive approach to attract growers • (farmers) voluntarily into the efficiency conservation program and to achieve the targeted on-farm savings.Implement seepage recovery and Integrated Information Management (IIM) to • achieve the targeted delivery system savings and to enable the targeted on-farm savings.Implement improved measurement of farm deliveries.• Rely on selected seepage recovery projects and on-farm and delivery system pilot • projects to generate early year—2008 through 2010—water savings.IID should take a series of steps to ensure it is ready to meet its near-term water • transfer obligations.
In 2008, IID will implement a program to test and finalize details in three areas to meet the water conservation efficiency ramp-up schedule: (1) On-farm conservation program, (2) Identification and testing of system improvements, and (3) Improved delivery measurement. Over a period of two and a half years, work will be carried out to set up the programs that will ultimately be used to create the 303 thousand acre-feet per year of transferred water by efficiency conservation. The anticipated cost to complete the near-term actions is $5.74 million.
On-Farm Program. The objective of the on-farm program is to create conserved water through voluntary participation of IID landowners and growers. Details of the program as identified by the Definite Plan as near-term actions need to be developed and finalized. Once the details are finalized and incorporated into an on-farm program, a small-scale enrollment and implementation test will be completed to validate the program details
Identification and Testing of System Improvements. To facilitate water user participation and on-farm conservation efforts, components of the IID delivery system will need to be improved and re-operated to offer additional flexibility to the water users while maintaining existing levels of service and increased reliability.
Improved Delivery Measurement. Improved delivery measurement is a key part of on-farm conservation verification and payment.
C a l i f o r n i a w a t e r p l a n | u p d a t e 2 0 0 9
Colorado r iver Hydrologic region
C R - 3 5
Groundwater�StorageCVWD and IID have entered into a 75-year agreement that allows IID to store a portion of its Colorado River water supply in the Coachella Valley groundwater basin. The water would be delivered to existing or proposed CVWD facilities through direct or in-lieu recharge methods. CVWD would return the stored supplies to IID by decreasing its consumptive use of Colorado River water by the quantity requested by IID or the amount in storage.
Water�SuppliesWater recycling continues to expand in the region. CVWD is currently operating six wastewater treatment plants. Flows from three of the facilities are used to irrigate greenbelts and golf courses, while some of the supplies are used to recharge groundwater. In 2005, total recycled water use was slightly less than 15 thousand acre-feet. The district projects recycled water use to increase to slightly below 30 thousand acre-feet per year by 2030.
CVWD is implementing some of the recommendations from its 2002 Water Management Plan. The plan established goals for conserving water supplies for urban and agricultural users, golf courses, managing the Coachella Valley Groundwater Basin, maintaining water quality, and searching for firm imported supplies. CVWD is exercising its authority to levy and collect assessments to replenish the groundwater supplies within its service area. It has done so in the Upper Whitewater River basin since 1973, and it began to collect assessments in the Mission Creek and lower Whitewater River basins.
CVWD and DWA have jointly and separately entered into agreements to obtain additional SWP supplies. The 2003 Exchange Agreement will permit CVWD and DWA to obtain an additional 100 thousand acre-feet per year in an exchange with MWDSC. CVWD entered into an exchange agreement with the Tulare Lake Basin Groundwater Storage District for an additional 9.9 thousand acre-feet per year.
An EIR has been released for the proposed transfer of the Table A SWP water supplies from the Berrenda Mesa Water District in the Central Valley to CVWD and DWA. The proposed amount for the transaction would be 16 thousand acre-feet per year: 12 thousand acre-feet per year for CVWD and 4 thousand acre-feet per year for DWA.
Urban Water ConservationCVWD has updated and approved a revised landscape ordinance for customers within its service area. With this update, the CVWD hopes to decrease overall water use, eliminate the runoff of irrigation water into the streets, and limit turf grass allowance for golf courses.
C a l i f o r n i a w a t e r p l a n | u p d a t e 2 0 0 9
Volume 3 - Regional Repor ts
C R - 3 6
The Twentynine Palms Water District has been implementing very aggressive water audit, leak detection, and water main replacement programs for the past decade. The agency conducts a very efficient preventive maintenance program and detects and repairs leaks in its distribution system quickly. Annual unaccounted water losses have been reduced by over 90 percent.
Water�QualityMSWD has successfully completed several phases of its Groundwater Protection Project connecting about 2,500 parcels to its wastewater collection system and abating about 1,750 on-site (septic) systems.
Cathedral City has completed three septic-to-sewer projects and is currently implementing a fourth to address water quality problems for the Whitewater Municipal Groundwater Basin. The completed projects have replaced about 2,600 septic tanks and have extended sewer service to more than 3,000 parcels. The current project will eliminate 500 septic tanks and provide sewer service for 650 parcels.
Due to changes in the federal and State Safe Drinking Water acts, IID water users who receive canal water at their homes or businesses must have an alternate source of water for drinking and cooking purposes. If users are not currently receiving water from one of the California Department of Health Safety (DHS) Approved Providers, a municipal (city) water system, or a private permitted water system (not a point-of-entry filtration system), they must arrange to have water delivered to their home or business or the domestic canal water connection will be terminated. IID strictly enforces this rule to avoid penalties that could exceed $25,000 a day.
Flood�ControlMajor flood control accomplishments in the Colorado River Hydrologic Region since 2000 include:
Imperial County Multi-Hazard Mitigation Plan, in progress• Multi-Jurisdictional Hazard Mitigation Plan, San Diego County, California, adopted • in 2004Riverside County Operational Area Multi-Jurisdictional Local Hazard Mitigation • Plan, approved in 2005San Bernardino Operational Area, Multi-Jurisdictional Hazard Mitigation Plan, • approved in 2005.
Urban Wastewater TreatmentImportant steps were taken to improve the quality of the urban wastewater flows entering into the United States through the New River from Mexico. Financed largely by the United States, a new wastewater treatment facility, the Las Arenitas plant, was constructed in the Mexicali Valley and began treating New River water in
C a l i f o r n i a w a t e r p l a n | u p d a t e 2 0 0 9
Colorado r iver Hydrologic region
C R - 3 7
November 2006. Treated flows from the plant are moved southward through a new pipeline to the Hardy River. This has reduced flow to the Salton Sea.
ChallengesThreatened or endangered fish species on the main stem of the Colorado River include the Colorado pikeminnow, razorback sucker, humpback chub, and bonytail chub. Efforts to protect these fish may impact reservoir operations and streamflow in the main stem and tributaries, which are critically important to California’s ability to store and divert Colorado River water supplies. Other species of concern in the basin include the bald eagle, Yuma clapper rail, black rail, southwestern willow flycatcher, yellow warbler, vermilion flycatcher, yellow-billed cuckoo, and Kanab ambersnail.
The Salton Sea is the primary focus of water quality issues within this hydrologic region. The largest sources of surface water inflow to the sea are the New and Alamo rivers and the Imperial Valley agriculture drains, all of which contribute pesticides, nutrients, selenium, and silt. The Alamo River consists mainly of agricultural drainage from the Imperial Valley. The Coachella Valley Stormwater Channel, which also drains to the sea, is heavily contaminated at its north end with pathogens from municipal wastewater plants in the Coachella Valley and agricultural drainage.
The Citizen’s Congressional Task Force on the New River was created in 1997 to improve agricultural drain water quality that flows into the New River and, ultimately, to the Salton Sea. In 2000, the task force constructed two pilot wetland projects, a 7-acre site near Brawley and a 68-acre site near Imperial, to test the effectiveness of constructed wetlands in lowering nonpoint source pollutants. With the success of the pilot sites, a total of 30 additional wetland sites were proposed on both the New and Alamo rivers. Further investigation has shown that around ten of these sites would require pumping of water into the wetland, which is why about 20 sites are now proposed.
A new treatment facility had been constructed in the Mexicali Valley that also included 17 miles of pipelines and treatment lagoons. Despite plans to send the treated wastewater southward through the Hardy River, treated and untreated flow continues from Mexico into the New River and the Salton Sea; however, the amount of flow from Mexico has been reduced.
Colorado�River�Water�and�GroundwaterThe relatively saline Colorado River provides irrigation and domestic water to much of Southern California. Of recent concern to human health is the presence of low levels of perchlorate in the Colorado River from a Kerr-McGee chemical facility in the Las Vegas Wash, the nation’s largest perchlorate contamination site. In addition, high levels of hexavalent chromium occur in groundwater wells near the town of Needles. Septic systems at recreational areas along the river are also a concern for domestic
C a l i f o r n i a w a t e r p l a n | u p d a t e 2 0 0 9
Volume 3 - Regional Repor ts
C R - 3 8
and recreational water uses. Other important water quality issues in this region include increasing levels of salinity, nitrates, and other substances in groundwater associated with animal feeding and dairy operations and septic tank systems, especially in the Desert Hot Springs area. In the Coachella Valley, high levels of nitrates restrict the use of several domestic water supply wells.
As a result of a 1964 US Supreme Court decree in Arizona v. California, California’s basic apportionment of Colorado River water was quantified, and five lower Colorado River Indian Tribes were awarded 905 thousand acre-feet per year of diversions, 131.4 thousand acre-feet of which were allocated for diversion in and chargeable to California pursuant to a later supplemental decree. Three of the five tribes—the Fort Mojave Indian Tribe, the Fort Yuma-Quechan Indian Tribe, and the Colorado River Indian Tribe—are pursuing additional water rights related to the boundary lands claims. A settlement has been reached on the claims of the Fort Mojave Indian Tribe and the Colorado River Indian Tribe. The settlements as approved by the US Supreme Court provide 5,122 acre-feet of additional diversions to these two tribes. An agreement has also been reached to settle the claim of the Fort Yuma-Quechan Indian Tribe, which is currently before the US Supreme Court.
Urban�Wastewater�TreatmentA building moratorium was imposed by Imperial County in the community of Salton City until the existing wastewater treatment facility can be upgraded. The concern is that the plant cannot process the volume of collected wastewater. The capacity of plant will go from 200,000 gallons per day to 500,000 gallons per day.
Drought and Flood PlanningImperial County has created a flood management plan in cooperation with Imperial Irrigation District, Imperial County School District, and Salton Community Services District. This plan identifies vulnerable areas (e.g., Calipatria), discusses various techniques for lessening flood risk, and contains a general implementation plan.
The Disaster Mitigation Act of 2000 provided financial incentives to states and local entities for developing Hazard Mitigation Plans (HMPs) that identify actions for mitigating disasters and contain strategies for action implementation. Currently, Riverside, San Diego, and San Bernardino counties have FEMA-approved HMPs that discuss flooding issues and the measures most likely to alleviate those risks. All three plans are multi-jurisdictional and consider flood risks and mitigation at various governmental levels. Imperial County has prepared a draft plan that is available for public review.
Water supply shortages, both short- and long-termed, are always possible in the Colorado River region. Faced with that reality and prompted by amendments to the
C a l i f o r n i a w a t e r p l a n | u p d a t e 2 0 0 9
Colorado r iver Hydrologic region
C R - 3 9
Urban Water Management Plan Act, water districts have developed emergency or water supply shortage plans to mitigate the consequences of the shortages.
For MSWD, procedures have been established to obtain emergency water supplies from the CVWD. Two inter-connections exist which could be utilized to obtain additional emergencies supplies. MSWD’s Disaster Preparedness Plan has been updated to be compliant with both the NIMS and SEMS.
In late 2006, the IID Board of Directors approved the development of an equitable distribution plan to apportion agricultural water users using the straight-line method for years that conditions trigger a supply/demand imbalance (SDI) declaration. In December 2007, the IID Board passed a resolution approving the new regulations and authorizing the general manager to implement them. Also in December 2007, the Secretary of the Interior signed Colorado River Interim Guidelines for Lower Basin Shortages and Coordinated Operations for Lakes Powell and Mead. The four key elements of the new guidelines:
Establish rules for shortages specifying who will take reductions and when they • take them, which is essential for prudent water planning in times of drought. Establish new operational rules for Lake Powell and Lake Mead to allow these • reservoirs to rise and fall in tandem, thereby better sharing the risk of drought. Establish rules for surpluses so if the basin has ample runoff the Department of the • Interior will have rules in place to distribute the extra water. Address the ongoing drought by encouraging new initiatives for water conservation.•
Looking to the Future
A new delivery system will permit CVWD to deliver Colorado River water supplies through the Coachella Canal to golf courses in the middle of the Coachella Valley. The project is designed to supply a blend of irrigation water and recycled water to some of the over 50 golf courses in the Palm Desert, Rancho Mirage, and Indian Wells areas of the valley and encourage the golf courses to pump less groundwater annually. A new receiving reservoir near one of its recycling plants will permit CVWD to store 65 acre-feet of blended canal and recycled water.
Future ScenariosFor Update 2009, we evaluated different ways of managing water in California depending on alternative future conditions and different regions of the state. The ultimate goal is to evaluate how different regional response packages, or combinations of resource management strategies from Volume 2, perform under alternative possible future conditions. The alternative future conditions are described as future scenarios. Together the response packages and future scenarios show what management options could provide for sustainability of resources and ways to manage uncertainty and risk at a regional level. See Box CR-5 for scenario descriptions.
C a l i f o r n i a w a t e r p l a n | u p d a t e 2 0 0 9
Volume 3 - Regional Repor ts
C R - 4 0
Total�Demand�Change in total water demand in the Colorado River Hydrologic Region for the three scenarios—Current Trends, Slow & Strategic Growth, and Expansive Growth—are shown in Figure CR-5. The change in water demand is based on the difference between the historical average (1998-2005) and future average (2043-2050) water demands. Future water demand is shown with and without climate change. The change in water demand without climate change is shown with solid bars and those with climate change with hatched bars. As shown in the figure, future water demand relative to historical period without climate impacts (solid bar) shows an increase in water demand under both the Current Trends and Expansive Growth scenarios. Current Trends had an increase of about 300 thousand acre-feet, and Expansive Growth showed an increase of about 740 thousand acre-feet. Slow & Strategic Growth, however, shows a reduction in water demand of about 380 thousand acre-feet. Considering the 12 alternative climate change sequences studied (hatched bar), the Current Trends and Expansive Growth scenarios show a modest range of variability and increase in future water demand. Ranges of increase for Current Trends is from 250 thousand acre-feet to 450 thousand acre-feet, and for Expansive Growth, it was from 680 thousand acre-feet to 920 thousand acre-feet. Slow & Strategic Growth, however, shows a reduction in water demand from 410 thousand acre-feet with milder climates and a reduction to 250 thousand acre-feet in demand on the higher end with drier and warmer climatic projections.
Update 2009 uses three baseline scenarios to better understand the implications of future conditions on water management decisions. The scenarios are referred to as baseline because they represent changes that are plausible and could occur without additional management intervention beyond those currently planned. Each scenario affects water demands and supplies differently.
�Scenario�1�–�Current�Trends.�• For this scenario, recent trends are assumed to continue into the future. In 2050, nearly 60 million people live in California. Affordable housing has drawn families to the interior valleys. Commuters take longer trips in distance and time. In some areas where urban development and natural resources restoration has increased, irrigated crop land has decreased. The state continues to face lawsuits: fromflooddamagestowaterqualityandendangeredspecies protections. Regulations are not comprehensive or coordinated, creating uncertainty for local planners and water managers.
�Scenario�2�–�Slow�&�Strategic�Growth.�• Private, public, and governmental institutions form alliances to provide formoreefficientplanninganddevelopmentthatisless
resources intensive than current conditions. Population growth is slower than currently projected—about 45 million people live here. Compact urban development has eased commuter travel. Californians embrace water and energy conservation. Conversion of agricultural land to urban development has slowed and occurs mostly for environmentalrestorationandfloodprotection.Stategovernment implements comprehensive and coordinated regulatoryprogramstoimprovewaterquality,protectfishandwildlife,andprotectcommunitiesfromflooding.
�Scenario�3�–�Expansive�Growth.�• Future conditions are more resource intensive than existing conditions. Population growth is faster than currently projected with 70 million people living in California in 2050. Families prefer low-density housing, and many seek rural residential properties, expanding urban areas. Some water and energy conservation programs are offered but at a slower rate than trends in the early century. Irrigated crop land hasdecreasedsignificantlywhereurbandevelopmentand natural restoration have increased. Protection of water quality and endangered species is driven mostly by lawsuits, creating uncertainty.
Box CR-5 Scenario�Descriptions
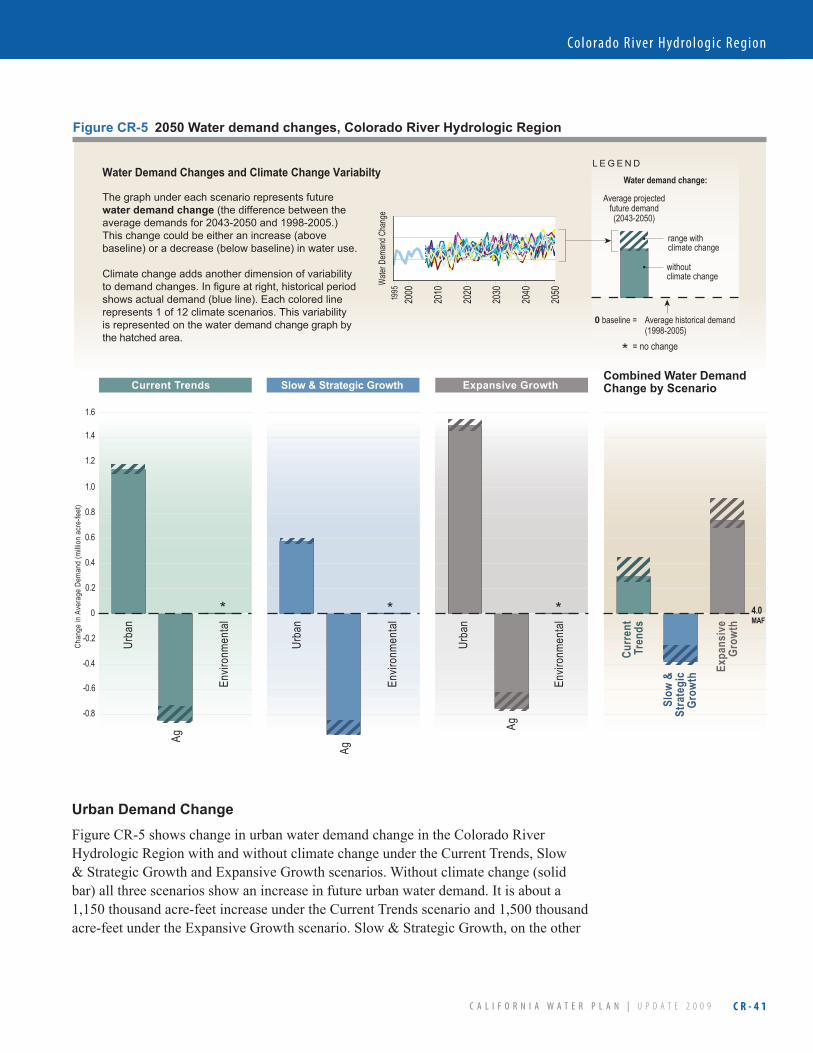
C a l i f o r n i a w a t e r p l a n | u p d a t e 2 0 0 9
Colorado r iver Hydrologic region
C R - 4 1
Urban�Demand�ChangeFigure CR-5 shows change in urban water demand change in the Colorado River Hydrologic Region with and without climate change under the Current Trends, Slow & Strategic Growth and Expansive Growth scenarios. Without climate change (solid bar) all three scenarios show an increase in future urban water demand. It is about a 1,150 thousand acre-feet increase under the Current Trends scenario and 1,500 thousand acre-feet under the Expansive Growth scenario. Slow & Strategic Growth, on the other
1990 20001995
2010
2020
2030
2040
2050
* = no change
L E G E N D
Wat
er D
eman
d Ch
ange
Water Demand Changes and Climate Change Variabilty
The graph under each scenario represents future water demand change (the difference between the average demands for 2043-2050 and 1998-2005.) This change could be either an increase (above baseline) or a decrease (below baseline) in water use.
Climate change adds another dimension of variability to demand changes. In figure at right, historical period shows actual demand (blue line). Each colored line represents 1 of 12 climate scenarios. This variability is represented on the water demand change graph by the hatched area.
range with climate change
without climate change
0 baseline = Average historical demand (1998-2005)
Average projectedfuture demand(2043-2050)
Water demand change:
Slow & Strategic Growth
Colorado River
Figure CR-5 2050 Water Demand Changes
Combined Water Demand Change by ScenarioCurrent Trends Expansive Growth
Cha
nge
in A
vera
ge D
eman
d (m
illio
n ac
re-fe
et)
-0.4
-0.2
0
-0.8
-0.6
0.2
0.4
0.6
0.8
1.0
1.2
1.4
1.6
4.0MAF
Urb
an
Ag
Env
ironm
enta
l
Urb
an
Ag
Env
ironm
enta
l
Urb
an
Ag
Env
ironm
enta
l
Cur
rent
Tren
ds
Slo
w &
Str
ateg
ic
G
row
th
Exp
ansi
veG
row
th
* * *
Figure CR-5 �2050�Water�demand�changes,�Colorado�River�Hydrologic�Region
C a l i f o r n i a w a t e r p l a n | u p d a t e 2 0 0 9
Volume 3 - Regional Repor ts
C R - 4 2
hand, shows a smaller increase in future demand of about 580 thousand acre-feet. When climate change is factored in, all 3 scenarios show an overall increase in future urban water demand but the variation is relatively narrow across the span of the 12 climate scenarios for all 3 scenarios. This indicates future climate change may have limited impacts on urban water demand in the Colorado River Hydrologic Region.
Agricultural�Demand�ChangeChange in agricultural water demand in the Colorado River Hydrologic Region is shown in Figure CR-5. Future agricultural water demand is lower due to reduction in irrigated acreage and additional background water conservation. Without climate change (solid bar), Slow & Strategic Growth has a slightly larger reduction (960 thousand acre-feet), followed by the Current Trends scenario (850 thousand acre-feet). The Expansive Growth scenario, however, shows a lesser reduction (about 750 thousand acre-feet). Considering the 12 alternative climate change sequences studied (hatched bar), all three scenarios still show a reduction in region’s future agricultural water demand, but the reduction is less than without climate change. The Current Trends scenario shows a future reduction in water demand ranging from 740 thousand acre-feet to 870 thousand acre-feet. Slow & Strategic Growth shows a reduction from 850 thousand acre-feet to 970 thousand acre-feet. Expansive Growth scenario shows a variation in future water demands between 630 thousand acre-feet to about 780 thousand acre-feet.
Environmental�Demand�Change�Figure CR-5 shows a base environmental water demand of about 30 thousand acre-feet in Colorado River Hydrologic Region. No additional environmental water demands are assumed for the Colorado River region beyond current commitments. For Update 2009 we were not able to estimate additional environmental objectives. Please refer to Volume 1 Chapter 5 for more information.
Response Strategies
Additional�Storage/Operational�FlexibilityIllustrating the growing anxiety over water across the West, MWDSC has entered into a novel tri-state agreement to build a small reservoir (8 thousand acre-feet) in the Imperial Valley that could stretch supplies for Phoenix, Las Vegas, and San Diego. Drop 2 Storage Reservoir is a $172 million project that would collect water allocated to California users that would otherwise flow to Mexico. The water would be diverted into the All American Canal at Imperial Dam, and from the AAC into the reservoir some 30 miles east of the City of Calexico.
Under the agreement, the stored water will be used by Imperial Valley farmers. In exchange, the three agencies that paid for the reservoir will be credited a like amount from Lake Mead.
C a l i f o r n i a w a t e r p l a n | u p d a t e 2 0 0 9
Colorado r iver Hydrologic region
C R - 4 3
For MWDSC, the project would provide about 100 thousand acre-feet over the next three years. MWDSC can take only 34 thousand acre-feet per year for each of those three years, however. The Las Vegas-based Southern Nevada Water Agency, which is financing most of the project, will receive a maximum of 400 thousand acre-feet starting in 2011. The Central Arizona Project will receive 100 thousand acre-feet spread out over time. The USBR will build the project.
Landscape�Water�Conservation�Indio has a new landscaping and water conservation ordinance for new development. The ordinance was written to help reduce the depletion of the valley’s water supply. Stipulations are:
Inefficient landscape irrigation that causes runoff, low head drainage and conditions • where water flows onto roadways are prohibited. All new commercial, industrial and apartment buildings must have separate meters • for landscaping installed by January 1, 2013. Rain sensing override devices shall be required on all irrigation systems. • Sprinklers must be equipped with vertical stops installed just below the sprinkler • head to automatically shut off water to a broken sprinkler head.
Desert�Landscape�WorkshopsThe Alliance for Water Awareness and Conservation, in partnership with Joshua Basin Water District and Hi-Desert Water District, held a series of Desert Landscape Workshops. The workshops explored and shared landscaping ideas and concepts that are best suited to high desert climates. Attendees were introduced to techniques that make the most of water efficient irrigation methods, low-maintenance and sustainable landscaping practices, and desert friendly plants in landscape design.

C a l i f o r n i a w a t e r p l a n | u p d a t e 2 0 0 9
Volume 3 - Regional Repor ts
C R - 4 4
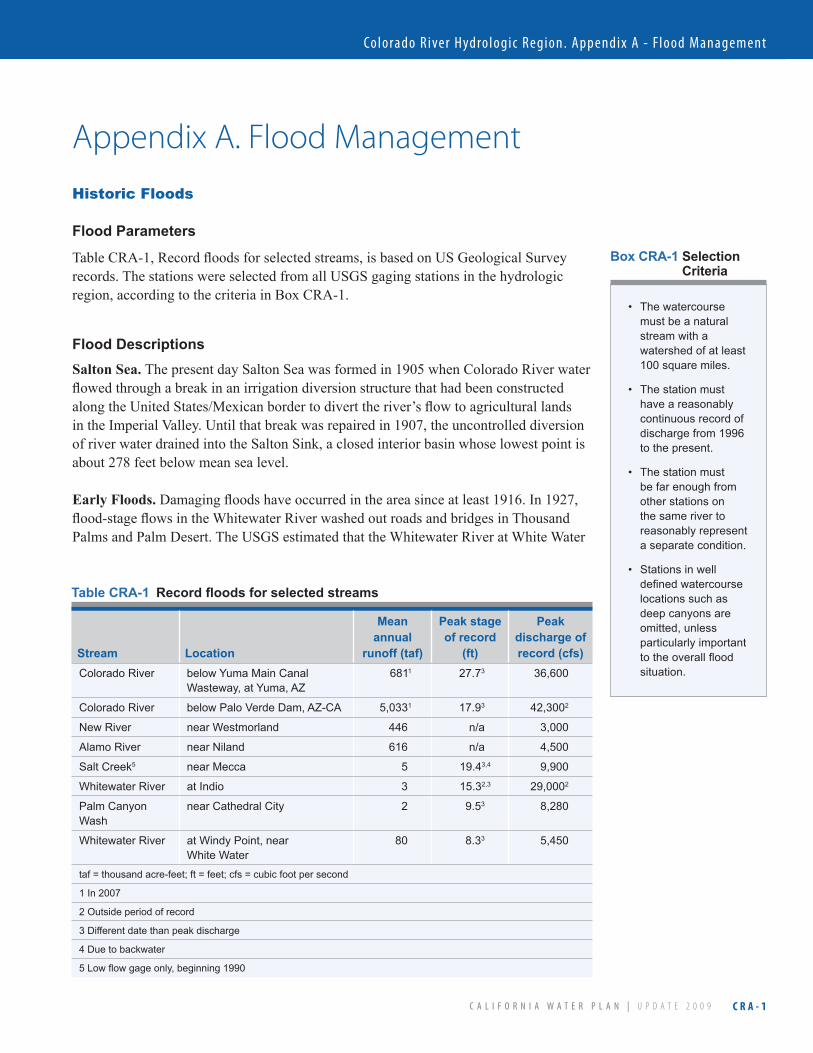
C a l i f o r n i a w a t e r p l a n | u p d a t e 2 0 0 9
Colorado r iver Hydrologic region. appendix a - flood Management
C R A - 1
Appendix A. Flood ManagementHistoric Floods
Flood�Parameters
Table CRA-1, Record floods for selected streams, is based on US Geological Survey records. The stations were selected from all USGS gaging stations in the hydrologic region, according to the criteria in Box CRA-1.
Flood�DescriptionsSalton Sea. The present day Salton Sea was formed in 1905 when Colorado River water flowed through a break in an irrigation diversion structure that had been constructed along the United States/Mexican border to divert the river’s flow to agricultural lands in the Imperial Valley. Until that break was repaired in 1907, the uncontrolled diversion of river water drained into the Salton Sink, a closed interior basin whose lowest point is about 278 feet below mean sea level.
Early Floods. Damaging floods have occurred in the area since at least 1916. In 1927, flood-stage flows in the Whitewater River washed out roads and bridges in Thousand Palms and Palm Desert. The USGS estimated that the Whitewater River at White Water
Table�CRA-1� �Record�floods�for�selected�streams
Stream Location
Mean�annual
runoff�(taf)
Peak�stage�of record
(ft)
Peak�discharge�of�record�(cfs)
Colorado River below Yuma Main Canal Wasteway, at Yuma, AZ
6811 27.73 36,600
Colorado River below Palo Verde Dam, AZ-CA 5,0331 17.93 42,3002
New River near Westmorland 446 n/a 3,000
Alamo River near Niland 616 n/a 4,500
Salt Creek5 near Mecca 5 19.43,4 9,900
Whitewater River at Indio 3 15.32,3 29,0002
Palm Canyon Wash
near Cathedral City 2 9.53 8,280
Whitewater River at Windy Point, near White Water
80 8.33 5,450
taf = thousand acre-feet; ft = feet; cfs = cubic foot per second
1 In 2007
2 Outside period of record
3 Different date than peak discharge
4 Due to backwater
5Lowflowgageonly,beginning1990
The watercourse •must be a natural stream with a watershed of at least 100 square miles.
The station must •have a reasonably continuous record of discharge from 1996 to the present.
The station must •be far enough from other stations on the same river to reasonably represent a separate condition.
Stations in well •definedwatercourselocations such as deep canyons are omitted, unless particularly important totheoverallfloodsituation.
Box CRA-1 �Selection�Criteria

C a l i f o r n i a w a t e r p l a n | u p d a t e 2 0 0 9
Volume 3 - Regional Repor ts
C R A - 2
exceeded the 100-year flood stage in March 1938 when it isolated Palm Springs and caused several deaths.
November 1965. Flooding from the Whitewater River struck again in November 1965 and resulted in three fatalities and $3 million in damages.
January 1969. A flow of wet, tropical air from Hawaii to Southern California in January 1969 caused intense rainfall and consequent flooding in the Whitewater River, culminating in severe damage to roads and property in the Palm Springs area.
September 1976. Bolstered by an El Niño year, the peak of hurricane season, and a high storm velocity, Tropical Storm Kathleen reached Southern California on September 10, 1976, and caused widespread damage throughout the region. Levee failure in the Whitewater River resulted in inundation of a significant portion of Palm Desert. Flooding in the Coachella, Imperial, and Palo Verde valleys caused extensive damage to residential, commercial, and agricultural properties. Floodwater from McCoy Wash, a tributary of the Colorado River, caused an estimated $12 million crop loss in Palo Verde Valley.
Late Summer 1977. Tropical Storm Doreen swept through the region and ravaged 300 homes, wiped out portions of Interstate 8, and caused $15 million worth of damage to crops.
January 1995. Rising Salton Sea levels, derived from precipitation dropped by wet Pacific storms steered into the region by El Niño conditions in January 1995, damaged electrical infrastructure and inundated a trailer park at Desert Shores.
2003. The community of Borrego Springs was inundated with storm water flowing from the fire-scorched Ranchita area, causing extensive property damage.
Flood GovernanceMany federal, State, and local agencies have responsibilities in the overall effort to manage floods. The principal participants in the Colorado River Hydrologic Region and their activities are listed in Table CRA-2. Most listed activities are self-explanatory. Descriptions of some follow.
Flood project development. • Performing feasibility studies, planning, and design of constructed facilities.Encroachment control. • Establishing, financing, and operating a system of permitting and enforcing permits to encroach on constructed facilities.Floodplain conservation or restoration. • Any overt activity causing part of a floodplain to remain in effect or to be reinstated as a watercourse overflow area.Flood insurance administration or participation. • Contribution to the management of or acting as a sponsor and cooperator in the National Flood Insurance Program including the Community Rating System.

C a l i f o r n i a w a t e r p l a n | u p d a t e 2 0 0 9
Colorado r iver Hydrologic region. appendix a - flood Management
C R A - 3
Table�CRA-2� �Flood�management�participants
FCWCD = Flood Control and Water Conservation District
Structural�approaches Land�use�management
Preparedness,�response�and�recovery
Floo
d�projects
Floo
dplains
Floo
d�insurance
Regulation
Data�managem
ent
Floo
d�education
Event�m
anagem
ent
Fina
ncin
g
Develop
ment
Con
struction
Operatio
n
Encroachment�con
trol
Maintenance
Con
servation
Restoratio
n
Delineatio
n
Adm
inistration
Participation
FIRM�mapping
Building�perm
its
Designated�flo
odways
Data�collection
Hydrologic�analysis
Data�station�maintenance
Preparedness
Respo
nse�managem
ent
Respo
nse�person
nel
System
�adm
inistration
Rec
over
y fu
ndin
g
Recovery�op
erations
Mitigatio
n
Federal�agencies
Federal Emergency Management Agency
National Weather Service
Natural Resources Conservation Service
US Geological Survey
US Army Corps of Engineers
US Bureau of Reclamation
State�agencies
California Conservation Corps
Department of Corrections
Department of Forestry and Fire Protection
Department of Water Resources
California Emergency Management Agency
Local�agencies
County emergency services units
County planning departments
County building departments
Localfloodmaintenanceorganizations
Local conservation corps
Local initial responders to emergencies
Riverside County FCWCD
San Bernardino County Flood Control District
San Diego County Flood Control District
C a l i f o r n i a w a t e r p l a n | u p d a t e 2 0 0 9
Volume 3 - Regional Repor ts
C R A - 4
Hydrologic analysis. • Hydrologic or statistical analysis of collected hydrometeorological data.Flood education. • Informing the general public about any aspect of flood management; publishing or broadcasting collected hydrometeorological data or other flood-related material.Recovery operations. • Financing or performing any activity intended to return flood-impacted facilities or persons to normal status.Event management system administration. • Oversight of the National Incident Management System/Standardized Emergency Management System (NIMS/SEMS) as applied to California.
Flood Risk Management
Structural�ApproachesThe principal reservoirs and non-storage facilities contributing to flood control are listed below in Table CRA-3.
Disaster�Preparation,�Response,�and�RecoveryManagement of flood emergencies is the responsibility of many organizations and individuals. Response is required by law to conform to SEMS, under which action is taken by levels of organization. It is begun by the person or organization on the site. That entity resists personal injury and property damage to the best of its ability, only calling on the next level when its resources become insufficient, and succeeding levels follow the same procedure. Table CRA-4 indicates the responsible entities at successive levels of response.
Regional Water and Flood Planning and Management
Integrated Regional Water Management
Of three water management plans in the region, one addresses flood control. The Salton Sea Integrated Regional Water Management: Water Quality Improvement of Inflow could decrease the risk of flooding from the sea to the communities of Bombay Beach and Desert Shores by planning projects that would stabilize the elevation of the Salton Sea (via pumps, outlet streams, reservoirs, and berms).
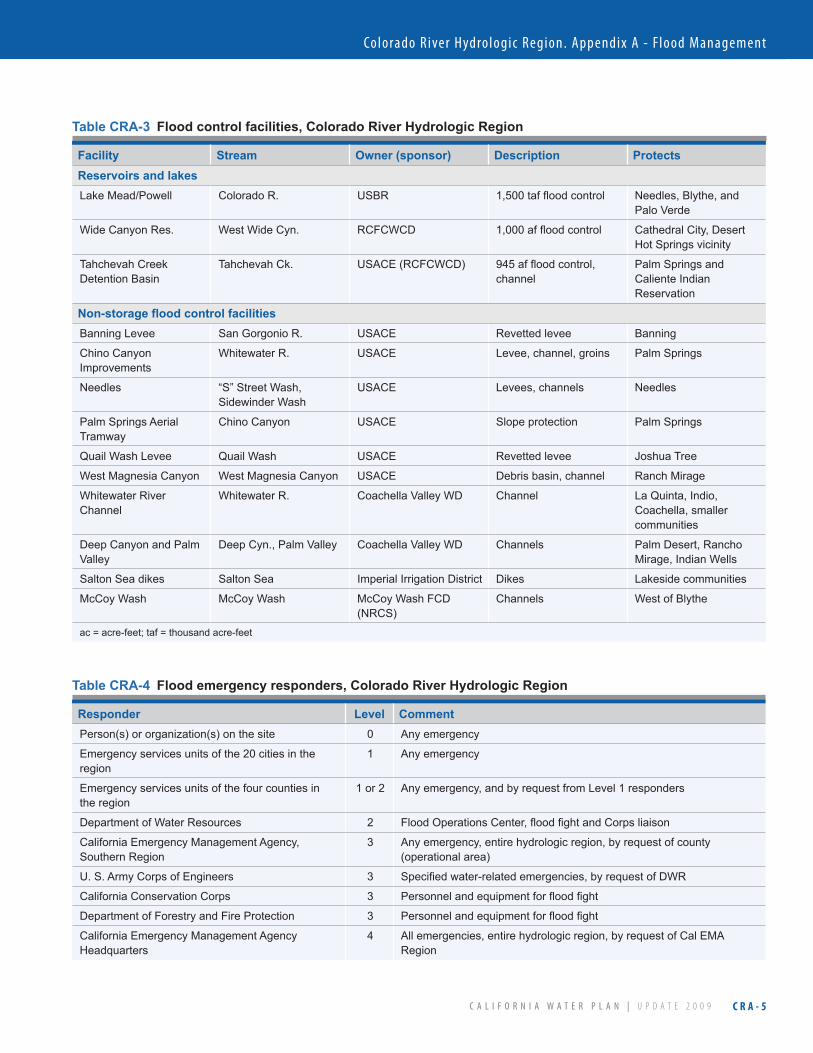
C a l i f o r n i a w a t e r p l a n | u p d a t e 2 0 0 9
Colorado r iver Hydrologic region. appendix a - flood Management
C R A - 5
Table�CRA-4� �Flood�emergency�responders,�Colorado�River�Hydrologic�Region
Responder Level CommentPerson(s) or organization(s) on the site 0 Any emergency
Emergency services units of the 20 cities in the region
1 Any emergency
Emergency services units of the four counties in the region
1 or 2 Any emergency, and by request from Level 1 responders
Department of Water Resources 2 FloodOperationsCenter,floodfightandCorpsliaison
California Emergency Management Agency, Southern Region
3 Any emergency, entire hydrologic region, by request of county (operational area)
U. S. Army Corps of Engineers 3 Specifiedwater-relatedemergencies,byrequestofDWR
California Conservation Corps 3 Personnelandequipmentforfloodfight
Department of Forestry and Fire Protection 3 Personnelandequipmentforfloodfight
California Emergency Management Agency Headquarters
4 All emergencies, entire hydrologic region, by request of Cal EMA Region
Table�CRA-3� �Flood�control�facilities,�Colorado�River�Hydrologic�Region
Facility Stream Owner�(sponsor) Description ProtectsReservoirs�and�lakesLake Mead/Powell Colorado R. USBR 1,500taffloodcontrol Needles, Blythe, and
Palo Verde
Wide Canyon Res. West Wide Cyn. RCFCWCD 1,000affloodcontrol Cathedral City, Desert Hot Springs vicinity
Tahchevah Creek Detention Basin
Tahchevah Ck. USACE (RCFCWCD) 945affloodcontrol,channel
Palm Springs and Caliente Indian Reservation
Non-storage�flood�control�facilitiesBanning Levee San Gorgonio R. USACE Revetted levee Banning
Chino Canyon Improvements
Whitewater R. USACE Levee, channel, groins Palm Springs
Needles “S”StreetWash,Sidewinder Wash
USACE Levees, channels Needles
Palm Springs Aerial Tramway
Chino Canyon USACE Slope protection Palm Springs
Quail Wash Levee Quail Wash USACE Revetted levee Joshua Tree
West Magnesia Canyon West Magnesia Canyon USACE Debris basin, channel Ranch Mirage
Whitewater River Channel
Whitewater R. Coachella Valley WD Channel La Quinta, Indio, Coachella, smaller communities
Deep Canyon and Palm Valley
Deep Cyn., Palm Valley Coachella Valley WD Channels Palm Desert, Rancho Mirage, Indian Wells
Salton Sea dikes Salton Sea Imperial Irrigation District Dikes Lakeside communities
McCoy Wash McCoy Wash McCoy Wash FCD (NRCS)
Channels West of Blythe
ac = acre-feet; taf = thousand acre-feet

C a l i f o r n i a w a t e r p l a n | u p d a t e 2 0 0 9
Volume 3 - Regional Repor ts
C R A - 6
C a l i f o r n i a w a t e r p l a n | u p d a t e 2 0 0 9
Colorado r iver Hydrologic region. appendix B - S elec ted references
C R B - 1
Appendix B. Selected ReferencesWatersheds
Colorado River Basin Regional Water Quality Control Board. Salton Sea [Web site]. http://www.waterboards.ca.gov/coloradoriver/water_issues/programs/salton_sea/index.shtml
Colorado River Basin Regional Water Quality Control Board. Watershed Management Initiative Chapter [Web site]. http://www.swrcb.ca.gov/rwqcb7/wmi.html
US Department of Agriculture, Natural Resources Conservation Services. 1998. Clean Water Action Plan – California Unified Watershed Assessment. Available at http://www.ca.nrcs.usda.gov/features/projects/cwap/
Ecosystems
CH2MHill. 2007. Worker Education Manual for New Construction, Operation, and Maintenance Activities in Desert Habitats. Feb. [Internet]. Prepared for Imperial Irrigation District. Available at: http://www.iid.com/Operations/EnvironmentalEducationTraining
Coachella Valley Multiple Species Habitat Conservation Plan. [Internet]. Available at: http://www.cvmshcp.org/
Coachella Valley Multiple Species Habitat Conservation Plan. Plan Map. [Internet]. Available at: http://www.cvmshcp.org/Plan_Maps_New.htm
Imperial Irrigation District. Managed Marsh. [Internet]. Various technical documents available at: http://www.iid.com/Water_Index.php?pid=3191
Lower Colorado River Multi-Species Conservation Plan. 2005. Record of Decision. [Internet]. April. Available at: http://www.lcrmscp.gov/workplans.html
US Bureau of Reclamation. Lower Colorado Region. Lower Colorado River Multi-Species Conservation Program. [Internet]. Available at: http://www.lcrmscp.gov/
Climate
Western Regional Climate Center. [Internet]. Available at: http://www.wrcc.dri.edu/
Water Use
Agricultural Water Management Council. 1999. Memorandum of Understanding Regarding Efficient Water Management Practices by Agricultural Water Suppliers in California. Agricultural Water Suppliers Efficient Management Practices Act of 1990 AB 3616. [Internet]. Available at: http://www.agwatercouncil.org/images/stories/pdfs/awmcmou.pdf
Bookman-Edmonston Engineering. 2007. Water Use and Conservation Progress Monitoring, Mojave Water Agency Regional Water Management Plan Technical Memorandum. Jan 16.
Imperial Irrigation District. 2005. QSA Annual Implementation Report.
Mojave Water Agency. [Internet]. MWA Web site: http://www.mojavewater.org/homeContent.aspx
Palo Verde Irrigation District. [Internet]. Available at: http://www.pvid.org/
Citations to the World Wide Web (URL) were accurate at the time of writing
C a l i f o r n i a w a t e r p l a n | u p d a t e 2 0 0 9
Volume 3 - Regional Repor ts
C R B - 2
Water Quality
Colorado River Basin Regional Water Quality Control Board. Total Maximum Daily Load (TDML) and the 303(d) List of Impaired Bodies. [Internet]. [updated: April 16, 2008]. Available at: http://www.waterboards.ca.gov/coloradoriver/water_issues/programs/tmdl/
Colorado River Basin Regional Water Quality Control Board. Water Management Initiative (WMI). [Internet]. [updated: July 12, 2005]. Available at: http://www.waterboards.ca.gov/coloradoriver/water_issues/programs/wmi/
Salton Sea Authority. 2005. Final Report for Reducing Eutrophic Conditions of the Salton Sea. Prepared for the Colorado River Regional Water Quality Control Board. July 29.
State Water Resources Control Board, California Coastal Commission. 2000. Nonpoint Source Program Strategy and Implementation Plan, 1998-2013. [Internet]. Jan. Available at: http://www.coastal.ca.gov/nps/npsndx.html
State Water Resources Control Board. 2003. 2002 California §305(b) Report on Water Quality. [Internet]. Prepared as required by Federal Clean Water Act Section 305(b). Aug. Available at: http://www.waterboards.ca.gov/water_issues/programs/tmdl/305b.shtml
Strategic Plan, State Water Resources Control Board, Regional Water Quality Control Boards, November 15, 2001 http://www.swrcb.ca.gov/publications_forms/publications/general/docs/strategicplan_2001.pdf
Water Governance
City of Banning. 2005. Urban Water Management Plan
Mojave Water Agency. 2004. Regional Water Plan
State Water Resources Control Board; Regional Water Quality Control Boards. 2008. Strategic Plan Update 2008-2012. Adopted by the State Water Resources Control Board Sep 2, 2008. Available at: http://www.swrcb.ca.gov/water_issues/hot_topics/strategic_plan/2007update.shtml
Flood Management
California Department of Water Resources. 1965. California Flood Control Program 1965. (Bulletin 159-65) 162p.
California Department of Water Resources. 1966. California High Water 1964-1965. (Bulletin 69-65) 135p.
California Department of Water Resources. 1970. California High Water 1968-1969. (Bulletin 69-69) 93p.
California Department of Water Resources. 1978. Water Conditions and Flood Events. (Bulletin 202-77) 74p.
California Department of Water Resources. 1980. California Flood Management: An Evaluation of Flood Damage Prevention Programs. (Bulletin 199) Sep. 277p.
California Department of Water Resources. 2003. California High Water. (Bulletin 69-95) 193p.
California Department of Water Resources. Division of Flood Management. 2007. Directory of Flood Control Officials. Oct.
Federal Emergency Management Agency. 2006. Floodplain Mapping and Map Modernization. Presented by Ray Lenaburg. FEMA Region IX.
C a l i f o r n i a w a t e r p l a n | u p d a t e 2 0 0 9
Colorado r iver Hydrologic region. appendix B - S elec ted references
C R B - 3
Imperial County. 2007. Imperial County Flood Management Plan. Draft. 93p.
US Army Corps of Engineers. 1995. Water Resources Development in California. San Francisco: South Pacific Division. 138p.
US Army Corps of Engineers; Kevin Knuuti. 2001. Planning for Sea Level Rise. (US Army Corps of Engineers Policy).
US Geological Survey. 2001. Water Resources Data—California, Water Year 2000. Vol 3. May.
US Geological Survey. 2005. Water Resources Data—California, Water Year 2004. Vol 1. 550p.
Relationships with Other Regions
Imperial Irrigation District. QSA/Water Transfer. [Internet]. 2006. Available at: http://www.iid.com/Water_Index.php?pid=61
Salton Sea Ecosystem Restoration Program. [Internet]. Available at: http://www.saltonsea.water.ca.gov/
Accomplishments
Coachella Valley Water District. 2002. Coachella Valley Final Water Management Plan. Sep.
Coachella Valley Water District. 2005. Urban Water Management Plan. Dec.
Coachella Valley Water District. 2007. New landscape rules designed to conserve water. [Internet]. Aug 28. Available at: http://www.cvwd.org/news/press21.php
Colorado River Citizens’ Forum Imperial. 2007. California August 20, 2007 Tentative Meeting Minutes. [Internet]. Available at: http:www.ibwc.state.gov/Files/CF_CR_20Aug07_Minutes.pdf
Desert Water Agency. 2005. Urban Water Management Plan. Dec.
Holt, Greg (staff writer). 2006 (Nov 29). New River: Plant offers hope for waterway. Imperial Valley Press.
Imperial Irrigation District. 2007. Draft IID 2007 Agricultural Water Management Plan
Imperial Irrigation District. 2007. Efficiency Conservation Definite Plan. Final Report. May.
Imperial Irrigation District. 2008. Imperial Irrigation District Fallowing Program Status Report. PowerPoint presentation. Feb 19.
Imperial Irrigation District. Safe Drinking Water Act. [Internet]. 2006. Available at: http://www.iid.com/Water_Index.php?pid=603%20&
Challenges
Imperial Irrigation District. 2007. Draft IID 2007 Agricultural Water Management Plan
New River Wetlands Project. [Internet]. Available at: http://www.newriverwetlands.com/

C a l i f o r n i a w a t e r p l a n | u p d a t e 2 0 0 9
Volume 3 - Regional Repor ts
C R B - 4
**Insert holder for CD inside of back cover**
California Water Plan Update 2009 I n t e g ra t e d Wa t e r M a n a g e m e n t
Northern Region Office The Division of Integrated Regional Water Management assists public and private agencies and the general public with water issues throughout the state. Four regional offices are located throughout California to maintain close contact with local interests to facilitate communication and to work on water-related matters. The offices are:
Northern Region in Red Bluff, • North Central Region in West Sacramento, • South Central Region in Fresno, and • Southern Region in Glendale.•
Each of the regional offices offers technical guidance and assistance in water resource engineering, project management, hydrology, groundwater, water quality, environmental analysis and restoration, surveying, mapping, water conservation, and other related areas within the boundaries of their offices. Because of the regional offices’ close ties with local interests, DWR regional coordinators in each office facilitate overall communication between DWR divisions and local partners to ensure coordinated efforts throughout all DWR programs and projects.
For more information on DWR and DWR projects, please contact the Regional Coordinators at: [email protected]
Northern Region Office address: 2440 Main StreetRed Bluff, CA 96080Northern Region Office phone number: (530) 529-7300Department of Water Resources’ website:http://www.water.ca.gov/
NORTHLAHONTAN
SOUTHLAHONTANTULARE
LAKE
S A N J O A Q U I NR I V E R
S A NF R A N C I S C O
B A Y
CENTRALCOAST
N O R T HC O A S T
SACRAMENTORIVER
COLORADORIVER
SOUTH COAST
NorthernRegion
North CentralRegion
South CentralRegion
SouthernRegion
ModocSiskiyou
Glenn
Lake
Sonoma
DelNorte
Humboldt
Trinity
Mendocino
The California Water Plan provides a framework for resource managers, legislators, Tribes, other decision-makers, and the public to consider options and make decisions regarding California’s water future. Our goal is that this document meet Water Code requirements, receive broad support among those participating in California’s water planning, and be a useful document. With its partners, DWR completed the final Update 2009 volumes and Highlights in December 2009.
The first four volumes of the update and the Highlights booklet are contained on the CD attached below. All five volumes of the update and related materials are also available online at www.waterplan.water.ca.gov.
Volume 1: The Strategic Plan Volume 2: Resource Management Strategies Volume 3: Regional ReportsVolume 4: Reference GuideVolume 5: Technical Guide
For printed copies of the Highlights, Volume 1, 2, or 3, call 1-916-653-1097. If you need this publication in alternate form, contact the Public Affairs Office at 1-800-272-8869.
Cover Photos:1. 2. 3. 6. Rugged North Coast 4. North Coast fishing village5. Redwood grove
1
4
2
5
3
6
VolumeRegional Reports3
California Water PlanUpdate 2009
B u l l e t i n 1 6 0 - 0 9 • D e p a r t m e n t o f W a t e r R e s o u r c e s
North Coast
I N T E G R A T E D W A T E R M A N A G E M E N T
Arnold SchwarzeneggerGovernor
State of California
Lester A. SnowSecretary for Natural ResourcesThe Natural Resources Agency
Mark W. CowinDirector
Department of Water Resources
DEPA
RTMENT OF WATER RESOURCES
STATE OF CALIFORNIA