Embed Size (px)
Citation preview
Water Management Pollution Policy in
Indonesia
Aksa TejalaksanaSub Head Section of ClearinghouseAssistance Deputy for Environmental Information & DataThe State Ministry of Environment
The amount of water necessary to fulfil the needs of the people will increase in quantity
causing an imbalance in the ecosystem because
the amount of water needed is larger compared to the amount of water provided

Quantity ……
The decrease in water availability in Indonesia is caused by the increase for the
ti d ti itimentioned activities;– agriculture,– domestic– Industry
And also because of the continuing degradation in water catchments and containment areas in several provinces.
Quality…
Meanwhile the decrease in water quality are commonly caused by over pollution from; • industrial activities • house holds • farms
The uncontrolled urbanization adds the problem of the ever deteriorating water
quality in city-state areas.
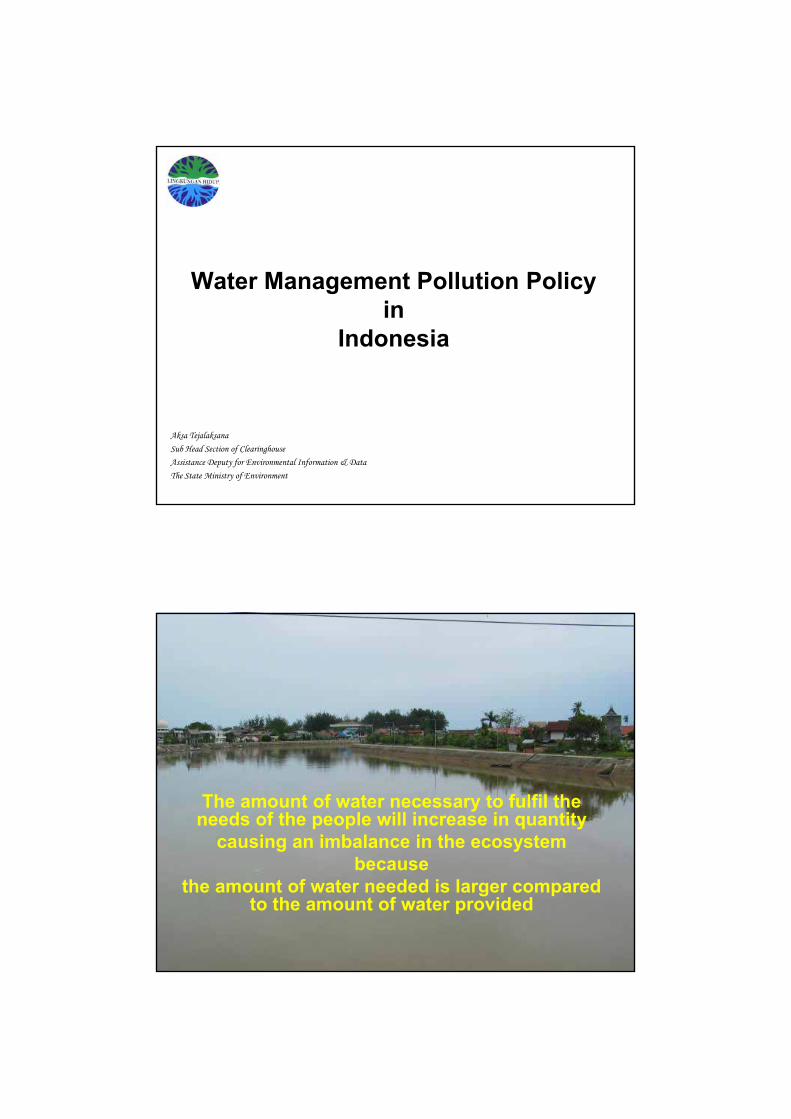
Deforestation 1994 - 1999
3 billion Km23 million Km2886 million Km2
1,2 million Km2
679 Thousand Km2
During 1994-1999 the decrease of forest level has reached 6 million km2
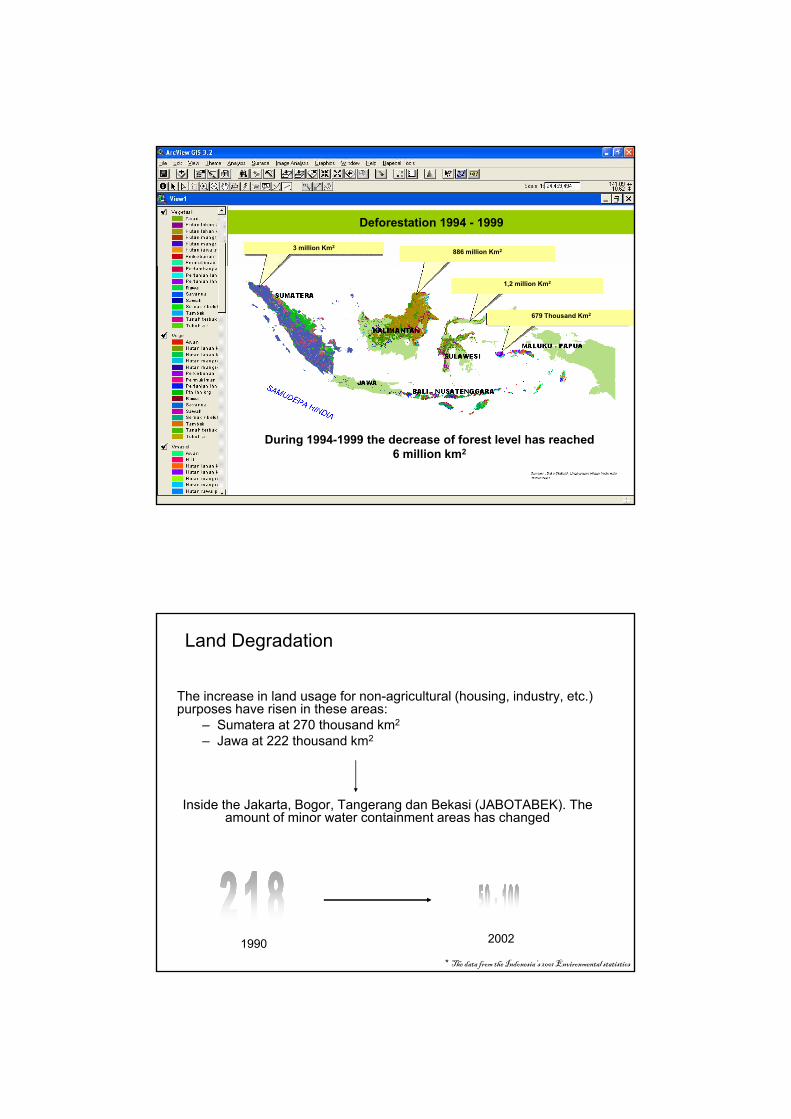
The increase in land usage for non-agricultural (housing, industry, etc.) purposes have risen in these areas:
– Sumatera at 270 thousand km2
Land Degradation
– Jawa at 222 thousand km2
Inside the Jakarta, Bogor, Tangerang dan Bekasi (JABOTABEK). The amount of minor water containment areas has changed
* The data from the Indonesia’s 2001 Environmental statistics
1990 2002
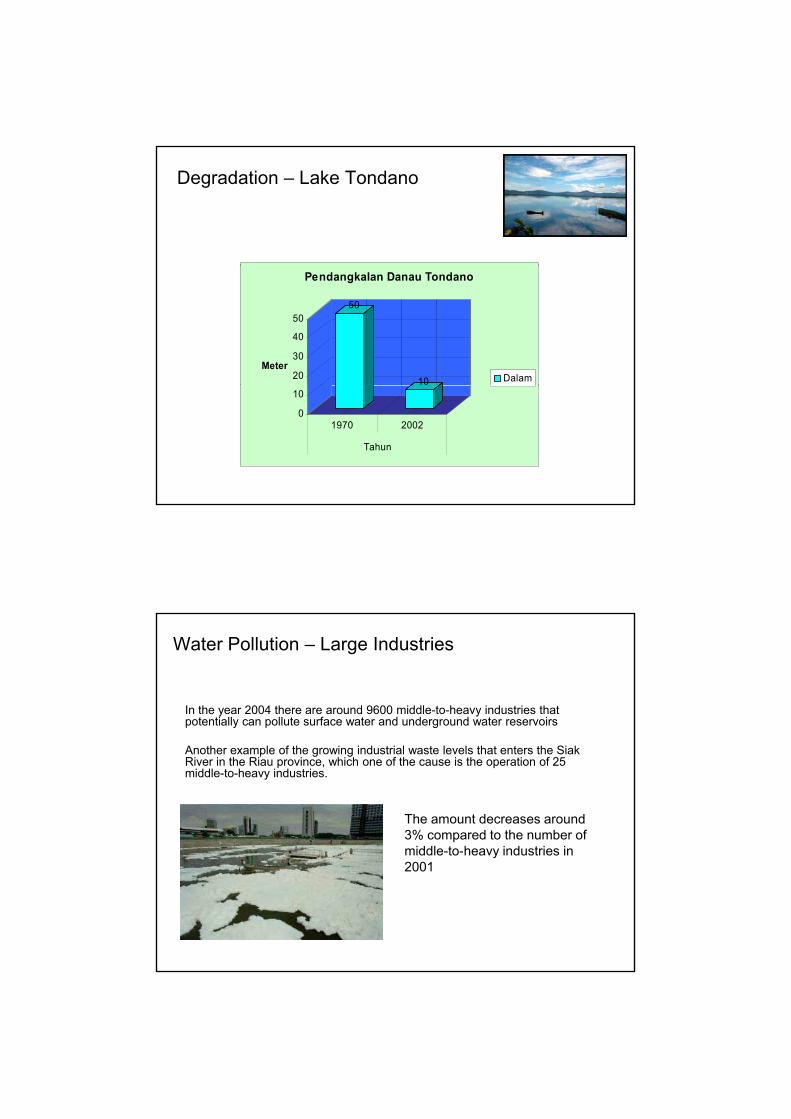
Degradation – Lake Tondano
50
1020
30
40
50
Meter
Pendangkalan Danau Tondano
Dalam
0
10
1970 2002
Tahun
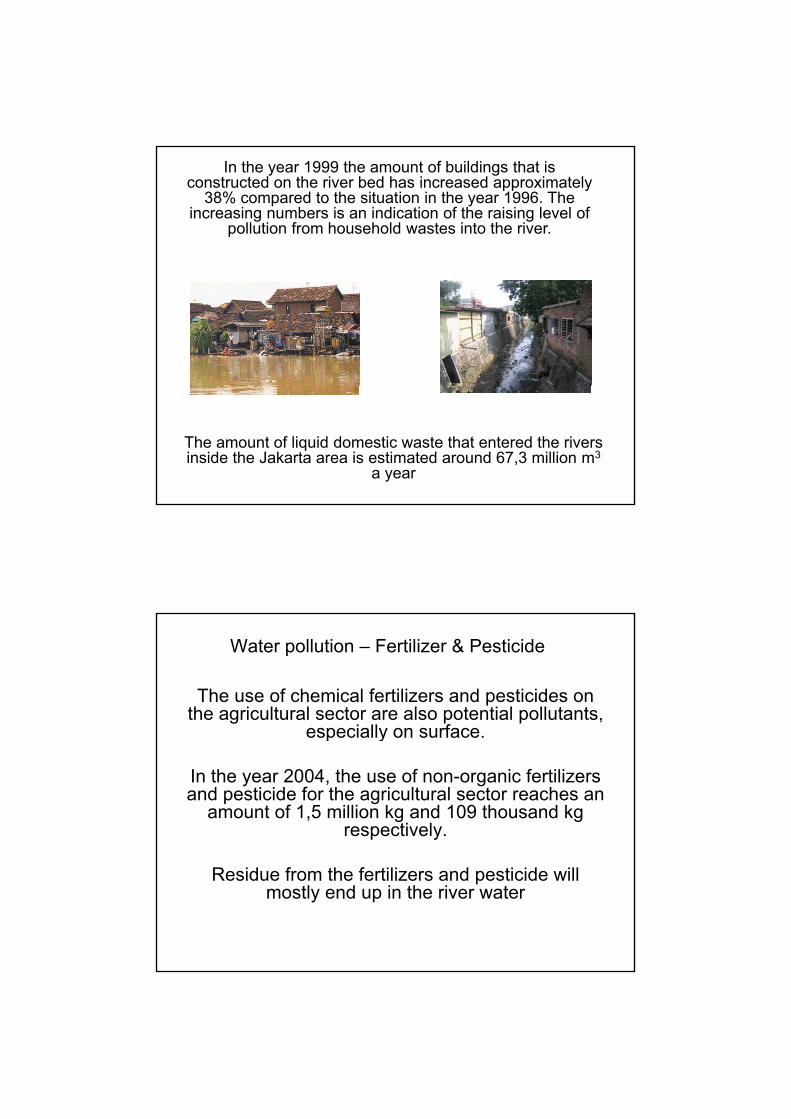
Water Pollution – Large Industries
In the year 2004 there are around 9600 middle-to-heavy industries that potentially can pollute surface water and underground water reservoirs
Another example of the growing industrial waste levels that enters the Siak River in the Riau province, which one of the cause is the operation of 25 middle-to-heavy industries.
. The amount decreases around 3% compared to the number of middle-to-heavy industries inmiddle-to-heavy industries in 2001

Water Pollution – Small Industries
Small-scale industries also contribute to the pollution inside the rivers water putting in mind the weakness in its capital and spread it’s a
The amount of small-scale industries with the potential to pollute surface water and underground water reservoirs.
water, putting in mind the weakness in its capital and spread, it s a small chance for them to be equipped with a waste water treatment
2001 2004
14 %
Water Pollution – Household Waste
• In metropolitan cities like Jakarta, Surabaya and Medan, the decrease in the river water quality is also affected by the liquid waste from households. According to the 2004 census data from BPS nationally there arecensus data from BPS, nationally there are still 22% of households that does not poses proper toileting, which in turn can potentially pollute public waters, 59% is located on Java Island alone
• The pollution of Jakarta’s underground water reservoirs are mainly caused by the Coliformand Fecal Coli bacteria. The condition is most likely because around 55% of the household in Jakarta possesses an underground water reservoir whose distance to the nearest waste disposal unit have a distance of less then 10 m
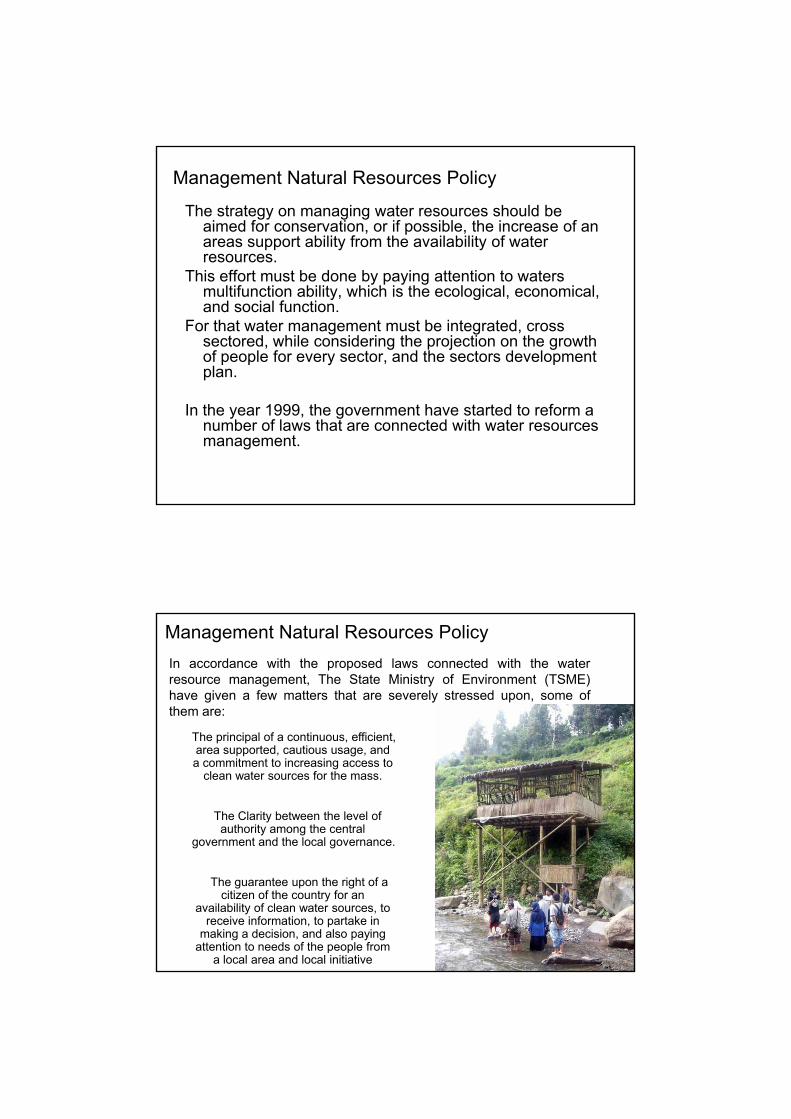
In the year 1999 the amount of buildings that is constructed on the river bed has increased approximately
38% compared to the situation in the year 1996. The increasing numbers is an indication of the raising level of
pollution from household wastes into the river.
The amount of liquid domestic waste that entered the rivers inside the Jakarta area is estimated around 67,3 million m3
a year
Water pollution – Fertilizer & Pesticide
The use of chemical fertilizers and pesticides on the agricultural sector are also potential pollutants,
especially on surfaceespecially on surface.
In the year 2004, the use of non-organic fertilizers and pesticide for the agricultural sector reaches an
amount of 1,5 million kg and 109 thousand kg respectively.
Residue from the fertilizers and pesticide will mostly end up in the river water
Management Natural Resources Policy
The strategy on managing water resources should be aimed for conservation, or if possible, the increase of an areas support ability from the availability of water resources.
This effort must be done by paying attention to waters multifunction ability, which is the ecological, economical, and social function.
For that water management must be integrated, cross sectored, while considering the projection on the growth of people for every sector, and the sectors development plan.
In the year 1999, the government have started to reform a number of laws that are connected with water resources management.
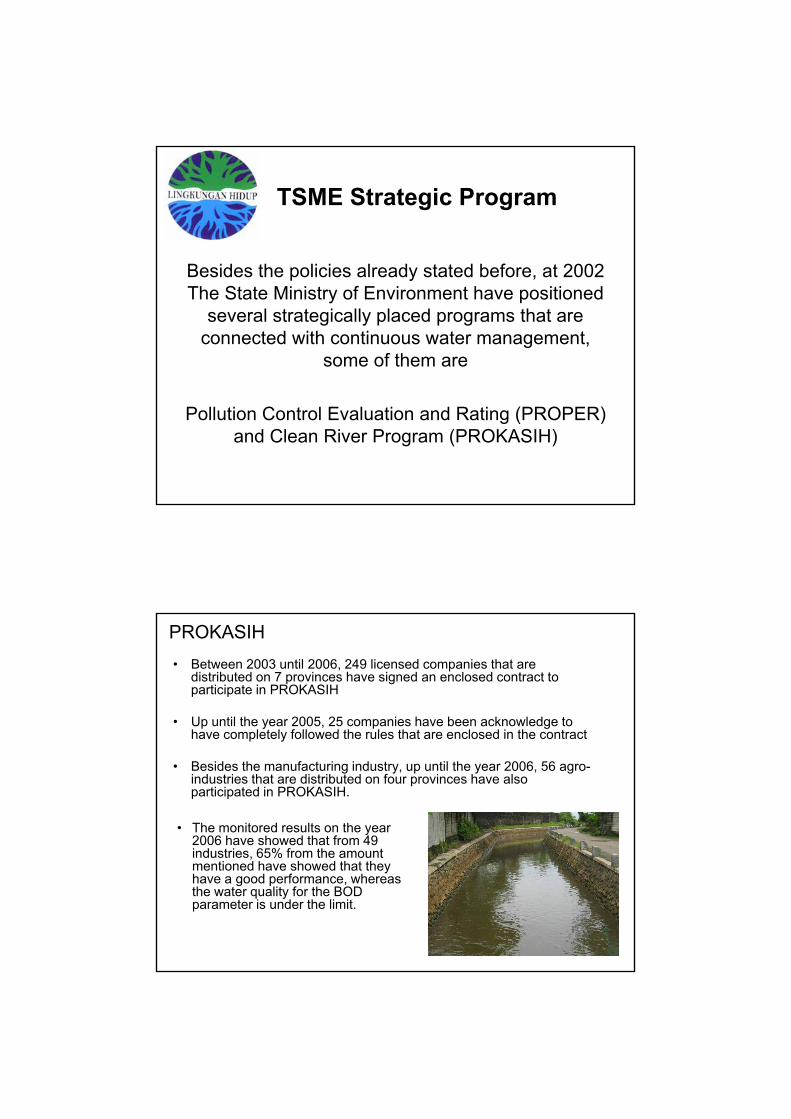
Management Natural Resources PolicyIn accordance with the proposed laws connected with the waterresource management, The State Ministry of Environment (TSME)have given a few matters that are severely stressed upon, some ofthem are:
f ffThe principal of a continuous, efficient, area supported, cautious usage, and a commitment to increasing access to
clean water sources for the mass.
The Clarity between the level of authority among the central
government and the local governance.
The guarantee upon the right of a citizen of the country for an
availability of clean water sources, to receive information, to partake in
making a decision, and also paying attention to needs of the people from
a local area and local initiative
TSME Strategic Program
B id th li i l d t t d b f t 2002Besides the policies already stated before, at 2002 The State Ministry of Environment have positioned
several strategically placed programs that are connected with continuous water management,
some of them are
Pollution Control Evaluation and Rating (PROPER) and Clean River Program (PROKASIH)
PROKASIH• Between 2003 until 2006, 249 licensed companies that are
distributed on 7 provinces have signed an enclosed contract to participate in PROKASIH
• Up until the year 2005, 25 companies have been acknowledge to have completely followed the rules that are enclosed in the contracthave completely followed the rules that are enclosed in the contract
• Besides the manufacturing industry, up until the year 2006, 56 agro-industries that are distributed on four provinces have also participated in PROKASIH.
• The monitored results on the year 2006 have showed that from 49 industries 65% from the amountindustries, 65% from the amount mentioned have showed that they have a good performance, whereas the water quality for the BOD parameter is under the limit.

PROPERThat basic principle of PROPER is to push a company’s
organization in managing the ecosystem, through a reputation based incentivereputation based incentive,
for companies that possesses a good performance on ecosystem management will also get a good reputation,
for companies with a less then satisfactory performance on ecosystem management will also gain reputation,
though it will not be a good reputation.
Level Catagorize
Technical Environmental Public RatingRatingEnvironmental
Monitoring Data Informationgg
Color systemColor system
COLORCOLOR CRITERIACRITERIAGOLD Display the best environmental excellences among similiar industries.
GREEN Effective environmental management implement energy efficiency pollutionGREEN Effective environmental management, implement energy efficiency, pollution prevention, resources conservations program and community development.
BLUE Comply with regulation
RED Makes some effort to control pollution, but it is not sufficient to achieve compliance.
BLACK Makes no effort to control pollution, or causes serious environmental damage
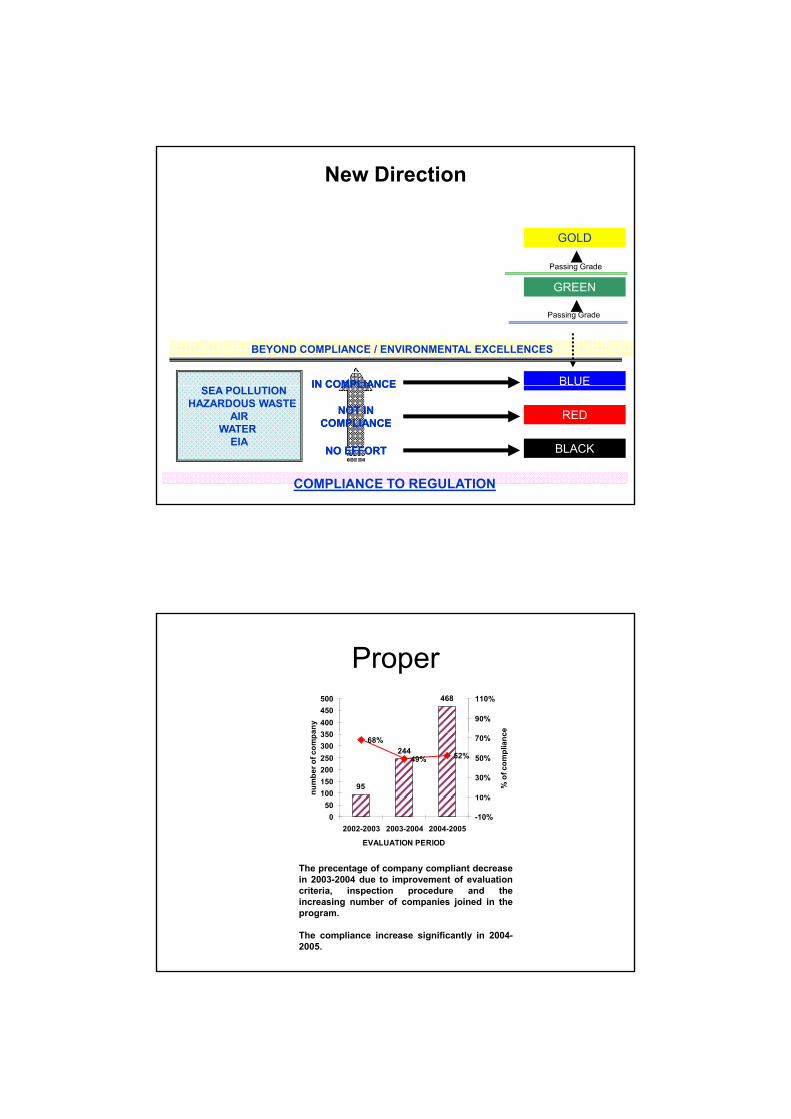
New Direction
GOLD
Passing Grade
BEYOND COMPLIANCE / ENVIRONMENTAL EXCELLENCES
BLUEIN COMPLIANCEIN COMPLIANCE
GREEN
Passing Grade
Passing Grade
COMPLIANCE TO REGULATION
RED
BLACK
SEA POLLUTIONHAZARDOUS WASTE
AIRWATER
EIANO EFFORT NO EFFORT
NOT IN NOT IN COMPLIANCECOMPLIANCE
IN COMPLIANCEIN COMPLIANCE
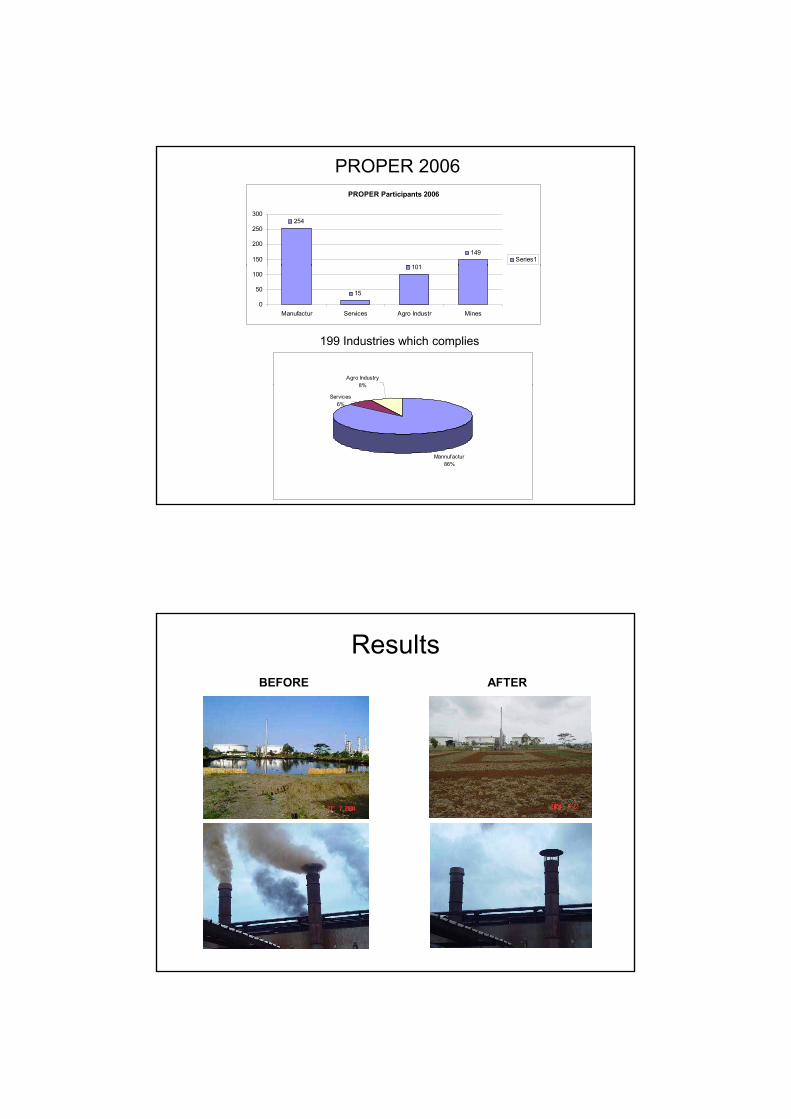
Proper468
350400450500
any 90%
110%
e
95
24468%
49% 52%
050
100150200250300350
2002-2003 2003-2004 2004-2005
EVALUATION PERIOD
num
ber o
f com
pa
-10%
10%
30%
50%
70%
% o
f com
plia
nc
The precentage of company compliant decreasein 2003-2004 due to improvement of evaluationcriteria, inspection procedure and theincreasing number of companies joined in theprogram.
The compliance increase significantly in 2004-2005.
PROPER 2006PROPER Participants 2006
254
101
149150
200
250
300
Series1
15
101
0
50
100
Manufactur Services Agro Industr Mines
Agro Industry8%
199 Industries which complies
Mannufactur86%
Services6%
8%
BEFORE AFTER
Results

Problems
Because the participation of PROPER is voluntaryBecause the participation of PROPER is voluntary in nature, the amount of companies which follows
the program is relatively not significant enough compared to the amount of companies with the
potential to ruin the ecosystem
Keys to Success
• The execution of a strategic program like PROPER & PROKASIH will not achieve the desired results without any sort of serious reprimand and law enforcements
• All programs and can be effectively implemented especially if the community understands the necessity and participated actively.