Embed Size (px)
Citation preview

water
Article
Water Level Loggers as a Low-Cost Tool forMonitoring of Stormwater Control MeasuresLaura Toran
Department of Earth and Environmental Science, Temple University, Philadelphia, PA 19122, USA;[email protected]; Tel.: +1-215-204-2352
Academic Editor: Joan M. BrehmReceived: 26 May 2016; Accepted: 10 August 2016; Published: 15 August 2016
Abstract: Stormwater control measures (SCMs) are a key component of watershed health in urbanizedareas. SCMs are used to increase infiltration and reduce discharge to streams or storm sewer systemsduring rain events. Monitoring is important for the evaluation of design and causes of failure inSCMs. However, the expense of monitoring means it is not always included in stormwater controlplanning. This study shows how low-cost water level loggers can be used to answer certain questionsabout SCM performance. Five case studies are presented that use water level loggers to evaluate theoverflow of basins, compare a traditional stormpipe trench with an infiltration trench, monitor timingof blue roof storage, show the effects of retrofitting a basin, and provide long term performance data.Water level loggers can be used to answer questions about the timing and location of stormwateroverflows, which helps to evaluate the effectiveness of SCMs. More expensive monitoring andmodeling can be used as a follow up if needed to more thoroughly assess a site. Nonetheless, low-costmonitoring can be a first step in identifying sites that need improvement or additional monitoring.
Keywords: urban hydrology; stormwater control measures; monitoring; retention basin; infiltrationtrench; blue roof; infiltration chamber
1. Introduction
Controlling stormwater runoff is critical to watershed health. Increased infiltration can helpto reduce both the volume of water and contaminant loads that threaten streams due to increasedimpervious surface area [1]. As urban centers expand or renovate, sustainable design typicallydepends on including stormwater controls to infiltrate water more efficiently in less space than naturalsystems [2].
A variety of stormwater control measures (SCMs) are used to increase infiltration during rainevents and reduce discharge to streams or storm sewer systems [2,3]. Stormwater basins are one of themost common methods for capturing stormwater, and there are several different designs used [4–6].Some basins include a subsurface retention chamber with perforated piping and gravel to store water,while some use natural soil or fill. Some basins include wetland plants to help retain water and someare dry between storms, while many have mowed grass. These basins vary in size, depending onthe intended capture area; for example, a survey of 100 basins in the Valley Creek Watershed outsidePhiladelphia found sizes of 2.6 × 10⁻³ km2 to 11 km2 [7]. There is typically an inlet pipe and anoutlet pipe or multiple inlets to take water from paved areas to the basin and then delay release tourban drainages. In addition to capturing land surface drainage, SCMs are needed for roof drainage.Although roof drainage can be piped to stormwater basins, sometimes green or blue roofs are used toreduce stormwater discharge from buildings. Green roofs use plants to help store water on the roof.Design considerations include low-cost plant maintenance and roof stability. Blue roofs store water ona waterproof membrane without plants, using instead check valves to slow the rate of discharge on theroof top [8]. Flat roofs with good stability are required. When space is more limited, smaller stormwater
Water 2016, 8, 346; doi:10.3390/w8080346 www.mdpi.com/journal/water

Water 2016, 8, 346 2 of 10
trenches are used instead [5,9]. These are designed with storage pipes surrounded by gravel, an inletand outlet, but are smaller in size—typically a meter or two wide and 2–10 m long. Trenches can beused between buildings, along roadways, and in parking lot berms.
Although use of SCMs has increased since the 1990’s, when stormwater control ordinancesbecame more common, monitoring their effectiveness is not typically part of the design [2,10,11]. It isunfortunate that such monitoring is not standard, because stormwater control measures can fail for avariety of reasons. The systems can release water too rapidly due to design malfunction [12], fail toinfiltrate due to clogging or reduced infiltration over time [7,9], and allow the release of chemicals ofconcern [13,14]. If these failures could be prevented by repair or improved designs, then the dollarsspent on stormwater control would be more effective.
Monitoring is important for the evaluation of design problems and causes for failure in SCMs.Instrumentation is added to SCMs to evaluate the capacity for storing stormwater and to monitorinflows and outflows to calculate a water budget [15–17]. Rain gauges are needed to characterizestorms at the site scale. Flowmeters, water level loggers, and soil moisture sensors are typically usedto track water flow [11]. Instrumentation may need to be built into the initial design if weirs to focusoutflow are needed or if sensors to measure soil moisture or water levels need to be buried within theSCM [9,15,17]. Long-term monitoring is conducted to evaluate potential clogging infiltration basins—acommon problem [9,12,14]. In some cases, stream monitoring is implemented to evaluate the impactof SCM on catchments [18,19]. Both models and runoff capture calculations require careful assessmentof land use and design specifications. However, monitoring tends not to be included because ofthe additional cost. Costs include changes in construction to include monitoring and additional sitecharacterization, such as soil properties [9,15]. Often, multiple outlets and inlets or multiple structuresin a treatment train [11,15,16] need to be monitored, which adds to the cost. Although models canbe used to assess catchment hydrology, stream gauging stations are needed to calibrate the models.If gauging stations are not already in place, the cost to install is beyond the budget for a single project.Among the most expensive components of SCM monitoring is water quality assessment. A widevariety of chemicals may need to be analyzed [11], which can be expensive, and sample collectionrequires either automatic samplers or labor-intensive monitoring. Water quality monitoring typicallydepends on concurrent flow monitoring to assess loads.
Some stormwater control issues related to physical performance (rather than water quality) canbe addressed by low-cost monitoring techniques. Although low-cost monitoring does not provideas much quantitative information about performance, it can be an initial screening tool, and moreprojects can be monitored. When necessary, follow-up using higher-cost, more detailed monitoringcan be conducted. This paper reviews the types of projects and questions that lend themselves tolow-cost monitoring.
2. Materials and Methods
Monitoring was conducted with water level loggers to answer questions about the effectivenessof various SCMs. Onset HOBO pressure transducers (4 m range, 0.3 cm accuracy) were used tomeasure water level. One to three water level loggers were installed, and data were collected at 15 minintervals. Water level loggers were installed in pairs to evaluate the timing and size of storm responses.An additional barometric logger was also needed to correct water level data for changes in barometricpressure. Rain data were obtained from nearby weather stations that report online or a rain gauge wasinstalled on site. A monitoring system that included three loggers, software, computer connectors, anda rain gauge cost only $1,750 using the Onset HOBO water level logger ($300 each) and rain gauge($420 each). Nearby sites could share rain gauges and barometric loggers. The water level loggersalso include a temperature sensor, which sometimes provided additional information on stormflow.Labor costs were not included in the monitoring budget, and they can be highly variable depending onthe number of sites, location, and frequency and duration of downloading data. However, relativelylittle training is needed to download and process the data (undergraduate students performed thefield work in most of the projects described here.)
Water 2016, 8, 346 3 of 10
The five sites selected for this project were all in Philadelphia or its suburbs, in urban settingswhere stormwater impairs the local streams. In the city proper, stormwater creates combined seweroutfall overflows, and the city is implementing a large green infrastructure implementation programto reduce overflows. In the suburbs, impervious surface cover leads to the majority of stream reachesbeing impaired. In the studies summarized here, three vegetated basins, one parking lot infiltrationtrench, one parking lot infiltration chamber, and one blue roof were monitored. Two SCMs were insidethe city and three sites with SCMs were outside the city. The specific locations of loggers, duration ofmonitoring, and questions addressed are described below for each case history. The site descriptionsdo not include a detailed diagram of capture areas or SCM design. One of the points of low-costmonitoring is not to include capture area analysis or design capacity calculations, but to insteaduse hydrographs to supplement anecdotal information about how stormwater is moving throughthe system.
3. Results
3.1. Comparison of Overflow in Two Stormwater Retention Basins
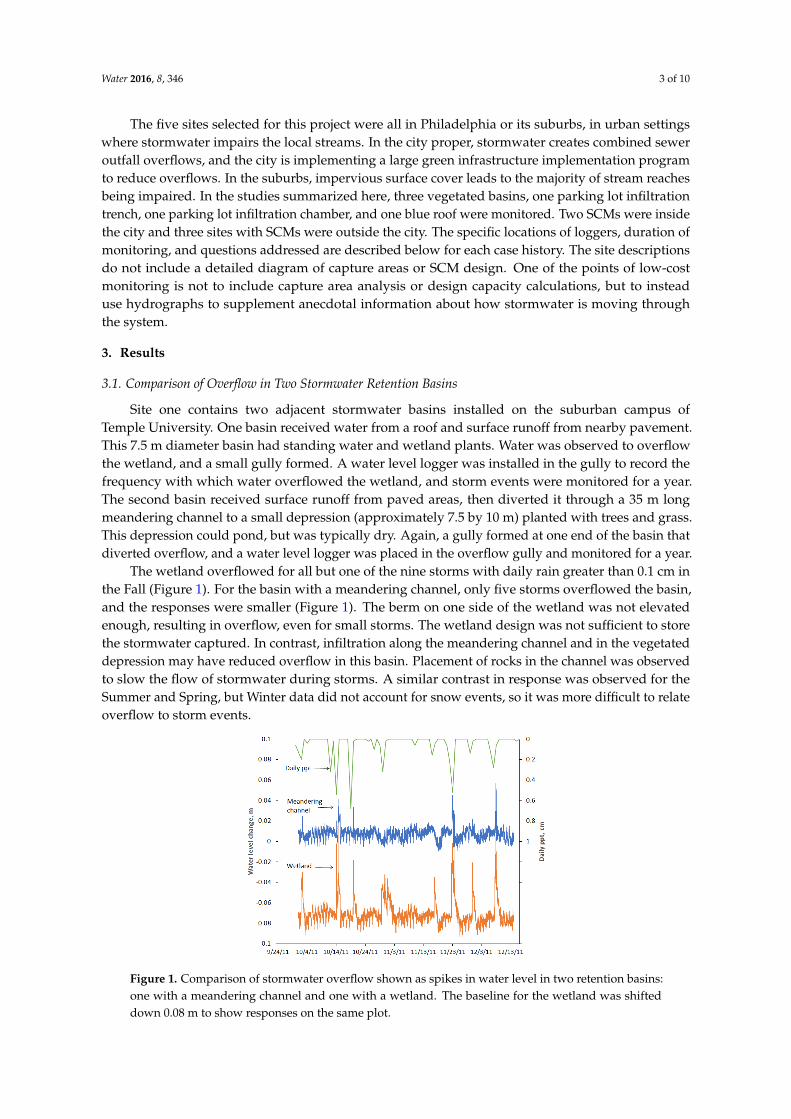
Site one contains two adjacent stormwater basins installed on the suburban campus ofTemple University. One basin received water from a roof and surface runoff from nearby pavement.This 7.5 m diameter basin had standing water and wetland plants. Water was observed to overflowthe wetland, and a small gully formed. A water level logger was installed in the gully to record thefrequency with which water overflowed the wetland, and storm events were monitored for a year.The second basin received surface runoff from paved areas, then diverted it through a 35 m longmeandering channel to a small depression (approximately 7.5 by 10 m) planted with trees and grass.This depression could pond, but was typically dry. Again, a gully formed at one end of the basin thatdiverted overflow, and a water level logger was placed in the overflow gully and monitored for a year.
The wetland overflowed for all but one of the nine storms with daily rain greater than 0.1 cm inthe Fall (Figure 1). For the basin with a meandering channel, only five storms overflowed the basin,and the responses were smaller (Figure 1). The berm on one side of the wetland was not elevatedenough, resulting in overflow, even for small storms. The wetland design was not sufficient to storethe stormwater captured. In contrast, infiltration along the meandering channel and in the vegetateddepression may have reduced overflow in this basin. Placement of rocks in the channel was observedto slow the flow of stormwater during storms. A similar contrast in response was observed for theSummer and Spring, but Winter data did not account for snow events, so it was more difficult to relateoverflow to storm events.
Water 2016, 8, 346 3 of 10
The five sites selected for this project were all in Philadelphia or its suburbs, in urban settings
where stormwater impairs the local streams. In the city proper, stormwater creates combined sewer
outfall overflows, and the city is implementing a large green infrastructure implementation program
to reduce overflows. In the suburbs, impervious surface cover leads to the majority of stream reaches
being impaired. In the studies summarized here, three vegetated basins, one parking lot infiltration
trench, one parking lot infiltration chamber, and one blue roof were monitored. Two SCMs were
inside the city and three sites with SCMs were outside the city. The specific locations of loggers,
duration of monitoring, and questions addressed are described below for each case history. The site
descriptions do not include a detailed diagram of capture areas or SCM design. One of the points of
low‐cost monitoring is not to include capture area analysis or design capacity calculations, but to
instead use hydrographs to supplement anecdotal information about how stormwater is moving
through the system.
3. Results
3.1. Comparison of Overflow in Two Stormwater Retention Basins
Site one contains two adjacent stormwater basins installed on the suburban campus of Temple
University. One basin received water from a roof and surface runoff from nearby pavement. This 7.5 m
diameter basin had standing water and wetland plants. Water was observed to overflow the wetland,
and a small gully formed. A water level logger was installed in the gully to record the frequency with
which water overflowed the wetland, and storm events were monitored for a year. The second basin
received surface runoff from paved areas, then diverted it through a 35 m long meandering channel
to a small depression (approximately 7.5 by 10 m) planted with trees and grass. This depression could
pond, but was typically dry. Again, a gully formed at one end of the basin that diverted overflow,
and a water level logger was placed in the overflow gully and monitored for a year.
The wetland overflowed for all but one of the nine storms with daily rain greater than 0.1 cm in
the Fall (Figure 1). For the basin with a meandering channel, only five storms overflowed the basin,
and the responses were smaller (Figure 1). The berm on one side of the wetland was not elevated
enough, resulting in overflow, even for small storms. The wetland design was not sufficient to store
the stormwater captured. In contrast, infiltration along the meandering channel and in the vegetated
depression may have reduced overflow in this basin. Placement of rocks in the channel was observed
to slow the flow of stormwater during storms. A similar contrast in response was observed for the
Summer and Spring, but Winter data did not account for snow events, so it was more difficult to
relate overflow to storm events.
Figure 1. Comparison of stormwater overflow shown as spikes in water level in two retention basins:
one with a meandering channel and one with a wetland. The baseline for the wetland was shifted
down 0.08 m to show responses on the same plot.
Figure 1. Comparison of stormwater overflow shown as spikes in water level in two retention basins:one with a meandering channel and one with a wetland. The baseline for the wetland was shifteddown 0.08 m to show responses on the same plot.
Water 2016, 8, 346 4 of 10
This example showed that low-cost monitoring could quantify how often overflow occurred inan observed gully. Monitoring also contrasted differences in design between two sites, which led toincreased basin overflow at a site with less infiltration.
3.2. Monitoring before and after Retrofit of a Basin
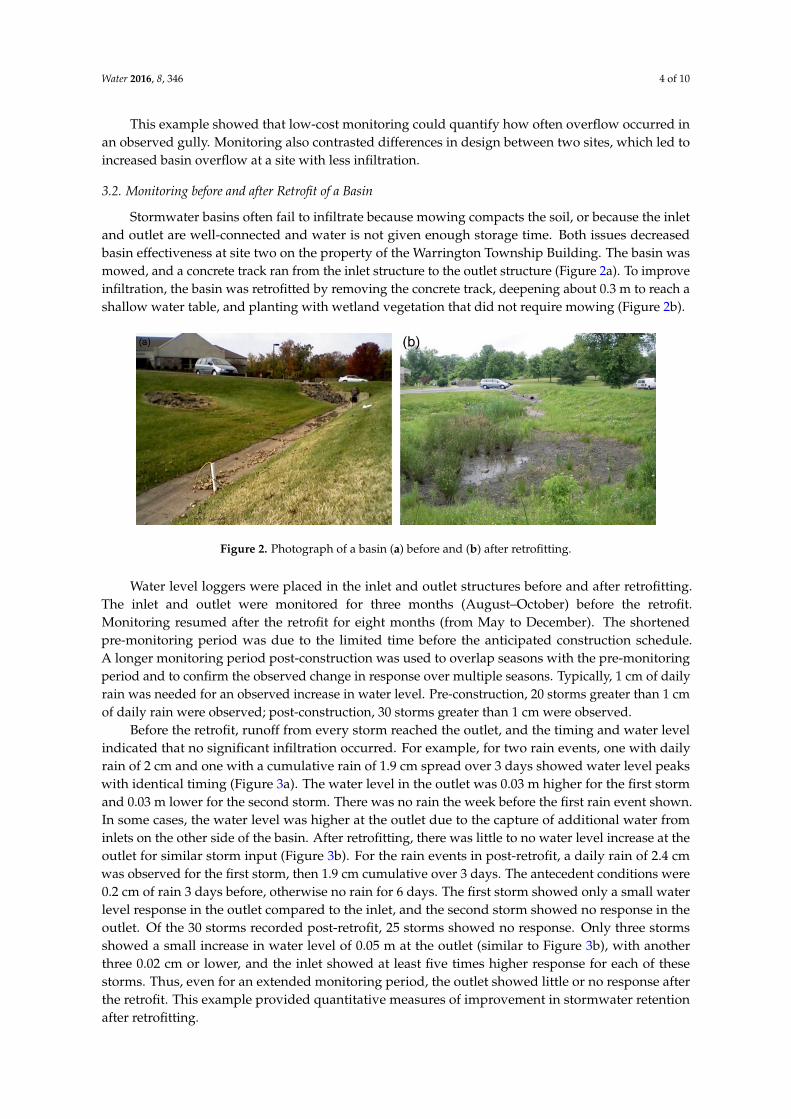
Stormwater basins often fail to infiltrate because mowing compacts the soil, or because the inletand outlet are well-connected and water is not given enough storage time. Both issues decreasedbasin effectiveness at site two on the property of the Warrington Township Building. The basin wasmowed, and a concrete track ran from the inlet structure to the outlet structure (Figure 2a). To improveinfiltration, the basin was retrofitted by removing the concrete track, deepening about 0.3 m to reach ashallow water table, and planting with wetland vegetation that did not require mowing (Figure 2b).
Water 2016, 8, 346 4 of 10
This example showed that low‐cost monitoring could quantify how often overflow occurred in
an observed gully. Monitoring also contrasted differences in design between two sites, which led to
increased basin overflow at a site with less infiltration.
3.2. Monitoring before and after Retrofit of a Basin
Stormwater basins often fail to infiltrate because mowing compacts the soil, or because the inlet
and outlet are well‐connected and water is not given enough storage time. Both issues decreased
basin effectiveness at site two on the property of the Warrington Township Building. The basin was
mowed, and a concrete track ran from the inlet structure to the outlet structure (Figure 2a). To
improve infiltration, the basin was retrofitted by removing the concrete track, deepening about 0.3 m
to reach a shallow water table, and planting with wetland vegetation that did not require mowing
(Figure 2b).
Figure 2. Photograph of a basin (a) before and (b) after retrofitting.
Water level loggers were placed in the inlet and outlet structures before and after retrofitting.
The inlet and outlet were monitored for three months (August–October) before the retrofit.
Monitoring resumed after the retrofit for eight months (from May to December). The shortened pre‐
monitoring period was due to the limited time before the anticipated construction schedule. A longer
monitoring period post‐construction was used to overlap seasons with the pre‐monitoring period
and to confirm the observed change in response over multiple seasons. Typically, 1 cm of daily rain
was needed for an observed increase in water level. Pre‐construction, 20 storms greater than 1 cm of
daily rain were observed; post‐construction, 30 storms greater than 1 cm were observed.
Before the retrofit, runoff from every storm reached the outlet, and the timing and water level
indicated that no significant infiltration occurred. For example, for two rain events, one with daily
rain of 2 cm and one with a cumulative rain of 1.9 cm spread over 3 days showed water level peaks
with identical timing (Figure 3a). The water level in the outlet was 0.03 m higher for the first storm
and 0.03 m lower for the second storm. There was no rain the week before the first rain event shown.
In some cases, the water level was higher at the outlet due to the capture of additional water from
inlets on the other side of the basin. After retrofitting, there was little to no water level increase at the
outlet for similar storm input (Figure 3b). For the rain events in post‐retrofit, a daily rain of 2.4 cm
was observed for the first storm, then 1.9 cm cumulative over 3 days. The antecedent conditions were
0.2 cm of rain 3 days before, otherwise no rain for 6 days. The first storm showed only a small water
level response in the outlet compared to the inlet, and the second storm showed no response in the
outlet. Of the 30 storms recorded post‐retrofit, 25 storms showed no response. Only three storms
showed a small increase in water level of 0.05 m at the outlet (similar to Figure 3b), with another three
0.02 cm or lower, and the inlet showed at least five times higher response for each of these storms.
Thus, even for an extended monitoring period, the outlet showed little or no response after the
retrofit. This example provided quantitative measures of improvement in stormwater retention after
retrofitting.
Figure 2. Photograph of a basin (a) before and (b) after retrofitting.
Water level loggers were placed in the inlet and outlet structures before and after retrofitting.The inlet and outlet were monitored for three months (August–October) before the retrofit.Monitoring resumed after the retrofit for eight months (from May to December). The shortenedpre-monitoring period was due to the limited time before the anticipated construction schedule.A longer monitoring period post-construction was used to overlap seasons with the pre-monitoringperiod and to confirm the observed change in response over multiple seasons. Typically, 1 cm of dailyrain was needed for an observed increase in water level. Pre-construction, 20 storms greater than 1 cmof daily rain were observed; post-construction, 30 storms greater than 1 cm were observed.
Before the retrofit, runoff from every storm reached the outlet, and the timing and water levelindicated that no significant infiltration occurred. For example, for two rain events, one with dailyrain of 2 cm and one with a cumulative rain of 1.9 cm spread over 3 days showed water level peakswith identical timing (Figure 3a). The water level in the outlet was 0.03 m higher for the first stormand 0.03 m lower for the second storm. There was no rain the week before the first rain event shown.In some cases, the water level was higher at the outlet due to the capture of additional water frominlets on the other side of the basin. After retrofitting, there was little to no water level increase at theoutlet for similar storm input (Figure 3b). For the rain events in post-retrofit, a daily rain of 2.4 cmwas observed for the first storm, then 1.9 cm cumulative over 3 days. The antecedent conditions were0.2 cm of rain 3 days before, otherwise no rain for 6 days. The first storm showed only a small waterlevel response in the outlet compared to the inlet, and the second storm showed no response in theoutlet. Of the 30 storms recorded post-retrofit, 25 storms showed no response. Only three stormsshowed a small increase in water level of 0.05 m at the outlet (similar to Figure 3b), with anotherthree 0.02 cm or lower, and the inlet showed at least five times higher response for each of thesestorms. Thus, even for an extended monitoring period, the outlet showed little or no response afterthe retrofit. This example provided quantitative measures of improvement in stormwater retentionafter retrofitting.

Water 2016, 8, 346 5 of 10
Water 2016, 8, 346 5 of 10
Figure 3. Water level response to storm events (a) before and (b) after retrofitting.
3.3. Blue Roof for Stormwater Storage Control
Site three is located at Paseo Verde, an apartment complex next to the Temple University
campus, which is the first platinum Leadership in Energy and Environmental Design (LEED)‐
certified neighborhood development project in the U.S. One aspect of the LEED certification is a
combination of green and blue roofs to provide stormwater control and energy insulation. The roof
has a series of “bars” or corridors that alternate between blue and green roofs. Low‐cost monitoring
included water level loggers on two of the blue roofs. An additional logger was placed in the concrete
manhole accessing the pipes leading from the roof bar to the street. A nearby rain gauge 500 m away
was used to monitor the rain events.
Low‐cost monitoring with water level loggers was used to evaluate the size of a rain event that
creates a response on the roof, the length of time water was stored on the roof, and how often the
street level pipes receive water compared to the roof. Only 5 mm of rain (per 15 min interval)
produced a measureable response on the roof (Figure 4). This response was consistent across seasons
for a year of monitoring and consistent between the two blue roofs monitored. For small storms (an
hour or less) there was no storage, and the roofs immediately drained after the storm event ended.
For longer storms lasting 6 to 12 h, the roofs stored water while the storm intensity declined, then
drained about an hour after the end of the precipitation event. Snow depth was not recorded and not
accounted for as storage. Longer storage was observed in the manhole going to the street (Figure 4).
The outflow pipe in the manhole constricted flow, leading to slower drainage. A water level increase
was recorded for every storm, both on the roof and in the street manhole. While the low‐cost
monitoring does not provide a water balance to indicate how much of the precipitation reached the
storm pipe at the street, the close timing of the roof and street response suggests water flows rapidly
from the roof with little opportunity for evaporation. One way to increase the travel time would be
to decrease the size of the roof outlets, but care must be taken not to allow the water level to exceed
the roof capacity.
Figure 4. Water level responses on two blue roofs (Bar 1 and Bar 3) and a street manhole. The street
manhole water level is divided by five to show on the same plot as the roof loggers.
Figure 3. Water level response to storm events (a) before and (b) after retrofitting.
3.3. Blue Roof for Stormwater Storage Control
Site three is located at Paseo Verde, an apartment complex next to the Temple Universitycampus, which is the first platinum Leadership in Energy and Environmental Design (LEED)-certifiedneighborhood development project in the U.S. One aspect of the LEED certification is a combinationof green and blue roofs to provide stormwater control and energy insulation. The roof has a seriesof “bars” or corridors that alternate between blue and green roofs. Low-cost monitoring includedwater level loggers on two of the blue roofs. An additional logger was placed in the concrete manholeaccessing the pipes leading from the roof bar to the street. A nearby rain gauge 500 m away was usedto monitor the rain events.
Low-cost monitoring with water level loggers was used to evaluate the size of a rain event thatcreates a response on the roof, the length of time water was stored on the roof, and how often the streetlevel pipes receive water compared to the roof. Only 5 mm of rain (per 15 min interval) produced ameasureable response on the roof (Figure 4). This response was consistent across seasons for a year ofmonitoring and consistent between the two blue roofs monitored. For small storms (an hour or less)there was no storage, and the roofs immediately drained after the storm event ended. For longerstorms lasting 6 to 12 h, the roofs stored water while the storm intensity declined, then drained aboutan hour after the end of the precipitation event. Snow depth was not recorded and not accounted foras storage. Longer storage was observed in the manhole going to the street (Figure 4). The outflowpipe in the manhole constricted flow, leading to slower drainage. A water level increase was recordedfor every storm, both on the roof and in the street manhole. While the low-cost monitoring does notprovide a water balance to indicate how much of the precipitation reached the storm pipe at the street,the close timing of the roof and street response suggests water flows rapidly from the roof with littleopportunity for evaporation. One way to increase the travel time would be to decrease the size of theroof outlets, but care must be taken not to allow the water level to exceed the roof capacity.
Water 2016, 8, 346 5 of 10
Figure 3. Water level response to storm events (a) before and (b) after retrofitting.
3.3. Blue Roof for Stormwater Storage Control
Site three is located at Paseo Verde, an apartment complex next to the Temple University
campus, which is the first platinum Leadership in Energy and Environmental Design (LEED)‐
certified neighborhood development project in the U.S. One aspect of the LEED certification is a
combination of green and blue roofs to provide stormwater control and energy insulation. The roof
has a series of “bars” or corridors that alternate between blue and green roofs. Low‐cost monitoring
included water level loggers on two of the blue roofs. An additional logger was placed in the concrete
manhole accessing the pipes leading from the roof bar to the street. A nearby rain gauge 500 m away
was used to monitor the rain events.
Low‐cost monitoring with water level loggers was used to evaluate the size of a rain event that
creates a response on the roof, the length of time water was stored on the roof, and how often the
street level pipes receive water compared to the roof. Only 5 mm of rain (per 15 min interval)
produced a measureable response on the roof (Figure 4). This response was consistent across seasons
for a year of monitoring and consistent between the two blue roofs monitored. For small storms (an
hour or less) there was no storage, and the roofs immediately drained after the storm event ended.
For longer storms lasting 6 to 12 h, the roofs stored water while the storm intensity declined, then
drained about an hour after the end of the precipitation event. Snow depth was not recorded and not
accounted for as storage. Longer storage was observed in the manhole going to the street (Figure 4).
The outflow pipe in the manhole constricted flow, leading to slower drainage. A water level increase
was recorded for every storm, both on the roof and in the street manhole. While the low‐cost
monitoring does not provide a water balance to indicate how much of the precipitation reached the
storm pipe at the street, the close timing of the roof and street response suggests water flows rapidly
from the roof with little opportunity for evaporation. One way to increase the travel time would be
to decrease the size of the roof outlets, but care must be taken not to allow the water level to exceed
the roof capacity.
Figure 4. Water level responses on two blue roofs (Bar 1 and Bar 3) and a street manhole. The street
manhole water level is divided by five to show on the same plot as the roof loggers. Figure 4. Water level responses on two blue roofs (Bar 1 and Bar 3) and a street manhole. The streetmanhole water level is divided by five to show on the same plot as the roof loggers.
Water 2016, 8, 346 6 of 10
3.4. Comparison of an Infiltration Trench and a Traditional Stormpipe in a Parking Lot
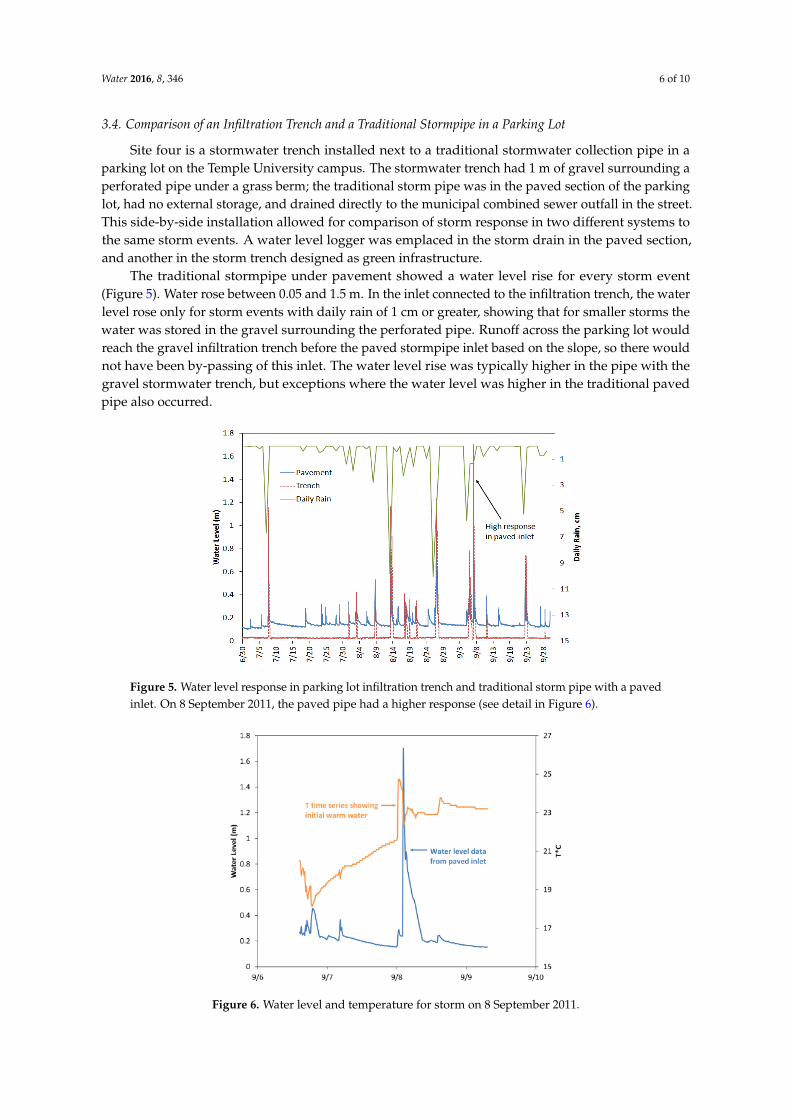
Site four is a stormwater trench installed next to a traditional stormwater collection pipe in aparking lot on the Temple University campus. The stormwater trench had 1 m of gravel surrounding aperforated pipe under a grass berm; the traditional storm pipe was in the paved section of the parkinglot, had no external storage, and drained directly to the municipal combined sewer outfall in the street.This side-by-side installation allowed for comparison of storm response in two different systems tothe same storm events. A water level logger was emplaced in the storm drain in the paved section,and another in the storm trench designed as green infrastructure.
The traditional stormpipe under pavement showed a water level rise for every storm event(Figure 5). Water rose between 0.05 and 1.5 m. In the inlet connected to the infiltration trench, the waterlevel rose only for storm events with daily rain of 1 cm or greater, showing that for smaller storms thewater was stored in the gravel surrounding the perforated pipe. Runoff across the parking lot wouldreach the gravel infiltration trench before the paved stormpipe inlet based on the slope, so there wouldnot have been by-passing of this inlet. The water level rise was typically higher in the pipe with thegravel stormwater trench, but exceptions where the water level was higher in the traditional pavedpipe also occurred.
Water 2016, 8, 346 6 of 10
3.4. Comparison of an Infiltration Trench and a Traditional Stormpipe in a Parking Lot
Site four is a stormwater trench installed next to a traditional stormwater collection pipe in a
parking lot on the Temple University campus. The stormwater trench had 1 m of gravel surrounding
a perforated pipe under a grass berm; the traditional storm pipe was in the paved section of the
parking lot, had no external storage, and drained directly to the municipal combined sewer outfall in
the street. This side‐by‐side installation allowed for comparison of storm response in two different
systems to the same storm events. A water level logger was emplaced in the storm drain in the paved
section, and another in the storm trench designed as green infrastructure.
The traditional stormpipe under pavement showed a water level rise for every storm event
(Figure 5). Water rose between 0.05 and 1.5 m. In the inlet connected to the infiltration trench, the
water level rose only for storm events with daily rain of 1 cm or greater, showing that for smaller
storms the water was stored in the gravel surrounding the perforated pipe. Runoff across the parking
lot would reach the gravel infiltration trench before the paved stormpipe inlet based on the slope, so
there would not have been by‐passing of this inlet. The water level rise was typically higher in the
pipe with the gravel stormwater trench, but exceptions where the water level was higher in the
traditional paved pipe also occurred.
Figure 5. Water level response in parking lot infiltration trench and traditional storm pipe with a
paved inlet. On 8 September 2011, the paved pipe had a higher response (see detail in Figure 6).
Higher response in the pipe beneath the pavement was linked to flow reversals. The water
showed a temperature increase when the water level response was higher. For a storm on 8
September 2011, the warmer water appeared at 1:00 A.M.; however, warmer water is not expected
for a night time rain event (Figure 6). Stormwater stored in the street stormpipe may have been
warmed and entered the parking lot during this and similar storm events. Higher‐cost monitoring
using a flowmeter was used to follow up this observation. This flowmeter monitoring confirmed that
flow sometimes reverses direction, moving water from the street to the parking lot.
Figure 5. Water level response in parking lot infiltration trench and traditional storm pipe with a pavedinlet. On 8 September 2011, the paved pipe had a higher response (see detail in Figure 6).Water 2016, 8, 346 7 of 10
Figure 6. Water level and temperature for storm on 8 September 2011.
3.5. Long‐Term Monitoring of Infiltration Chamber Performance
Site five is an infiltration chamber installed beneath a parking lot at the Pennypack Ecological
Restoration Trust (PERT). The infiltration chamber has five corrugated pipes surrounded by crushed
stone that was washed to remove fines, and underlies an 8 × 13 m parking lot. Water enters the
chamber by a drop inlet equipped with sediment filtration fabric as well as by entering through
porous pavement on part of the parking lot. The system was designed to capture storms for the 2‐
year 24‐h event, or approximately 8 cm of precipitation. The drainage area was estimated to be about
1.8 hectares (4.5 acres), with forest and residential development.
The PERT infiltration gallery was monitored for 2.7 years to evaluate its effectiveness and
longevity. A monitoring well installed in the trench instrumented with a water level logger recorded
the height of water and the recession. The logger data were compared to the rain gage recording
events on the PERT site.
For most storms, there was no water level response. This lack of response demonstrates that
rapid infiltration occurred. There was no response for any storm with daily rain less than 3 cm. Since
65% of annual precipitation occurs in storms less than 3 cm [20], the data indicate effective infiltration
of the majority of stormwater. For storms with daily rain 3 cm and over, 50% had a measureable
water level response, but 50% showed rapid infiltration and no response (Table 1). In 2007, there were
five storms recorded with 3 cm or more of precipitation, and two had a water level response showing
storage in the gallery. In 2008, there were six storms recorded with high precipitation, and three had
a water level response. In the portion of 2009 that was monitored, there were two storms with high
precipitation, and one had a water level response. Thus, there was no evidence of decline in
effectiveness based on stormwater response. The water level peaks varied from 0.1 to 0.5 m, although
some storms produced multiple peaks, so peak height was not always related to storm volume. The
highest peak was for a 2.3 cm/h intensity storm.
The recession times were short, 7 h or less with an average of 4.5 h. This recovery is considerably
less than the 72 h required by the Pennsylvania Department of Environmental Protection stormwater
manual [20], so there was no evidence for clogging during the monitoring period. The recovery times
were somewhat longer in the last two years, but there was overlap with the early data. There was
only one storm as large as the designed 2‐year, 24‐h storm event (Table 1, 16/4/2007), but it showed a
similar water level rise to other storm events and similar rapid infiltration. Thus, the infiltration
gallery had sufficient capacity to handle the designed event.
In summary, the infiltration gallery effectively captured and infiltrated the largest storms
observed. Furthermore, the trench did not show signs of degradation after 2.7 years of monitoring,
based on small storms showing no response both at the beginning and end of the period, and based
Figure 6. Water level and temperature for storm on 8 September 2011.

Water 2016, 8, 346 7 of 10
Higher response in the pipe beneath the pavement was linked to flow reversals. The watershowed a temperature increase when the water level response was higher. For a storm on 8 September2011, the warmer water appeared at 1:00 A.M.; however, warmer water is not expected for a night timerain event (Figure 6). Stormwater stored in the street stormpipe may have been warmed and enteredthe parking lot during this and similar storm events. Higher-cost monitoring using a flowmeter wasused to follow up this observation. This flowmeter monitoring confirmed that flow sometimes reversesdirection, moving water from the street to the parking lot.
3.5. Long-Term Monitoring of Infiltration Chamber Performance
Site five is an infiltration chamber installed beneath a parking lot at the Pennypack EcologicalRestoration Trust (PERT). The infiltration chamber has five corrugated pipes surrounded by crushedstone that was washed to remove fines, and underlies an 8 × 13 m parking lot. Water enters thechamber by a drop inlet equipped with sediment filtration fabric as well as by entering through porouspavement on part of the parking lot. The system was designed to capture storms for the 2-year 24-hevent, or approximately 8 cm of precipitation. The drainage area was estimated to be about 1.8 hectares(4.5 acres), with forest and residential development.
The PERT infiltration gallery was monitored for 2.7 years to evaluate its effectiveness and longevity.A monitoring well installed in the trench instrumented with a water level logger recorded the heightof water and the recession. The logger data were compared to the rain gage recording events on thePERT site.
For most storms, there was no water level response. This lack of response demonstrates that rapidinfiltration occurred. There was no response for any storm with daily rain less than 3 cm. Since 65% ofannual precipitation occurs in storms less than 3 cm [20], the data indicate effective infiltration of themajority of stormwater. For storms with daily rain 3 cm and over, 50% had a measureable water levelresponse, but 50% showed rapid infiltration and no response (Table 1). In 2007, there were five stormsrecorded with 3 cm or more of precipitation, and two had a water level response showing storage inthe gallery. In 2008, there were six storms recorded with high precipitation, and three had a water levelresponse. In the portion of 2009 that was monitored, there were two storms with high precipitation,and one had a water level response. Thus, there was no evidence of decline in effectiveness based onstormwater response. The water level peaks varied from 0.1 to 0.5 m, although some storms producedmultiple peaks, so peak height was not always related to storm volume. The highest peak was for a2.3 cm/h intensity storm.
Table 1. Summary of storm responses in parking lot infiltration chamber for events greater than 3 cmfor 2.7 years of monitoring.
dd/mm/yyyy Daily Rain, cm Intensity, cm/h Storm Peak, m Recession, h
2/3/2007 4 0.2 0.25 3.516/4/2007 10 0.3 0.25 327/4/2007 3.6 0.4 09/10/2007 3.2 1.3 027/10/2007 3.7 0.2 0
1/2/2008 3.3 0.2 013/2/2008 5 0.4 0.1 68/3/2008 3.5 0.7 0.2 3
28/10/2008 3 0.2 012/12/2008 5 0.5 0.08 713/6/2009 3.4 0.8 02/8/2009 5 2.3 0.5 5
The recession times were short, 7 h or less with an average of 4.5 h. This recovery is considerablyless than the 72 h required by the Pennsylvania Department of Environmental Protection stormwater

Water 2016, 8, 346 8 of 10
manual [20], so there was no evidence for clogging during the monitoring period. The recovery timeswere somewhat longer in the last two years, but there was overlap with the early data. There wasonly one storm as large as the designed 2-year, 24-h storm event (Table 1, 16/4/2007), but it showeda similar water level rise to other storm events and similar rapid infiltration. Thus, the infiltrationgallery had sufficient capacity to handle the designed event.
In summary, the infiltration gallery effectively captured and infiltrated the largest storms observed.Furthermore, the trench did not show signs of degradation after 2.7 years of monitoring, based onsmall storms showing no response both at the beginning and end of the period, and based on similarrecession over time for larger storms. A typical trench can show signs of degradation at this pointin time if clogging is an issue [7,9]. An appropriately-sized trench with a sediment filtration systemimproved the effectiveness and longevity of the PERT parking lot infiltration gallery.
4. Discussion
Low-cost monitoring can be an effective way to answer certain types of questions related to SCMdesign. It does not provide quantitative assessment of performance or capture volume or water qualityissues. Instead, low-cost monitoring is suggested to provide a level of assessment that supplementsobservations and anecdotal evidence of SCM functioning. Low-cost water level loggers can be usedto evaluate how often stormflow reaches an overflow monitoring point and for which storm events.The hydrograph also provides timing to indicate how fast stormwater is moving through the system.Green infrastructure can also be assessed before and after retrofitting.
The design of a low-cost monitoring system typically involves monitoring two points in a system,such as the inlet and outlet. Selection of monitoring points sometimes involves observing a systemduring wet weather to identify overflow points. The water level logger can be dry in between rainevents, but it helps to have a collection point where water pools to record a water level rise in responseto storms. Local precipitation data are also needed to relate the size of the storm event to the response.The time period for monitoring should be sufficient to capture a variety of storm events, and long-termmonitoring (a year or more) requires little maintenance with low-cost water level loggers.
There are some limitations when relying on water level loggers to assess SCMs. Water qualityassessment is not provided, although water level data can complement water quality sampling.It can be difficult to assess Winter performance, because snow melt can release water unrelated to aprecipitation event and because frozen ground can change infiltration characteristics. Placing loggersin stormpipes can make them susceptible to movement, and the data record can be disrupted if thelogger is knocked over or displaced from the pipe. Monthly data downloads can help keep the datarecord from getting disrupted, but that adds to labor costs. With a limited number of loggers, notall sources of inflow to a system can be monitored, and the sources can change depending on theseason and storm intensity. Uneven distribution of rainfall can make it difficult to tie data directly torain events. Despite such uncertainties, low-cost monitoring can help overcome resistance to makingquantitative assessments of SCM performance.
In the examples presented here, there were several types of assessment provided by the low-costmonitoring. At site one, monitoring the inlet and outlet of two retention basins revealed differences indesign that influenced how often the basin overflowed. At site two, monitoring showed that retrofittingreduced the number of storms that overflowed to the outlet structure. On a blue roof (site three),the timing of retention and overflow to the street pipe were recorded, which showed that water storageon the roof was short. Comparison of storm response in a traditional storm pipe and an infiltrationtrench (site four) showed improved storage in the trench, as expected. Stormpipe monitoring alsoshowed warm water entering during storms, which may indicate overflow from street stormpipes.Because of the low-cost of the sensors, long-term monitoring can easily be implemented, and for aninfiltration chamber beneath a parking lot (site five), showed little change in storage capacity in a2.7-year study.

Water 2016, 8, 346 9 of 10
Observations of hydrographs using low-cost monitoring can help to evaluate the effectiveness ofSCMs. Stormflow reduction is not always achieved, but monitoring can suggest improved designs thatslow the flow of water and increase infiltration. Sites that need improvement or additional monitoringcan be identified with low-cost monitoring.
Acknowledgments: Funding for these projects was provided by grants from the U.S. EPA and the William PennFoundation to Temple University’s Center for Sustainable Communities. Cultec, Inc. donated materials for thePERT infiltration chamber and the Warrington Environmental Action Council provided monitoring equipmentand arranged funding for the retrofit of the township basin. Over the years a number of students helped downloaddata at the field sites; their help is gratefully acknowledged. Any use of trade, firm, or product names is fordescriptive purposes only and does not imply endorsement by Temple University or the U.S. Government.
Conflicts of Interest: The author declare no conflict of interest.
References
1. O’Driscoll, M.; Clinton, S.; Jefferson, A.; Manda, A.; McMillan, S. The effects of urbanization on streams inthe southern US: A Review. Water 2010, 2, 605–648. [CrossRef]
2. National Academy of Sciences. Urban Stormwater Management in the United States; National Academies Press:Washington, DC, USA, 2009.
3. Environmental Protection Agency. Low Impact Development (LID). A Literature Review; EPA Office of Water:Washington, DC, USA, 2000.
4. Environmental Protection Agency. Stormwater Technology Fact Sheet: On-Site Underground Retention/Detention;EPA Office of Water: Washington, DC, USA, 2001.
5. Davis, A.P. Green engineering principles promote low-impact development. Environ. Sci. Technol. 2005, 39,338A–344A. [CrossRef] [PubMed]
6. Ahiablame, L.M.; Engel, B.A.; Chaubey, I. Effectiveness of low impact development practices: Literaturereview and suggestions for future research. Water Air Soil Pollut. 2012, 223, 4253–4273. [CrossRef]
7. Emerson, C.H.; Welty, C.; Traver, R.G. Watershed-scale evaluation of a system of storm water detentionbasins. J. Hydrol. Eng. 2005, 10, 237–242. [CrossRef]
8. Philadelphia Water Department (PWD). Stormwater Management Guidance Manual V 3; PWD: Philadelphia,PA, USA, 2015.
9. Brown, R.A.; Borst, M. Evaluation of Surface and Subsurface Processes in Permeable Pavement InfiltrationTrenches. J. Hydrol. Eng. 2014, 20. [CrossRef]
10. Roy, A.H.; Wenger, S.J.; Fletcher, T.D.; Walsh, C.J.; Ladson, A.R.; Shuster, W.D.; Thurston, H.W.; Brown, R.R.Impediments and solutions to sustainable, watershed-scale urban stormwater management: Lessons fromAustralia and the United States. Environ. Manag. 2008, 42, 344–359. [CrossRef] [PubMed]
11. Strecker, E.W.; Quigley, M.M.; Urbonas, B.R.; Jones, J.E.; Clary, J.K. Determining urban storm water BMPeffectiveness. J. Water Resour. Plan. Manag. 2001, 127, 144–149. [CrossRef]
12. Emerson, C.H.; Wadzuk, B.M.; Traver, R.G. Hydraulic evolution and total suspended solids capture of aninfiltration trench. Hydrol. Process. 2010, 24, 1008–1014. [CrossRef]
13. Natarajan, P.; Davis, A.P. Performance of a ‘Transitioned’ Infiltration Basin Part 2: Nitrogen and PhosphorusRemovals. Water Environ. Res. 2016, 88, 291–302. [CrossRef] [PubMed]
14. Ellis, J.B. Infiltration Systems: A Sustainable Source-Control Option for Urban Stormwater QualityManagement? Water Environ. J. 2000, 14, 27–34. [CrossRef]
15. Lewellyn, C.; Lyons, C.E.; Traver, R.G.; Wadzuk, B.M. Evaluation of Seasonal and Large Storm RunoffVolume Capture of an Infiltration Green Infrastructure System. J. Hydrol. Eng. 2015, 21. [CrossRef]
16. Jia, H.; Wang, X.; Ti, C.; Zhai, Y.; Field, R.; Tafuri, A.N.; Cai, H.; Shaw, L.Y. Field monitoring of a LID-BMPtreatment train system in China. Environ. Monit. Assess. 2015, 187, 1–18. [CrossRef] [PubMed]
17. Li, H.; Sharkey, L.J.; Hunt, W.F.; Davis, A.P. Mitigation of impervious surface hydrology using bioretentionin North Carolina and Maryland. J. Hydrol. Eng. 2009, 14, 407–415. [CrossRef]
18. Page, J.L.; Winston, R.J.; Mayes, D.B.; Perrin, C.; Hunt, W.F. Retrofitting with innovative stormwater controlmeasures: Hydrologic mitigation of impervious cover in the municipal right-of-way. J. Hydrol. 2015, 527,923–932. [CrossRef]

Water 2016, 8, 346 10 of 10
19. Loperfido, J.V.; Noe, G.B.; Jarnagin, S.T.; Hogan, D.M. Effects of distributed and centralized stormwater bestmanagement practices and land cover on urban stream hydrology at the catchment scale. J. Hydrol. 2014,519, 2584–2595. [CrossRef]
20. Pennsylvania Department of Environmental Protection (PA DEP). Pennsylvania Stormwater BMP Manual;PA DEP: Harrisburg, PA, USA, 2006.
© 2016 by the author; licensee MDPI, Basel, Switzerland. This article is an open accessarticle distributed under the terms and conditions of the Creative Commons Attribution(CC-BY) license (http://creativecommons.org/licenses/by/4.0/).