Embed Size (px)
Citation preview
Water in the Climate System –The Hydrological Cycle
Richard Allan - University of ReadingThanks to Julia Slingo, Adrian Tomkins, Peter Bechtold and others

Overview
• Basic Quantities and Concepts
• Water cycle in the climate system– Atmospheric hydrological cycle
– Ocean freshwater budget
– Terrestrial water cycle
• Modelling the water cycle:– Clouds and precipitation
– Atmospheric convection
– Land surface processes
• Water cycle and climate change

Why water is so important• Water is a fundamental ingredient of the Earth System, supporting
plant, animal and marine life.
• Water in both liquid and frozen forms covers ~75% of the Earth’s surface
• Water vapour constitutes the Earth’s most abundant and important greenhouse gas
• Water in its various forms (vapour, liquid, solid) determines the characteristics and spatio-temporal evolution of the Earth System
– Latent heat release from precipitation is a major driver of the global circulation, which acts to transport heat, moisture and momentum around the climate system.
– Natural ecosystems depend on precipitation, and so water has a fundamental role to play in other cycles of the earth system. such as the carbon and nitrogen cycles.

LIMITLESS POTENTIAL | LIMITLESS OPPORTUNITIES | LIMITLESS IMPACT
WATER
RESOURCES
• Most water on Earth is salty
• Most fresh water locked away in
or deep in ground
• Atmosphere contains a minute
amount of water ~ 0.001%
(~2.5cm of water globally)
• BUT every year atmosphere
cycles ~40x that amount
(~1m of water globally)
• Usable water depends strongly
on the water cycle4

LIMITLESS POTENTIAL | LIMITLESS OPPORTUNITIES | LIMITLESS IMPACT
Trenberth et al. (2007) J Hydromet; updated: Trenberth et al. 2011 J. Clim
386
426
114
74

Atmospheric Hydrological CyclePrecipitation = Surface Evaporation + Atmospheric Transport
Annual Mean Precipitation (mm/day)

Atmospheric Hydrological CyclePrecipitation = Surface Evaporation + Atmospheric Transport
Annual Mean Latent Heat Flux (Wm-2)
1 mm/day = 28.9 Wm-2

Atmospheric Hydrological CyclePrecipitation = Surface Evaporation + Atmospheric Transport
Annual Mean Precipitation minus Evaporation (mm/day)
•Sub-tropics are source of moisture for the global hydrological cycle
•Atlantic exports moisture to the Pacific

• In the tropics, mean meridional circulation (i.e. Hadley cell)
provides major equatorward transport in the lower troposphere
• In mid-latitudes, transient eddies provide the poleward transport
Precipitation = Surface Evaporation + Atmospheric Transport
Atmospheric Hydrological Cycle
Annual Mean Fluxes and Convergence of Water Vapour
LIMITLESS POTENTIAL | LIMITLESS OPPORTUNITIES | LIMITLESS IMPACT
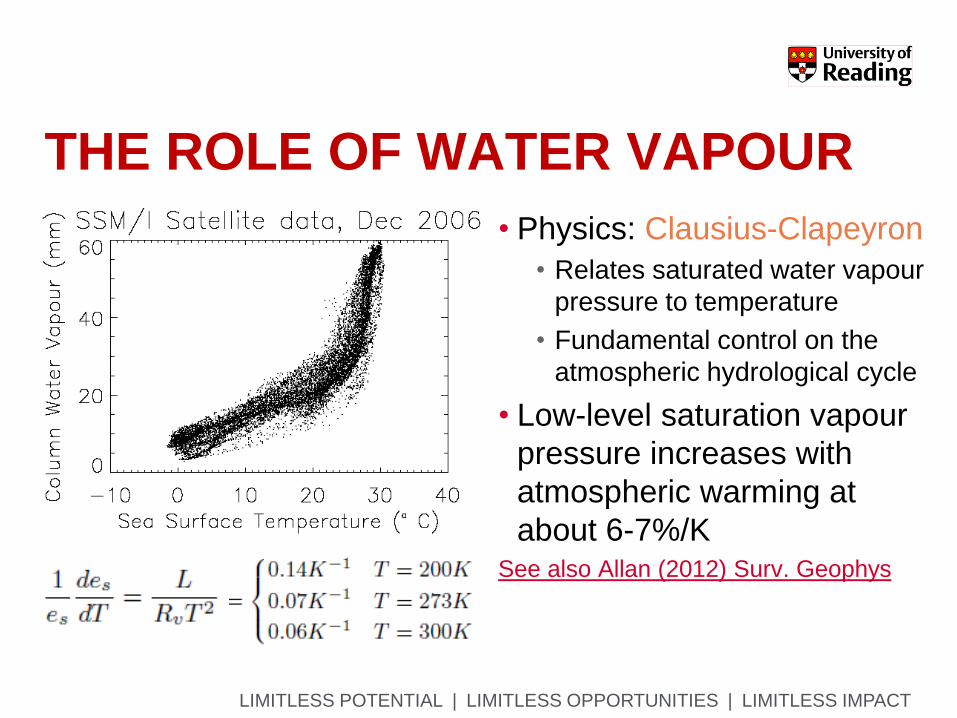
THE ROLE OF WATER VAPOUR
• Physics: Clausius-Clapeyron
• Relates saturated water vapour
pressure to temperature
• Fundamental control on the
atmospheric hydrological cycle
• Low-level saturation vapour
pressure increases with
atmospheric warming at
about 6-7%/K See also Allan (2012) Surv. Geophys
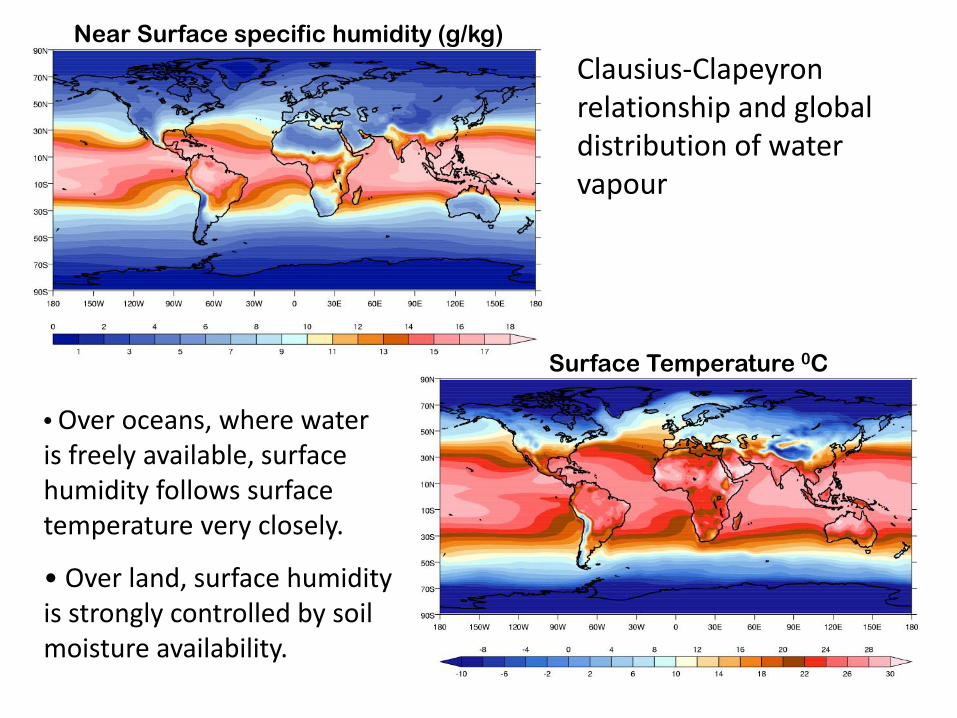
Clausius-Clapeyron relationship and global distribution of water vapour
Near Surface specific humidity (g/kg)
Surface Temperature 0C
• Over oceans, where water is freely available, surface humidity follows surface temperature very closely.
• Over land, surface humidity is strongly controlled by soil moisture availability.

Clausius-Clapeyron relationship also influences precipitation rates, especially over the tropical oceans
Observed probability distribution function (PDF) of monthly mean Sea Surface Temperature (SST) and precipitation over the tropical Pacific for Dec.–Feb.
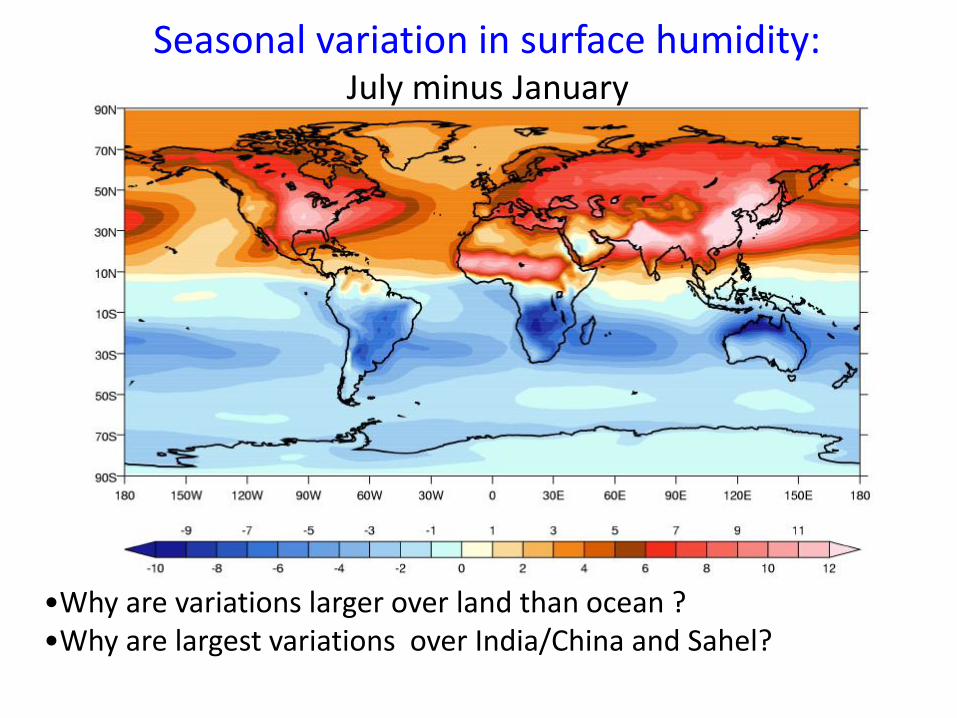
•Why are variations larger over land than ocean ?•Why are largest variations over India/China and Sahel?
Seasonal variation in surface humidity: July minus January

Monsoons: Winds at 925hPa
DJF
JJA
Asian Monsoon Austral MonsoonWest African Monsoon
‘Monsoon’ means ‘season’ and describes complete reversal of wind regimes during the seasonal cycle
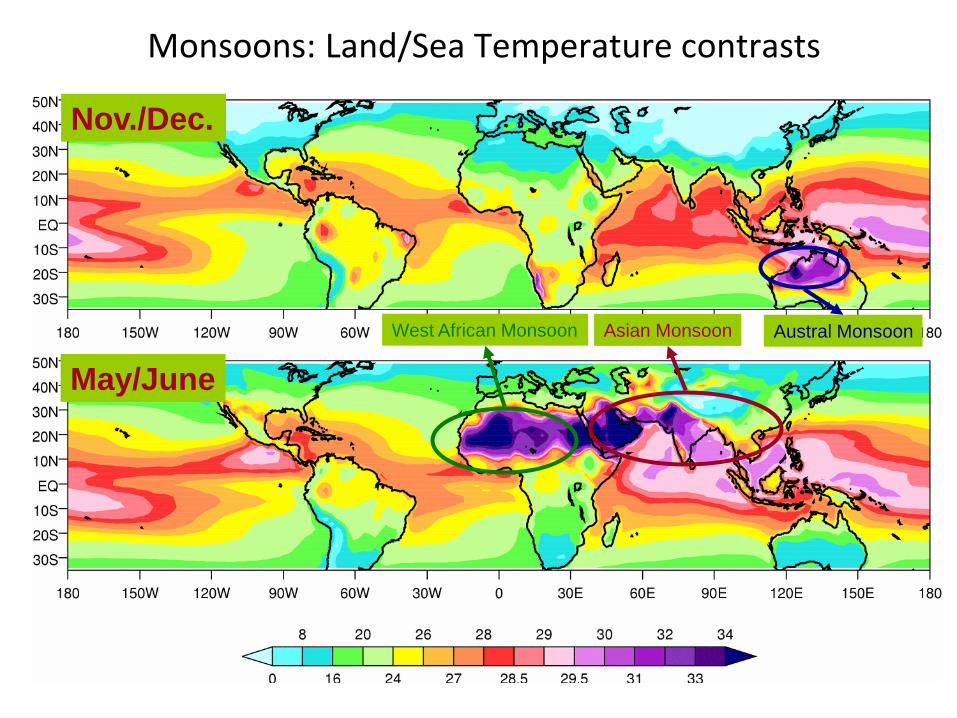
Monsoons: Land/Sea Temperature contrasts
Nov./Dec.
May/June
Austral MonsoonAsian MonsoonWest African Monsoon
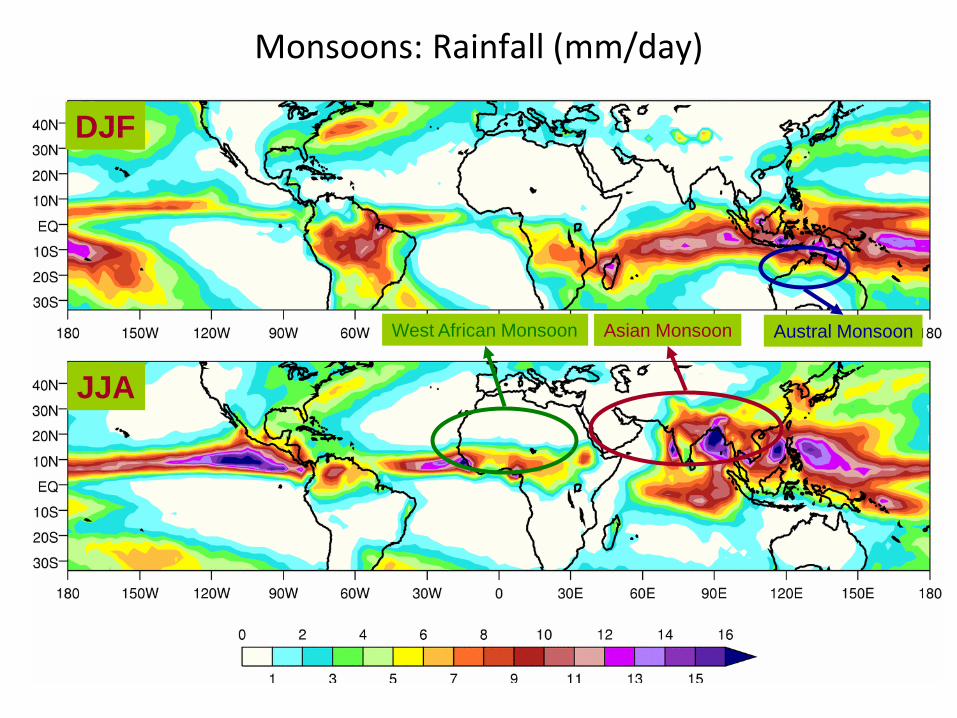
Monsoons: Rainfall (mm/day)
DJF
JJA
Austral MonsoonAsian MonsoonWest African Monsoon

Ocean Water Cycle
• Controls Surface Salinity and Temperature, hence water density. • Changes in water density drive ocean mixing and deep circulations
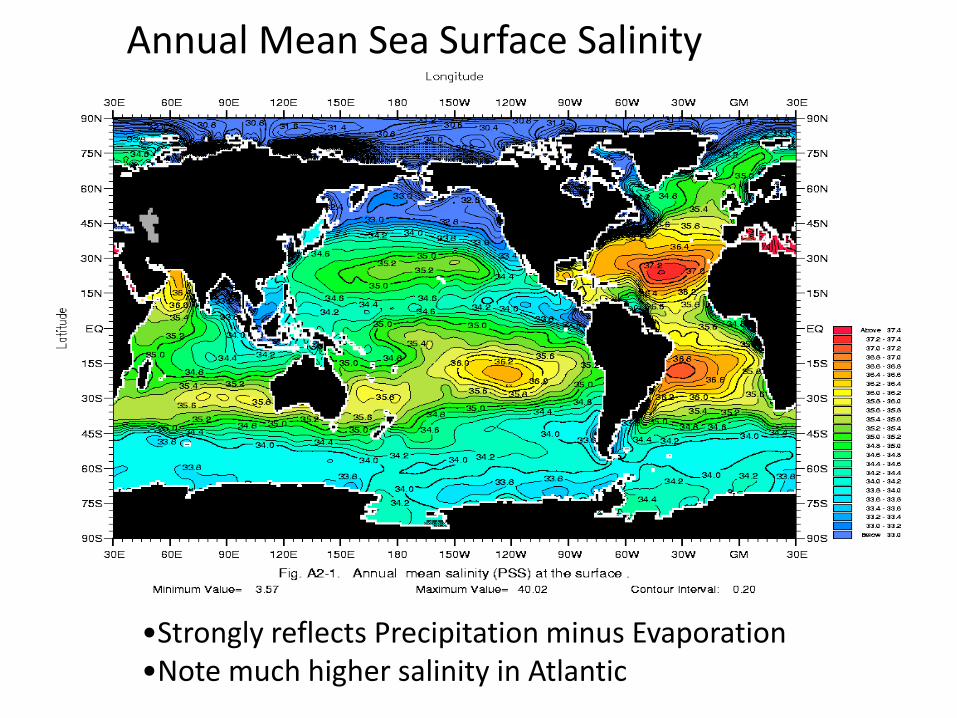
Annual Mean Sea Surface Salinity
•Strongly reflects Precipitation minus Evaporation•Note much higher salinity in Atlantic

From S. Rahmstorf: Thermohaline Ocean Circulation. In: Encyclopedia of QuaternarySciences, Edited by
S. A. Elias. Elsevier, Amsterdam 2006 (see www.pik-potsdam.de/~stefan/thc_fact_sheet.html)
Global Thermohaline Circulation

Terrestrial Water CycleStorage = P – E – Ro(Surface run-off) – Ru(Subterranean run-off)
Operates on a vast range of timescales and space scales Terrestrial biosphere interacts with the water cycle by:
•Extracting water from the soils •Returning water to the atmosphere through evapo-transpiration
Water extraction is significantly altering the terrestrial water balance

Soil water availability strongly influences the surface energy budget by determining the partitioning between surface sensible (H) and latent (LE) heat fluxes.
Surface Energy Budget:
where Ts is surface temperature, Snet is net solar radiation, Lnet is net longwave radiation and G is ground heat flux, C is heat capacity
Bowen Ratio (β) is widely used to describe the influence of soil moisture on surface fluxes and hence temperature:
Soil Moisture and the Surface Energy Budget
LE
H
GLETHTLSCt
Tssnetnet
s
)()()(
1

Constraints on evaporation
• Energy & precipitation (P) constraints on evaporation (E)
Budyko Framework
Eo is maximum theoretical evaporation (E is energy limited)
E is also limited by water availability (determined by P)
n is a catchment-specific parameter
If P>>Eo, EEo
If Eo>>P, EP Roderick et al. (2014) HESS
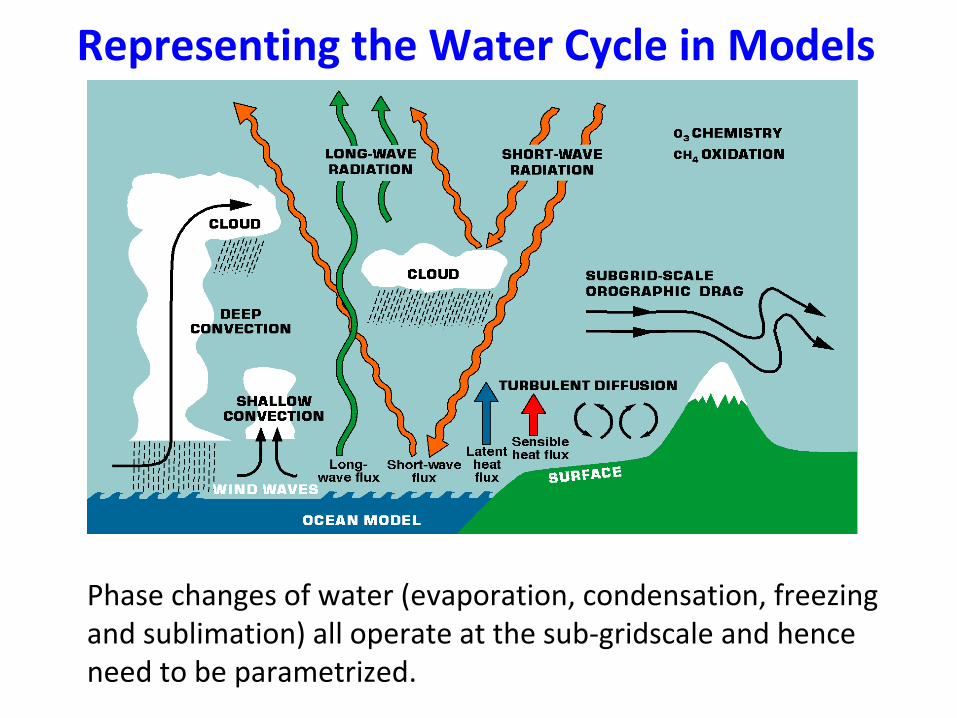
Representing the Water Cycle in Models
Phase changes of water (evaporation, condensation, freezing and sublimation) all operate at the sub-gridscale and hence need to be parametrized.

Cloud and Precipitation Processes
• We need to include in models:
– Formation of clouds
– Release of precipitation
– Evaporation of both clouds and precipitation
• Therefore we need to describe:
– change of phase from water vapour to water droplets and ice crystals
– transformation of small cloud droplets/ice crystals to larger rain drops/ice particles
– advection and sedimentation/falling of these species
– evaporation/sublimation of cloud and precipitation size particles

Deciding how much cloud
GCM Grid
GCM Grid cell: 40-400km Most schemes presume cloud fills GCM box in vertical Still need to represent
horizontal cloud cover: a
a
From Tompkins, ECMWF Training Course
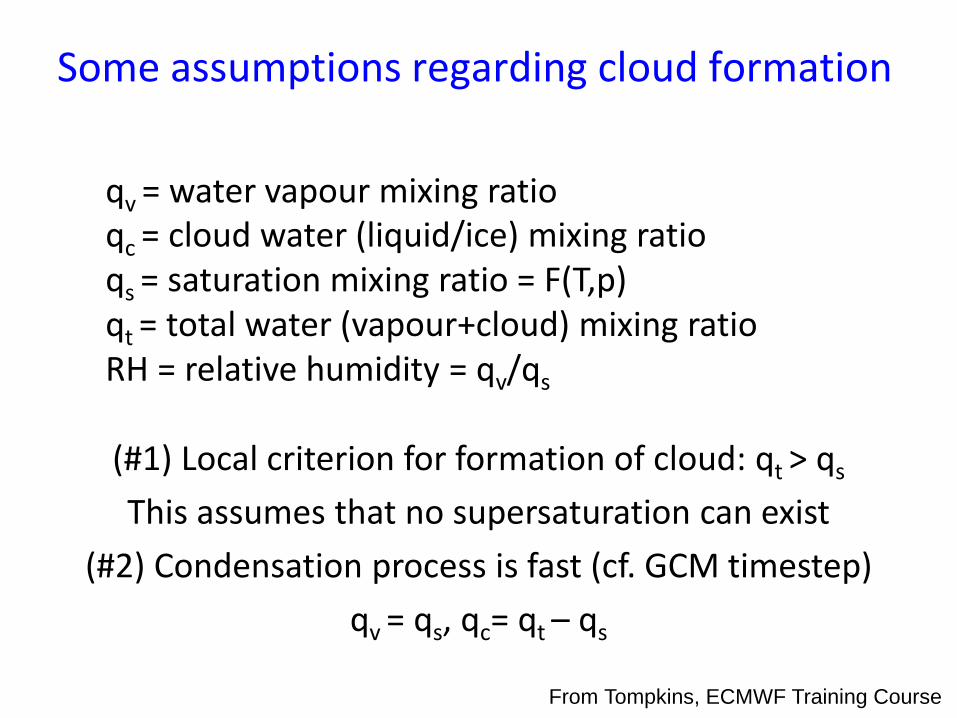
qv = water vapour mixing ratioqc = cloud water (liquid/ice) mixing ratioqs = saturation mixing ratio = F(T,p)qt = total water (vapour+cloud) mixing ratioRH = relative humidity = qv/qs
(#1) Local criterion for formation of cloud: qt > qs
This assumes that no supersaturation can exist
(#2) Condensation process is fast (cf. GCM timestep)
qv = qs, qc= qt – qs
Some assumptions regarding cloud formation
From Tompkins, ECMWF Training Course

Partial coverage of a grid-box with clouds is only possible if there is a inhomogeneous distribution of
temperature and/or humidity.
Partial cloud cover
q
x
q
sq
cloudy=
RH=1 RH<1
Another implication of the above is that clouds must exist before the grid-mean relative humidity reaches 1.
From Tompkins, ECMWF Training Course

Simple Diagnostic Schemes: Relative Humidity Schemes
• Many schemes, from the 1970s onwards, based cloud cover on the relative humidity (RH)
• e.g. Sundqvist et al. MWR 1989:
critRHRHC
111
RHcrit = critical relative humidity at which cloud assumed to form(function of height, typical value is 60-80%)
C
0
1
60 10080RH
From Tompkins, ECMWF Training Course

Statistical Schemes
• These explicitly specify the probability density function (PDF) for the total water qt
(and sometimes also temperature)
qt
x
q
sq
qt
PD
F(q
t)
qs
Cloud cover is integral under
supersaturated part of PDF
sq
ttstc dqqPDFqqq )()(
sq
tt dqqPDFC )(
From Tompkins, ECMWF Training Course

Unified Model cloud microphysics scheme
It is here that some of the major uncertainties in climate sensitivity arise

Convection
Much more in following lecture by Alison Sterling

If we assume that only radiative processes are operating, the equilibrium surface temperature is very high, tropospheric temperatures very low and the profile is strongly superadiabatic*.
In reality, convection removes heat from the surface, warms the atmosphere and adjusts the lapse-rate towards that observed#.
From the classic paper by Manabe and Wetherald, JAS, 1967
Radiative-convective equilibrium
*
#

What is convection doing, where does it occur
• Convection transports heat, water vapour, momentum … and chemical constituents upwards …. Water vapour then condenses and falls out net convective heating/drying
• Deep Convection (precipitating convection) stabilizes the environment; shallow convection redistributes the surface fluxes
• The tropical atmosphere is in radiative(cooling) / convective(heating) equilibrium: 2K/day cooling in lowest 15 km corresponds to about 5 mm/day precipitation.
• The effect of convection (local heat source) is fundamentally different in the midlatitudes and the Tropics.
• In the Tropics the Rossby radius of deformation R=NH/f is ~ infinite, and therefore the effects are not locally bounded, but spread globally via gravity waves – “throwing a stone in a lake”
From Bechtold, ECMWF Training Course

Arakawa and Schubert (1974)
Convection schemes attempt to represent the effects of a family of individual clouds on the environment

Task of the (Penetrative) Convection scheme
To calculate the collective effectsof an ensemble of convective clouds in a model column as a function of grid-scale variables.
Hence parameterization needs to describe Condensation/Evaporation and Transport of T, q and (often) momentum
Most models treat shallow (non-precipitating) convection as a separate process
From Bechtold, ECMWF Training Course

Representing Surface processes
Surface schemes are needed to:
1. Calculate the fluxes of heat, moisture and momentum between the surface and atmosphere
2. Calculate surface temperature and other variables
• Over the oceans, the schemes are quite simple
•Over land, models now contain quite detailed representations of evaporation, interception and vertical transfers of heat and moisture in the soil

Root depth
Root fractions
H2O CO2
Stomatal conductance
Rainfall
Canopy
evaporation
Interception
Throughfall
Surface
runoff
Darcian
flow
Root
uptake
Sub-surface runoff
Soil
evaporation
Transpiration
Leaf area index ( )
Canopy height ( z0)
Modelling the land surface and the terrestrial water cycle
Why the Water Cycle is at the heart of climate change
• Potential acceleration of the hydrological cycle hasimplications for the incidence of extreme events.
• Regional changes in mean precipitation patterns haveimplications for desertification, flooding.
• Changes in the partitioning between fresh and salty water(e.g. melting ice-caps, river water extraction, acceleratedhydrological cycle from global warming) could have majorconsequences for the Earth System.
• Impacts of climate variability and change on naturalecosystems directly involve precipitation.
• The impacts of climate change and variability on the quality ofhuman life occur primarily through changes in the water cycle.
• Water availability and water quality are fundamental issuesfor the 21st century.

LIMITLESS POTENTIAL | LIMITLESS OPPORTUNITIES | LIMITLESS IMPACT
HOW WILL GLOBAL PRECIPITATION
RESPOND TO CLIMATE CHANGE?
39
Allan et al. (2014) Surv. Geophys
ObservationsSimulations:
RCP 8.5Historical
RCP 4.5
1210
86420
-2
Glo
bal
Pre
cip
itat
ion
Ch
ange
(%
)
1950 2000 2050 2100

LIMITLESS POTENTIAL | LIMITLESS OPPORTUNITIES | LIMITLESS IMPACT
• Increased Precipitation• More Intense Rainfall• More droughts• Wet regions get wetter, dry
regions get drier?• Regional projections??
IPCC
WGI
(2013)
Precipitation intensity
CHANGING WATER CYCLE

LIMITLESS POTENTIAL | LIMITLESS OPPORTUNITIES | LIMITLESS IMPACT
MONITORING CHANGES IN
THE GLOBAL WATER CYCLE
Adapted from: Allan et al. (2014) Surv. Geophys
Water vapour
increases by
around 7% for
each degree C
of warming.
~1%/decade trend

LIMITLESS POTENTIAL | LIMITLESS OPPORTUNITIES | LIMITLESS IMPACT
Extreme Precipitation
• Moisture convergence fuels large-scale rainfall events
e.g. Trenberth et al. (2003) BAMS
• Intensification of rainfall with warming
e.g. Allan & Soden (2008) Science
• Amplifying latent heat feedbacks?
e.g. Berg et al. (2013) Nature Geo
• Time/space scale important• Observational constraints? e.g. O’Gorman (2012) Nature Geosci; Liu & Allan (2012) JGR
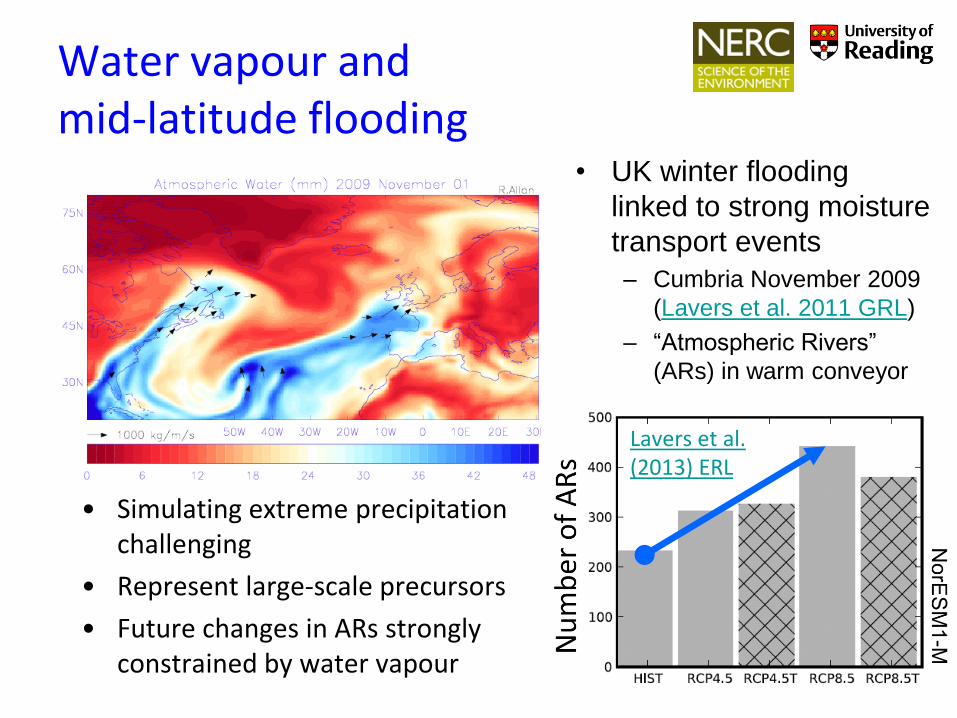
Water vapour and mid-latitude flooding
• UK winter flooding
linked to strong moisture
transport events
– Cumbria November 2009
(Lavers et al. 2011 GRL)
– “Atmospheric Rivers”
(ARs) in warm conveyor
• Simulating extreme precipitation challenging
• Represent large-scale precursors
• Future changes in ARs strongly constrained by water vapour
Lavers et al. (2013) ERL

LIMITLESS POTENTIAL | LIMITLESS OPPORTUNITIES | LIMITLESS IMPACT
EVALUATING
SIMULATED
RESPONSES
OF EXTREME
PRECIPITATION
TO WARMING
44
Allan et al. (2014) Surveys in Geophysics
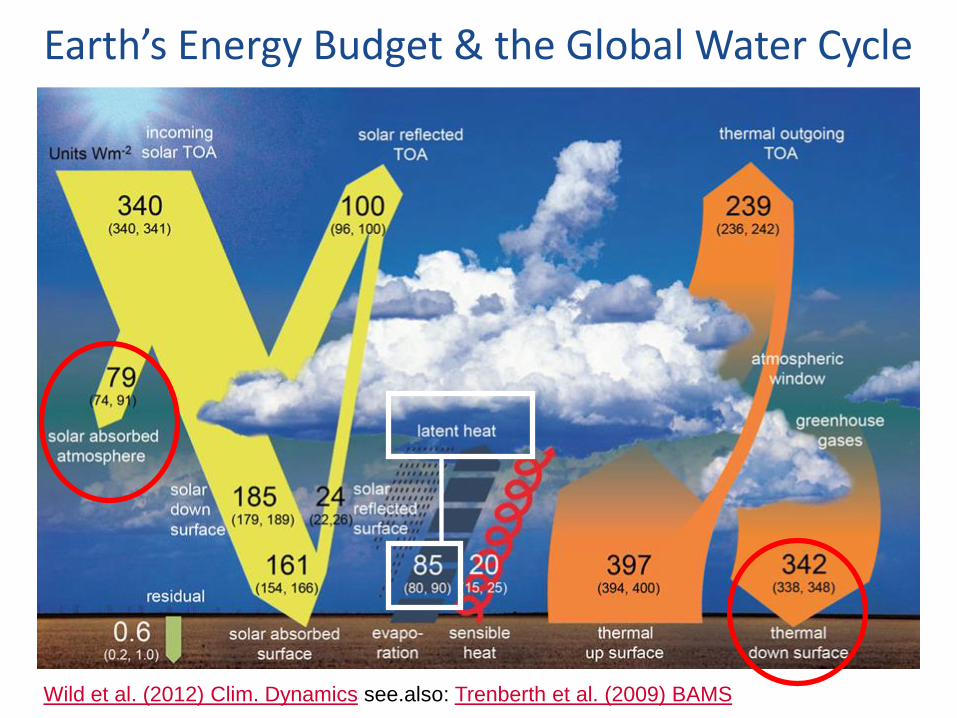
LIMITLESS POTENTIAL | LIMITLESS OPPORTUNITIES | LIMITLESS IMPACTWild et al. (2012) Clim. Dynamics see.also: Trenberth et al. (2009) BAMS
Earth’s Energy Budget & the Global Water Cycle

Radiative energy budget of the
atmosphere and hydrological response
O’Gorman et al. (2012) Surv. Geophys; after Takahashi (2009) JAS.See also Manabe & Wetherald (1975) JAS
• There is an
approximate
balance between
latent heating LP
(precipitation) and
radiative cooling
RTOA-RLCL above
lifting condensation
level (LCL)
• Below LCL sensible
heat adjustments
important (SH)
LIMITLESS POTENTIAL | LIMITLESS OPPORTUNITIES | LIMITLESS IMPACT
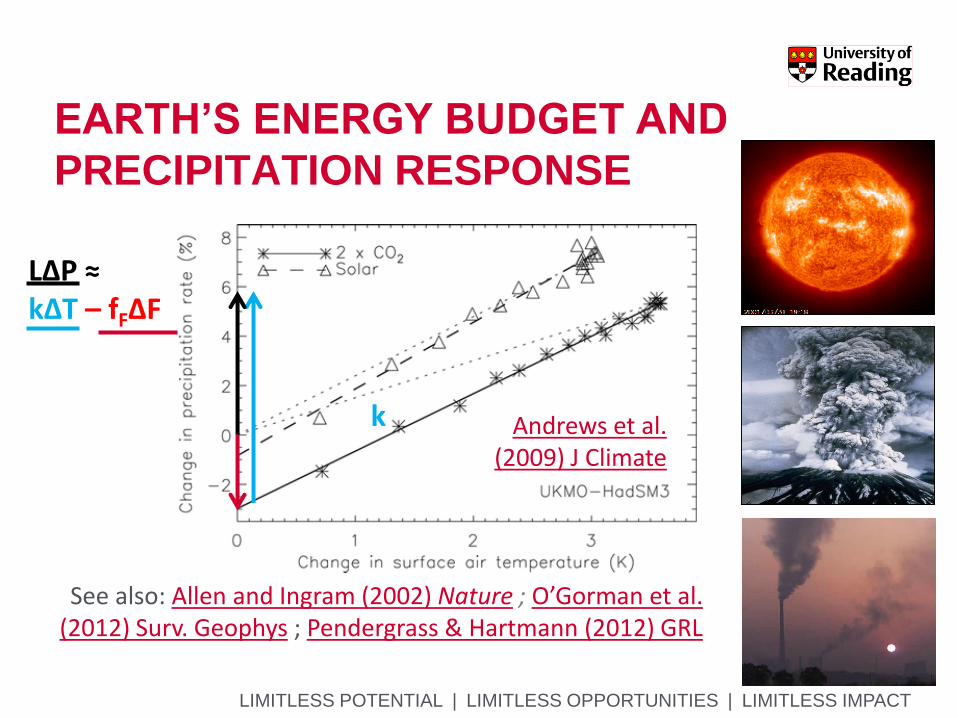
See also: Allen and Ingram (2002) Nature ; O’Gorman et al. (2012) Surv. Geophys ; Pendergrass & Hartmann (2012) GRL
Andrews et al. (2009) J Climate
EARTH’S ENERGY BUDGET AND
PRECIPITATION RESPONSE
LΔP ≈ kΔT – fFΔF
k

LIMITLESS POTENTIAL | LIMITLESS OPPORTUNITIES | LIMITLESS IMPACT
SIMPLE MODEL TO UNDERSTAND
GLOBAL PRECIPITATION RESPONSES
CMIP5 historical/RCP8.5
After Allan et al. (2014) Surv. Geophys and Thorpe and Andrews (2014) ERL
Using simple model: LΔP = kΔT – fFΔF
Zahra Mousavi (PhD project)
N=ΔF – YΔT
DΔT

LIMITLESS POTENTIAL | LIMITLESS OPPORTUNITIES | LIMITLESS IMPACT
CONTRASTING PRECIPITATION
RESPONSE EXPECTED• Basic physics indicates
that precipitation
changes will not be
uniform in space.
• Some regions will
experience increases
and others decreases
e.g. Allen and Ingram (2002) Nature; Allan (2011) Nature

First argument:
P ~ Mq
So if P constrained to rise more slowly than q, this implies reduced M:Bony et al. (2013) Nat GeosciChadwick et al. (2012) J Clim
Second argument:
ω = Q/σSubsidence (ω) induced by radiative cooling (Q) but the magnitude of ω depends on static stability (σ = Гd - Г).
If Г follows MALR increased σ. This offsets Q effect on ω.
See Held & Soden (2006) and Zelinka & Hartmann (2010) JGR
P ~ Mq
Circulation response
Schematic from Gabriel Vecchi
ω = Q/σ
P
M q
Q ω

Moisture BalanceC
hange in M
ois
ture
Tra
nsport
, dF
(pg/d
ay)
If the flow field remains
relatively constant, the
moisture transport scales
with low-level moisture.Model simulation
scaling
Held and Soden (2006) J Climate
𝑃 − 𝐸 ≈ 𝛻.1
𝑔 𝑝𝑠
0
𝑞 𝒖 𝑑𝑝 = −𝛻. 𝐹
E P−𝜵.𝑭
𝝏𝑾/𝒅𝒕
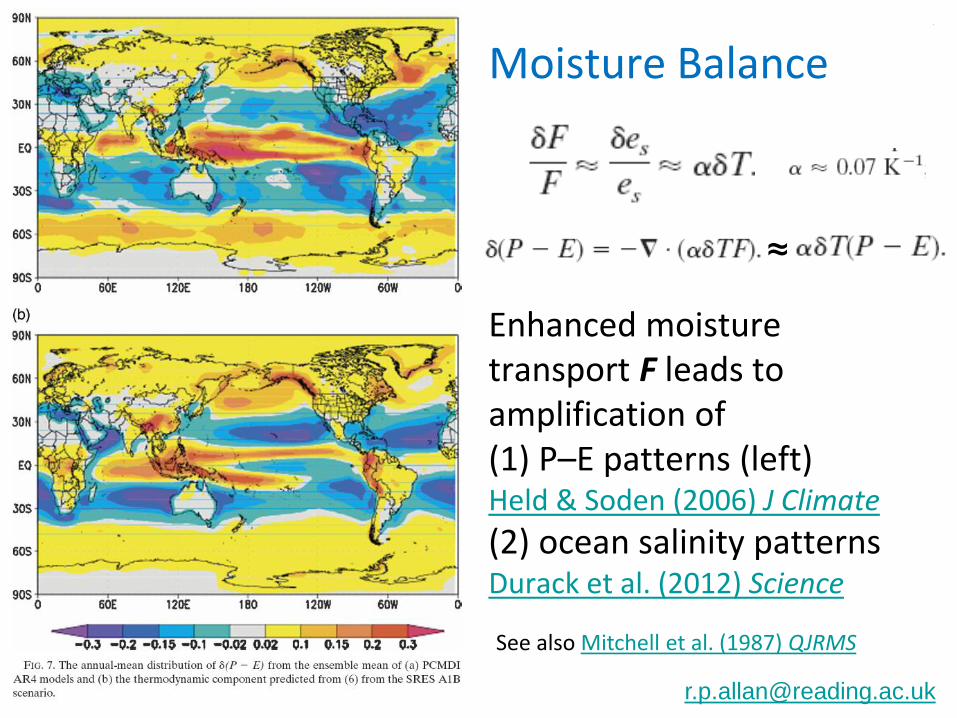
Moisture Balance
Enhanced moisture transport F leads to amplification of (1) P–E patterns (left) Held & Soden (2006) J Climate
(2) ocean salinity patterns Durack et al. (2012) Science
See also Mitchell et al. (1987) QJRMS
≈

Enhanced outflowEnhanced inflow(dominates)
PREPARE project
Zahn & Allan (2014) WRR
Allan et al. (2014) Surv. Geophys ; Zahn & Allan (2013) J Clim
Enhanced moisture transports into the “wet” tropics, high
latitudes and continents

LIMITLESS POTENTIAL | LIMITLESS OPPORTUNITIES | LIMITLESS IMPACT
THE RICH GET RICHER?
• Held & Soden (2006) scaling holds over oceans but less applicable/relevant over land (Greve et al. 2015)
• However, contrasting trends over land also imply more intense wet and dry spells in future Liu & Allan (2013) ERL
• Sampling of wet/dry regimes and consideration of internal variability and other processes key in understanding changes Allan (2014) Nature Geosci. ; Byrne & O’Gorman (2015)
1900 1950 2000 2050 2100
6420
-2-4
5
0
-5
-10
Wet
Dry
Simulations
Observations
Tropical Land
1900 1950 2000 2050 2100

LIMITLESS POTENTIAL | LIMITLESS OPPORTUNITIES | LIMITLESS IMPACT
IMPACT-RELEVANT METRICSCHANGES IN GLOBAL ARIDITY
• Changes in aridity index:𝑃 − 𝐸𝑜 ~ 𝑃 − 𝑅𝑛/λ
(Eo is potential evaporation, Rn is net radiation and λ is latent heat of vapourization)
Right: Δ(𝑃 − 𝑅𝑛/λ)
Greve & Seneviratne (2015) GRL
Also: Roderick et al. (2014) HESS
55
LIMITLESS POTENTIAL | LIMITLESS OPPORTUNITIES | LIMITLESS IMPACT
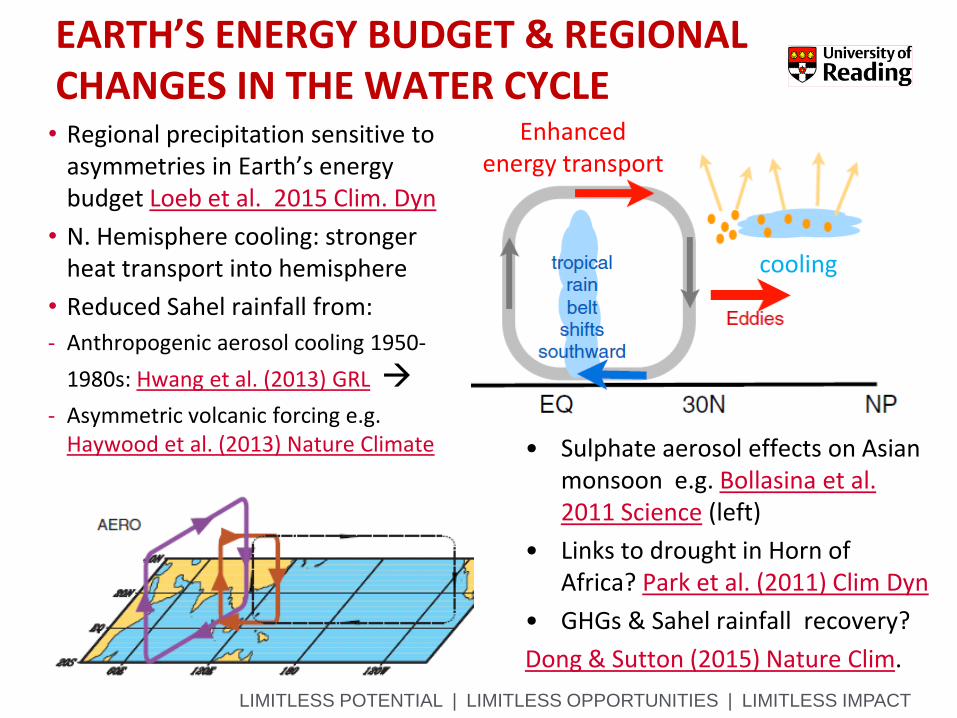
EARTH’S ENERGY BUDGET & REGIONAL CHANGES IN THE WATER CYCLE
cooling
Enhanced energy transport
• Sulphate aerosol effects on Asian monsoon e.g. Bollasina et al. 2011 Science (left)
• Links to drought in Horn of Africa? Park et al. (2011) Clim Dyn
• GHGs & Sahel rainfall recovery?
Dong & Sutton (2015) Nature Clim.
• Regional precipitation sensitive to asymmetries in Earth’s energy budget Loeb et al. 2015 Clim. Dyn
• N. Hemisphere cooling: stronger heat transport into hemisphere
• Reduced Sahel rainfall from:
- Anthropogenic aerosol cooling 1950-
1980s: Hwang et al. (2013) GRL
- Asymmetric volcanic forcing e.g. Haywood et al. (2013) Nature Climate