Embed Size (px)
Citation preview

Water implications of various forest management strategies
1. Introduction 2. Research background 3. Forest management & water 4. Water information 5. Water security
Martha Conklin, Sierra Nevada
Research Institute, UC Merced
Collaborators: R Bales, UC Merced, S. Glaser, UC Berkeley

1. Introduction: drought and fire

Hot off the press…
Source: Randall Osterhuber; measurements since 1946
Elevation: 6883 ft

The West has been drier…
http://www.mercurynews.com/science/ci_24993601/california-drought-past-dry-periods-have-lasted-more
Already, the 2013-14 rainfall season is shaping up to be the driest in 434 years, based on tree ring data, according to Lynn Ingram, a paleoclimatologist at UC Berkeley…

Some background questions
1. How different were forests prior to fire suppression vs. today, pre-fire and post-fire?
2. Can we take forests back to pre-fire-suppression conditions?
E. Branch, N. Fork Feather R., 3400’
1993
1890
Photos from G. Gruell

2. Research background

infiltration
evapotranspiration
snowmelt
runoff
sublimation
ground & surface water exchange
precipitation
Mountain hydrology – fluxes
Reservoirs: Snowpack storage Soil-water storage
How will this landscape & the hydrologic processes connecting it alter w/ climate warming & landcover change?

What elevations provide the most snowmelt?
Based on SNRI research
9000
7000
6000
10000
5000
12000
11000
8000
feet

Basic water balance Precipitation = Evapotranspiration + Runoff
= +
Groundwater recharge, mountain block vs. mountain front?

CZO
N-S transect of research catchments
MODIS image
600 1200 1800 2400 3000
Elev., m
San Joaquin Experimental
Range 400 m 1300 ft
Shorthair Creek
2700 m 8900 ft
CZO P301
2000 m 6600 ft
Soaproot Saddle 1100 m 3600 ft
E-W transect of flux towers
Sierra Nevada watershed research infrastructure

3. Forest management & water

Three issues 1. Water use by vegetation
2. Interception losses
3. Timing of snowmelt & runoff
Scoping report
Runoff = Precipitation ̶ Evapotranspiration ̶ Interception

Vegetation water use: summary from literature
Reducing forest cover by 40% of maximum levels across a watershed could increase water yields by about 9%
Sustained, extensive treatments in dense Sierra Nevada forests could increase water yield by up to 16%
These estimates are based on very limited data
Adapted from Zhang et al., 2001

Trees block low-angle winter sun, retarding snowmelt … … but intercept snowfall, some of which sublimates (< 20%) … … and emit longwave radiation that melts snow … … resulting in tree wells
Trees & snow

Lowest shortwave
3 scenarios for solar & infrared radiation
High longwave
Shortwave (solar) radiation
Low shortwave
Low longwave
High shortwave
Lower longwave
1. Dense canopy 2. Small gaps 3. Large gaps
Canopy longwave (infrared) radiation
How much snow gets to the ground & how fast does it melt?

Measuring forest effects on snow accumulation
1200 measurements

1200 measurements
Measuring forest effects on snow accumulation

Thinned unit w/ control in background

Evapotranspiration (ET) across an elevation transect
Mid-elevation forests show neither summer nor winter shutdown: ̶ deep rooting & resiliency to moisture stress ̶ warmer canopy-level temperatures despite snow
Goulden et al., 2012
ET, f
t p
er y
ear
1
2
3
Oak savannah
Mixed conifer
Red fir
Elevation, ft 0 3000 6700 10,000
Winter dormancy
Summer moisture
deficit
Sweet spot for mixed conifer

Impact of thinning on evapotranspiration & streamflow
P303 headwater catchment, Southern Sierra CZO/KREW, Sierra NF
Rain-snow transition, 2000 m elev
Results based on very-detailed pre-treatment data & hydrologic modeling
5-yr average, 2004-2008 Indicates steeper gain
from thinning than do Zhang curves (LAI)
Preliminary

4. Advances in water information – verifying
effects of management & improving forecasts
1904

Measurement technology – verification & forecasts
Available now: blending data from satellites, aircraft, wireless sensor networks, advanced modeling tools
satellite snowcover
low-cost sensors
wireless sensor
networks
Together these add up to Big Data challenges LiDAR

Current setup: wireless nodes
Improved representation of the landscape: topography & vegetation

American River basin – current hydrologic measurements
2 snow pillows in N. Fork, 1 in Middle Fork, 8 in S. Fork
Non-representative network
Stations are on flat ground, in clearings, at mid elevations
Lake Tahoe

25
An Example: Basin-wide deployment of hydrologic instrument clusters – American R. basin
• Strategically place low-cost sensor stations
to get spatial estimates of snowcover, soil
moisture & other water-balance
components
• Integrate with satellite imaging to map out
entire basin
• American River Basin Hydrological Observatory
– 4,500 km2
– 18 networks; 20 sensor nodes per network
– Sensor node - snow depth, temperature, humidity, solar radiation, soil moisture
– 1000’s sensors
– 47 reservoir inflow points; 50 water supply points
– 81 Flood forecast points
Real time data acquired by wireless sensor networks provides better predictive capabilities for reservoir mass-balance and system dynamics

Node construction at Alpha site

5. Water security

Making a water-secure world – the three I’s
Better & more-accessible
INFORMATION
INFRASTRUCTURE to store, transport
& treat water
Stronger & more-adaptable
INSTITUTIONS
Water security: the reliable availability of an acceptable quantity & quality of water for health, livelihoods & production, coupled w/ an acceptable level of water-related risks
HARD SOFT
Madden: The Beast that
ate the earth
Managing ecosystem
services
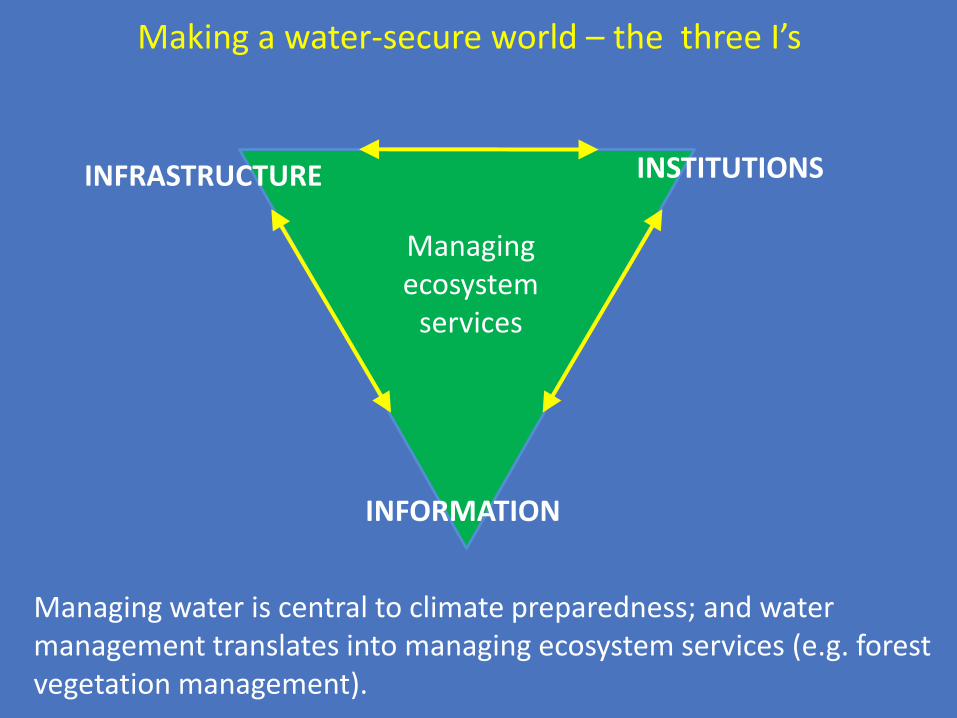
Making a water-secure world – the three I’s
INFORMATION
INFRASTRUCTURE INSTITUTIONS
Managing water is central to climate preparedness; and water management translates into managing ecosystem services (e.g. forest vegetation management).

1. Sustained forest management that provides measurable benefits for water supply will require investment , verification & maintenance
2. Better information is a critical foundation for water security, especially in a warming & more-variable climate
5. Research is still needed on several basic engineering, hydrologic-science, social-science questions, e.g.: ̶ Effect of sustained forest restoration & management ̶ Systems design for accurate spatial measurements ̶ Blending of data w/ modeling tools to improve forecasts ̶ Economic value & use of better information
Concluding points

31
3
has the flexibility to include a wide variety of sensors. A sensor station with temperature, snow
depth and solar radiation sensors can operate for two years on a single D-cell battery in mountain
conditions.
2. Acquisition and interpretation of remote sensing data. Satellite and aircraft remote sensing
provide the only practical means of basin-wide measurement and monitoring of snow properties,
vegetation characteristics and other watershed conditions. This program would use data daily from
NASA satellites on Sierra Nevada snow-covered area and albedo, and provide value-added products
of unprecedented spatial detail and accuracy that are useable on a watershed level. While some
satellite and aircraft products are now routinely available, they require further evaluation and
processing before they can be used for watershed-scale hydrologic science and applications.
We will derive spatial estimates of snow water equivalent (SWE) by combining the remote-sensing
and ground-based data. For example, the ground-based snow data are interpolated to a surface, then
total basin SWE is obtained by masking (multiplying) the interpolated SWE product with the
MODIS fractional SCA product. Validation of this product will be performed by a SWE
reconstruction analysis over the period of the MODIS record. During the snow season, SWE
estimates will be updated at least weekly, with estimates provided by sub-basin and elevation band.
3. Data integration and information management. The most critical project component will be
the cyber infrastructure that links measurements, data processing, models and users. Distributed
Satellite,aircraft&otherspatialdata
Ground-basedsensordata
Analysis&QA/QC
Analysis&QA/QC
Dataintegration&informationmanagement
Decisionsupporttools
Modeling
toolbox
Intermediate
userinterface
Intermediateuser
interfaceIntermediateuser
interface
Planning
Scheduling
Informing
Demand
data
1
2
3
4
5
The Intelligent Water Information System has 5 Components