Embed Size (px)
Citation preview
Water Demand, Supply And
Resource Development
(Namibian and Botswanan Sectors)
Specialist Report prepared by Frederick Becker for :
PERMANENT OKAVANGO RIVER BASIN COMMISSION Angola Botswana Namibia Ministério da Energia e Águas Ministry of Mineral Resources and Water Affairs Ministry of Agriculture, Water and Rural Development GABHIC Department of Water Affairs Department of Water Affairs Cx. P. 6695 Private Bag 0029 Private Bag 13193 LUANDA GABORONE WINDHOEK
Tel: +244 2 393 681 Tel: +267 360 7100 Tel: +264 61 296 9111 Fax: +244 2 393 687 Fax: +267 303508 Fax: +264 61 232 861
Water Demand, Supply And
Resource Development
(Namibian and Botswanan Sectors)
Please Note : This report is presented in two Sections, A and B, each with its own table of contents.
Report prepared by : F.W. Becker
Alexander and Becker cc PO Box 22738 WINDHOEK
Namibia
March 1998
Water Demand, Supply and Resource Development; Namibian and Botswanan Sectors
i
Section A : Namibian Sector
CONTENTS
1. INTRODUCTION 1 1.1 Study objective 1 1.2 Consultations 1
2. LOCATION 1
3. WATER DEMAND, MANAGEMENT AND SUPPLY IN NAMIBIA 3 3.1 Water dependencies 3 3.2 Water resource areas 3 3.3 Water ownership and law 6 3.4 Institutional responsibilities 6 3.5 Sector policy 9 3.6 Water utilisation strategy and policies 9 3.7 Water consumption and demand 13 3.8 Existing and future water sources and supply 19 3.9 Demand on Okavango River water 21
4. WATER MASTER PLANNING 23
5. DIAGNOSTIC ASSESSMENT AND FURTHER WORK 23 5.1 Unit water demand and projections of water demand 23 5.2 Water supply balances 24 5.3 Role of the Okavango River as a source for water supply 24 5.4 Okavango River consumer register 24 5.5 Seawater 25 5.6 Legislation and regulation 25 5.7 Management information systems 25
6. SUMMARY OF RECOMMENDATIONS FOR FURTHER WORK 26
7. LITERATURE REFERENCES 27
List of Tables
Nr Title Page
1 Total water demands along the Okavango River, in the central area and countrywide 15 2 Water demand along the Okavango River in Namibia, according to Hatutale (1994) 16
3 Per capita demands in major urban centres as per WTC (1997) projections 16 4 Per capita demands along the Okavango and countrywide, according to the
DWA (1997) and DWA (1998) projections 17
5 Water demands along main sections of the Okavango River in Namibia 21
Water Demand, Supply and Resource Development; Namibian and Botswanan Sectors
ii
List of Figures
Nr Title Page
1 Location map of Namibia 2 2 Major river basins in Namibia 5 3 Namibia water sector: government, parastatal and private involvement 8 4 Water demand of Namibia 15 5 Per capita demands in major urban centres according to WTC (1997) projections 18 6 Per capita demands along the Okavango and countrywide, according to DWA (1997)
and DWA (1998) projections 18
7 Water supply regions of Namibia 20 8 Water use in Namibia by natural source and main category in 1993 22 9 Preliminary estimate for water demand on the Okavango River 22
Terminology and abbreviations
AMSL (Elevation) above mean sea level DA Directorate of Agriculture (in the MAWRD) DRWS Directorate of Rural Water Supply (in the DWA) DW Department of Works (in the MWTC) DWA Department of Water Affairs (in the MAWRD) GTZ Deutsche Gesellschaft für technische Zusammenarbeit MAWRD Ministry of Agriculture, Water and Rural Development MET Ministry of Environment and Tourism MWTC Ministry of Works, Transport and Communication MRLGH Ministry of Regional and Local Government & Housing NamWater Namibia Water Corporation UNDP United Nations Development Fund WASCO National Water Supply and Sanitation Committee WASP Water and sanitation policy
Water Demand, Supply and Resource Development; Namibian and Botswanan Sectors
1
1. INTRODUCTION
1.1 Study objective This study forms one component of a multidisciplinary preparatory diagnostic assessment of the Okavango River basin, which is intended to lead into full-scale impact assessments and eventually to the formation of an integrated management plan for the basin.
The report focuses on the national and regional water demands and water supply in Namibia, with particular emphasis on the Okavango basin. It has the following principal outputs:
A review of available data and literature.
A preparatory diagnostic assessment of the current and projected future water demand and water supply situations.
A description of the areas where there is a lack of data or knowledge, and the work which will need to be carried out to provide an improved and accurate diagnostic assessment.
1.2 Consultations Investigations for this report included consultation with various officials, the particulars of whom are presented in Annexure A.
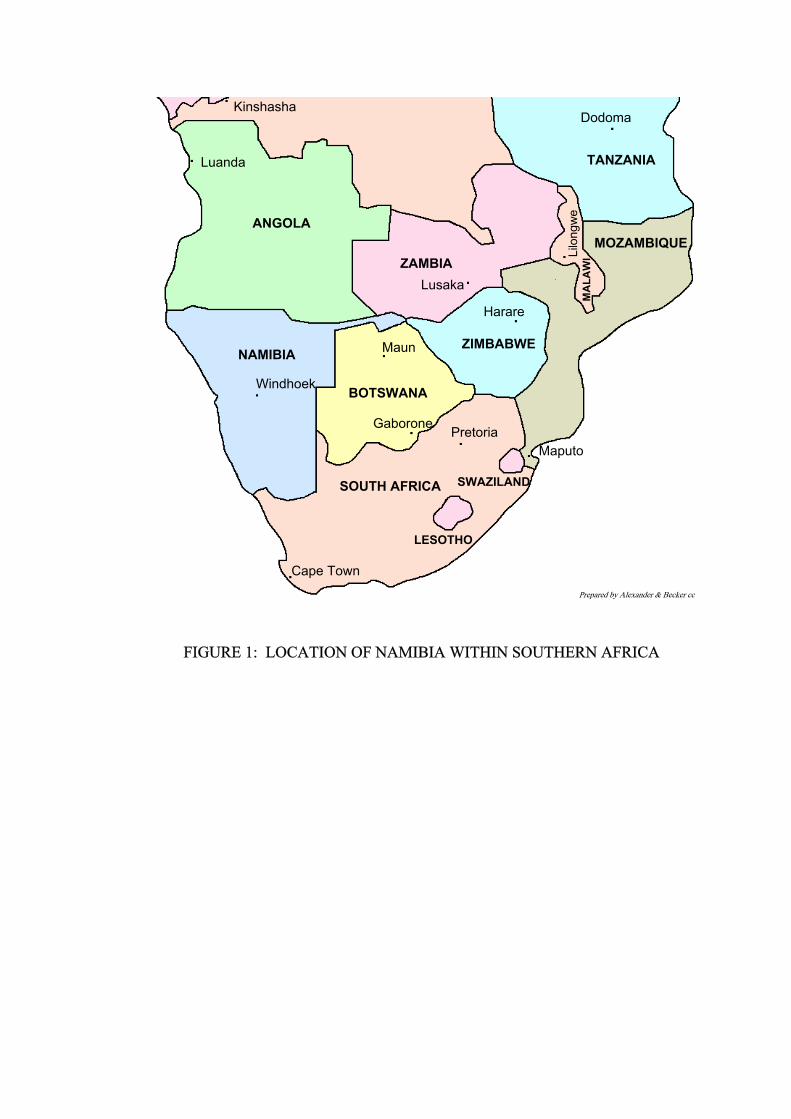
2. LOCATION Namibia has an area of 824 270 km2 and is situated on the western coast of southern Africa. It is bordered by Angola to the north, both Zambia and Zimbabwe to the far north-east, Botswana to the east, South Africa to the south, and the Atlantic Ocean to the west. The location is shown in Figure 1. Judged by the criterion of mean annual rainfall, Namibia is the driest country in Sub-Saharan Africa (Moorsom et al, 1995).
Water Demand, Supply and Resource Development; Namibian and Botswanan Sectors
2
Replacement page for Figure 1: Location map for Namibia
Water Demand, Supply and Resource Development; Namibian and Botswanan Sectors
3
3. WATER DEMAND, MANAGEMENT AND SUPPLY IN NAMIBIA
3.1 Water dependencies The entities in Namibia that are dependent on water can be categorised as:
♦ Natural environment and tourism
Physical environment (evaporation, groundwater seepage losses)
Natural fauna and flora including supplementation of wildlife drinking points
Tourist facilities in nature parks
♦ Urban centres, towns and rural villages, with the major sub-components being:
domestic and institutional
commerce and industry
distribution losses
♦ Rural population and subsistence farming
♦ Mines and energy
♦ Agriculture
Commercial livestock farming
Commercial irrigation and forestry
♦ Other
Water production processes
3.2 Water resource areas
3.2.1 Surface water When classified in terms of rainwater catchments, Namibia can be divided into the following main areas:
• The Cunene drainage region in the north-west, covering about 2 % of the country
• The Cuvelai basin in the north, covering about 13 % of the country
• The Okavango drainage region in the north-east, covering about 22 % of the country, with the following main sub-divisions:
direct drainage into Okavango River
Omatako River catchment
Northern Kalahari, draining to Botswana
• The Cuando-Linyanti-Chobe sub-catchment and the Zambezi drainage region in the far north-east, covering about 2 % of the land.
Water Demand, Supply and Resource Development; Namibian and Botswanan Sectors
4
• The Orange basin in the north-east, covering about 30 % of the country, with the following main sub-divisions:
Nossob and Auob river catchments, draining to the Molopo River and then to the Orange River
Fish River catchment
direct drainage into Orange River
• The Atlantic drainage: the collection of westward flowing ephemeral rivers, covering about 32 % of the country and grouped as:
Southern Namib
Central Namib
Northern Namib
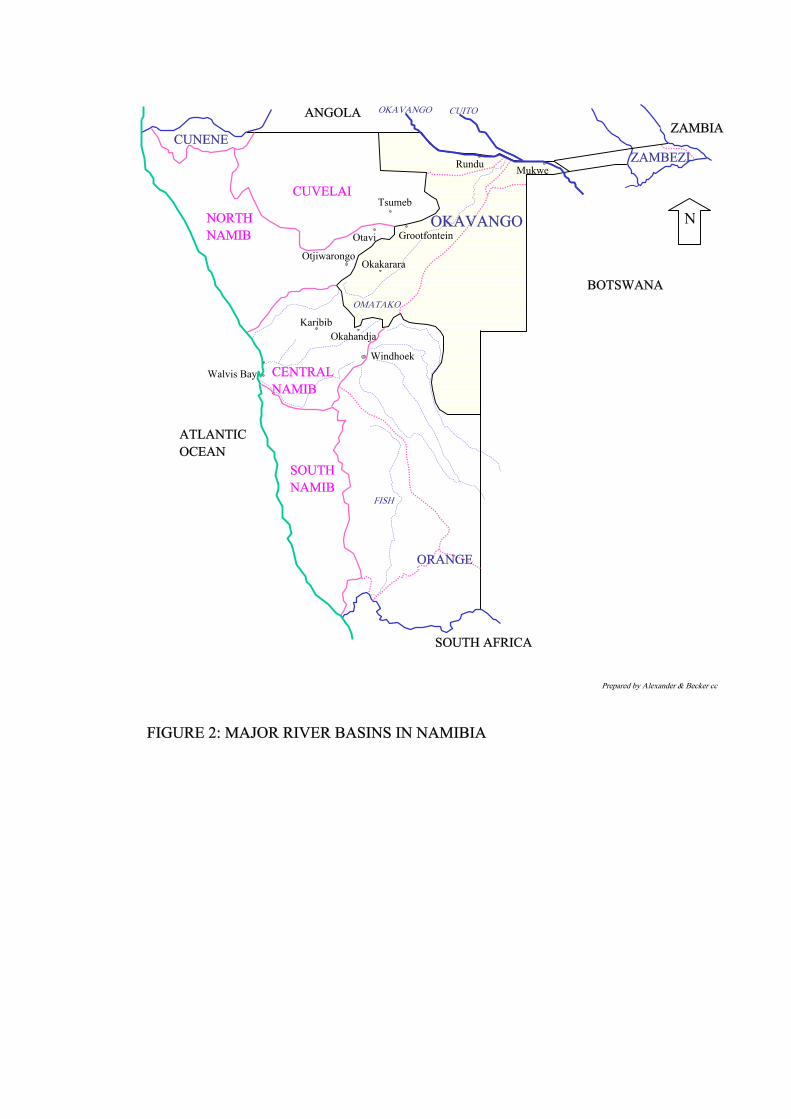
These catchments are depicted in Figure 2, with the Okavango basin shown shaded.
All the perennial rivers are shared with neighbouring countries. A more detailed description of these perennial rivers is presented by Heyns (1995 a).
Flows in the ephemeral rivers of Namibia are irregular and their water can only be used when impounded. Heyns (1995 b) reports that: the estimated aggregated sustainable safe yield from the ephemeral rivers is at least 200 Mm3 /a the DWA has constructed nine major dams in these rivers with a 95 % assured yield of about 80
Mm3/a and a total storage capacity of about 600 Mm3.
3.2.2 Groundwater Groundwater utilisation plays a significant role in Namibia’s water supply industry, with more than half the current water supplies in the country derived from groundwater. Large parts of the country are exclusively reliant on this source. An overview map of the aquifer types and yield potential in Namibia is currently under preparation by others and therefore not taken up in this report.
Heyns (1995 b) reports that more than 150 000 boreholes have been drilled in Namibia to find water and to assess the hydrogeology of these aquifers, and that approximately 40 000 of these are used for water supply. Groundwater in Namibia is associated with six types of hydrogeological environments and the estimated sustainable yield of these aquifers is estimated to be in excess of 300 Mm3/a. The sustainable yields of many aquifers are at this stage estimates only and much work is required to quantify the aquifer potentials better.
3.2.3 Seawater Namibia has access to seawater from the Atlantic Ocean and in the Namibian context, desalinated seawater is potentially an abundant source. However, it is expensive to purify and to pump to the high lying and distant inland consumers. Purification and transfer of seawater for use in Windhoek, which is more than 1 600 m above sea level for example, will require large amounts energy. The energy generation that is required to pump this water, in itself, draws heavily on natural resources. Comparisons of the usage of seawater, as opposed to that of other sources where natural forces have purified the water and elevated it to inland positions, therefore have to take due consideration of this aspect.
Seawater is nevertheless an important source of water and has been identified as the preferred source to meet future demands at the coastal towns and mines of the central Namib area of Namibia (JVC, 1996). Improvements in energy harvesting and desalination technologies may also render seawater a more attractive option in future and this needs to be made a high research priority in Namibia.
Water Demand, Supply and Resource Development; Namibian and Botswanan Sectors
5
Replacement page for Figure 2: Major river basins in Namibia
Water Demand, Supply and Resource Development; Namibian and Botswanan Sectors
6
3.3 Water ownership and law According to the Namibian constitution, all water in Namibia belongs to the state, which regulates and permits its use. Relevant acts in the water sector are:
3.3.1 Water Act 1956 (Act No. 54 of 1956) as amended Namibia’s present Water Act is an older version of the South African Water Act and is being administered by the Department of Water Affairs (DWA), of the Ministry of Agriculture, Water and Rural Development (MAWRD). Heyns (1995 b) reports that the act does not meet the requirements of an independent nation facing severe water scarcity and a new, truly Namibian Water Act is being drafted. The existing act, amongst others, allows private ownership of groundwater where it is linked to the ownership of land, and grants riparian landowners of surface water the right of access to such water. These stipulations are in conflict with the constitution of Namibia and are to be rectified in the new water act. More information regarding the Water Act is presented in the paragraph titled institutional responsibilities.
3.3.2 Namibia Water Corporation Act (Act No. 12 of 1997) The Namibia Water Corporation Act establishes the Namibia Water Corporation (NamWater) and regulates its powers, duties and functions. NamWater has come into existence recently and has taken over the bulk water supply function of the Department of Water Affairs. NamWater may also render water-related services to customers upon request.
3.3.3 Local Authorities Act (Act 23 of 1992) The Local Authorities Act that spells out the functions and duties of local authorities in rendering water supply and wastewater disposal services in its areas of jurisdiction.
3.3.4 Other acts that has a bearing on the water sector include: The Health Act of 1920 in terms of which regulations have been promulgated in 1969 and which has
the purpose of regulating the health aspects of water use.
A proposed Environmental Management Act, which is under preparation.
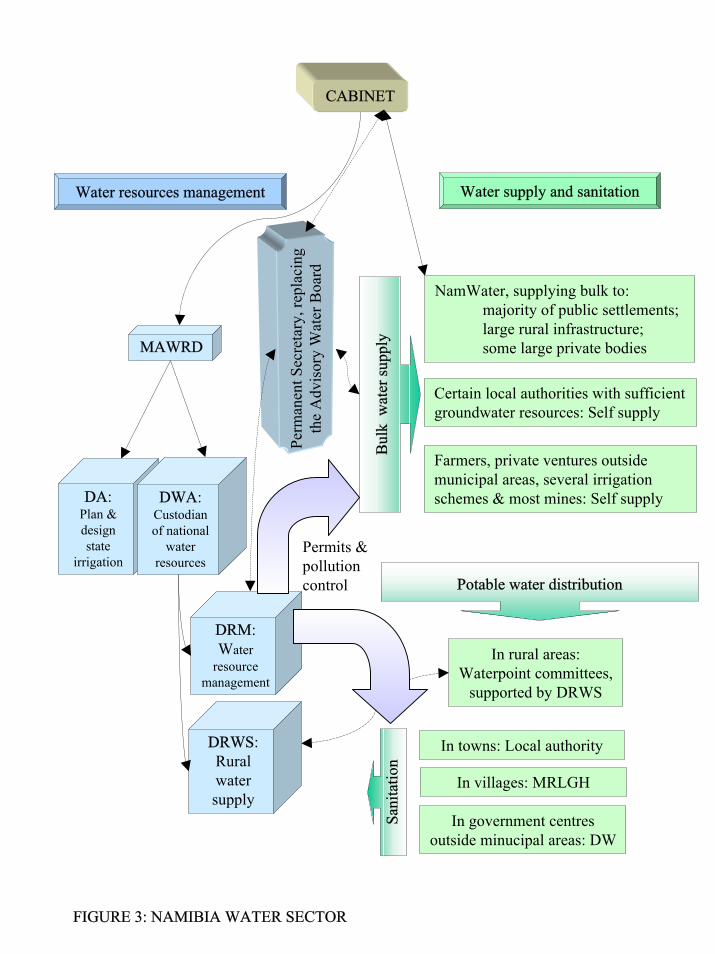
3.4 Institutional responsibilities The MAWRD, through the DWA, is responsible for water resources policy. The DWA is responsible to administer the Water Act and is thereby responsible for:
control over the conservation and utilisation of the natural water resources
planning, development, utilisation and management of the water resources
determination of tariffs, in consultation with the Government, for water supplied/distributed by the state
Since the Water Act makes the DWA the custodian of the country’s water resources, other ministries have to co-ordinate with the DWA where their line functions have an impact on the water resources.
The Water Act also enacts the Advisory Water Board, which previously advised the Minister on matters concerning the protection and utilisation of water resources and was responsible for the equitable allocation of and distribution of water between different consumer groups. In lieu of the preparation of the new water act, this function is now performed by the Permanent Secretary of the MAWRD.
A newly established government-owned parastatal organisation, Namibian Water Corporation (Pty) Ltd (NamWater) is responsible for bulk water supply.
Water Demand, Supply and Resource Development; Namibian and Botswanan Sectors
7
The Directorate of Rural Water Supply (DRWS) in the DWA is responsible for facilitating, co-ordinating and supporting rural communities, for them to secure, operate and maintain their own water supply in the rural areas.
Responsibilities for water distribution and sanitation are:
in proclaimed towns: the local municipality (local authority)
in villages: the Ministry of Regional and Local Government and Housing (MRLGH)
at government centres: Department of Works (DW) of the Ministry of Works, Transport and Communication (MWTC)
In some instances, bulk water is not supplied by NamWater and here the Local Authorities, the MRLGH and the DW, construct, operate and maintain their own water supply systems.
The Directorate of Agriculture (DA) in the MAWRD is responsible for irrigation planning and development on Government land, as well as the necessary extension services. It operates in accordance with the National Agricultural Policy of 1995.
Several private consumers, such as commercial stock farmers, irrigation developments, and mining and large industrial developers, provide in their own needs.
A simplified diagram that shows the major roles of the above organisations in the water sector is shown in Figure 3.
The Ministry of Health and Social Services and the health departments of local authorities are also involved in the water and sanitation sector where it concerns consumer health issues. This is being done in terms of the Health Act of 1920.
Water Demand, Supply and Resource Development; Namibian and Botswanan Sectors
8
Replacement page for Figure 3: Namibia water sector: government, parastatal and private involvement
Water Demand, Supply and Resource Development; Namibian and Botswanan Sectors
9
3.5 Sector policy A water supply and sanitation policy (WASP) for Namibia was approved in 1993 (DWA, 1993). In terms of this policy, affordable water supply and sanitation services should be made available to all Namibians in order to improve public health and hygiene, reduce the burden of collecting water, promote community based social development, support basic needs for subsistence and promote economic development. This equitable improvement of services should be the mutual responsibility of, and achieved by the combined efforts of the government and the beneficiaries. The beneficiaries should have the right, with due regard for environmental needs and the resources available, to determine which solutions and service levels are acceptable to them. Beneficiaries should contribute towards the cost of services at increasing rates for standards of living exceeding the levels required for providing basic needs.
The policy with regard to irrigation is that it should improve nutrition and surplus production at household level, improve sustainable national food self-sufficiency and promote economic development.
All development should be environmentally sustainable and utilisation of the water should be done in such a way that water is conserved and that water resources are protected against pollution.
In recognition of the water resources in Namibia being scarce, the WASP (DWA, 1993) stipulates the following priority ranking to the allocation of water where there are competing demands:
First priority: Water for domestic purposes, including livestock watering for both subsistence and commercial farming
Second priority: Water for economic activities such as mining, industries and irrigation. Priorities for these activities will in each individual case have to be determined by their respective value in relation to the overall development objectives and plans for the country.
A co-ordinating body for the large number of actors in water and sanitation sector in Namibia has been established, namely the National Water Supply and Sanitation Committee (WASCO), to resolve general sector issues and to determine priorities.
A World Bank/ UNDP/ GTZ sponsored review of the water sector in Namibia is currently taking place and it is expected that new policies will be forthcoming.
3.6 Water utilisation strategy and policies
3.6.1 Methodology of water demand estimation Various methods of water demand estimation are in use in Namibia, the selection of which depend on the level of investigation, be it on the national or project level, and on the availability of historic data and firm development plans. Since the focus in this report is on water demand from the Okavango River, the methodologies as were employed by WTC (1997) during its investigation into water transfer from the Okavango River, are listed below. WTC (1997) divided the consumers into different categories and applied one or a combination of the following methods to each of the categories:
regression analyses (linear, power or exponential extrapolations) where historic data was available
projections based on planned development programmes, where reliable information was available to calculate anticipated future water demands
growth rate projections, based on anticipated population structure and growth
Water Demand, Supply and Resource Development; Namibian and Botswanan Sectors
10
The demand categories that were adopted by WTC (1997) are:
Major urban centres, which are those run by autonomous local authorities (municipalities) and for which the following subcategories were applied:
Squatters
Formal domestic
Commercial and industrial
Distribution losses
Minor urban centres which provide basic shopping, schooling and health care facilities and which have been classified as Towns in terms of the Local Authorities Act (Act 23 of 1992)
Rural villages, which are all other settlements not included in the previous two categories
Government centres, which are outside municipal areas and essentially run by Government, such as airports and military bases.
Mines
Agriculture, being subdivided into irrigation and commercial livestock farming
Stock watering, which applies to livestock in communal areas that is served by State watering points
Wildlife and tourism, which allows for game parks, tourist resorts and nature conservation research centres
Small consumers, which lumps together all other sundry abstractions from existing state water schemes
Rundu to Grootfontein en route rural consumers
Production losses due to water production and bulk transmission (distribution losses were included with the above categories)
3.6.2 Water supply planning National planning, and planning of rural water supply and distribution, is the responsibility of the DWA. The suppliers of bulk water, namely NamWater and organisations that provide in their own needs such as mines, some local authorities and other private organisations, are responsible for their own resource and scheme planning. However, the bulk water suppliers require permits from DWA to impound water or to abstract water from water controlled areas. The DWA therefore has to be involve in their planning.
National planning of water resources is important, since future water demand cannot be met in all centres of Namibia by local sources and additional sources from further away have to be developed for this purpose.
3.6.3 Conservation policies and activities The Constitution of the Republic of Namibia states Namibia’s fundamental concern for environmental issues and prevention of degradation of national resources. Some specific conservation policies and activities are presented below.
3.6.3.1 Protection of Water Sources It is the task of the DWA to ensure that environmental management is carefully considered in the planning, design and operation of water supply schemes to avoid unnecessary conflict between development and conservation objectives. A variety of controls has therefore been put in place by the DWA to protect surface and groundwater sources from over-exploitation. Further strengthening of these measures is recommended in order to pro-actively guide and regulate the ever-growing consumer demands and pressures on the limited resources, both in terms of quantity and quality. These may be forthcoming from the water sector review that is currently taking place in Namibia.
Water Demand, Supply and Resource Development; Namibian and Botswanan Sectors
11
3.6.3.2 Public awareness Heyns (1995 b) reports that the DWA and local authorities like the City Council of Windhoek have been actively promoting a water awareness amongst the public through:
dissemination of information about water availability, consumption and misuse
advice on water conservation measures
encouragement of public participation in reducing water demand
improvement of efficiency and financial accountability for water supplied
3.6.3.3 Environmental management Apart from the DWA’s position as water resources custodian, the Ministry of Environment and Tourism (MET) is also overall responsible for environmental management and has drawn up a set of relevant policy documents. The governing Environmental Management Act, as was previously mentioned, is currently under preparation.
3.6.3.4 Water pollution control The DWA requires from all bodies that generate effluent to acquire permits therefor and to treat the effluent to acceptable standards, before discharge to the environment. Such permits have to be renewed every five years. The DWA regularly inspects the water care works for compliance with the permit conditions.
3.6.3.5 Water re-use and reclamation Re-use of treated sewage effluent for irrigation of town parks is practised by several municipalities in the country, and in Windhoek the advanced reclamation plant returns effluent directly to the potable water supply system.
It is outside the scope of this report to comment on the sufficiency of these measures and they are merely noted to demonstrate the awareness that exists regarding them.
3.6.4 Water demand management strategies Following the recent droughts in Namibia and the severe water shortages that the capital, Windhoek was faced with, persevered water demand management strategies were applied in the city. These included public awareness campaigns, steep tariff increases in higher demand categories, promoting and regulating more water-efficient domestic appliances and other measures.
A comprehensive coverage of water demand management strategies is given by WTC (1997).
3.6.5 Decision-making guidelines and policies A First National Development Plan (NDP1) has been drawn up for Namibia for the period 1995/96-1999/2000 (NPC, 1995), which provides directives for national development. This NDP1 also makes provision for the production of a master water plan that reflects the development objectives set out in the NDP1. The water master plan still has to be produced.
Water Demand, Supply and Resource Development; Namibian and Botswanan Sectors
12
3.6.6 Payment for water (tariffs, tariff structures & payment responsibilities) Each institution responsible for water supply and reticulation determines its own water tariffs, which are to ensure self-sustainability. The more important role players in this field are: Municipalities, responsible for water distribution and in some cases for bulk water supply: Tariffs are
determined by the responsible local authority council and in most cases, approved by the MRLGH. Local authority councils are to be financially self-supporting and have to charge for water on a basis of full cost recovery. The WASP recommends the following: A low price for a defined minimum lifeline volume of water and progressively increasing rates
for increased consumption (with higher volume users subsidising lower volume users). Rates for commercial enterprises and industries that as far as possible recover the full financial
cost of water supply. Immediate recovery of investment costs for local distribution infrastructure to erven, through
inclusion in the erven price of such erven. Administrative approval by the Minister of MAWRD, in order to ensure that they will comply
with government policy and that any adjustments in tariffs or tariff structures are warranted and reasonable (this policy has not been applied yet).
Payment for water should be enforced. For the few who still cannot afford to pay for water, assistance can be given from a social security vote. The latter is to be provided for by the authority responsible for these social services in any specific urban area, rather than to circumvent the revenue collection system.
NamWater, responsible for bulk water supply to most consumers in Namibia: Tariffs are determined by the NamWater Board, in consultation with the Minister of the MAWRD. NamWater is to be financially self-supporting and has to charge for water on a basis of full cost recovery, wherever supplied. At the moment, tariffs lag behind the full cost recovery level and deficits are made up from the Government over a transitional period within which NamWater gradually has to increase tariffs until they reache the level of full cost recovery. In areas where the communities cannot afford to pay full cost, or at irrigation projects that warrant special subsidy due to their socio-economic benefits, Government will consider subsidisation of the consumers instead of the water supply authority.
Government, facilitating and supporting rural water supply in conjunction with Regional Authorities:
Tariffs are scheme specific and determined by Government to reflect the level of service required by each community. Initially, tariffs will be gradually increased to where operations and maintenance costs are recovered and eventually to where full cost recovery is achieved. For new schemes, the communities provide an input to lower the capital cost requirements for such a scheme and to provide for own operation and basic maintenance. Apart from participation in the establishment of new schemes, rural communities do not yet pay for water themselves. DRWS pay on their behalf. However, Cabinet has resolved that 25% of the full tariff will be levied from the consumers as from 1 August 1998. This level of recovery will gradually increase until full cost is recovered.
It is stated in WTC (1997) though, that the WASP is vague in respect of tariffs to be charged to end consumers. It proposes that a more prescriptive tariff policy be formulated, using the WASP policy, principles accepted by the International Water Supply Association, Windhoek municipal tariff structures and the draft National Water Supply Regulations of South Africa as starting points.
Water Demand, Supply and Resource Development; Namibian and Botswanan Sectors
13
3.7 Water consumption and demand
3.7.1 Water demand of the natural environment, excluding the human environment
3.7.1.1 Physical environment Two subcategories of water demand can be considered, namely where water maintains the physical integrity of the land, and the water that is lost due to evaporation and seepage.
Quantification of these demands falls outside the scope of this report and is considered to form part of the studies relating to hydrology, geohydrology and environmental impact assessments.
3.7.1.2 Fauna and flora The water demand of natural habitats that needs to be preserved is not readily quantifiable and is the subject of other studies in this programme.
3.7.2 Water demand of the human environment Water demands of interest here are those that exist
along the Okavango River
in the central areas of Namibia that may want to draw supplementary water from the Okavango River
for Namibia as a whole
Demands for each of these are reported in DWA (1998), WTC (1997) and DWA (1997) respectively and the results are summarised below.
3.7.2.1 Wildlife and tourism Although wildlife is part of the demand of the natural environment, an aspect thereof is singled out here and grouped with tourism. The reason is that in game parks, there is water supply to both tourist centres and artificial wildlife watering points. The wildlife water demand that is satisfied from natural surface water sources though, forms part of the natural environment demand and is not addressed here.
Wildlife and tourism demand along the Okavango River is not specifically reported on in DWA (1998). This report is presently in its draft form only and has not been finalised yet. It is therefore recommended that the wildlife and tourism water demand be included in the final version of this report. A list of established tourist destinations along the river between Rundu and Mohembo, and their water demands, are summarised by WTC (1997), along with other users. The demands for the tourism sector need to be separated from this list, supplemented with information regarding the river section upstream of Rundu and then projected to establish potential future water demands.
In the central area of Namibia, the more prominent game parks and tourist destinations are Daan Viljoen Park near Windhoek, Von Bach Dam and Gross Barmen near Okahandja and Waterberg Plateau Park near Otjiwarongo. The total 1995 water consumption for these parks has been metered as 153 000 m3. Future demand is estimated by escalation of this value by 1%, 2% and 3% per annum for the low, expected and high demand scenarios respectively. Projected values are presented in detail in WTC (1997) and are summarised in Table 1 of this report.
At national level, DWA (1997) estimates the water demand for the tourism sector by number of average number tourists and average duration of stay, rather than by resort. The results of the water demand projections that correspond with the projected growth in the number of tourists, are summarised in Table 1.
3.7.2.2 Domestic demands, including industry, commerce and institutions DWA (1998) estimates the 1997 urban and rural population along the Okavango River as 37 000 and 91 000 respectively. The urban population lives in Rundu, while the rural population is spread out along the 415 km stretch of river in Namibia. Water demand for Rundu was estimated in a dedicated DWA planning report and includes the industrial, commercial, institutional and other sectors, as well, as losses.
Water Demand, Supply and Resource Development; Namibian and Botswanan Sectors
14
Water demand for the rural population was estimated, using the unit water demand norm of 30 l/c.d. This is taken to include for small-scale economic activities along the river. Results are summarised in Table 1. No allowance is made for significant industrial development along the river up to 2012.
In the central area of Namibia, domestic water demands are projected by WTC (1997) as explained before. The results are summarised in Table 1.
Demand estimates on the national level for domestic consumers were based on population projections by administrative region, and the results are summarised in Table 1.
3.7.2.3 Mines There are currently no mines along the Okavango River, but several mines are in operation elsewhere in Namibia. In the central area of Namibia, there are mining operations at Tsumeb, Kombat, Okaruso, Navachab and Otjihase. Except for the Navachab mine, which is supplied from the Swakoppoort Dam, the full demand of the other mines is met from local groundwater sources. Reasons for inclusion of these mines in the central area of the country is for its surplus water production, which can be exported to other centres where there are shortages. Details of water demands by these mines are presented in WTC (1997). The mining water demand as projected for the country as a whole, is presented in DWA (1997). The results from both these references are summarised in Table 1.
3.7.2.4 Livestock The cattle industry in both the commercial and subsistence contexts is one of the major industries in the country and the water demand of this sector is therefore important. DWA (1998) reports that the estimated 1997 cattle, goat and horse populations along the Okavango River are about 93 750, 27 500 and 920 respectively. The same report estimates the water demand for these livestock as 1,67 Mm3/a and expects that this level will be maintained throughout the planning period, until 2012.
Water demand for livestock in the central area and countrywide, as respectively estimated by WTC (1997) and DWA (1997), is shown in Table 1.
3.7.2.5 Irrigation and forestry Both small-scale irrigation for household purposes by the local population and commercial irrigation by government, parastatal and private organisations takes place along the Okavango River:
The small-scale irrigation is estimated to take 1 Mm3/a from the river (WTC, 1997).
For commercial irrigation, permits have been issued that, when fully utilised, will use about 14 Mm3/a from the river. However, irrigation land has not yet been development to its permitted extent and it is estimated that the present utilisation is 4,3 Mm3/a (DWA, 1998).
In the central area, apart from the 1 ha irrigation that each commercial farmer has as standard irrigation allowance, larger scale commercial irrigation also take place at
Kombat, using groundwater that is pumped by the mine to keep mine workings dry
Otavi fountain
Otjikoto and Guinas lakes
Small-holdings north of Tsumeb, drawing on shallow groundwater in the area
All these irrigation lands draw on local water and do not require importation. They are, however, included in the central area, since this local water is also looked at for export to other centres where shortages exist.
Water demand for irrigation in the central area and countrywide, as respectively estimated by WTC (1997) and DWA (1997), is presented in Table 1.
3.7.2.6 Losses WTC (1997) reports the present distribution losses for major towns in the central area of Namibia as varying between 7 % and 13 %. In its water demand projections, it has assumed that these figures will
Water Demand, Supply and Resource Development; Namibian and Botswanan Sectors
15
change to between 8 % and 10 %. These distribution losses have been included in the water demand figures of the preceding water demand categories.
Water production and transmission losses may be considered as included in the projections for consumers along the Okavango and in Namibia as a whole. In the WTC (1997) projections for the central area of Namibia, however, these losses were considered separately. It was allowed for in the systems analyses rather than in the demands, because the losses vary from component to component in different stages of the water production and transfer system.
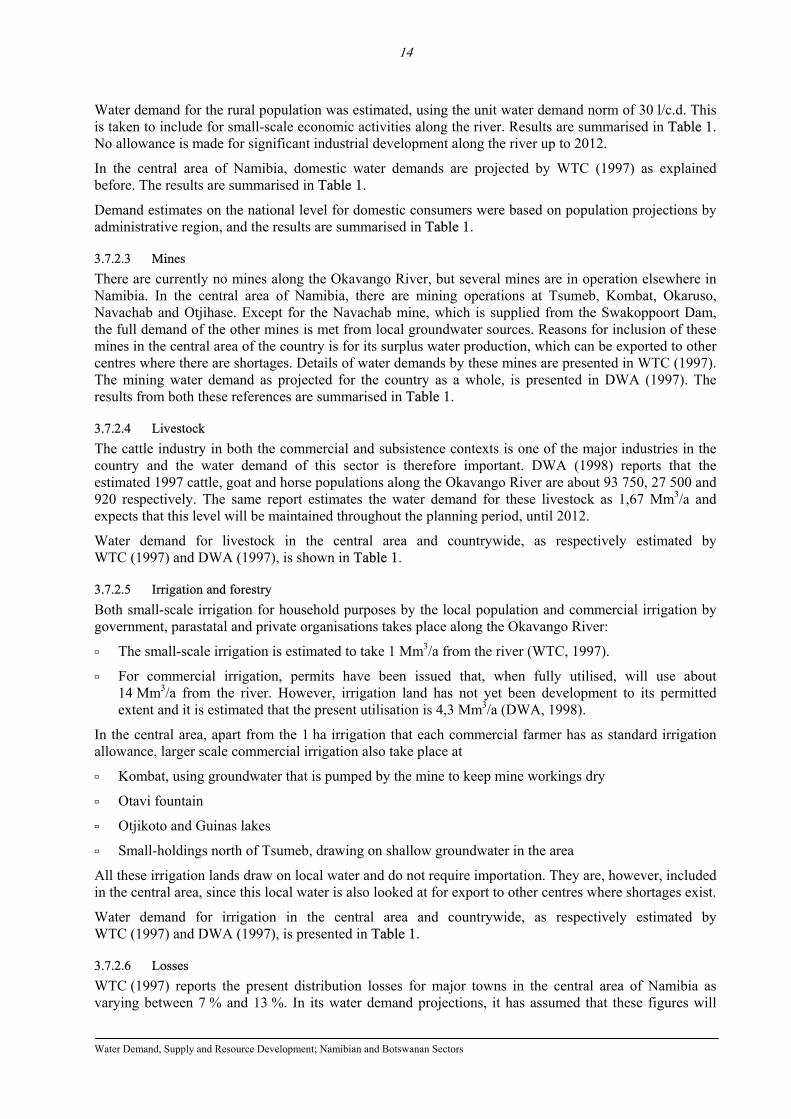
3.7.3 Aggregated demand The water demand as established and projected in DWA (1998) for the land along the Okavango River, in WTC (1997) for the central area of Namibia, and from DWA (1997) for the country as a whole, is summarised in Table 1 and in Figure 4.
Table 1: Total water demands along the Okavango River, in the central area and countrywide
Water demand (Mm3/a) Along Okavango
(DWA, 1998) In central area (WTC, 1997)
Countrywide (DWA, 1997) Category
1997 2012 1996 2012 1996 2012 Wildlife and tourism not stated not stated 0,15 0,21 0,74 1,62 Urban (all inclusive) 1,84 5,90 26,26 41,25 67,90 108,96 Rural domestic 0,33 1,56 0,17 0,28 13,10 21,02 Mines 0,00 0,00 6,53 7,74 20,00 30,00 Livestock 1,40 1,67 3,41 3,68 42,18 49,46 Irrigation 4,30 39,42 4,91 6,45 137,03 212,03 DEMAND TOTAL (Rounded) 8 49 41 60 281 423
Figure 4: Water demand in Namibia
94941
60
281
423
0
50
100
150
200
250
300
350
400
450
96/97 2012Year
Wat
er d
eman
d (M
m3/
a)
Along Okavango
Supp
lem
enta
tion
requ
ired
from
rem
ote
sour
ces
In central area
Countrywide
Water Demand, Supply and Resource Development; Namibian and Botswanan Sectors
16
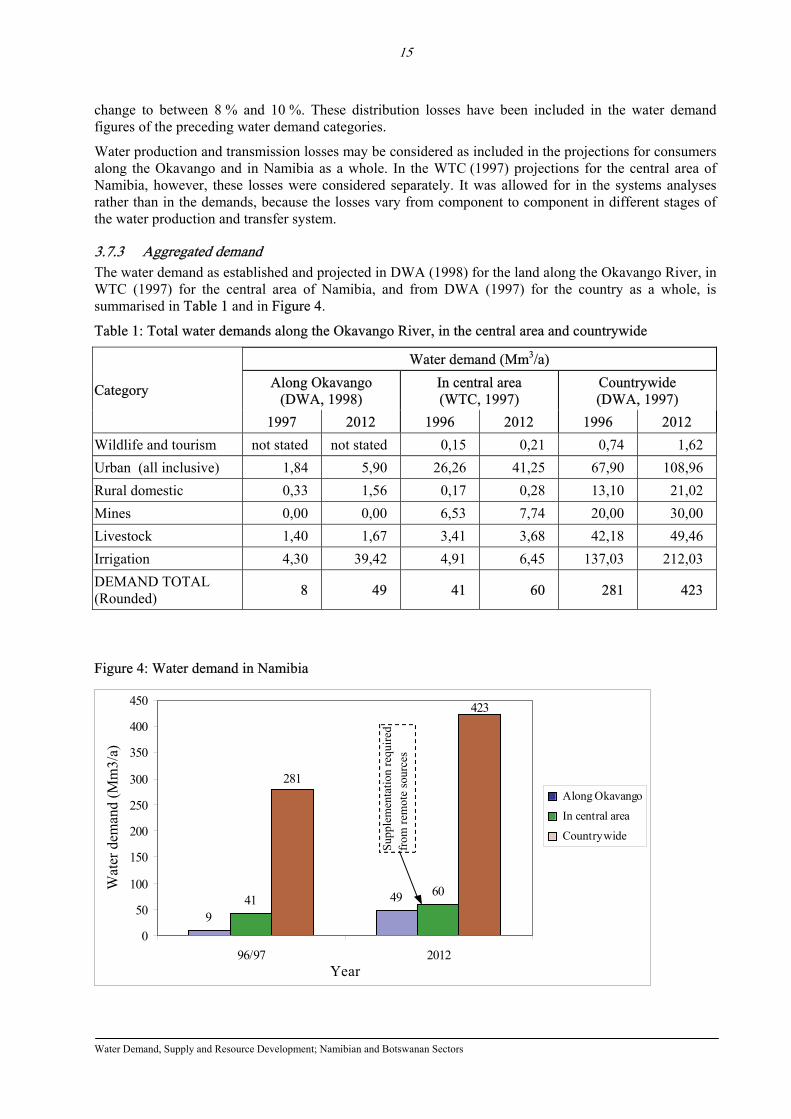
In another report, prepared by the Hatutale (1994) for the Hydrology Division of DWA, a different set of estimates for future water demand along the Okavango River are presented. These are reproduced in Table 2 below.
Table 2: Water demand along the Okavango River in Namibia, according to Hatutale (1994)
Water demand along the Okavango River (Mm3/a) 1995 2005 2020 Category
Low High Low High Low High Domestic 2,943 2,966 3,698 3,964 4,831 6,125 Livestock 0,205 0,205 0,205 0,205 0,205 0,205 Irrigation 20 20 36 72 60 150 Total 23,15 23,17 39,90 76,17 65,04 156,33
3.7.4 Water use efficiency Evaluation of wasteful usage in the water sector requires in-depth investigations into the water use of individual large consumers and to aggregated groups of smaller consumers. Such evaluations are available to varying degrees for Windhoek and some other major urban centres in the country and are presented in different reports, such as WTC (1997), JVC (1996) and Alexander & Becker (1998). It is shown in WTC (1997) that certain urban centres in Namibia, especially where excess water is locally available and priced low, water is used in abundance. In most urban centres though, and especially in Windhoek where demand management have been put in place, water is on average used sparingly and water demand projections have anticipated that water use efficiency will further improve as time progresses. More work is, however required if the water use efficiency is to be assessed and improved countrywide.
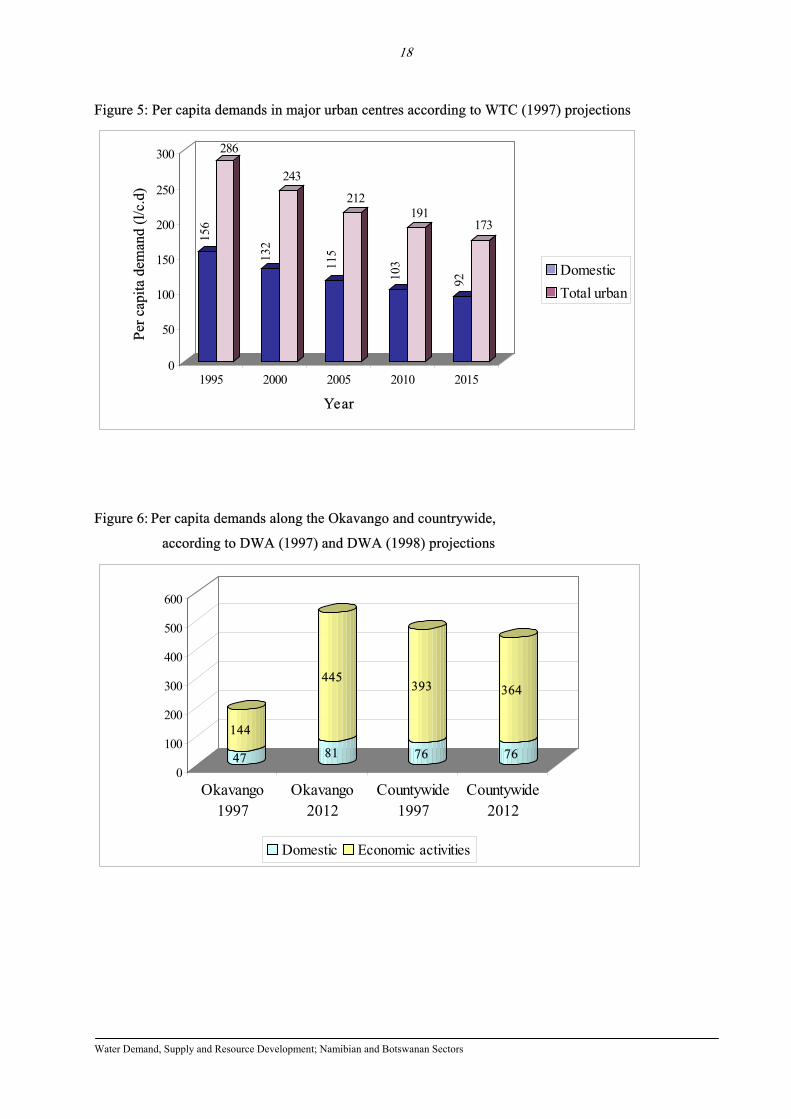
3.7.5 Per capita use of water In WTC (1997) the total population for the project area is not stated. Only the populations for the major urban centres are given. Unit demands that result from that projection can therefore be assessed for the major urban centres only. These are summarised in Table 3 and presented in Figure 5.
Table 3: Per capita demands in major urban centres as per WTC (1997) projections
Per capita demand (l/c.d) Per capita demands in major urban centres 1995 2000 2005 2010 2015
Domestic 156 132 115 103 92 All urban uses 286 243 212 191 173
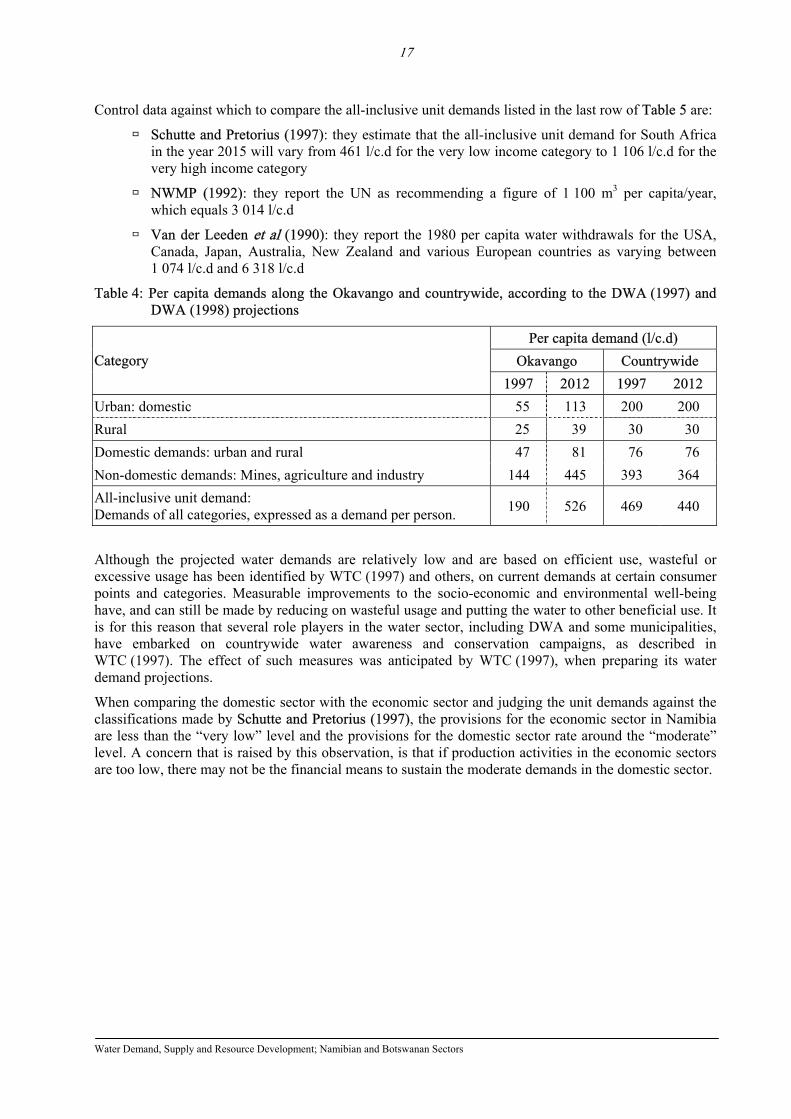
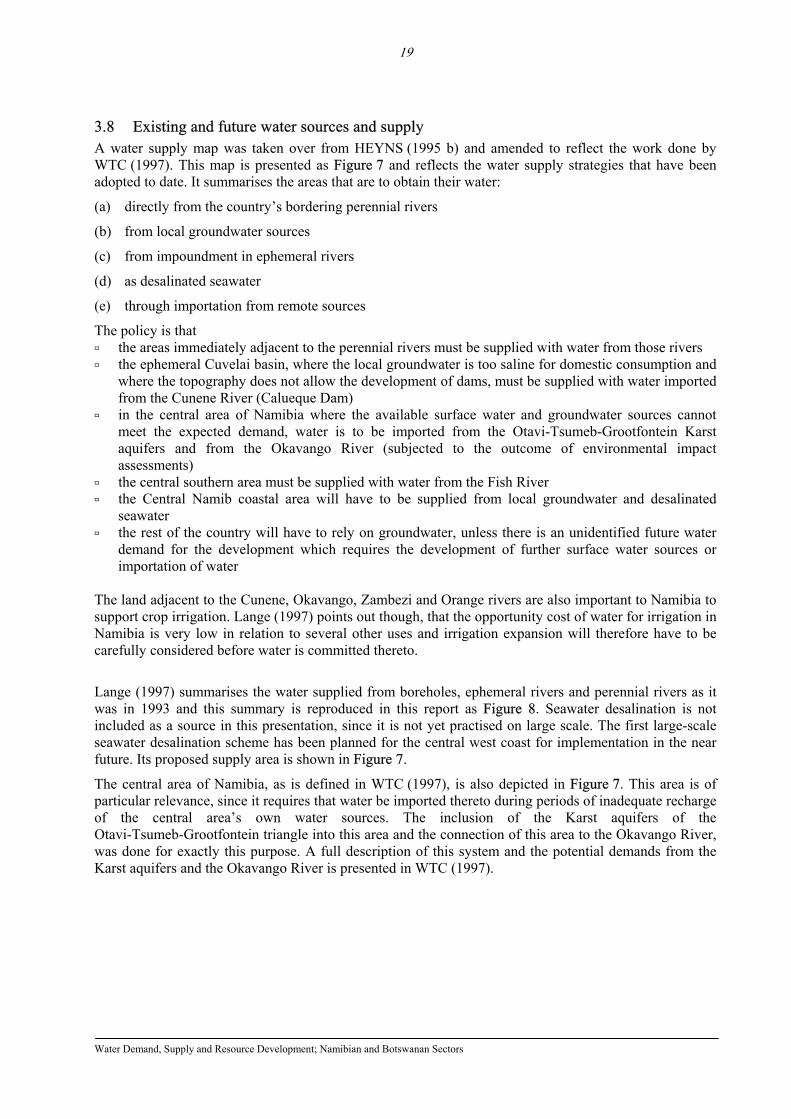
The per capita demands that are derived when using the DWA (1998) projections for demands along the Okavango River and the DWA (1997) projections for demands in the central area, are summarised in Table 4 and presented in Figure 6. The 2012 unit demand for the urban domestic sector in the Okavango area, as presented in Table 4, is similar to that used for the central area, as presented in Table 3. These figures compare to what Schutte and Pretorius (1997) would classify for South Africa as a low to moderate demand level. The countrywide figure, however, is much higher and compares to what Schutte and Pretorius (1997) would classify for South Africa as a moderate to high demand level. The all-inclusive per capita demands as presented in Table 4, compare to the Schutte and Pretorius (1997) classification for the very low to low demand level.
Water Demand, Supply and Resource Development; Namibian and Botswanan Sectors
17
Control data against which to compare the all-inclusive unit demands listed in the last row of Table 5 are:
Schutte and Pretorius (1997): they estimate that the all-inclusive unit demand for South Africa in the year 2015 will vary from 461 l/c.d for the very low income category to 1 106 l/c.d for the very high income category
NWMP (1992): they report the UN as recommending a figure of 1 100 m3 per capita/year, which equals 3 014 l/c.d
Van der Leeden et al (1990): they report the 1980 per capita water withdrawals for the USA, Canada, Japan, Australia, New Zealand and various European countries as varying between 1 074 l/c.d and 6 318 l/c.d
Table 4: Per capita demands along the Okavango and countrywide, according to the DWA (1997) and DWA (1998) projections
Per capita demand (l/c.d) Okavango Countrywide Category
1997 2012 1997 2012 Urban: domestic 55 113 200 200 Rural 25 39 30 30 Domestic demands: urban and rural 47 81 76 76 Non-domestic demands: Mines, agriculture and industry 144 445 393 364 All-inclusive unit demand: Demands of all categories, expressed as a demand per person. 190 526 469 440
Although the projected water demands are relatively low and are based on efficient use, wasteful or excessive usage has been identified by WTC (1997) and others, on current demands at certain consumer points and categories. Measurable improvements to the socio-economic and environmental well-being have, and can still be made by reducing on wasteful usage and putting the water to other beneficial use. It is for this reason that several role players in the water sector, including DWA and some municipalities, have embarked on countrywide water awareness and conservation campaigns, as described in WTC (1997). The effect of such measures was anticipated by WTC (1997), when preparing its water demand projections.
When comparing the domestic sector with the economic sector and judging the unit demands against the classifications made by Schutte and Pretorius (1997), the provisions for the economic sector in Namibia are less than the “very low” level and the provisions for the domestic sector rate around the “moderate” level. A concern that is raised by this observation, is that if production activities in the economic sectors are too low, there may not be the financial means to sustain the moderate demands in the domestic sector.
Water Demand, Supply and Resource Development; Namibian and Botswanan Sectors
18
Figure 5: Per capita demands in major urban centres according to WTC (1997) projections
156
286
132
243
115
212
103
191
92
173
0
50
100
150
200
250
300Pe
r cap
ita d
eman
d (l/
c.d)
1995 2000 2005 2010 2015
Year
DomesticTotal urban
Figure 6: Per capita demands along the Okavango and countrywide,
according to DWA (1997) and DWA (1998) projections
47
144
81
445
76
393
76
364
0
100
200
300
400
500
600
Okavango1997
Okavango2012
Countywide1997
Countywide2012
Domestic Economic activities
Water Demand, Supply and Resource Development; Namibian and Botswanan Sectors
19
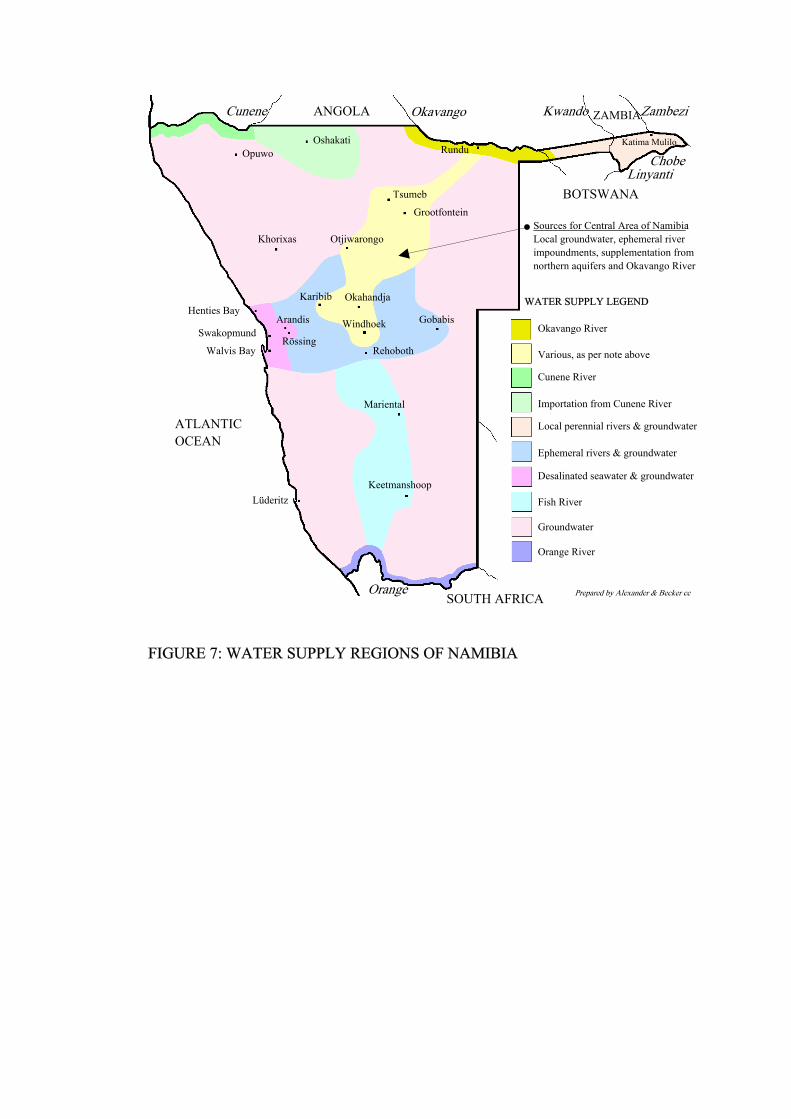
3.8 Existing and future water sources and supply A water supply map was taken over from HEYNS (1995 b) and amended to reflect the work done by WTC (1997). This map is presented as Figure 7 and reflects the water supply strategies that have been adopted to date. It summarises the areas that are to obtain their water:
(a) directly from the country’s bordering perennial rivers
(b) from local groundwater sources
(c) from impoundment in ephemeral rivers
(d) as desalinated seawater
(e) through importation from remote sources
The policy is that the areas immediately adjacent to the perennial rivers must be supplied with water from those rivers the ephemeral Cuvelai basin, where the local groundwater is too saline for domestic consumption and
where the topography does not allow the development of dams, must be supplied with water imported from the Cunene River (Calueque Dam)
in the central area of Namibia where the available surface water and groundwater sources cannot meet the expected demand, water is to be imported from the Otavi-Tsumeb-Grootfontein Karst aquifers and from the Okavango River (subjected to the outcome of environmental impact assessments)
the central southern area must be supplied with water from the Fish River the Central Namib coastal area will have to be supplied from local groundwater and desalinated
seawater the rest of the country will have to rely on groundwater, unless there is an unidentified future water
demand for the development which requires the development of further surface water sources or importation of water
The land adjacent to the Cunene, Okavango, Zambezi and Orange rivers are also important to Namibia to support crop irrigation. Lange (1997) points out though, that the opportunity cost of water for irrigation in Namibia is very low in relation to several other uses and irrigation expansion will therefore have to be carefully considered before water is committed thereto.
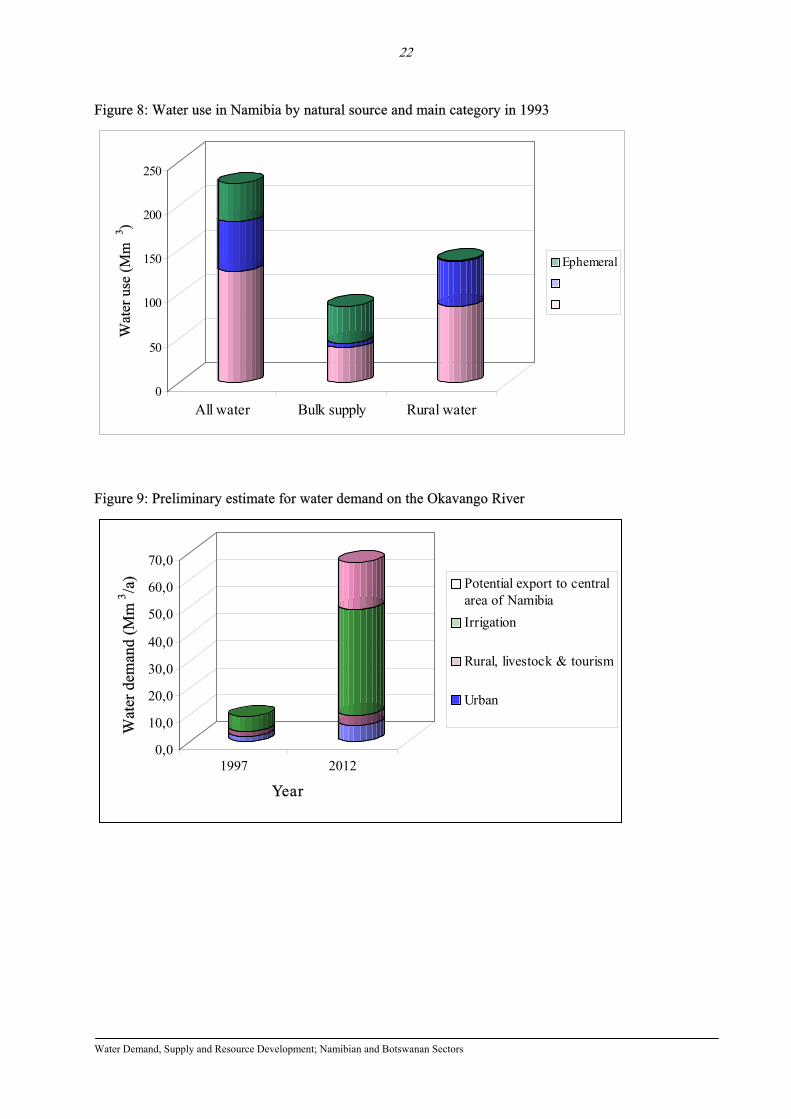
Lange (1997) summarises the water supplied from boreholes, ephemeral rivers and perennial rivers as it was in 1993 and this summary is reproduced in this report as Figure 8. Seawater desalination is not included as a source in this presentation, since it is not yet practised on large scale. The first large-scale seawater desalination scheme has been planned for the central west coast for implementation in the near future. Its proposed supply area is shown in Figure 7.
The central area of Namibia, as is defined in WTC (1997), is also depicted in Figure 7. This area is of particular relevance, since it requires that water be imported thereto during periods of inadequate recharge of the central area’s own water sources. The inclusion of the Karst aquifers of the Otavi-Tsumeb-Grootfontein triangle into this area and the connection of this area to the Okavango River, was done for exactly this purpose. A full description of this system and the potential demands from the Karst aquifers and the Okavango River is presented in WTC (1997).
Water Demand, Supply and Resource Development; Namibian and Botswanan Sectors
20
Replacement page for Figure 7: Water supply regions of Namibia
Water Demand, Supply and Resource Development; Namibian and Botswanan Sectors
21
3.9 Demand on Okavango River water Demand for water from the Okavango River in Namibia can be grouped into the demands of man and natural environment along the river and demands for transportation to the central area of Namibia.
Importation requirements by the central area from the Okavango River vary, depending on the water levels in the inland dams and on the amount of water that can be imported from the Karst aquifers. The likely transfer requirements are extensively described and quantified in WTC (1997). The recommended capacity of the water transfer infrastructure from the Okavango River to cope various deficit scenarios until 2012, is 17,3 Mm3/a.
Estimates of future demand along the river are incomplete and further work is required to quantify such demands for each prominent consumer category and for each main section of the river. The main river sections are:
Section 1: From first entry into Namibia to the Rundu gauging station
Section 2: From Rundu gauging station to confluence with Cuito River (including Rundu)
Section 3: From the Cuito River confluence to Mukwe gauging station
Section 4: From Mukwe gauging station to Mohembo gauging site (near the Botswana border)
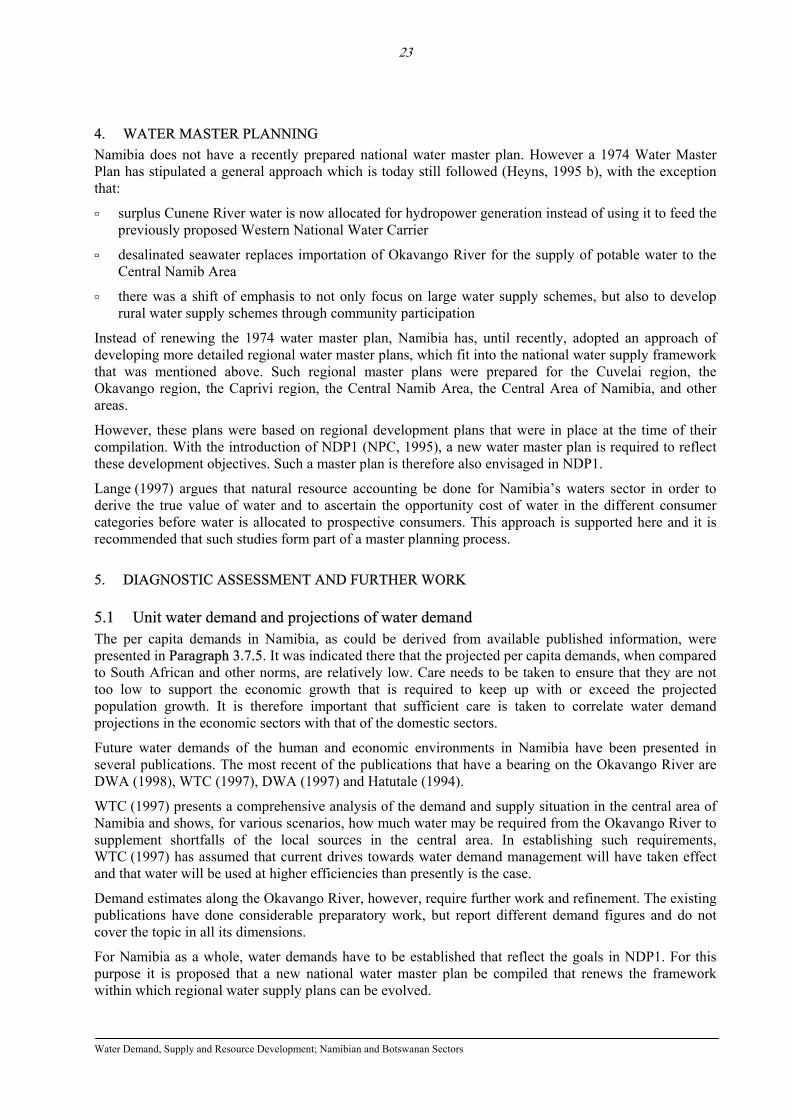
Present (1996/97) demands along this river are reported on in Volume 4, Part 3, Appendix A of WTC (1997). This information is summarised in Table 5 below. These demands differ from those estimated in DWA (1998) (see Table 2) and further work is required to resolve the differences and other outstanding aspects of the water demand estimates. By using the information contained in DWA (1998) and WTC (1997), a preliminary estimate for Namibian demands on the Okavango River is presented in Figure 9.
Table 5: Water demands along main sections of the Okavango River in Namibia
SECTION A: 1996/97 WATER ABSTRACTION ALONG THE RIVER (Mm3/a)
River section in Namibia Direct from Okavango River
From boreholes near the Okavango River
From first entry into Namibia to the Rundu gauging station
0,001 0,016
From Rundu gauging station to confluence with Cuito River (incl. Rundu)
4,158 0,231
From the Cuito River confluence to Mukwe gauging station
0,858 0,014
From Mukwe gauging station to Mohembo gauging site near the Botswana border
0,061 0,002
TOTAL 5,078 0,263 SECTION B: WATER COMMITTED FOR DOMESTIC USE AND IN IRRIGATION PERMITS (Mm3/a)
Category Direct from Okavango River
From boreholes near the Okavango River
Domestic 4,153 0,488 Irrigation 13,223 TOTAL 17,376 0,488
Water Demand, Supply and Resource Development; Namibian and Botswanan Sectors
22
Figure 8: Water use in Namibia by natural source and main category in 1993
Figure 9: Preliminary estimate for water demand on the Okavango River
0,0
10,0
20,0
30,0
40,0
50,0
60,0
70,0
Wat
er d
eman
d (M
m3 /a
)
1997 2012
Year
Potential export to centralarea of NamibiaIrrigation
Rural, livestock & tourism
Urban
PerennialGround
0
50
100
150
200
250
Wat
er u
se (M
m3 )
All water Bulk supply Rural water
Ephemeral
Water Demand, Supply and Resource Development; Namibian and Botswanan Sectors
23
4. WATER MASTER PLANNING Namibia does not have a recently prepared national water master plan. However a 1974 Water Master Plan has stipulated a general approach which is today still followed (Heyns, 1995 b), with the exception that:
surplus Cunene River water is now allocated for hydropower generation instead of using it to feed the previously proposed Western National Water Carrier
desalinated seawater replaces importation of Okavango River for the supply of potable water to the Central Namib Area
there was a shift of emphasis to not only focus on large water supply schemes, but also to develop rural water supply schemes through community participation
Instead of renewing the 1974 water master plan, Namibia has, until recently, adopted an approach of developing more detailed regional water master plans, which fit into the national water supply framework that was mentioned above. Such regional master plans were prepared for the Cuvelai region, the Okavango region, the Caprivi region, the Central Namib Area, the Central Area of Namibia, and other areas.
However, these plans were based on regional development plans that were in place at the time of their compilation. With the introduction of NDP1 (NPC, 1995), a new water master plan is required to reflect these development objectives. Such a master plan is therefore also envisaged in NDP1.
Lange (1997) argues that natural resource accounting be done for Namibia’s waters sector in order to derive the true value of water and to ascertain the opportunity cost of water in the different consumer categories before water is allocated to prospective consumers. This approach is supported here and it is recommended that such studies form part of a master planning process.
5. DIAGNOSTIC ASSESSMENT AND FURTHER WORK
5.1 Unit water demand and projections of water demand The per capita demands in Namibia, as could be derived from available published information, were presented in Paragraph 3.7.5. It was indicated there that the projected per capita demands, when compared to South African and other norms, are relatively low. Care needs to be taken to ensure that they are not too low to support the economic growth that is required to keep up with or exceed the projected population growth. It is therefore important that sufficient care is taken to correlate water demand projections in the economic sectors with that of the domestic sectors.
Future water demands of the human and economic environments in Namibia have been presented in several publications. The most recent of the publications that have a bearing on the Okavango River are DWA (1998), WTC (1997), DWA (1997) and Hatutale (1994).
WTC (1997) presents a comprehensive analysis of the demand and supply situation in the central area of Namibia and shows, for various scenarios, how much water may be required from the Okavango River to supplement shortfalls of the local sources in the central area. In establishing such requirements, WTC (1997) has assumed that current drives towards water demand management will have taken effect and that water will be used at higher efficiencies than presently is the case.
Demand estimates along the Okavango River, however, require further work and refinement. The existing publications have done considerable preparatory work, but report different demand figures and do not cover the topic in all its dimensions.
For Namibia as a whole, water demands have to be established that reflect the goals in NDP1. For this purpose it is proposed that a new national water master plan be compiled that renews the framework within which regional water supply plans can be evolved.
Water Demand, Supply and Resource Development; Namibian and Botswanan Sectors
24
5.2 Water supply balances For the purpose of integrated catchment management, it is important to link consumers and their water demands with their associated river catchments and aquifers. This will enable the evaluation of the local demands on each of the river and groundwater systems and the need for inter-basin transfers. This in turn will enable improved basin management and provide the information needed for water use agreements and equitable distribution.
It is proposed that for the each of the major catchments outlined in Figure 2 and for the major aquifer systems, there be water balances prepared that show for that region:
extent of presently developed water sources and surplus potential
current demands per demand category
projected demands that reflect regional and national development plans
allocation of sources to demand categories, based on the social value and full opportunity cost of water
This work should form an integral part of the proposed national water master plan.
5.3 Role of the Okavango River as a source for water supply The Okavango River, as existing source for water supply to the local population, commercial irrigation and tourism and as potential source to the central areas of Namibia, has long been targeted for these purposes. Several developments towards abstracting water for such purposes have taken place, such as construction of the first phases of Namibia’s Eastern National Water Carrier. When seen in isolation, these planned developments seemed to be small in relation to the total discharge of the river. However, when other basin countries embark on similar utilisation strategies and developments keep escalating, the source may well end up over-utilised and valuable natural environments may be lost forever. The role of the Okavango River as source of water supply in its international context and then in its national context, therefore has to be clearly defined by all involved.
As can be seen from Figure 9, the current and potential future irrigation demands along the river dominate the water demand figures. Prioritisation of the status of potential irrigation developments at the Okavango River against other competing consumers and interests are therefore of great importance.
Along with defining the role of the Okavango River as source for water supply, other relevant issues regarding its utilisation include:
effective control over the both quantity of water abstraction and quality of discharged effluent
measures to prevent leaching of nutrients and pesticides from irrigation lands into the river
5.4 Okavango River consumer register A register of existing users of the Okavango River water that describe their location, methods of water production, methods of wastewater disposal, purpose of use and quantities used, is necessary to:
put the established claims to Okavango River water in perspective
evaluate the implications of allowing new consumers access to the source
exercise pollution control supervision
Certain elements of these have already been surveyed for the DWA and it is recommended that this information be supplemented where insufficient and incorporated in the Okavango Basin management portfolio.
Water Demand, Supply and Resource Development; Namibian and Botswanan Sectors
25
5.5 Seawater Since desalination of seawater is seen as an environmentally friendly alternative to the utilisation of Okavango River water, research into methods of lower energy consumption in seawater desalination and improved harvesting of naturally supplied energies, is important. Initiation and funding of such research is recommended.
5.6 Legislation and regulation It is understood that the new water act for Namibia is overdue and that completion thereof will go a long way in directing the water sector in Namibia. Apart from the act, it is also proposed that national water supply and wastewater disposal regulations be implemented countrywide to standardise and regulate, amongst others:
(a) efficiency in water use
(b) water metering management
(c) appropriate tariff structures throughout the country
(d) effective revenue collection
(e) wastewater discharge management and pollution control
5.7 Management information systems It is essential to understand and quantify the basic nature of the different water consumers in the various demand centres in Namibia and to quantify the water demand patterns of the major consumers. For this purpose, it is proposed that a uniform database and management information system (MIS) be used countrywide to:
facilitate assessment of water demands that are consistent between different regional water supply investigations
perform water use audits in relation to pre-defined consumer categories
link consumers to various geographical and administrative regions for the purposes of regional and basin management
ensure that water loss control is exercised
Water Demand, Supply and Resource Development; Namibian and Botswanan Sectors
26
6. SUMMARY OF RECOMMENDATIONS FOR FURTHER WORK With reference to previous discussions and motivations, it is recommended that the following work be done by Namibian water sector and/or OKACOM:
(a) Compose, from existing regional water plans and against the background of NDP1, a water master plan for Namibia that provides the framework within which regional water supply plans are renewed.
(b) In the proposed master plan:
fully investigate the position and requirements of irrigation and determine the opportunity cost of water for all users in order to prioritise between competing demands
further evolve on the concept of integrated catchment management and link demands to major river catchments and aquifers
evolve the institutions, legislation, regulations and control measures to manage each catchment in relation to its exploitation, water quality, structural and ecological integrity and external support
propose forums and procedures for co-ordination between development organisations and the water sector
propose research organs to facilitate the improvement of technology and the local understanding of water related matters, especially in relation to water renovation and re-use, seawater utilisation, water use optimisation, groundwater exploration, meteorological and hydrological phenomena and resource economics
propose the implementation of a countrywide management information system (MIS) for purposes of water demand management and supply planning
(c) From existing and supplementary surveys and records, establish a database with the most recent data on existing consumers at the Okavango River, containing at least their names, location, purpose for which water is used, amounts of water used, methods of water production, status of wastewater discharged, and planned expansion.
(d) Prioritise the demands on Okavango River water with special reference to
the established rural population, their socio-economical activities and their natural growth
the natural environment
the tourism industry and wildlife management
developing large settlements such as Rundu
demands from the central areas of Namibia
existing and planned commercial irrigation at the river
(e) Define the status of the Okavango Delta as national water resource in the context of its international character and provide legislation and resources to maintain/establish that status.
Water Demand, Supply and Resource Development; Namibian and Botswanan Sectors
27
7. LITERATURE REFERENCES
Burke JJ and Patorni F (1993): Proceedings of the workshop on water resources management in Southern Africa. Sponsored by World Bank, the Commonwealth Secretariat, United Nations and Canadian International Development Agency; held at Victoria Falls, Zimbabwe, July 5-9, 1993.
DWA (1993). A digest of the water supply and sanitation sector policy of the government of Namibia. Department of Water Affairs, Ministry of Agriculture, Water and Rural Development, Republic of Namibia. November 1993.
DWA (1997). Water demand of Namibia (in preparation by the Planning division). Department of Water Affairs, Ministry of Agriculture, Water and Rural Development, Republic of Namibia. 1997
DWA (1998). Namibian water demands from the Okavango River (in preparation by the Planning division). Department of Water Affairs, Ministry of Agriculture, Water and Rural Development, Republic of Namibia. 1998.
JVC (1996). Water supply to the central Namib area of Namibia: Feasibility study. Prepared for the Department of Water Affairs, Ministry of Agriculture, Water and Rural Development, Republic of Namibia by the consortium of consultants GKW Consult, Bicon Namibia and Parkman Namibia, June 1996.
Alexander & Becker (1998). Planning investigation on bulk water supply to Rehoboth Town. Prepared by Alexander & Becker cc for the Namibia Water Corporation, March 1998.
NPC (1995). First National Development Plan (NDP1): 1995/96 – 1999/2000. Volumes 1 and 2. National Planning Commission, Windhoek, Namibia.
Hatutale (1994). Investigation into the surface water resources of the Okavango Region, with special reference to the Okavango River. Internal report no 2500/3/1/H1, Hydrology Division, DWA, Windhoek.
Heyns (1995 a). Namibian access to international waters. Unpublished report to the Deputy Permanent Secretary, Ministry of Agriculture, Water and Rural Development, Republic of Namibia.
Heyns (1995 b). Water sector facts and master water planning in Namibia. Department of Water Affairs, Ministry of Agriculture, Water and Rural Development, Republic of Namibia. October 1995.
Lange G (1997). An approach to sustainable water management using natural resource accounts: the use of water, the economic value of water and implications for policy. Research discussion paper No 18, Ministry of Environment and Tourism, Namibia, June 1997.
Moorsom R, Franz J and Mupotola M (1995). Coping with aridity in Namibia. Prepared for: NEPRU, the United Nations Environment Programme and the Ministry of Agriculture, Water and Rural Development of the Republic of Namibia. Brandes & Apsel, Frankfurt a.M.
Schutte CF and Pretorius WA (1997). Water demand and population growth. Water SA 23 (2) 127-133
Van der Leeden F, Troise FL and Todd DK (1990). The water encyclopaedia. 2nd ed. Lewis Publishers, Michigan, USA
Water Demand, Supply and Resource Development; Namibian and Botswanan Sectors
28
ANNEXURE A: INVESTIGATION CONSULTATIONS
The investigations for this report included consultations with officials, the particulars of whom are presented in Table A1.
Table A1: Persons consulted
Name Organisation Subject discussed Aldrich, S NamWater: Acting manager:
Technical planning Responsibility distribution between DWA and NamWater and organisational framework
Brown, Dr C MET Environmental policy references Christelis, G DWA Groundwater potential map De Wet, Dr S DWA Pollution control Dijkstra, C DWA Okavango River water consumption inventory and
national water demand summary Ebrecht, L DRWS Rural water tariff policy Gouws, C DWA Water law
Water Demand, Supply and Resource Development; Namibian and Botswanan Sectors
Prepared by Alexander & Becker cc
BOTSWANA
NAMIBIA
ZAMBIA
ZIMBABWE
SOUTH AFRICA
MOZAMBIQUE
MA
LAW
I
ANGOLA
TANZANIALuanda
Lusaka
Gaborone
Maun
Windhoek
Pretoria
Harare
SWAZILAND
Lilo
ngw
e
Maputo
Cape Town
LESOTHO
DodomaKinshasha
FIGURE 1: LOCATION OF NAMIBIA WITHIN SOUTHERN AFRICA
NORTHNAMIB
CUVELAI
OKAVANGO
ZAMBEZICUNENE
SOUTHNAMIB
CENTRALNAMIB
ORANGE
FISH
OMATAKO
Rundu
Grootfontein
Mukwe
Windhoek
Otjiwarongo
Otavi
Tsumeb
Okakarara
Okahandja
Walvis Bay
Karibib
ATLANTICOCEAN
ANGOLA
SOUTH AFRICA
BOTSWANA
ZAMBIAOKAVANGO CUITO
N
FIGURE 2: MAJOR RIVER BASINS IN NAMIBIA
Prepared by Alexander & Becker cc
CABINET
Water resources management Water supply and sanitation
MAWRD
DA: Plan & design state
irrigation
DRM: Water
resource management
Perm
anen
t Sec
reta
ry, r
epla
cing
the
Adv
isor
y W
ater
Boa
rd
Bul
k w
ater
supp
ly
NamWater, supplying bulk to:majority of public settlements;large rural infrastructure;some large private bodies
FIGURE 3: NAMIBIA WATER SECTOR
Sani
tatio
n
In towns: Local authority
In rural areas:Waterpoint committees,
supported by DRWS
In government centresoutside minucipal areas: DW
In villages: MRLGH
Farmers, private ventures outside municipal areas, several irrigationschemes & most mines: Self supply
Certain local authorities with sufficientgroundwater resources: Self supply
Potable water distribution
Permits &pollutioncontrol
DWA: Custodian of national
water resources
DRWS: Rural water supply
Prepared by Alexander & Becker cc
Prepared by Alexander & Becker cc
OkavangoCunene ZambeziKwandoANGOLA
BOTSWANA
ZAMBIA
SOUTH AFRICAOrange
ATLANTICOCEAN
OshakatiRunduOpuwo
Otjiwarongo
Tsumeb
Karibib Okahandja
Gobabis
Rehoboth
Windhoek
Khorixas
Arandis
Walvis Bay
Swakopmund
Henties Bay
Katima Mulilo
Rössing
Keetmanshoop
Mariental
Grootfontein
Lüderitz
Okavango River
Sources for Central Area of Namibia:Local groundwater, ephemeral riverimpoundments, supplementation fromnorthern aquifers and Okavango River
Various, as per note above
Importation from Cunene River
Cunene River
Local perennial rivers & groundwater
Ephemeral rivers & groundwater
Desalinated seawater & groundwater
Fish River
Groundwater
Orange River
WATER SUPPLY LEGEND
LinyantiChobe
FIGURE 7: WATER SUPPLY REGIONS OF NAMIBIA
i
Section B : Botswanan Sector
CONTENTS
1. INTRODUCTION 1 1.1 Study objective 1 1.2 Consultations 1
2. LOCATION AND GEOGRAPHY 1
3. WATER DEMAND, MANAGEMENT AND SUPPLY IN BOTSWANA 3 3.1 Water dependencies 3 3.2 Water resource areas 3 3.3 Water law and institutions 4 3.4 Water supply functions of government, parastatal and other organisations 5 3.5 Water utilisation strategy and policies 9 3.6 Water consumption and demand 12 3.7 Existing and future water sources and supply 20 3.8 Demand on Okavango River water 24
4. ROLE OF THE MASTER WATER PLAN 26
5. DIAGNOSTIC ASSESSMENT AND FURTHER WORK 26 5.1 Unit water demand and review of the demand projections 26 5.2 Water demand and supply regions 27 5.3 Role of the Okavango River as resource 27 5.4 Okavango River consumer register 27
6. SUMMARY OF RECOMMENDATIONS FOR FURTHER WORK 28
7. LITERATURE REFERENCES 29
Water Demand, Supply and Resource Development: Namibian and Botswanan Sectors Section B
ii
List of Tables
No Title Page
1 Current water tariff for areas served by the WUC 2 Current water tariff for areas served by Government 3 Estimated distribution of major herbivores in Botswana 4 Per capita domestic water demands as applied in Botswana’s NWMP 5 Water losses adopted for estimation of future water demand 6 Established and potential irrigation land in Botswana 7 Irrigation water demand projection 8 Water requirements for the potential irrigation in the “Maun irrigation region” 9 Water demand projections for forestry
10 Total Botswana water demands as presented in the NWMP 11 Per capita water demands 12 Summary of water supply regions as identified in the NWMP 13 Projected population in Ngamiland 14 Water demand in Ngamiland, excluding environmental demand
List of Figures
No Title Page
1 Botswana location map 2 Major river basins and administrative districts in Botswana 3 Groundwater potential map of Botswana 4 Botswana water sector: government, parastatal and private involvement 5 Projected water demand of Botswana 6 Projected distribution of water demand in Botswana in 2020 7 Per capita water demand in various settlement categories 8 Per capita water demand, incorporating all uses countrywide 9 Projected water demands in Ngamiland District
Water Demand, Supply and Resource Development: Namibian and Botswanan Sectors Section B
iii
Terminology and abbreviations
AMSL (Elevation) above mean sea level DGS Department of Geological Survey DLGD Department of Local Government and Development DWA Department of Water Affairs IUCN International Union for the Conservation of Nature MA Ministry of Agriculture MLGLH Ministry of Local Government, Lands & Housing NWMP National Water Master Plan (of Botswana) WUC Water Utilities Corporation
Water Demand, Supply and Resource Development: Namibian and Botswanan Sectors Section B
1
1. INTRODUCTION
1.1 Study objective This study forms one component of a multidisciplinary preparatory diagnostic assessment of the Okavango river basin, which is intended to lead into full-scale impact assessments and eventually to the formation of an integrated management plan for the basin.
The report focuses on the national and regional water demands and water supply in Botswana, with particular emphasis on the Okavango basin. It has the following principal outputs:
A review of available data and literature, including the most recent Master Water Plan.
A preparatory diagnostic assessment of the current and projected future water demand and water supply situations.
A description of the areas where there is a lack of data or knowledge, and the work which will need to be carried out to provide an improved and accurate diagnostic assessment.
1.2 Consultations Investigations for this report included consultation with various Botswana officials, the particulars of whom are presented in Annexure A.
2. LOCATION AND GEOGRAPHY Botswana is a landlocked country in southern Africa, bordered by Namibia to the west and north, South Africa to the south and south-east, and Zimbabwe to the north-east. It lies between latitudes 18°S and 27°S and occupies an area of about 581 730 km2. The location is shown in Figure 1.
Most of Botswana is relatively flat with the elevation above mean sea level (AMSL) ranging from 600 m to 1 490 m. Most of the country is at an elevation of between 800 m and 1 200 m AMSL. This flat topography combined with the sandy nature of its soils, the low rainfall and high evaporation, results in low rates of surface runoff. All streams originating in Botswana are ephemeral and all of its main river systems are shared with neighbouring countries (NWMP, 1992).
The Okavango Delta is situated in the north-west of Botswana and slopes from 1000 m AMSL in the upper reaches of its panhandle, down to about 920 m AMSL at Lake Ngami (McCarthy & Ellery, 1997). It has inundation area of up to 18 000 km2.
Water Demand, Supply and Resource Development: Namibian and Botswanan Sectors Section B
2
Replacement page for Figure 1: Location map for Botswana
Water Demand, Supply and Resource Development: Namibian and Botswanan Sectors Section B
3
3. WATER DEMAND, MANAGEMENT AND SUPPLY IN BOTSWANA
3.1 Water dependencies The entities in Botswana that are dependent on water can be categorised as:
♦ Natural environment and tourism
Physical environment (evaporation, groundwater seepage losses)
Natural fauna and flora including compensation for wildlife that, due to fencing, is prevented from reaching natural water supplies during dry periods
Tourist facilities in nature parks
♦ Urban centres and villages, collectively referred to as settlements, with the major sub-components being
domestic
commerce and industry
institutional
distribution losses
♦ Rural population and subsistence farming
♦ Mines and energy
♦ Agriculture
Commercial livestock farming
Forestry, including nurseries
Commercial irrigation
♦ Other
Water production processes
3.2 Water resource areas
3.2.1 Surface water When classified in terms of rainwater catchments, Botswana can be divided into four main areas (NWMP, 1992):
• The Okavango swamps in the north-west, the Makgadikgadi pans in the north-east and the bulk of the Kalahari desert in the central and western parts of Botswana, all forming part of the Okavango-Makgadikgadi basin, hereafter referred to as the Okavango basin. This basin covers about 60% of the land in Botswana.
• The Linyanti-Chobe sub-catchment of the Zambezi basin in the far north of Botswana, covering about 5% of the land.
• Western tributaries of the Shashe River and northern tributaries of the Limpopo River upstream of Shashe, draining the south-east of Botswana into the Limpopo River and therefore forming part of the Limpopo basin. This basin covers about 20% of the land.
• The south and south-west of Botswana that drains into the Orange basin via the Molopo River, covering about 5% of the land.
Water Demand, Supply and Resource Development: Namibian and Botswanan Sectors Section B
4
These catchments are depicted in Figure 2, with the Okavango basin being emphasised by yellow shading. All the major rivers in Botswana are shared with its neighbouring countries.
The bulk of the country’s surface water sources have been developed in the Limpopo basin, where the majority of the country’s industrial and development urban settlement has taken place. Only local settlements draw water from the Okavango and Chobe (Zambezi) systems, mainly due to their remoteness from the urban centres and the ecological sensitivity of the Okavango and Cuando-Linyanti-Chobe systems. The region falling in the Orange River catchment is dry and does not support any significant surface water source development.
3.2.2 Groundwater Groundwater utilisation plays a significant role in Botswana’s water supply industry. An overview map of the groundwater potential in Botswana is shown in Figure 3, which has been carried over from NWMP (1992). The rural population, most villages, the cattle industry and the mining industry have traditionally relied upon groundwater.
3.3 Water law and institutions Information about the water law and institutions in Botswana as obtained from Burke & Patorni (1993) and NWMP (1992) is summarised below.
3.3.1 Water Act 1968 Cap 34:01 This act is administered by the Department of Water Affairs (DWA). It is the basic statute and deals amongst other issues, with:
the status of public water
rights of individuals to use water
recording, granting, variation and termination of rights to use or impound water or to discharge effluents thereto
obligations of those taking water to use it properly
pollution control with respect to public water
All surface- and groundwater belongs to the state and permission for the use of water is licensed by the Water Apportionment Board (WAP), which is enacted by the Water Act and for which the DWA serves as secretariat.
3.3.2 Borehole Act 1956 Cap 34:02 The Boreholes Act is administered by the Department of Geological Survey (DGS). It stipulates the records and samples in respect of the drilling of boreholes, which have to be furnished to this department. The DGS keeps a comprehensive borehole register and fulfils a research role with respect to groundwater issues. It interfaces with the DWA on groundwater matters.
3.3.3 Waterworks Act 1962 Cap 34:03 (Waterworks Amendment Act 1983 (16183)) The Waterworks Act is administered by the DWA and is the means by which the responsible Cabinet Minister appoints water supply authorities to assume the responsibility for water supply and pollution control in designated areas of jurisdiction. The act also deals with the charges for water supplied, the suspension of supplies, the inspection and testing of appurtenances and the prevention of misuse and wasting of water.
Water Demand, Supply and Resource Development: Namibian and Botswanan Sectors Section B
5
3.3.4 Water Utilities Corporation Act 1970 Cap 74:02 (WUC Amendment Act 1978 (3178)) The Water Utilities Corporation Act established the Water Utilities Corporation (WUC) as the "Water Authority" responsible for distribution of water within the Shashe Development Area and other urban areas where water is supplied on a non-subsidised and full cost recovery basis.
3.3.5 Aquatic Weeds Act 1971 Cap 34:04 This act empowers the Department of Water Affairs to control the spreading of alien species of aquatic weeds into ecologically sensitive areas.
3.3.6 Other acts Other acts which have bearing on the water environment, include the following:
The Public Health Act, in terms of which environmental health officers ensure the purity of public water supplies
Local Government District Council Act in terms of which the district councils provide water outside any area for which a water authority has been appointed under the Waterworks Act.
3.4 Water supply functions of government, parastatal and other organisations The DWA is responsible for overall resources planning and investigation and for the design and construction of village water supply schemes on behalf the District Councils. The latter consists of locally elected councillors, and for their duties they receive financial and technical support from Department of Local Government and Development (DLGD) in the ministry of Local Government, Lands and Housing (MLGLH). DWA also operates and maintains the water supply schemes of major villages, while the respective District Councils, under support from DLGD, operate and maintain the water supply schemes of rural villages. Water supply to urban areas is the responsibility of the parastatal organisation, the Water Utilities Corporation (WUC). The latter supplies water to urban areas on a basis that is financially self supporting, while the mentioned government organs supply water to villages and the rural sector on a heavily subsidised basis.
Others involved in the development of water sources are private organisations who do so for own use, such as certain mines and the agricultural sector. Farm dam development for purposes of stock drinking, is for example done with support from the Ministry of Agriculture (MA).
A simplified diagram that shows the major roles and linkages of the above organisations in the water sector is shown in Figure 4.
The distribution of potable water within a settlement is also done by the responsible water supply authority.
Wastewater disposal is the responsibility of the respective city councils and, in the case of villages, of the DLGD. It is intended, however, to transfer the wastewater disposal function to the water supply authority. This will then make the water authority responsible for bulk water supply, water distribution and wastewater disposal.
Water Demand, Supply and Resource Development: Namibian and Botswanan Sectors Section B
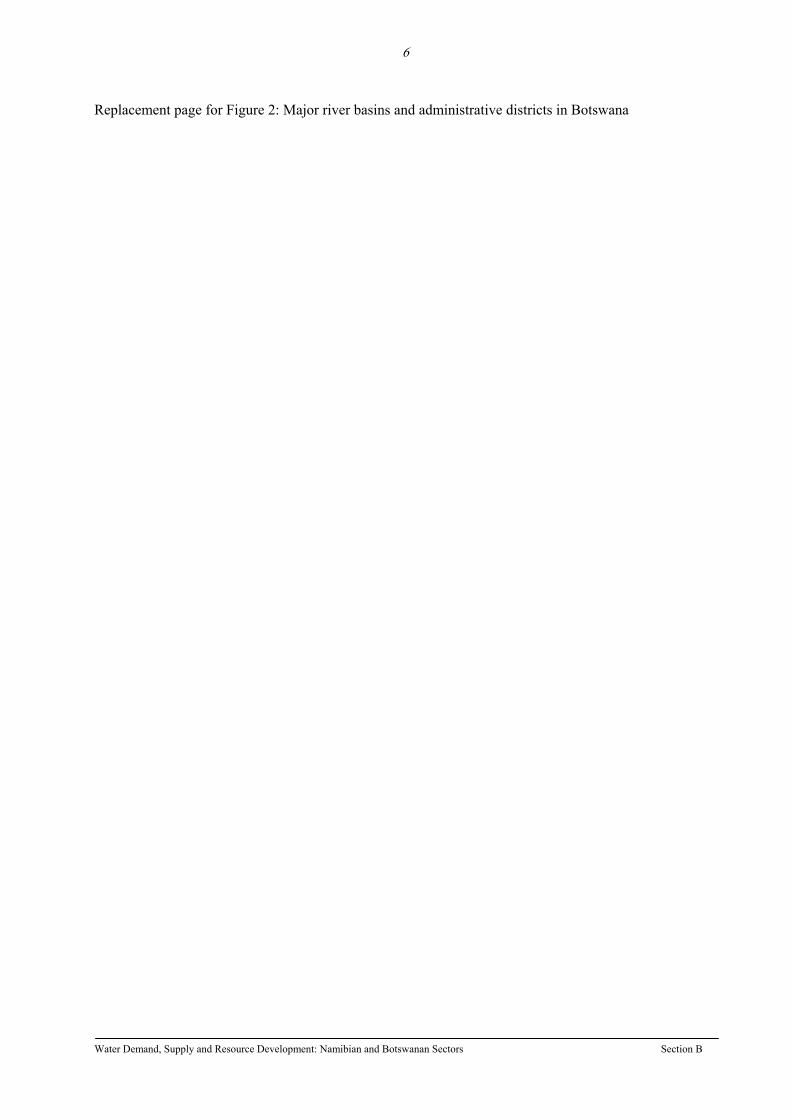
6
Replacement page for Figure 2: Major river basins and administrative districts in Botswana
Water Demand, Supply and Resource Development: Namibian and Botswanan Sectors Section B
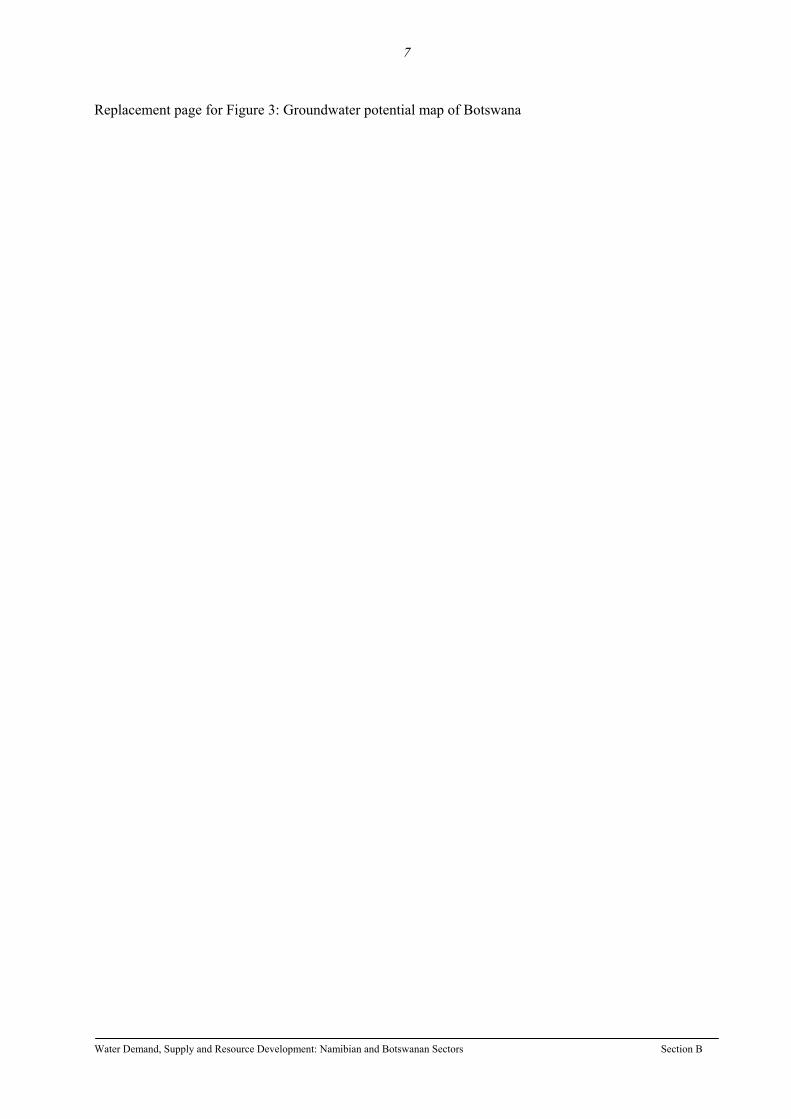
7
Replacement page for Figure 3: Groundwater potential map of Botswana
Water Demand, Supply and Resource Development: Namibian and Botswanan Sectors Section B
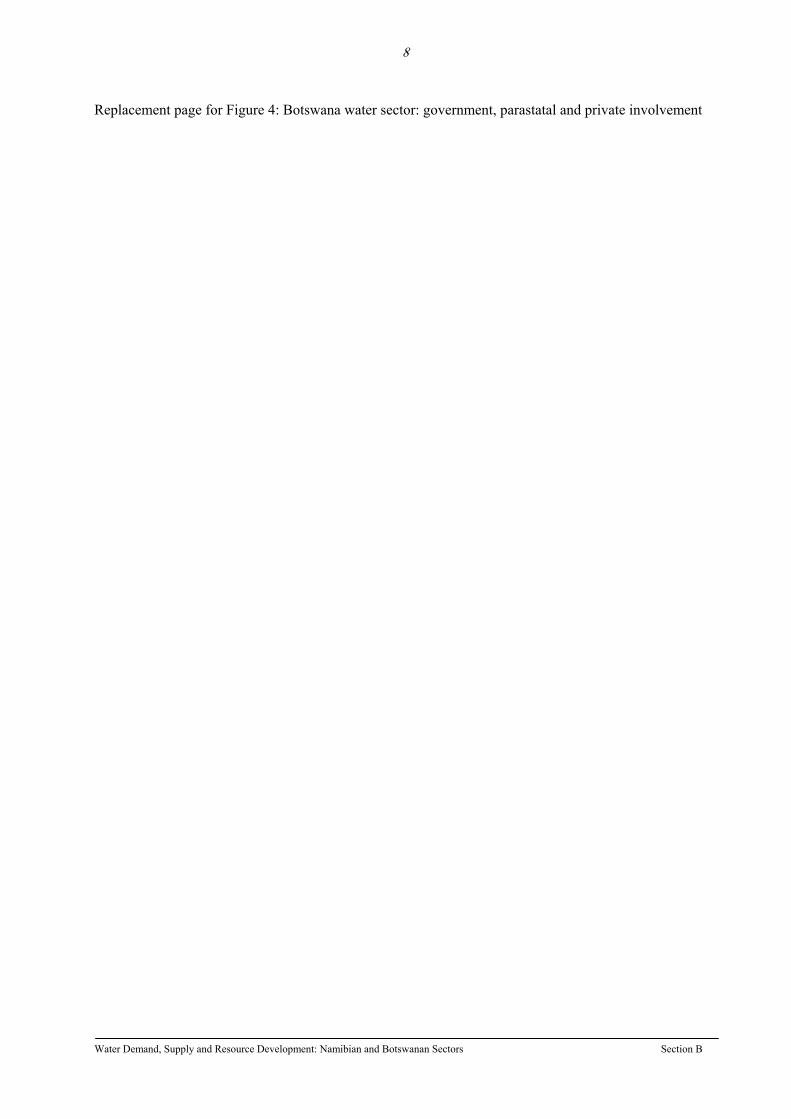
8
Replacement page for Figure 4: Botswana water sector: government, parastatal and private involvement
Water Demand, Supply and Resource Development: Namibian and Botswanan Sectors Section B
9
3.5 Water utilisation strategy and policies
3.5.1 Methodology of water demand estimation For the purposes of water demand estimation, consumers have been categorised as settlements, mining, energy, agriculture and wildlife. Settlements are further subdivided into domestic, commercial/industrial and institutional consumers and in distribution losses. Agriculture is further subdivided into livestock, irrigation and forestry categories.
Present (and historic) water demands for settlements and the mining and energy sectors are available from metered data. For demand categories where metered data is not available, demand is estimated by applying unit water demand figures to the occupancy levels in such consumer categories.
Future water demands are estimated by applying expected growth factors to the current occupancy levels and then by multiplication with applicable unit demands. Growth factors are selected by observing historic trends, development policies, economic growth potential and other relevant factors.
More details are provided in a later paragraph of this report.
3.5.2 Water supply planning As was previously reported, the DWA is responsible for resources planning and investigation. However, the WUC also has a planning and investigation responsible with respect to meeting its own obligations. In reality, the DWA and WUC plan together in many instances, since resources are shared between different water supply authorities. The overall responsibility for national planning remains with the DWA and it does so by means of national master planning and by project specific planning.
3.5.3 Conservation policies In the NWMP, the following approaches to conservation were being promoted:
Co-ordination and direction of environmental impact assessments for development projects by the National Conservation Strategy Co-ordinating Agency, which oversees the National Conservation Strategy
Environmental audit throughout construction, operation and decommissioning of projects
Total catchment management, which entails land use planning and administration to meet the needs of all users in a way that the environment is protected to the benefit of all
Groundwater management that addresses the issues of groundwater mining, groundwater quality and optimal economic and social use of the resources
The treatment of wastewater on a level that receiving land and water bodies can cope with the load and also that recycling and re-use can be introduced in future
Water re-use and recycling
Reduction of water leaks, control of institutional consumption and improvement of irrigation efficiencies
Reduction of wasteful unit water consumption by means of water demand management strategies (see below)
Wetland and aquatic weed management programmes
Combating of water-borne diseases
It is outside the scope of this report to comment on the sufficiency of these measures and they are merely noted to demonstrate the awareness that exists regarding these matters.
Water Demand, Supply and Resource Development: Namibian and Botswanan Sectors Section B
10
3.5.4 Water demand management strategies The NWMP realises the need to curb the growth in water demand by:
efficiency in water use through public education
maintaining full cost recovery for water supply secured in urban centres and major villages and the adoption of a stratified tariff structure
promoting more water-efficient domestic appliances, etc
operational means such as lower service pressures
encouraging management and the development of water supplies by local communities
3.5.5 Decision-making guidelines and policies Development in Botswana is guided by the National Development Plan and several formal strategies and policy documents, such as the Settlement Policy, the Accelerated Land Servicing Programme, the National Conservation Strategy and others. Water development is guided by the National Water Master Plan (NWMP), which has been developed in recognition of the National Development Plan. The NWMP analyses all alternative options to meet Botswana's water requirements with the available resources over the period 1990-2020. It outlines the developments needed, taking into consideration environmental, economic, social, institutional and legal factors.
Water is considered a scarce resource in Botswana, and treated as a basic commodity that cannot be exploited as a commercial resource. All water is owned by the state and the use thereof is apportioned to consumers by the Water Apportionment Board. Apportionment of the use of water can be altered as different priorities arise. Domestic demand enjoys highest priority when water is limited, while irrigation has the lowest priority.
3.5.6 Payment for water (tariffs, tariff structures & payment responsibilities) In order to conserve water and supply it on a sustainable basis, it is the official policy to eventually supply water on a basis of full cost recovery. This objective has already been met in urban centres, but not yet in villages and in the rural areas. The pricing policy for water is based on the principles of equity and affordability and this result in the tariffs being structured in such a way that those who use large quantities of water subsidise those who consumes little. Those who cannot afford to pay for water, have free excess to a number of public water outlets, which are supplied by the water supply authorities in all settlements.
All water supplies are metered and paid for by the individual consumers. The water supplied by means of public standpipes is, in the urban centres, paid for by the responsible city council, and in the villages by the District Councils.
Tariffs for water supplies by both government and parastatals are revised annually and have to be approved by Cabinet. For urban centres, the tariffs are set to recover cost of water secured for that particular centre, but for the villages and rural supplies, unified tariffs apply across the country.
The policy is to gradually increase the tariffs in villages and rural areas to eventually reach full cost recovery, but achievement thereof is still along way off.
The current WUC water tariffs are presented in Table 1 and the current rural water tariffs are presented in Table 2.
Water Demand, Supply and Resource Development: Namibian and Botswanan Sectors Section B
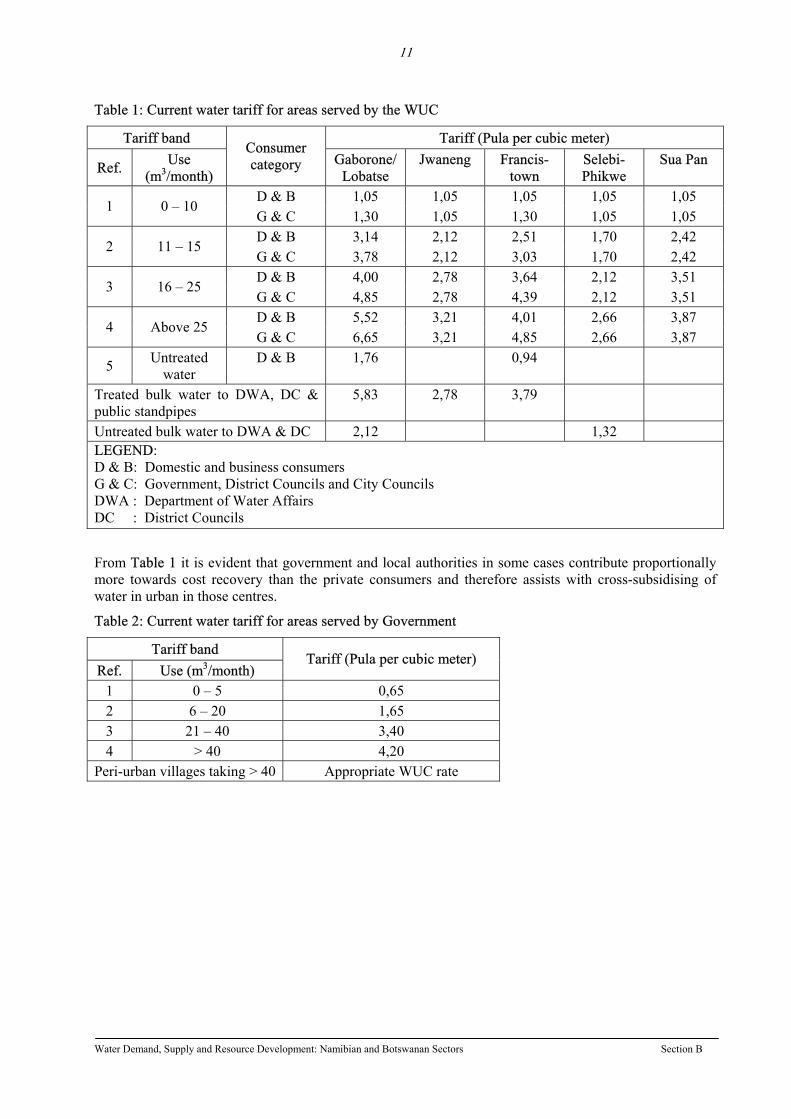
11
Table 1: Current water tariff for areas served by the WUC
Tariff band Tariff (Pula per cubic meter)
Ref. Use (m3/month)
Consumer category Gaborone/
Lobatse Jwaneng Francis-
town Selebi-Phikwe
Sua Pan
D & B 1,05 1,05 1,05 1,05 1,05 1 0 – 10
G & C 1,30 1,05 1,30 1,05 1,05 D & B 3,14 2,12 2,51 1,70 2,42
2 11 – 15 G & C 3,78 2,12 3,03 1,70 2,42 D & B 4,00 2,78 3,64 2,12 3,51
3 16 – 25 G & C 4,85 2,78 4,39 2,12 3,51 D & B 5,52 3,21 4,01 2,66 3,87
4 Above 25 G & C 6,65 3,21 4,85 2,66 3,87
5 Untreated water
D & B 1,76 0,94
Treated bulk water to DWA, DC & public standpipes
5,83 2,78 3,79
Untreated bulk water to DWA & DC 2,12 1,32 LEGEND: D & B: Domestic and business consumers G & C: Government, District Councils and City Councils DWA : Department of Water Affairs DC : District Councils
From Table 1 it is evident that government and local authorities in some cases contribute proportionally more towards cost recovery than the private consumers and therefore assists with cross-subsidising of water in urban in those centres.
Table 2: Current water tariff for areas served by Government
Tariff band Ref. Use (m3/month)
Tariff (Pula per cubic meter)
1 0 – 5 0,65 2 6 – 20 1,65 3 21 – 40 3,40 4 > 40 4,20
Peri-urban villages taking > 40 Appropriate WUC rate
Water Demand, Supply and Resource Development: Namibian and Botswanan Sectors Section B
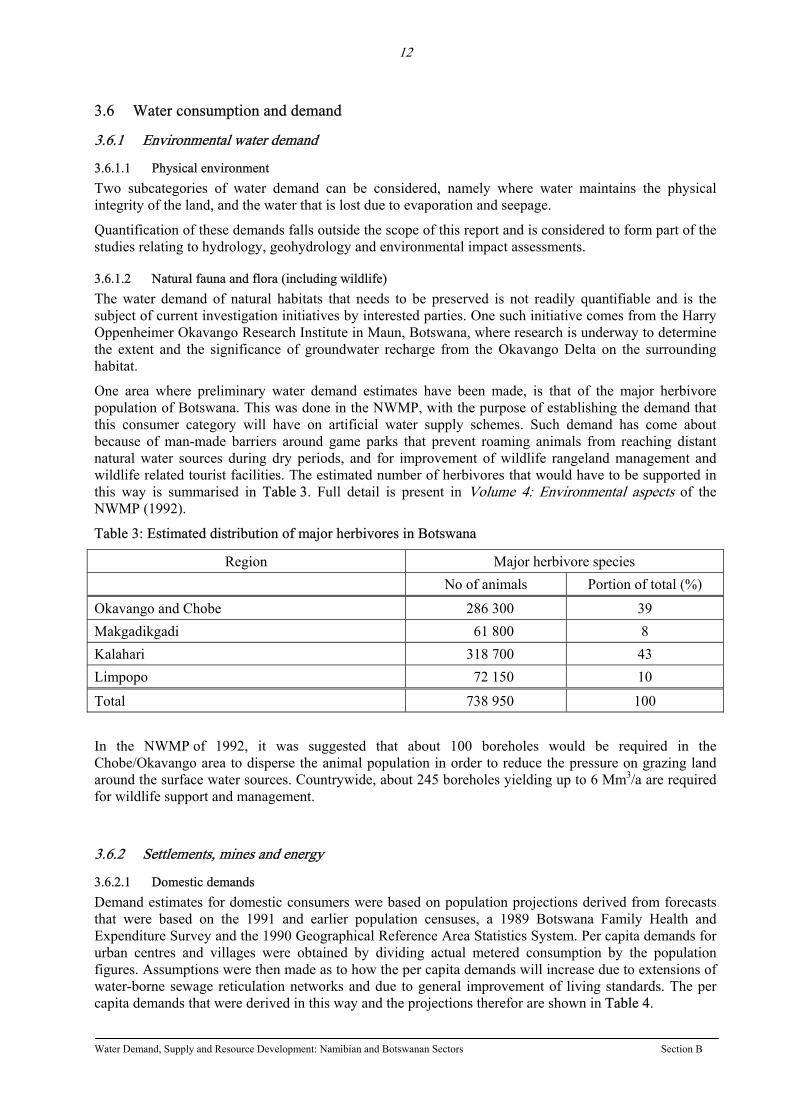
12
3.6 Water consumption and demand
3.6.1 Environmental water demand
3.6.1.1 Physical environment Two subcategories of water demand can be considered, namely where water maintains the physical integrity of the land, and the water that is lost due to evaporation and seepage.
Quantification of these demands falls outside the scope of this report and is considered to form part of the studies relating to hydrology, geohydrology and environmental impact assessments.
3.6.1.2 Natural fauna and flora (including wildlife) The water demand of natural habitats that needs to be preserved is not readily quantifiable and is the subject of current investigation initiatives by interested parties. One such initiative comes from the Harry Oppenheimer Okavango Research Institute in Maun, Botswana, where research is underway to determine the extent and the significance of groundwater recharge from the Okavango Delta on the surrounding habitat.
One area where preliminary water demand estimates have been made, is that of the major herbivore population of Botswana. This was done in the NWMP, with the purpose of establishing the demand that this consumer category will have on artificial water supply schemes. Such demand has come about because of man-made barriers around game parks that prevent roaming animals from reaching distant natural water sources during dry periods, and for improvement of wildlife rangeland management and wildlife related tourist facilities. The estimated number of herbivores that would have to be supported in this way is summarised in Table 3. Full detail is present in Volume 4: Environmental aspects of the NWMP (1992).
Table 3: Estimated distribution of major herbivores in Botswana
Region Major herbivore species No of animals Portion of total (%)
Okavango and Chobe 286 300 39 Makgadikgadi 61 800 8 Kalahari 318 700 43 Limpopo 72 150 10
Total 738 950 100
In the NWMP of 1992, it was suggested that about 100 boreholes would be required in the Chobe/Okavango area to disperse the animal population in order to reduce the pressure on grazing land around the surface water sources. Countrywide, about 245 boreholes yielding up to 6 Mm3/a are required for wildlife support and management.
3.6.2 Settlements, mines and energy
3.6.2.1 Domestic demands Demand estimates for domestic consumers were based on population projections derived from forecasts that were based on the 1991 and earlier population censuses, a 1989 Botswana Family Health and Expenditure Survey and the 1990 Geographical Reference Area Statistics System. Per capita demands for urban centres and villages were obtained by dividing actual metered consumption by the population figures. Assumptions were then made as to how the per capita demands will increase due to extensions of water-borne sewage reticulation networks and due to general improvement of living standards. The per capita demands that were derived in this way and the projections therefor are shown in Table 4.
Water Demand, Supply and Resource Development: Namibian and Botswanan Sectors Section B
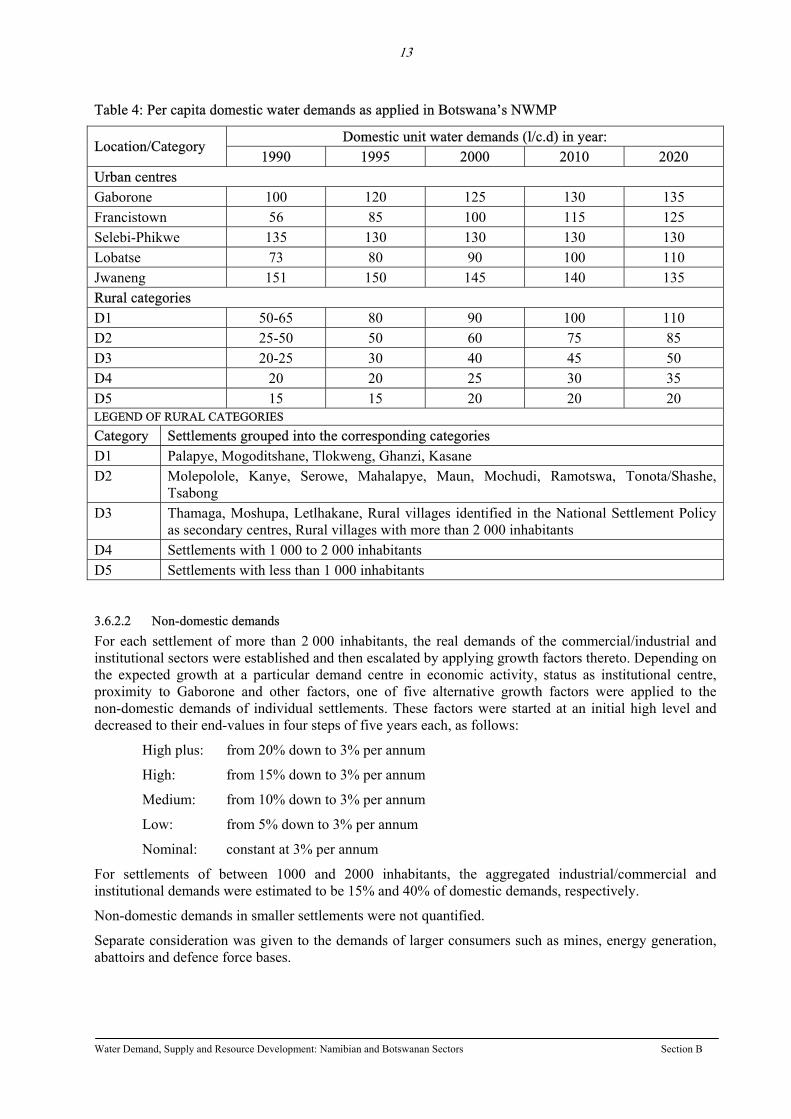
13
Table 4: Per capita domestic water demands as applied in Botswana’s NWMP
Domestic unit water demands (l/c.d) in year: Location/Category
1990 1995 2000 2010 2020 Urban centres Gaborone 100 120 125 130 135 Francistown 56 85 100 115 125 Selebi-Phikwe 135 130 130 130 130 Lobatse 73 80 90 100 110 Jwaneng 151 150 145 140 135 Rural categories D1 50-65 80 90 100 110 D2 25-50 50 60 75 85 D3 20-25 30 40 45 50 D4 20 20 25 30 35 D5 15 15 20 20 20 LEGEND OF RURAL CATEGORIES
Category Settlements grouped into the corresponding categories D1 Palapye, Mogoditshane, Tlokweng, Ghanzi, Kasane D2 Molepolole, Kanye, Serowe, Mahalapye, Maun, Mochudi, Ramotswa, Tonota/Shashe,
Tsabong D3 Thamaga, Moshupa, Letlhakane, Rural villages identified in the National Settlement Policy
as secondary centres, Rural villages with more than 2 000 inhabitants D4 Settlements with 1 000 to 2 000 inhabitants D5 Settlements with less than 1 000 inhabitants
3.6.2.2 Non-domestic demands For each settlement of more than 2 000 inhabitants, the real demands of the commercial/industrial and institutional sectors were established and then escalated by applying growth factors thereto. Depending on the expected growth at a particular demand centre in economic activity, status as institutional centre, proximity to Gaborone and other factors, one of five alternative growth factors were applied to the non-domestic demands of individual settlements. These factors were started at an initial high level and decreased to their end-values in four steps of five years each, as follows:
High plus: from 20% down to 3% per annum
High: from 15% down to 3% per annum
Medium: from 10% down to 3% per annum
Low: from 5% down to 3% per annum
Nominal: constant at 3% per annum
For settlements of between 1000 and 2000 inhabitants, the aggregated industrial/commercial and institutional demands were estimated to be 15% and 40% of domestic demands, respectively.
Non-domestic demands in smaller settlements were not quantified.
Separate consideration was given to the demands of larger consumers such as mines, energy generation, abattoirs and defence force bases.
Water Demand, Supply and Resource Development: Namibian and Botswanan Sectors Section B
14
3.6.2.3 Losses Allowance was made for water losses during purification, transmission and distribution, as shown in Table 5.
Table 5: Water losses adopted for estimation of future water demand
Demand centre Actual losses at source
Urban centres 20%
Other settlements 25%
Process water used in the mining & power sectors 10%
The above figures exclude unaccounted-for losses, since allowances for all demands were made in the demand forecasts
3.6.2.4 Alternative demand forecasts Three alternative demand forecasts are presented in the NWMP, these being low, medium and high forecasts. The low and high alternatives were generated by varying the medium forecast settlement demands by –10% and +20% respectively. Mining and energy demands were held constant in al three forecasts.
3.6.3 Agriculture
3.6.3.1 Livestock The cattle industry is one of the major industries in the country and the water demand of this sector is therefore important.
Three growth scenarios were considered, namely:
low scenario whereby the 1992 stock levels of 2 million livestock units prevail throughout the study period
medium scenario whereby the livestock numbers increase to its pre-drought levels of 2,7 million livestock units
high scenario where the livestock numbers increase to 3,8 million livestock units by 2020 due to uncontrolled expansion
For the medium scenario, the water demand by 2020 was estimated at 44,1 million m3/annum.
3.6.3.2 Irrigation The NWMP identifies the opportunity cost of irrigation water as being very low and this sector therefore enjoys the lowest priority where resources are scarce. Certain irrigation areas are nevertheless in existence and others have been identified as suitable for irrigation, based on soil suitability and water availability:
1 383 ha was already under irrigation at the time of producing the NWMP (1992)
about 13 000 ha of land was identified as suitable for irrigation based on soils and water resources, of which 2 300 ha could be developed without major development works
More details are presented in Table 6.
Water Demand, Supply and Resource Development: Namibian and Botswanan Sectors Section B
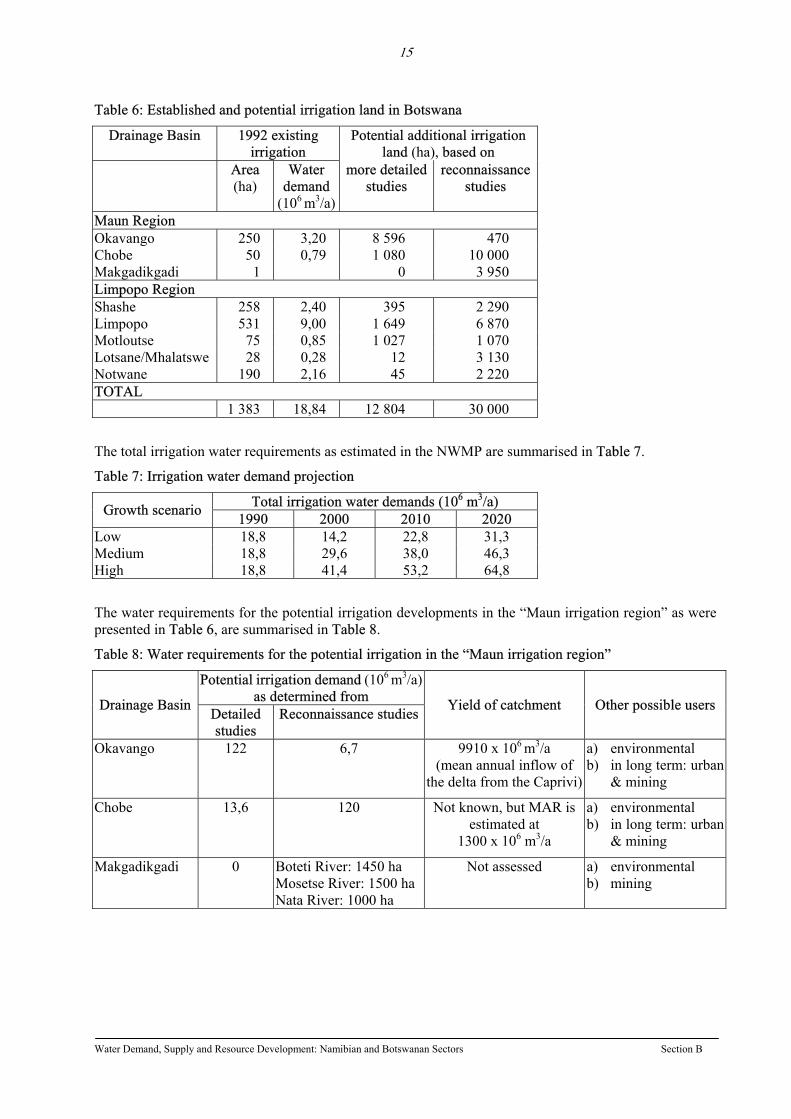
15
Table 6: Established and potential irrigation land in Botswana
Drainage Basin 1992 existing irrigation
Potential additional irrigation land (ha), based on
Area (ha)
Water demand
(106 m3/a)
more detailed studies
reconnaissance studies
Maun Region Okavango 250 3,20 8 596 470 Chobe 50 0,79 1 080 10 000 Makgadikgadi 1 0 3 950 Limpopo Region Shashe 258 2,40 395 2 290 Limpopo 531 9,00 1 649 6 870 Motloutse 75 0,85 1 027 1 070 Lotsane/Mhalatswe 28 0,28 12 3 130 Notwane 190 2,16 45 2 220 TOTAL 1 383 18,84 12 804 30 000
The total irrigation water requirements as estimated in the NWMP are summarised in Table 7.
Table 7: Irrigation water demand projection
Total irrigation water demands (106 m3/a) Growth scenario 1990 2000 2010 2020 Low 18,8 14,2 22,8 31,3 Medium 18,8 29,6 38,0 46,3 High 18,8 41,4 53,2 64,8
The water requirements for the potential irrigation developments in the “Maun irrigation region” as were presented in Table 6, are summarised in Table 8.
Table 8: Water requirements for the potential irrigation in the “Maun irrigation region”
Potential irrigation demand (106 m3/a)as determined from Drainage Basin Detailed
studies Reconnaissance studies Yield of catchment Other possible users
Okavango 122 6,7 9910 x 106 m3/a (mean annual inflow of
the delta from the Caprivi)
a) environmental b) in long term: urban
& mining
Chobe 13,6 120 Not known, but MAR is estimated at
1300 x 106 m3/a
a) environmental b) in long term: urban
& mining
Makgadikgadi 0 Boteti River: 1450 ha Mosetse River: 1500 ha Nata River: 1000 ha
Not assessed a) environmental b) mining
Water Demand, Supply and Resource Development: Namibian and Botswanan Sectors Section B
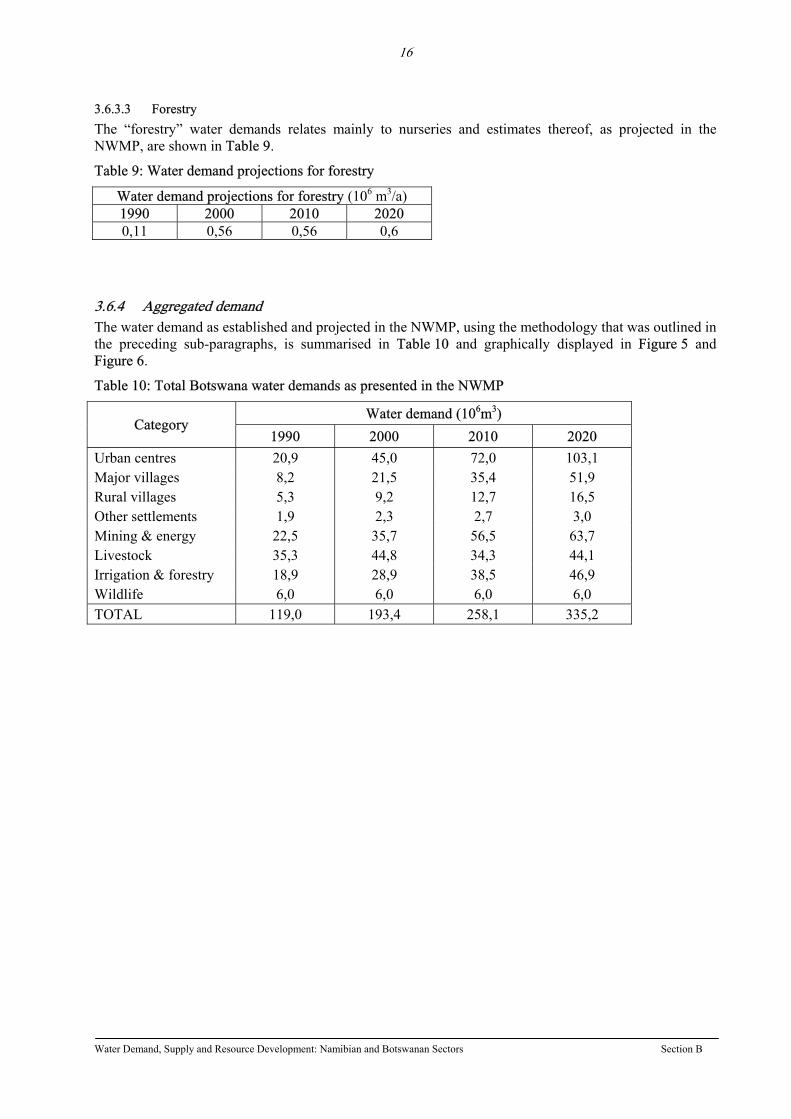
16
3.6.3.3 Forestry The “forestry” water demands relates mainly to nurseries and estimates thereof, as projected in the NWMP, are shown in Table 9.
Table 9: Water demand projections for forestry
Water demand projections for forestry (106 m3/a) 1990 2000 2010 2020 0,11 0,56 0,56 0,6
3.6.4 Aggregated demand The water demand as established and projected in the NWMP, using the methodology that was outlined in the preceding sub-paragraphs, is summarised in Table 10 and graphically displayed in Figure 5 and Figure 6.
Table 10: Total Botswana water demands as presented in the NWMP
Water demand (106m3) Category
1990 2000 2010 2020 Urban centres 20,9 45,0 72,0 103,1 Major villages 8,2 21,5 35,4 51,9 Rural villages 5,3 9,2 12,7 16,5 Other settlements 1,9 2,3 2,7 3,0 Mining & energy 22,5 35,7 56,5 63,7 Livestock 35,3 44,8 34,3 44,1 Irrigation & forestry 18,9 28,9 38,5 46,9 Wildlife 6,0 6,0 6,0 6,0 TOTAL 119,0 193,4 258,1 335,2
Water Demand, Supply and Resource Development: Namibian and Botswanan Sectors Section B
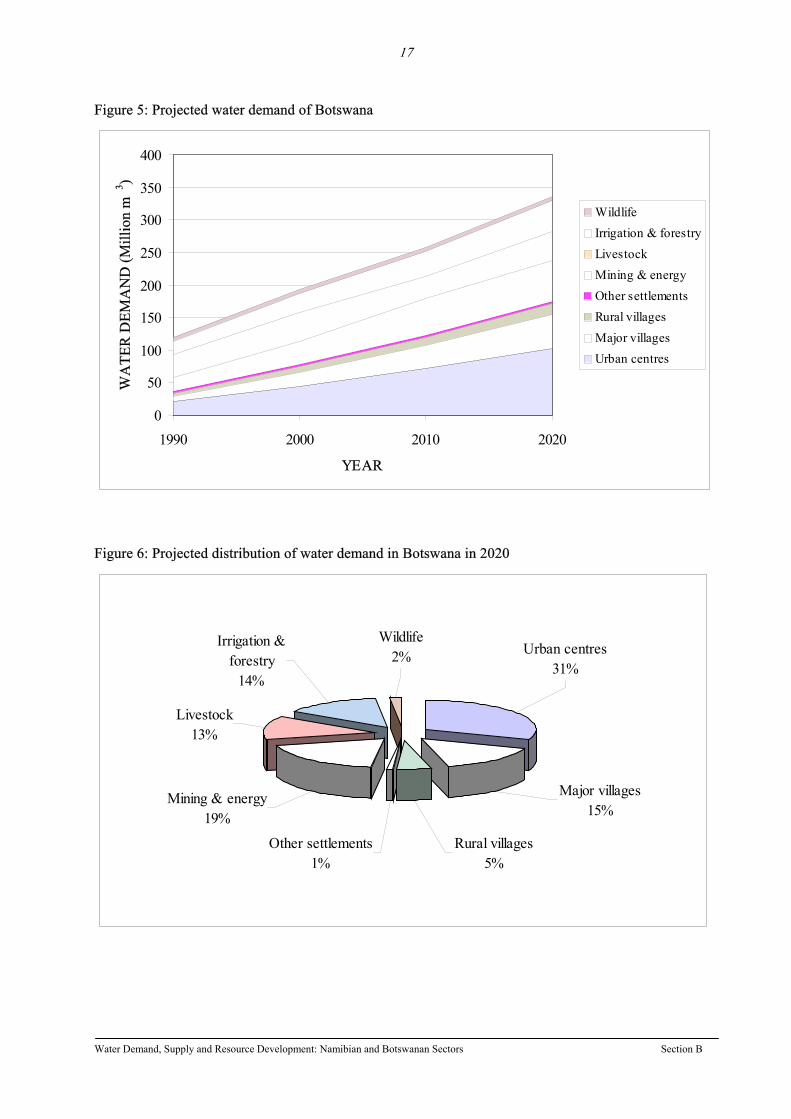
17
Figure 5: Projected water demand of Botswana
0
50
100
150
200
250
300
350
400
1990 2000 2010 2020
YEAR
WA
TER
DEM
AN
D (M
illio
n m
3 )
WildlifeIrrigation & forestryLivestockMining & energyOther settlementsRural villagesMajor villagesUrban centres
Figure 6: Projected distribution of water demand in Botswana in 2020
Urban centres31%
Wildlife2%
Livestock13%
Irrigation & forestry
14%
Mining & energy19%
Rural villages5%
Major villages15%
Other settlements1%
Water Demand, Supply and Resource Development: Namibian and Botswanan Sectors Section B
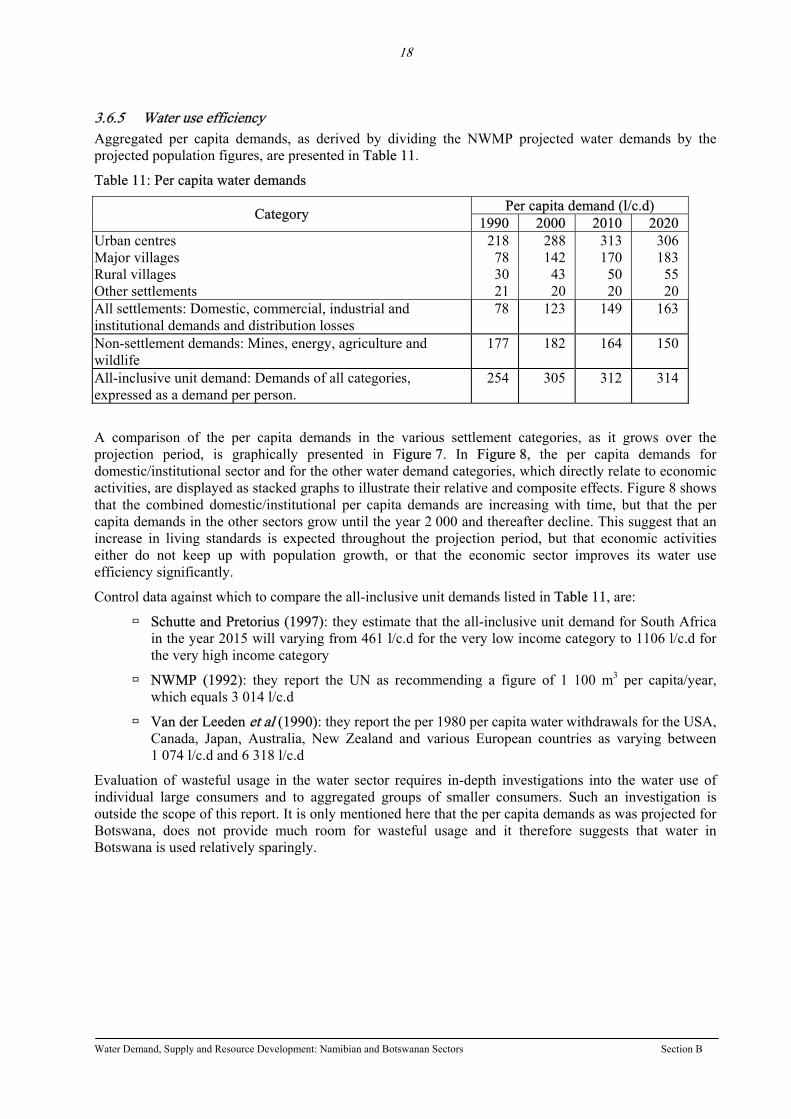
18
3.6.5 Water use efficiency Aggregated per capita demands, as derived by dividing the NWMP projected water demands by the projected population figures, are presented in Table 11.
Table 11: Per capita water demands
Per capita demand (l/c.d) Category 1990 2000 2010 2020 Urban centres 218 288 313 306 Major villages 78 142 170 183 Rural villages 30 43 50 55 Other settlements 21 20 20 20 All settlements: Domestic, commercial, industrial and institutional demands and distribution losses
78 123 149 163
Non-settlement demands: Mines, energy, agriculture and wildlife
177 182 164 150
All-inclusive unit demand: Demands of all categories, expressed as a demand per person.
254 305 312 314
A comparison of the per capita demands in the various settlement categories, as it grows over the projection period, is graphically presented in Figure 7. In Figure 8, the per capita demands for domestic/institutional sector and for the other water demand categories, which directly relate to economic activities, are displayed as stacked graphs to illustrate their relative and composite effects. Figure 8 shows that the combined domestic/institutional per capita demands are increasing with time, but that the per capita demands in the other sectors grow until the year 2 000 and thereafter decline. This suggest that an increase in living standards is expected throughout the projection period, but that economic activities either do not keep up with population growth, or that the economic sector improves its water use efficiency significantly.
Control data against which to compare the all-inclusive unit demands listed in Table 11, are:
Schutte and Pretorius (1997): they estimate that the all-inclusive unit demand for South Africa in the year 2015 will varying from 461 l/c.d for the very low income category to 1106 l/c.d for the very high income category
NWMP (1992): they report the UN as recommending a figure of 1 100 m3 per capita/year, which equals 3 014 l/c.d
Van der Leeden et al (1990): they report the per 1980 per capita water withdrawals for the USA, Canada, Japan, Australia, New Zealand and various European countries as varying between 1 074 l/c.d and 6 318 l/c.d
Evaluation of wasteful usage in the water sector requires in-depth investigations into the water use of individual large consumers and to aggregated groups of smaller consumers. Such an investigation is outside the scope of this report. It is only mentioned here that the per capita demands as was projected for Botswana, does not provide much room for wasteful usage and it therefore suggests that water in Botswana is used relatively sparingly.
Water Demand, Supply and Resource Development: Namibian and Botswanan Sectors Section B
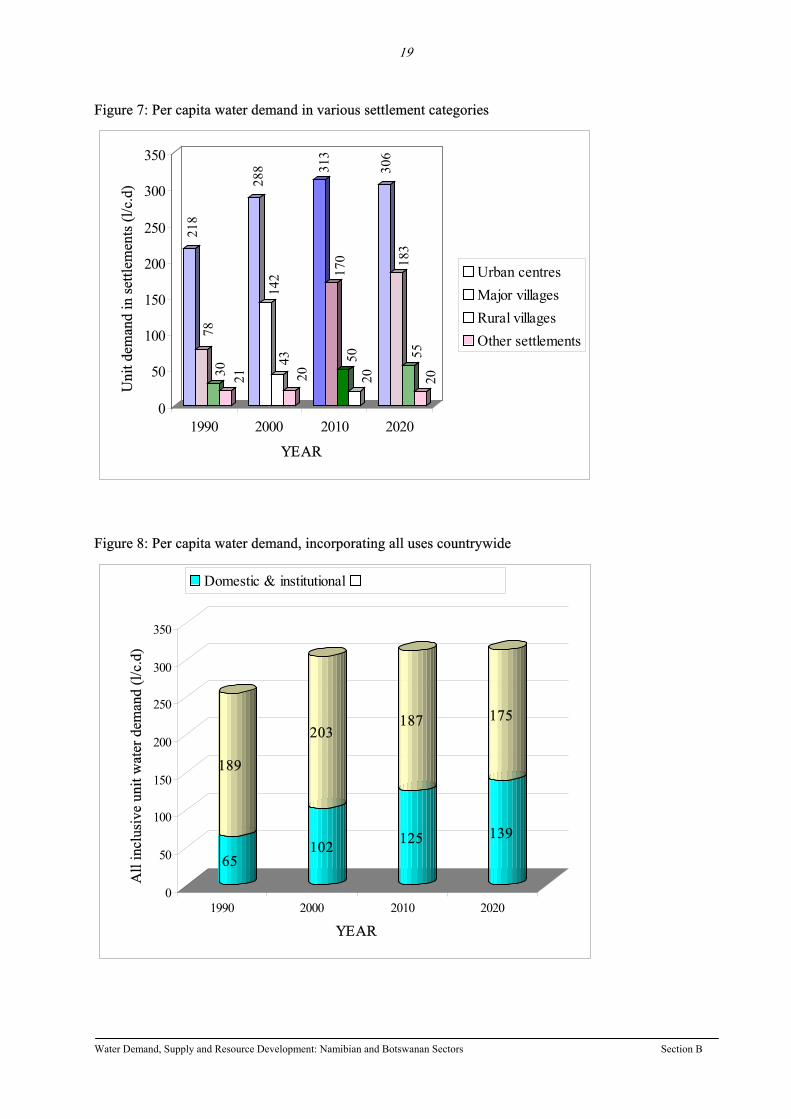
19
Figure 7: Per capita water demand in various settlement categories
218
7830 21
288
142
4320
313
170
5020
306
183
5520
0
50
100
150
200
250
300
350
Uni
t dem
and
in se
ttlem
ents
(l/c
.d)
1990 2000 2010 2020
YEAR
Urban centres
Figure 8: Per capita water demand, incorporating all uses countrywide
Major villagesRural villagesOther settlements
For economic activities
65
189
102
203
125
187
139
175
0
50
100
150
200
250
300
350
All
incl
usiv
e un
it w
ater
dem
and
(l/c.
d)
1990 2000 2010 2020
YEAR
Domestic & institutional
Water Demand, Supply and Resource Development: Namibian and Botswanan Sectors Section B
20
3.7 Existing and future water sources and supply In the NWMP of Botswana the country is divided into four major water supply regions, as described below. For orientation refer to Figure 2 where the country’s districts, urban centres and a number settlements are shown.
3.7.1 The South West The South West consists of the Ghanzi and Kgalagadi Districts, comprising 40% of Botswana’s land area, yet containing only 4% of the 1991 human population. Water demands are generally low, with most people living in small settlements.
Water in this region is, and will continue to be supplied from groundwater sources. Adequate groundwater is available for most of the villages in this region, except for Tsabong where the water is increasingly becoming saline. Here, desalination of the groundwater is being investigated.
More information on villages in this region is given in Table 12.
3.7.2 The North West Region (including the Okavango Delta) The north-west and northern part of Botswana, covering Ngamiland and Chobe districts and the Boteti sub-region of the Central District, comprises 30% of Botswana’s land area and contained 12% of the 1991 human population. The majority of people live in small rural settlements. Of the regional population, 34% live in the primary centres, Maun and Kasane, in the diamond mining towns of Orapa and Letlhakane and in Gumare village. More information on these and other substantial rural villages is given in Table 12 and discussed below.
The primary future sources of water are:
Kasane will continue to utilise surface water from the Chobe River
Shakawe will continue to utilise surface water from the Okavango River
Most settlements in the North West will continue to utilise local groundwater, although those close to the Okavango River may switch to using Okavango River water (verbal information by Mr Bockarie of MLGLH).
Maun used to be dependent on groundwater abstracted from boreholes in the Shashe river in the Okavango Delta, with a small contribution also coming from boreholes in the Thamalakane river. These sources are, however, insufficient (NWMP, 1992) and increasingly becoming polluted (Africa Information Afrique, 1997). A plan to augment the surface water flow in the Thamalakane river that runs past Maun, was contained in a Southern Okavango Integrated Water Development scheme (SMEC, 1987, 1991). This plan was suspended by the Government of Botswana after meeting with public opposition and after a review of the plan was produced by the IUCN (Howe, 1994). An extensive borehole development programme that includes aquifers around several of the Okavango Delta’s arteries near Maun is currently being undertaken by the DWA of Botswana.
Letlhakane is self sufficient in water supply, with water obtained from mine dewatering operations. Surplus water is exported to Orapa.
Orapa utilises groundwater, supplemented by occasionally available surface water from the Mopipi Dam in the Boteti River. The insufficient yield of these sources has lead to the plan of surface water augmentation as was proposed in the Southern Okavango Integrated Water Development scheme. After suspension of this plan, the focus was placed on an aquifer to the south of Orapa and west of Letlhakane. However, this is expected to provide interim relief only and further water supply schemes are required to meet the long term demands. One alternative that requires further investigation is to import water from the Eastern Botswana water supply infrastructure and to supplement water supply to that system from the Zambezi River.
Water Demand, Supply and Resource Development: Namibian and Botswanan Sectors Section B
21
3.7.3 The North East The North East, defined as the North East and Central Districts, excluding the Boteti sub-region, covers 18% of Botswana’s land and includes 40% of the total 1991 population. Over 40% of the population lives in settlements of more than 5 000 inhabitants and a substantial proportion of Botswana’s mining takes place in this region.
Local groundwater development is expected to be the most employed method of water supply to rural settlements. Larger centres are to be served either form the interconnected surface water sources on the North-South carrier and /or nearby groundwater sources.
More information on villages and mining in this region is given in Table 12.
3.7.4 The South East The South East, defined as the Southern, Southeast, Kweneng and Kgatleng Districts, covers 12% of Botswana’s land and includes 44% of the total 1991 population.
Water supplies will be reliant on nearby groundwater sources, on the Greater Gaborone water supply system, on importation via the North-South carrier, on potential developments in the Limpopo river and on water conservation and recycling options.
More information on villages and mining in this region is given in Table 12.
Water Demand, Supply and Resource Development: Namibian and Botswanan Sectors Section B

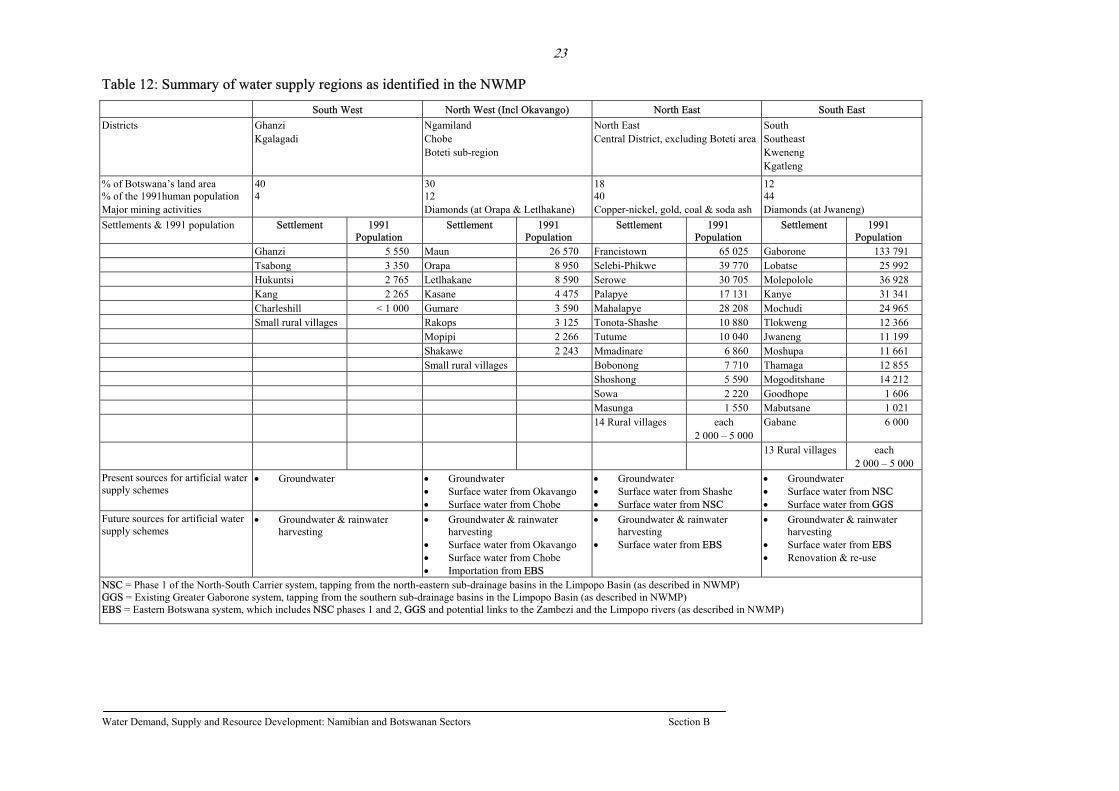
23
Table 12: Summary of water supply regions as identified in the NWMP
South West North West (Incl Okavango) North East South East Districts Ghanzi
Kgalagadi Ngamiland Chobe Boteti sub-region
North East Central District, excluding Boteti area
South Southeast Kweneng Kgatleng
% of Botswana’s land area 40 30 18 12 % of the 1991human population 4 12 40 44 Major mining activities Diamonds (at Orapa & Letlhakane) Copper-nickel, gold, coal & soda ash Diamonds (at Jwaneng) Settlements & 1991 population Settlement 1991
Population Settlement 1991
Population Settlement 1991
Population Settlement 1991
Population Ghanzi 5 550 Maun 26 570 Francistown 65 025 Gaborone 133 791
Tsabong 3 350 Orapa 8 950 Selebi-Phikwe 39 770 Lobatse 25 992 Hukuntsi 2 765 Letlhakane 8 590 Serowe 30 705 Molepolole 36 928 Kang 2 265 Kasane 4 475 Palapye 17 131 Kanye 31 341 Charleshill < 1 000 Gumare 3 590 Mahalapye 28 208 Mochudi 24 965 Small rural villages Rakops 3 125 Tonota-Shashe 10 880 Tlokweng 12 366 Mopipi 2 266 Tutume 10 040 Jwaneng 11 199 Shakawe 2 243 Mmadinare 6 860 Moshupa 11 661 Small rural villages Bobonong 7 710 Thamaga 12 855
Shoshong 5 590 Mogoditshane 14 212Sowa 2 220 Goodhope 1 606Masunga 1 550 Mabutsane 1 021
14 Rural villages each 2 000 – 5 000
Gabane 6 000
13 Rural villages each 2 000 – 5 000
Present sources for artificial water supply schemes
• Groundwater
• Groundwater • Surface water from Okavango • Surface water from Chobe
• Groundwater • Surface water from Shashe • Surface water from NSC
• Groundwater • Surface water from NSC • Surface water from GGS
Future sources for artificial water supply schemes
• Groundwater & rainwater harvesting
• Groundwater & rainwater harvesting
• Surface water from Okavango • Surface water from Chobe • Importation from EBS
• Groundwater & rainwater harvesting
• Surface water from EBS
• Groundwater & rainwater harvesting
• Surface water from EBS • Renovation & re-use
NSC = Phase 1 of the North-South Carrier system, tapping from the north-eastern sub-drainage basins in the Limpopo Basin (as described in NWMP) GGS = Existing Greater Gaborone system, tapping from the southern sub-drainage basins in the Limpopo Basin (as described in NWMP) EBS = Eastern Botswana system, which includes NSC phases 1 and 2, GGS and potential links to the Zambezi and the Limpopo rivers (as described in NWMP)
Water Demand, Supply and Resource Development: Namibian and Botswanan Sectors Section B
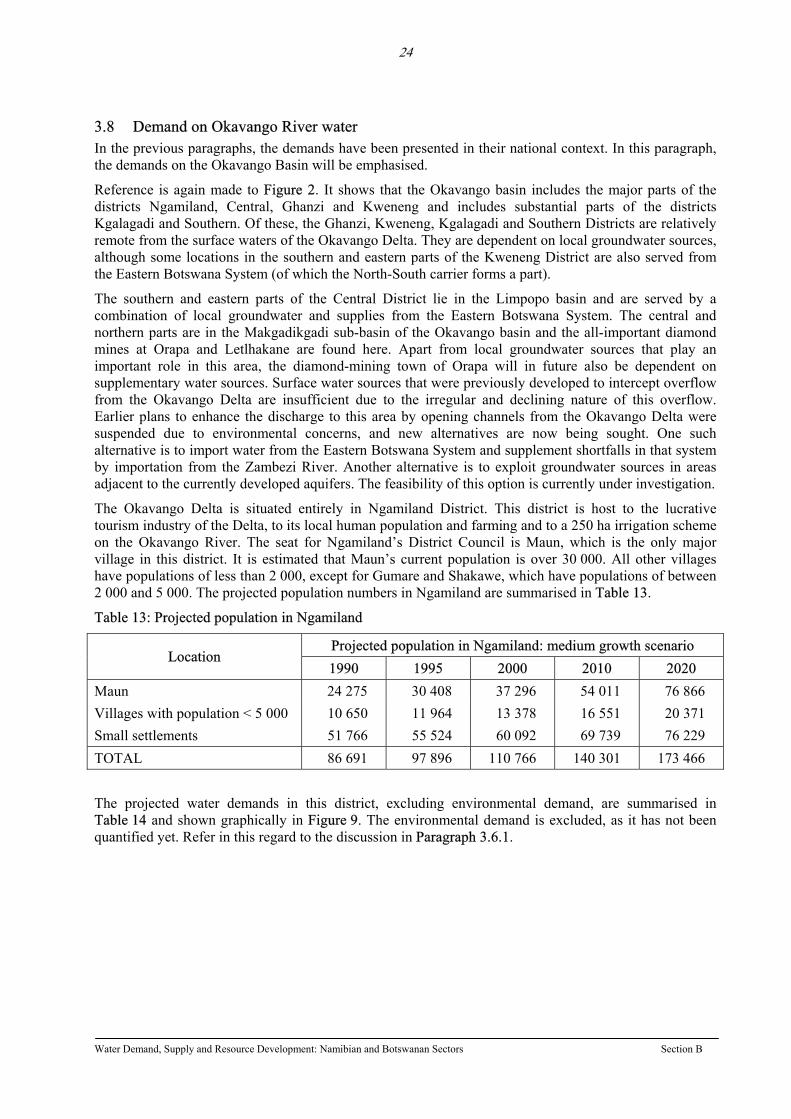
24
3.8 Demand on Okavango River water In the previous paragraphs, the demands have been presented in their national context. In this paragraph, the demands on the Okavango Basin will be emphasised.
Reference is again made to Figure 2. It shows that the Okavango basin includes the major parts of the districts Ngamiland, Central, Ghanzi and Kweneng and includes substantial parts of the districts Kgalagadi and Southern. Of these, the Ghanzi, Kweneng, Kgalagadi and Southern Districts are relatively remote from the surface waters of the Okavango Delta. They are dependent on local groundwater sources, although some locations in the southern and eastern parts of the Kweneng District are also served from the Eastern Botswana System (of which the North-South carrier forms a part).
The southern and eastern parts of the Central District lie in the Limpopo basin and are served by a combination of local groundwater and supplies from the Eastern Botswana System. The central and northern parts are in the Makgadikgadi sub-basin of the Okavango basin and the all-important diamond mines at Orapa and Letlhakane are found here. Apart from local groundwater sources that play an important role in this area, the diamond-mining town of Orapa will in future also be dependent on supplementary water sources. Surface water sources that were previously developed to intercept overflow from the Okavango Delta are insufficient due to the irregular and declining nature of this overflow. Earlier plans to enhance the discharge to this area by opening channels from the Okavango Delta were suspended due to environmental concerns, and new alternatives are now being sought. One such alternative is to import water from the Eastern Botswana System and supplement shortfalls in that system by importation from the Zambezi River. Another alternative is to exploit groundwater sources in areas adjacent to the currently developed aquifers. The feasibility of this option is currently under investigation.
The Okavango Delta is situated entirely in Ngamiland District. This district is host to the lucrative tourism industry of the Delta, to its local human population and farming and to a 250 ha irrigation scheme on the Okavango River. The seat for Ngamiland’s District Council is Maun, which is the only major village in this district. It is estimated that Maun’s current population is over 30 000. All other villages have populations of less than 2 000, except for Gumare and Shakawe, which have populations of between 2 000 and 5 000. The projected population numbers in Ngamiland are summarised in Table 13.
Table 13: Projected population in Ngamiland
Projected population in Ngamiland: medium growth scenario Location
1990 1995 2000 2010 2020 Maun 24 275 30 408 37 296 54 011 76 866 Villages with population < 5 000 10 650 11 964 13 378 16 551 20 371 Small settlements 51 766 55 524 60 092 69 739 76 229 TOTAL 86 691 97 896 110 766 140 301 173 466
The projected water demands in this district, excluding environmental demand, are summarised in Table 14 and shown graphically in Figure 9. The environmental demand is excluded, as it has not been quantified yet. Refer in this regard to the discussion in Paragraph 3.6.1.
Water Demand, Supply and Resource Development: Namibian and Botswanan Sectors Section B
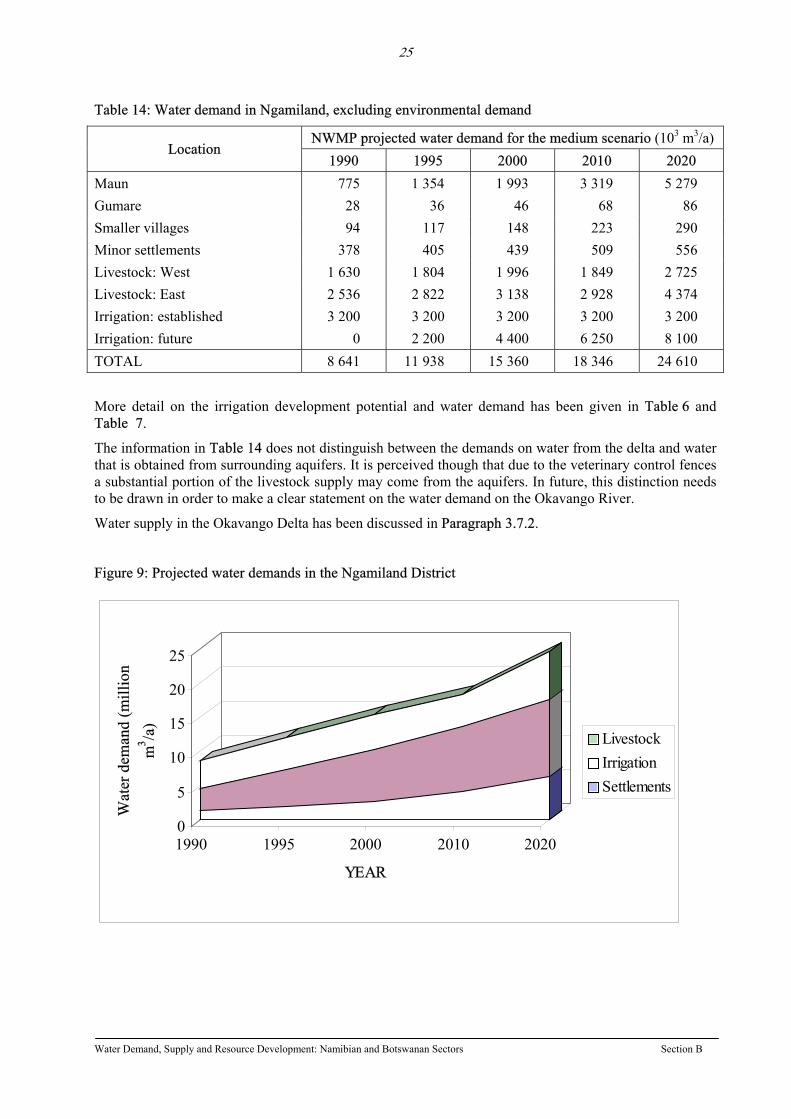
25
Table 14: Water demand in Ngamiland, excluding environmental demand
NWMP projected water demand for the medium scenario (103 m3/a) Location
1990 1995 2000 2010 2020 Maun 775 1 354 1 993 3 319 5 279 Gumare 28 36 46 68 86 Smaller villages 94 117 148 223 290 Minor settlements 378 405 439 509 556 Livestock: West 1 630 1 804 1 996 1 849 2 725 Livestock: East 2 536 2 822 3 138 2 928 4 374 Irrigation: established 3 200 3 200 3 200 3 200 3 200 Irrigation: future 0 2 200 4 400 6 250 8 100 TOTAL 8 641 11 938 15 360 18 346 24 610
More detail on the irrigation development potential and water demand has been given in Table 6 and Table 7.
The information in Table 14 does not distinguish between the demands on water from the delta and water that is obtained from surrounding aquifers. It is perceived though that due to the veterinary control fences a substantial portion of the livestock supply may come from the aquifers. In future, this distinction needs to be drawn in order to make a clear statement on the water demand on the Okavango River.
Water supply in the Okavango Delta has been discussed in Paragraph 3.7.2.
Figure 9: Projected water demands in the Ngamiland District
Wat
er d
eman
d (m
illio
n m
3 /a)
1990 1995 2000 2010 2020
YEAR
Livestock
0
5
10
15
20
25
IrrigationSettlements
Water Demand, Supply and Resource Development: Namibian and Botswanan Sectors Section B
26
4. ROLE OF THE MASTER WATER PLAN The bulk of the information presented in this report was obtained from the NWMP (1992) of Botswana. This is a comprehensive set of documents, consisting of a 12-volume phase 1 set (1991) and a phase 2 (1992) report. This master plan has guided the water sector development in Botswana since 1992, although not all recommendations have been implemented yet. The plan is 6 years old now and the Director of Water Affairs has indicated that it will be renewed soon. It provides
comprehensive water demand analyses and forecasts up to 2020 for various consumer categories and demand areas in Botswana
analyses of the state of the water sector
recommendations to strengthen the legislative and institutional backbone of the sector
hydrological and hydrogeological reviews
analyses of existing and future water sources (excluding the Okavango), complete with source development strategies, financial resource requirements and proposals for environmental assessments to accompany such development
sector management and pricing policies
considerations related to sanitation, desalination of brackish groundwater, water demand management, importation of water from South Africa and re-use and reclamation of wastewater
The role of the Okavango River in the National water supply strategy is not addressed in the NWMP. Prior to the compilation of the NWMP, a Southern Okavango Integrated Water Development scheme was planned, whereby the Boro river in the delta would have been opened up to improve discharge into the Thamalakane river that runs past Maun. (SMEC, 1987, 1991). This plan was suspended by the Government of Botswana after meeting with public opposition and the IUCN was called in to review the plan. At the time of production of the NWMP, the review was ongoing and the master plan therefore did not include the Okavango River as a resource in its water supply proposals. However, it did provide projected water demands for established consumer categories in the region and it made allowance in its demand projections for additional irrigation developments at the river. This information was presented in previous paragraphs of this report.
Future water supply to Maun and to the Orapa diamond mine, which previously was intended to be met from the Okavango Delta (see Paragraph 3.7.2), was not resolved in the NWMP. Now, extensive groundwater studies are being carried out in order to determine the sufficiency of the latter for these two centres.
The NWMP also does not address the issue of environmental water demand, other than what was described in Paragraph 3.6.1 of this report.
5. DIAGNOSTIC ASSESSMENT AND FURTHER WORK
5.1 Unit water demand and review of the demand projections A diagnostic assessment of the per capita demands in Botswana was presented in Paragraph 3.6.5. It was indicated there that the projected per capita demands are relatively low and perhaps too low if economic growth is to keep up with or exceed the projected population growth. This observation supports the notion that the water demands should be re-assessed, which, in accordance with DWA policy, should be done every five years. To support the current OKACOM initiatives and the intentention of DWA to re-evaluate every five years, it is recommended that the Botswana water demand projections be updated soon.
Review of the water demand projections will perhaps be best done by using the computerised models that were developed for this purpose by the consultants who compiled the NWMP.
Water Demand, Supply and Resource Development: Namibian and Botswanan Sectors Section B
27
5.2 Water demand and supply regions Water demands up to 2020 by the human and economic environments in Botswana have been comprehensively analysed and projected in the NWMP (1992). Demands were subdivided by category and location. Water supply was then evaluated by dividing the country into four water supply regions. These divisions have been made along district boundaries and named South West, North West, North East and South East respectively. However, this subdivision was done from the national perspective and not with particular focus on river basin or aquifer management. For the latter purpose, it is recommended that additional labels be attached to consumer entities and to sources to assess the demand and supply, by category, within the different catchments and major aquifer regions. In particular, this is required for:
the Okavango swamp area and the adjacent groundwater area that is recharged from the swamps (which will include the requirements of Maun and proposed irrigation land)
the Okavango Delta – Makgadikgadi Pan axis (which will include requirements of the Orapa diamond mine)
the Okavango Basin as a whole (see Figure 2)
Categorisation along river basin and major aquifer boundaries will enable the evaluation of the local demands on each of the river and groundwater systems and the need for inter-basin transfers. This in turn will enable improved basin management and provide the information needed for water use agreements with neighbouring countries.
5.3 Role of the Okavango River as resource Due to reasons mentioned in a previous paragraph, the role of the Okavango River as a national resource is not clarified in the NWMP and water supply to Maun and Orapa was left unresolved. Since the compilation of the NWMP, however, the IUCN review of the Southern Okavango Integrated Water Development scheme has become available and considerable more fieldwork has been done to quantify groundwater sources near Maun and Orapa. A consolidation of this new information, along with revised demand assessments, will bring more perspective on the water demand and supply constraints than what previously existed and such work is recommended.
Other issues regarding the status of the river as a national resource include:
prioritisation of the status of potential irrigation developments at the Okavango River, as described in the NWMP, against other competing consumers and interests
extent and significance of groundwater recharge of the area surrounding the swamps
environmental significance of the delta (which is the focus of reports done by others)
5.4 Okavango River consumer register A register of existing users of the Okavango River water that describes its location, methods of water production and wastewater disposal, purpose of use and quantities used, is necessary to:
put the established claims to Okavango River water in perspective
evaluate the implications of allowing new consumers access to the source
exercise pollution control supervision
Botswana officials have indicated that the surveys to establish this register were being carried out at the time of investigations for this report. It is recommended that the information forthcoming from such an inventory be incorporated in Okavango Basin management portfolio.
Water Demand, Supply and Resource Development: Namibian and Botswanan Sectors Section B
28
6. SUMMARY OF RECOMMENDATIONS FOR FURTHER WORK With reference to previous discussions and motivations, it is recommended that the following work be done by DWA (Botswana) and/or OKACOM:
(a) Establish a database with the most recent data on existing consumers at the Okavango river, containing at least their names, location, purpose for which water is used, amounts of water used, methods of water production and status of wastewater discharged and planned expansion
(b) Analyse the current (1998) water consumption figures and losses for all consumer categories and update the national water demand projections by applying the demand forecasting model that was established by the developers of the NWMP
(c) Attach additional identification labels to all consumer categories to enable computerised sorting thereof according to their associated water resource basins, and use this to produce demand projections for consumers in the Okavango catchment, the Okavango-Makgadikgadi axis and the Okavango swamp area
(d) Review of the status of groundwater resources for the supply to Maun and Orapa, and the role of the Okavango Delta in this respect
(e) Prioritise the demands on Okavango river water with special reference to
the established rural population, their socio-economical activities and their natural growth
the natural environment
the tourism industry and wildlife management
developing large settlements such as Maun
consumers further downstream of the Delta, such as Orapa diamond mine
existing and planned commercial irrigation at the river
(f) Define the status of the Okavango Delta as national water resource in the context of its international character and provide legislation and resources to maintain/establish that status
Water Demand, Supply and Resource Development: Namibian and Botswanan Sectors Section B
29
7. LITERATURE REFERENCES
Africa Information Afrique (1997): Botswana: waiting for the waters. Internet publication by Africa Information Afrique, 28 August 1997
Howe, CW (1994). The IUCN review of the southern Okavango integrated water development project. Environment. Jan-Feb 1994. 36 (1) 25
NWMP (1992): Botswana national water master plan study: Phase 1 (12 volumes) and Phase 2 (final report). Prepared for the Government of Botswana, Ministry of Mineral Resources and Water Affairs, Department of Water Affairs by Snowy Mountains Engineering Corporation Ltd and Knight Pièsold Botswana, Phase 1: 1991; Phase 2: July 1992
McCarthy TS and Ellery WN (1997). The fluvial dynamics of the Maunachira Channel system, northeastern Okavango Swamps, Botswana. Water SA 23 (2) 115-125
Burke JJ and Patorni F (1993): Proceedings of the workshop on water resources management in Southern Africa. Sponsored by World Bank, the Commonwealth Secretariat, United Nations and Canadian International Development Agency; held at Victoria Falls, Zimbabwe, July 5-9, 1993.
Schutte CF and Pretorius WA (1997). Water demand and population growth. Water SA 23 (2) 127-133
SMEC (1987). Southern Okavango integrated water development plan, Phase I: Final report, Technical study (5 vols.). Prepared for the Government of Botswana, Ministry of Mineral Resources and Water Affairs, Department of Water Affairs
SMEC (1991). Southern Okavango integrated water development: Sukwane Dam and pipeline to Mopipi, feasibility/preliminary design study. Final report. Prepared for the Government of Botswana, Ministry of Mineral Resources and Water Affairs, Department of Water Affairs
Van der Leeden F, Troise FL and Todd DK (1990). The water encyclopedia. 2nd ed. Lewis Publishers, Michigan, USA
Water Demand, Supply and Resource Development: Namibian and Botswanan Sectors Section B
30
ANNEXURE A: INVESTIGATION CONSULTATIONS
The investigations for this report included consultations with officials in Botswana, the particulars of whom are presented in Table A1.
Table A1: Consultation schedule
Date Time Meeting with Topics Discussed
Tu 27 Jan 98 12:40 Prof. Lars Ramberg Head: Harry Oppenheimer Okavango Research Centre
Environmental water demand on Okavango system and related research requirements
08:00 Mr BBJ Khupe Director: DWA
Introductory meeting and establishment of meeting schedule for the two days
09:30 Mr M Sekwale Project Co-ordinator: North-South Carrier
All items on the attached Discussion Agenda
We 28 Jan 98
14:30
Officials of DWA: Mr BBJ Khupe: Director Mr I Muzila: Deputy Director Mr O Katai: Hydro-geologist Mr G Gabaake: Hydro-geologist
All items on the attached Discussion Agenda
08:00 Mr FM Maunge: Deputy Chief Executive: WUC
Items from the attached Discussion Agenda relevant to urban water supply
Th 29 Jan 98
10:00 Mr J Bockarie: Ministry of Local Government, Lands and Housing
Items from the attached Discussion Agenda relevant to village and rural water supply
Water Demand, Supply and Resource Development: Namibian and Botswanan Sectors Section B
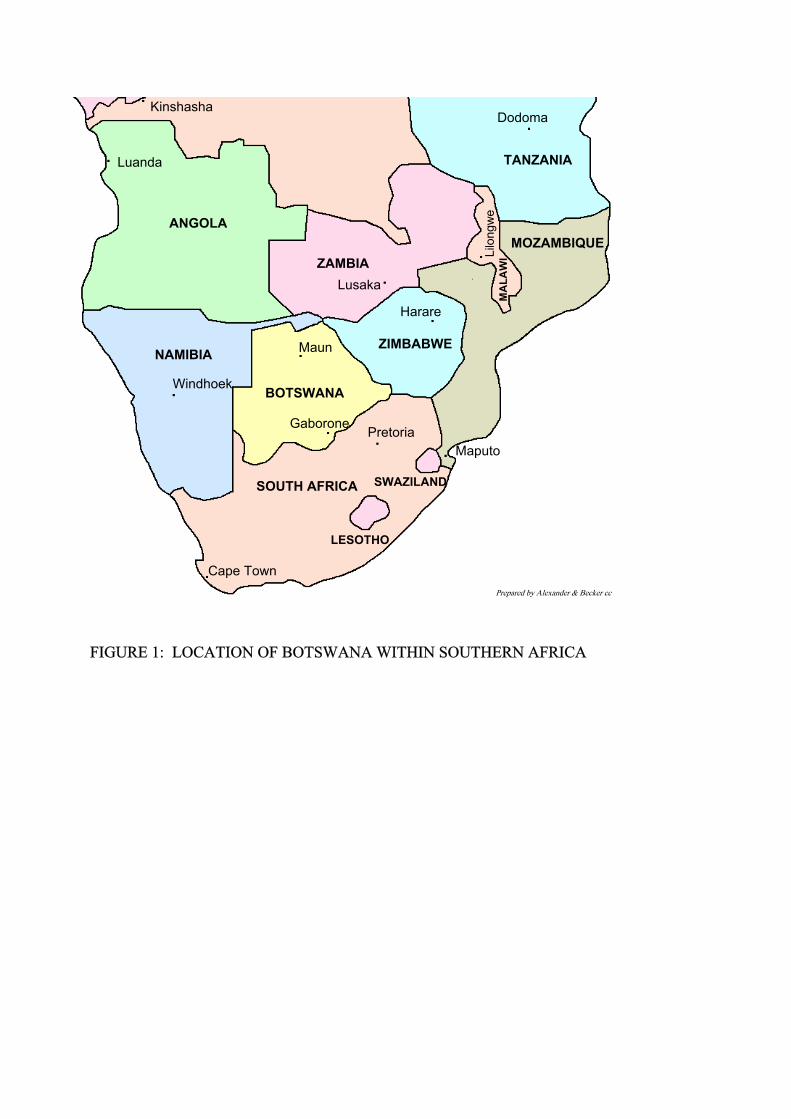
Prepared by Alexander & Becker cc
BOTSWANA
NAMIBIA
ZAMBIA
ZIMBABWE
SOUTH AFRICA
MOZAMBIQUE
MA
LAW
I
ANGOLA
TANZANIALuanda
Lusaka
Gaborone
Maun
Windhoek
Pretoria
Harare
SWAZILANDLi
long
we
Maputo
Cape Town
LESOTHO
DodomaKinshasha
FIGURE 1: LOCATION OF BOTSWANA WITHIN SOUTHERN AFRICA
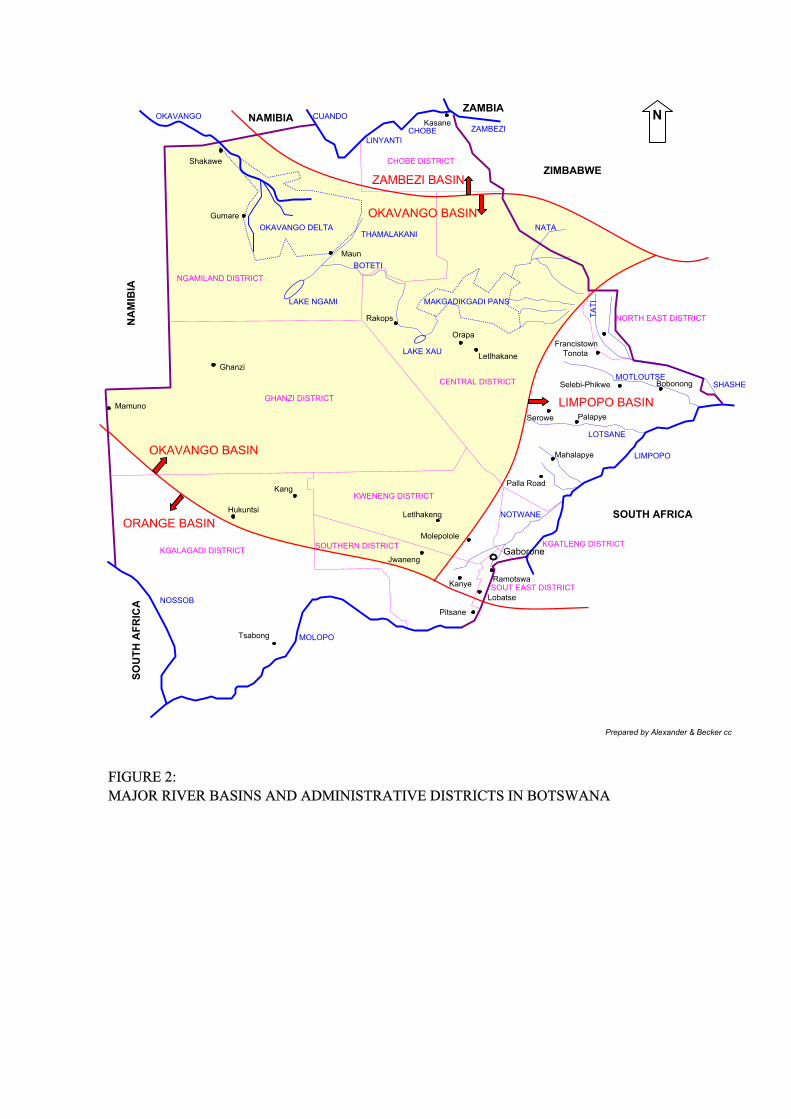
Maun
Orapa
ZAMBEZI
OKAVANGO DELTA
MAKGADIKGADI PANS
Kasane
Shakawe
Gumare
GhanziLetlhakane
Mamuno
TonotaFrancistown
LINYANTI
CUANDO
CHOBE
MOLOPO
LIMPOPO
NOSSOB
KGALAGADI DISTRICT SOUTHERN DISTRICT
KWENENG DISTRICT
GHANZI DISTRICT
KGATLENG DISTRICT
SOUT EAST DISTRICT
NGAMILAND DISTRICT
CENTRAL DISTRICT
NORTH EAST DISTRICT
CHOBE DISTRICT
LAKE NGAMI
LAKE XAU
THAMALAKANI
BOTETI
NN
AM
IBIA
ZIMBABWE
SOUTH AFRICA
ZAMBIA
SOU
TH A
FRIC
ANAMIBIA
Gaborone
Tsabong
Lobatse
Molepolole
Selebi-Phikwe
Mahalapye
Palapye
MOTLOUTSE
LOTSANE
NOTWANEORANGE BASIN
OKAVANGO BASIN
ZAMBEZI BASIN
LIMPOPO BASIN
OKAVANGO BASIN
TATI
SHASHE
NATA
Rakops
Letlhakeng
Palla Road
Serowe
Bobonong
Jwaneng
Kang
Hukuntsi
Ramotswa
Pitsane
Kanye
OKAVANGO
FIGURE 2: MAJOR RIVER BASINS AND ADMINISTRATIVE DISTRICTS IN BOTSWANA
Prepared by Alexander & Becker cc
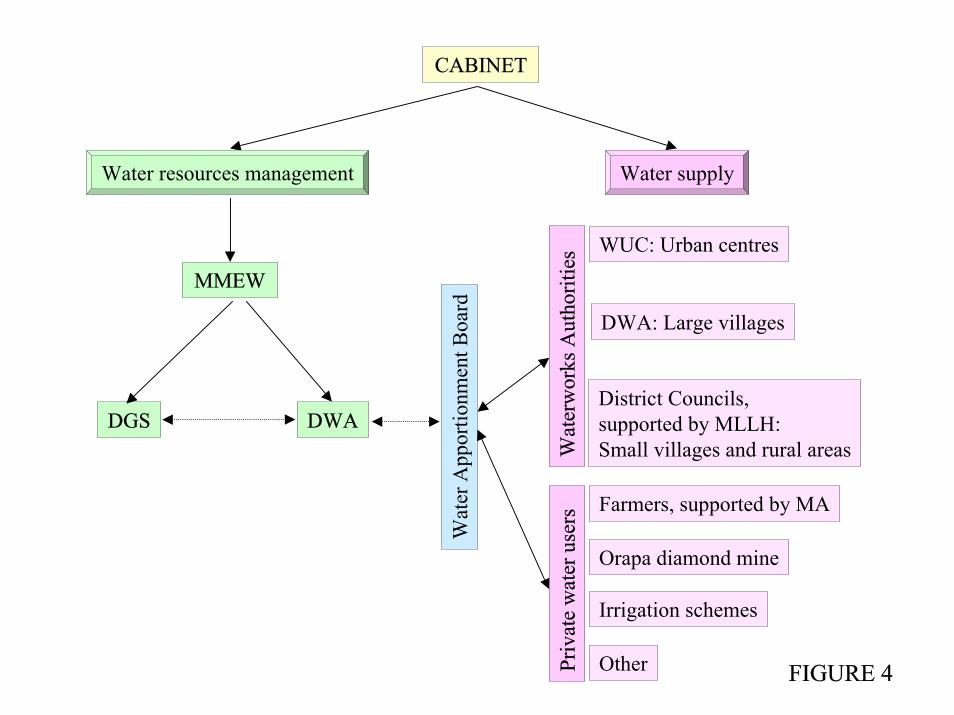
CABINET
Water resources management Water supply
MMEW
DWA
Wat
er A
ppor
tionm
ent B
oard
Wat
erw
orks
Aut
horit
ies
Irrigation schemes
Priv
ate
wat
er u
sers Farmers, supported by MA
Orapa diamond mine
Other
DWA: Large villages
District Councils,supported by MLLH: Small villages and rural areas
FIGURE 4
WUC: Urban centres
DGS
Prepared by Alexander & Becker cc