Embed Size (px)
Citation preview

CChhaapptteerr 33 DDeemmaanndd SSuurrvveeyy ffoorr HHuummaann RReessoouurrccee DDeevveellooppmmeenntt
Chapter 3 Demand Survey for Human Resource Development
Chapter 3 Demand Survey for Human Resource Development
3.1 Outline of the demand survey
The Study conducted two surveys of manufacturing SMEs in parallel, 1) interview survey by the Study Team and 2) questionnaire survey. Need assessments of the industry are indispensable for the planning of the human resource development programs. Results of the need assessment of the Study will serve as a basis for the formulation of the action plan.
3.1.1 Interview survey
The experts of the Study Team who have ample experience of diagnosis, consultation and training for SMEs in Japan and also in several developing countries visited Indonesian SMEs of supporting industry for interview on their policy and activities of staff training. At the same time, they inspected production sites and evaluated their technology levels. During the inspection, responding to the requests from the SMEs, they gave advice and consultation as far as time allowed.
(1) Selection of SMEs
This study targets parts and components manufacturing SMEs for assemblers of transportation equipment, electric and electronic appliances, and general machineries. The priority was given to the viable local SMEs for the supporting industry which have not yet a constant and stable contract with assemblers. The definition of SMEs in terms of the number of employees was not strictly followed.
The selection was made using the following directories of industrial associations. In
addition, some assemblers were visited to ask them to introduce the local supporting SMEs. • List of ASPEP (Association of Metalwork and Machinery) • List by Foundry Union (as a concrete example; BAKRIE TOSAN JAYA) • List of ASSOCIATION OF ASTRA MOBIL’S VENDOR/SUPPLIERS (PIVA) • List of GIAMM (INDONESIAN AUTOMOTIVE PARTS & COMPONENT
INDUSTRIES ASSOCIATION) • List of ASSOCIATION OF MACHINERY – WEST JAWA • List of ELECTRICAL MACHINERY AND APPRATUS N.E.C. • LIST OF ELECTRONIC SUPPORTING INDUSTRIES • INDONESIAN METALWORK AND MACHINERY INDUSTRY GUIDE 2001
3 - 1
Chapter 3 Demand Survey for Human Resource Development
(2) Questions Questions asked to the SMEs during the visits were as follows. Most of the interviewees
were managers of the companies responsible for management and administration including human resource development.
1) Outlines of the company 2) What is the urgent problem of your company to solve? How do you evaluate the
competitiveness of your products? 3) Policies for human resource development of the staff? 4) Past records of Off-JT (subject, training agency, trainees, results)? 5) Priority area and target employees for Off-JT in the future? 6) If you are not interested in Off-JT, why? 7) Do you know the MOIT training agencies and their programs? 8) Have you invited the consultants or advisors from outside? If yes, in which area? Results? 9) Do you want the support of outside consultants or advisors in the future? 10) Any requests to the Government on the human resource development?
3.1.2 Questionnaire survey
Interviewers of the local consultant visited SMEs with questionnaires prepared by the Study Team.
(1) Selection of SMEs
Target was SMEs of the supporting industry located mostly in Jakarta, Bandung, Semarang and Surabaya. The following directories were used for the selection.
Directory GIAMM 1997 – 2003 Directory of Supporting Industry Electronica, MOIT Office of MOIT Bekasi Office of MOIT Jakarta East Office of MOIT Tangerang Office of MOIT Central Java (Semarang) Office of MOIT East Java (Surabaya) Office of MOIT West Java (Bandung) Association of Mechanic Bandung Association of Electronica Jakarta Association of Metal Industry Surabaya
3 - 2
Chapter 3 Demand Survey for Human Resource Development
Cooperative Metal Industry Klaten
(2) Questionnaires Questionnaire consisted of the following questions.
1) How do you grapple with the problem of staff training? 2) Past records of the Off-JT (subject, training agency, position and the number of
trainees)? 3) Comments on the cost of the Off-JT 4) Results of the Off-JT? 5) If results were negative, what do you think the reason? 6) How did you know the Off-JT programs to which you sent your staff? 7) Will you send your staff to the Off-JT in the future? 8) If you are not interested in sending your staff to the Off-JT, why? 9) Priority area and target employees for the Off-JT in the future? 10) What kind of training do you prefer? 11) Available time or duration of the Off-JT? 12) Any limit of cost to bear? 13) Have you invited the consultants or advisors from outside? In which area? Results? 14) Do you want the support of outside consultants or advisors in the future? In which area? 15) Do you know the MOIT training agencies and their programs? 16) Any requests to the Government on the human resource development?
3.2 Business Development of the SMEs in the Supporting Industry
3.2.1 Business Development of the SMEs in the Supporting Industry
To analyze the results of the demand surveys of the supporting industry, SMEs in the supporting industry were classified into four (4) groups by the stage of business development based on the contract situation with the OEM buyers.
Stage-1 Products (parts and components) are for after-market. Stage-2 QCD (Quality, Cost, and Delivery) of the products have not reached the
audit level of the OEM buyers yet. Stage-3 Contract with the OEM buyers is unstable. Stage-4 Contract with the OEM buyers is stable.
3 - 3
Chapter 3 Demand Survey for Human Resource Development
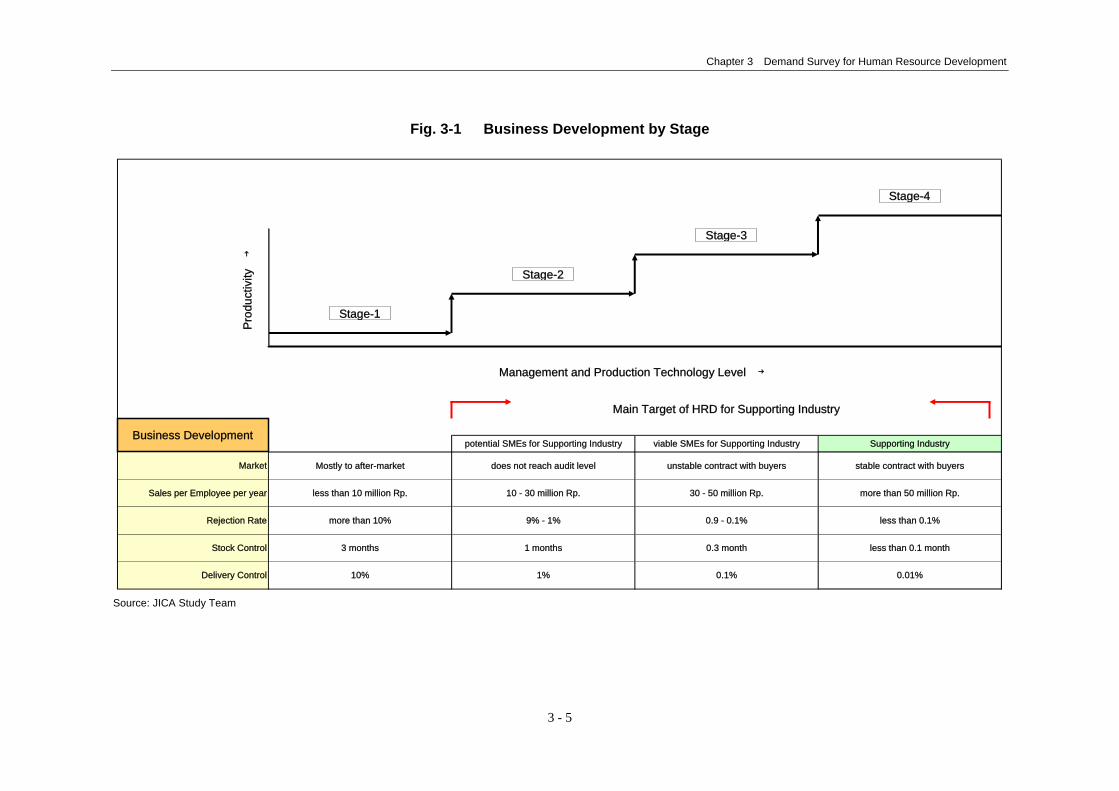
During the interview survey, in addition to the questions about human resource development, general company data about their business was collected. Using the data obtained, the yearly sales amount per employee, rejection rate, stock level, and inventory level were assumed for each stage as shown in the Fig. 3-1. While management and production technologies level rise, the productivity improves and the company becomes more integrated into the supporting industry.
There are cases where SMEs are operating on a consignment basis with raw materials
provided by the buyers, then, their small sales amount does not reflect the stable contract with the buyers. However, these are assumed not to apply to most of supporting SMEs.
The criteria for classification of SMEs by stages established by the interview survey were
applied to the analysis of the questionnaire survey.
3 - 4
Chapter 3 Demand Survey for Human Resource Development
Fig. 3-1 Business Development by Stage
0.01%Delivery Control 10% 1% 0.1%
less than 0.1%
Stock Control 3 months 1 months 0.3 month less than 0.1 month
Rejection Rate more than 10% 9% - 1% 0.9 - 0.1%
stable contract with buyers
Sales per Employee per year less than 10 million Rp. 10 - 30 million Rp. 30 - 50 million Rp. more than 50 million Rp.
Market Mostly to after-market does not reach audit level unstable contract with buyers
potential SMEs for Supporting Industry viable SMEs for Supporting Industry Supporting Industry
Stage-1
Management and Production Technology Level →
Pro
duct
ivity
→
Stage-2
Stage-3
Stage-4
Main Target of HRD for Supporting Industry
Business Development
Source: JICA Study Team
3 - 5
Chapter 3 Demand Survey for Human Resource Development
3.2.2 Estimated Number of Companies in Supporting Industry by Stage
The number of companies in supporting industries by stage at a national level of Indonesia is estimated as follows.
Table 3-1 Estimated Number of Companies in Supporting Industry by Stage
Unit: No. of Companies Stage 1 Stage 2 Stage 3 Stage 4
Electrics/Electronics Appliances 98,000 10,900 1,600 560
Transportation Machineries 1,000 700 600 240
General Machineries * * * 250
99,000 11,600 2,200 1,050
(1)
(4)
(7)
(2)
(5)
(3)
(6)
Remark *, primary and secondary parts/components suppliers for general machinery are deemed as the same as
supplier of electrics/electronics and transportation machinery Source: JICA Study Team
The number of stage-4 companies of each sub-sector is discussed at sections 3.2.2(2),
3.2.2(3) and 3.2.2(4). (1):The number of stage-3 group companies is assumed approximately to be 3 times bigger
than the stage-4 according to the interviews to relevant industrial associations. (2) and (3):The numbers of stage-2 and -1 companies are taken from statistical data (the
number of SMEs of electric appliances). One tenth of the figure of the statistical data is applied to the stage-2 and the remaining portion has been allocated to stage-1.
(4):The number of stage-3 is estimated approximately 2.5 times bigger than that of the stage 4, according to the relevant association.
(5) and (6):The number of small scale “Motor vehicle” plus “Other transport equipment” in the statistical data has been used to stage-2 and -1.
(7):Manufacturers in stage-3 and -2 are included in Electrics/Electronics Appliances as well as Transportation Machineries. Small and medium sized general machinery manufacturers do not appear in statistical data whereas there are statistical data for large-scale general machinery manufacturers.
(1) Precondition for estimation
1) Data sources utilized The sources utilized are listed here.
1. Statistical Year Book of Indonesia, 2002, National Bureau of Statistics
3 - 6

Chapter 3 Demand Survey for Human Resource Development
2. Directory for Electric/Electronics Manufacturers in Indonesia, National Investment Board, Indonesian Electrics & Home Electric Appliances Industries Association (Association of ELECTRONIC)
3. Directory for Electrics & Home Electric Appliances Industries Association members 4. List of Supporting Industries by Association of ELECTRONIC 5. Directories of GAIKINDO and GIAMM 6. Activity Report 1998, MOIT & JICA Study Team (on Production in Indonesian
machinery industry by type of products) 7. Directory of Association of Metalwork and Machinery (ASPEP) 8. Result of interviews to manufacturers by JICA Study team, 2003
Note: Transformers, power units, electric motors, generator sets, circuit breakers, lighting assembles, etc. are considered as parts/components.
2) General feature of manufacturers at each stage
Stage 4: (Stable parts/components suppliers): The manufacturers in this stage supply their products to assemblers regularly. And their parts/components are acknowledged as genuine parts. Generally, quality, highly processed and/or precision parts and components manufacturers are categorized in this group.
Stage 3: (viable suppliers): The manufacturers in this stage receive orders from OEM buyers (assemblers or 1st tier suppliers), occasionally (unstable).
Stage 2: (potential suppliers): Suppliers target post-sales and maintenance-purpose market because their QCD do not meet the requirement of assemblers.
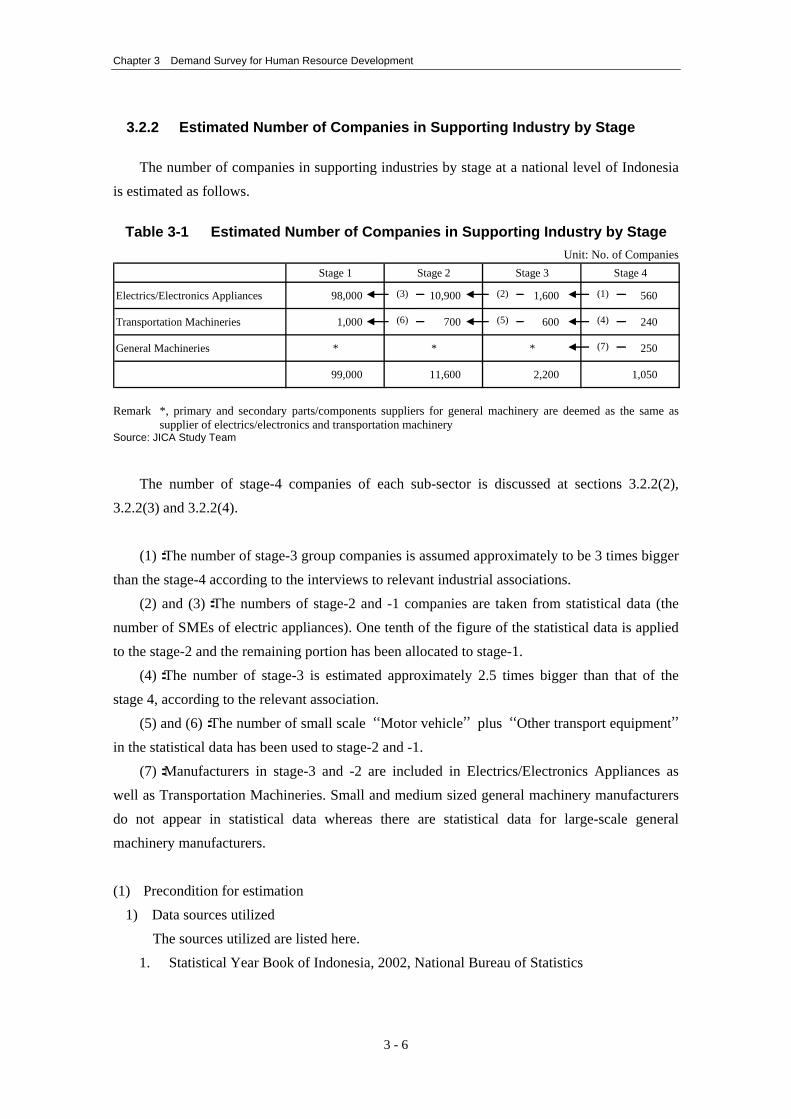
Stage 1: Manufacturers apply only basic skills for production of aftermarket. The structure of parts and components supply to assemblers is illustrated in Fig. 3-2.
3 - 7
Chapter 3 Demand Survey for Human Resource Development
Fig. 3-2 Structure of Parts and Components Supply
Source: JICA Study Team
The 4th Stage Supplier
ASSEMBLERS(Assemble parts/components for final products)
The 3rd Stage Supplier
(2) Electric/Electronics Appliances (E/E)
Table 3-2 summarizes the estimated number of stage-4 suppliers. Table 3-2 Summary Table of Estimated Number of Stage-4 Suppliers
Electronic Appliances 2)
Electric Machineries 2) Total
(1) Estimated number of exclusive suppliers1) by interview to the relevant associations 4 4
(2) Total number of electric/electronics assemblers based on the data from Investment Board and estimation made by the Association of ELECTRONIC
36 12 48
(3) Number of common suppliers 268 3) 96 3)
(4) Estimated number of stage-4 suppliers: (2)×(1)+(3) 420 140 560
Remarks: 1): Exclusive supplier means the manufacturer that produces special parts/components only for specific assembler. 2): These classifications are complying with the Statistical Year Book. 3): Most of suppliers except exclusive suppliers do not limit the market only to one assembler. According to the
relevant associations and assemblers, the number of common parts and components suppliers was estimated. Source: JICA Study Team
(3) Transportation Machineries
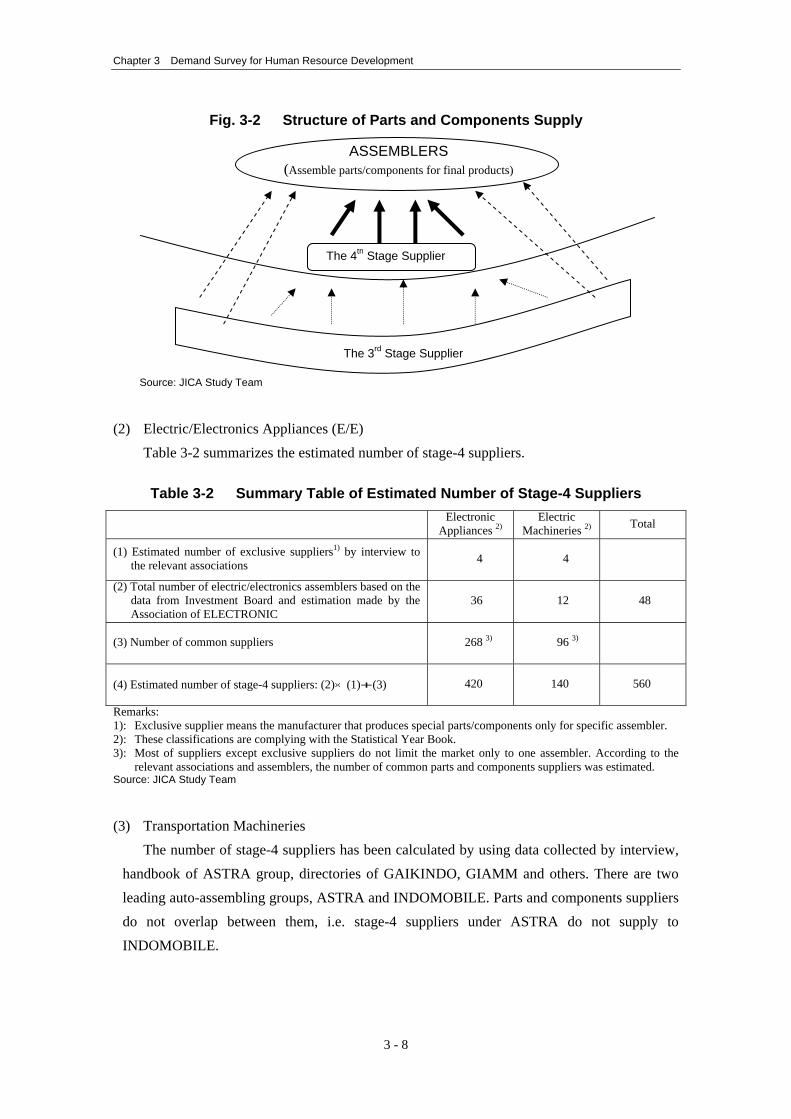
The number of stage-4 suppliers has been calculated by using data collected by interview, handbook of ASTRA group, directories of GAIKINDO, GIAMM and others. There are two leading auto-assembling groups, ASTRA and INDOMOBILE. Parts and components suppliers do not overlap between them, i.e. stage-4 suppliers under ASTRA do not supply to INDOMOBILE.
3 - 8
Chapter 3 Demand Survey for Human Resource Development
The number of stage-4 suppliers of each group is about 100 to 110 respectively. In addition, there are suppliers mainly to two wheeler assemblers.
Accordingly, the number of stage-4 suppliers in the transportation machinery manufactures
is estimated as 240.
Fig. 3-3 Automotive Assemblers and the Stage 4 Suppliers
1 S u n t e rT O Y O T A D a ih a t s uG A Y A - - - - - - - - - - - I s u z u p a s s e n g e r v e h ic leH O N D A G M ( in c l.O p e l) , D im le r - c h r y s le r
2 B E K A S I V o v lo , P u je u t , F ia tS U Z U K II S U Z UI S U Z U T R U C KN I S S A N D I E S E LG E N E R A L M O T O R SB A K R I I E M O T O R ST O Y O T A T R U C K
3 B O G O RD I M L E R C H R Y S L E R
4 D U L O G A D U N GM I T S U B I S H I( K R A M A Y U D H A T I G H B E R L I A N )( K A R A M A Y U Y R A R A T H M O T O R S )
5 K A R A W A N GH O N D A P R O S N E G M O T O R
6 C I K A R A N GH Y U N D A I : C K D O n ly
7 T A N G E R A NM I T S U B I S H I B U ST R I J A Y A
T w o W h e e le r s ( m o t o r c y c le ) :H O N D A - - - - - - S u n t e r I , S u n t e r I I ( P e g a n g s u n )Y A M A H A - - - - - - P u lo g a d a n gS U Z U K I - - - - - - - B e k a s iK A W A S A K I - - - - - - - P u lo g a d a n g
2 0 0 t o 2 2 0s u p p lie r s
2 0 t o 4 0s u p p lie r s
2 4 0
Source: JICA Study Team
(4) General Machineries
The number of state-4 suppliers in General Machinery sub-sector will be given by two approaches, 1) field survey report under the follow-up study on supporting industry in Indonesia by JICA in 1999, and 2) “Statistical Year Book of Indonesia, 2002”.
JICA’s field survey report gives a basic data in the sub-sector. Data in the Statistics is
another significant source to observe the sub-sector. However, the number of manufacturers of statistical data and JICA’s data differ from each other. The statistical data covers both large-scale assemblers and parts manufacturers. Also, the statistical data does not have any indicative information on small and medium scale manufacturers.
3 - 9
Chapter 3 Demand Survey for Human Resource Development
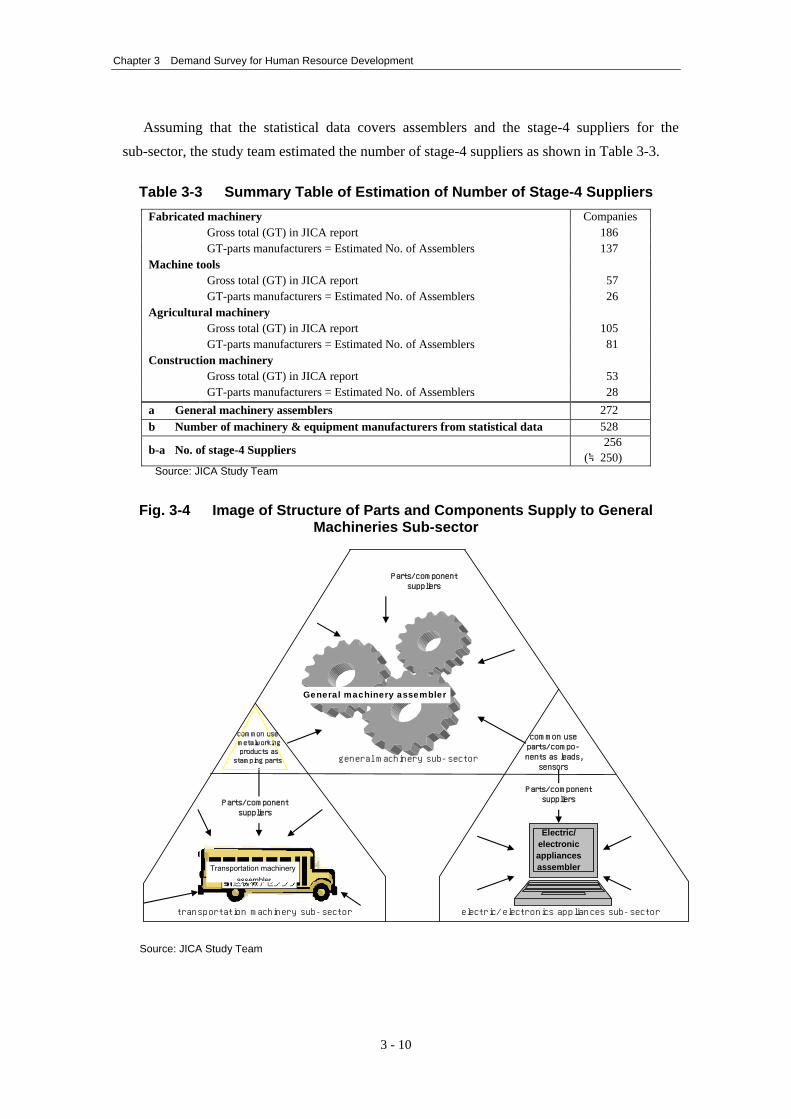
Assuming that the statistical data covers assemblers and the stage-4 suppliers for the sub-sector, the study team estimated the number of stage-4 suppliers as shown in Table 3-3.
Table 3-3 Summary Table of Estimation of Number of Stage-4 Suppliers
Fabricated machinery Companies Gross total (GT) in JICA report 186 GT-parts manufacturers = Estimated No. of Assemblers 137 Machine tools Gross total (GT) in JICA report 57 GT-parts manufacturers = Estimated No. of Assemblers 26 Agricultural machinery Gross total (GT) in JICA report 105 GT-parts manufacturers = Estimated No. of Assemblers 81 Construction machinery Gross total (GT) in JICA report 53 GT-parts manufacturers = Estimated No. of Assemblers 28 a General machinery assemblers 272 b Number of machinery & equipment manufacturers from statistical data 528
b-a No. of stage-4 Suppliers 256
(≒250) Source: JICA Study Team
Fig. 3-4 Image of Structure of Parts and Components Supply to General
Machineries Sub-sector
General machinery assembler
common useparts/compo-nents as leads,sensors
Electric/electronicappliancesassembler
common use metalworking products asstamping parts
Parts/componentsuppliers
Parts/componentsuppliersParts/component
suppliers
transportation machinery sub-sector electric/electronics appliances sub-sector
general machinery sub-sector
Transportation machineryassembler
Source: JICA Study Team
3 - 10
Chapter 3 Demand Survey for Human Resource Development
3.3 Result of the Interview survey
3.3.1 Survey results
(1) No. of companies visited: 80
(2) Categories of companies determined through analysis of corporate profiles 1) Categories used sales channels and degree of management stability as criteria
[1] Foreign-owned companies and joint-venture companies --- No problems with sales channels or quality. Education and training are being implemented regularly following the headquarters’ policy. This group is receiving no assistance whatsoever from the Indonesian government. --- 31 companies
[2] Established with 100% Indonesian capital. The companies in this group are supplying genuine parts to assembly companies constantly, and have high-level corporate management. --- 24 companies
[3] Established with 100% Indonesian capital. Although the companies in this group are providing genuine parts to assembly companies on a spot basis, the after-sales market comprises the bulk of their sales channels. While they fervently want to be a stable genuine parts supplier, their management control levels are not sufficient for that purpose. --- 20 companies
[4] Established with 100% Indonesian capital. Due to their low technical level, companies in this group are aiming solely at the after-sales market, and are satisfied with the situation. --- 5 companies
Companies in group [2]-[4] need government supports. They were divided into the
following categories based on overall consideration of sales/personnel, defect rates upon inspection, and other management indices. Refer to Chapter 3.2 for clarification of stages.
Companies in Group [2] --- Stage 4 Companies in Group [3] --- Stage 3 Companies in Group [4] --- Stage 2
2) Categories based on whether or not ISO, QS, and audits are carried out (categories based on control standards)
Stage 4 companies: Of the 24 companies, 13 companies, or 54%, have obtained ISO9000 series or QS certification, and of the 24 companies, 12 companies, or 50%, undergo audits by assembly companies and have high-level control standards.
3 - 11
Chapter 3 Demand Survey for Human Resource Development
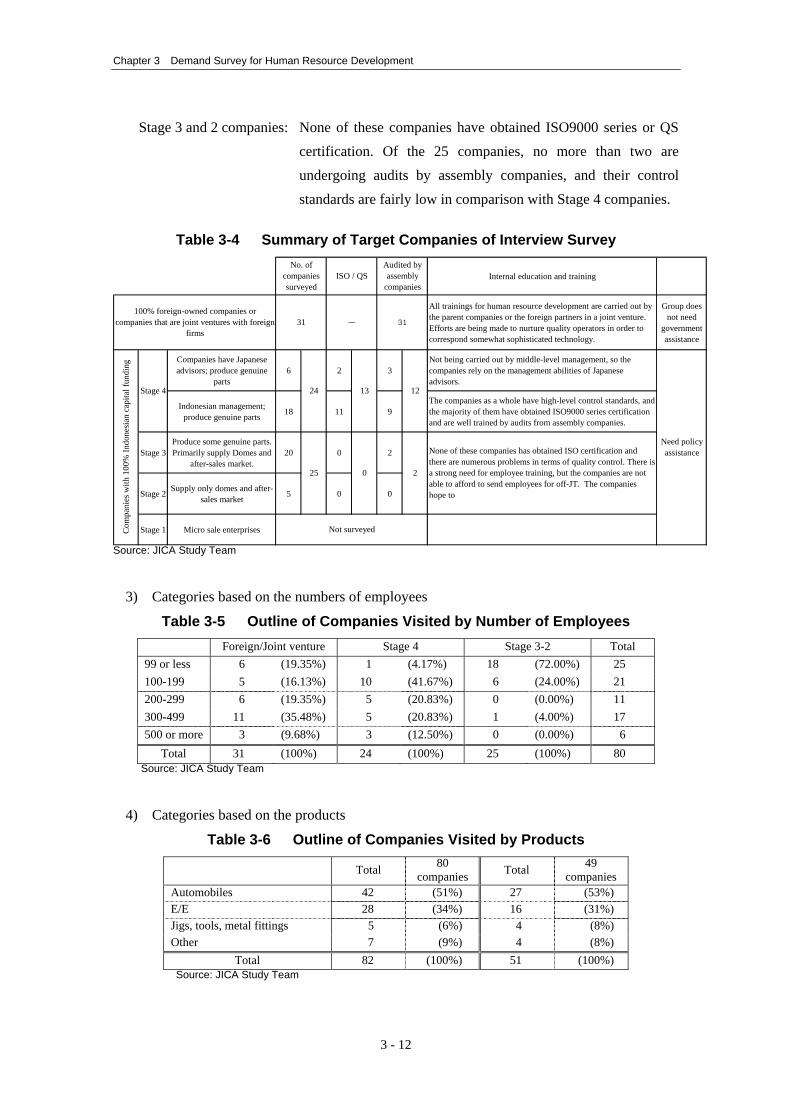
Stage 3 and 2 companies: None of these companies have obtained ISO9000 series or QS certification. Of the 25 companies, no more than two are undergoing audits by assembly companies, and their control standards are fairly low in comparison with Stage 4 companies.
Table 3-4 Summary of Target Companies of Interview Survey
Internal education and training
All trainings for human resource development are carried out bythe parent companies or the foreign partners in a joint venture.Efforts are being made to nurture quality operators in order tocorrespond somewhat sophisticated technology.
Group doesnot need
governmentassistance
Companies have Japaneseadvisors; produce genuine
parts6 2 3
Not being carried out by middle-level management, so thecompanies rely on the management abilities of Japaneseadvisors.
Indonesian management;produce genuine parts 18 11 9
The companies as a whole have high-level control standards, andthe majority of them have obtained ISO9000 series certificationand are well trained by audits from assembly companies.
Stage 3Produce some genuine parts.Primarily supply Domes and
after-sales market.20 0 2
Stage 2 Supply only domes and after-sales market 5 0 0
Stage 1 Micro sale enterprises
None of these companies has obtained ISO certification andthere are numerous problems in terms of quality control. There isa strong need for employee training, but the companies are notable to afford to send employees for off-JT. The companieshope to
Need policyassistance
0 2
100% foreign-owned companies orcompanies that are joint ventures with foreign
firms31 - 31
No. ofcompaniessurveyed
ISO / QSAudited byassembly
companies
12
Com
pani
es w
ith 1
00%
Indo
nesi
an c
apita
l fun
ding
Stage 4 24 13
25
Not surveyed
Source: JICA Study Team
3) Categories based on the numbers of employees
Table 3-5 Outline of Companies Visited by Number of Employees Foreign/Joint venture Stage 4 Stage 3-2 Total
99 or less 6 (19.35%) 1 (4.17%) 18 (72.00%) 25 100-199 5 (16.13%) 10 (41.67%) 6 (24.00%) 21 200-299 6 (19.35%) 5 (20.83%) 0 (0.00%) 11 300-499 11 (35.48%) 5 (20.83%) 1 (4.00%) 17 500 or more 3 (9.68%) 3 (12.50%) 0 (0.00%) 6
Total 31 (100%) 24 (100%) 25 (100%) 80 Source: JICA Study Team
4) Categories based on the products
Table 3-6 Outline of Companies Visited by Products
Total 80 companies Total 49
companies Automobiles 42 (51%) 27 (53%) E/E 28 (34%) 16 (31%) Jigs, tools, metal fittings 5 (6%) 4 (8%) Other 7 (9%) 4 (8%)
Total 82 (100%) 51 (100%) Source: JICA Study Team
3 - 12
Chapter 3 Demand Survey for Human Resource Development
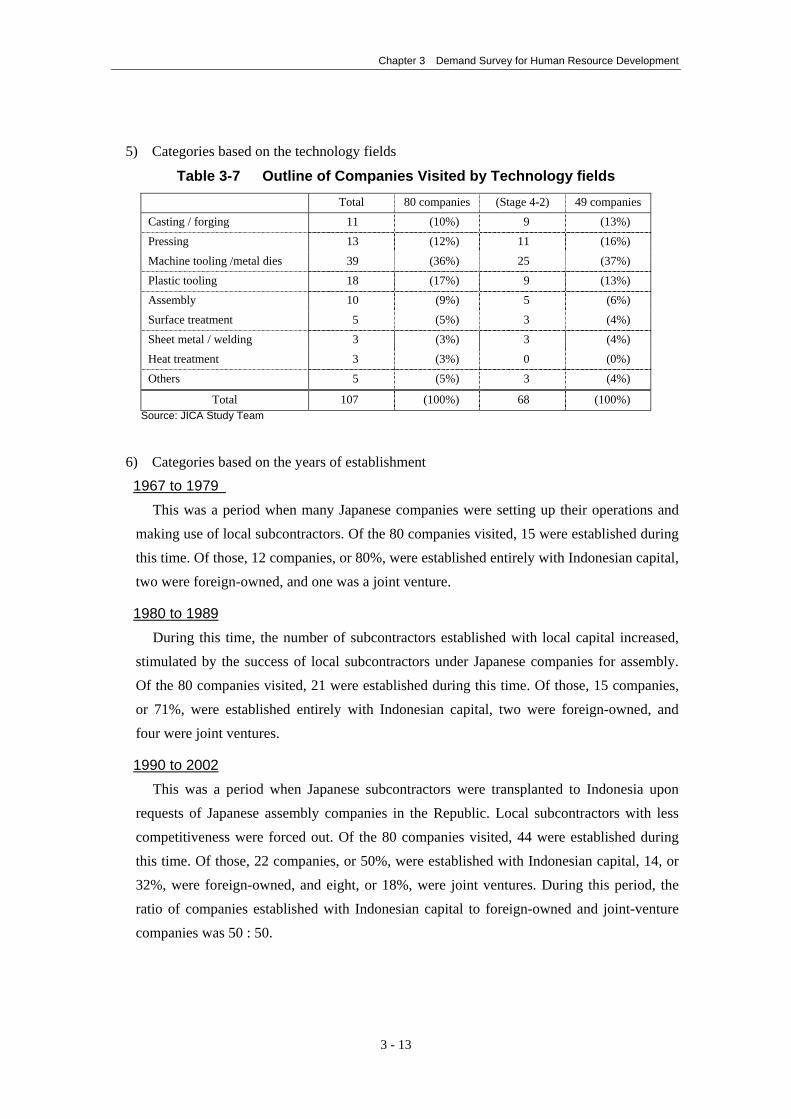
5) Categories based on the technology fields
Table 3-7 Outline of Companies Visited by Technology fields Total 80 companies (Stage 4-2) 49 companies
Casting / forging 11 (10%) 9 (13%)
Pressing 13 (12%) 11 (16%) Machine tooling /metal dies 39 (36%) 25 (37%)
Plastic tooling 18 (17%) 9 (13%) Assembly 10 (9%) 5 (6%)
Surface treatment 5 (5%) 3 (4%)
Sheet metal / welding 3 (3%) 3 (4%)
Heat treatment 3 (3%) 0 (0%) Others 5 (5%) 3 (4%)
Total 107 (100%) 68 (100%) Source: JICA Study Team
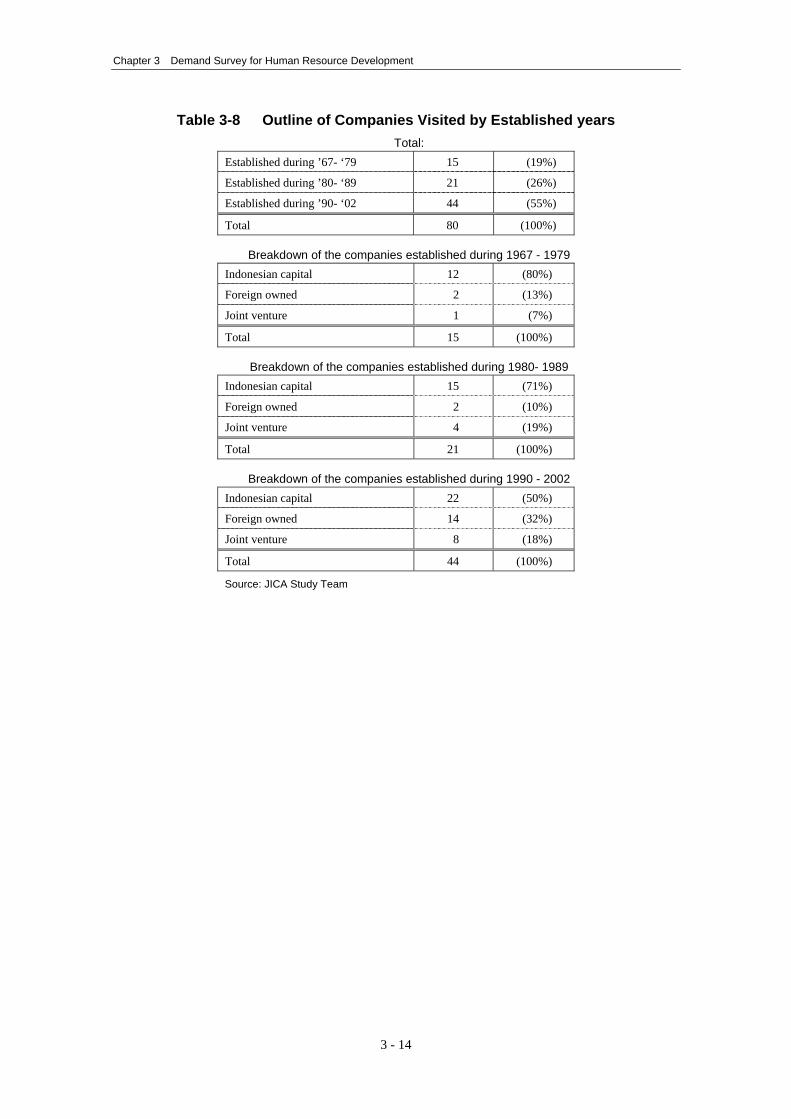
6) Categories based on the years of establishment 1967 to 1979
This was a period when many Japanese companies were setting up their operations and making use of local subcontractors. Of the 80 companies visited, 15 were established during this time. Of those, 12 companies, or 80%, were established entirely with Indonesian capital, two were foreign-owned, and one was a joint venture.
1980 to 1989 During this time, the number of subcontractors established with local capital increased,
stimulated by the success of local subcontractors under Japanese companies for assembly. Of the 80 companies visited, 21 were established during this time. Of those, 15 companies, or 71%, were established entirely with Indonesian capital, two were foreign-owned, and four were joint ventures.
1990 to 2002 This was a period when Japanese subcontractors were transplanted to Indonesia upon
requests of Japanese assembly companies in the Republic. Local subcontractors with less competitiveness were forced out. Of the 80 companies visited, 44 were established during this time. Of those, 22 companies, or 50%, were established with Indonesian capital, 14, or 32%, were foreign-owned, and eight, or 18%, were joint ventures. During this period, the ratio of companies established with Indonesian capital to foreign-owned and joint-venture companies was 50 : 50.
3 - 13
Chapter 3 Demand Survey for Human Resource Development
Table 3-8 Outline of Companies Visited by Established years Total:
Established during ’67- ‘79 15 (19%)
Established during ’80- ‘89 21 (26%)
Established during ’90- ‘02 44 (55%)
Total 80 (100%)
Breakdown of the companies established during 1967 - 1979 Indonesian capital 12 (80%)
Foreign owned 2 (13%)
Joint venture 1 (7%)
Total 15 (100%)
Breakdown of the companies established during 1980- 1989 Indonesian capital 15 (71%)
Foreign owned 2 (10%)
Joint venture 4 (19%)
Total 21 (100%)
Breakdown of the companies established during 1990 - 2002 Indonesian capital 22 (50%)
Foreign owned 14 (32%)
Joint venture 8 (18%)
Total 44 (100%)
Source: JICA Study Team
3 - 14

Chapter 3 Demand Survey for Human Resource Development
(3) Difficulties faced by companies
Table 3-9 Difficulties faced by Companies Visited
Stage 4 : 24 companies Stage 3-2 : 25 companies
13 19 32
11
5
5 2 7
3 4 5
3 2 3
1
40 32 54
Foreign owned, Joint Venture : 31 companies
7
(Characteristics)1) Employee motivation and leadershipthat will draw out motivation is anextremely large issue.2) China is presenting strong competition,and QCD improvement is also an issue.3) Boosting operator quality is an issue incorresponding advanced technology.
(Characteristics)QCD improvement is anoverwhelmingly large issue.
(Characteristics)1) QCD improvement2) Boosting marketing and productdevelopment prowess is an issue,because strengthening marketingprowess means establishing a nichewith assembly companies.
16 4
QCD Improvement
Improvement of employeemotivationLeadership
Boosting quality of operators
Renovating equipment
Manufacture of in-housemetal dies
QCD Improvement
Leadership
Cultivating middlemanagement level
Renovating equipment
Environment and safety
QCD Improvement
Marketing
Boosting productdevelopment prowess
Renovating equipment
Finance and personnelmanagement
Marketing
Source: JICA Study Team
(4) Results of off-JT in production technology
Table 3-10 Results of off-JT in production technology
Results Training organizations
Stage 4 (24 companies) 7/24
Machinery makers: 0 Vendors/suppliers: 2 Training organizations: 5 Polman (Bandung), MIDC, GIAMM, FESTO, National
Gobel
Stage 3-2 (25 companies) 9/25
Machinery makers: 1 Vendors/suppliers: 4 Training organizations: 9 National Gobel, ASTRA, MIDC, TRAKINDO, AIPPI,
AIMKI, SAN-VIX, YDBA, FESCO Source: JICA Study Team
More companies in the Stage 3 and 2 groups than those in the other groups are sending
their employees (mostly engineering staff and operators) to off-JT, in order to improve their production technology and skills.
3 - 15
Chapter 3 Demand Survey for Human Resource Development
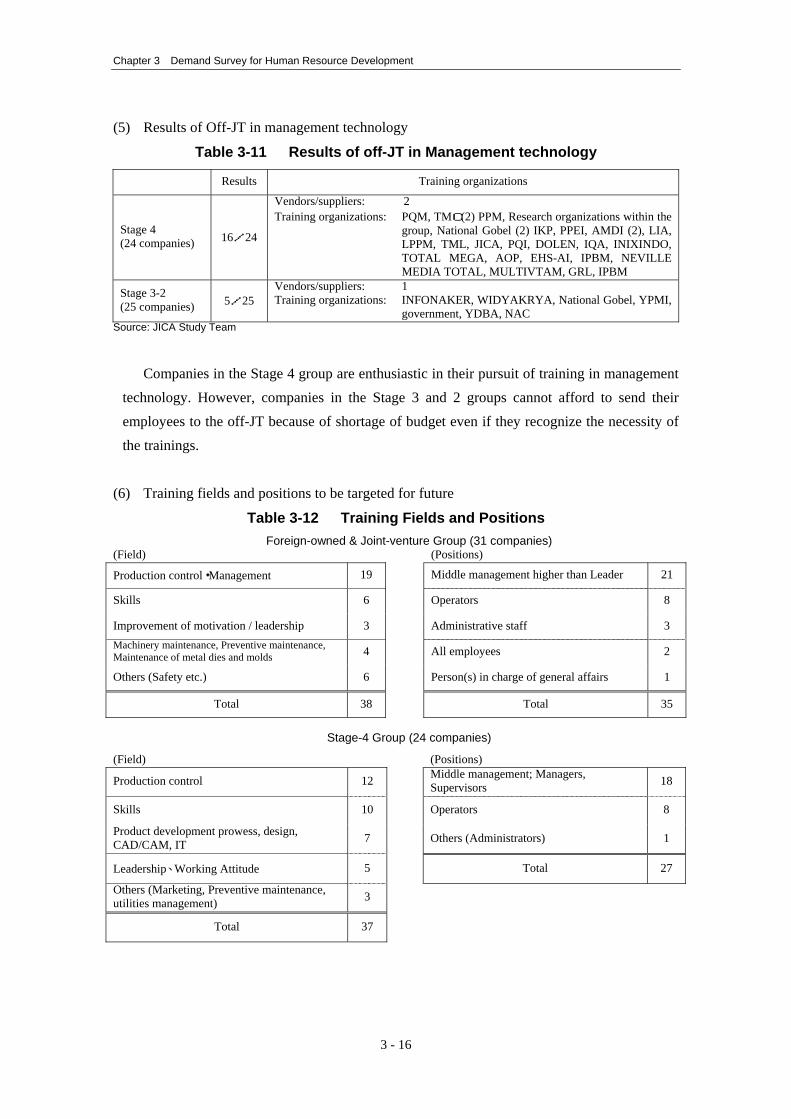
(5) Results of Off-JT in management technology
Table 3-11 Results of off-JT in Management technology
Results Training organizations
Stage 4 (24 companies) 16/24
Vendors/suppliers: 2 Training organizations: PQM, TMC(2) PPM, Research organizations within the
group, National Gobel (2) IKP, PPEI, AMDI (2), LIA, LPPM, TML, JICA, PQI, DOLEN, IQA, INIXINDO, TOTAL MEGA, AOP, EHS-AI, IPBM, NEVILLE MEDIA TOTAL, MULTIVTAM, GRL, IPBM
Stage 3-2 (25 companies) 5/25
Vendors/suppliers: 1 Training organizations: INFONAKER, WIDYAKRYA, National Gobel, YPMI,
government, YDBA, NAC Source: JICA Study Team
Companies in the Stage 4 group are enthusiastic in their pursuit of training in management
technology. However, companies in the Stage 3 and 2 groups cannot afford to send their employees to the off-JT because of shortage of budget even if they recognize the necessity of the trainings.
(6) Training fields and positions to be targeted for future
Table 3-12 Training Fields and Positions Foreign-owned & Joint-venture Group (31 companies)
(Field) (Positions)
Production control・Management 19 Middle management higher than Leader 21
Skills 6 Operators 8
Improvement of motivation / leadership 3 Administrative staff 3 Machinery maintenance, Preventive maintenance, Maintenance of metal dies and molds 4 All employees 2
Others (Safety etc.) 6 Person(s) in charge of general affairs 1
Total 38 Total 35
Stage-4 Group (24 companies)
(Field) (Positions)
Production control 12 Middle management; Managers, Supervisors 18
Skills 10 Operators 8
Product development prowess, design, CAD/CAM, IT 7 Others (Administrators) 1
Leadership、Working Attitude 5 Total 27
Others (Marketing, Preventive maintenance, utilities management) 3
Total 37
3 - 16
Chapter 3 Demand Survey for Human Resource Development
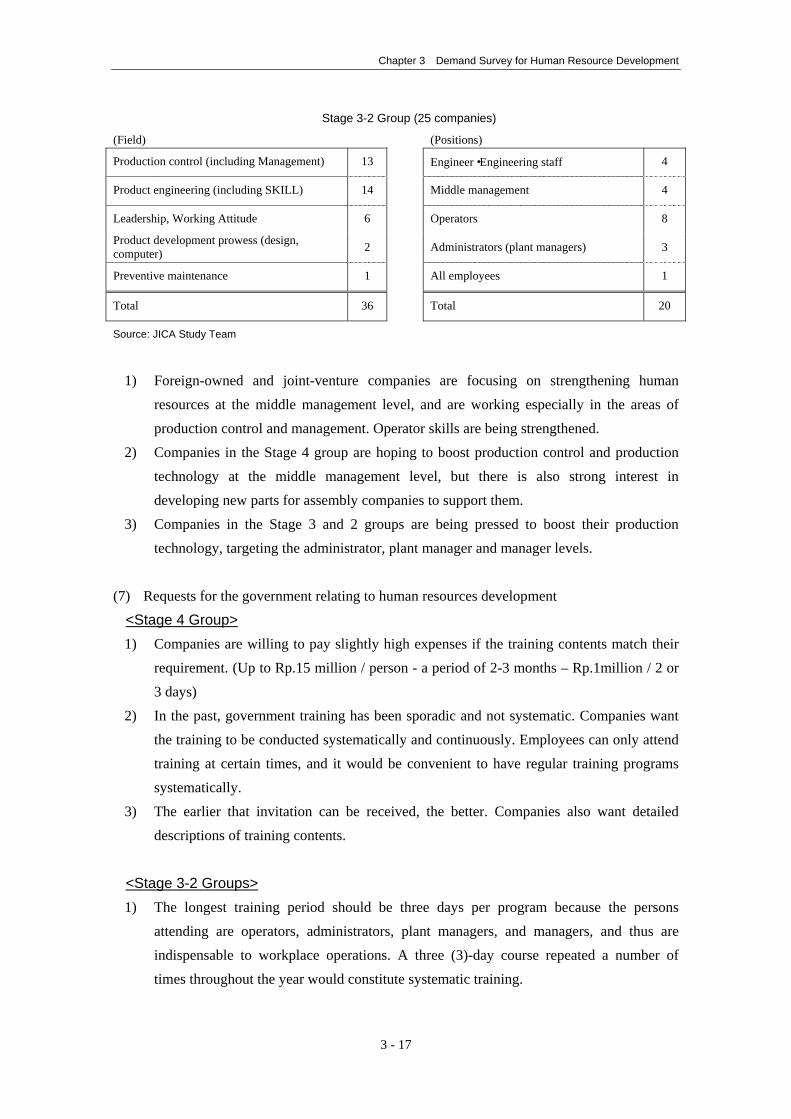
Stage 3-2 Group (25 companies)
(Field) (Positions)
Production control (including Management) 13 Engineer・Engineering staff 4
Product engineering (including SKILL) 14 Middle management 4
Leadership, Working Attitude 6 Operators 8
Product development prowess (design, computer) 2 Administrators (plant managers) 3
Preventive maintenance 1 All employees 1
Total 36 Total 20
Source: JICA Study Team
1) Foreign-owned and joint-venture companies are focusing on strengthening human
resources at the middle management level, and are working especially in the areas of production control and management. Operator skills are being strengthened.
2) Companies in the Stage 4 group are hoping to boost production control and production technology at the middle management level, but there is also strong interest in developing new parts for assembly companies to support them.
3) Companies in the Stage 3 and 2 groups are being pressed to boost their production technology, targeting the administrator, plant manager and manager levels.
(7) Requests for the government relating to human resources development
<Stage 4 Group> 1) Companies are willing to pay slightly high expenses if the training contents match their
requirement. (Up to Rp.15 million / person - a period of 2-3 months – Rp.1million / 2 or 3 days)
2) In the past, government training has been sporadic and not systematic. Companies want the training to be conducted systematically and continuously. Employees can only attend training at certain times, and it would be convenient to have regular training programs systematically.
3) The earlier that invitation can be received, the better. Companies also want detailed descriptions of training contents.
<Stage 3-2 Groups> 1) The longest training period should be three days per program because the persons
attending are operators, administrators, plant managers, and managers, and thus are indispensable to workplace operations. A three (3)-day course repeated a number of times throughout the year would constitute systematic training.
3 - 17
Chapter 3 Demand Survey for Human Resource Development
2) The lower the training expenses, the better, but, from a psychological standpoint, free training is not desirable. Fees of around Rp.300,000 to Rp.500,000 per person for three days of training would be the limit of what companies could afford.
3) Training that combines both production control and production technology as a set is preferable. Companies would like to participate in practical training that incorporates elements such as plant tours, hands-on practice, and talks by administrators in successful supporting industries.
4) Invitations should be received at least two weeks in advance. Invitations received immediately prior to the training cause problems with time management. Companies would like detailed information concerning the training period, training contents, locations (preferably as close as possible to the company), instructors, expenses and other information.
5) In addition to production control and production technology, training would be even better if it addressed areas such as boosting leadership, labor management, marketing, and interpretation of newly enforced legislation.
3.3.2 Summary for training needs
Preferred training programs by the government to stage 4 to 2 groups based on analysis of complied results are summarized. (1) Period: A maximum of three days for one training course. Repeating a 3-day course would
enable systematic training. (2) Expenses: Rp.300,000 to Rp.500,000 per person for three days of training (3) Training that could be participated at any time throughout the year (4) Small numbers of attendees, around 10 to 20 people per class (5) Companies prefer training locations that are close to the company and highly convenient.
(For example, companies near Jakarta would like training to take place in Jakarta.) (6) Invitations to training should reach the companies at least two weeks in advance, and
should state the training contents, period, location, instructors, expenses and other information in detail and in a straightforward manner.
(7) Training that combines production control and production technology as a set is preferable. In addition, companies would like training to focus on stimulating operator motivation and leadership at the middle management level.
(8) Training should include not only lectures, but also plant tours and practice as well. Production technology encompasses a variety of areas, but basic training in metal dies, molds, casting and forging, welding, and lathes would be good.
3 - 18
Chapter 3 Demand Survey for Human Resource Development
3.3.3 Observation on Company Visit
(1) Observation of Expert - A 1) The contents of training need to be changed to fit the stage of the company. In other
words, there are different needs between the companies in Stages 2 and 3 and the Stage 4 companies.
2) The followings describe the environment shared by both Stage 2 and 3 companies and the
Stage 4 companies. a) All of the companies are struggling for the cost reduction as a common problem. b) With respect to marketing, Japanese companies with operations in Indonesia are
looking at the market for domestic demand, and are not inclined to operate as export bases. Consequently, the market will grow only as much as domestic demand grows, and thus market growth will be limited.
c) Some of the Indonesians parts suppliers believe that orders can be obtained within the range of domestic demand, but market will be conversely shrunken without boosting competitiveness against China, Taiwan, Thailand, and Singapore. It is necessary to take measures to cope with this situation.
3) Administrative problems of companies in the Stage 2 and 3 groups
a) Deterioration of equipments • The importance of maintenance technology cannot be overemphasized. • Companies depend on the technical levels of their operators to a significant degree. • It is unavoidable that measures to boost productivity depends on fundamental aspects
of production control such as maintenance technology, operators’ skills and morale, and the plant layout, but the problem is that these are insufficient. Considerable results can be expected simply from making sure that the 5S is carried out on a comprehensive basis, alone.
b) Cost reduction There are cases in which assembly companies are making relentless demands for prices
to be lowered. At the same time, there are many factors that are pushing costs up such as an increase in the minimum wage, competition from Chinese products, increases in the costs of raw materials and electricity. The companies forced into this tight corner are implementing the following measures to reduce their costs. • Some companies are lowering the percentage of full-time employees in response to
shrinkage of incoming orders, and boosting the percentage of contract employees. The percentage of contract employees has exceeded 50% at some companies.
3 - 19
Chapter 3 Demand Survey for Human Resource Development
• Boosting productivity • Lowering the rejection ratio of products at inspections • Recycling rejected products
c) Quality The fact that companies in these groups focus primarily on the after-sales market means
that their products fall short of OEM levels. The principle reasons that they are not able to get out of this situation are: • Level of production control is low. • The quality of metal dies and molds manufactured in-house is too low. In addition, the
level of maintenance technology is also too low. d) Delivery
Because of problems such as high rejection rates and low productivity, many companies are unable to meet delivery due dates, and are forced to compensate the shortages with inventory stock. Because they do not have the funds to maintain abundant inventories, however, they break delivery date often.
e) Development capability • It would be no exaggeration to say that these companies are only capable of copying
products available on the market. • The companies have no special lines to develop samples that can be used to cultivate
new customers or to provide follow-up of new products for existing customers, so they are unable to respond quickly.
4) Training needs by the Stage 2 and 3 groups
Training needs consist of finding ways to deal with the problems outlined in a) to b). a) With respect to skills, plant manager class personnel are training operators through
on-the-job training. Consequently, training needs to focus on the plant manager or manager class and covers production engineering and production control as a set.
b) Training contents • Knowledge of production engineering and production control, in order to pull quality
up to the OEM level • Measures and leadership to boost operator incentives and motivation with regard to
production • Machine maintenance, layout, 5S • The rudiments of marketing, starting with methods to create samples that will cultivate
new customers.
3 - 20

Chapter 3 Demand Survey for Human Resource Development
c) Training period Plant is being run by a single person. Because there is no staff available to substitute for
the person undergoing training, it is important to utilize a system in which a single training session should consist of a minimum of three days and to repeat the three-day session a number of times.
d) Training expenses Many of the companies have no financial leeway, so it is important to conduct training
at low costs. A fee of around 300,000 to 500,000 Rupiah per person, per three-day session, is the limit of what most companies can afford.
e) Training curriculum planning In addition to the above, when the companies in stage 2 and 3 select the training
contents, it is realistic to refer the contents of audits being implemented by assembly companies for stage 4 companies.
5) Administrative problems and training needs of companies in the Stage 4 group
a) Administrative problems a. Modernization and replacement of outdated equipment
Overall, the equipments are out-of-date, but the companies that are beginning to modernize by using robots for some of the operations are emerging. At the very least, all of the companies feel the necessity for modernizing their equipments. • Procedures and methods to modernize their equipments • Maintenance methods for out-of-date sections of the equipments • Measures and leadership to boost operator incentives and motivation
b. Cost reduction The current situation is the same as that of the Stage 2 and 3 groups.
c. Quality and delivery date For the time being, companies are meeting the demands of assembly companies.
d. Development capability When assembly companies shift to new products, stage 4 companies need to provide the
development capabilities to keep up with them. Development capabilities need to be strengthened in areas such as metal die and mold design capability, product design capability, CAD/CAM and measurement capabilities.
b) Training a. For Stage 4 companies, the cultivation of middle management level personnel such as
supervisors and managers is an urgent issue. Training should target this level of personnel.
3 - 21
Chapter 3 Demand Survey for Human Resource Development
b. Training contents • Production engineering and production control need to be covered as a set, but it
would be good to put slightly more emphasis on production control. • Machine maintenance methods • Areas relating to development prowess (metal die and mold design, product design
strength, CAD/CAM, measurement equipment, etc.) • Measures to boost operator incentive and motivation, and to demonstrate leadership
at the middle management level.
(2) Observation of Expert - B Problems and requests relating to human resources development and training are as
follows: 1) Companies are trying to motivate leaders, foremen, supervisors, and other management
personnel to provide guidance for their subordinates and to develop human resources. But because they have no leadership capacity, their efforts are of no avail. Companies want these personnel to undergo training to boost their leadership, but no appropriate training is available. At the same time, there are almost no companies at which administrators and management executives are trying to develop human resources themselves under their own initiative.
2) Because applying and calculation capability of employees are low, undergoing training with theoretical contents will be of no use to them. Training should allow the employees to master practical knowledge and skills that can be utilized right away in the workplace.
3) The morale is low. People are strongly influenced by the easy-going feelings, the culture, the lifestyle and other factors, and it is apparently difficult to boost morale by making rules and taking trainings. Indonesian managers share the same awareness with respect to this.
4) Even at the companies that provide training focusing on boosting technical prowess in production and have reached levels that satisfy the assemblers, many of the companies have not yet introduced management technologies. For example, inspections are cited as being part of QC (quality control), but companies are not even recording the results of the inspections.
5) Even if employees are sent to off-JT, many course contents are not relevant, and there is a lot of waste. The scale of the companies is not large enough to call in instructors and these companies do not conduct trainings at all.
6) Companies want to have employees undergo training, but do not have sufficient personnel and financial resources, so they would like to have training provided by the government.
3 - 22
Chapter 3 Demand Survey for Human Resource Development
7) Training carried out by the assemblers is low-cost and useful. 8) Training programs that the companies would like to have include:
• Leadership, motivation, etc. • Production planning control、 quality control, production efficiency, preventive
maintenance, etc. • Knowledge in design development, mechanical design, metal dies/molds technology,
plastic materials, etc. 9) Audits implemented by assemblers provide trainees with knowledge and awareness, and
are therefore effective. 10) Companies would like to see their hopes and wishes incorporated when training is
planned and invitations are sent. 11) Companies would like to have a training center that instructs metal dies/molds
maintenance. The engineers in charge are manufacturing the metal dies/molds by receiving guidance from machine makers and software makers, but there is a need for technology to be accumulated by people in the area of metal dies/molds maintenance. Also, when metal dies/molds provided by suppliers get old and wear out, the suppliers do not replace them, and they have to be kept up through maintenance.
If there were an organization providing guidance in maintenance, old metal dies/molds could be used for a long period in acceptable condition.
12) Having a Japanese advisor is an important condition to select parts manufacturer as a supplier to Japanese companies operating in Indonesia (assemblers). A system should be investigated by which the Indonesian government and industrial associations could invite retirees from Japanese companies to make the round patrol consultation for companies that are not able to have a Japanese advisor in-house.
(3) Observation of Expert - C
1) The number of companies visited 37 companies were visited. Of these, 24 were local companies.
3 - 23
Chapter 3 Demand Survey for Human Resource Development
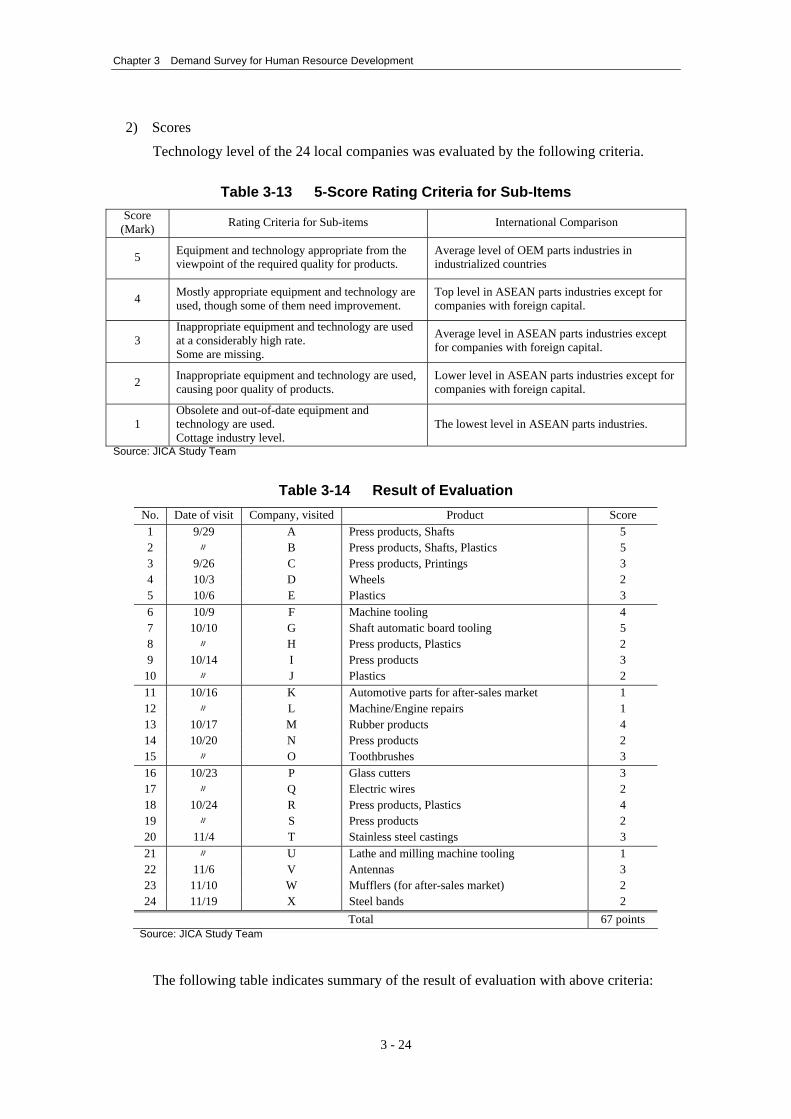
2) Scores Technology level of the 24 local companies was evaluated by the following criteria.
Table 3-13 5-Score Rating Criteria for Sub-Items Score
(Mark) Rating Criteria for Sub-items International Comparison
5 Equipment and technology appropriate from the viewpoint of the required quality for products.
Average level of OEM parts industries in industrialized countries
4 Mostly appropriate equipment and technology are used, though some of them need improvement.
Top level in ASEAN parts industries except for companies with foreign capital.
3 Inappropriate equipment and technology are used at a considerably high rate. Some are missing.
Average level in ASEAN parts industries except for companies with foreign capital.
2 Inappropriate equipment and technology are used, causing poor quality of products.
Lower level in ASEAN parts industries except for companies with foreign capital.
1 Obsolete and out-of-date equipment and technology are used. Cottage industry level.
The lowest level in ASEAN parts industries.
Source: JICA Study Team
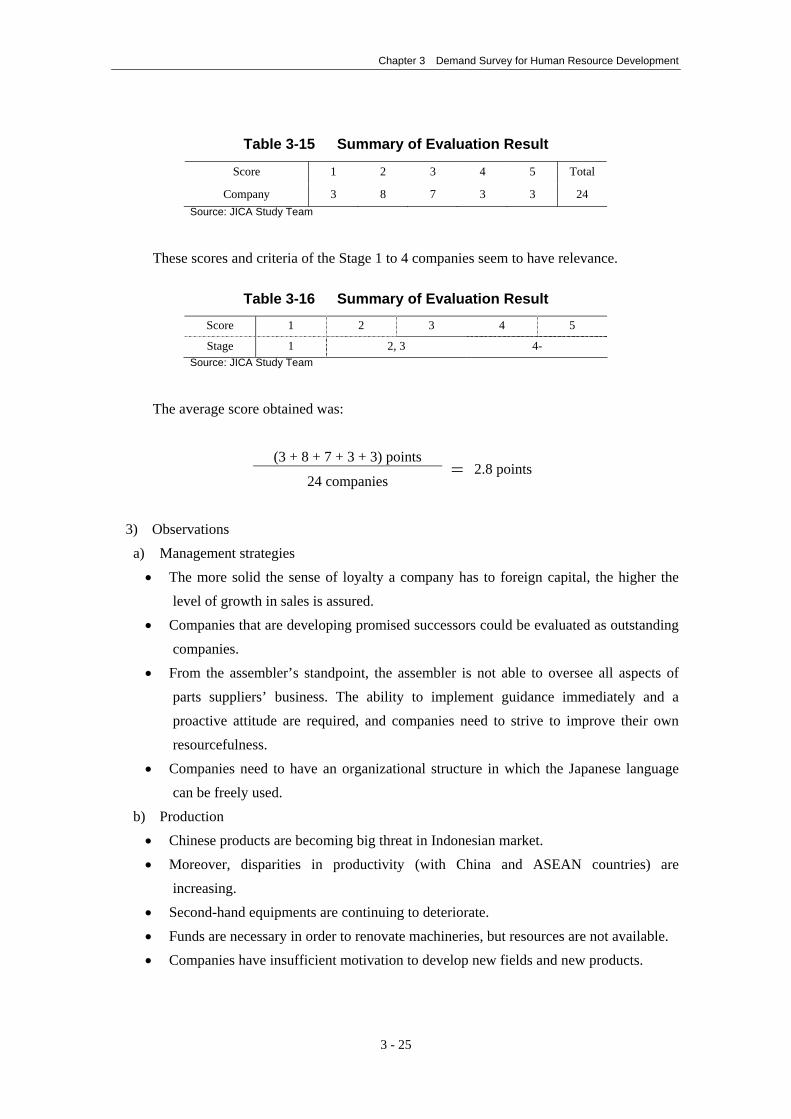
Table 3-14 Result of Evaluation
No. Date of visit Company, visited Product Score 1 9/29 A Press products, Shafts 5 2 〃 B Press products, Shafts, Plastics 5 3 9/26 C Press products, Printings 3 4 10/3 D Wheels 2 5 10/6 E Plastics 3 6 10/9 F Machine tooling 4 7 10/10 G Shaft automatic board tooling 5 8 〃 H Press products, Plastics 2 9 10/14 I Press products 3
10 〃 J Plastics 2 11 10/16 K Automotive parts for after-sales market 1 12 〃 L Machine/Engine repairs 1 13 10/17 M Rubber products 4 14 10/20 N Press products 2 15 〃 O Toothbrushes 3 16 10/23 P Glass cutters 3 17 〃 Q Electric wires 2 18 10/24 R Press products, Plastics 4 19 〃 S Press products 2 20 11/4 T Stainless steel castings 3 21 〃 U Lathe and milling machine tooling 1 22 11/6 V Antennas 3 23 11/10 W Mufflers (for after-sales market) 2 24 11/19 X Steel bands 2
Total 67 points Source: JICA Study Team
The following table indicates summary of the result of evaluation with above criteria:
3 - 24
Chapter 3 Demand Survey for Human Resource Development
Table 3-15 Summary of Evaluation Result
Score 1 2 3 4 5 Total
Company 3 8 7 3 3 24 Source: JICA Study Team
These scores and criteria of the Stage 1 to 4 companies seem to have relevance.
Table 3-16 Summary of Evaluation Result
Score 1 2 3 4 5
Stage 1 2, 3 4- Source: JICA Study Team
The average score obtained was:
(3 + 8 + 7 + 3 + 3) points
24 companies = 2.8 points
3) Observations
a) Management strategies • The more solid the sense of loyalty a company has to foreign capital, the higher the
level of growth in sales is assured. • Companies that are developing promised successors could be evaluated as outstanding
companies. • From the assembler’s standpoint, the assembler is not able to oversee all aspects of
parts suppliers’ business. The ability to implement guidance immediately and a proactive attitude are required, and companies need to strive to improve their own resourcefulness.
• Companies need to have an organizational structure in which the Japanese language can be freely used.
b) Production • Chinese products are becoming big threat in Indonesian market. • Moreover, disparities in productivity (with China and ASEAN countries) are
increasing. • Second-hand equipments are continuing to deteriorate. • Funds are necessary in order to renovate machineries, but resources are not available. • Companies have insufficient motivation to develop new fields and new products.
3 - 25
Chapter 3 Demand Survey for Human Resource Development
• Advantages and disadvantages of the minimum-wage system International competitiveness would be lowered, but, on the other hand, a greater willingness could be expected on the part of the low-income class to purchase consumer products.
• High interests on the systems such as the kanban system and the Just-in-Time system • Strict enforcement of morning assemblies and work improvements
c) Market and sales • International tie-ups with Singapore, Malaysia, and China are undoubtedly important. • Work can be assured through ongoing association with Japanese companies in
Indonesia. • Sales are growing in conjunction with the growth of Japanese companies in Indonesia.
d) Human resources • Sending trainees to Japan is highly popular. The systems of IMM-Japan and CEVEST
have taken root particularly strongly, and have proven successful. • The importance of labor management as countermeasures for strikes • Assuring and dealing with safety • The time required to develop outstanding managers, and the lack of training
opportunities, are significant problems. • Wearing uniforms with the company logo is effective from the standpoint of
discipline. e) Finance • Renovations of machineries, acquisition of sites, etc. are being covered with the
companies’ own funds. • It is difficult to obtain a bank loan.
3.4 Result of Questionnaire Survey to SMEs in the Supporting Industry
3.4.1 Outline of the Target Companies
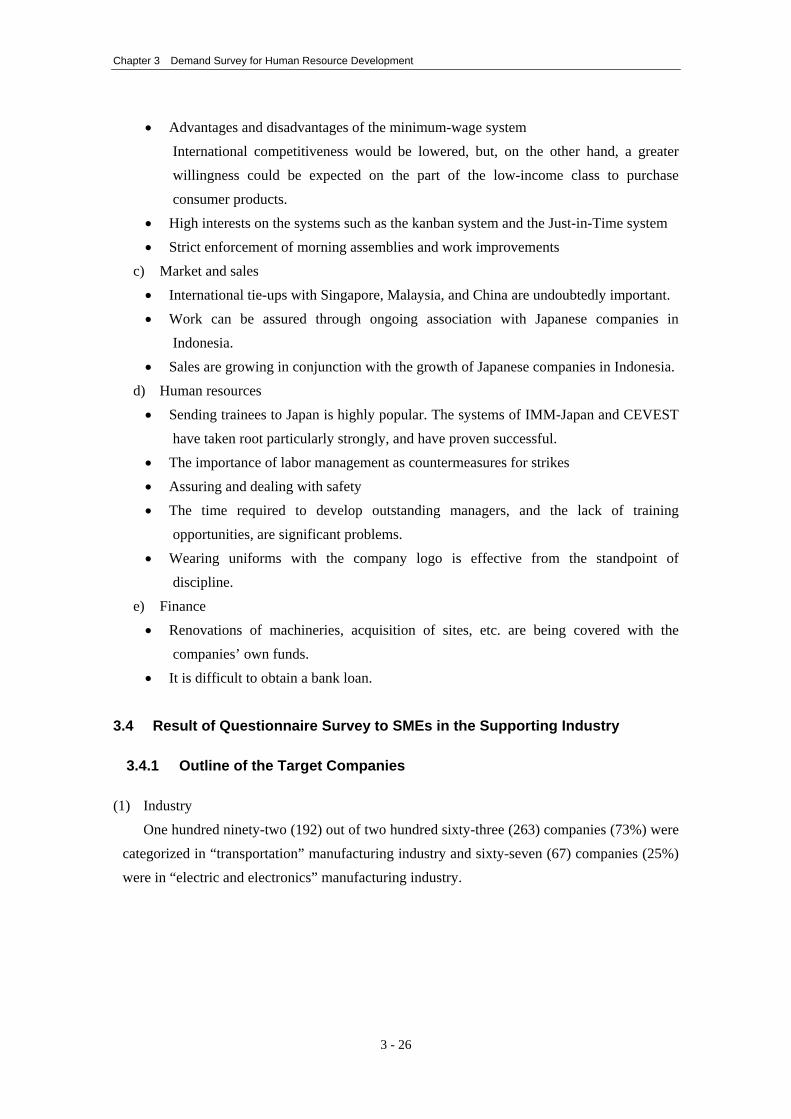
(1) Industry One hundred ninety-two (192) out of two hundred sixty-three (263) companies (73%) were
categorized in “transportation” manufacturing industry and sixty-seven (67) companies (25%) were in “electric and electronics” manufacturing industry.
3 - 26
Chapter 3 Demand Survey for Human Resource Development
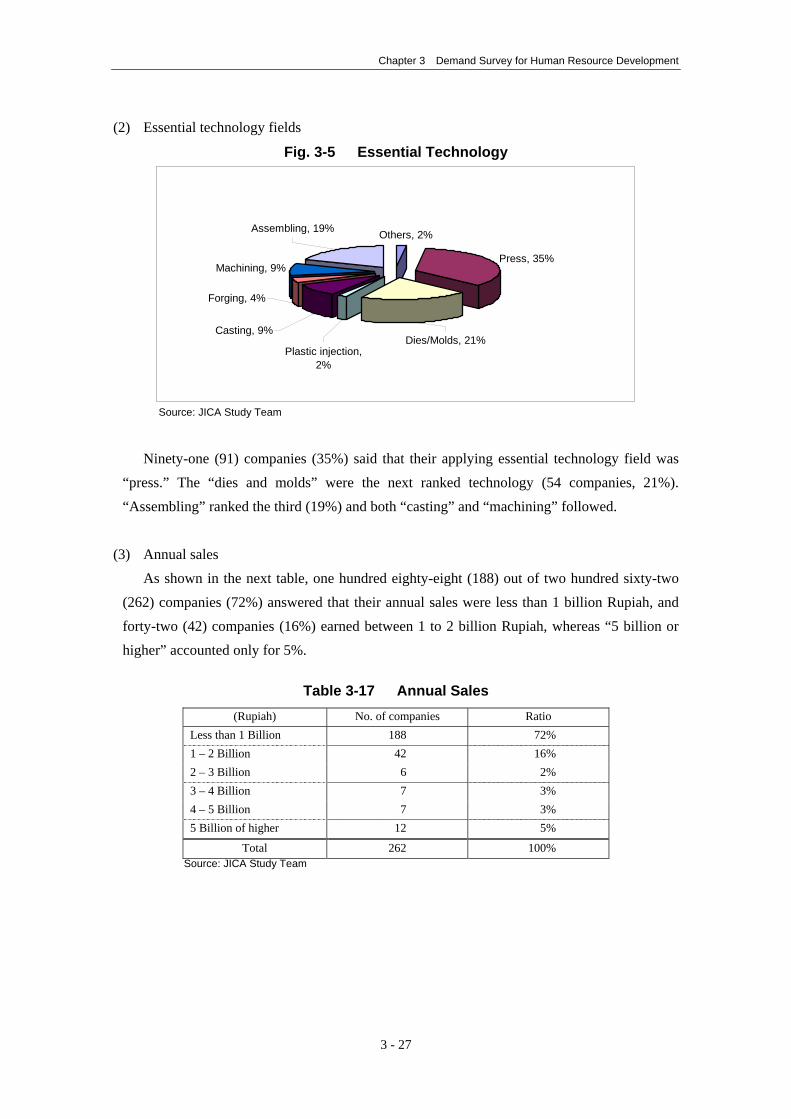
(2) Essential technology fields
Fig. 3-5 Essential Technology
Others, 2%
Press, 35%Machining, 9%
Assembling, 19%
Plastic injection,2%
Forging, 4%
Casting, 9%Dies/Molds, 21%
Source: JICA Study Team
Ninety-one (91) companies (35%) said that their applying essential technology field was
“press.” The “dies and molds” were the next ranked technology (54 companies, 21%). “Assembling” ranked the third (19%) and both “casting” and “machining” followed.
(3) Annual sales
As shown in the next table, one hundred eighty-eight (188) out of two hundred sixty-two (262) companies (72%) answered that their annual sales were less than 1 billion Rupiah, and forty-two (42) companies (16%) earned between 1 to 2 billion Rupiah, whereas “5 billion or higher” accounted only for 5%.
Table 3-17 Annual Sales
(Rupiah) No. of companies Ratio Less than 1 Billion 188 72% 1 – 2 Billion 42 16% 2 – 3 Billion 6 2% 3 – 4 Billion 7 3% 4 – 5 Billion 7 3% 5 Billion of higher 12 5%
Total 262 100% Source: JICA Study Team
3 - 27
Chapter 3 Demand Survey for Human Resource Development
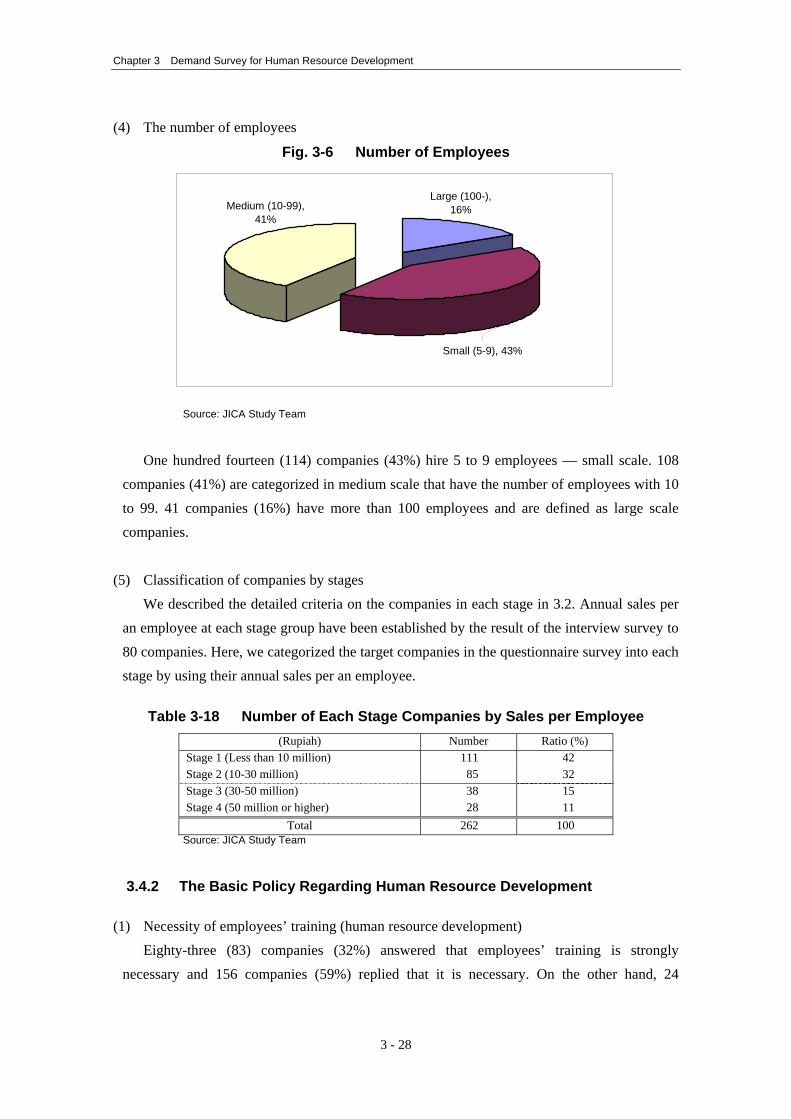
(4) The number of employees
Fig. 3-6 Number of Employees
Small (5-9), 43%
Large (100-),16%Medium (10-99),
41%
Source: JICA Study Team
One hundred fourteen (114) companies (43%) hire 5 to 9 employees — small scale. 108
companies (41%) are categorized in medium scale that have the number of employees with 10 to 99. 41 companies (16%) have more than 100 employees and are defined as large scale companies.
(5) Classification of companies by stages
We described the detailed criteria on the companies in each stage in 3.2. Annual sales per an employee at each stage group have been established by the result of the interview survey to 80 companies. Here, we categorized the target companies in the questionnaire survey into each stage by using their annual sales per an employee.
Table 3-18 Number of Each Stage Companies by Sales per Employee
(Rupiah) Number Ratio (%) Stage 1 (Less than 10 million) 111 42 Stage 2 (10-30 million) 85 32 Stage 3 (30-50 million) 38 15 Stage 4 (50 million or higher) 28 11
Total 262 100 Source: JICA Study Team
3.4.2 The Basic Policy Regarding Human Resource Development
(1) Necessity of employees’ training (human resource development) Eighty-three (83) companies (32%) answered that employees’ training is strongly
necessary and 156 companies (59%) replied that it is necessary. On the other hand, 24
3 - 28
Chapter 3 Demand Survey for Human Resource Development
companies (9%) said that the training is not currently necessary. This means that the majority of responded companies admit the importance of the employees’ training.
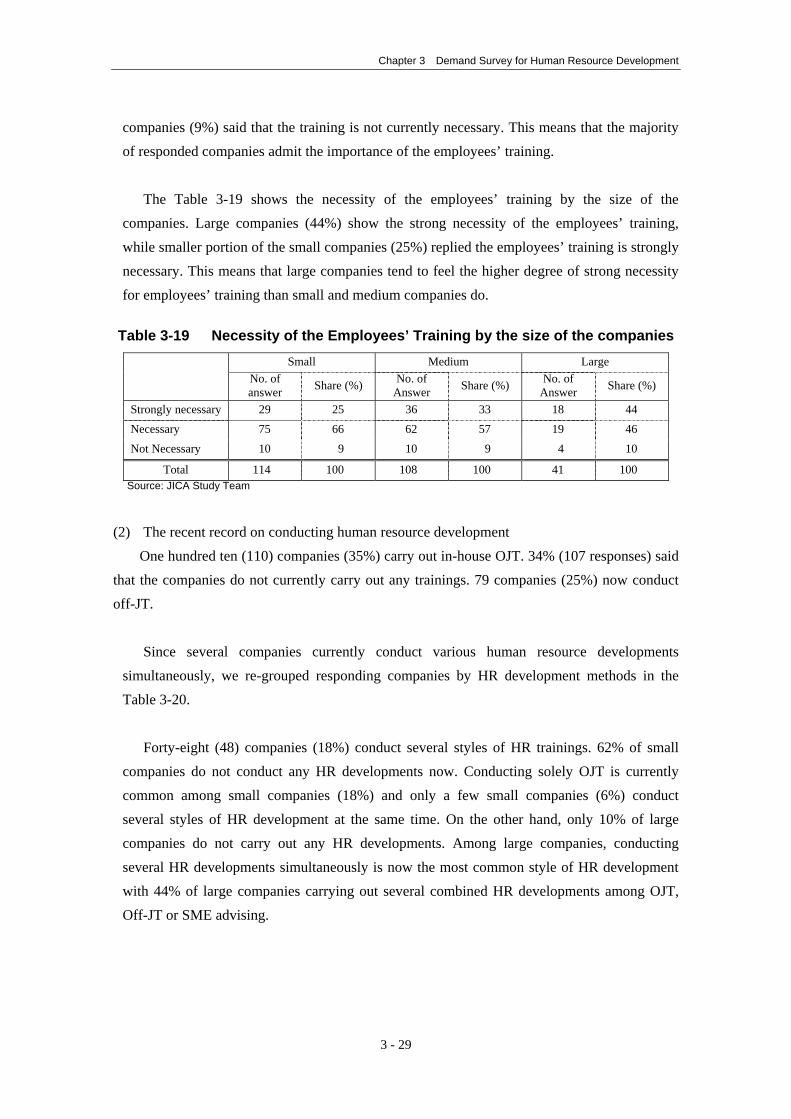
The Table 3-19 shows the necessity of the employees’ training by the size of the
companies. Large companies (44%) show the strong necessity of the employees’ training, while smaller portion of the small companies (25%) replied the employees’ training is strongly necessary. This means that large companies tend to feel the higher degree of strong necessity for employees’ training than small and medium companies do.
Table 3-19 Necessity of the Employees’ Training by the size of the companies
Small Medium Large No. of
answer Share (%) No. of Answer Share (%) No. of
Answer Share (%)
Strongly necessary 29 25 36 33 18 44
Necessary 75 66 62 57 19 46 Not Necessary 10 9 10 9 4 10
Total 114 100 108 100 41 100 Source: JICA Study Team
(2) The recent record on conducting human resource development
One hundred ten (110) companies (35%) carry out in-house OJT. 34% (107 responses) said that the companies do not currently carry out any trainings. 79 companies (25%) now conduct off-JT.
Since several companies currently conduct various human resource developments
simultaneously, we re-grouped responding companies by HR development methods in the Table 3-20.
Forty-eight (48) companies (18%) conduct several styles of HR trainings. 62% of small
companies do not conduct any HR developments now. Conducting solely OJT is currently common among small companies (18%) and only a few small companies (6%) conduct several styles of HR development at the same time. On the other hand, only 10% of large companies do not carry out any HR developments. Among large companies, conducting several HR developments simultaneously is now the most common style of HR development with 44% of large companies carrying out several combined HR developments among OJT, Off-JT or SME advising.
3 - 29
Chapter 3 Demand Survey for Human Resource Development
Table 3-20 Methods of Current Human Resource Development
None Combination of OJT, Off-JT or
Advisor OJT only Off-JT only Advisor only
No. of
Answers % No. of Answers % No. of
Answers % No. of Answers % No. of
Answers %
Small 71 62 7 6 21 18 14 12 1 1 Medium 32 30 23 21 33 31 18 17 2 2 Large 4 10 18 44 15 37 3 7 1 2
Total 107 41 48 18 69 26 35 13 4 2 Source: JICA Study Team
3.4.3 Result of Off-JT
(1) Past record of Off-JT One hundred thirty eight (138) companies (53%) conducted the off-JT since 2001, as
shown in Table 3-21. Out of the one hundred thirty-eight (138) companies that conducted off-JT, forty-seven (47) companies sent their employees to off-JT for management technology, while thirty (30) companies conducted off-JT for production technology. Also, sixty-one (61) companies replied that they conducted off-JT for both management and production technology.
Table 3-21 Number of the Companies that Conducted Off-JT since 2001
No. of answers Companies that conducted Off-JT 138
Management Technology 47 Production Technology 30 Management and Production Technology 61
No Off-JT 125
Total 263 Source: JICA Study Team
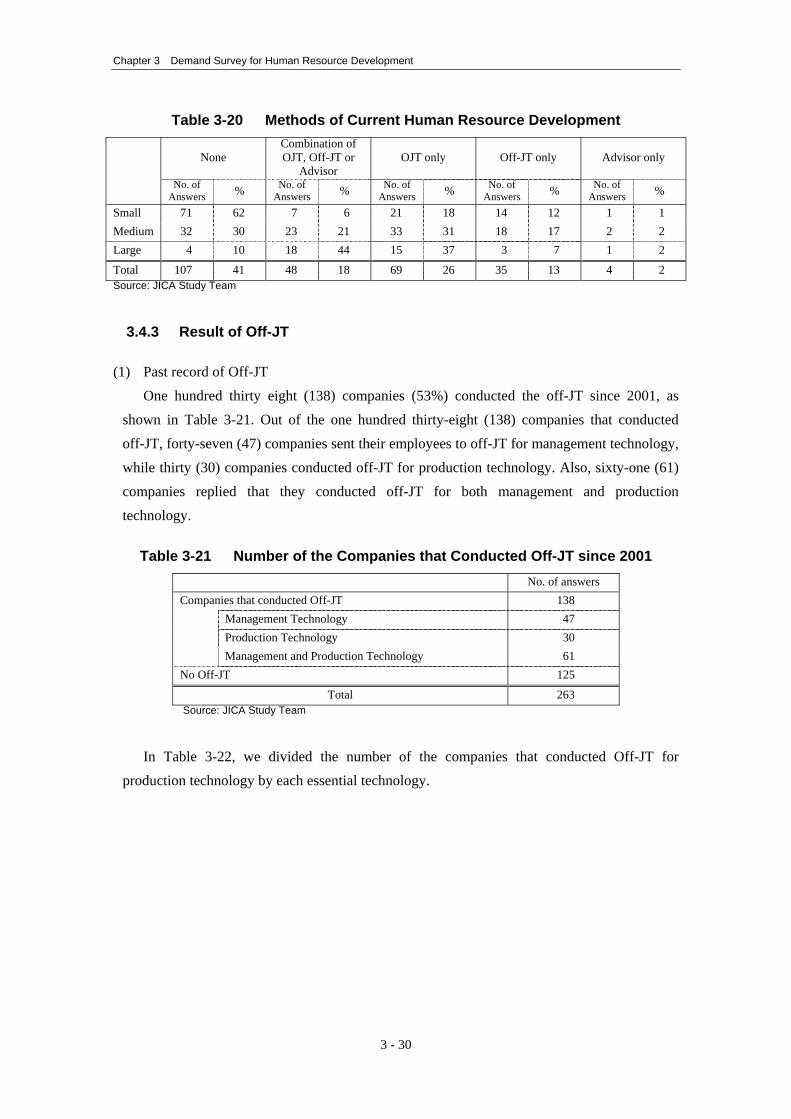
In Table 3-22, we divided the number of the companies that conducted Off-JT for
production technology by each essential technology.
3 - 30
Chapter 3 Demand Survey for Human Resource Development
Table 3-22 Number of the Companies that Conducted Off-JT for Production Technology by each Essential Technology
No. ofanswers
Share(%)
No. ofanswers
Share(%)
No. ofanswers
Share(%)
No. ofanswers
Share(%)
No. ofanswers
Share(%)
No. ofanswers
Share(%)
No. ofanswers
Share(%)
No. ofanswers
Share(%)
All responding comnpanies 91 100 54 100 4 100 24 100 10 100 24 100 51 100 5 100
Conducting Off-JT 46 51 41 76 0 0 13 54 5 50 10 42 22 43 1
Conducting Off-JT forProduction Technology 31 34 25 46 0 0 10 42 4 40 9 38 11 22 1 20
Forging Machining Assembling OthersPress Dies/Molds Plastic injection Casting
20
Source: JICA Study Team
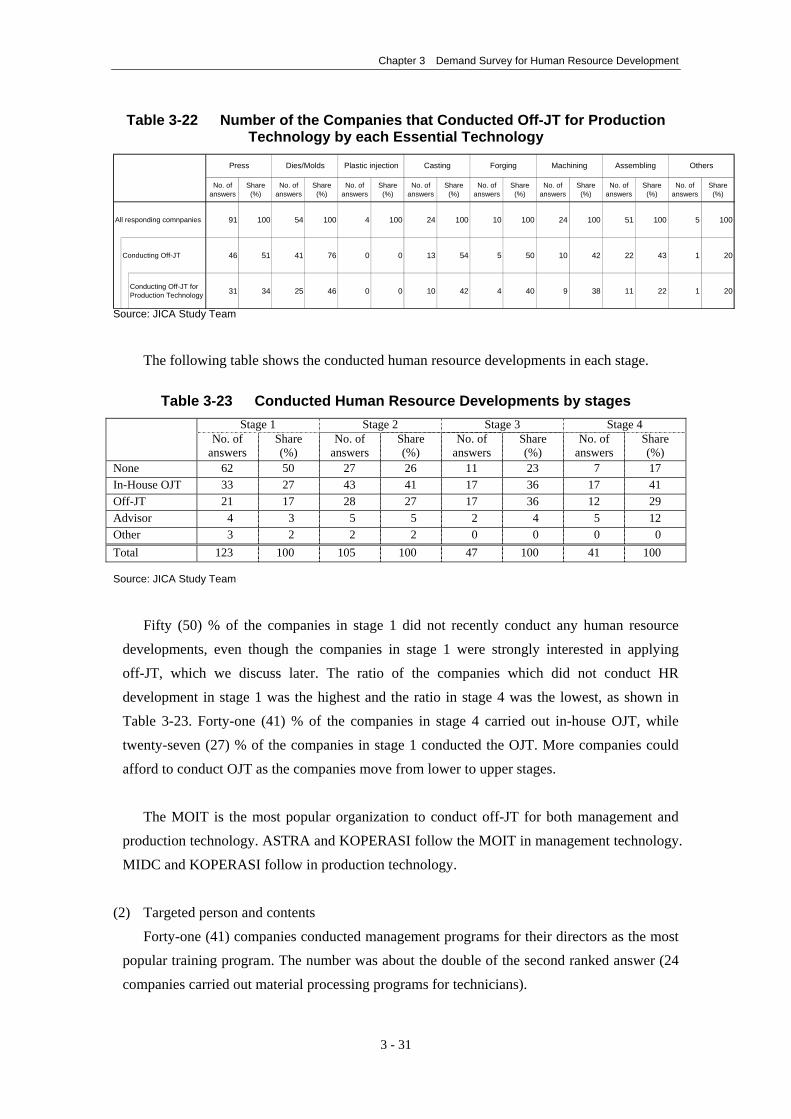
The following table shows the conducted human resource developments in each stage.
Table 3-23 Conducted Human Resource Developments by stages Stage 1 Stage 2 Stage 3 Stage 4
No. of answers
Share (%)
No. of answers
Share (%)
No. of answers
Share (%)
No. of answers
Share (%)
None 62 50 27 26 11 23 7 17 In-House OJT 33 27 43 41 17 36 17 41 Off-JT 21 17 28 27 17 36 12 29 Advisor 4 3 5 5 2 4 5 12 Other 3 2 2 2 0 0 0 0 Total 123 100 105 100 47 100 41 100
Source: JICA Study Team
Fifty (50) % of the companies in stage 1 did not recently conduct any human resource
developments, even though the companies in stage 1 were strongly interested in applying off-JT, which we discuss later. The ratio of the companies which did not conduct HR development in stage 1 was the highest and the ratio in stage 4 was the lowest, as shown in Table 3-23. Forty-one (41) % of the companies in stage 4 carried out in-house OJT, while twenty-seven (27) % of the companies in stage 1 conducted the OJT. More companies could afford to conduct OJT as the companies move from lower to upper stages.
The MOIT is the most popular organization to conduct off-JT for both management and
production technology. ASTRA and KOPERASI follow the MOIT in management technology. MIDC and KOPERASI follow in production technology.
(2) Targeted person and contents
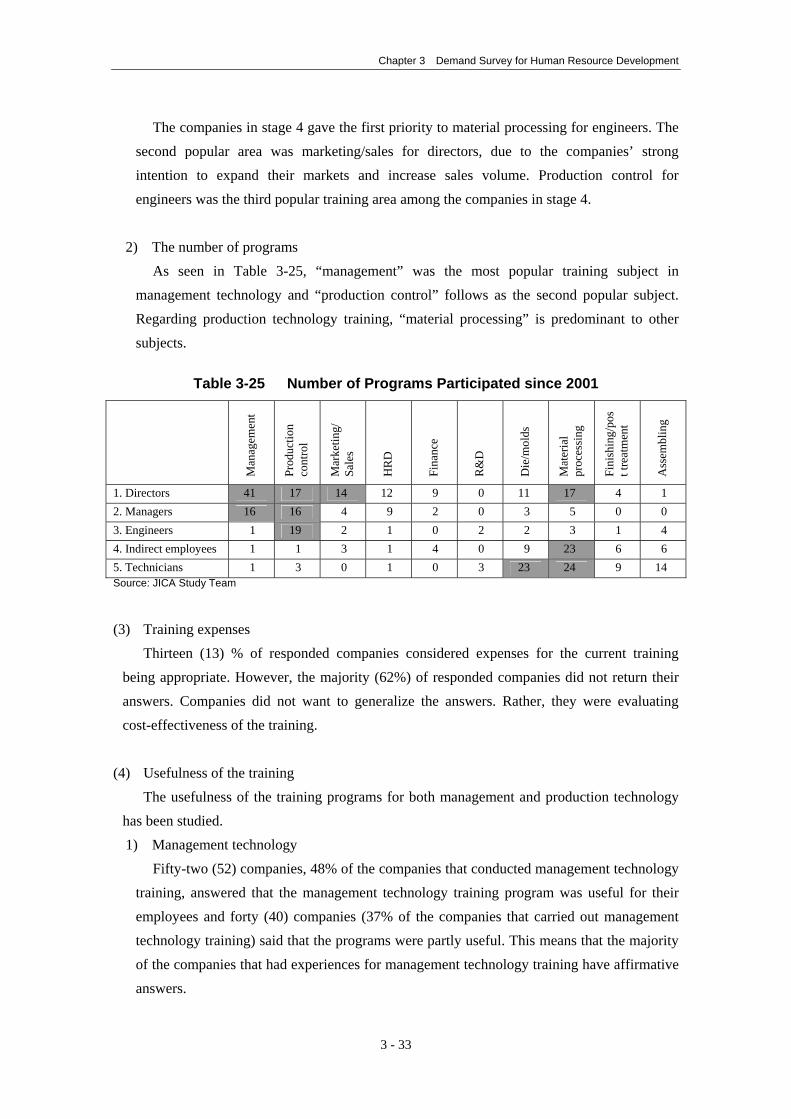
Forty-one (41) companies conducted management programs for their directors as the most popular training program. The number was about the double of the second ranked answer (24 companies carried out material processing programs for technicians).
3 - 31
Chapter 3 Demand Survey for Human Resource Development
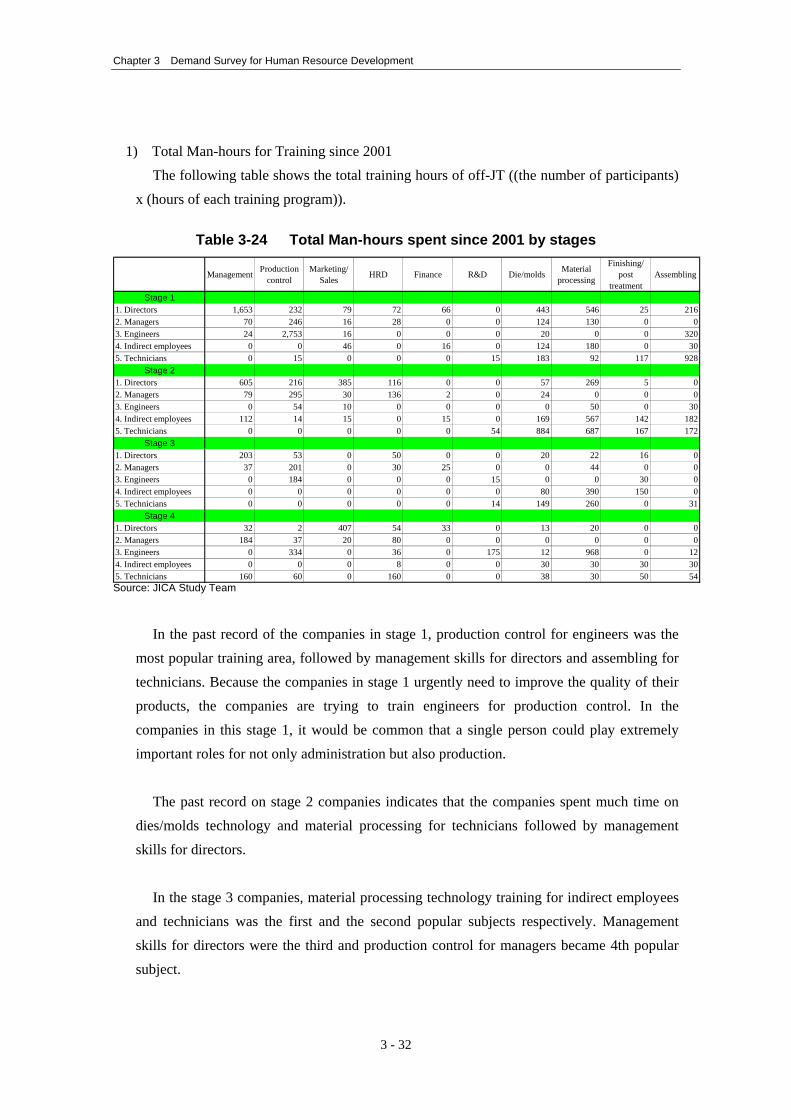
1) Total Man-hours for Training since 2001
The following table shows the total training hours of off-JT ((the number of participants) x (hours of each training program)).
Table 3-24 Total Man-hours spent since 2001 by stages
Management Productioncontrol
Marketing/Sales HRD Finance R&D Die/molds Material
processing
Finishing/post
treatmentAssembling
Stage 11. Directors 1,653 232 79 72 66 0 443 546 25 2162. Managers 70 246 16 28 0 0 124 130 0 03. Engineers 24 2,753 16 0 0 0 20 0 0 3204. Indirect employees 0 0 46 0 16 0 124 180 0 305. Technicians 0 15 0 0 0 15 183 92 117
Stage 21. Directors 605 216 385 116 0 0 57 269 5 02. Managers 79 295 30 136 2 0 24 0 0 03. Engineers 0 54 10 0 0 0 0 50 0 304. Indirect employees 112 14 15 0 15 0 169 567 142 1825. Technicians 0 0 0 0 0 54 884 687 167
Stage 31. Directors 203 53 0 50 0 0 20 22 16 02. Managers 37 201 0 30 25 0 0 44 0 03. Engineers 0 184 0 0 0 15 0 0 304. Indirect employees 0 0 0 0 0 0 80 390 1505. Technicians 0 0 0 0 0 14 149 260 0
Stage 41. Directors 32 2 407 54 33 0 13 20 0 02. Managers 184 37 20 80 0 0 0 0 0 03. Engineers 0 334 0 36 0 175 12 968 0 124. Indirect employees 0 0 0 8 0 0 30 30 305. Technicians 160 60 0 160 0 0 38 30 50 54
928
172
00
31
30
Source: JICA Study Team
In the past record of the companies in stage 1, production control for engineers was the
most popular training area, followed by management skills for directors and assembling for technicians. Because the companies in stage 1 urgently need to improve the quality of their products, the companies are trying to train engineers for production control. In the companies in this stage 1, it would be common that a single person could play extremely important roles for not only administration but also production.
The past record on stage 2 companies indicates that the companies spent much time on
dies/molds technology and material processing for technicians followed by management skills for directors.
In the stage 3 companies, material processing technology training for indirect employees
and technicians was the first and the second popular subjects respectively. Management skills for directors were the third and production control for managers became 4th popular subject.
3 - 32
Chapter 3 Demand Survey for Human Resource Development
The companies in stage 4 gave the first priority to material processing for engineers. The second popular area was marketing/sales for directors, due to the companies’ strong intention to expand their markets and increase sales volume. Production control for engineers was the third popular training area among the companies in stage 4.
2) The number of programs
As seen in Table 3-25, “management” was the most popular training subject in management technology and “production control” follows as the second popular subject. Regarding production technology training, “material processing” is predominant to other subjects.
Table 3-25 Number of Programs Participated since 2001
Man
agem
ent
Prod
uctio
n co
ntro
l
Mar
ketin
g/
Sale
s
HR
D
Fina
nce
R&
D
Die
/mol
ds
Mat
eria
l pr
oces
sing
Fini
shin
g/po
st t
reat
men
t
Ass
embl
ing
1. Directors 41 17 14 12 9 0 11 17 4 1 2. Managers 16 16 4 9 2 0 3 5 0 0 3. Engineers 1 19 2 1 0 2 2 3 1 4 4. Indirect employees 1 1 3 1 4 0 9 23 6 6 5. Technicians 1 3 0 1 0 3 23 24 9 14 Source: JICA Study Team
(3) Training expenses
Thirteen (13) % of responded companies considered expenses for the current training being appropriate. However, the majority (62%) of responded companies did not return their answers. Companies did not want to generalize the answers. Rather, they were evaluating cost-effectiveness of the training.
(4) Usefulness of the training
The usefulness of the training programs for both management and production technology has been studied. 1) Management technology
Fifty-two (52) companies, 48% of the companies that conducted management technology training, answered that the management technology training program was useful for their employees and forty (40) companies (37% of the companies that carried out management technology training) said that the programs were partly useful. This means that the majority of the companies that had experiences for management technology training have affirmative answers.
3 - 33
Chapter 3 Demand Survey for Human Resource Development
The effective points of the management technology training were a) expansion of the
management knowledge, b) practice of the theory that they learned during the training, c) improvement of the management efficiency, etc.
On the other hand, 36% of the responded companies that carried out the management
technology complained that the level of programs was low, and 30% considered that the programs were not practical due to no field works conducted.
2) Production technology
Eighty-one (81) companies out of 92 companies that carried out production technology training answered that the training programs were useful or partly useful for their employees.
The effective points of the production technology training were a) improvement of the
products’ quality, b) expansion of the knowledge, c) acquirement of the new technology, d) improvement of the employees’ skills, etc.
On the other hand, unsatisfied points of the current production technology training were
a) the training was not practical, b) the training did not meet the need of the market, and c) the low quality of the instructors, etc.
(5) Information source for the training
The most popular information source for the training is “direct contact from training agencies” and 133 companies (74%) learned about the training directly from the agencies. Mass media is not popular as an information source. Rather, mass media has not been used to invite trainees.
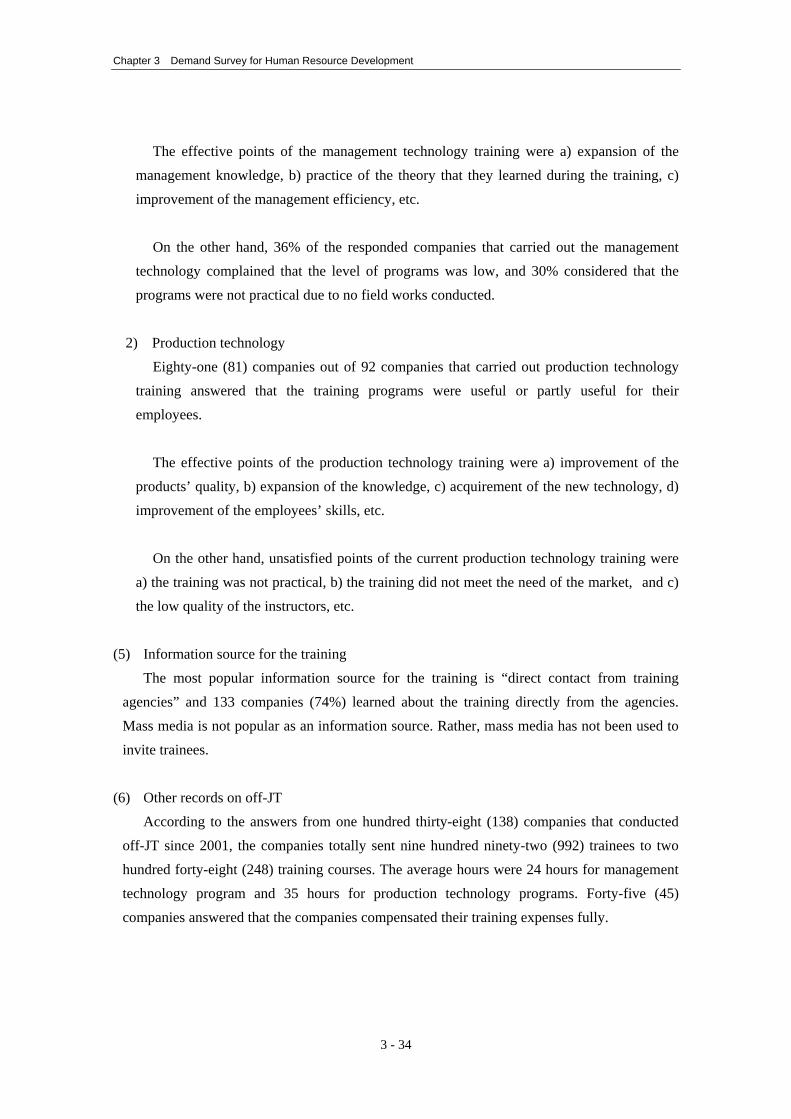
(6) Other records on off-JT
According to the answers from one hundred thirty-eight (138) companies that conducted off-JT since 2001, the companies totally sent nine hundred ninety-two (992) trainees to two hundred forty-eight (248) training courses. The average hours were 24 hours for management technology program and 35 hours for production technology programs. Forty-five (45) companies answered that the companies compensated their training expenses fully.
3 - 34
Chapter 3 Demand Survey for Human Resource Development
The number of the answers for “classroom lecture” exceeds that of practical training not only in management technology but also in production technology, whereas the result of the interview indicates the necessity of practical training in production technology.
Table 3-26 Other Records on Off-JT
Full day Outside ofregular hours
Own(%)
Subsidy(%)
Classroomlecture
Practicaltraining Both methods
ManagementTechnology 140 410 24 116 11 90.7 93.6 81 3 41
ProductionTechnology 102 506 35 81 8 78.3 95.7 14 10 66
Management &Production 6 76 21 6 0 - 100 4 -
Classroom lecture or proctical trainingTraining fee sourcesTraining timeNo. of thetrainings
No. ofemployees
participated inthe training
Averagetraining hours
2
Source: JICA Study Team
3.4.4 Future Off-JT
(1) Wishes to apply off-JT Two hundred twenty-two (222) companies (85%) answered that they would have their
employees apply off-JT. The majority of the responding companies have positive attitude toward the off-JT in their future training plans.
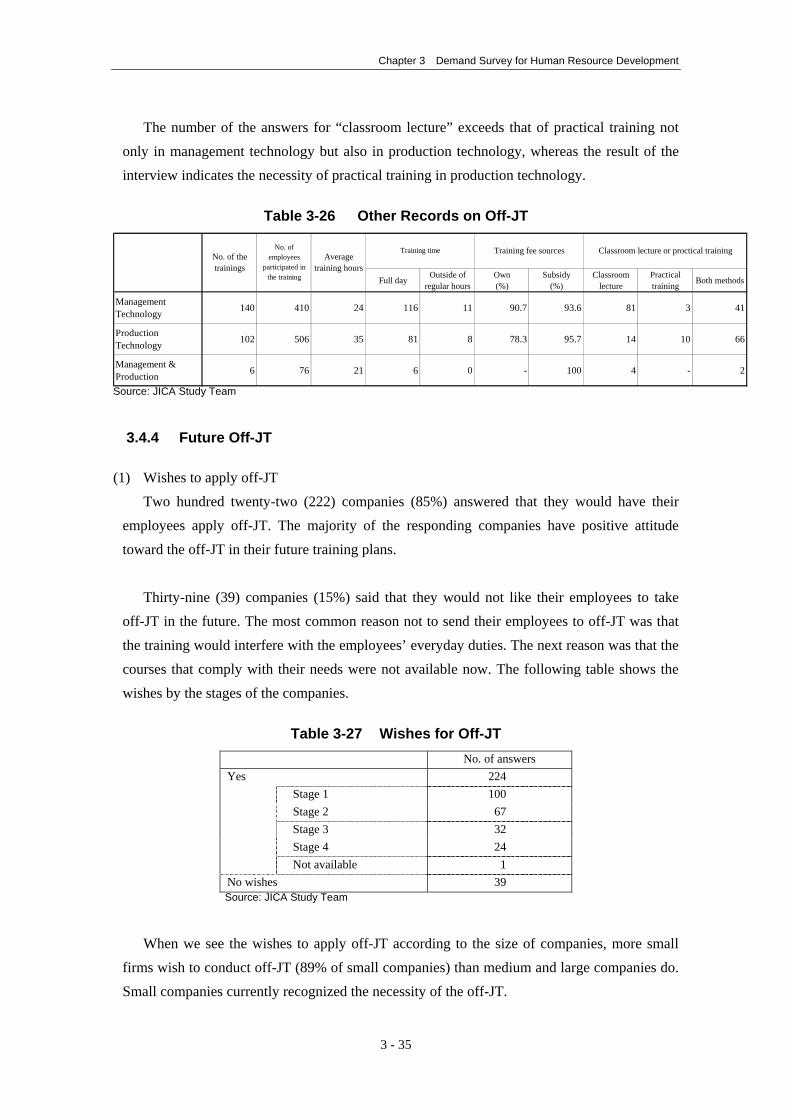
Thirty-nine (39) companies (15%) said that they would not like their employees to take
off-JT in the future. The most common reason not to send their employees to off-JT was that the training would interfere with the employees’ everyday duties. The next reason was that the courses that comply with their needs were not available now. The following table shows the wishes by the stages of the companies.
Table 3-27 Wishes for Off-JT
No. of answers Yes 224
Stage 1 100 Stage 2 67 Stage 3 32 Stage 4 24
Not available 1 No wishes 39 Source: JICA Study Team
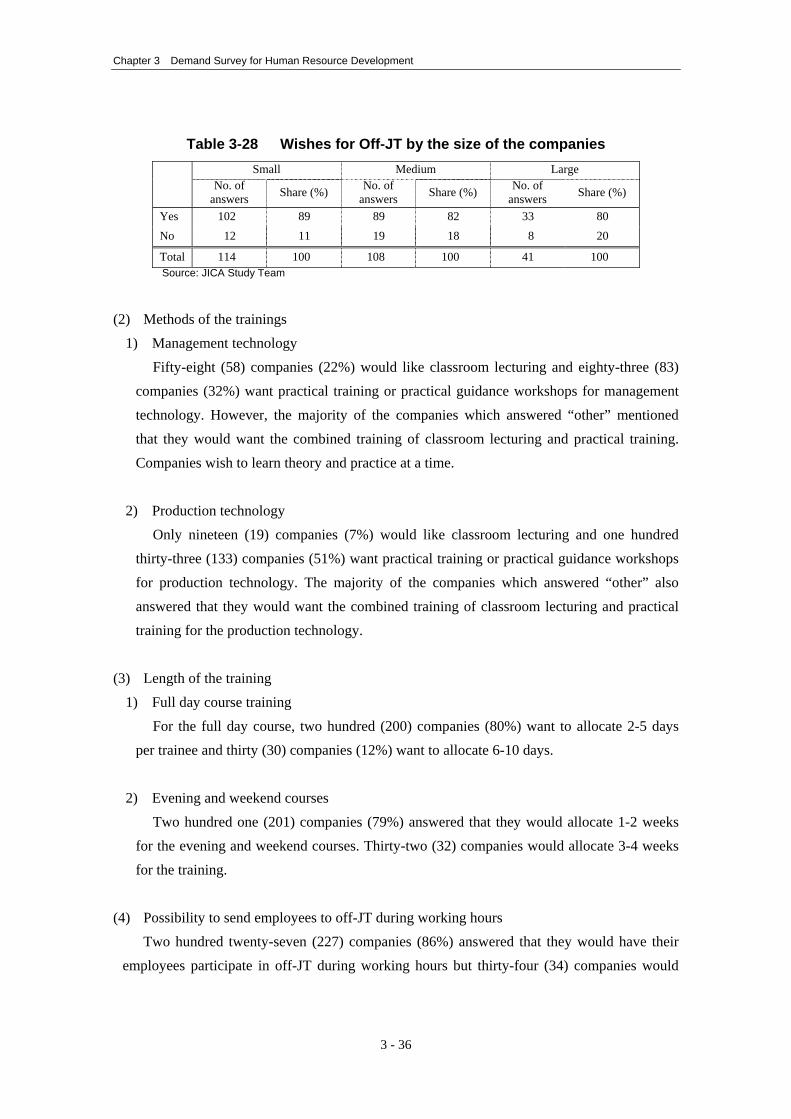
When we see the wishes to apply off-JT according to the size of companies, more small
firms wish to conduct off-JT (89% of small companies) than medium and large companies do. Small companies currently recognized the necessity of the off-JT.
3 - 35
Chapter 3 Demand Survey for Human Resource Development
Table 3-28 Wishes for Off-JT by the size of the companies
Small Medium Large No. of
answers Share (%) No. of answers Share (%) No. of
answers Share (%)
Yes 102 89 89 82 33 80 No 12 11 19 18 8 20
Total 114 100 108 100 41 100 Source: JICA Study Team
(2) Methods of the trainings
1) Management technology Fifty-eight (58) companies (22%) would like classroom lecturing and eighty-three (83)
companies (32%) want practical training or practical guidance workshops for management technology. However, the majority of the companies which answered “other” mentioned that they would want the combined training of classroom lecturing and practical training. Companies wish to learn theory and practice at a time.
2) Production technology
Only nineteen (19) companies (7%) would like classroom lecturing and one hundred thirty-three (133) companies (51%) want practical training or practical guidance workshops for production technology. The majority of the companies which answered “other” also answered that they would want the combined training of classroom lecturing and practical training for the production technology.
(3) Length of the training
1) Full day course training For the full day course, two hundred (200) companies (80%) want to allocate 2-5 days
per trainee and thirty (30) companies (12%) want to allocate 6-10 days.
2) Evening and weekend courses Two hundred one (201) companies (79%) answered that they would allocate 1-2 weeks
for the evening and weekend courses. Thirty-two (32) companies would allocate 3-4 weeks for the training.
(4) Possibility to send employees to off-JT during working hours
Two hundred twenty-seven (227) companies (86%) answered that they would have their employees participate in off-JT during working hours but thirty-four (34) companies would
3 - 36
Chapter 3 Demand Survey for Human Resource Development
not. One hundred ninety-four (194) out of 227 affirmative companies answered that, during working hours, they can allocate 2-4 days for off-JT.
(5) The most important element of the training courses
The most important element for the companies to decide training course has been asked. One hundred forty-five (145) companies (56%) answered that the content of the training course was the most important element. The next elements were the experience / ability of the instructor (57 companies (22%)) and the amount of the training fee (52 companies (20%)).
(6) Compensation if the employee requests the company to pay off-JT
During the working hours, fifty-nine (59) companies (23%) would compensate full expenses for the employees’ training. Ninety-seven (97) companies (37%) answered that they would partly compensate the expenses. However, one hundred five (105) companies (40%) would not compensate their expenses even though the training would be conducted during the working hours.
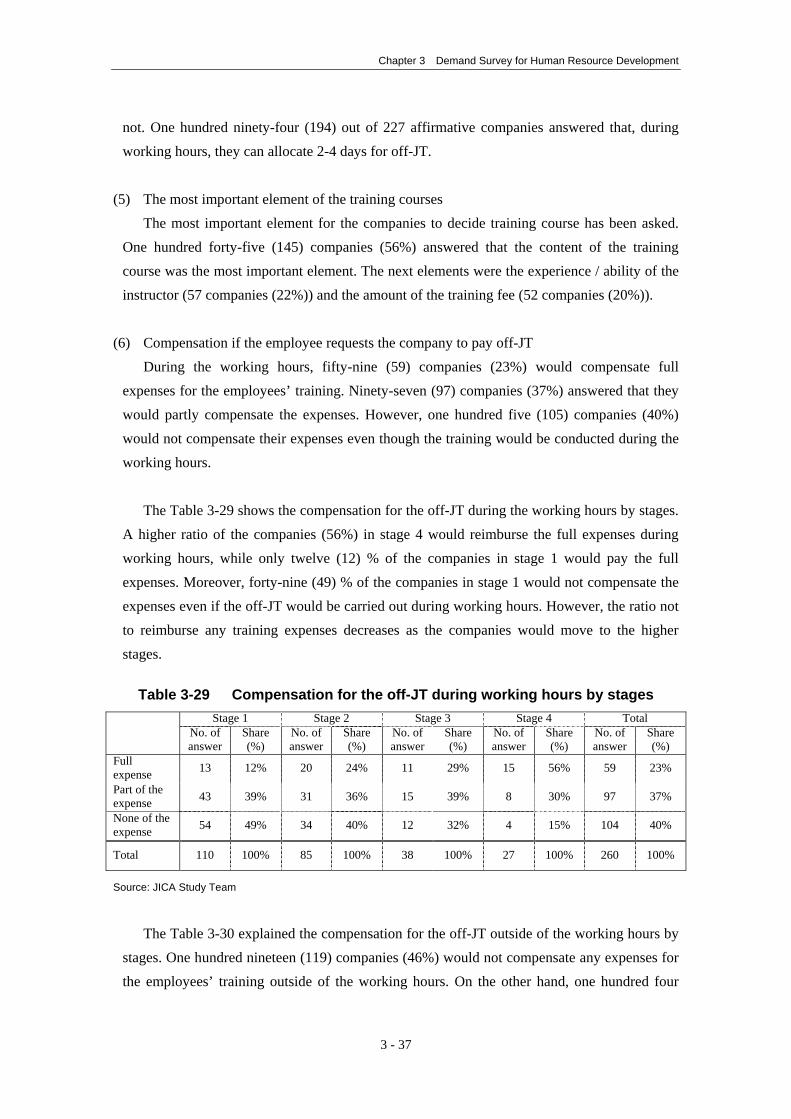
The Table 3-29 shows the compensation for the off-JT during the working hours by stages.
A higher ratio of the companies (56%) in stage 4 would reimburse the full expenses during working hours, while only twelve (12) % of the companies in stage 1 would pay the full expenses. Moreover, forty-nine (49) % of the companies in stage 1 would not compensate the expenses even if the off-JT would be carried out during working hours. However, the ratio not to reimburse any training expenses decreases as the companies would move to the higher stages.
Table 3-29 Compensation for the off-JT during working hours by stages
Stage 1 Stage 2 Stage 3 Stage 4 Total No. of
answer Share (%)
No. of answer
Share (%)
No. of answer
Share (%)
No. of answer
Share (%)
No. of answer
Share (%)
Full expense 13 12% 20 24% 11 29% 15 56% 59 23%
Part of the expense 43 39% 31 36% 15 39% 8 30% 97 37%
None of the expense 54 49% 34 40% 12 32% 4 15% 104 40%
Total 110 100% 85 100% 38 100% 27 100% 260 100%
Source: JICA Study Team
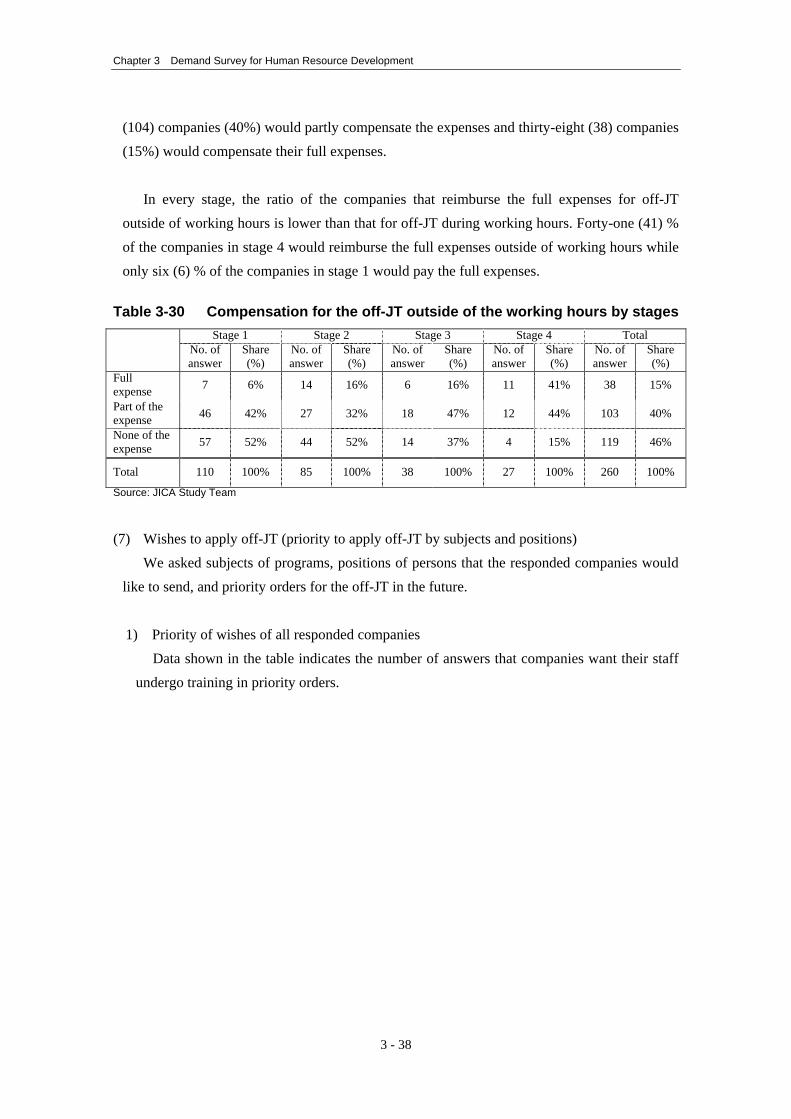
The Table 3-30 explained the compensation for the off-JT outside of the working hours by
stages. One hundred nineteen (119) companies (46%) would not compensate any expenses for the employees’ training outside of the working hours. On the other hand, one hundred four
3 - 37
Chapter 3 Demand Survey for Human Resource Development
(104) companies (40%) would partly compensate the expenses and thirty-eight (38) companies (15%) would compensate their full expenses.
In every stage, the ratio of the companies that reimburse the full expenses for off-JT
outside of working hours is lower than that for off-JT during working hours. Forty-one (41) % of the companies in stage 4 would reimburse the full expenses outside of working hours while only six (6) % of the companies in stage 1 would pay the full expenses.
Table 3-30 Compensation for the off-JT outside of the working hours by stages
Stage 1 Stage 2 Stage 3 Stage 4 Total No. of
answer Share (%)
No. of answer
Share (%)
No. of answer
Share (%)
No. of answer
Share (%)
No. of answer
Share (%)
Full expense 7 6% 14 16% 6 16% 11 41% 38 15%
Part of the expense 46 42% 27 32% 18 47% 12 44% 103 40%
None of the expense 57 52% 44 52% 14 37% 4 15% 119 46%
Total 110 100% 85 100% 38 100% 27 100% 260 100%
Source: JICA Study Team
(7) Wishes to apply off-JT (priority to apply off-JT by subjects and positions)
We asked subjects of programs, positions of persons that the responded companies would like to send, and priority orders for the off-JT in the future.
1) Priority of wishes of all responded companies
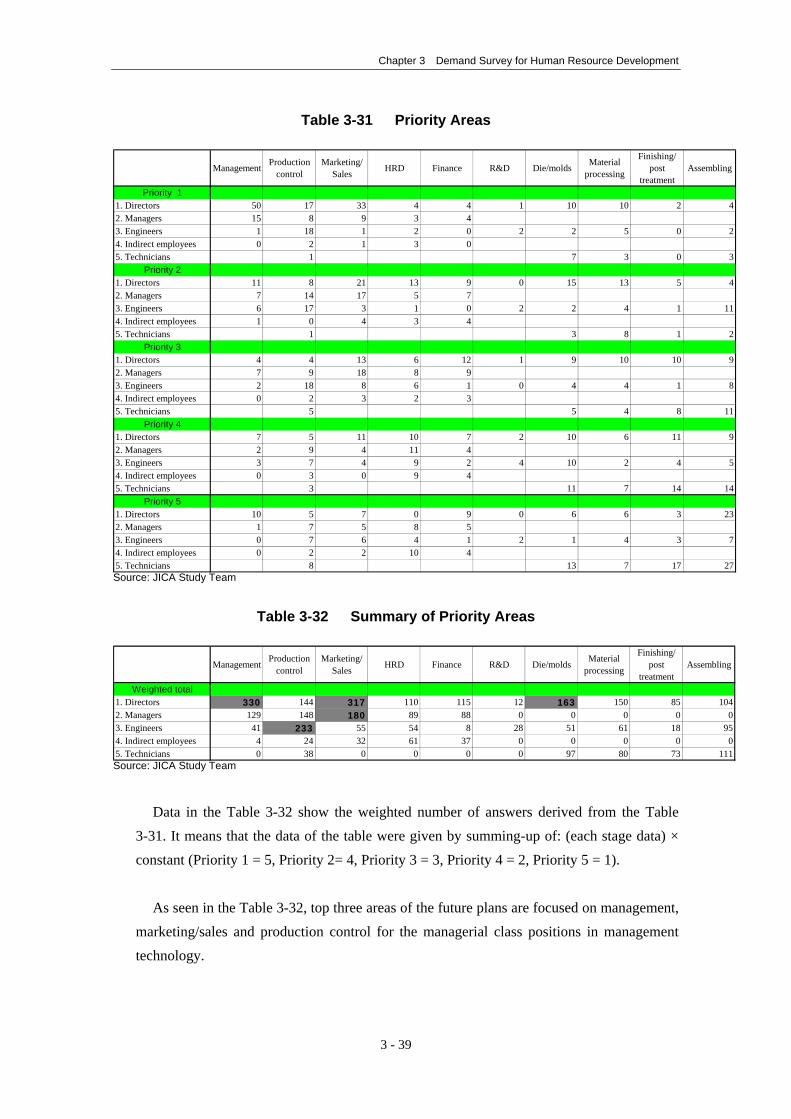
Data shown in the table indicates the number of answers that companies want their staff undergo training in priority orders.
3 - 38
Chapter 3 Demand Survey for Human Resource Development
Table 3-31 Priority Areas
Management Productioncontrol
Marketing/Sales HRD Finance R&D Die/molds Material
processing
Finishing/post
treatmentAssembling
Priority 11. Directors 50 17 33 4 4 1 10 10 2 42. Managers 15 8 9 3 43. Engineers 1 18 1 2 0 2 2 5 0 24. Indirect employees 0 2 1 3 05. Technicians 1 7 3 0 3
Priority 21. Directors 11 8 21 13 9 0 15 13 5 42. Managers 7 14 17 5 73. Engineers 6 17 3 1 0 2 2 4 14. Indirect employees 1 0 4 3 45. Technicians 1 3 8 1 2
Priority 31. Directors 4 4 13 6 12 1 9 10 10 92. Managers 7 9 18 8 93. Engineers 2 18 8 6 1 0 4 4 1 84. Indirect employees 0 2 3 2 35. Technicians 5 5 4 8 11
Priority 41. Directors 7 5 11 10 7 2 10 6 11 92. Managers 2 9 4 11 43. Engineers 3 7 4 9 2 4 10 2 4 54. Indirect employees 0 3 0 9 45. Technicians 3 11 7 14 14
Priority 51. Directors 10 5 7 0 9 0 6 6 32. Managers 1 7 5 8 53. Engineers 0 7 6 4 1 2 1 4 3 74. Indirect employees 0 2 2 10 45. Technicians 8 13 7 17 27
11
23
Source: JICA Study Team
Table 3-32 Summary of Priority Areas
Management Productioncontrol
Marketing/Sales HRD Finance R&D Die/molds Material
processing
Finishing/post
treatmentAssembling
Weighted total1. Directors 330 144 317 110 115 12 163 150 85 1042. Managers 129 148 180 89 88 0 0 0 03. Engineers 41 233 55 54 8 28 51 61 18 94. Indirect employees 4 24 32 61 37 0 0 0 0 05. Technicians 0 38 0 0 0 0 97 80 73 111
05
Source: JICA Study Team
Data in the Table 3-32 show the weighted number of answers derived from the Table
3-31. It means that the data of the table were given by summing-up of: (each stage data) × constant (Priority 1 = 5, Priority 2= 4, Priority 3 = 3, Priority 4 = 2, Priority 5 = 1).
As seen in the Table 3-32, top three areas of the future plans are focused on management,
marketing/sales and production control for the managerial class positions in management technology.
3 - 39
Chapter 3 Demand Survey for Human Resource Development
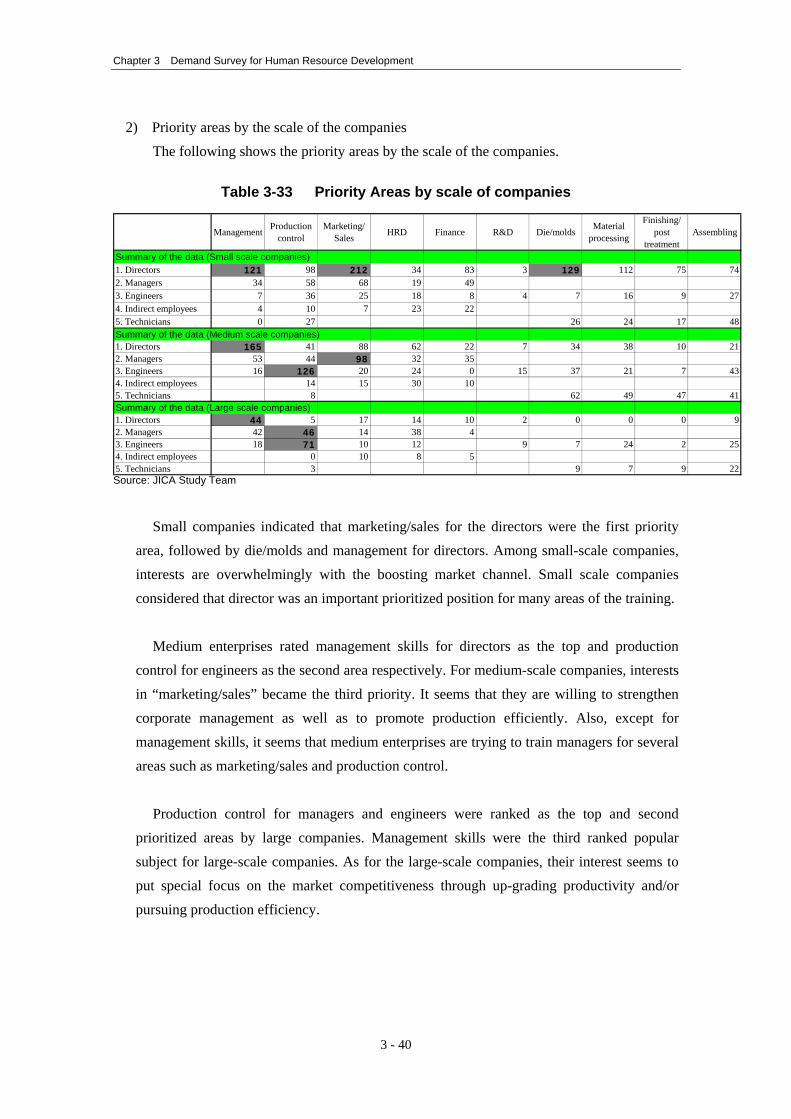
2) Priority areas by the scale of the companies The following shows the priority areas by the scale of the companies.
Table 3-33 Priority Areas by scale of companies
Management Productioncontrol
Marketing/Sales HRD Finance R&D Die/molds Material
processing
Finishing/post
treatmentAssembling
Summary of the data (Small scale companies)1. Directors 121 98 212 34 83 3 129 112 75 742. Managers 34 58 68 19 493. Engineers 7 36 25 18 8 4 7 16 94. Indirect employees 4 10 7 23 225. Technicians 0 27 26 24 17 48Summary of the data (Medium scale companies)1. Directors 165 41 88 62 22 7 34 38 10 212. Managers 53 44 98 32 353. Engineers 16 126 20 24 0 15 37 21 7 434. Indirect employees 14 15 30 105. Technicians 8 62 49 47 41Summary of the data (Large scale companies)1. Directors 44 5 17 14 10 2 0 0 0 92. Managers 42 46 14 38 43. Engineers 18 71 10 12 9 7 24 2 254. Indirect employees 0 10 8 55. Technicians 3 9 7 9 22
27
Source: JICA Study Team
Small companies indicated that marketing/sales for the directors were the first priority
area, followed by die/molds and management for directors. Among small-scale companies, interests are overwhelmingly with the boosting market channel. Small scale companies considered that director was an important prioritized position for many areas of the training.
Medium enterprises rated management skills for directors as the top and production
control for engineers as the second area respectively. For medium-scale companies, interests in “marketing/sales” became the third priority. It seems that they are willing to strengthen corporate management as well as to promote production efficiently. Also, except for management skills, it seems that medium enterprises are trying to train managers for several areas such as marketing/sales and production control.
Production control for managers and engineers were ranked as the top and second
prioritized areas by large companies. Management skills were the third ranked popular subject for large-scale companies. As for the large-scale companies, their interest seems to put special focus on the market competitiveness through up-grading productivity and/or pursuing production efficiency.
3 - 40
Chapter 3 Demand Survey for Human Resource Development
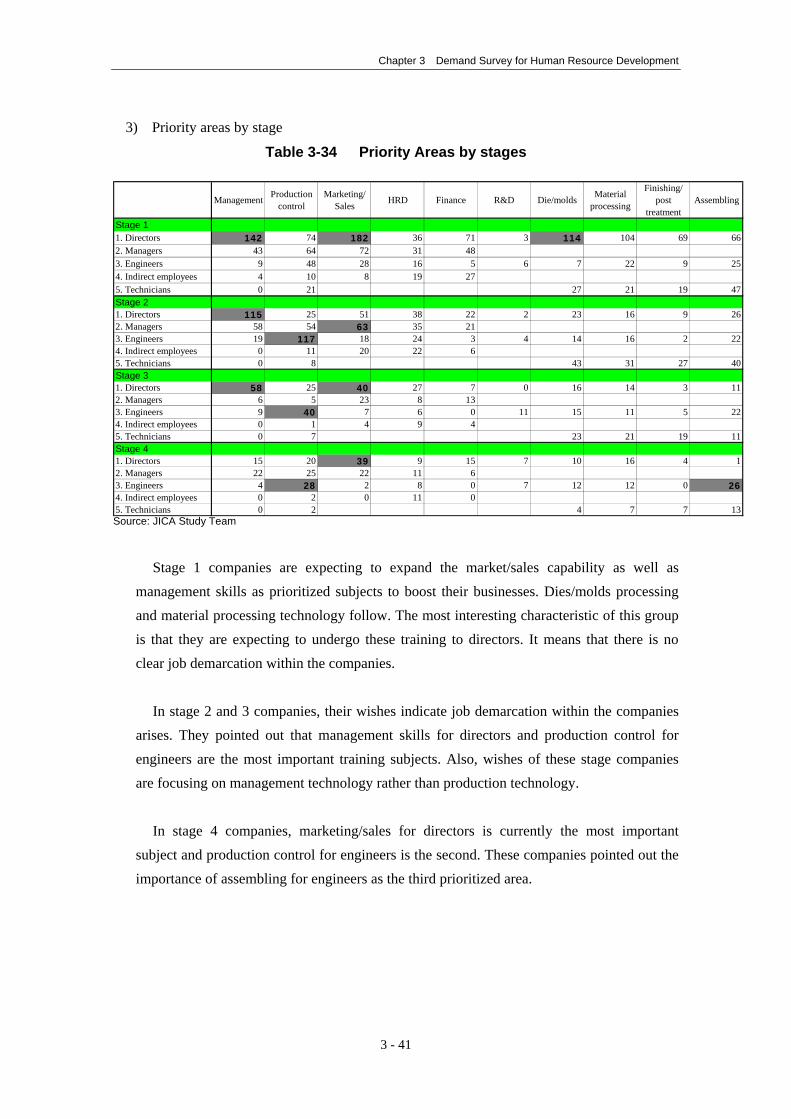
3) Priority areas by stage
Table 3-34 Priority Areas by stages
Management Productioncontrol
Marketing/Sales HRD Finance R&D Die/molds Material
processing
Finishing/post
treatmentAssembling
Stage 11. Directors 142 74 182 36 71 3 114 104 69 662. Managers 43 64 72 31 483. Engineers 9 48 28 16 5 6 7 22 9 254. Indirect employees 4 10 8 19 275. Technicians 0 21 27 21 19 47Stage 21. Directors 115 25 51 38 22 2 23 16 9 262. Managers 58 54 63 35 213. Engineers 19 117 18 24 3 4 14 16 2 224. Indirect employees 0 11 20 22 65. Technicians 0 8 43 31 27 40Stage 31. Directors 58 25 40 27 7 0 16 14 3 112. Managers 6 5 23 8 133. Engineers 9 40 7 6 0 11 15 11 5 224. Indirect employees 0 1 4 9 45. Technicians 0 7 23 21 19 11Stage 41. Directors 15 20 39 9 15 7 10 16 4 12. Managers 22 25 22 11 63. Engineers 4 28 2 8 0 7 12 12 0 264. Indirect employees 0 2 0 11 05. Technicians 0 2 4 7 7 13Source: JICA Study Team
Stage 1 companies are expecting to expand the market/sales capability as well as
management skills as prioritized subjects to boost their businesses. Dies/molds processing and material processing technology follow. The most interesting characteristic of this group is that they are expecting to undergo these training to directors. It means that there is no clear job demarcation within the companies.
In stage 2 and 3 companies, their wishes indicate job demarcation within the companies
arises. They pointed out that management skills for directors and production control for engineers are the most important training subjects. Also, wishes of these stage companies are focusing on management technology rather than production technology.
In stage 4 companies, marketing/sales for directors is currently the most important
subject and production control for engineers is the second. These companies pointed out the importance of assembling for engineers as the third prioritized area.
3 - 41
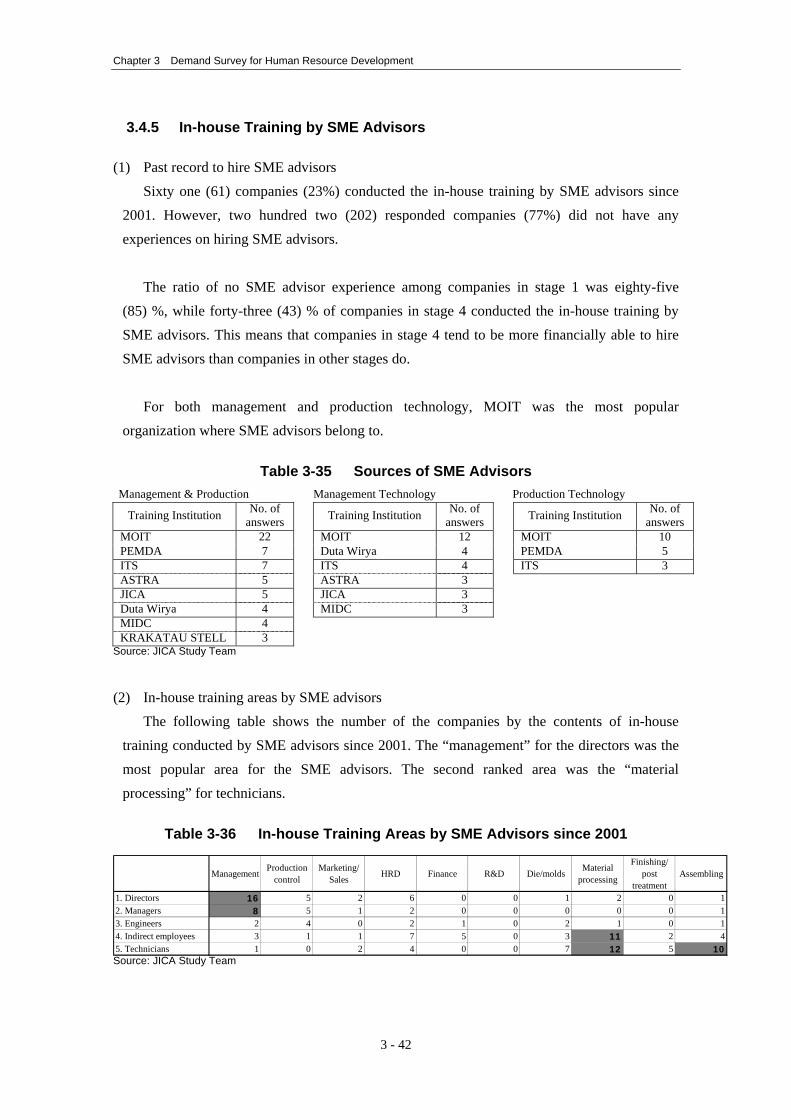
Chapter 3 Demand Survey for Human Resource Development
3.4.5 In-house Training by SME Advisors
(1) Past record to hire SME advisors Sixty one (61) companies (23%) conducted the in-house training by SME advisors since
2001. However, two hundred two (202) responded companies (77%) did not have any experiences on hiring SME advisors.
The ratio of no SME advisor experience among companies in stage 1 was eighty-five
(85) %, while forty-three (43) % of companies in stage 4 conducted the in-house training by SME advisors. This means that companies in stage 4 tend to be more financially able to hire SME advisors than companies in other stages do.
For both management and production technology, MOIT was the most popular
organization where SME advisors belong to.
Table 3-35 Sources of SME Advisors Management & Production Management Technology Production Technology
Training Institution No. of answers
Training Institution No. of answers Training Institution No. of
answersMOIT 22 MOIT 12 MOIT 10 PEMDA 7 Duta Wirya 4 PEMDA 5 ITS 7 ITS 4 ITS 3 ASTRA 5 ASTRA 3 JICA 5 JICA 3 Duta Wirya 4 MIDC 3 MIDC 4 KRAKATAU STELL 3
Source: JICA Study Team
(2) In-house training areas by SME advisors
The following table shows the number of the companies by the contents of in-house training conducted by SME advisors since 2001. The “management” for the directors was the most popular area for the SME advisors. The second ranked area was the “material processing” for technicians.
Table 3-36 In-house Training Areas by SME Advisors since 2001
Management Productioncontrol
Marketing/Sales HRD Finance R&D Die/molds Material
processing
Finishing/post
treatmentAssembling
1. Directors 16 5 2 6 0 0 1 2 0 12. Managers 8 5 1 2 0 0 0 0 0 13. Engineers 2 4 0 2 1 0 2 1 0 14. Indirect employees 3 1 1 7 5 0 3 11 2 45. Technicians 1 0 2 4 0 0 7 12 5 10Source: JICA Study Team
3 - 42
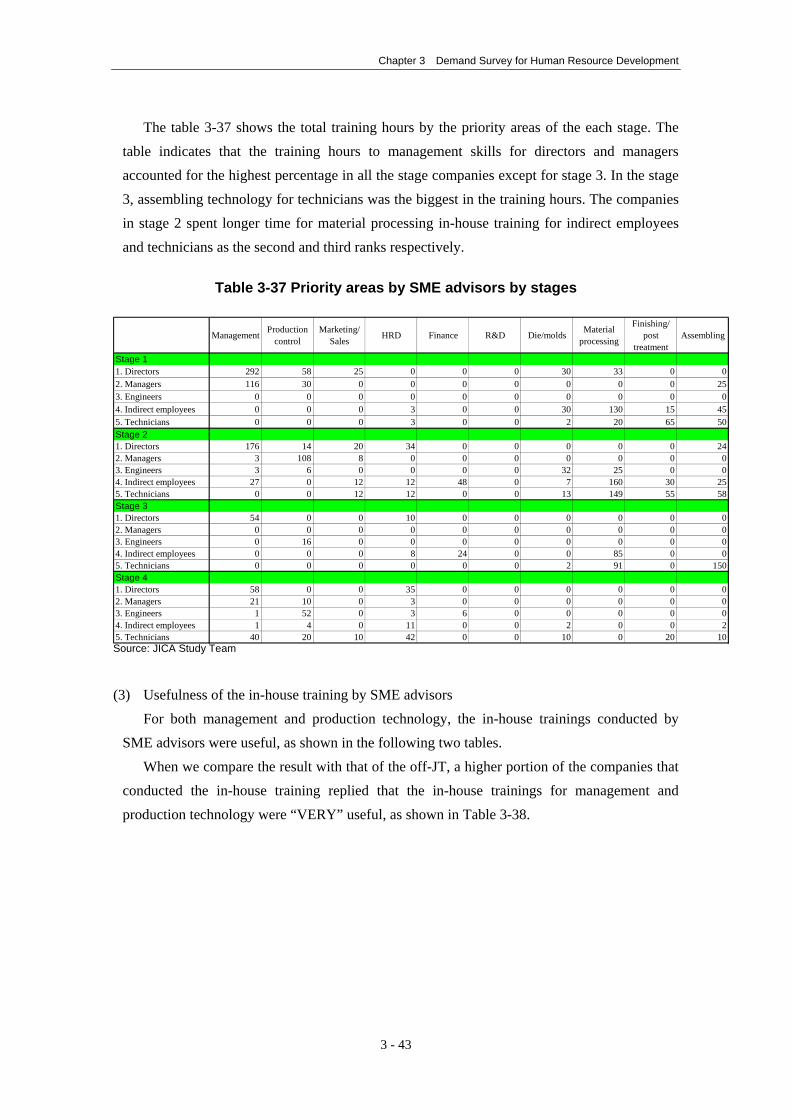
Chapter 3 Demand Survey for Human Resource Development
The table 3-37 shows the total training hours by the priority areas of the each stage. The table indicates that the training hours to management skills for directors and managers accounted for the highest percentage in all the stage companies except for stage 3. In the stage 3, assembling technology for technicians was the biggest in the training hours. The companies in stage 2 spent longer time for material processing in-house training for indirect employees and technicians as the second and third ranks respectively.
Table 3-37 Priority areas by SME advisors by stages
Management Productioncontrol
Marketing/Sales HRD Finance R&D Die/molds Material
processing
Finishing/post
treatmentAssembling
Stage 11. Directors 292 58 25 0 0 0 30 33 0 02. Managers 116 30 0 0 0 0 0 0 03. Engineers 0 0 0 0 0 0 0 0 04. Indirect employees 0 0 0 3 0 0 30 130 15 455. Technicians 0 0 0 3 0 0 2 20 65 50Stage 21. Directors 176 14 20 34 0 0 0 0 0 242. Managers 3 108 8 0 0 0 0 0 0 03. Engineers 3 6 0 0 0 0 32 25 04. Indirect employees 27 0 12 12 48 0 7 160 30 25. Technicians 0 0 12 12 0 0 13 149 55 58Stage 31. Directors 54 0 0 10 0 0 0 0 02. Managers 0 0 0 0 0 0 0 0 03. Engineers 0 16 0 0 0 0 0 0 04. Indirect employees 0 0 0 8 24 0 0 85 0 05. Technicians 0 0 0 0 0 0 2 91 0 150Stage 41. Directors 58 0 0 35 0 0 0 0 02. Managers 21 10 0 3 0 0 0 0 0 03. Engineers 1 52 0 3 6 0 0 0 04. Indirect employees 1 4 0 11 0 0 2 0 0 25. Technicians 40 20 10 42 0 0 10 0 20
250
05
000
0
0
10Source: JICA Study Team
(3) Usefulness of the in-house training by SME advisors
For both management and production technology, the in-house trainings conducted by SME advisors were useful, as shown in the following two tables.
When we compare the result with that of the off-JT, a higher portion of the companies that conducted the in-house training replied that the in-house trainings for management and production technology were “VERY” useful, as shown in Table 3-38.
3 - 43
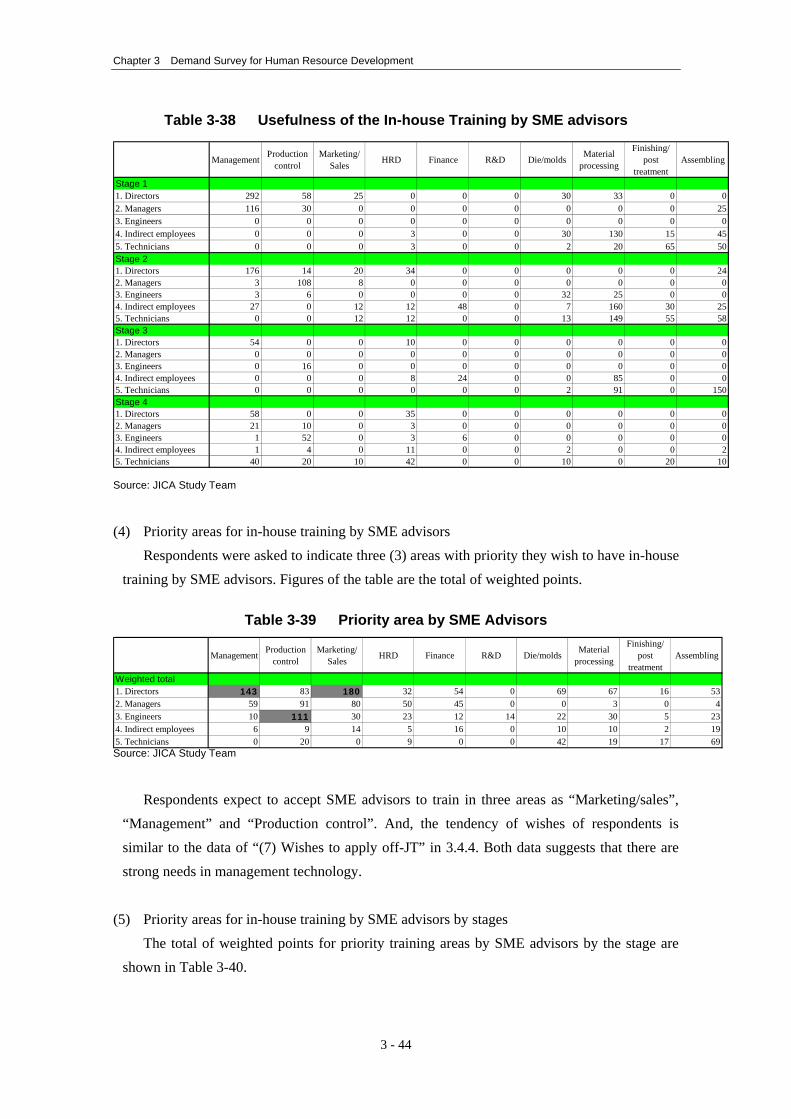
Chapter 3 Demand Survey for Human Resource Development
Table 3-38 Usefulness of the In-house Training by SME advisors
Management Productioncontrol
Marketing/Sales HRD Finance R&D Die/molds Material
processing
Finishing/post
treatmentAssembling
Stage 11. Directors 292 58 25 0 0 0 30 33 0 02. Managers 116 30 0 0 0 0 0 0 03. Engineers 0 0 0 0 0 0 0 0 04. Indirect employees 0 0 0 3 0 0 30 130 15 455. Technicians 0 0 0 3 0 0 2 20 65 50Stage 21. Directors 176 14 20 34 0 0 0 0 0 242. Managers 3 108 8 0 0 0 0 0 0 03. Engineers 3 6 0 0 0 0 32 25 04. Indirect employees 27 0 12 12 48 0 7 160 30 25. Technicians 0 0 12 12 0 0 13 149 55 58Stage 31. Directors 54 0 0 10 0 0 0 0 02. Managers 0 0 0 0 0 0 0 0 03. Engineers 0 16 0 0 0 0 0 0 04. Indirect employees 0 0 0 8 24 0 0 85 0 05. Technicians 0 0 0 0 0 0 2 91 0 150Stage 41. Directors 58 0 0 35 0 0 0 0 02. Managers 21 10 0 3 0 0 0 0 0 03. Engineers 1 52 0 3 6 0 0 0 04. Indirect employees 1 4 0 11 0 0 2 0 0 25. Technicians 40 20 10 42 0 0 10 0 20
250
05
000
0
0
10 Source: JICA Study Team
(4) Priority areas for in-house training by SME advisors
Respondents were asked to indicate three (3) areas with priority they wish to have in-house training by SME advisors. Figures of the table are the total of weighted points.
Table 3-39 Priority area by SME Advisors
Management Productioncontrol
Marketing/Sales HRD Finance R&D Die/molds Material
processing
Finishing/post
treatmentAssembling
Weighted total1. Directors 143 83 180 32 54 0 69 67 16 52. Managers 59 91 80 50 45 0 0 3 0 43. Engineers 10 111 30 23 12 14 22 30 5 234. Indirect employees 6 9 14 5 16 0 10 10 2 195. Technicians 0 20 0 9 0 0 42 19 17
3
69Source: JICA Study Team
Respondents expect to accept SME advisors to train in three areas as “Marketing/sales”,
“Management” and “Production control”. And, the tendency of wishes of respondents is similar to the data of “(7) Wishes to apply off-JT” in 3.4.4. Both data suggests that there are strong needs in management technology.
(5) Priority areas for in-house training by SME advisors by stages
The total of weighted points for priority training areas by SME advisors by the stage are shown in Table 3-40.
3 - 44
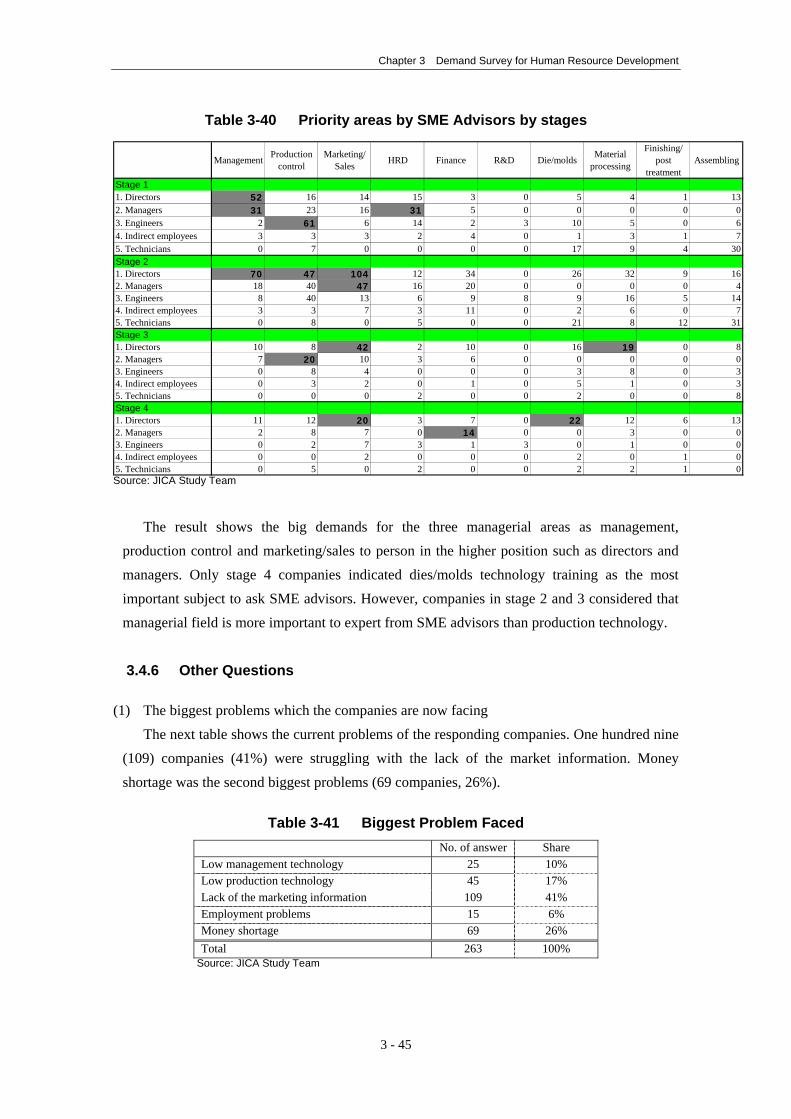
Chapter 3 Demand Survey for Human Resource Development
Table 3-40 Priority areas by SME Advisors by stages
Management Productioncontrol
Marketing/Sales HRD Finance R&D Die/molds Material
processing
Finishing/post
treatmentAssembling
Stage 11. Directors 52 16 14 15 3 0 5 4 12. Managers 31 23 16 31 5 0 0 0 03. Engineers 2 61 6 14 2 3 10 5 04. Indirect employees 3 3 3 2 4 0 1 3 15. Technicians 0 7 0 0 0 0 17 9 4Stage 21. Directors 70 47 104 12 34 0 26 32 92. Managers 18 40 47 16 20 0 0 0 03. Engineers 8 40 13 6 9 8 9 16 5 144. Indirect employees 3 3 7 3 11 0 2 6 05. Technicians 0 8 0 5 0 0 21 8 12Stage 31. Directors 10 8 42 2 10 0 16 19 0 82. Managers 7 20 10 3 6 0 0 0 03. Engineers 0 8 4 0 0 0 3 8 04. Indirect employees 0 3 2 0 1 0 5 1 05. Technicians 0 0 0 2 0 0 2 0 0Stage 41. Directors 11 12 20 3 7 0 22 12 6 132. Managers 2 8 7 0 14 0 0 3 03. Engineers 0 2 7 3 1 3 0 1 04. Indirect employees 0 0 2 0 0 0 2 0 15. Technicians 0 5 0 2 0 0 2 2 1
13067
30
164
731
0338
0000
Source: JICA Study Team
The result shows the big demands for the three managerial areas as management,
production control and marketing/sales to person in the higher position such as directors and managers. Only stage 4 companies indicated dies/molds technology training as the most important subject to ask SME advisors. However, companies in stage 2 and 3 considered that managerial field is more important to expert from SME advisors than production technology.
3.4.6 Other Questions
(1) The biggest problems which the companies are now facing The next table shows the current problems of the responding companies. One hundred nine
(109) companies (41%) were struggling with the lack of the market information. Money shortage was the second biggest problems (69 companies, 26%).
Table 3-41 Biggest Problem Faced
No. of answer Share Low management technology 25 10% Low production technology 45 17% Lack of the marketing information 109 41% Employment problems 15 6% Money shortage 69 26% Total 263 100%
Source: JICA Study Team
3 - 45
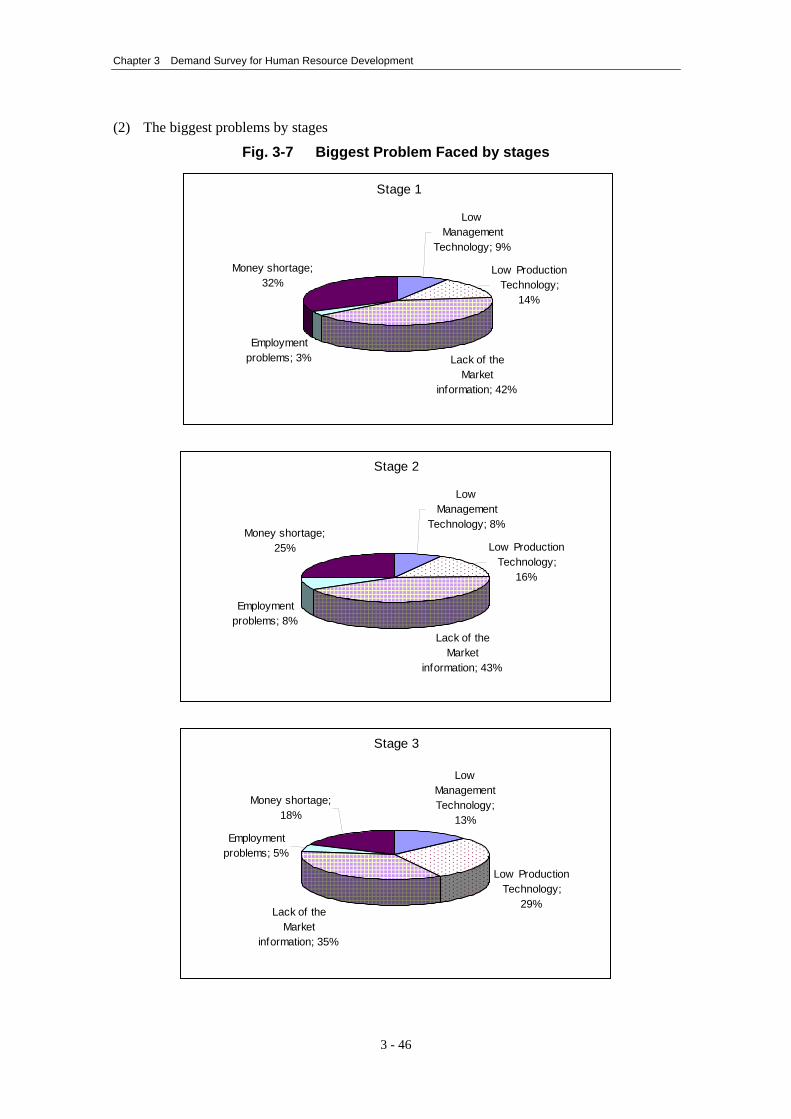
Chapter 3 Demand Survey for Human Resource Development
(2) The biggest problems by stages
Fig. 3-7 Biggest Problem Faced by stages
Stage 1
LowManagement
Technology; 9%
Low ProductionTechnology;
14%
Lack of theMarket
information; 42%
Employmentproblems; 3%
Money shortage;32%
Stage 2
LowManagement
Technology; 8%
Low ProductionTechnology;
16%
Lack of theMarket
information; 43%
Employmentproblems; 8%
Money shortage;25%
Stage 3
LowManagementTechnology;
13%
Low ProductionTechnology;
29%Lack of the
Marketinformation; 35%
Employmentproblems; 5%
Money shortage;18%
3 - 46
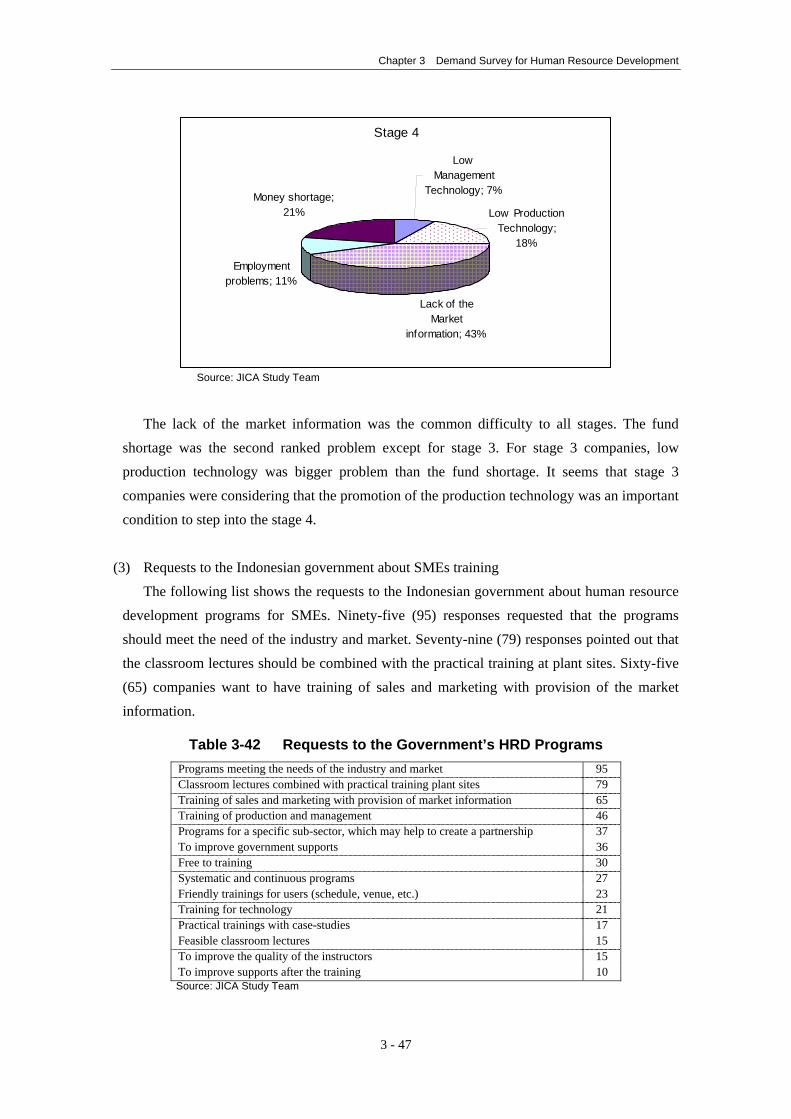
Chapter 3 Demand Survey for Human Resource Development
Stage 4
LowManagement
Technology; 7%
Low ProductionTechnology;
18%
Lack of theMarket
information; 43%
Employmentproblems; 11%
Money shortage;21%
Source: JICA Study Team
The lack of the market information was the common difficulty to all stages. The fund
shortage was the second ranked problem except for stage 3. For stage 3 companies, low production technology was bigger problem than the fund shortage. It seems that stage 3 companies were considering that the promotion of the production technology was an important condition to step into the stage 4.
(3) Requests to the Indonesian government about SMEs training
The following list shows the requests to the Indonesian government about human resource development programs for SMEs. Ninety-five (95) responses requested that the programs should meet the need of the industry and market. Seventy-nine (79) responses pointed out that the classroom lectures should be combined with the practical training at plant sites. Sixty-five (65) companies want to have training of sales and marketing with provision of the market information.
Table 3-42 Requests to the Government’s HRD Programs
Programs meeting the needs of the industry and market 95 Classroom lectures combined with practical training plant sites 79 Training of sales and marketing with provision of market information 65 Training of production and management 46 Programs for a specific sub-sector, which may help to create a partnership 37 To improve government supports 36 Free to training 30 Systematic and continuous programs 27 Friendly trainings for users (schedule, venue, etc.) 23 Training for technology 21 Practical trainings with case-studies 17 Feasible classroom lectures 15 To improve the quality of the instructors 15 To improve supports after the training 10 Source: JICA Study Team
3 - 47
Chapter 3 Demand Survey for Human Resource Development
3.4.7 Narrative Summary of the Questionnaire Survey
Data discussed in this questionnaire survey was fundamentally targeting small and medium scale supporting industries in transportation, electrics/electronics appliances and general machineries sub-sectors. Some large-scale supporting industries are included for comparison.
It was confirmed that the companies were aware of the importance of human resource
development for the satisfactory growth of the companies. [Off-JT]
Key Training Subjects for the off-JT: Management Technology: Corporate management, Marketing/Sales, Production ControlProduction Technology: Die/Molds, Material Processing
Training needs of the off-JT: Management, marketing/sales and production control were the top three ranked training
subjects for the off-JT. Small-scale companies considered that production technology, especially “dies/molds technology” can not be neglected. However, there is the little number of public centers that can provide training programs for dies/molds technology to the industry. On the other hand, demands from larger scale companies seem that they are aiming more at market competitiveness and boosting production efficiency through introducing modernized administration method and strengthening the quality control system.
Position of staff that small-scale companies target to foster is management or directors
rather than technicians and/or indirect workers. Generally, job demarcation is not clear for the most of the small-scale companies so that top management could be the only one engineer and sales person as well as the financial manager in the companies. In addition to the demands to train management, it is more important for medium and large companies to train their managers or engineers in order to expand their businesses.
3 - 48

Chapter 3 Demand Survey for Human Resource Development
Duration and methods of Training for the off-JT: 2 to 5 days for full day courses One week (5 days) for evening and weekend courses Combination of classroom lecture and practice at plants
The majority of the companies answered that at most 2 to 5 days day-time (full day) training courses are preferable, and 5 days for evening or weekend courses.
Ongoing management technology courses cover both classroom lecture and field works.
Several training programs for production technology offer practical training at plants in addition to classroom lectures. However, the past records and the wishes of companies indicate the necessity and importance of combined training for theoretical lecture at classroom and practical works at plants. Responding companies feel that the program should comply with the real needs from the market. The companies also claim the experiences and ability of training instructors.
Although 40% of the responding companies would not reimburse any training expenses,
60% of the companies would compensate full or partial training expenses. The companies tend to financially support their employees’ training while the companies move to upper stages.
It is necessary to reexamine the curriculum of ongoing programs and to foster knowledge
and skills of instructors. [SME Advisors] Only 23 % of the responding companies conducted in-house training by SME advisors.
However, the majority of the companies that invited SME advisors before answered that the in-house trainings conducted by SME advisors were useful for management and production technology.
The companies want SME advisors to train in Marketing/sales, management and production
control that tend to be similar with the answers for off-JT. For the in-house training by SME advisors, the targeting person tends to be in higher positions such as directors and managers.
3 - 49
Chapter 3 Demand Survey for Human Resource Development
[Requests to the government’s human resource development]
Requests to the government: Training programs that are corresponding to the market and industry need Combination of classroom (theoretical) lecturing and practice at workplace Sales/marketing training programs with provision of market information
The requests to the government in terms of human resource development fully comply with
the topics already discussed in the previous section. It is understandable that most SMEs expect much from the government when they look for
training centers for off-JT. Because it is common to almost all the SMEs that are suffering from the shortage of operational capital, they expect cheap but quality training programs. On the other hand, SMEs have complaints on the current training programs. Reevaluation of the current training programs with due considerations to key factors indicated above is needed.
3 - 50