Embed Size (px)
Citation preview
Presented by:
Steve Cavanaugh, P.E.
Water Audits
One Tool in the ToolboxTuesday, May 17, 2016 Water Infrastructure
Planning & Financing:
A Workshop for
Rethinking, Reinvesting &
Reinvigorating our Water
Systems
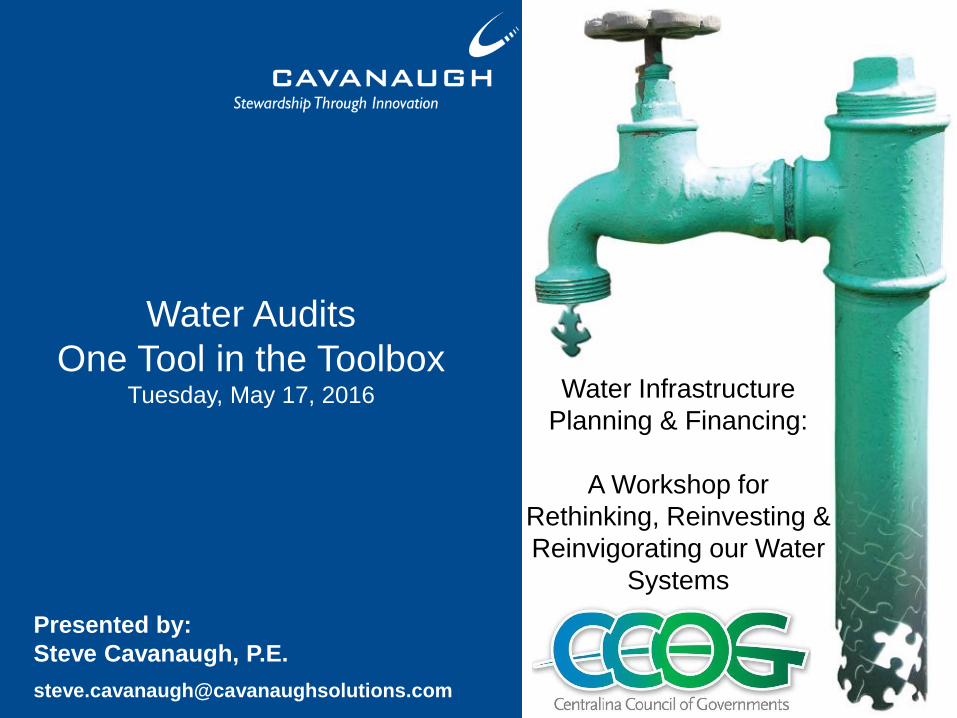
“AWWA is challenging
1,000 water utilities to
complete a water audit
using AWWA's Free
Water Audit Software in
the next two years and
report their findings on
AWWA's website.”
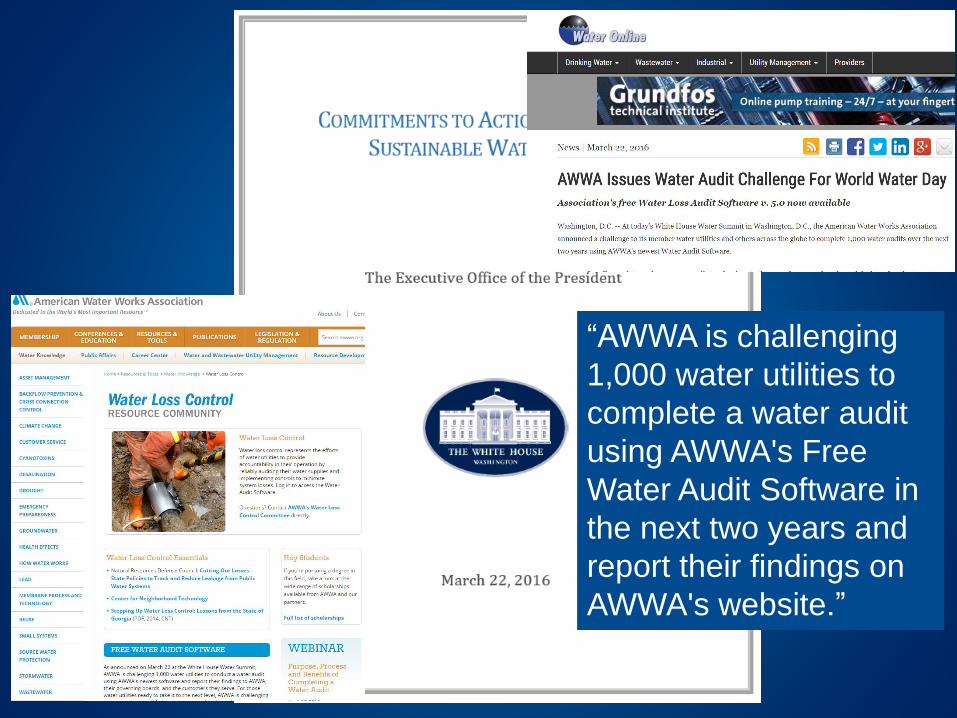
What’s driving change?
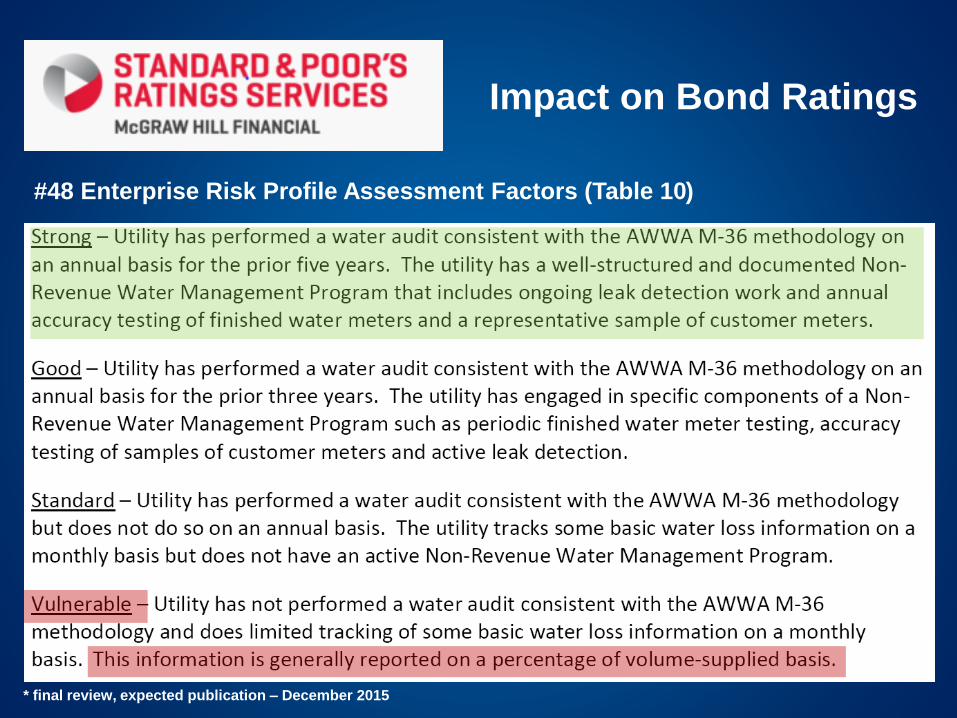
#48 Enterprise Risk Profile Assessment Factors (Table 10)
Impact on Bond Ratings
* final review, expected publication – December 2015
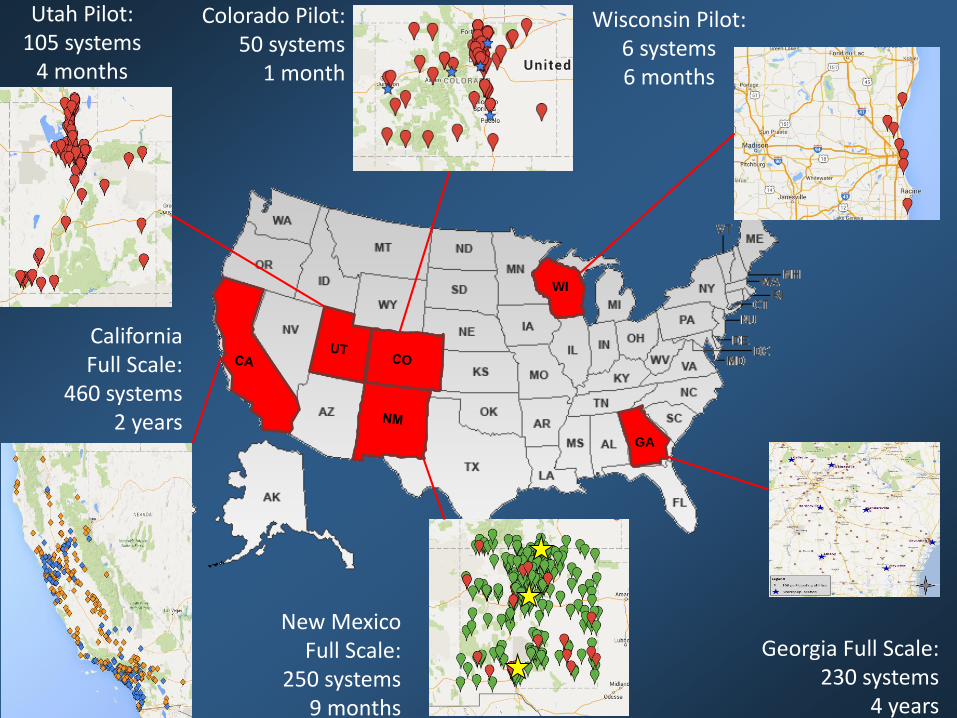
Wisconsin Pilot: 6 systems6 months
Colorado Pilot: 50 systems
1 month
New Mexico Full Scale:
250 systems9 months
WI
GA
Georgia Full Scale: 230 systems
4 years
California Full Scale:
460 systems2 years
Utah Pilot: 105 systems
4 months
6
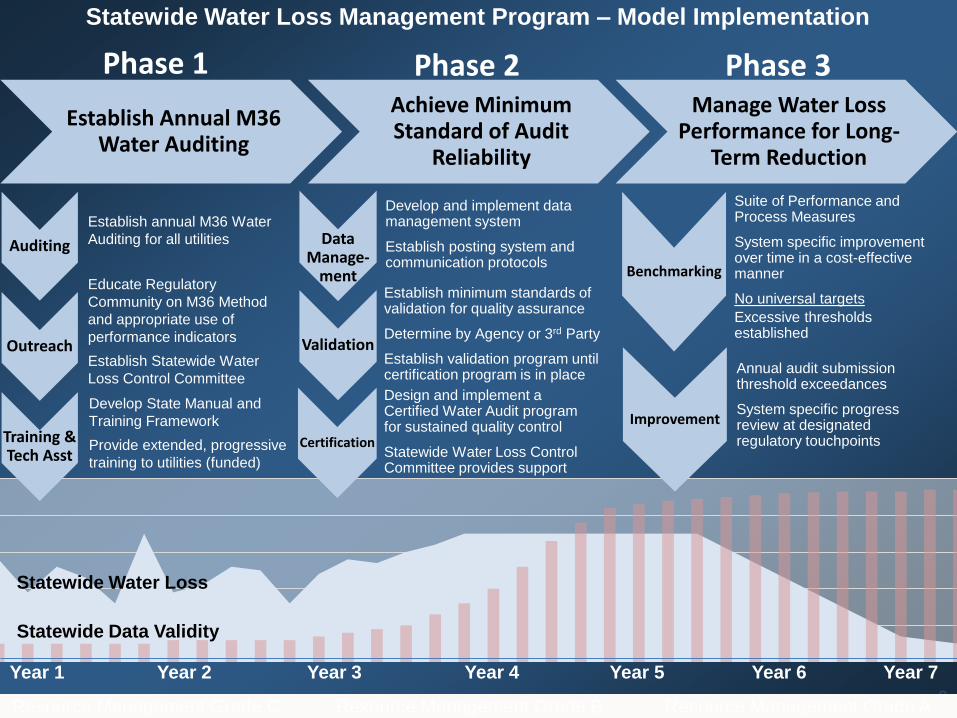
Phase 1
Establish Annual M36 Water Auditing
Achieve Minimum Standard of Audit
Reliability
Manage Water Loss Performance for Long-
Term Reduction
Phase 2 Phase 3
Auditing
Outreach
Training &Tech Asst
DataManage-
ment
Validation
Certification
Benchmarking
Improvement
Statewide Data Validity
Statewide Water Loss
Year 1 Year 2 Year 3 Year 4 Year 5 Year 6 Year 7
Resource Management Grade C Resource Management Grade B Resource Management Grade A
Establish annual M36 Water
Auditing for all utilities
Educate Regulatory
Community on M36 Method
and appropriate use of
performance indicators
Establish Statewide Water
Loss Control Committee
Develop State Manual and
Training Framework
Provide extended, progressive
training to utilities (funded)
Develop and implement data management system
Establish posting system and communication protocols
Establish minimum standards of validation for quality assurance
Determine by Agency or 3rd Party
Establish validation program until certification program is in place
Design and implement a Certified Water Audit program for sustained quality control
Statewide Water Loss Control Committee provides support
Suite of Performance and Process Measures
System specific improvement over time in a cost-effective manner
No universal targets
Excessive thresholds established
Annual audit submission threshold exceedances
System specific progress review at designated regulatory touchpoints
Statewide Water Loss Management Program – Model Implementation

7
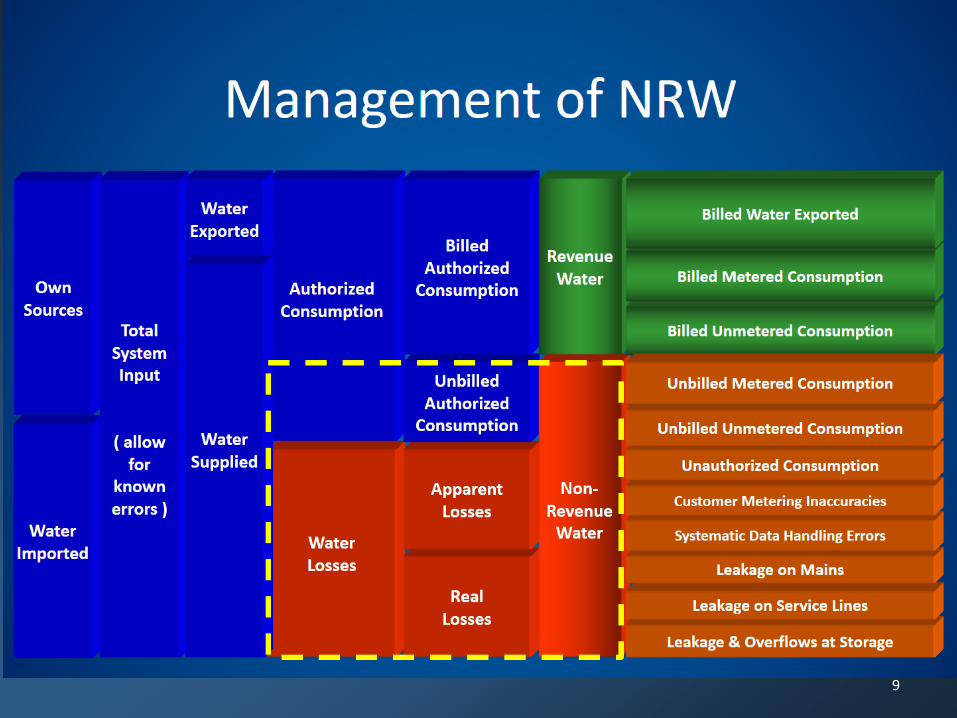
Are We Healthy?
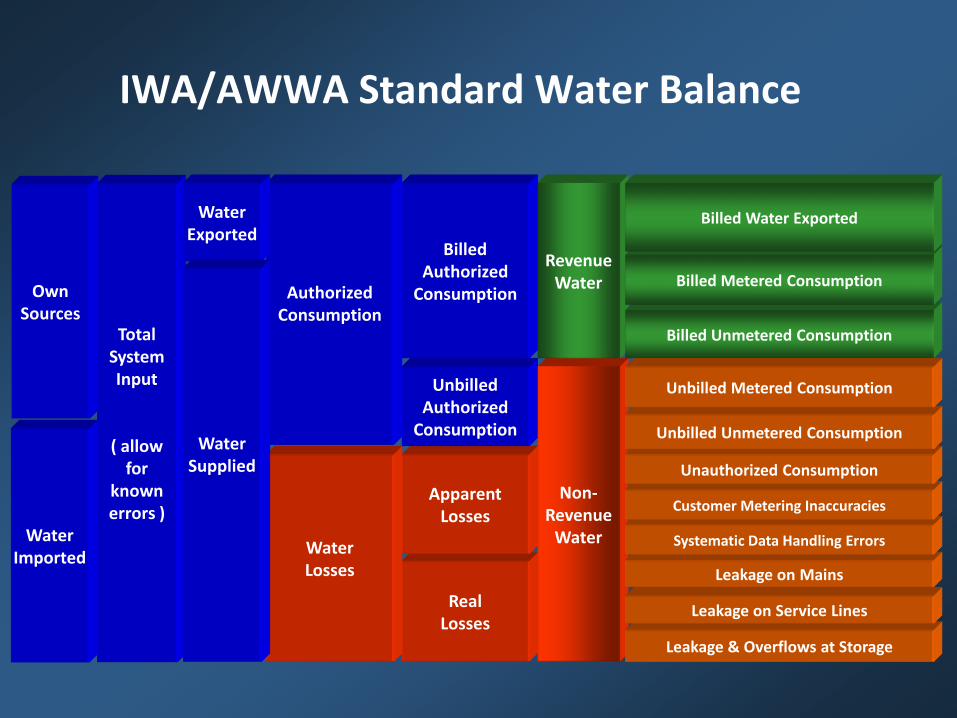
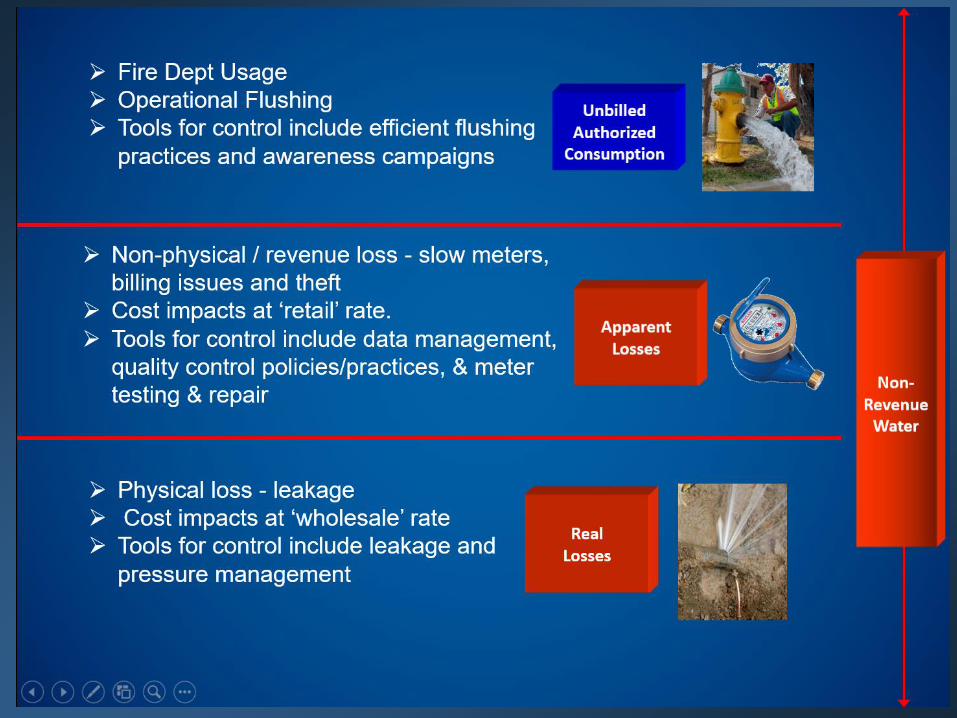
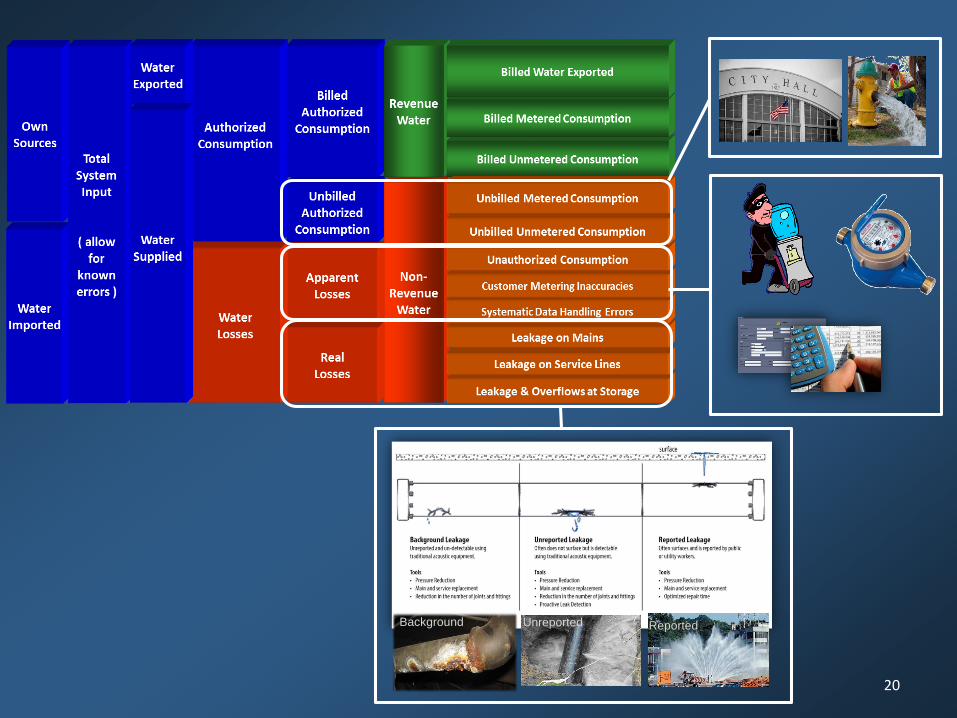
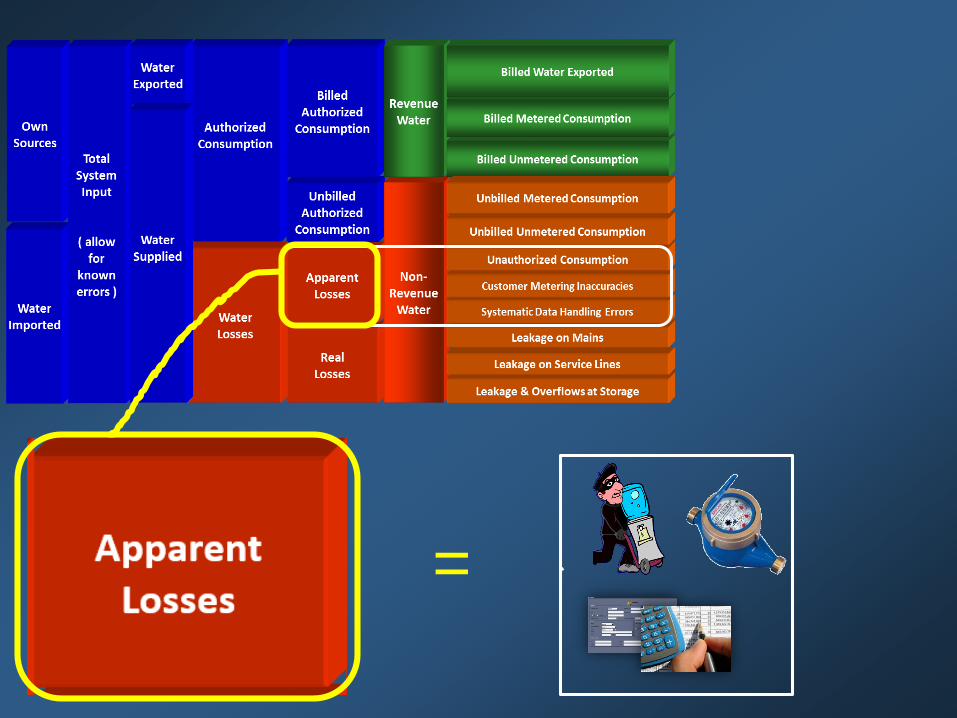
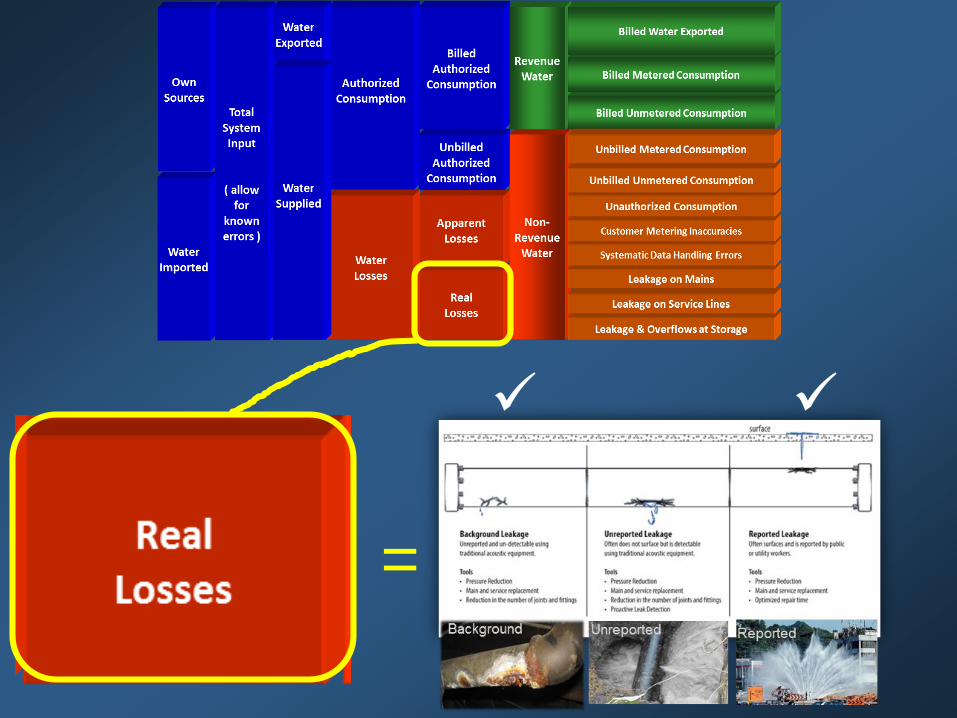
RealLosses
ApparentLosses
UnbilledAuthorized
Consumption
BilledAuthorized
Consumption
Non-Revenue
Water
RevenueWater
Leakage & Overflows at Storage
Billed Unmetered Consumption
Billed Metered Consumption
Billed Water Exported
Leakage on Service Lines
Leakage on Mains
Systematic Data Handling Errors
Customer Metering Inaccuracies
Unauthorized Consumption
Unbilled Unmetered Consumption
Unbilled Metered Consumption
WaterImported
OwnSources
TotalSystemInput
( allowfor
knownerrors )
WaterLosses
AuthorizedConsumption
WaterExported
WaterSupplied
IWA/AWWA Standard Water Balance
9
10
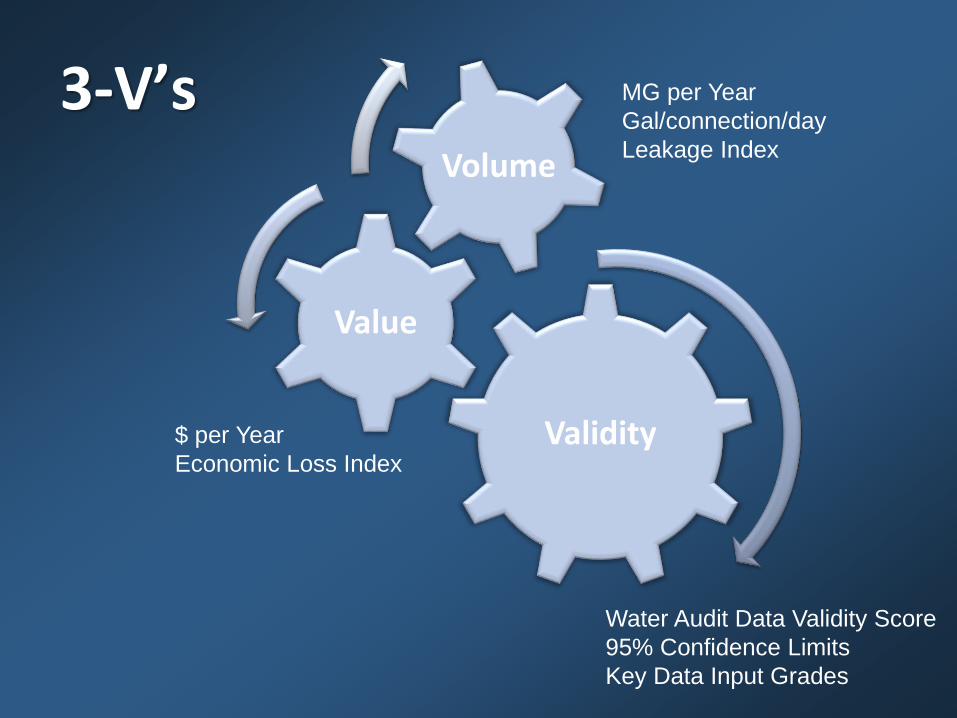
3-V’s
Validity
Value
Volume
MG per Year
Gal/connection/day
Leakage Index
$ per Year
Economic Loss Index
Water Audit Data Validity Score
95% Confidence Limits
Key Data Input Grades
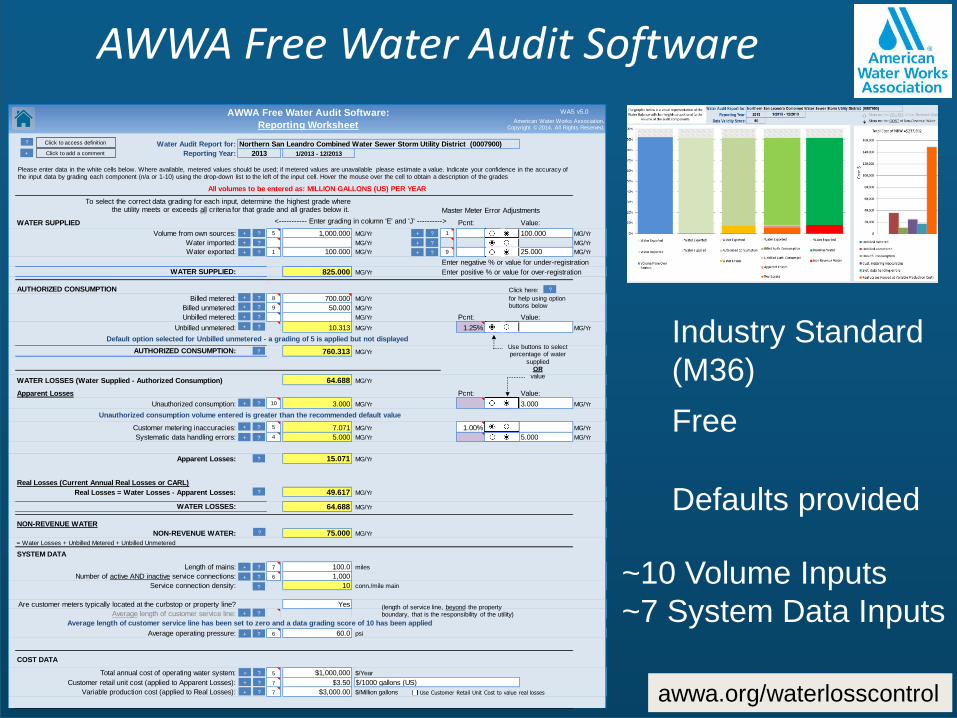
AWWA Free Water Audit Software
Water Audit Report for:
Reporting Year:
All volumes to be entered as: MILLION GALLONS (US) PER YEAR
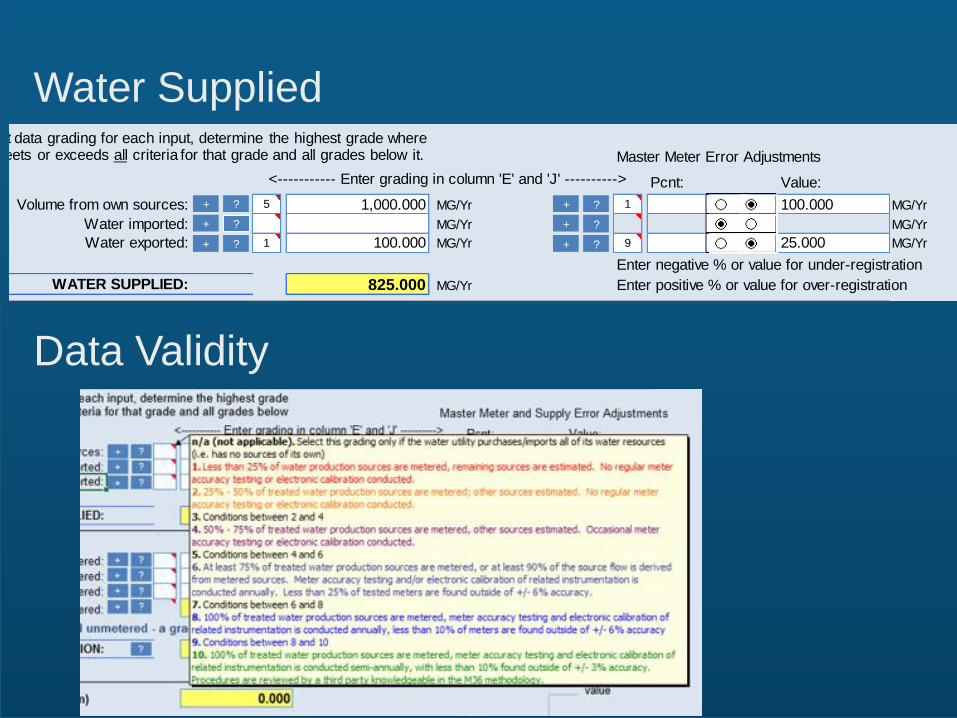
Master Meter Error Adjustments
WATER SUPPLIED Pcnt: Value:
Volume from own sources: 5 1,000.000 MG/Yr 1 MG/Yr
Water imported: MG/Yr MG/Yr
Water exported: 1 100.000 MG/Yr 9 MG/Yr
Enter negative % or value for under-registration
WATER SUPPLIED: 825.000 MG/Yr Enter positive % or value for over-registration.
AUTHORIZED CONSUMPTION
Billed metered: 8 700.000 MG/Yr
Billed unmetered: 9 50.000 MG/Yr
Unbilled metered: MG/Yr Pcnt: Value:
Unbilled unmetered: 9 10.313 MG/Yr 1.25% MG/Yr24061
AUTHORIZED CONSUMPTION: 760.313 MG/Yr
WATER LOSSES (Water Supplied - Authorized Consumption) 64.688 MG/Yr
Apparent Losses Pcnt: Value:
Unauthorized consumption: 10 3.000 MG/Yr 0.25% MG/Yr
Customer metering inaccuracies: 5 7.071 MG/Yr 1.00% MG/Yr
Systematic data handling errors: 4 5.000 MG/Yr 0.25% MG/Yr
Apparent Losses: 15.071 MG/Yr
Real Losses (Current Annual Real Losses or CARL)
Real Losses = Water Losses - Apparent Losses: 49.617 MG/Yr
WATER LOSSES: 64.688 MG/Yr
NON-REVENUE WATER
NON-REVENUE WATER: 75.000 MG/Yr
= Water Losses + Unbilled Metered + Unbilled Unmetered
SYSTEM DATA
Length of mains: 7 100.0 miles
Number of active AND inactive service connections: 6 1,000
Service connection density: 10 conn./mile main
Yes
Average length of customer service line: ft
Average operating pressure: 6 60.0 psi
COST DATA
Total annual cost of operating water system: 5 $1,000,000 $/Year
Customer retail unit cost (applied to Apparent Losses): 7 $3.50
Variable production cost (applied to Real Losses): 7 $3,000.00 $/Million gallons
WATER AUDIT DATA VALIDITY SCORE:
PRIORITY AREAS FOR ATTENTION:
1: Volume from own sources
2: Customer metering inaccuracies
3: Total annual cost of operating water system
Based on the information provided, audit accuracy can be improved by addressing the following components:
$/1000 gallons (US)
100.000
<----------- Enter grading in column 'E' and 'J' ---------->
Unauthorized consumption volume entered is greater than the recommended default value
5.000
*** YOUR SCORE IS: 60 out of 100 ***
A weighted scale for the components of consumption and water loss is included in the calculation of the Water Audit Data Validity Score
100.000
3.000
25.000
Average length of customer service line has been set to zero and a data grading score of 10 has been applied
Are customer meters typically located at the curbstop or property line?
AWWA Free Water Audit Software:
Reporting Worksheet
Default option selected for Unbilled unmetered - a grading of 5 is applied but not displayed
1.000
2013 1/2013 - 12/2013
Northern San Leandro Combined Water Sewer Storm Utility District (0007900)
?
?
?
?
?
? Click to access definition
?
?
?
?
?
?
Please enter data in the white cells below. Where available, metered values should be used; if metered values are unavailable please estimate a value. Indicate your confidence in the accuracy of the input data by grading each component (n/a or 1-10) using the drop-down list to the left of the input cell. Hover the mouse over the cell to obtain a description of the grades
?
?
?
?
?
?
(length of service line, beyond the property boundary, that is the responsibility of the utility)
Use buttons to selectpercentage of water
suppliedOR
value
?Click here:
for help using option buttons below
?
?
?
?
+
+ Click to add a comment
WAS v5.0
+
+
+
+
+
+
American Water Works Association.Copyright © 2014, All Rights Reserved.
?
?
?
+
+
+
+
+
+
+
+
+
+
+
+
+ Use Customer Retail Unit Cost to value real losses
?
To select the correct data grading for each input, determine the highest grade where the utility meets or exceeds all criteria for that grade and all grades below it.
Defaults provided
Free
awwa.org/waterlosscontrol
Industry Standard
(M36)
~10 Volume Inputs
~7 System Data Inputs
Water Audit Report for:
Reporting Year:
All volumes to be entered as: MILLION GALLONS (US) PER YEAR
Master Meter Error Adjustments
WATER SUPPLIED Pcnt: Value:
Volume from own sources: 5 1,000.000 MG/Yr 1 MG/Yr
Water imported: MG/Yr MG/Yr
Water exported: 1 100.000 MG/Yr 9 MG/Yr
Enter negative % or value for under-registration
WATER SUPPLIED: 825.000 MG/Yr Enter positive % or value for over-registration.
AUTHORIZED CONSUMPTION
Billed metered: 8 700.000 MG/Yr
Billed unmetered: 9 50.000 MG/Yr
Unbilled metered: MG/Yr Pcnt: Value:
Unbilled unmetered: 9 10.313 MG/Yr 1.25% MG/Yr24061
AUTHORIZED CONSUMPTION: 760.313 MG/Yr
WATER LOSSES (Water Supplied - Authorized Consumption) 64.688 MG/Yr
Apparent Losses Pcnt: Value:
Unauthorized consumption: 10 3.000 MG/Yr 0.25% MG/Yr
Customer metering inaccuracies: 5 7.071 MG/Yr 1.00% MG/Yr
Systematic data handling errors: 4 5.000 MG/Yr 0.25% MG/Yr
Apparent Losses: 15.071 MG/Yr
Real Losses (Current Annual Real Losses or CARL)
Real Losses = Water Losses - Apparent Losses: 49.617 MG/Yr
WATER LOSSES: 64.688 MG/Yr
NON-REVENUE WATER
NON-REVENUE WATER: 75.000 MG/Yr
= Water Losses + Unbilled Metered + Unbilled Unmetered
SYSTEM DATA
Length of mains: 7 100.0 miles
Number of active AND inactive service connections: 6 1,000
Service connection density: 10 conn./mile main
Yes
Average length of customer service line: ft
Average operating pressure: 6 60.0 psi
COST DATA
Total annual cost of operating water system: 5 $1,000,000 $/Year
Customer retail unit cost (applied to Apparent Losses): 7 $3.50
Variable production cost (applied to Real Losses): 7 $3,000.00 $/Million gallons
WATER AUDIT DATA VALIDITY SCORE:
PRIORITY AREAS FOR ATTENTION:
1: Volume from own sources
2: Customer metering inaccuracies
3: Total annual cost of operating water system
Based on the information provided, audit accuracy can be improved by addressing the following components:
$/1000 gallons (US)
100.000
<----------- Enter grading in column 'E' and 'J' ---------->
Unauthorized consumption volume entered is greater than the recommended default value
5.000
*** YOUR SCORE IS: 60 out of 100 ***
A weighted scale for the components of consumption and water loss is included in the calculation of the Water Audit Data Validity Score
100.000
3.000
25.000
Average length of customer service line has been set to zero and a data grading score of 10 has been applied
Are customer meters typically located at the curbstop or property line?
AWWA Free Water Audit Software:
Reporting Worksheet
Default option selected for Unbilled unmetered - a grading of 5 is applied but not displayed
1.000
2013 1/2013 - 12/2013
Northern San Leandro Combined Water Sewer Storm Utility District (0007900)
?
?
?
?
?
? Click to access definition
?
?
?
?
?
?
Please enter data in the white cells below. Where available, metered values should be used; if metered values are unavailable please estimate a value. Indicate your confidence in the accuracy of the input data by grading each component (n/a or 1-10) using the drop-down list to the left of the input cell. Hover the mouse over the cell to obtain a description of the grades
?
?
?
?
?
?
(length of service line, beyond the property boundary, that is the responsibility of the utility)
Use buttons to selectpercentage of water
suppliedOR
value
?Click here:
for help using option buttons below
?
?
?
?
+
+ Click to add a comment
WAS v5.0
+
+
+
+
+
+
American Water Works Association.Copyright © 2014, All Rights Reserved.
?
?
?
+
+
+
+
+
+
+
+
+
+
+
+
+ Use Customer Retail Unit Cost to value real losses
?
To select the correct data grading for each input, determine the highest grade where the utility meets or exceeds all criteria for that grade and all grades below it.
Water Supplied
Data Validity
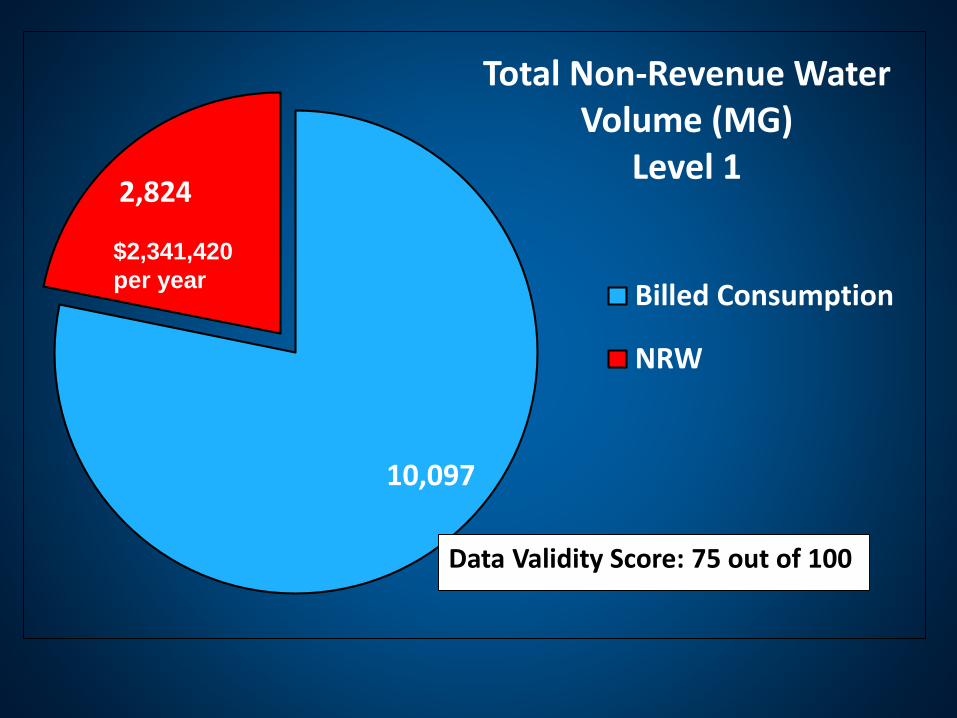
10,097
2,824
Total Non-Revenue WaterVolume (MG)
Level 1
Billed Consumption
NRW
Data Validity Score: 75 out of 100
$2,341,420
per year
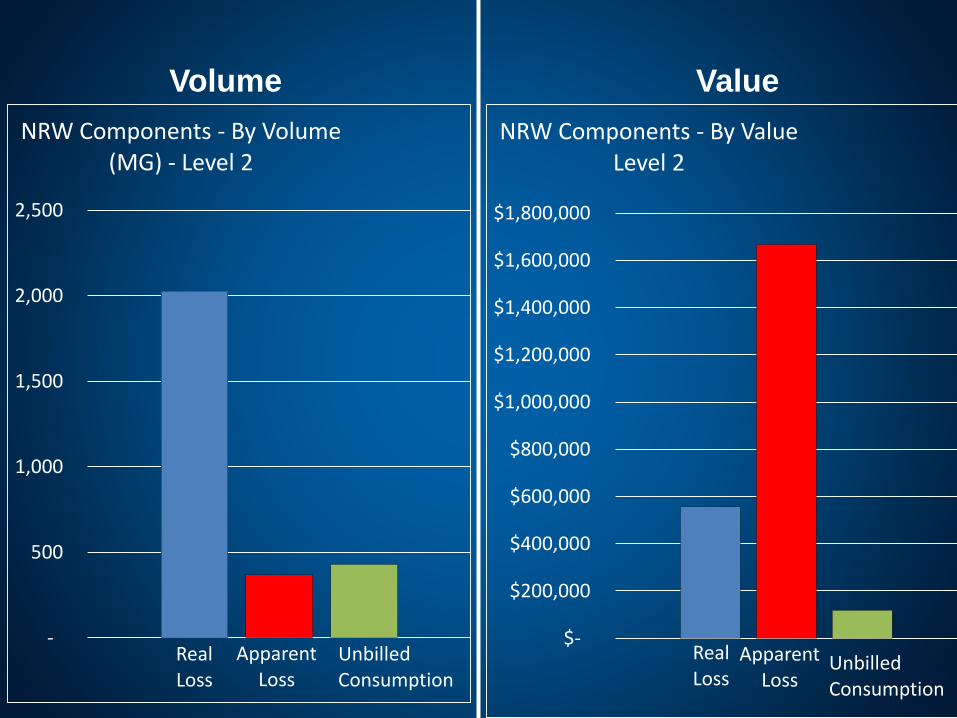
Volume Value
Real Loss
Apparent Loss
Unbilled Consumption
-
500
1,000
1,500
2,000
2,500
NRW Components - By Volume (MG) - Level 2
Real Loss
Apparent Loss
Unbilled Consumption
$-
$200,000
$400,000
$600,000
$800,000
$1,000,000
$1,200,000
$1,400,000
$1,600,000
$1,800,000
NRW Components - By ValueLevel 2
Volume Value
Unbilled Unmetered
Unbilled Metered
Meter Inaccuracy
Theft
Data Handling
Unreported Leakage
Background Leakage
Reported Leakage
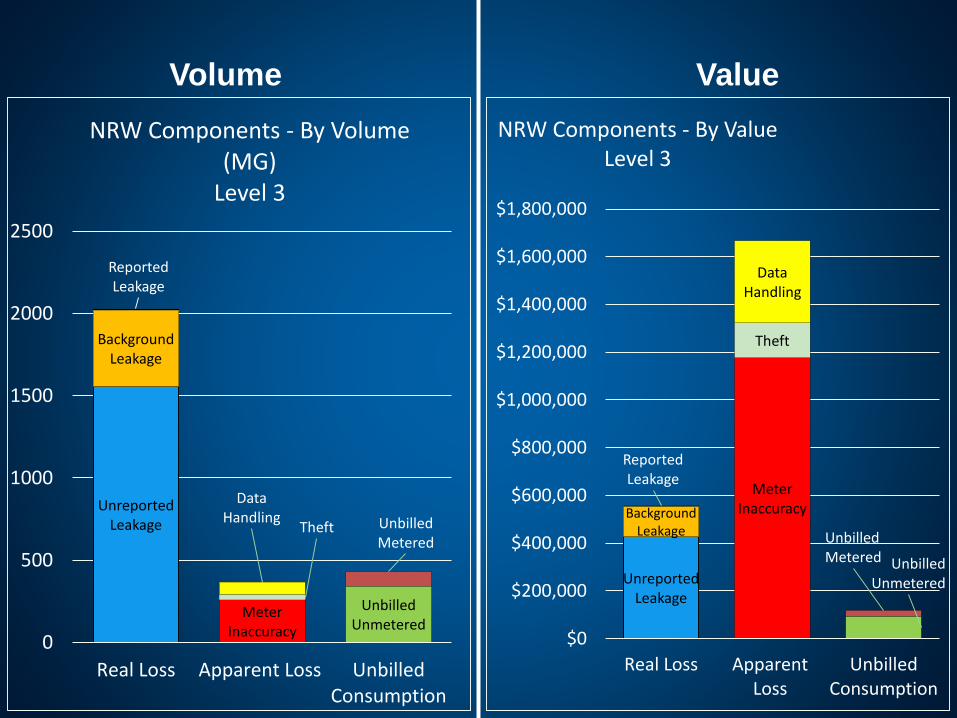
0
500
1000
1500
2000
2500
Real Loss Apparent Loss UnbilledConsumption
NRW Components - By Volume (MG)
Level 3
Unbilled Unmetered
Unbilled Metered
Meter Inaccuracy
Theft
Data Handling
Unreported Leakage
Background Leakage
Reported Leakage
$0
$200,000
$400,000
$600,000
$800,000
$1,000,000
$1,200,000
$1,400,000
$1,600,000
$1,800,000
Real Loss ApparentLoss
UnbilledConsumption
NRW Components - By ValueLevel 3
Volume Value
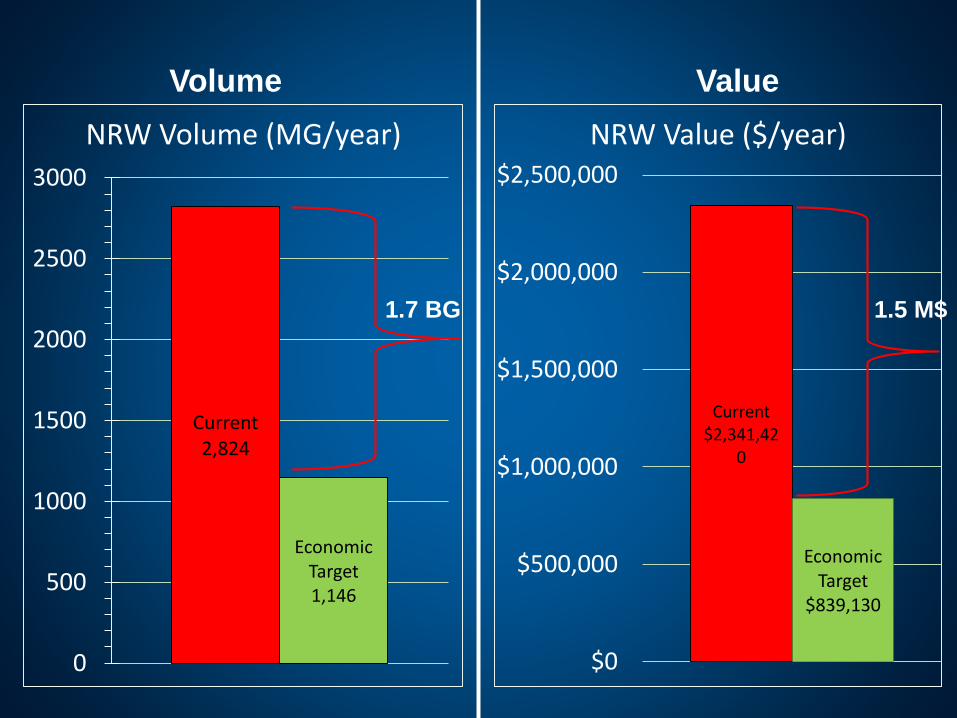
Current2,824
Economic Target1,146
0
500
1000
1500
2000
2500
3000
NRW Volume (MG/year)
Current$2,341,42
0
Economic Target
$839,130
$0
$500,000
$1,000,000
$1,500,000
$2,000,000
$2,500,000
NRW Value ($/year)
1.7 BG 1.5 M$
19
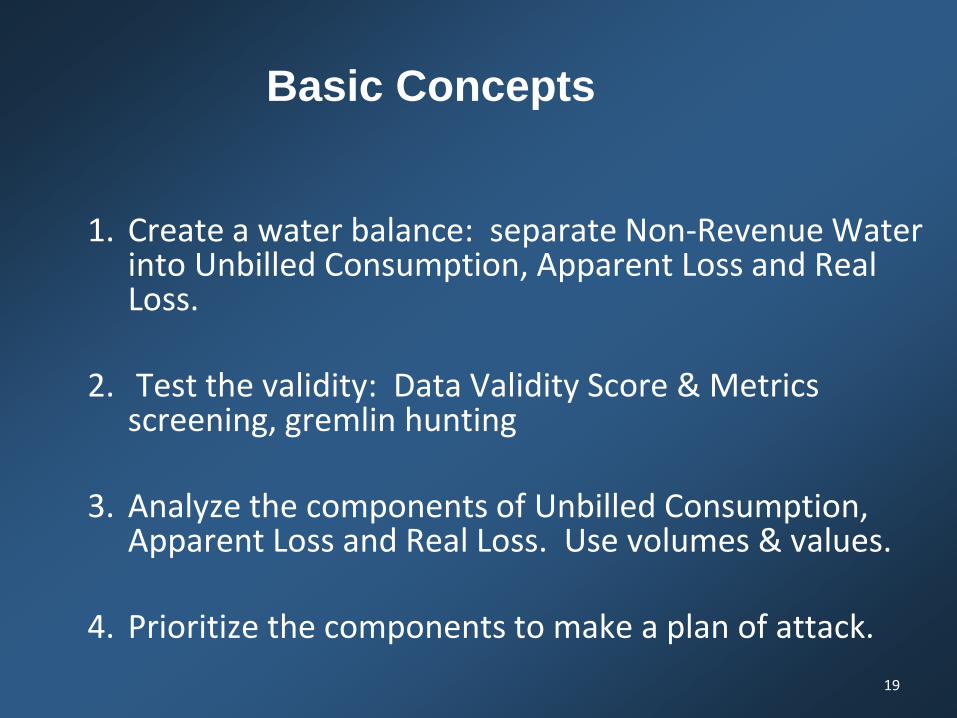
Basic Concepts
1. Create a water balance: separate Non-Revenue Water into Unbilled Consumption, Apparent Loss and Real Loss.
2. Test the validity: Data Validity Score & Metrics screening, gremlin hunting
3. Analyze the components of Unbilled Consumption, Apparent Loss and Real Loss. Use volumes & values.
4. Prioritize the components to make a plan of attack.
20
Unreported ReportedBackground
=
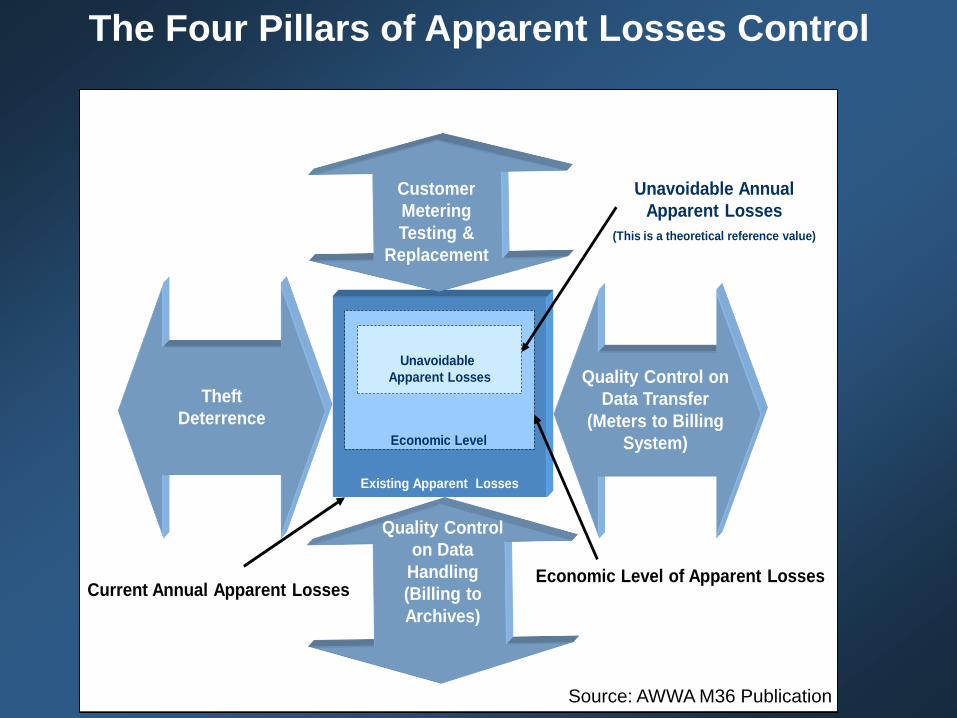
Unavoidable
Apparent Losses
Current Annual Apparent LossesEconomic Level of Apparent Losses
Existing Apparent Losses
Customer
Metering
Testing &
Replacement
Quality Control
on Data
Handling
(Billing to
Archives)
Theft
Deterrence
Quality Control on
Data Transfer
(Meters to Billing
System)Economic Level
Unavoidable Annual
Apparent Losses
(This is a theoretical reference value)
The Four Pillars of Apparent Losses Control
Source: AWWA M36 Publication
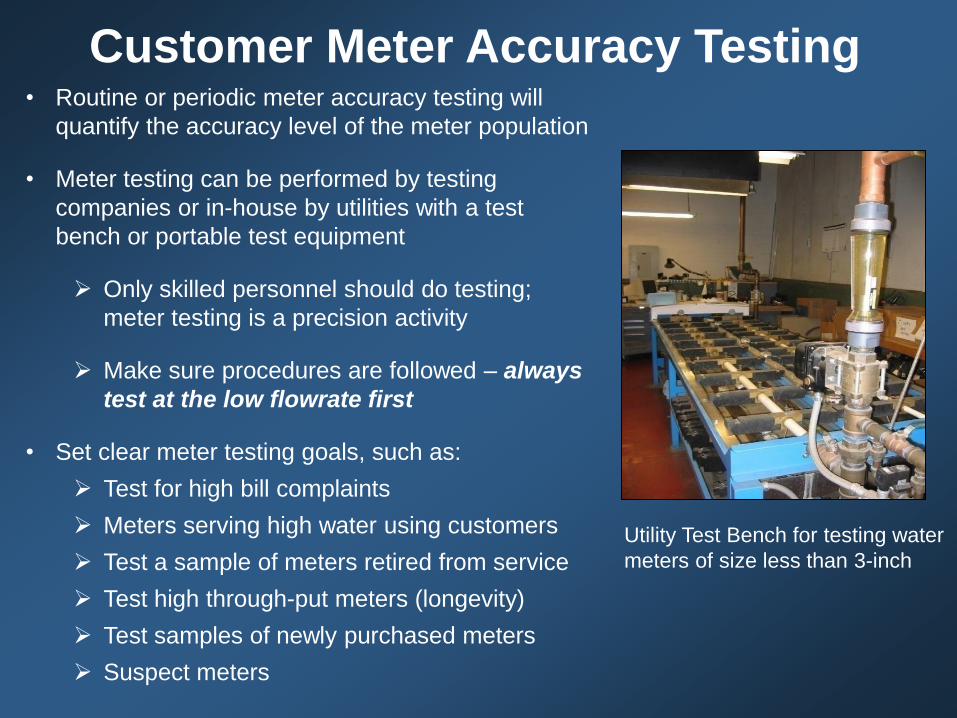
Customer Meter Accuracy Testing• Routine or periodic meter accuracy testing will
quantify the accuracy level of the meter population
• Meter testing can be performed by testing
companies or in-house by utilities with a test
bench or portable test equipment
Only skilled personnel should do testing;
meter testing is a precision activity
Make sure procedures are followed – always
test at the low flowrate first
• Set clear meter testing goals, such as:
Test for high bill complaints
Meters serving high water using customers
Test a sample of meters retired from service
Test high through-put meters (longevity)
Test samples of newly purchased meters
Suspect meters
Utility Test Bench for testing water
meters of size less than 3-inch

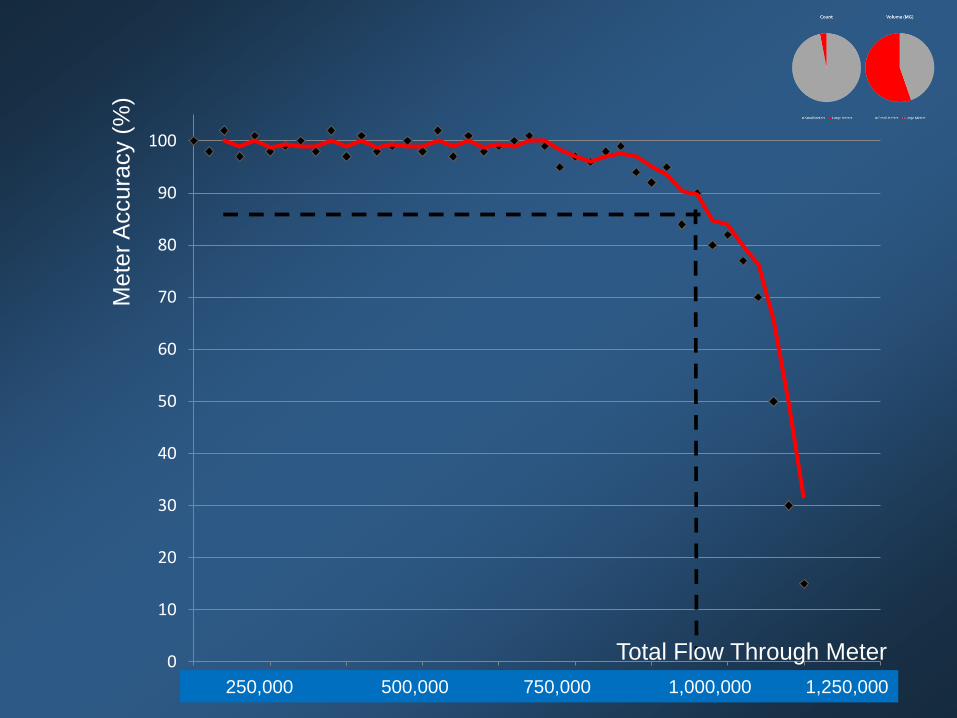
Sample Testing for Small Meters
0
10
20
30
40
50
60
70
80
90
100M
ete
r A
ccura
cy (
%)
250,000 500,000 750,000 1,000,000 1,250,000
Total Flow Through Meter
=
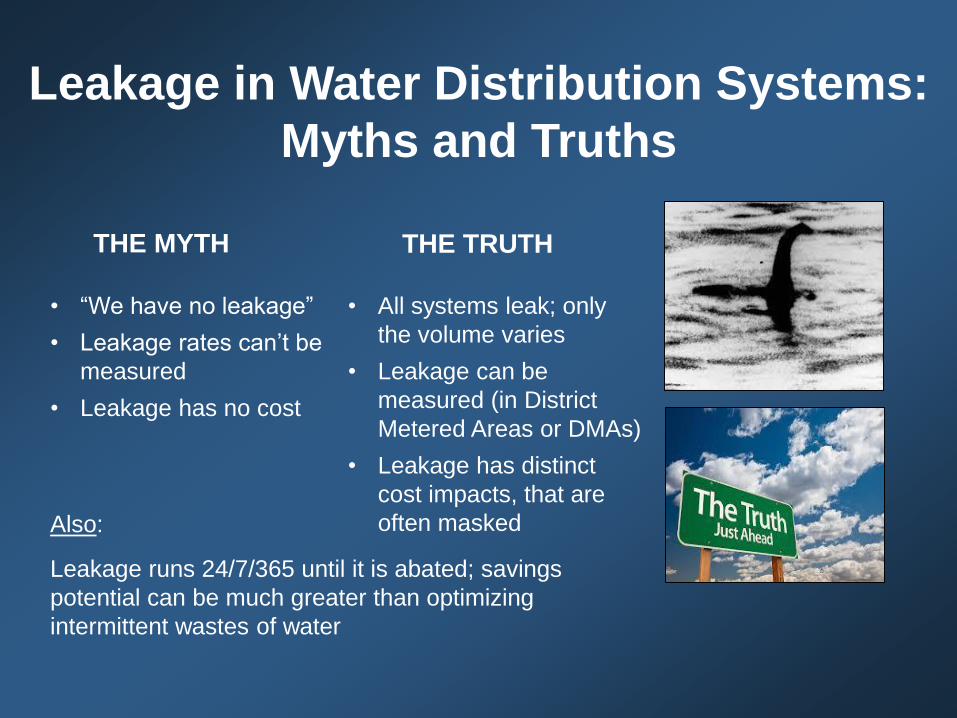
Leakage in Water Distribution Systems:
Myths and Truths
• “We have no leakage”
• Leakage rates can’t be
measured
• Leakage has no cost
• All systems leak; only
the volume varies
• Leakage can be
measured (in District
Metered Areas or DMAs)
• Leakage has distinct
cost impacts, that are
often maskedAlso:
Leakage runs 24/7/365 until it is abated; savings
potential can be much greater than optimizing
intermittent wastes of water
THE MYTH THE TRUTH
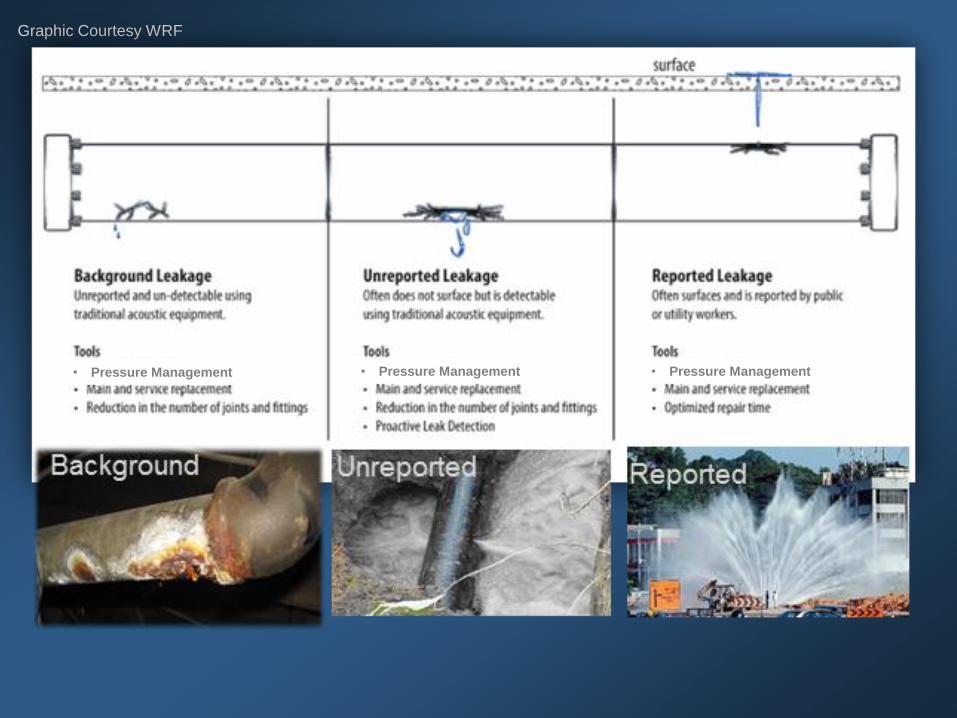
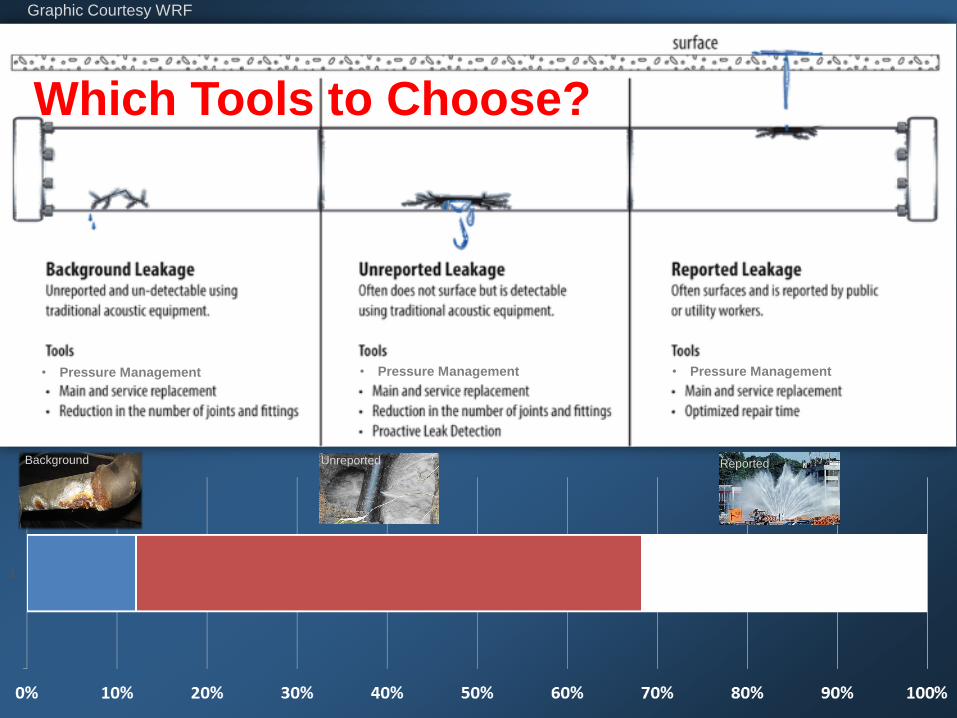
Graphic Courtesy WRF
• Pressure Management • Pressure Management • Pressure Management
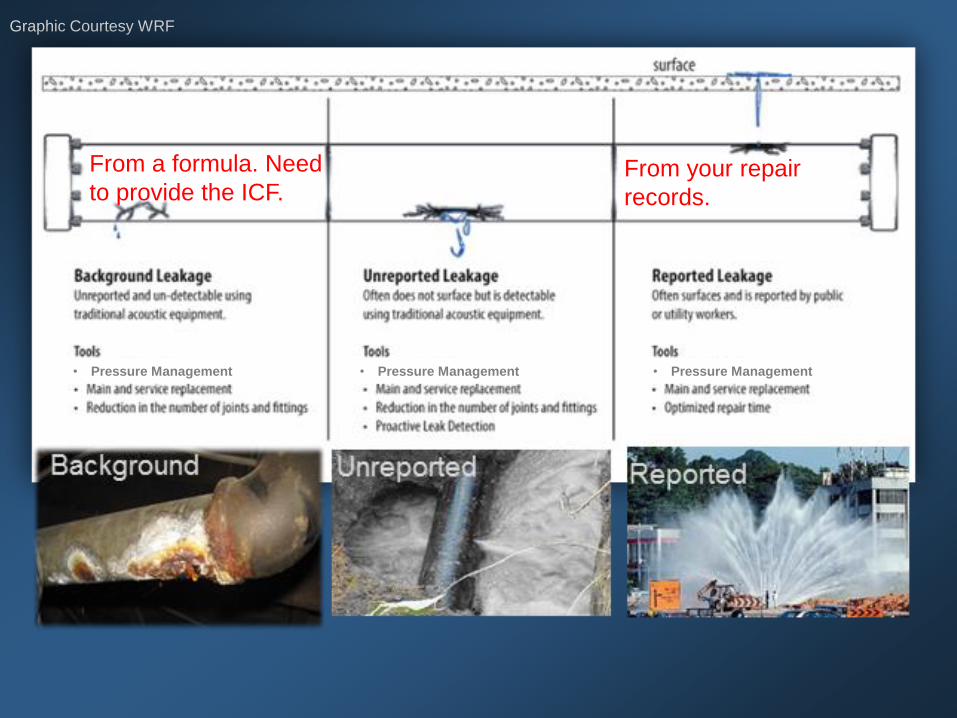
Graphic Courtesy WRF
From a formula. Need
to provide the ICF.From your repair
records.
• Pressure Management • Pressure Management • Pressure Management
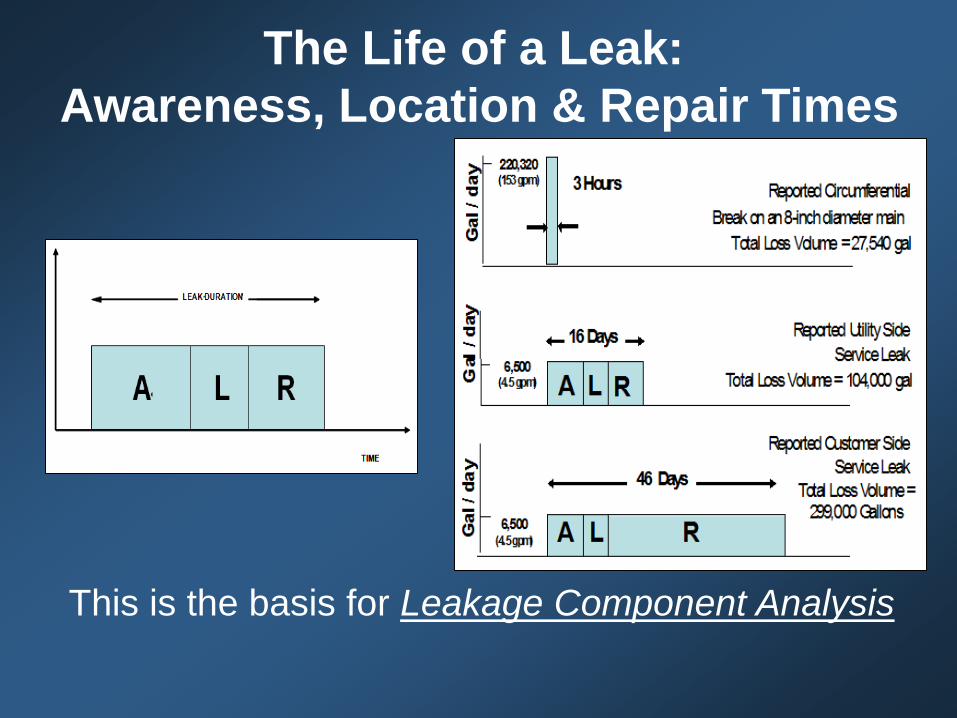
The Life of a Leak:
Awareness, Location & Repair Times
This is the basis for Leakage Component Analysis
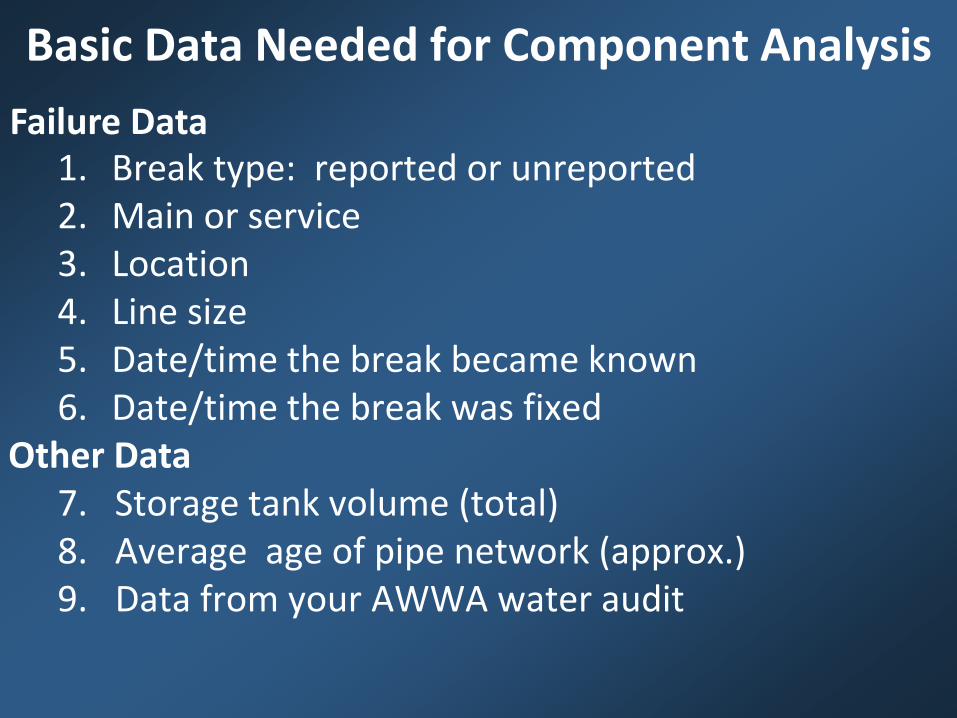
Basic Data Needed for Component Analysis
1. Break type: reported or unreported2. Main or service3. Location4. Line size5. Date/time the break became known6. Date/time the break was fixed
7. Storage tank volume (total)8. Average age of pipe network (approx.)9. Data from your AWWA water audit
Failure Data
Other Data
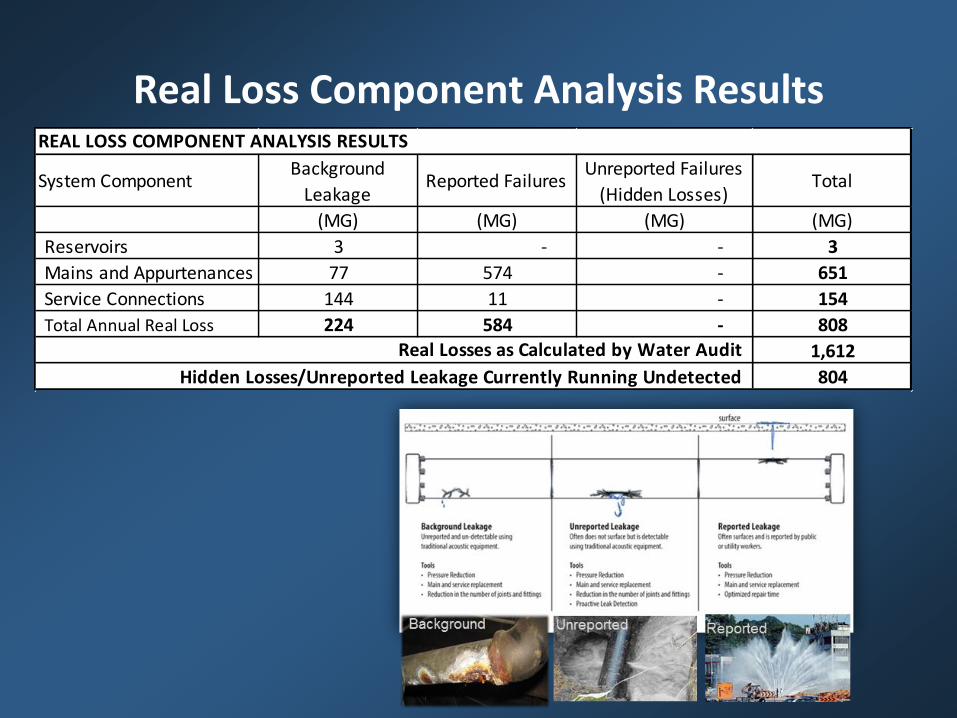
Real Loss Component Analysis Results
System ComponentBackground
LeakageReported Failures
Unreported Failures
(Hidden Losses)Total
(MG) (MG) (MG) (MG)
Reservoirs 3 - - 3
Mains and Appurtenances 77 574 - 651
Service Connections 144 11 - 154
Total Annual Real Loss 224 584 - 808
1,612
804
REAL LOSS COMPONENT ANALYSIS RESULTS
Real Losses as Calculated by Water Audit
Hidden Losses/Unreported Leakage Currently Running Undetected
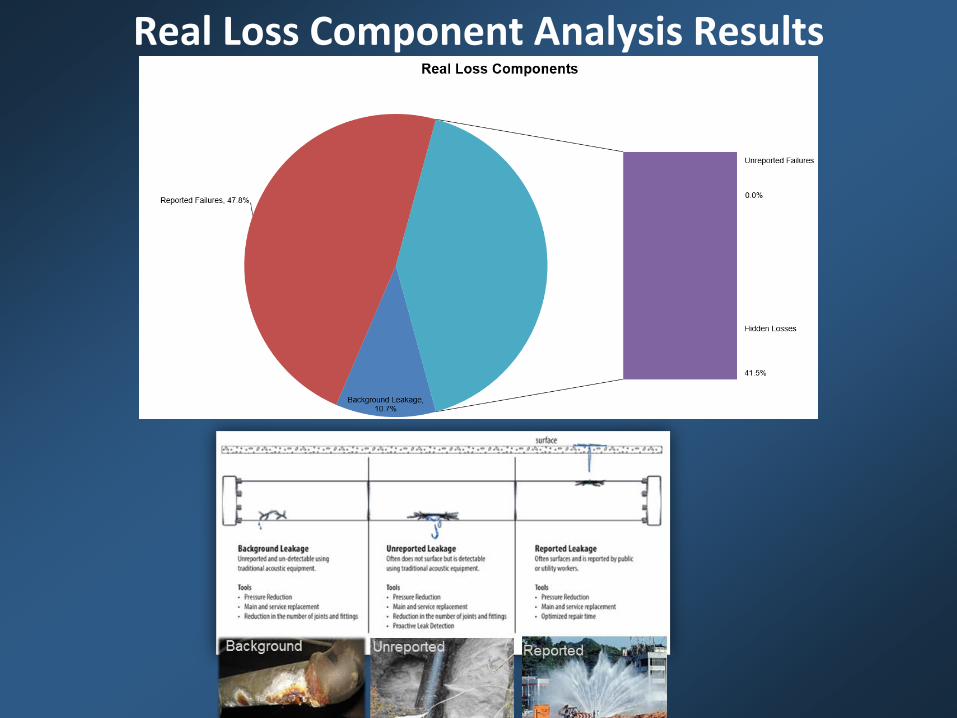
Real Loss Component Analysis Results
Graphic Courtesy WRF
Which Tools to Choose?
Unreported ReportedBackground
• Pressure Management • Pressure Management • Pressure Management
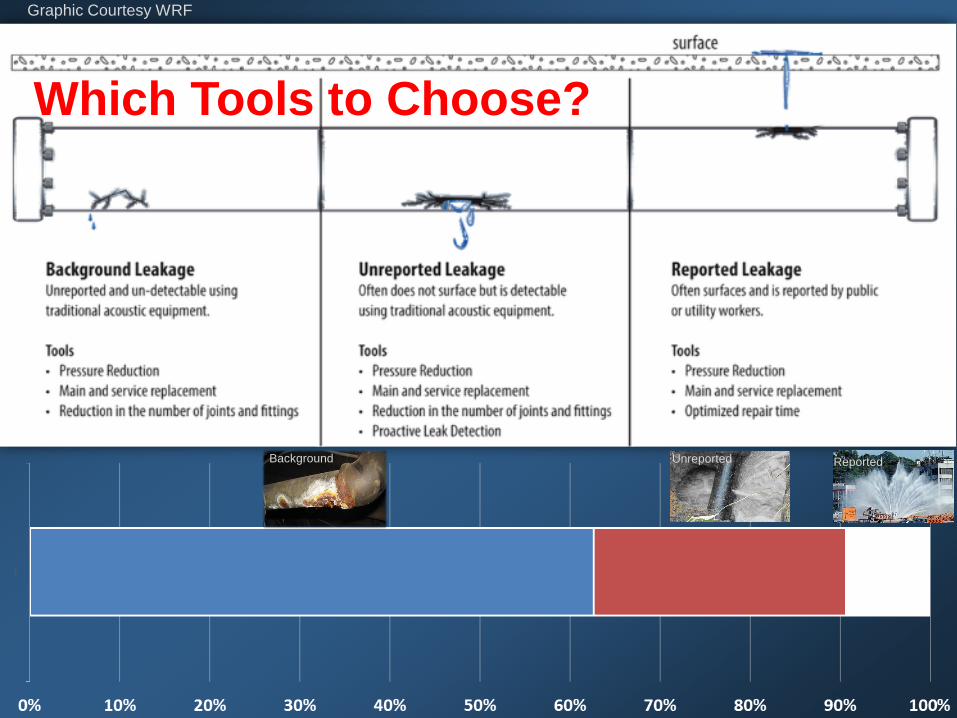
Graphic Courtesy WRF
Which Tools to Choose?
Unreported ReportedBackground
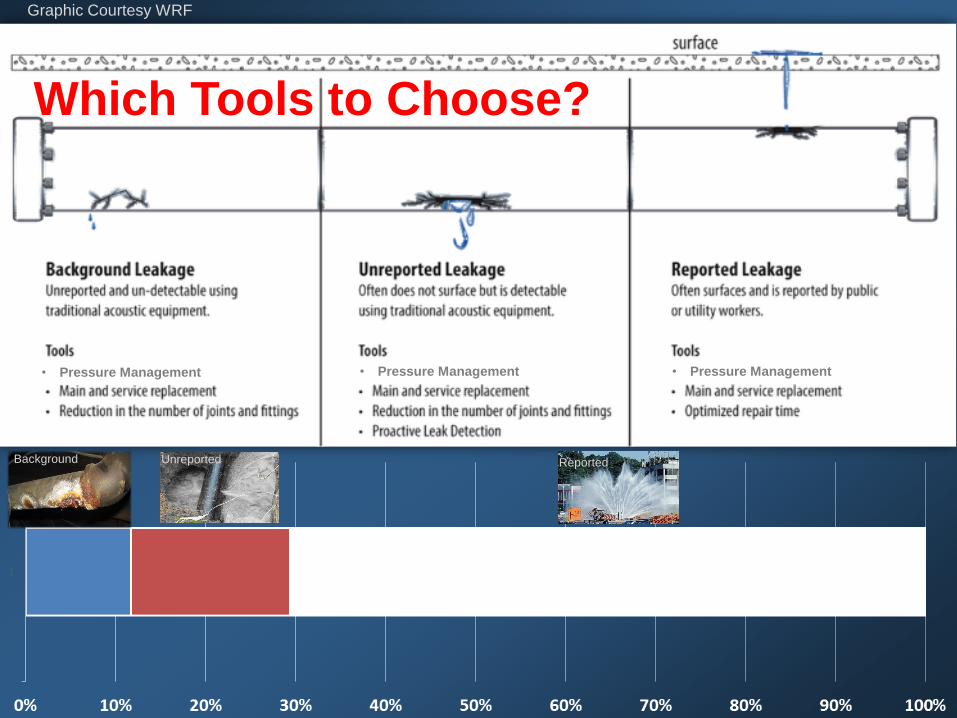
Graphic Courtesy WRF
Which Tools to Choose?
Unreported ReportedBackground
• Pressure Management • Pressure Management • Pressure Management
37
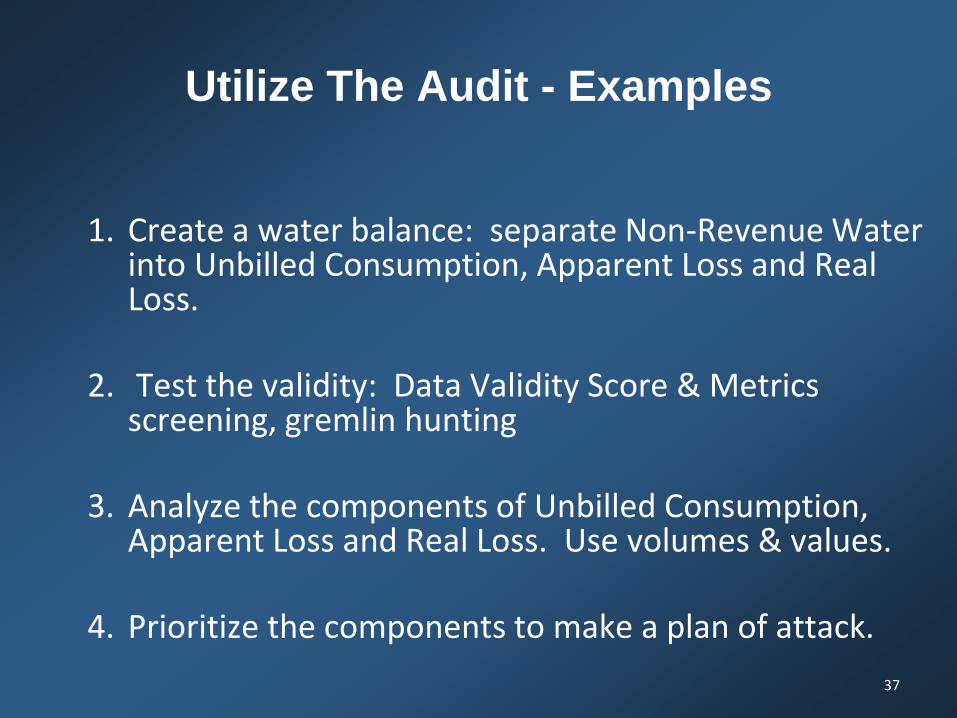
Utilize The Audit - Examples
1. Create a water balance: separate Non-Revenue Water into Unbilled Consumption, Apparent Loss and Real Loss.
2. Test the validity: Data Validity Score & Metrics screening, gremlin hunting
3. Analyze the components of Unbilled Consumption, Apparent Loss and Real Loss. Use volumes & values.
4. Prioritize the components to make a plan of attack.

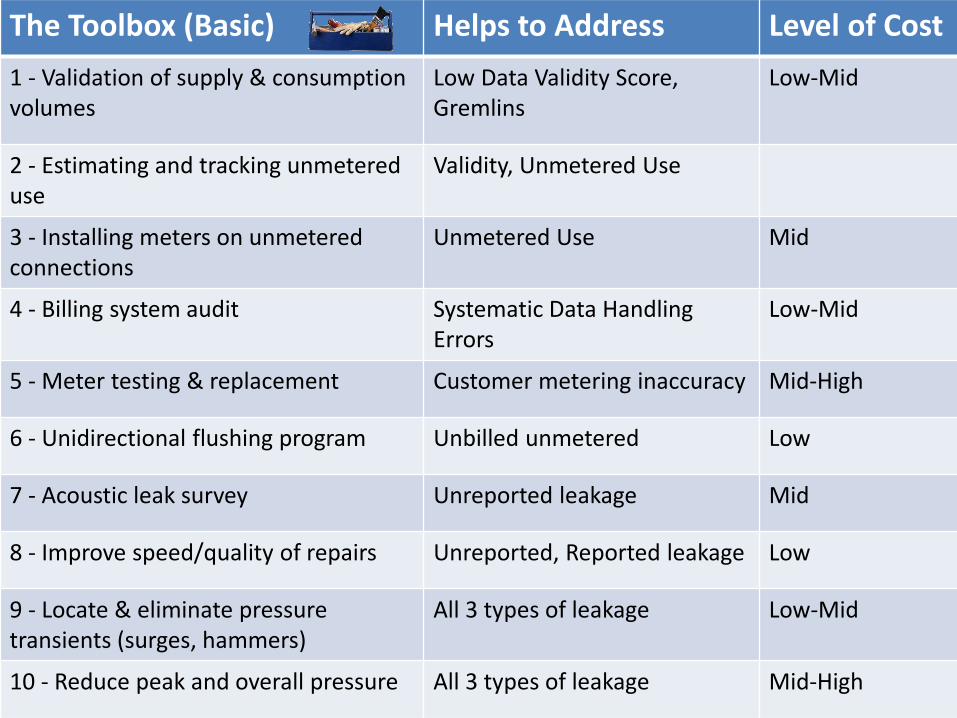
The Toolbox (Basic) Helps to Address Level of Cost
1 - Validation of supply & consumption volumes
Low Data Validity Score, Gremlins
Low-Mid
2 - Estimating and tracking unmetered use
Validity, Unmetered Use None-Low
3 - Installing meters on unmetered connections
Unmetered Use Mid
4 - Billing system audit Systematic Data Handling Errors
Low-Mid
5 - Meter testing & replacement Customer metering inaccuracy Mid-High
6 - Unidirectional flushing program Unbilled unmetered Low
7 - Acoustic leak survey Unreported leakage Mid
8 - Improve speed/quality of repairs Unreported, Reported leakage Low
9 - Locate & eliminate pressure transients (surges, hammers)
All 3 types of leakage Low-Mid
10 - Reduce peak and overall pressure All 3 types of leakage Mid-High
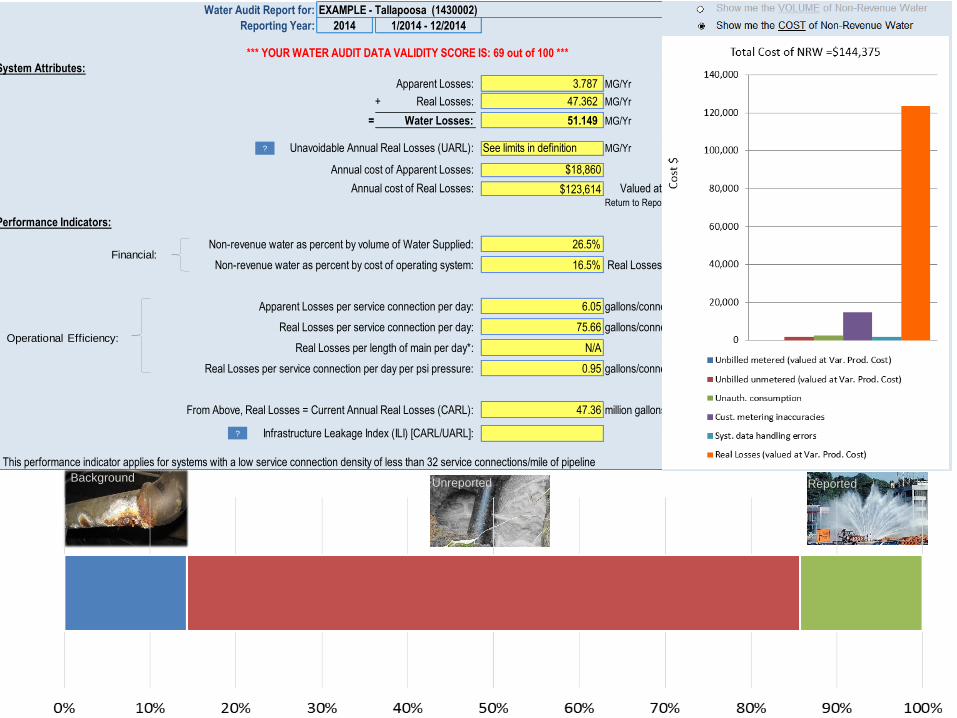
Water Audit Report for: EXAMPLE - Tallapoosa (1430002)
Reporting Year:
System Attributes:
Apparent Losses: 3.787 MG/Yr
+ Real Losses: 47.362 MG/Yr
= Water Losses: 51.149 MG/Yr
Unavoidable Annual Real Losses (UARL): See limits in definition MG/Yr
Annual cost of Apparent Losses: $18,860
Annual cost of Real Losses: $123,614 Valued at Variable Production Cost
Performance Indicators:
Non-revenue water as percent by volume of Water Supplied: 26.5%
Non-revenue water as percent by cost of operating system: 16.5% Real Losses valued at Variable Production Cost
Apparent Losses per service connection per day: 6.05 gallons/connection/day
Real Losses per service connection per day: 75.66 gallons/connection/day
Real Losses per length of main per day*: N/A
Real Losses per service connection per day per psi pressure: 0.95 gallons/connection/day/psi
From Above, Real Losses = Current Annual Real Losses (CARL): 47.36 million gallons/year
* This performance indicator applies for systems with a low service connection density of less than 32 service connections/mile of pipeline
*** YOUR WATER AUDIT DATA VALIDITY SCORE IS: 69 out of 100 ***
Infrastructure Leakage Index (ILI) [CARL/UARL]:
2014 1/2014 - 12/2014
Return to Reporting Worksheet to change this assumption
?
?
Financial:
Operational Efficiency:
Unreported ReportedBackground

The Toolbox (Basic) Helps to Address Level of Cost
1 - Validation of supply & consumption volumes
Low Data Validity Score, Gremlins
Low-Mid
2 - Estimating and tracking unmetered use
Validity, Unmetered Use
3 - Installing meters on unmetered connections
Unmetered Use Mid
4 - Billing system audit Systematic Data Handling Errors
Low-Mid
5 - Meter testing & replacement Customer metering inaccuracy Mid-High
6 - Unidirectional flushing program Unbilled unmetered Low
7 - Acoustic leak survey Unreported leakage Mid
8 - Improve speed/quality of repairs Unreported, Reported leakage Low
9 - Locate & eliminate pressure transients (surges, hammers)
All 3 types of leakage Low-Mid
10 - Reduce peak and overall pressure All 3 types of leakage Mid-High
Unreported ReportedBackground
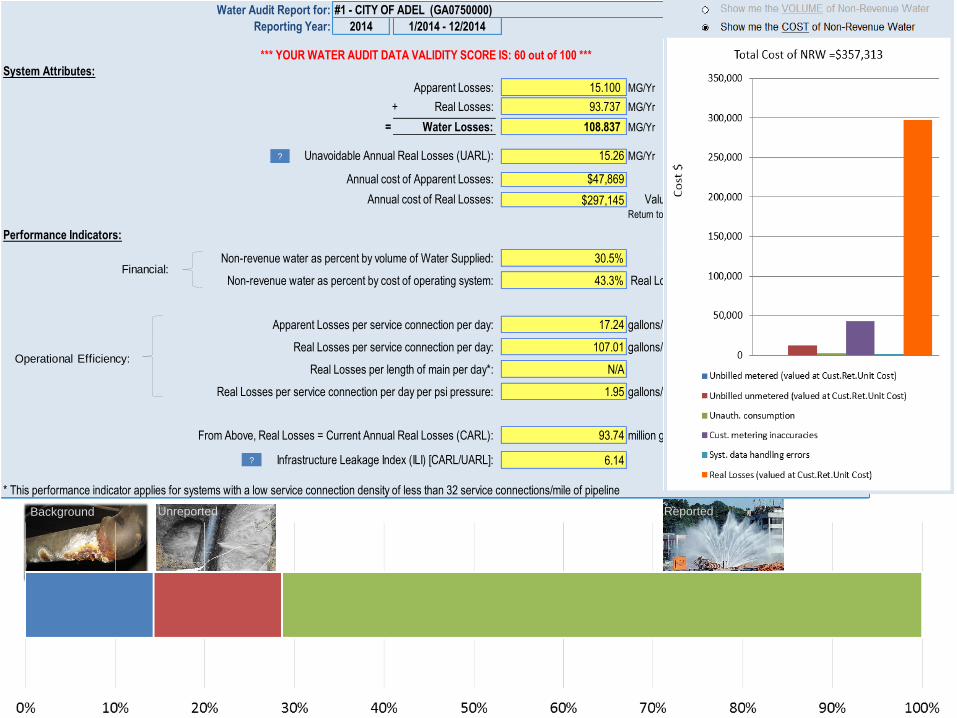
Water Audit Report for: #1 - CITY OF ADEL (GA0750000)
Reporting Year:
System Attributes:
Apparent Losses: 15.100 MG/Yr
+ Real Losses: 93.737 MG/Yr
= Water Losses: 108.837 MG/Yr
Unavoidable Annual Real Losses (UARL): 15.26 MG/Yr
Annual cost of Apparent Losses: $47,869
Annual cost of Real Losses: $297,145 Valued at Customer Retail Unit Cost
Performance Indicators:
Non-revenue water as percent by volume of Water Supplied: 30.5%
Non-revenue water as percent by cost of operating system: 43.3% Real Losses valued at Customer Retail Unit Cost
Apparent Losses per service connection per day: 17.24 gallons/connection/day
Real Losses per service connection per day: 107.01 gallons/connection/day
Real Losses per length of main per day*: N/A
Real Losses per service connection per day per psi pressure: 1.95 gallons/connection/day/psi
From Above, Real Losses = Current Annual Real Losses (CARL): 93.74 million gallons/year
6.14
* This performance indicator applies for systems with a low service connection density of less than 32 service connections/mile of pipeline
Infrastructure Leakage Index (ILI) [CARL/UARL]:
2014 1/2014 - 12/2014
Return to Reporting Worksheet to change this assumpiton
*** YOUR WATER AUDIT DATA VALIDITY SCORE IS: 60 out of 100 ***
?
?
Financial:
Operational Efficiency:
The Toolbox (Basic) Helps to Address Level of Cost
1 - Validation of supply & consumption volumes
Low Data Validity Score, Gremlins
Low-Mid
2 - Estimating and tracking unmetered use
Validity, Unmetered Use
3 - Installing meters on unmetered connections
Unmetered Use Mid
4 - Billing system audit Systematic Data Handling Errors
Low-Mid
5 - Meter testing & replacement Customer metering inaccuracy Mid-High
6 - Unidirectional flushing program Unbilled unmetered Low
7 - Acoustic leak survey Unreported leakage Mid
8 - Improve speed/quality of repairs Unreported, Reported leakage Low
9 - Locate & eliminate pressure transients (surges, hammers)
All 3 types of leakage Low-Mid
10 - Reduce peak and overall pressure All 3 types of leakage Mid-High
Unreported ReportedBackground
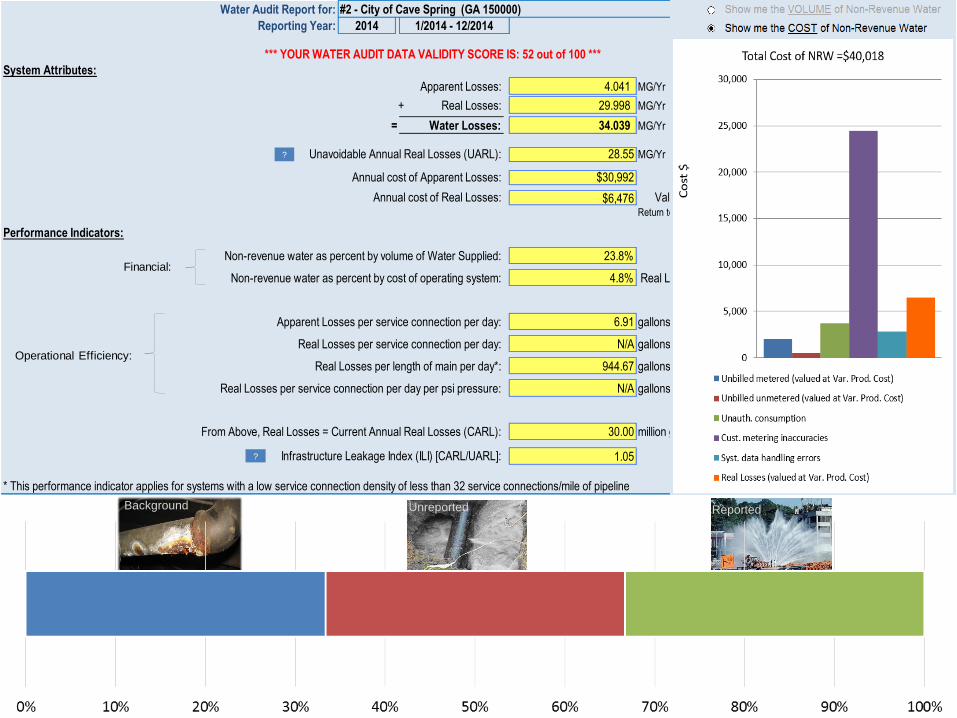
Water Audit Report for: #2 - City of Cave Spring (GA 150000)
Reporting Year:
System Attributes:
Apparent Losses: 4.041 MG/Yr
+ Real Losses: 29.998 MG/Yr
= Water Losses: 34.039 MG/Yr
Unavoidable Annual Real Losses (UARL): 28.55 MG/Yr
Annual cost of Apparent Losses: $30,992
Annual cost of Real Losses: $6,476 Valued at Variable Production Cost
Performance Indicators:
Non-revenue water as percent by volume of Water Supplied: 23.8%
Non-revenue water as percent by cost of operating system: 4.8% Real Losses valued at Variable Production Cost
Apparent Losses per service connection per day: 6.91 gallons/connection/day
Real Losses per service connection per day: N/A gallons/connection/day
Real Losses per length of main per day*: 944.67 gallons/mile/day
Real Losses per service connection per day per psi pressure: N/A gallons/connection/day/psi
From Above, Real Losses = Current Annual Real Losses (CARL): 30.00 million gallons/year
1.05
* This performance indicator applies for systems with a low service connection density of less than 32 service connections/mile of pipeline
Infrastructure Leakage Index (ILI) [CARL/UARL]:
2014 1/2014 - 12/2014
Return to Reporting Worksheet to change this assumption
*** YOUR WATER AUDIT DATA VALIDITY SCORE IS: 52 out of 100 ***
?
?
Financial:
Operational Efficiency: