Embed Size (px)
Citation preview
Wastewater Risk Abatement Plan of
NELSON MANDELA BAY MUNICIPALITY
This document should be read in conjunction with WRC Report TT 489/11 (Wastewater Risk Abatement Plan – A W2RAP guideline to plan and manage towards safe and
complying municipal wastewater collection and treatment in South Africa.
WRC Report No. SP 23/11
June 2011
W2RAP – FISHWATER FLATS WwTW Page 1 of 37
Doc. ref. W2RAP FWF Rev 0.doc Prepared by: Checked: Approved:
Date of issue: 2010-10-15 J G Theron A Mancotywa B Martin
SSI Engineers and Environmental Consultants (Pty) Ltd. © Copyright.
NELSON MANDELA BAY MUNICIPALITY
WASTEWATER RISK ABATEMENT PLAN
FISHWATER FLATS WASTEWATER TREATMENT WORKS
Document status:
Rev 0 - Draft
PREPARED FOR: PREPARED BY: NELSON MANDELA BAY MUNICIPALITY SSI GOVAN MBEKI 30 CAPE ROAD NELSON MANDELA BAY PORT ELIZABETH 6529 6001 TEL: +27 41 506 5435 TEL: +27 41 391 0400 FAX: +27 86 529 9998 FAX: +27 41 391 0406
W2RAP – FISHWATER FLATS WwTW Page 2 of 37
Doc. ref. W2RAP FWF Rev 0.doc Prepared by: Checked: Approved:
Date of issue: 2010-10-15 J G Theron A Mancotywa B Martin
SSI Engineers and Environmental Consultants (Pty) Ltd. © Copyright.
INDEX PAGE
EXECUTIVE SUMMARY 3
1. INTRODUCTION 4 2. W2RAP: IMPLEMENTATION TEAM & PROCESS 4
3. WASTEWATER SYSTEM DESCRIPTION 6
3.1 Catchment area 3.2 Collection & reticulation 3.3 Treatment facility 3.4 Receiving environment & end users
4. WASTEWATER SYSTEM ASSESSMENT 14
4.1 Catchment area 4.2 Influent quantity and quality 4.3 Collection & reticulation 4.4 Treatment facility
5. HAZARD IDENTIFICATION & RISK ASSESSMENT 30
6. CRITICAL CONTROL POINTS 32
7. WASTEWATER QUALITY CONTROL 32
7.1 Wastewater quality limits 7.2 Operational monitoring 7.3 Control measures
8. VERIFICATION 34 9. USING THE W2RAP 35
9.1 Communication & management procedures 9.2 Documentation & record keeping 9.3 Implementation program
10. ANNEXURE 37
(A) Maps & layouts (B) Hazard-Risk-Prevent-Control (C) Wastewater Incident Management Protocol (D) Reference documents
W2RAP – FISHWATER FLATS WwTW Page 3 of 37
Doc. ref. W2RAP FWF Rev 0.doc Prepared by: Checked: Approved:
Date of issue: 2010-10-15 J G Theron A Mancotywa B Martin
SSI Engineers and Environmental Consultants (Pty) Ltd. © Copyright.
EXECUTIVE SUMMARY
The Nelson Mandela Bay Municipality (NMBM) wastewater risk abatement plans provide a practical
approach to manage the entire wastewater system from catchment through treatment to the receiving
environment and end users in order to provide an effective means of consistently, responsibly and
sustainably ensuring the safety of wastewater treatment and its by-products. The wastewater risk
abatement plans are implemented through practical risk management based on scientific best
practices and supported by appropriate monitoring, management and good communication. This
involves and encourages everyone in the wastewater cycle to take responsibility for safe wastewater
and public- and environmental health.
WASTEWATER QUALITY POLICY STATEMENT
Nelson Mandela Bay Municipality will at all times, when reasonably possible, treat wastewater and its
by-products to a safe and acceptable standard. Wastewater final effluent should not contain chemical,
microbial or any other substantial amounts of substances that is deleterious to health or the
environment. The aim is that wastewater produced will comply for at least 99% of the time with the
wastewater quality standards as specified by the Department of Water Affairs for the specific
wastewater treatment facility.
W2RAP – FISHWATER FLATS WwTW Page 4 of 37
Doc. ref. W2RAP FWF Rev 0.doc Prepared by: Checked: Approved:
Date of issue: 2010-10-15 J G Theron A Mancotywa B Martin
SSI Engineers and Environmental Consultants (Pty) Ltd. © Copyright.
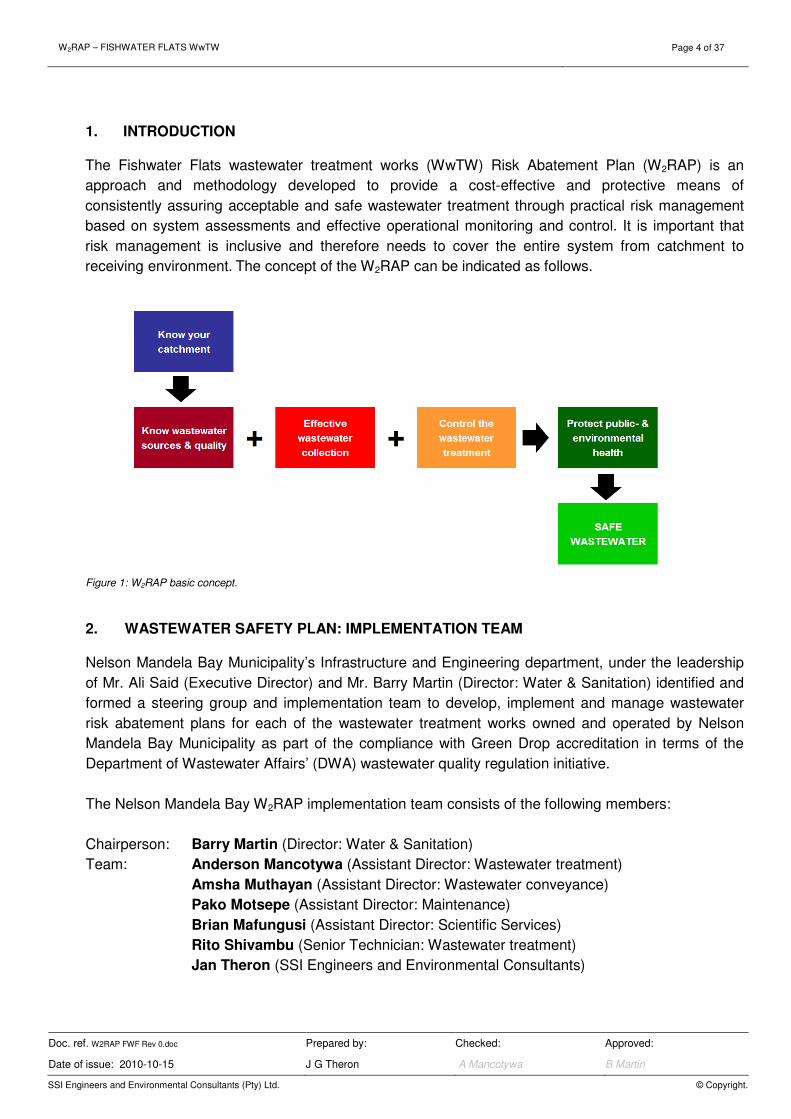
1. INTRODUCTION The Fishwater Flats wastewater treatment works (WwTW) Risk Abatement Plan (W2RAP) is an
approach and methodology developed to provide a cost-effective and protective means of
consistently assuring acceptable and safe wastewater treatment through practical risk management
based on system assessments and effective operational monitoring and control. It is important that
risk management is inclusive and therefore needs to cover the entire system from catchment to
receiving environment. The concept of the W2RAP can be indicated as follows.
Figure 1: W2RAP basic concept.
2. WASTEWATER SAFETY PLAN: IMPLEMENTATION TEAM Nelson Mandela Bay Municipality’s Infrastructure and Engineering department, under the leadership
of Mr. Ali Said (Executive Director) and Mr. Barry Martin (Director: Water & Sanitation) identified and
formed a steering group and implementation team to develop, implement and manage wastewater
risk abatement plans for each of the wastewater treatment works owned and operated by Nelson
Mandela Bay Municipality as part of the compliance with Green Drop accreditation in terms of the
Department of Wastewater Affairs’ (DWA) wastewater quality regulation initiative.
The Nelson Mandela Bay W2RAP implementation team consists of the following members:
Chairperson: Barry Martin (Director: Water & Sanitation)
Team: Anderson Mancotywa (Assistant Director: Wastewater treatment)
Amsha Muthayan (Assistant Director: Wastewater conveyance)
Pako Motsepe (Assistant Director: Maintenance)
Brian Mafungusi (Assistant Director: Scientific Services)
Rito Shivambu (Senior Technician: Wastewater treatment)
Jan Theron (SSI Engineers and Environmental Consultants)
W2RAP – FISHWATER FLATS WwTW Page 5 of 37
Doc. ref. W2RAP FWF Rev 0.doc Prepared by: Checked: Approved:
Date of issue: 2010-10-15 J G Theron A Mancotywa B Martin
SSI Engineers and Environmental Consultants (Pty) Ltd. © Copyright.
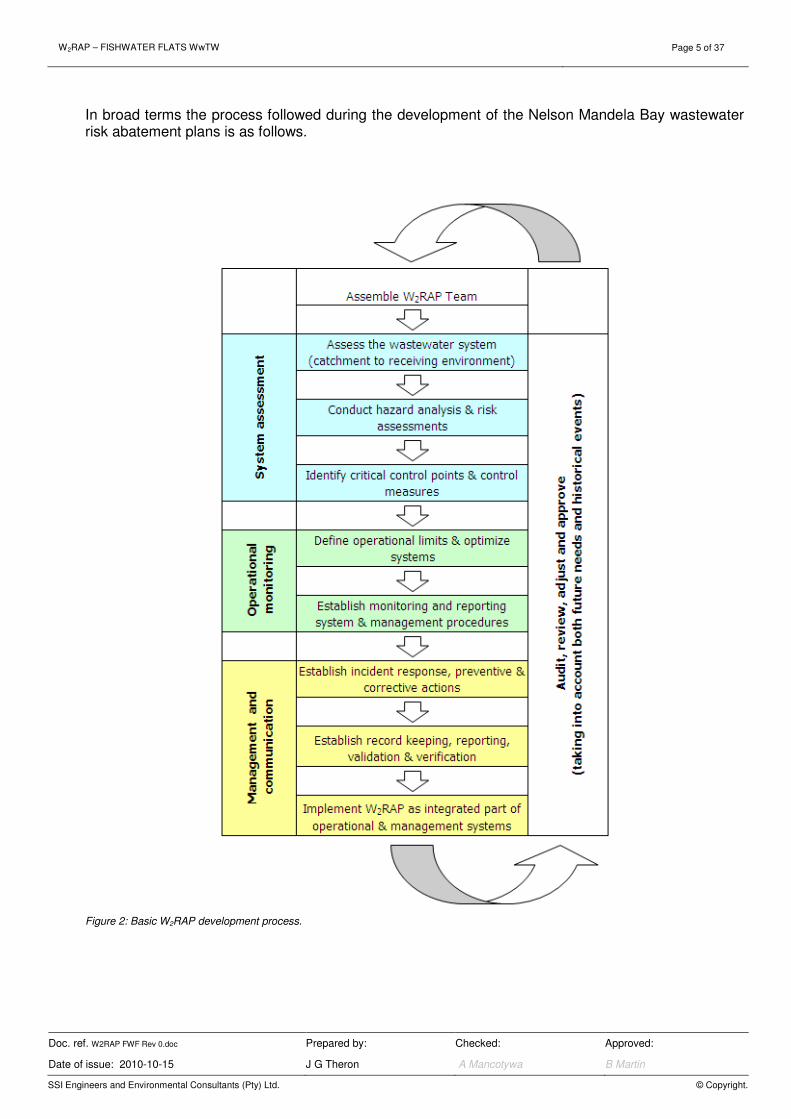
In broad terms the process followed during the development of the Nelson Mandela Bay wastewater risk abatement plans is as follows.
Figure 2: Basic W2RAP development process.
W2RAP – FISHWATER FLATS WwTW Page 6 of 37
Doc. ref. W2RAP FWF Rev 0.doc Prepared by: Checked: Approved:
Date of issue: 2010-10-15 J G Theron A Mancotywa B Martin
SSI Engineers and Environmental Consultants (Pty) Ltd. © Copyright.
3. WASTEWATER SYSTEM DESCRIPTION
3.1 Catchment Area
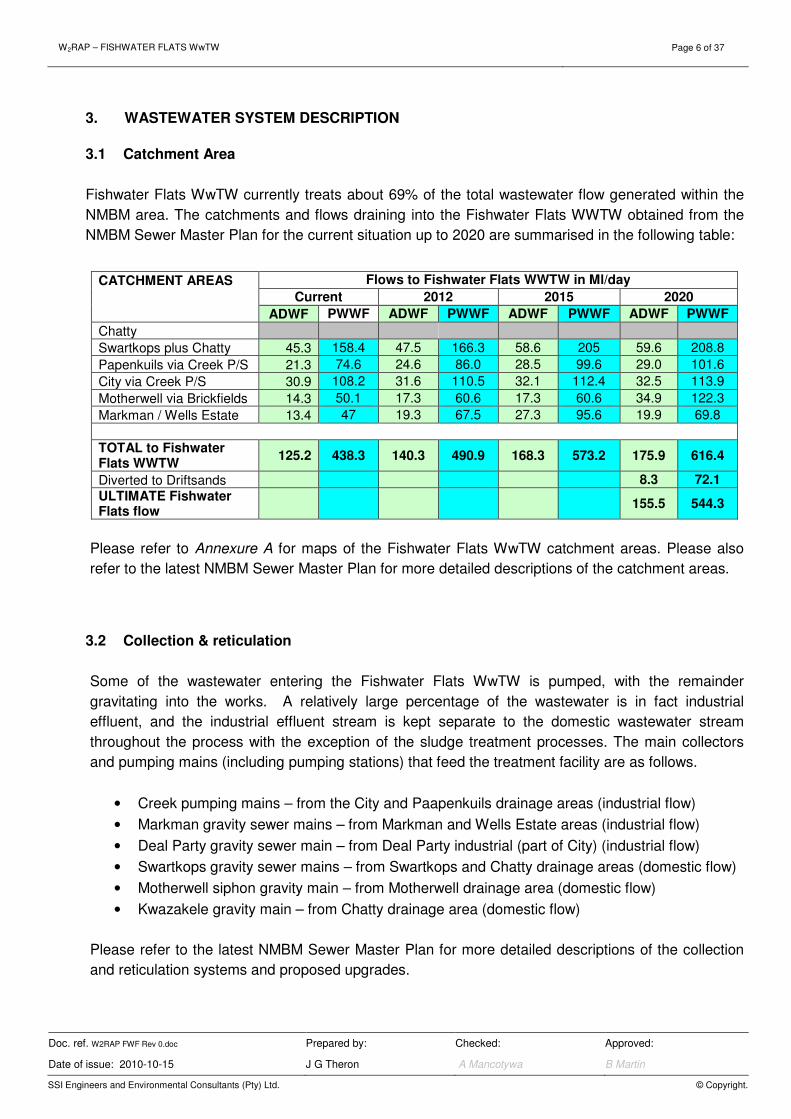
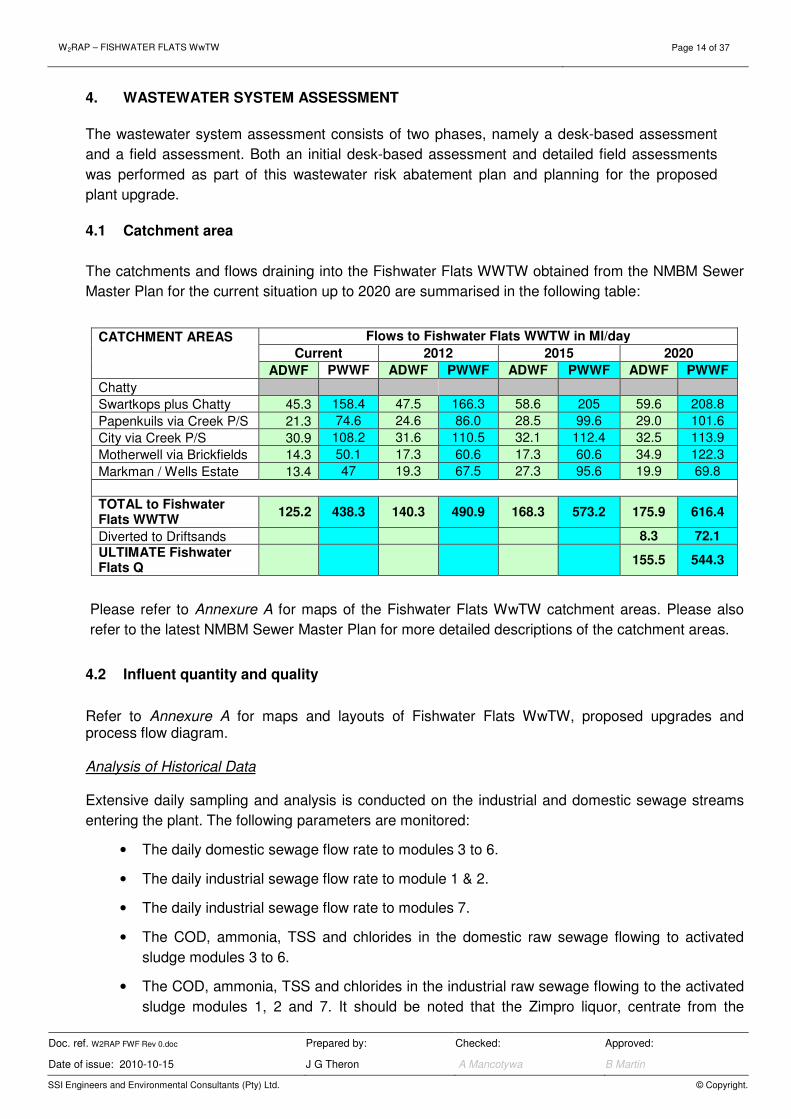
Fishwater Flats WwTW currently treats about 69% of the total wastewater flow generated within the
NMBM area. The catchments and flows draining into the Fishwater Flats WWTW obtained from the
NMBM Sewer Master Plan for the current situation up to 2020 are summarised in the following table:
CATCHMENT AREAS Flows to Fishwater Flats WWTW in Ml/day
Current 2012 2015 2020
ADWF PWWF ADWF PWWF ADWF PWWF ADWF PWWF
Chatty
Swartkops plus Chatty 45.3 158.4 47.5 166.3 58.6 205 59.6 208.8
Papenkuils via Creek P/S 21.3 74.6 24.6 86.0 28.5 99.6 29.0 101.6
City via Creek P/S 30.9 108.2 31.6 110.5 32.1 112.4 32.5 113.9
Motherwell via Brickfields 14.3 50.1 17.3 60.6 17.3 60.6 34.9 122.3
Markman / Wells Estate 13.4 47 19.3 67.5 27.3 95.6 19.9 69.8
TOTAL to Fishwater Flats WWTW
125.2 438.3 140.3 490.9 168.3 573.2 175.9 616.4
Diverted to Driftsands 8.3 72.1
ULTIMATE Fishwater Flats flow
155.5 544.3
Please refer to Annexure A for maps of the Fishwater Flats WwTW catchment areas. Please also
refer to the latest NMBM Sewer Master Plan for more detailed descriptions of the catchment areas.
3.2 Collection & reticulation
Some of the wastewater entering the Fishwater Flats WwTW is pumped, with the remainder
gravitating into the works. A relatively large percentage of the wastewater is in fact industrial
effluent, and the industrial effluent stream is kept separate to the domestic wastewater stream
throughout the process with the exception of the sludge treatment processes. The main collectors
and pumping mains (including pumping stations) that feed the treatment facility are as follows.
• Creek pumping mains – from the City and Paapenkuils drainage areas (industrial flow)
• Markman gravity sewer mains – from Markman and Wells Estate areas (industrial flow)
• Deal Party gravity sewer main – from Deal Party industrial (part of City) (industrial flow)
• Swartkops gravity sewer mains – from Swartkops and Chatty drainage areas (domestic flow)
• Motherwell siphon gravity main – from Motherwell drainage area (domestic flow)
• Kwazakele gravity main – from Chatty drainage area (domestic flow)
Please refer to the latest NMBM Sewer Master Plan for more detailed descriptions of the collection
and reticulation systems and proposed upgrades.
W2RAP – FISHWATER FLATS WwTW Page 7 of 37
Doc. ref. W2RAP FWF Rev 0.doc Prepared by: Checked: Approved:
Date of issue: 2010-10-15 J G Theron A Mancotywa B Martin
SSI Engineers and Environmental Consultants (Pty) Ltd. © Copyright.
3.3 Treatment facility: Fishwater Flats WwTW
The Fishwater Flats Wastewater Treatment Works is a conventional activated sludge treatment works
originally commissioned in 1976 to treat 80 Ml/day of domestic sewage and 32 Ml/day of industrial
wastewater. In 1992 SSI was appointed to undertake a feasibility study and preliminary design of a
120Ml/day extension to the works. The extension was planned in 20 Ml/day modules and the design
and construction of the first module was completed in 1997 to increase the capacity of the industrial
stream to 52 Ml/day. The original activated sludge reactors were upgraded to include biological
nitrate removal in 2001. The original plan to extend the works by 120 Ml/day to an ultimate capacity of
232 Ml/day has now changed due the proposed extension of the Driftsands WWTW and the proposed
construction of the new Coega WWTW and the ultimate capacity of Fishwater Flats WWTW have
now been reduced to 170 Ml/day.
The principal process units currently provided at the works include the following:
• screw pumps to elevate the sewage to a level to provide the hydraulic gradient required to
operate the works and sea outfall by gravity
• mechanical screening
• storm pumps with manual coarse screen
• grit removal facilities
• an equalization balancing/storm tank
• primary settling tanks (PST’s)
• activated sludge modules which include biological nitrate removal, each being served by a
final clarifier (FC)
• sea outfall discharge
• gravity thickeners
• Dissolved Air Floatation thickeners
• Zimpro wet oxidation sludge stabilization technology
• centrifuge sludge dewatering
• Upflow Anaerobic Sludge Blanket (UASB) system for treatment of the Zimpro waste liquor
• chlorination
• sand filtration for portion of the domestic effluent which is sold to industry
Some of the wastewater entering the works is pumped, with the remainder gravitating into the works.
A relatively large percentage of the wastewater is in fact industrial effluent, and the industrial effluent
stream is kept separate to the domestic waste water stream throughout the process with the
exception of the sludge treatment processes.
Upon entering the works the wastewater is lifted by means of Archimedean screw pumps to an
elevated mechanical screen plant from whence the wastewater gravitates to degritters, and then to
primary settling tanks. The settled sewage then gravitates into a number of activated sludge reactor
modules.
W2RAP – FISHWATER FLATS WwTW Page 8 of 37
Doc. ref. W2RAP FWF Rev 0.doc Prepared by: Checked: Approved:
Date of issue: 2010-10-15 J G Theron A Mancotywa B Martin
SSI Engineers and Environmental Consultants (Pty) Ltd. © Copyright.
The thickened sludge from the bottom of the secondary clarifiers is returned to the anoxic zone of the
reactors where it is mixed once again with the incoming settled sewage.
The raw sludge from the PST’s is passed through a gravity thickener before heat treatment in the
Zimpro process and final dewatering by means of centrifuges. The waste activated sludge (WAS) is
thickened before treatment in the Zimpro plant and dewatering by centrifuge.
The final dewatered sludge is then disposed of by truck to a nearby brick factory where it is
incorporated into bricks
The Fishwater Flats WwTW is currently being upgraded as follows.
• Increase the capacity of the Fishwater Flats WwTW from 132 Ml/day to 170 Ml/ day by 2015, which is the ultimate capacity required to meet the projections of the NMBM Sewer Master Plan.
• To completely upgrade and modernise the works which is over 30 years old, using state of the art processes and equipment where necessary in order to create a world class facility capable of consistently meeting the DWA discharge requirements.
• Provide a reliable source of treated effluent to an agreed quality by means of advanced treatment for use as industrial water by the Coega IDZ, existing industries and potentially indirect potable reuse.
• Create a facility which is in harmony with the environment and adopts energy saving and renewable energy methods wherever possible.
Summary of proposed upgrading
New Facilities
The following new facilities are proposed:
a) New Inlet Works comprising
• Inlet sump with stone removal facility interconnected to existing inlet works, which will
still remain operational and will be upgraded/refurbished
• Additional screw or centrifugal pumps for combined domestic and industrial streams
• Mechanically raked coarse screens (20-30mm) before pumps plus fine screens (6-
10mm);
• Conveyors, screenings press and all ancillary equipment
• Vortex type de-gritters including grit classifier/s and washing facility
• All M&E and Civil works including enclosure for inlet works if possible / practical plus
odour control/removal facility
b) Conversion of Existing Conventional Activated Sludge Facility into MBR Plant (Recommended preferred option) comprising
• External MBR cassette modules including civil works
• Pump stations / blower houses and all ancillary works including interconnecting
pipework
W2RAP – FISHWATER FLATS WwTW Page 9 of 37
Doc. ref. W2RAP FWF Rev 0.doc Prepared by: Checked: Approved:
Date of issue: 2010-10-15 J G Theron A Mancotywa B Martin
SSI Engineers and Environmental Consultants (Pty) Ltd. © Copyright.
• Upgrading of aeration requirements
• Ozone and GAC treatment of MBR effluent (if required only)
• Modular system to be implemented in phases to suit RE demand
c) New Buildings and Conversions
• New administration building and staff / visitors parking area incorporating laboratory
and new workshops (requirements to be agreed with NMBM)
• New entrance gate and guardhouse
• New perimeter wall and fencing where required
• New sludge dewatering facility close to proposed co-generation plant
• Conversion of existing store into new generator house
• Conversion of existing administration building (to be agreed with NMBM)
• Conversion or demolition of existing FS Building (to be agreed with NMBM)
Existing facilities to be upgraded
• Enclosure to be provided for existing inlet works if possible/practical
• All mechanical and electrical equipment throughout works to be refurbished/ replaced
as necessary (refer section 9 and Annexure C)
• Upgrading of surface aerators to increase oxygen output for increased flow or,
• Possible replacement of surface aerators with fine bubble diffused aeration
• All instrumentation to be assessed and upgraded or replaced where necessary
• All ancillary equipment (handrails, gratings, pipework etc.) to be refurbished or
replaced as necessary
• SCADA system to be assessed and upgraded to provide full plant automation and
management reporting capability (refer Section 8 and Annexure C)
• All civil and building work to be repaired as necessary (refer Afri-coast report –
Building Repairs and Concrete Rehabilitation to WWTW May 2008 )
• All external works (roads, paving, signage etc.) to be assessed and repaired /
upgraded / replaced as necessary in accordance with overall landscaping plans
• Landscaping to be upgraded as per landscape architect recommendations including
hard and soft landscaping (refer section 11) in order to restore the natural
environmental balance of the area while enhancing the aesthetic appearance of the
works
• Possible inclusion of additional facilities such as plant nursery, aqua and mari-culture
to provide NMBM with job creation opportunities
• All existing buildings and prominent and/or easily visible structures to be
architecturally enhanced in a co-ordinated theme to tie in with the landscape
proposals
• Security of the entire site to be upgraded with possible inclusion of high level security
cameras offering 24 hour surveillance
• Establishment of operation and maintenance contracts for key and/or specialist M&E
facilities including project and facilities management of the same
Facilities to become redundant
The following facilities could become redundant:-
• DAF Plant
W2RAP – FISHWATER FLATS WwTW Page 10 of 37
Doc. ref. W2RAP FWF Rev 0.doc Prepared by: Checked: Approved:
Date of issue: 2010-10-15 J G Theron A Mancotywa B Martin
SSI Engineers and Environmental Consultants (Pty) Ltd. © Copyright.
• Anaerobic Terrace comprising:
� UASB Digester
� Digester pump station
� Gas Holder
� Clarifier
� Sludge Tank
� Clarifier pump station
� Gas Holder
� Boiler house ( if Zimpro plant is decommissioned)
• Zimpro thermal conditioning plant. Dewatering in the form of centrifuges and/or belt
presses will still however be required.
• 4 Sludge thickeners may become redundant but depends on the actual take off point
for biogas plant (still to be confirmed)
• 3 No consolidation tanks
• FS Building (currently houses the SCADA control room, which is likely to be
relocated, and the centrifuges which will be relocated closer to the co-generation
plant in a new dewatering building)
• Sludge storage building (to be re-located)
• Filter Building (after MBR plant is commissioned)
• Osec chlorinator plant which has not been operating for many years
• Industrial outfall screw pumps and industrial chlorine contact tank (after MBR plant is
commissioned)
• Reclaimed effluent reservoir (after MBR plant is commissioned)
• Domestic chlorine contact tank (after MBR plant is commissioned)
Certain redundant structures and buildings may be modified and reused for other purposes or may
alternatively be demolished to create additional development space.
Electrical Supply / Reticulation
The electrical reticulation system at the works will need to be upgraded in order to cater for the
additional plant proposed under this Master Plan. In addition the main switchgear and distribution
switchgear is dated and in need of replacement. The power transformers are however still serviceable
and can be retained.
The majority of low voltage switchgear has been refurbished in recent years however some minor
failures have since occurred on certain components and some remedial action is required on most of
the MCC’s throughout the works.
Supervisory control and data acquisition (SCADA)
The Fishwater Flats WwTW control system has also been refurbished over the past years however
the SCADA system, which was gradually introduced over the past contracts, should now be
expanded, upgraded and implemented to it’s full capability in order to provide full Supervisory Control,
Data Acquisition, comprehensive Reporting as well as Routine and Preventative Maintenance
functionality.
W2RAP – FISHWATER FLATS WwTW Page 11 of 37
Doc. ref. W2RAP FWF Rev 0.doc Prepared by: Checked: Approved:
Date of issue: 2010-10-15 J G Theron A Mancotywa B Martin
SSI Engineers and Environmental Consultants (Pty) Ltd. © Copyright.
Instrumentation throughout the works is in varying condition and general assessment, recalibration
and replacement of faulty or dated and non-serviceable instrumentation must be undertaken.
Lastly, the energy efficiency of the works should be evaluated and measures proposed and
implemented in order to improve on such efficiency. One such possibility would be the use of Variable
Speed Drives on the aerators as opposed to direct on-line fixed speed drives.
Buildings and Structures
A new administration building, which will also house the workshops, security and a laboratory is
proposed and will be located at the entrance to the site which is a much better location than the
current one. The architecture of the building will follow the principles stated in section 1.10 and will
form a central theme which will apply to all other buildings. A dewatering facility which will be housed
in a new building close to the proposed co-generation plant will also be required.
The current state of the structures is extremely poor due a combination of the corrosive environment
and lack of adequate maintenance. A report on the building repairs and concrete rehabilitation was
prepared by Afri-coast Engineers as part of the backlog maintenance programme and this will be
used as a guideline for the rehabilitation requirements for this project.
Support Facilities
Security
There have been numerous cases of theft at the works and it is clear that the entire security system
needs to be reassessed and urgent improvements made.
Some contact has been made with the NMBM security section and further liaison with them together
with a security consultant is required in order to propose improved security measures. Improved
security should include:
• Additional High Mast lighting
• Electrified perimeter fencing
• Security cameras mounted on the masts for 24 hour surveillance
• Alarm system connected to NMBM security and the Fire Station or alarm company
for 24 hour monitoring
Health and Safety Requirements
All facilities within the works must be checked and upgraded where required to meet the requirements
of the Occupational Health and Safety Act (OHS Act).
For new projects health and safety aspects should be embraced and incorporated right from the
onset at the planning phase and continued through to completion handover and commissioning.
Regular training on Health and safety for operational staff must be maintained, as per the approved
health and safety management plan for the NMBM.

W2RAP – FISHWATER FLATS WwTW Page 12 of 37
Doc. ref. W2RAP FWF Rev 0.doc Prepared by: Checked: Approved:
Date of issue: 2010-10-15 J G Theron A Mancotywa B Martin
SSI Engineers and Environmental Consultants (Pty) Ltd. © Copyright.
Odour Control and Air Quality Assessment
At Fishwater Flats WwTW the inlet works is the primary source of unpleasant odours emanating from:
• The bucket discharge area during emptying of buckets
• Septic sewage containing H2S and other odorous compounds on arrival and
discharge at the inlet sump
• Certain industrial wastes
• Screenings and unwashed grit
Odour control devices suitable for Fishwater Flats WWTW will be investigated and incorporated in the
capital works programme.
Odour control methods can generally be divided into physical, chemical or biological methods:
Biological methods seem to be the latest direction as they are the most environmentally friendly and
are generally the most cost effective as well. It is proposed that portions of the inlet works be covered
to prevent odours from escaping into the atmosphere with a facility for collecting the trapped gasses
which can then be treated using one of the most suitable method for the site.
Architecture
Due to the extreme environmental conditions prevalent on the site, the existing buildings are showing
signs of severe decay and require urgent upgrading and or replacement.
In the design of new buildings the surrounding landscape and environment will be considered
relating to site orientation, current views and the site’s close proximity to surrounding industrial
buildings and the ocean.
The use of materials will be carefully considered to take into account the functionality of the structure,
affordability and the extremely harsh environment in which the site is located. The design will take
into account green building principles reducing the use of mechanical ventilation and making optimum
use of natural light through correct orientation.
Landscaping and Site Beautification
The landscaping master-plan (for existing and proposed) should consist of indigenous species which
are endemic to the region, with the aim of restoring the natural balance, which has been disturbed in
the past and which has been perpetuated over the years, but now, with foresight, can be rectified.
The landscaping would also provide screening of the installation although this will be limited due to
the low elevation of the site in relation to the surrounding roads and N2 motorway.
The creation of a bird-friendly eco-system will in turn encourage insect, amphibian and fish
establishment. These can be integrated with water-features, walkways, gathering points, bird "hides"
and fish-ponds.
Job Creation Opportunities for SMME’s
The construction phase of the project will create jobs for semi-skilled and unskilled workers and will
especially benefit the local communities close by.
W2RAP – FISHWATER FLATS WwTW Page 13 of 37
Doc. ref. W2RAP FWF Rev 0.doc Prepared by: Checked: Approved:
Date of issue: 2010-10-15 J G Theron A Mancotywa B Martin
SSI Engineers and Environmental Consultants (Pty) Ltd. © Copyright.
In the post construction phase the establishment of a nursery, flower growing businesses and aqua-
mariculture projects could create job opportunities through the NMBM.
Refer to Annexure A for maps and layouts of Fishwater Flats WwTW, proposed upgrades and
process flow diagram.
3.4 Receiving environment & end users
The domestic and industrial streams through Fishwater Flats WwTW are treated separately and final
treated effluent is also discharged to separate receiving environments. The domestic final effluent is
discharge to sea via a shallow sea outfall. However, some of this effluent is also used as reclaimed
effluent on site and treated further, through sand filtration, and sold to industries
The industrial final treated effluent is discharged to the Paapenkuils River, without any reuse. Both
domestic and industrial effluent streams as disinfected with chlorine prior to final discharge.
W2RAP – FISHWATER FLATS WwTW Page 14 of 37
Doc. ref. W2RAP FWF Rev 0.doc Prepared by: Checked: Approved:
Date of issue: 2010-10-15 J G Theron A Mancotywa B Martin
SSI Engineers and Environmental Consultants (Pty) Ltd. © Copyright.
4. WASTEWATER SYSTEM ASSESSMENT
The wastewater system assessment consists of two phases, namely a desk-based assessment
and a field assessment. Both an initial desk-based assessment and detailed field assessments
was performed as part of this wastewater risk abatement plan and planning for the proposed
plant upgrade.
4.1 Catchment area
The catchments and flows draining into the Fishwater Flats WWTW obtained from the NMBM Sewer
Master Plan for the current situation up to 2020 are summarised in the following table:
CATCHMENT AREAS Flows to Fishwater Flats WWTW in Ml/day
Current 2012 2015 2020
ADWF PWWF ADWF PWWF ADWF PWWF ADWF PWWF
Chatty
Swartkops plus Chatty 45.3 158.4 47.5 166.3 58.6 205 59.6 208.8
Papenkuils via Creek P/S 21.3 74.6 24.6 86.0 28.5 99.6 29.0 101.6
City via Creek P/S 30.9 108.2 31.6 110.5 32.1 112.4 32.5 113.9
Motherwell via Brickfields 14.3 50.1 17.3 60.6 17.3 60.6 34.9 122.3
Markman / Wells Estate 13.4 47 19.3 67.5 27.3 95.6 19.9 69.8
TOTAL to Fishwater Flats WWTW
125.2 438.3 140.3 490.9 168.3 573.2 175.9 616.4
Diverted to Driftsands 8.3 72.1
ULTIMATE Fishwater Flats Q
155.5 544.3
Please refer to Annexure A for maps of the Fishwater Flats WwTW catchment areas. Please also
refer to the latest NMBM Sewer Master Plan for more detailed descriptions of the catchment areas.
4.2 Influent quantity and quality
Refer to Annexure A for maps and layouts of Fishwater Flats WwTW, proposed upgrades and process flow diagram. Analysis of Historical Data Extensive daily sampling and analysis is conducted on the industrial and domestic sewage streams
entering the plant. The following parameters are monitored:
• The daily domestic sewage flow rate to modules 3 to 6.
• The daily industrial sewage flow rate to module 1 & 2.
• The daily industrial sewage flow rate to modules 7.
• The COD, ammonia, TSS and chlorides in the domestic raw sewage flowing to activated
sludge modules 3 to 6.
• The COD, ammonia, TSS and chlorides in the industrial raw sewage flowing to the activated
sludge modules 1, 2 and 7. It should be noted that the Zimpro liquor, centrate from the
W2RAP – FISHWATER FLATS WwTW Page 15 of 37
Doc. ref. W2RAP FWF Rev 0.doc Prepared by: Checked: Approved:
Date of issue: 2010-10-15 J G Theron A Mancotywa B Martin
SSI Engineers and Environmental Consultants (Pty) Ltd. © Copyright.
dewatering centrifuges as well as the overflow from the sludge thickeners is currently added
to this stream, and it is therefore not truly representative of the industrial sewage entering the
plant.
• The organic parameters in the settled sewage leaving all seven PSTs. In order to rationalise
the amount of settled sewage data the following sets of data have been averaged:
• the settled industrial sewage leaving PSTs 1 and 2 in modules 1 and 2
• the settled industrial sewage leaving from PSTs 7 and 8 in module 7.
• the settled domestic sewage leading from PSTs 3 to 6 in modules 3 to 6.
Daily Flow Data The influent flow rates of sewage to the plant are currently monitored as follows:
• The industrial sewage stream to modules 1 and 2 is measured as it flows through a venturi
flume in the supply channel. It should be noted that until very recently the measuring point
was downstream of an overflow weir which discharges excess flow into the storm overflow
tank. Once the storm overflow tank is full it in turn overflows to the sea outfall.
• The industrial sewage stream to module 7 is measured as it flows through a venturi flume in
the supply channel.
• The domestic sewage stream is measured as it flows through a venturi flume in the supply
channel. It should be noted that the measuring point is downstream of an overflow weir
which discharges excess flow into the storm overflow tank. Once the storm overflow tank is
full it in turn overflows to the sea outfall.
It should be noted that in August 2009 new area/velocity flow meters were installed in the channels
upstream of the overflow weirs so that the hydraulic profile of the influent flow of both the domestic
and the total industrial streams will become available. These will be important in order for the diurnal
peaks to be monitored so that flow balancing requirements can be established.
W2RAP – FISHWATER FLATS WwTW Page 16 of 37
Doc. ref. W2RAP FWF Rev 0.doc Prepared by: Checked: Approved:
Date of issue: 2010-10-15 J G Theron A Mancotywa B Martin
SSI Engineers and Environmental Consultants (Pty) Ltd. © Copyright.
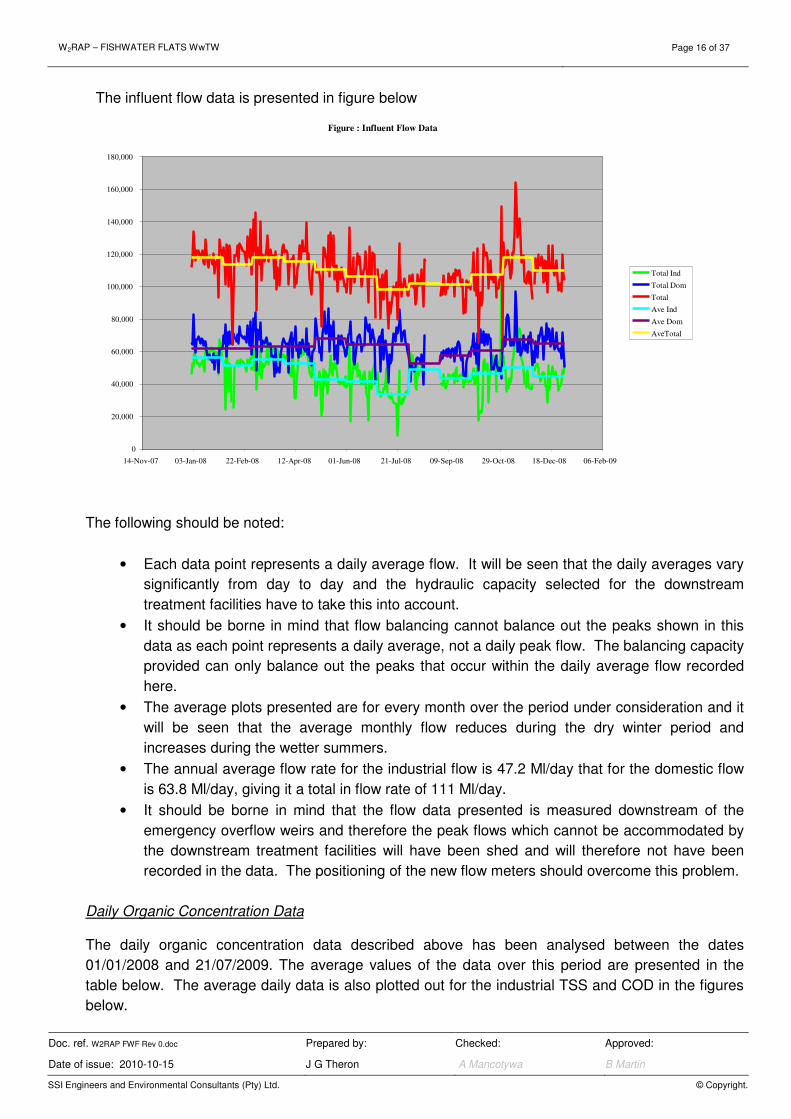
The influent flow data is presented in figure below
The following should be noted:
• Each data point represents a daily average flow. It will be seen that the daily averages vary
significantly from day to day and the hydraulic capacity selected for the downstream
treatment facilities have to take this into account.
• It should be borne in mind that flow balancing cannot balance out the peaks shown in this
data as each point represents a daily average, not a daily peak flow. The balancing capacity
provided can only balance out the peaks that occur within the daily average flow recorded
here.
• The average plots presented are for every month over the period under consideration and it
will be seen that the average monthly flow reduces during the dry winter period and
increases during the wetter summers.
• The annual average flow rate for the industrial flow is 47.2 Ml/day that for the domestic flow
is 63.8 Ml/day, giving it a total in flow rate of 111 Ml/day.
• It should be borne in mind that the flow data presented is measured downstream of the
emergency overflow weirs and therefore the peak flows which cannot be accommodated by
the downstream treatment facilities will have been shed and will therefore not have been
recorded in the data. The positioning of the new flow meters should overcome this problem.
Daily Organic Concentration Data The daily organic concentration data described above has been analysed between the dates
01/01/2008 and 21/07/2009. The average values of the data over this period are presented in the
table below. The average daily data is also plotted out for the industrial TSS and COD in the figures
below.
Figure : Influent Flow Data
0
20,000
40,000
60,000
80,000
100,000
120,000
140,000
160,000
180,000
14-Nov-07 03-Jan-08 22-Feb-08 12-Apr-08 01-Jun-08 21-Jul-08 09-Sep-08 29-Oct-08 18-Dec-08 06-Feb-09
Total Ind
Total Dom
Total
Ave Ind
Ave Dom
AveTotal
W2RAP – FISHWATER FLATS WwTW Page 17 of 37
Doc. ref. W2RAP FWF Rev 0.doc Prepared by: Checked: Approved:
Date of issue: 2010-10-15 J G Theron A Mancotywa B Martin
SSI Engineers and Environmental Consultants (Pty) Ltd. © Copyright.
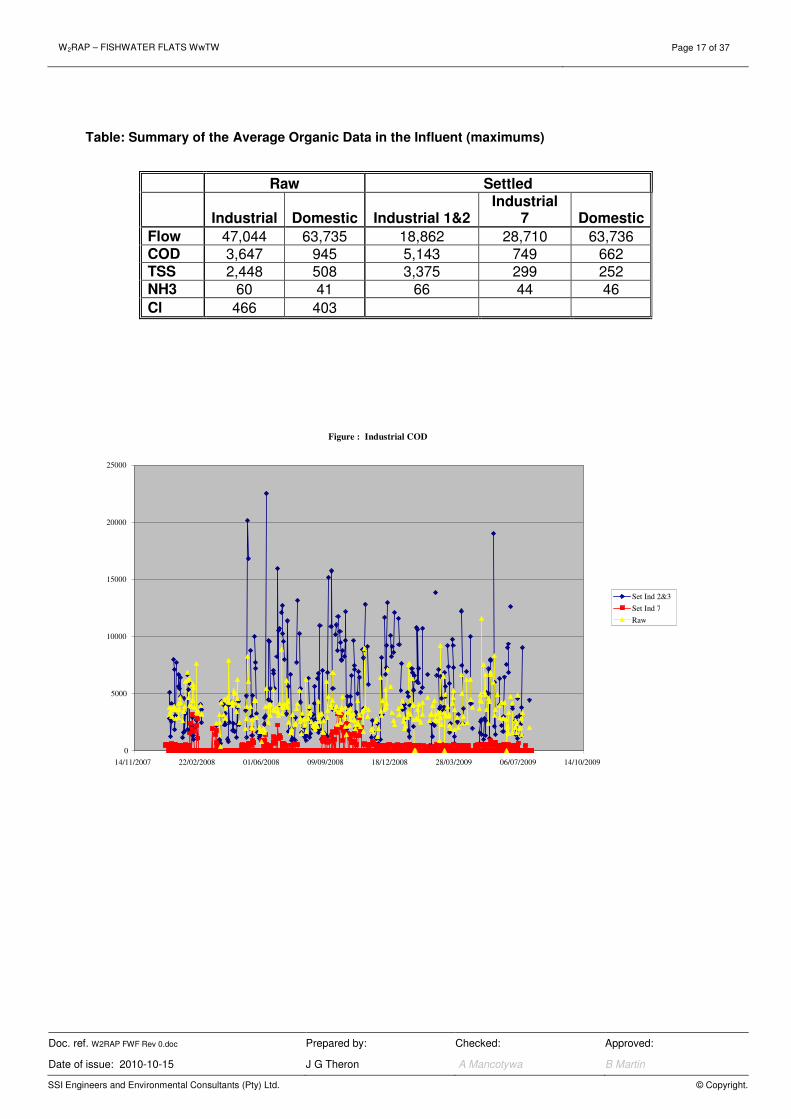
Table: Summary of the Average Organic Data in the Influent (maximums)
Raw Settled
Industrial Domestic Industrial 1&2 Industrial
7 Domestic
Flow 47,044 63,735 18,862 28,710 63,736 COD 3,647 945 5,143 749 662 TSS 2,448 508 3,375 299 252 NH3 60 41 66 44 46
Cl 466 403
Figure : Industrial COD
0
5000
10000
15000
20000
25000
14/11/2007 22/02/2008 01/06/2008 09/09/2008 18/12/2008 28/03/2009 06/07/2009 14/10/2009
Set Ind 2&3
Set Ind 7
Raw
W2RAP – FISHWATER FLATS WwTW Page 18 of 37
Doc. ref. W2RAP FWF Rev 0.doc Prepared by: Checked: Approved:
Date of issue: 2010-10-15 J G Theron A Mancotywa B Martin
SSI Engineers and Environmental Consultants (Pty) Ltd. © Copyright.
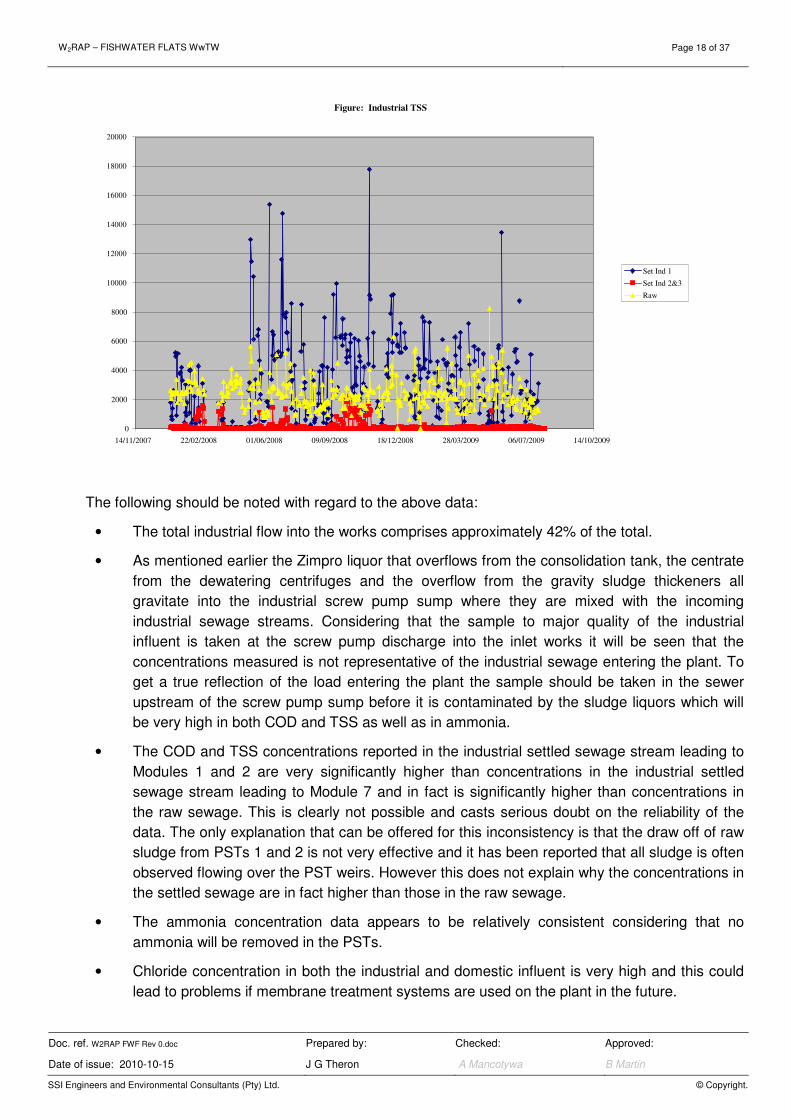
The following should be noted with regard to the above data:
• The total industrial flow into the works comprises approximately 42% of the total.
• As mentioned earlier the Zimpro liquor that overflows from the consolidation tank, the centrate
from the dewatering centrifuges and the overflow from the gravity sludge thickeners all
gravitate into the industrial screw pump sump where they are mixed with the incoming
industrial sewage streams. Considering that the sample to major quality of the industrial
influent is taken at the screw pump discharge into the inlet works it will be seen that the
concentrations measured is not representative of the industrial sewage entering the plant. To
get a true reflection of the load entering the plant the sample should be taken in the sewer
upstream of the screw pump sump before it is contaminated by the sludge liquors which will
be very high in both COD and TSS as well as in ammonia.
• The COD and TSS concentrations reported in the industrial settled sewage stream leading to
Modules 1 and 2 are very significantly higher than concentrations in the industrial settled
sewage stream leading to Module 7 and in fact is significantly higher than concentrations in
the raw sewage. This is clearly not possible and casts serious doubt on the reliability of the
data. The only explanation that can be offered for this inconsistency is that the draw off of raw
sludge from PSTs 1 and 2 is not very effective and it has been reported that all sludge is often
observed flowing over the PST weirs. However this does not explain why the concentrations in
the settled sewage are in fact higher than those in the raw sewage.
• The ammonia concentration data appears to be relatively consistent considering that no
ammonia will be removed in the PSTs.
• Chloride concentration in both the industrial and domestic influent is very high and this could
lead to problems if membrane treatment systems are used on the plant in the future.
Figure: Industrial TSS
0
2000
4000
6000
8000
10000
12000
14000
16000
18000
20000
14/11/2007 22/02/2008 01/06/2008 09/09/2008 18/12/2008 28/03/2009 06/07/2009 14/10/2009
Set Ind 1
Set Ind 2&3 Raw
W2RAP – FISHWATER FLATS WwTW Page 19 of 37
Doc. ref. W2RAP FWF Rev 0.doc Prepared by: Checked: Approved:
Date of issue: 2010-10-15 J G Theron A Mancotywa B Martin
SSI Engineers and Environmental Consultants (Pty) Ltd. © Copyright.
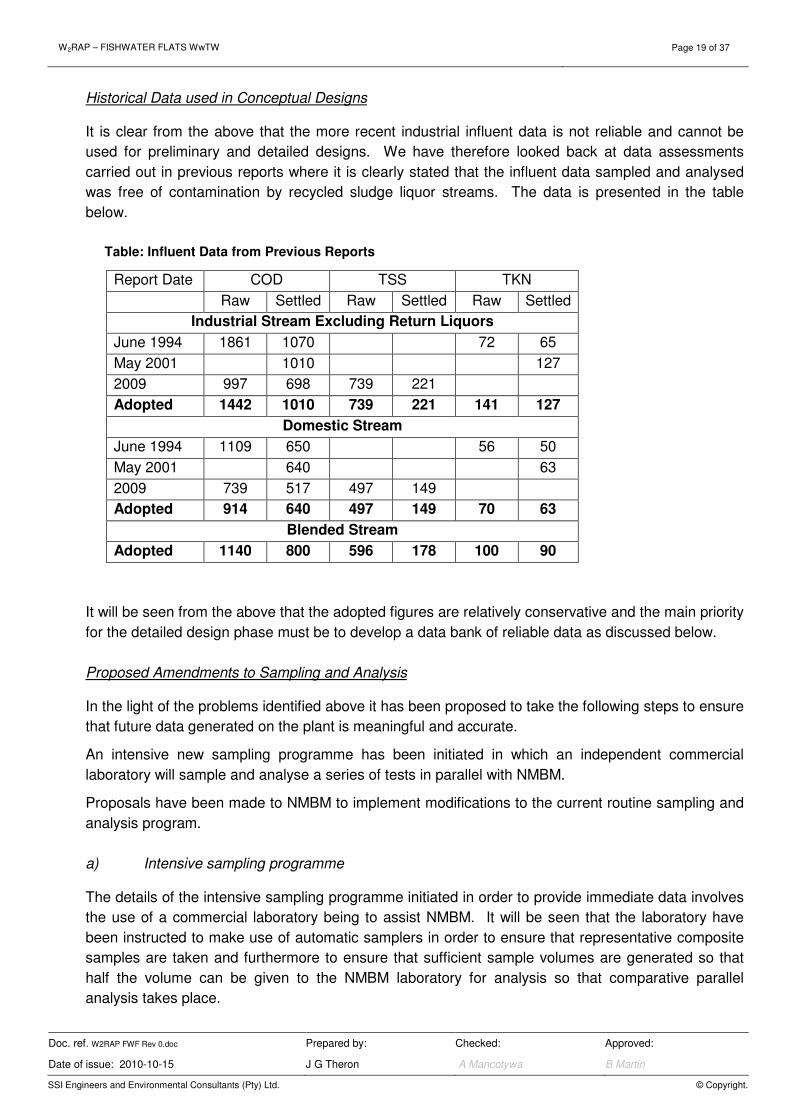
Historical Data used in Conceptual Designs It is clear from the above that the more recent industrial influent data is not reliable and cannot be
used for preliminary and detailed designs. We have therefore looked back at data assessments
carried out in previous reports where it is clearly stated that the influent data sampled and analysed
was free of contamination by recycled sludge liquor streams. The data is presented in the table
below.
Table: Influent Data from Previous Reports
Report Date COD TSS TKN
Raw Settled Raw Settled Raw Settled
Industrial Stream Excluding Return Liquors
June 1994 1861 1070 72 65
May 2001 1010 127
2009 997 698 739 221
Adopted 1442 1010 739 221 141 127
Domestic Stream
June 1994 1109 650 56 50
May 2001 640 63
2009 739 517 497 149
Adopted 914 640 497 149 70 63
Blended Stream
Adopted 1140 800 596 178 100 90
It will be seen from the above that the adopted figures are relatively conservative and the main priority
for the detailed design phase must be to develop a data bank of reliable data as discussed below.
Proposed Amendments to Sampling and Analysis In the light of the problems identified above it has been proposed to take the following steps to ensure
that future data generated on the plant is meaningful and accurate.
An intensive new sampling programme has been initiated in which an independent commercial
laboratory will sample and analyse a series of tests in parallel with NMBM.
Proposals have been made to NMBM to implement modifications to the current routine sampling and
analysis program.
a) Intensive sampling programme
The details of the intensive sampling programme initiated in order to provide immediate data involves
the use of a commercial laboratory being to assist NMBM. It will be seen that the laboratory have
been instructed to make use of automatic samplers in order to ensure that representative composite
samples are taken and furthermore to ensure that sufficient sample volumes are generated so that
half the volume can be given to the NMBM laboratory for analysis so that comparative parallel
analysis takes place.
W2RAP – FISHWATER FLATS WwTW Page 20 of 37
Doc. ref. W2RAP FWF Rev 0.doc Prepared by: Checked: Approved:
Date of issue: 2010-10-15 J G Theron A Mancotywa B Martin
SSI Engineers and Environmental Consultants (Pty) Ltd. © Copyright.
b) Proposed amendments to the routine sampling and analysis on the plant
As discussed above there are a number of shortcomings in the current routine sampling and analysis
programme be implemented on the plant. These are enumerated briefly below:
The current flow measuring contract at Fishwater Flats WwTW will address the existing shortcomings
in the monitoring of the flow data on the plant which includes:
• Area velocity meters have added to both the industrial and domestic streams before the overflow weirs so that flow is measured prior to overflow to the storm tank and/or to sea.
• The return liquours are now measured in a manhole before entering the industrial inlet sump.
• The overflow to the storm tank will also be measured so that a subtraction of the relevant flows will give an accurate figure of the actual incoming flows.
• A 12 month service contract forms part of the contract which includes monthly reports and data from the data loggers to ensure that the meters are functioning correctly and correct measurements are being recorded.
• It has been recommended to the works personnel that all samples taken on the works be in
the form of composite samples using automatic samplers in order to ensure that the data
generated is representative of the streams being monitored. In order to make this practical
and to reduce the number of automatic samplers required it is recommended that not all the
overflow streams from the PSTs and final clarifiers be monitored. It is rather recommended
that representative samples be taken from single PSTs or clarifiers which are representative of
a stream. A single composite sample is more representative of the contents of the stream
then a multitude of a grab sample. The cost of purchasing and maintaining the automatic
samplers will be more than offset by the saving in the number of analyses required.
The recommended sampling points have been modified as follows:
• The influent industrial stream should be sampled in the sewer before it discharges into the
screw pump sump so that it is not contaminated by the return flows from the sludge handling
facilities.
• The settled sewage from either PST 1 or 2 and one of the PSTs 3, 4, 5 or 6 discharging
settled sewage in the domestic stream should be monitored as representative of the
respective streams. Also the combined settled sewage flowing from PSTs 7 and 8 should be
monitored.
• The combined effluent from the final clarifiers 1 and 2, from the final clarifiers 3, 4, 5 or 6 and
from final clarifiers 7 and 8 should be monitored.
• It is also recommended that the internal recycle streams emanating from the sludge handling
facilities should be quantified and analysed. Therefore the volume and organic concentrations
in the Zimpro liquor from the consolidation tank, the centrate flow from the centrifuges and the
overflow from the sludge thickeners should be monitored so that the influence of these side
streams can be assessed for future design purposes.
Combining Industrial and Domestic Streams Currently the industrial and domestic sewage streams are treated separately in dedicated modules
because the effluents are disposed of differently. A portion of the domestic effluent is recovered and
W2RAP – FISHWATER FLATS WwTW Page 21 of 37
Doc. ref. W2RAP FWF Rev 0.doc Prepared by: Checked: Approved:
Date of issue: 2010-10-15 J G Theron A Mancotywa B Martin
SSI Engineers and Environmental Consultants (Pty) Ltd. © Copyright.
reused by putting it through a sand filter and therefore has to be of as high a quality as possible. The
industrial effluent is discharged into the Paapenkuils canal and eventually to sea. With the advent of
the reused effluent project to supply the Coega IDZ with industrial water, the effluent from both
streams will be mixed and it therefore makes sense that the influents be mixed as well. The major
advantage of this is that the very strong and difficult to treat industrial influent will be diluted by the
easier to treat domestic influent, making the blended mixture more amenable to treatment.
It was the intention that an estimate of the nature of the blended sewage would be made by
combining the loads represented by the existing data.
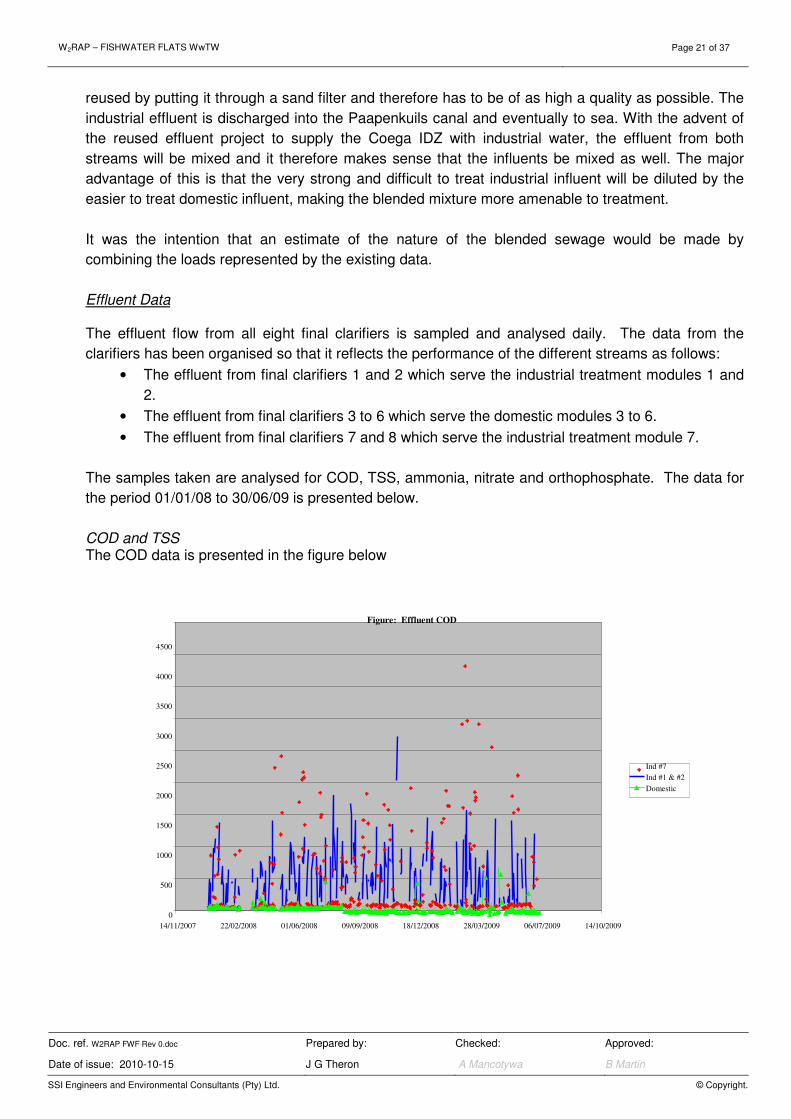
Effluent Data The effluent flow from all eight final clarifiers is sampled and analysed daily. The data from the
clarifiers has been organised so that it reflects the performance of the different streams as follows:
• The effluent from final clarifiers 1 and 2 which serve the industrial treatment modules 1 and
2.
• The effluent from final clarifiers 3 to 6 which serve the domestic modules 3 to 6.
• The effluent from final clarifiers 7 and 8 which serve the industrial treatment module 7.
The samples taken are analysed for COD, TSS, ammonia, nitrate and orthophosphate. The data for
the period 01/01/08 to 30/06/09 is presented below.
COD and TSS The COD data is presented in the figure below
Figure: Effluent COD
0
500
1000
1500
2000
2500
3000
3500
4000
4500
14/11/2007 22/02/2008 01/06/2008 09/09/2008 18/12/2008 28/03/2009 06/07/2009 14/10/2009
Ind #7 Ind #1 & #2 Domestic
W2RAP – FISHWATER FLATS WwTW Page 22 of 37
Doc. ref. W2RAP FWF Rev 0.doc Prepared by: Checked: Approved:
Date of issue: 2010-10-15 J G Theron A Mancotywa B Martin
SSI Engineers and Environmental Consultants (Pty) Ltd. © Copyright.
The following should be noted:
• The COD concentration from the domestic stream is generally very low and well within the
specified limits.
• The COD concentration from the industrial module 7 is generally low but many high values
are recorded.
• The COD concentration from industrial modules 1 and 2 are poor with most of the values
being out of specification.
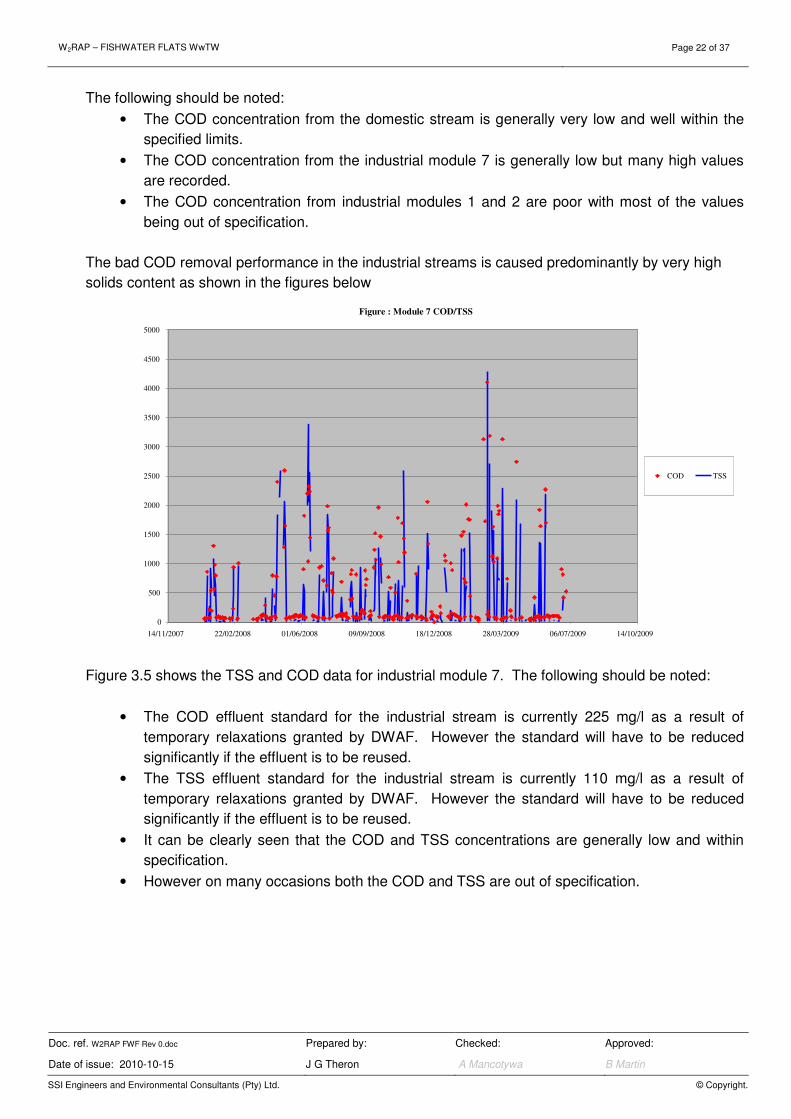
The bad COD removal performance in the industrial streams is caused predominantly by very high
solids content as shown in the figures below
Figure 3.5 shows the TSS and COD data for industrial module 7. The following should be noted:
• The COD effluent standard for the industrial stream is currently 225 mg/l as a result of
temporary relaxations granted by DWAF. However the standard will have to be reduced
significantly if the effluent is to be reused.
• The TSS effluent standard for the industrial stream is currently 110 mg/l as a result of
temporary relaxations granted by DWAF. However the standard will have to be reduced
significantly if the effluent is to be reused.
• It can be clearly seen that the COD and TSS concentrations are generally low and within
specification.
• However on many occasions both the COD and TSS are out of specification.
Figure : Module 7 COD/TSS
0
500
1000
1500
2000
2500
3000
3500
4000
4500
5000
14/11/2007 22/02/2008 01/06/2008 09/09/2008 18/12/2008 28/03/2009 06/07/2009 14/10/2009
COD TSS
W2RAP – FISHWATER FLATS WwTW Page 23 of 37
Doc. ref. W2RAP FWF Rev 0.doc Prepared by: Checked: Approved:
Date of issue: 2010-10-15 J G Theron A Mancotywa B Martin
SSI Engineers and Environmental Consultants (Pty) Ltd. © Copyright.
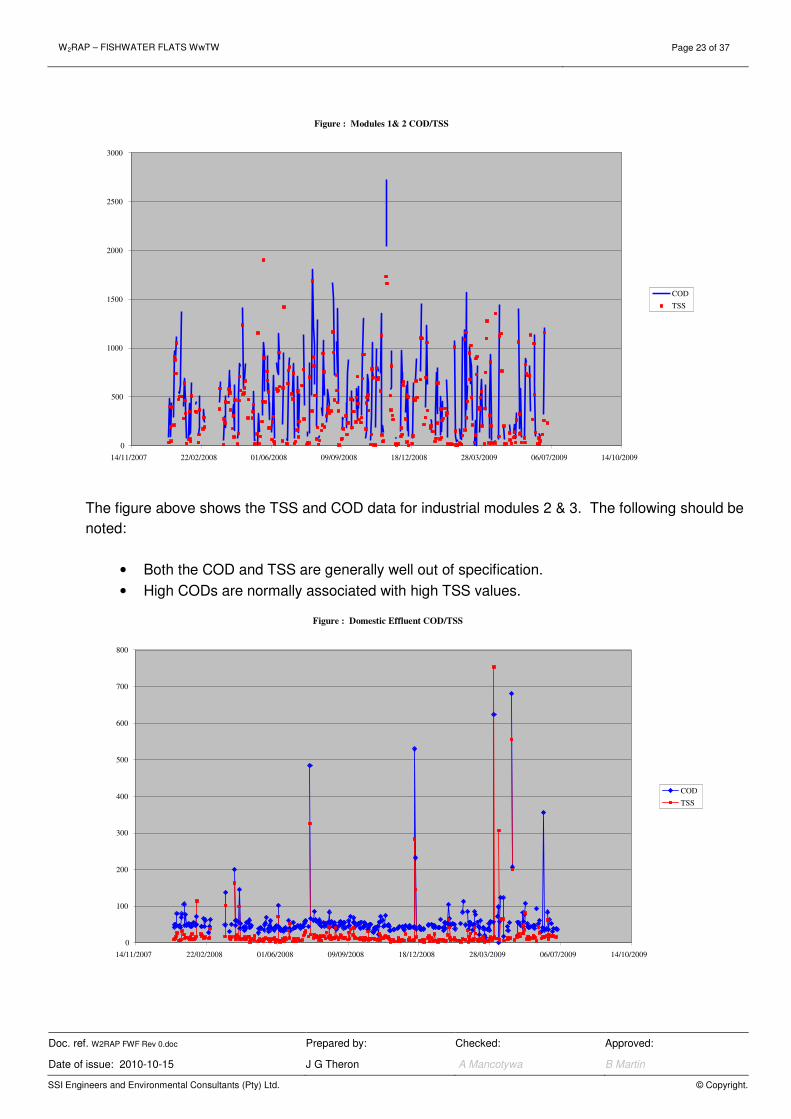
The figure above shows the TSS and COD data for industrial modules 2 & 3. The following should be
noted:
• Both the COD and TSS are generally well out of specification.
• High CODs are normally associated with high TSS values.
Figure : Domestic Effluent COD/TSS
0
100
200
300
400
500
600
700
800
14/11/2007 22/02/2008 01/06/2008 09/09/2008 18/12/2008 28/03/2009 06/07/2009 14/10/2009
COD
TSS
Figure : Modules 1& 2 COD/TSS
0
500
1000
1500
2000
2500
3000
14/11/2007 22/02/2008 01/06/2008 09/09/2008 18/12/2008 28/03/2009 06/07/2009 14/10/2009
COD
TSS
W2RAP – FISHWATER FLATS WwTW Page 24 of 37
Doc. ref. W2RAP FWF Rev 0.doc Prepared by: Checked: Approved:
Date of issue: 2010-10-15 J G Theron A Mancotywa B Martin
SSI Engineers and Environmental Consultants (Pty) Ltd. © Copyright.
The figure above shows the TSS and COD data for the domestic modules 3 to 6. The following
should be noted:
• The COD effluent standard for the domestic sewage stream is currently 75 mg/l
• The TSS effluent standard for the domestic sewage stream is currently 25 mg/l
• Both the COD and TSS are generally within specification.
• The few high COD levels that do occur are associated with high TSS values.
It will be clear from the foregoing analysis that the COD and TSS values in the effluent are very
closely related and in order to achieve regular compliance of the COD standard the discharge of
suspended solids over the final clarifier weirs will have to be controlled, particularly on the industrial
treatment streams. At present the high TSS in the effluent results in over 15dt/d of sludge being
discharged directly into the sea. This is not only detrimental to the environment but would also
significantly affect the viability of the proposed cogeneration plant for the handling and disposal of
sludge on the plant.
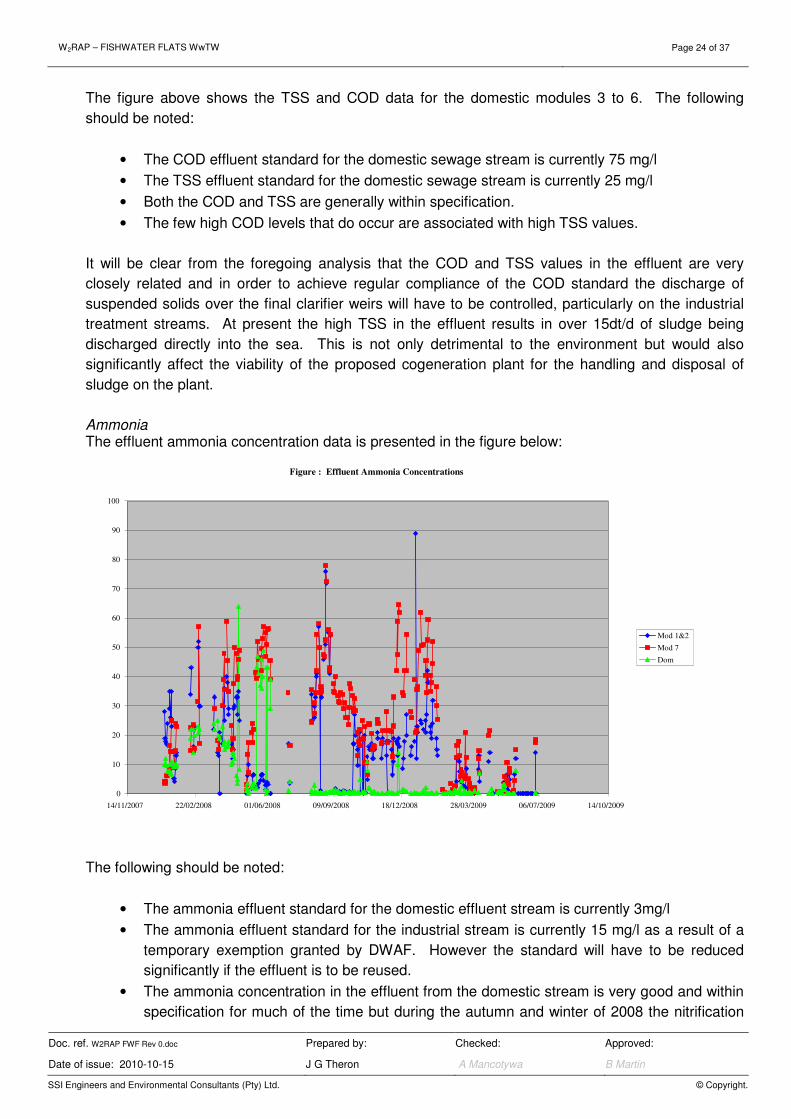
Ammonia The effluent ammonia concentration data is presented in the figure below:
The following should be noted:
• The ammonia effluent standard for the domestic effluent stream is currently 3mg/l
• The ammonia effluent standard for the industrial stream is currently 15 mg/l as a result of a
temporary exemption granted by DWAF. However the standard will have to be reduced
significantly if the effluent is to be reused.
• The ammonia concentration in the effluent from the domestic stream is very good and within
specification for much of the time but during the autumn and winter of 2008 the nitrification
Figure : Effluent Ammonia Concentrations
0
10
20
30
40
50
60
70
80
90
100
14/11/2007 22/02/2008 01/06/2008 09/09/2008 18/12/2008 28/03/2009 06/07/2009 14/10/2009
Mod 1&2
Mod 7
Dom
W2RAP – FISHWATER FLATS WwTW Page 25 of 37
Doc. ref. W2RAP FWF Rev 0.doc Prepared by: Checked: Approved:
Date of issue: 2010-10-15 J G Theron A Mancotywa B Martin
SSI Engineers and Environmental Consultants (Pty) Ltd. © Copyright.
was lost for some reason. The cause of this need to be investigated so that it can be
avoided in the future.
• The nitrification in module 7 is very poor which is evidenced by the high ammonia
concentrations in the effluent. As a result the ammonia concentration in the effluent is
consistently much higher than the specified standard.
• The nitrification in modules 1 and 2 is also poor although better than in module 7. The
ammonia concentration in the effluent is also out of specification for much of the time.
The possible reasons for the poor nitrification performance, particularly in the industrial treatment
streams, are many, such as under aeration or an inhibitory substance in the influent. The cause
should be investigated and corrected as a matter of urgency if the effluent is to be suitable for reuse
in the future.
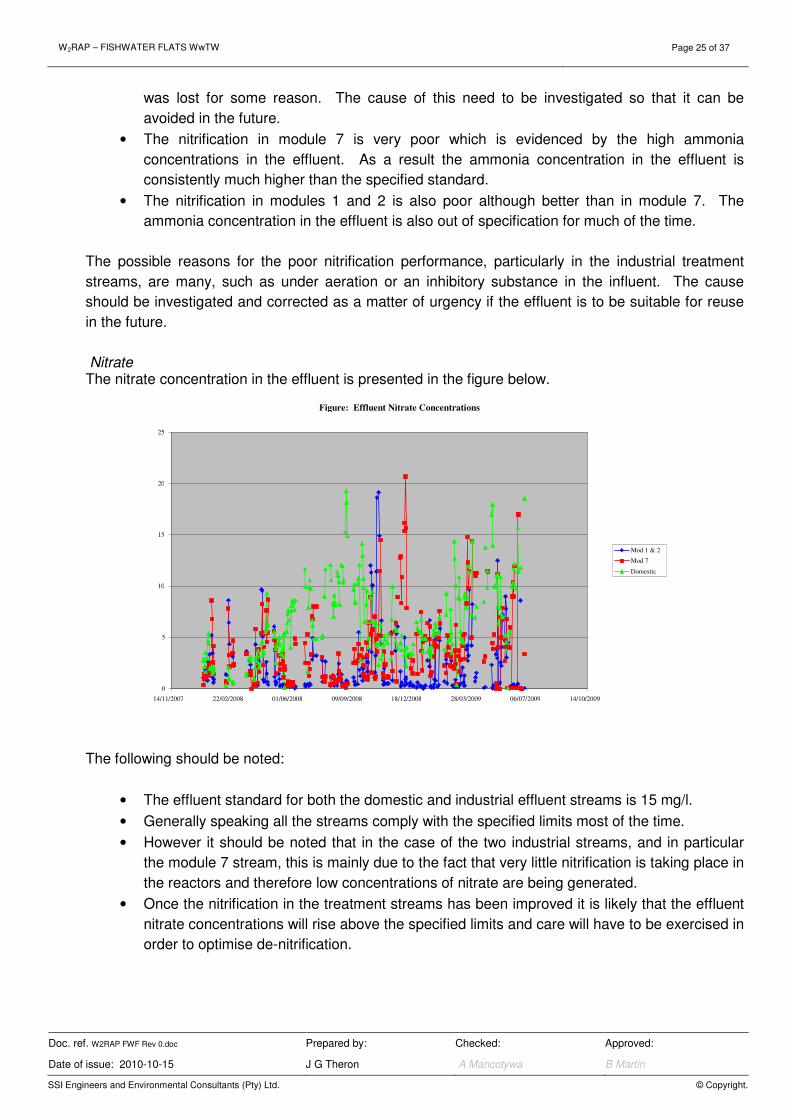
Nitrate The nitrate concentration in the effluent is presented in the figure below.
The following should be noted:
• The effluent standard for both the domestic and industrial effluent streams is 15 mg/l.
• Generally speaking all the streams comply with the specified limits most of the time.
• However it should be noted that in the case of the two industrial streams, and in particular
the module 7 stream, this is mainly due to the fact that very little nitrification is taking place in
the reactors and therefore low concentrations of nitrate are being generated.
• Once the nitrification in the treatment streams has been improved it is likely that the effluent
nitrate concentrations will rise above the specified limits and care will have to be exercised in
order to optimise de-nitrification.
Figure: Effluent Nitrate Concentrations
0
5
10
15
20
25
14/11/2007 22/02/2008 01/06/2008 09/09/2008 18/12/2008 28/03/2009 06/07/2009 14/10/2009
Mod 1 & 2
Mod 7
Domestic
W2RAP – FISHWATER FLATS WwTW Page 26 of 37
Doc. ref. W2RAP FWF Rev 0.doc Prepared by: Checked: Approved:
Date of issue: 2010-10-15 J G Theron A Mancotywa B Martin
SSI Engineers and Environmental Consultants (Pty) Ltd. © Copyright.
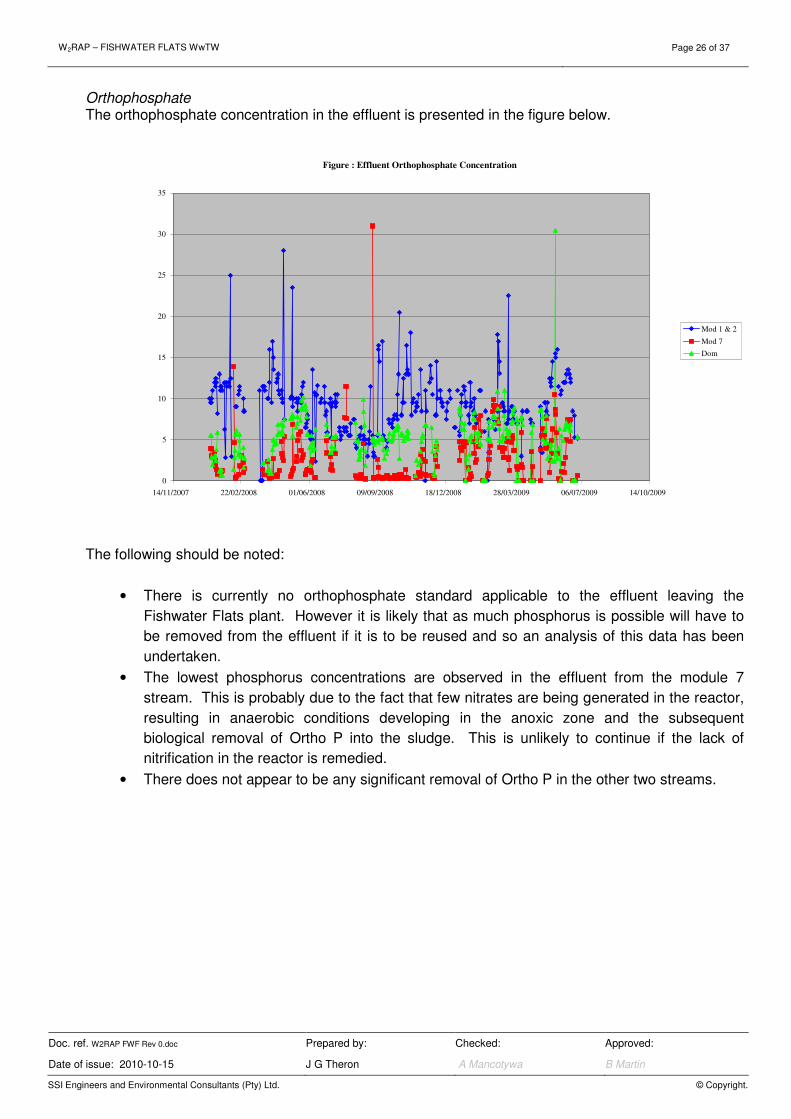
Orthophosphate The orthophosphate concentration in the effluent is presented in the figure below.
The following should be noted:
• There is currently no orthophosphate standard applicable to the effluent leaving the
Fishwater Flats plant. However it is likely that as much phosphorus is possible will have to
be removed from the effluent if it is to be reused and so an analysis of this data has been
undertaken.
• The lowest phosphorus concentrations are observed in the effluent from the module 7
stream. This is probably due to the fact that few nitrates are being generated in the reactor,
resulting in anaerobic conditions developing in the anoxic zone and the subsequent
biological removal of Ortho P into the sludge. This is unlikely to continue if the lack of
nitrification in the reactor is remedied.
• There does not appear to be any significant removal of Ortho P in the other two streams.
Figure : Effluent Orthophosphate Concentration
0
5
10
15
20
25
30
35
14/11/2007 22/02/2008 01/06/2008 09/09/2008 18/12/2008 28/03/2009 06/07/2009 14/10/2009
Mod 1 & 2 Mod 7 Dom
W2RAP – FISHWATER FLATS WwTW Page 27 of 37
Doc. ref. W2RAP FWF Rev 0.doc Prepared by: Checked: Approved:
Date of issue: 2010-10-15 J G Theron A Mancotywa B Martin
SSI Engineers and Environmental Consultants (Pty) Ltd. © Copyright.
4.3 Collection & reticulation
Please refer to the latest NMBM sewer master plan for a full assessment of the existing sewer bulk
conveyance system (collection and reticulation) for the entire NMBM.
4.4 Treatment facility: Fishwater Flats WwTW
Biological process assessment
A biological process assessment was performed on the existing plant aimed at compliance with
Green Drop requirements and to determine the extent of upgrading required in order to extend the
works to its ultimate capacity of 170 Ml/day whilst consistently meeting the DWA discharge
requirements and the standards required for RE as industrial water for the Coega IDZ.
The available flow data indicates that the annual average flow rate for the industrial flow is 47.2
Ml/day and the domestic flow is 63.8 Ml/day, giving a total in flow rate of 111 Ml/day.
Currently the works is unable to comply with the permit requirements relating to suspended solids and
ammonia in the effluent. In addition to the non compliances, the existing Zimpro® wet oxidation
sludge stabilisation system is nearing the end of its design life. The Zimpro® process is to be
replaced in the near future by anaerobic digestion in conjunction with co-generation of electricity from
methane produced by the digesters under a separate contract.
The existing centrifuges used to dewater the sludge prior to disposal are overloaded resulting in
suspended solids being recycled back through the works. This together with recycled Zimpro® liquors
adds to the load on the works and is contributing to the loss of suspended solids from the works.
A failure of the wet oxidation system will result in an un-stabilised sludge being produced by the
works and increase the overload on the centrifuges and it is therefore important that the capacity of
the dewatering equipment be increased without delay. This will not be a wasted cost as the
equipment will still be required in the future once the Zimpro® system is decommissioned and the co-
generation facility comes on line. The operation and maintenance of the future anaerobic digesters
and co-generation works will be undertaken by the co-generation investor/contractor but the disposal
and dewatering of the anaerobically digested sludge will however remain the responsibility of the
NMBM.
The flow into the works is expected to increase to an ultimate Average Dry Weather Flow (ADWF) of
156 Ml/dayay in 2020 with a peak flow of 164 Ml/day occurring in 2015. The current nominal design
capacity of the works is approximately 132 Ml/dayay but the capacity of the final clarifiers however
limits the peak flows that can be accommodated by the works. The final clarifiers are hydraulically
overloaded at present and excessive suspended solids carry over is being reported on two of the
industrial lanes in particular. Currently the works treats two streams, one primarily industrial and the
second primarily domestic in origin. Blending of the two streams to dilute the industrial stream which
produces sludge that does not settle well, will be investigated during the preliminary design stage.
The issue of elevated suspended solids in the effluent needs to be urgently addressed to:
• Improve compliance with licence conditions;
• Maximise the mass of sludge available for co-generation to ensure the financial
viability of the co-generation scheme;
• Maintain an appropriate sludge age for nitrification
W2RAP – FISHWATER FLATS WwTW Page 28 of 37
Doc. ref. W2RAP FWF Rev 0.doc Prepared by: Checked: Approved:
Date of issue: 2010-10-15 J G Theron A Mancotywa B Martin
SSI Engineers and Environmental Consultants (Pty) Ltd. © Copyright.
Options identified to address the existing clarification constraints and consequent suspended solids in
the effluent include:
• Provision of additional clarifiers:
• Provision of Dissolved Air Floatation (DAF) clarification;
• Provision of sand particle filters and;
• Provision of Micro/Ultra-Filtration.
Due to space constraints at the Fishwater Flats site, as well as the need for high quality treated
effluent for industrial use in the Coega IDZ, the use of Micro/Ultra-Filtration by retrofitting the existing
biological reactors as Membrane Bio-Reactors (MBR) was identified as the preferred solution even
though it did not obtain the best score in the NPV life cycle analysis. In addition to addressing the
current solids carryover problem from the final clarifiers, implementation of this option in conjunction
with provision of additional aeration would enable the works capacity to be increased to the ultimate
required treatment capacity without providing additional biological reactors. The increased aeration
requirements to treat the predicted future flows can be implemented by relocating existing surface
aerators and increasing the capacity of the surface aerators as required. Alternatively the biological
reactors could be retrofitted with fine bubble diffused air aeration which would decrease the energy
demand of the works. Both of these options will be investigated in the preliminary design stage.
In order to retrofit the biological reactors as MBR process streams, fine screening, flow balancing,
mixed liquor pumping, membrane cassettes and various ancillary equipment will be required. Flow
data from the flow measuring system presently being commissioned at the works will be used to
determine the flow balancing requirements at the works. Optimisation of flow balancing options will be
undertaken and could be implemented in the following ways and combinations thereof:
• Automation of existing balancing tank operation;
• Use of existing clear water storage tank to increase storage capacity;
• Construction of new balancing tank;
• Use of existing clarifiers by emptying through membrane cassettes during low inflow
periods;
• Use of existing biological reactors (if diffused air is retrofitted) by lowering liquid level
during low flow periods
Hydraulic capacity assessment
A hydraulic capacity assessment was carried out in terms of Green Drop criteria and to verify that
the relevant structures have sufficient freeboard available in order to pass the peak dry and wet
weather flows at the ultimate plant capacity of 170 Ml/day ADF. A hydraulic spreadsheet model was
produced to enable different inlet flows to be entered to check the levels and head losses through
the key biological sections of the works and is included in Annexure E.
Based on current flow checks and measurements, the total existing inflow is in the order of 110
Ml/day which is below the theoretical inflow of 125 Ml/day obtained from the NMBM Sewer Master
Plan and well below the current design capacity of 132 Ml/day.
W2RAP – FISHWATER FLATS WwTW Page 29 of 37
Doc. ref. W2RAP FWF Rev 0.doc Prepared by: Checked: Approved:
Date of issue: 2010-10-15 J G Theron A Mancotywa B Martin
SSI Engineers and Environmental Consultants (Pty) Ltd. © Copyright.
The current works was tested using the NMBM Sewer Master Plan figures which include flows up to
2020, although the peak flow occurs in 2015 as the flow drops slightly thereafter due to the planned
upgrading of the Driftsands WWTW and the construction of the proposed Coega WWTW. Peak
factors of 1,8 for PDWF and 3,6 for PWWF are used in the NMBM Sewer Master Plan are and these
were adopted in the model although an additional PF of 2,5 was also included as there should be
greater attenuation of peaks in a large catchment such as Fishwater Flats. A sample 24 hour flow
pattern taken over a typical week indicated that the dry weather flows appear to be relatively
constant throughout with only a slight dip between about 1am to 8am such that the PDWF is only in
the order of 1,2 compared to the Master Plan figure of 1,8. This seems unusually low and will be
verified once sufficient data becomes available from the new flow meter data loggers which are now
operational. It is not possible to measure PWWF with the current flow measuring arrangement and
thus the actual peak wet weather factor is not known at this stage. The new flow meters should
provide accurate flow figures for dry and wet weather flows once data is obtained for at least one
rainy season, and this will be used for detailed design purposes.
Air Quality Assessment
An air quality assessment will be conducted to determination of the dispersion potential of the area
being assessed. An emissions inventory will also need to be developed to provide the facility with
an indication of whether they comply with the required standards.
An air quality management plan for the site will be compiled when the final engineering designs
have been completed. This will include the development of management zones around the facility
which will aid in land use planning around the site.
W2RAP – FISHWATER FLATS WwTW Page 30 of 37
Doc. ref. W2RAP FWF Rev 0.doc Prepared by: Checked: Approved:
Date of issue: 2010-10-15 J G Theron A Mancotywa B Martin
SSI Engineers and Environmental Consultants (Pty) Ltd. © Copyright.
5. HAZARD IDENTIFICATION AND RISK ASSESSMENT
Hazard identification
The first step followed in considering hazards (risks) that may affect the Nelson Mandela Bay
wastewater supply is to identify potential hazard events during the wastewater system assessments
summarized in Chapter 4. Using this data, both the type of hazard events and the potential sources or
causes of these hazards are identified. It is suggested that considering ‘hazard events’ rather than
specific hazards is the most effective way to identify and quantify risks to wastewater safety. For the
purpose of the Nelson Mandela Bay wastewater risk abatement plans, a hazard event can be defined
as a mechanism which influences wastewater treatment and/or by-products to such an extent that it
may negatively affect public health, the environment or poses a risk to infrastructure or private
property. As part of the hazard identification process the impact of these hazard events are also
considered which then leads to their subsequent risk assessments. Please refer to Annexure C for the
hazard events identified for the Fishwater Flats WwTW system.
Risk assessment
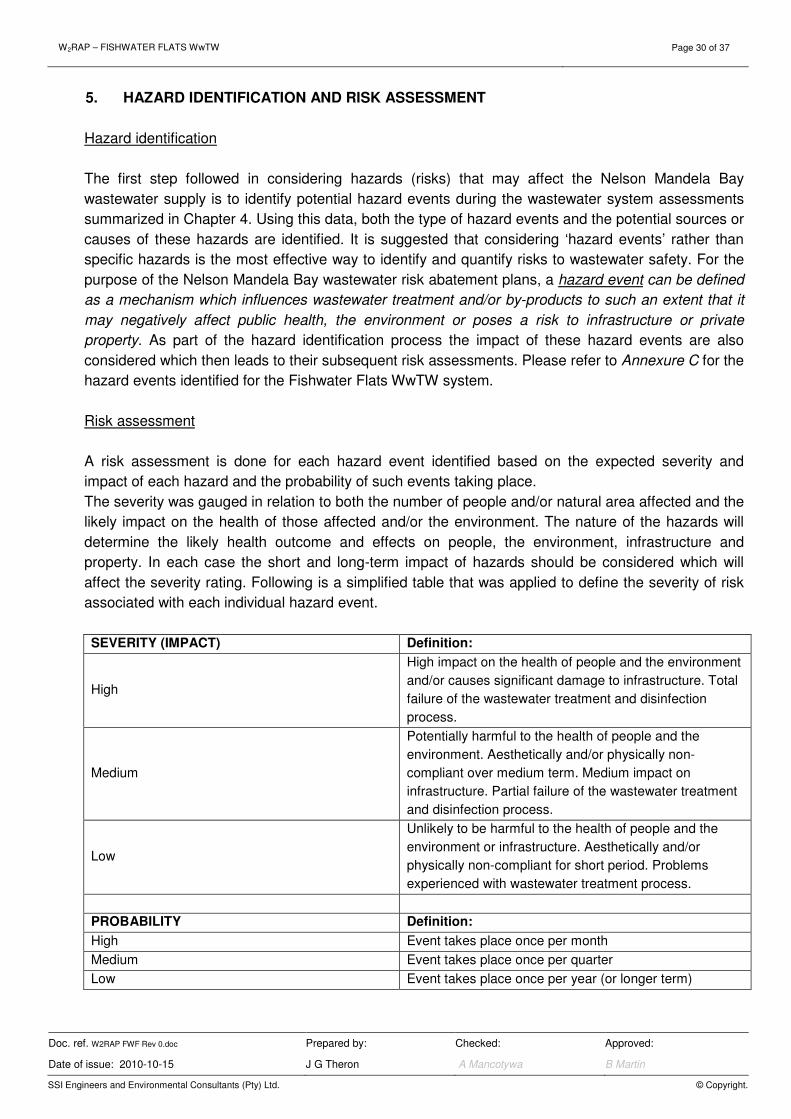
A risk assessment is done for each hazard event identified based on the expected severity and
impact of each hazard and the probability of such events taking place.
The severity was gauged in relation to both the number of people and/or natural area affected and the
likely impact on the health of those affected and/or the environment. The nature of the hazards will
determine the likely health outcome and effects on people, the environment, infrastructure and
property. In each case the short and long-term impact of hazards should be considered which will
affect the severity rating. Following is a simplified table that was applied to define the severity of risk
associated with each individual hazard event.
SEVERITY (IMPACT) Definition:
High
High impact on the health of people and the environment
and/or causes significant damage to infrastructure. Total
failure of the wastewater treatment and disinfection
process.
Medium
Potentially harmful to the health of people and the
environment. Aesthetically and/or physically non-
compliant over medium term. Medium impact on
infrastructure. Partial failure of the wastewater treatment
and disinfection process.
Low
Unlikely to be harmful to the health of people and the
environment or infrastructure. Aesthetically and/or
physically non-compliant for short period. Problems
experienced with wastewater treatment process.
PROBABILITY Definition:
High Event takes place once per month
Medium Event takes place once per quarter
Low Event takes place once per year (or longer term)
W2RAP – FISHWATER FLATS WwTW Page 31 of 37
Doc. ref. W2RAP FWF Rev 0.doc Prepared by: Checked: Approved:
Date of issue: 2010-10-15 J G Theron A Mancotywa B Martin
SSI Engineers and Environmental Consultants (Pty) Ltd. © Copyright.
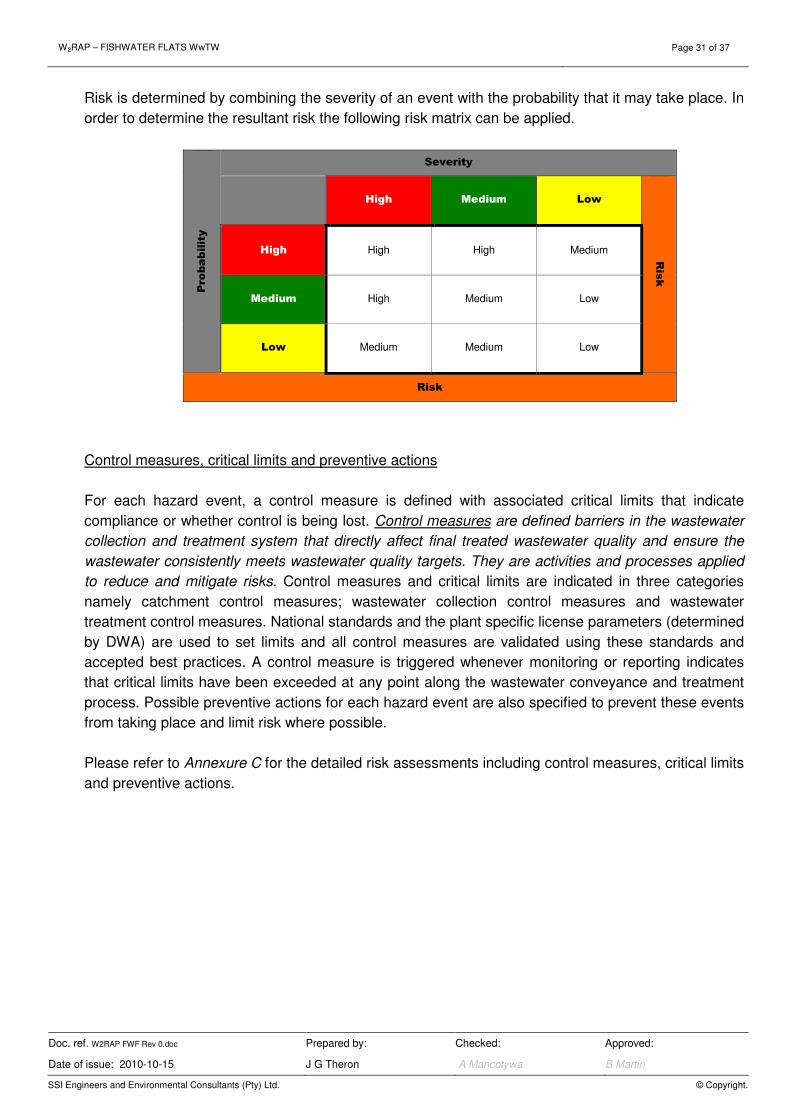
Risk is determined by combining the severity of an event with the probability that it may take place. In
order to determine the resultant risk the following risk matrix can be applied.
Probability
Severity
High Medium Low
Risk
High High High Medium
Medium High Medium Low
Low Medium Medium Low
Risk
Control measures, critical limits and preventive actions
For each hazard event, a control measure is defined with associated critical limits that indicate
compliance or whether control is being lost. Control measures are defined barriers in the wastewater
collection and treatment system that directly affect final treated wastewater quality and ensure the
wastewater consistently meets wastewater quality targets. They are activities and processes applied
to reduce and mitigate risks. Control measures and critical limits are indicated in three categories
namely catchment control measures; wastewater collection control measures and wastewater
treatment control measures. National standards and the plant specific license parameters (determined
by DWA) are used to set limits and all control measures are validated using these standards and
accepted best practices. A control measure is triggered whenever monitoring or reporting indicates
that critical limits have been exceeded at any point along the wastewater conveyance and treatment
process. Possible preventive actions for each hazard event are also specified to prevent these events
from taking place and limit risk where possible.
Please refer to Annexure C for the detailed risk assessments including control measures, critical limits
and preventive actions.
W2RAP – FISHWATER FLATS WwTW Page 32 of 37
Doc. ref. W2RAP FWF Rev 0.doc Prepared by: Checked: Approved:
Date of issue: 2010-10-15 J G Theron A Mancotywa B Martin
SSI Engineers and Environmental Consultants (Pty) Ltd. © Copyright.
6. CRITICAL CONTROL POINTS
Critical control points are established once the hazard identification and risk assessments have been
completed. Critical control points (CCP’s) are defined as points along the wastewater collection and
treatment chain where monitoring and/or interventions can have a significant impact on the quality of
wastewater. The critical control points should be positioned to act as a multiple barrier protection
system which can be activated during the detection of a hazard event. This provides the ability to
locate, isolate and mitigate a specific problem to stop it from escalating in order to ensure safe
wastewater.
Typical CCP’s include wastewater pumping stations, screening chambers, industry
discharge/connection points, inlet screens, penstocks, primary settlement tanks, aeration basin
(aerators), secondary settlement tanks, chlorine contact tanks and storm tank overflow & discharge,
sludge pumping stations, sludge stabilization and dewatering. The location and description of critical
control points are clearly identified in Annexure C.
7. WASTEWATER QUALITY CONTROL
In order to effectively manage the performance of the W2RAP it is essential to optimize
wastewater treatment systems to ensure that wastewater quality standards are met on a
sustained basis. The World Health Organization (WHO) prescribes three procedures to achieve
this namely; by setting wastewater quality limits, development of a monitoring program and
implementing control measures as a multiple barrier protection. These together with up-to-date
operating manuals and procedures are used to ensure that safe wastewater and by-products are
produced by all of Nelson Mandela Bay’s wastewater treatment facilities.
7.1 Wastewater quality limits
Wastewater quality limits are required at each operational control point in the wastewater
treatment process. The purification of wastewater at all the Nelson Mandela Bay wastewater
treatment facilities comprises of a series of steps with an incremental improvement in the
wastewater quality. Operational control points and limits are set at each of these steps where the
quality can be controlled. The wastewater treatment limits of the final wastewater, which is the
most important, need to comply with the specific treatment facility’s license conditions issued by
DWA.
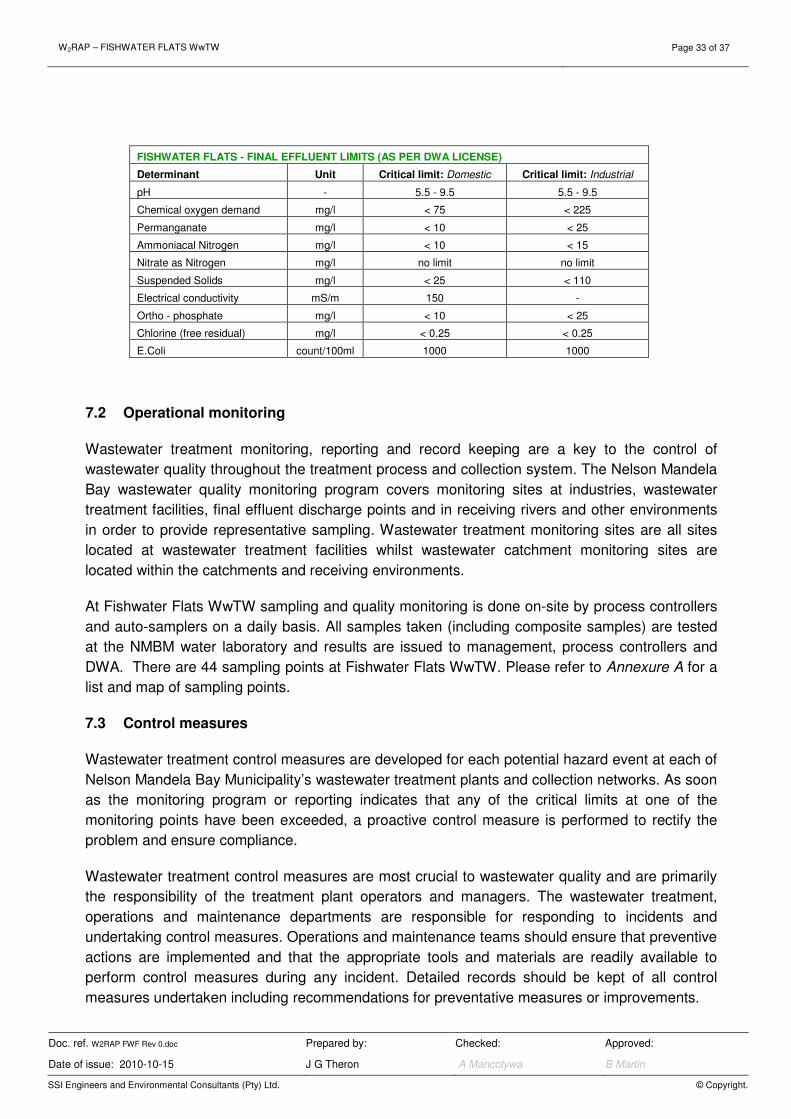
Fishwater Flats WwTW has to separate permits to discharge wastewater effluent from its
domestic and industrial streams as follows. An updated license application will be submitted for
the proposed upgrade and combination of these two streams. Critical limits not indicated are not
prescribed in the plant’s license, but measured to conform to best practices and water reuse
requirements.
W2RAP – FISHWATER FLATS WwTW Page 33 of 37
Doc. ref. W2RAP FWF Rev 0.doc Prepared by: Checked: Approved:
Date of issue: 2010-10-15 J G Theron A Mancotywa B Martin
SSI Engineers and Environmental Consultants (Pty) Ltd. © Copyright.
FISHWATER FLATS - FINAL EFFLUENT LIMITS (AS PER DWA LICENSE)
Determinant Unit Critical limit: Domestic Critical limit: Industrial
pH - 5.5 - 9.5 5.5 - 9.5
Chemical oxygen demand mg/l < 75 < 225
Permanganate mg/l < 10 < 25
Ammoniacal Nitrogen mg/l < 10 < 15
Nitrate as Nitrogen mg/l no limit no limit
Suspended Solids mg/l < 25 < 110
Electrical conductivity mS/m 150 -
Ortho - phosphate mg/l < 10 < 25
Chlorine (free residual) mg/l < 0.25 < 0.25
E.Coli count/100ml 1000 1000
7.2 Operational monitoring
Wastewater treatment monitoring, reporting and record keeping are a key to the control of
wastewater quality throughout the treatment process and collection system. The Nelson Mandela
Bay wastewater quality monitoring program covers monitoring sites at industries, wastewater
treatment facilities, final effluent discharge points and in receiving rivers and other environments
in order to provide representative sampling. Wastewater treatment monitoring sites are all sites
located at wastewater treatment facilities whilst wastewater catchment monitoring sites are
located within the catchments and receiving environments.
At Fishwater Flats WwTW sampling and quality monitoring is done on-site by process controllers
and auto-samplers on a daily basis. All samples taken (including composite samples) are tested
at the NMBM water laboratory and results are issued to management, process controllers and
DWA. There are 44 sampling points at Fishwater Flats WwTW. Please refer to Annexure A for a
list and map of sampling points.
7.3 Control measures
Wastewater treatment control measures are developed for each potential hazard event at each of
Nelson Mandela Bay Municipality’s wastewater treatment plants and collection networks. As soon
as the monitoring program or reporting indicates that any of the critical limits at one of the
monitoring points have been exceeded, a proactive control measure is performed to rectify the
problem and ensure compliance.
Wastewater treatment control measures are most crucial to wastewater quality and are primarily
the responsibility of the treatment plant operators and managers. The wastewater treatment,
operations and maintenance departments are responsible for responding to incidents and
undertaking control measures. Operations and maintenance teams should ensure that preventive
actions are implemented and that the appropriate tools and materials are readily available to
perform control measures during any incident. Detailed records should be kept of all control
measures undertaken including recommendations for preventative measures or improvements.
W2RAP – FISHWATER FLATS WwTW Page 34 of 37
Doc. ref. W2RAP FWF Rev 0.doc Prepared by: Checked: Approved:
Date of issue: 2010-10-15 J G Theron A Mancotywa B Martin
SSI Engineers and Environmental Consultants (Pty) Ltd. © Copyright.
8. VERIFICATION
Verification of on-site wastewater treatment monitoring is performed by the Nelson Mandela Bay
Municipality’s Laboratory Services. The Laboratory Services unit is also responsible for the
wastewater catchment monitoring which takes place at rivers, industries and throughout the
wastewater reticulation network with sampling and monitoring taking place periodically. The
Nelson Mandela Bay wastewater laboratory is currently part of a SABS Proficiency Scheme and
also registered with the National Laboratories association. The record keeping of wastewater
treatment monitoring is done by Laboratory Services and issue to operational staff on a daily
basis.
W2RAP – FISHWATER FLATS WwTW Page 35 of 37
Doc. ref. W2RAP FWF Rev 0.doc Prepared by: Checked: Approved:
Date of issue: 2010-10-15 J G Theron A Mancotywa B Martin
SSI Engineers and Environmental Consultants (Pty) Ltd. © Copyright.
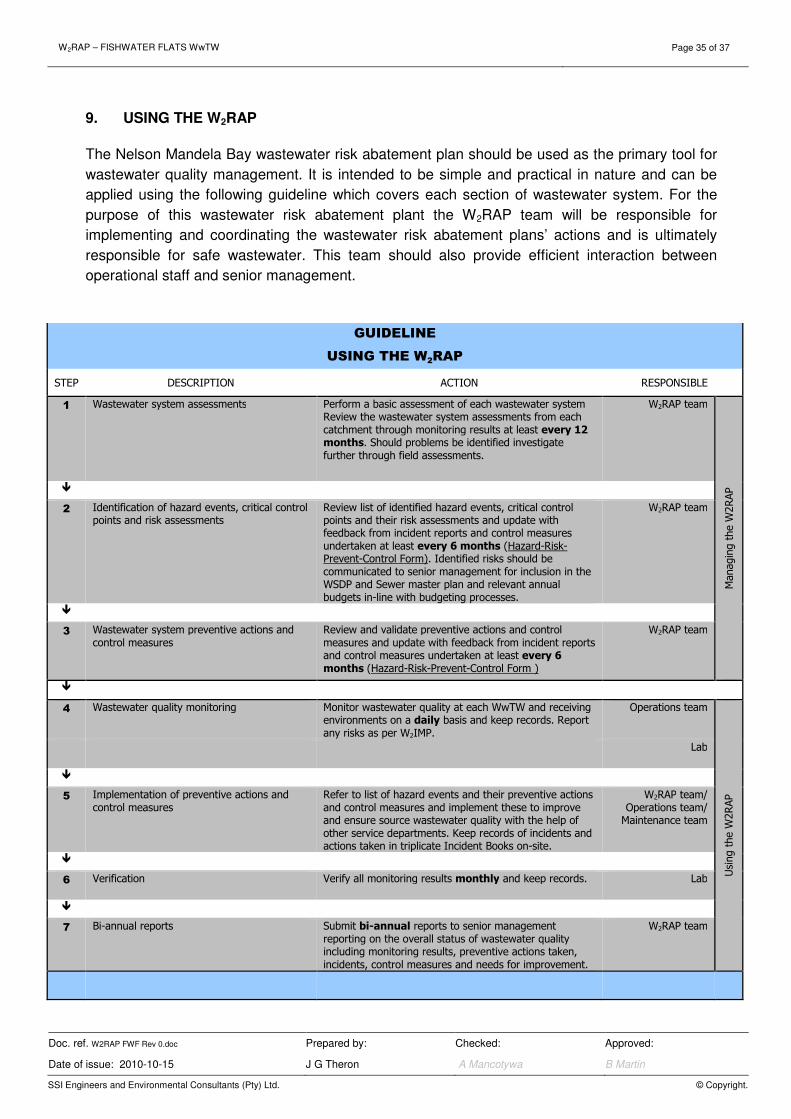
9. USING THE W2RAP
The Nelson Mandela Bay wastewater risk abatement plan should be used as the primary tool for
wastewater quality management. It is intended to be simple and practical in nature and can be
applied using the following guideline which covers each section of wastewater system. For the
purpose of this wastewater risk abatement plant the W2RAP team will be responsible for
implementing and coordinating the wastewater risk abatement plans’ actions and is ultimately
responsible for safe wastewater. This team should also provide efficient interaction between
operational staff and senior management.
GUIDELINE
USING THE W2RAP
STEP DESCRIPTION ACTION RESPONSIBLE
1 Wastewater system assessments Perform a basic assessment of each wastewater system Review the wastewater system assessments from each catchment through monitoring results at least every 12 months. Should problems be identified investigate further through field assessments.
W2RAP team
Ma
na
gin
g t
he
W2
RA
P �
2 Identification of hazard events, critical control points and risk assessments
Review list of identified hazard events, critical control points and their risk assessments and update with feedback from incident reports and control measures undertaken at least every 6 months (Hazard-Risk-Prevent-Control Form). Identified risks should be communicated to senior management for inclusion in the WSDP and Sewer master plan and relevant annual budgets in-line with budgeting processes.
W2RAP team
�
3 Wastewater system preventive actions and control measures
Review and validate preventive actions and control measures and update with feedback from incident reports and control measures undertaken at least every 6 months (Hazard-Risk-Prevent-Control Form )
W2RAP team
�
4 Wastewater quality monitoring Monitor wastewater quality at each WwTW and receiving environments on a daily basis and keep records. Report any risks as per W2IMP.
Operations team
Usi
ng
th
e W
2R
AP
Lab
�
5 Implementation of preventive actions and control measures
Refer to list of hazard events and their preventive actions and control measures and implement these to improve and ensure source wastewater quality with the help of other service departments. Keep records of incidents and actions taken in triplicate Incident Books on-site.
W2RAP team/ Operations team/
Maintenance team
�
6 Verification Verify all monitoring results monthly and keep records. Lab
�
7 Bi-annual reports Submit bi-annual reports to senior management reporting on the overall status of wastewater quality including monitoring results, preventive actions taken, incidents, control measures and needs for improvement.
W2RAP team
W2RAP – FISHWATER FLATS WwTW Page 36 of 37
Doc. ref. W2RAP FWF Rev 0.doc Prepared by: Checked: Approved:
Date of issue: 2010-10-15 J G Theron A Mancotywa B Martin
SSI Engineers and Environmental Consultants (Pty) Ltd. © Copyright.
9.1 Communication & management procedures
Clear and structured communication is crucial to the success of the wastewater risk abatement
plan. The lines of communication which should be followed are indicated as part of the
Wastewater Incident Management Protocol (W2IMP) – Please refer to Annexure C. This
communication protocol will be further developed and formalized during the implementation of the
wastewater safety plan.
9.2 Documentation & record keeping
Documentation and record keeping as per existing NMBM procedures.
9.3 Implementation program
The NMBM W2RAPs is currently being developed and implemented on all plants. Developments
of the plans are expected to be complete by January 2011, at which time implementation will start
immediately.
W2RAP – FISHWATER FLATS WwTW Page 37 of 37
Doc. ref. W2RAP FWF Rev 0.doc Prepared by: Checked: Approved:
Date of issue: 2010-10-15 J G Theron A Mancotywa B Martin
SSI Engineers and Environmental Consultants (Pty) Ltd. © Copyright.
10. ANNEXURE
(A) Maps & Layouts
(B) Hazard-Risk-Prevent-Control
(C) Wastewater Incident Management Protocol
(D) Reference documents