Embed Size (px)
Citation preview
WMRC ReportsWaste Management and Research Center
Microlubrication inMetal MachiningOperations
Machining XcellenceA division of TechSolve, Inc.
RR-96July 2002
Electronic Version E

About WMRC’s Electronic Publications:
This document was originally published in a traditional format.
It has been transferred to an electronic format to allow faster and broader access to importantinformation and data.
While the Center makes every effort to maintain a level of quality during the transfer from printto digital format, it is possible that minor formatting and typographical inconsistencies will stillexist in this document.
Additionally, due to the constraints of the electronic format chosen, page numbering will varyslightly from the original document.
The original, printed version of this document may still be available.
Please contact WMRC for more information:
WMRCOne E. Hazelwood DriveChampaign, IL 61820217-333-8940 (phone)
www.wmrc.uiuc.edu
WMRC is a division of theIllinois Department of NaturalResources
RR-96
Microlubrication in Metal
Machining Operations
Machining Xcellence A division of TechSolve, Inc.
Cincinnati, Ohio
July 2002
Submitted to The Illinois Waste Management and Research Center
One E. Hazelwood Dr. Champaign, IL 61820 www.wmrc.uiuc.edu
Printed by the Authority of the State of Illinois 2002/50

This report is part of WMRC’s Research Report Series. Mention of tradenames or commercial products does not constitute endorsement orrecommendation for use.
This report was prepared by
Machining Xcellence
A division of
TechSolve, Inc.
For further information contact:
Thomas F. McClure Manager, Fluid Business
(513) 948-2006
e-mail: [email protected]
Microlubrication in Metal Machining Operations Report # 320-889-302
Page 1 of 126
Microlubrication in Metal Machining Operations
ABSTRACT Spent metal removal fluid (cutting fluid, lubricant, coolant, etc.) is a significant waste stream from the metal fabrication industry. The quantity of waste generated and the cost of fluid purchases could be reduced by microlubrication (minimum quantity lubrication, mist lubrication) methods of fluid delivery. In microlubrication, a fine cutting fluid mist is used, rather than the traditional method of flooding the cutting tool – workpiece interface. The metal fabrication industry is concerned that the use of microlubrication might reduce tool life negatively impacting production and increasing manufacturing costs. The purpose of this research was to compare the performance (tool life) of cutting tools lubricated and cooled using microlubrication with that of cutting tools lubricated and cooled using traditional flood application. The performance difference identified is used to calculate and compare the economic impact of microlubrication versus flood application. Discussion is also presented comparing the effect of microlubrication and flood application on the cost of fluid purchased and disposal. Also recognizing that metal removal fluid mist is coming under increased scrutiny as a potential health hazard, TechSolve, Incorporated enlisted the assistance of Division of Applied Research and Technology of the National Institute for Occupational Safety and Health (NIOSH) to investigate and compare mist levels generated during machining with microlubrication and flood application. Their report is presented in Appendix 3.
Microlubrication in Metal Machining Operations Report # 320-889-302
Page 2 of 126
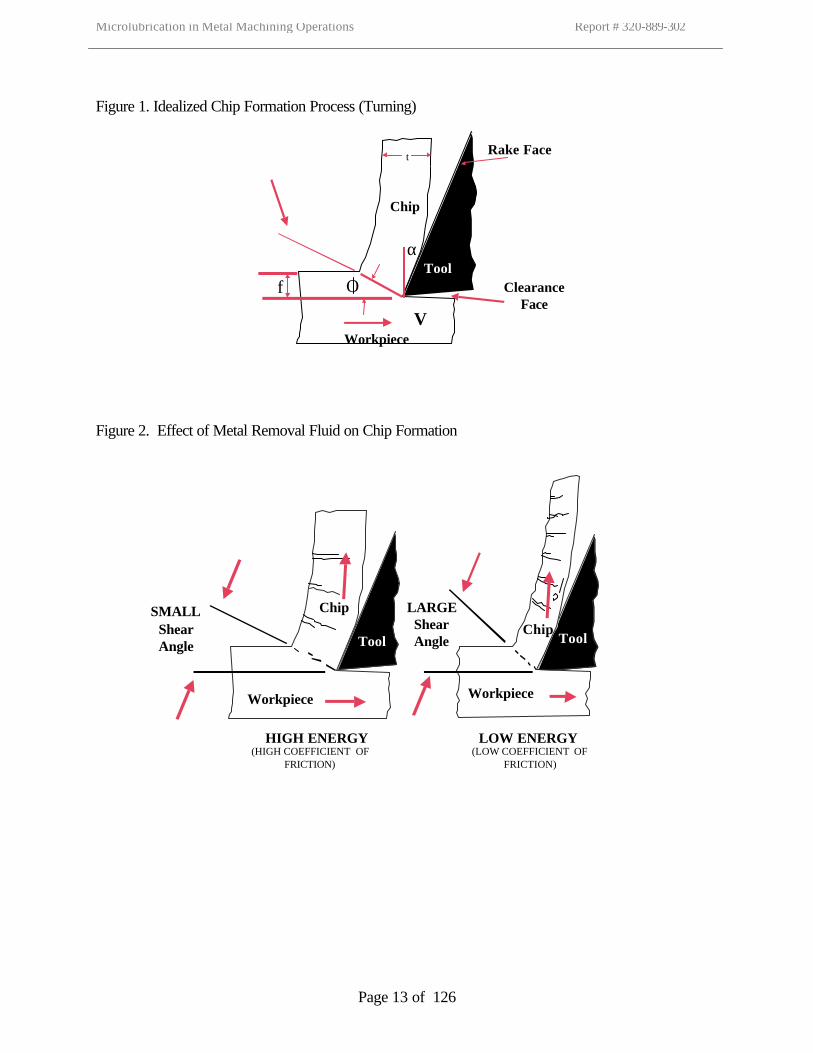
Microlubrication in Metal Machining Operations INTRODUCTION For over 150 years, the metal fabrication industry has been applying one form or another of metal removal fluid to the cutting tool – workpiece material interface during the machining process. The primary reason for this application is one of simple economics. It has been well established that the use of metal removal fluid prolongs cutting tool life, allowing one to maximize the number of parts or features produced prior to replacing the tool or allowing one to operate the machine tool at higher machining conditions producing parts or features more quickly at the same cutting tool life. The use of a metal removal fluid reduces power consumption compared with machining dry (no metal removal fluid). Metal removal fluids also provide the workpiece with short-term protection against corrosion. Finally, metal removal fluids flush chips and swarf (debris resulting from grinding operations) away from the cut zone and off the machine tool so they can be captured and disposed. In order to understand the role of the metal removal fluid in a machining operation, one must understand the process of chip formation. A simple two-dimensional representation of idealized chip formation is shown in Figure 1. Chip formation can be approximated by the shearing and sliding of a series of deformed layers of metal. The region where this shearing takes place is known as the shear plane. The sheared metal then slides over the rake face of the cutting tool.
In addition to the machined part and chip, one of the primary products of the chip formation process is thermal energy or heat. Temperatures at the cut edge are usually in the range of 260o to 480oC (500o to 800o F) for high speed steel tools and 420o to 650oC (800o to 1200o F) for carbide tools. A metal removal fluid properly applied to the cut zone absorbs the heat and carries it away. During machining, the temperature depends upon the balance between the rate at which heat is generated and the rate the heat is dissipated. As such, it is easy to understand why many on the manufacturing floor refer to metal removal fluids as “coolants”. The rubbing action, or friction of the chip as it moves across the rake face of the tool, also generates heat, although to a lesser degree than the chip formation process. Additional heat is generated as a result of the friction between the tool flank and the cut surface. If this friction is reduced, these amount of heat generated is also reduced. The traditional way of reducing friction is to apply a lubricant to the cut zone. In addition to lowering the friction at the chip-tool-workpiece interface, the addition of a lubricant affects the amount of heat generated during chip formation process. The amount of heat produced in the shear zone depends on the size of the shear angle. If the shear angle is small, then the plane in which deformation takes place (the shear zone) extends a considerable distance ahead of the tool. The result is a short, thick chip and considerable heat. If the shear angle is large, the shear path is short and the result is a longer, thinner chip. This type of cut generates less heat. Application of a metal removal fluid reduces the friction between the chip and tool effectively increasing the shear angle and reducing heat. This effect is demonstrated in Figure 2. Reducing friction and removing heat from the chip-tool-workpiece interface prolong the operational lifetime of the cutting tool. Tool life is a function of the workpiece material, tool material, tool design, machining
Microlubrication in Metal Machining Operations Report # 320-889-302
Page 3 of 126
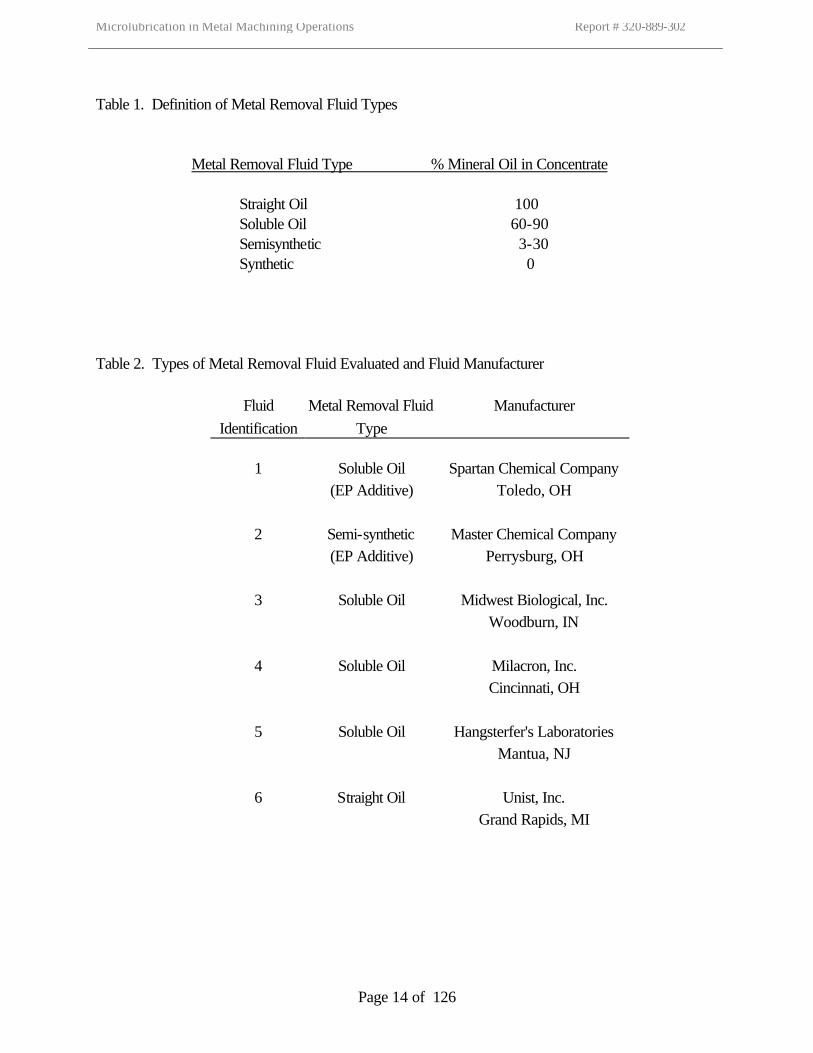
conditions, and chip-tool-workpiece temperature. As we will demonstrate later, cutting tool life and the selected machining conditions impact the overall cost and productivity of the machining operation. It should be noted that there are typically four types of metal removal fluids. These are straight oils, soluble oils, semisynthetics, and synthetics. Soluble oils, semisynthetics, and synthetics are mixed with water to form the metal removal fluid. The amount of mineral oil present in the fluid concentrate is usually used to differentiate between the fluid types. Presented in Table 1 is a general industry accepted definition of the four types of metal removal fluids. For the purposes of this research, straight oil, soluble oil and semisynthetic products were evaluated. Traditionally, metal removal fluids have been applied by flood application. Depending upon the size of the machine tool, workpiece, and machining operations, low pressure pumps (<50 psi) have supplied metal removal fluids at flow rates ranging from 2 to 10 gallons per minute. This has required that each machine tool have a metal removal fluid sump ranging in size from 10 gallons to 500 gallons. Additionally, filters and filtration systems have been added to machine tools to insure metal removal filter cleanliness prior to introduction into the pumps and metal cutting zone. As these filters become clogged, they require replacements thus increasing overall maintenance costs. In medium to large facilities, there has been a trend to centralize the coolant system and supply the machine tools with metal removal fluid from one large system. These “central systems” range in size from 200 gallons to 80,000 gallons. The central systems also require filters and have the same potential for increased maintenance costs as the individual sumps. The requirement to store an adequate supply of metal removal fluid to supply the machine tool creates a number of additional problems. Hydraulic and way oils used to actuate the machine tool often leak into the metal removal fluid. This, coupled with bacterial contamination of the metal removal fluid from a variety of different sources, may lead to the degradation of the fluid resulting in rancidity. In 1997, as part of a grant received from the United States Environmental Protection Agency, TechSolve, Inc. surveyed small to medium-sized machining organizations located throughout the United States. The results of this survey identified fluid rancidity as one of two most common reasons for metal removal fluid replacement and disposal. The second most common reason was that it was scheduled. In the last forty years as federal, state, and local regulation of the environment and employee health has increased, the costs associated with the use of metal removal fluids have also risen. Spent cutting fluids may be classified as hazardous waste requiring manifesting and proper disposal. Costs associated with this type of disposal are reported to range between $0.50 / gallon to $12.00 / gallon. As a result, metal removal fluid users have initiated fluid maintenance programs designed to extend the operational lives of their metal removal fluids. A study conducted by Daimler Benz in Germany in the mid 1980’s identified the purchase, maintenance, and disposal of metal removal fluids as contributing 16% of their overall manufacturing costs.1 . The aforementioned TechSolve survey attempted to capture the costs associated with metal removal fluid purchase, mixing, maintaining, and disposal. Based on the results of this survey, TechSolve estimates that an average machining facility using 500 gallons of metal removal fluid concentrate per year (approximate cost $5,000) spends a grand total of $57,000 to purchase, use, and dispose of the fluid. 2 1 P. Johanssen, “Null Losung”, Mercedes Benz will Kuhlhlscherstoff reuzueren. Industrie Anzeiger 2 Pollution Prevention Guide to Using Metal Removal Fluids in Machining Operations, TechSolve, Inc. Cincinnati, OH,
Microlubrication in Metal Machining Operations Report # 320-889-302
Page 4 of 126
Due to these increased costs, commercially available technologies have been developed and are constantly emerging that reduce or eliminate the use of metal removal fluids in machining operations. One such promising technology is microlubrication, also known as minimum quantity lubrication (MQL) or mist lubrication. Microlubrication administers traditional metal removal fluids (oil and water miscible) at very low levels (0.02 gallons/min or lower). These are once-through systems so there is no need to collect the applied fluid. As a result, there is no direct waste stream. Small amounts of the metal removal fluid will adhere to the workpiece, machine tool, and cutting tool that will supply short term corrosion protection. Microlubrication offers substantial reduction in metal removal fluid usage, subsequently reducing the amount of metal removal fluid disposed and thereby minimizing environmental damage. Additionally, the low volume system minimizes the need for metal removal fluid sumps and low pressure pumps. Finally, the once through nature of fluid application may eliminate the need for fluid and filtration system maintenance. However, traditionally, the reduced use of metal removal fluid in machining operations has resulted in lower tool life, increased tooling costs, and lowered productivity. While its is generally thought that microlubrication systems can supply excellent lubrication, there is some concern as to its ability to provide acceptable cooling. With reduced cooling, temperatures in the cutting zone increase causing rapid tool wear and, in some materials, thermal damage to the workpiece. Reducing the cutting speed and material removal rate can lower the temperature to an acceptable level. However, this also reduces productivity. For many manufacturers, this is an unacceptable compromise. The manufacturers must be convinced that, for a particular application, the benefits and savings from microlubrication will not be overshadowed by the possibility of increased tool cost and lower productivity. One of the goals of this research was to identify the performance difference, primarily tool life, of cutting tools lubricated and cooled by microlubrication and flood application in typical machining operations (milling and drilling). At the request of the Illinois Waste Management and Research Center Proposal Review committee, TechSolve Inc.’s original proposal was modified to investigate the difference in mist levels generated during microlubrication and flood application-assisted machining. In recent years, the metal removal fluid mist generated during machining has come under increasing scrutiny. These mists and the metal removal fluid themselves are potential health hazards. In 1997, the United States Occupational Health and Safety Administration (OSHA) convened a standards advisory committee. The purpose of this committee was “to investigate the need for and/or recommend, if appropriate, a standard, guideline or other appropriate response to the health effects, if any, that result in material impairment to workers occupationally exposed to metal removal fluids.”3 The standards advisory committee found that exposure to metal removal fluids may result in asthma, hypersensitivity pneumonitis, other respiratory disorders and dermatitis. The committee also recognized that there were other health conditions, including cancer, related to metal removal fluid exposure, for which the evidence is still evolving. The standards advisory committee recommended that OSHA adopt a permissible exposure limit of 0.4mg/m3 thoracic or 0.5 mg/m3 total particulate. While it is unclear as to when and if OSHA will act on this recommendation, it is clear that any application system generating significant quantities of metal removal fluid might find difficulties gaining widespread application and acceptance.
pp 7, (2000). 3 Howell, John, “Responding to OSHA’s Possible Regulation on Metal Working Fluids: Using the ORC Guide,” Proceedings of Gorham Conference, “Coolants and Lubricants for Metal Cutting and Grinding’”Chicago ,IL (2000).
Microlubrication in Metal Machining Operations Report # 320-889-302
Page 5 of 126
In an attempt to comply with the Illinois Waste Management and Research Center Proposal Review committee’s recommendation, TechSolve, Inc. enlisted the assistance of the Division of Applied Research and Technology of the National Institute of Occupational Safety and Health (NIOSH). The Division of Applied Research and Technology conducted experiments measuring mist levels generated during machining with microlubrication and flood application of metal removal fluids. A separate report detailing their findings is presented in Appendix 3. EVALUATION PROCEDURES The test methods used to evaluate the differences in performances between cutting tools lubricated and cooled using microlubrication and flood application are published in the Pollution Prevention Guide to Using Metal Removal Fluids in Machining Operations.4 Summaries of the test methods are reproduced here for the convenience of the reader. The International Working Industry Group developed these methods. This group is an association of over sixty organizations involved in the production, use, maintenance, and research of metal removal fluids. The original proposal called for testing of the application systems in three machining operations - drilling, milling, and turning. Drilling and milling were accomplished using the same machine tool. Turning required the use of a different machine tool. The design, construction, and installation of the mist collection system for the lathe used in the turning study proved quite complex and, therefore, time consuming. Based on this, a decision was made not to investigate the effect of microlubrication in turning operations. Metal Removal Fluid and Fluid Application Presented in Table 2 is a list of the types of metal removal fluids used in this test program as well as their manufacturers. In fairness to the manufacturers, the products submitted are not identified. TechSolve wishes to thank these companies for donating the metal removal fluids used in this test program. The water miscible metal removal fluids (Fluids 1-5) were diluted with Cincinnati tap water to a concentration of 7% by volume. The appropriate amounts of these solutions were poured into the delivery systems for application. TechSolve, Inc. also wishes to thank Unist, Inc. for the donation of its Coolubricator System Model # 25034. This three nozzle system was the only mist application system used in this research. The three nozzles were positioned approximately every 120o around the cutting tool. The Coolubricator System delivered fluid to the cut zone at a flow rate of .0029 gallons/minute (.010 liters/minute) The Tongil TNV 80 CNC vertical machining center is equipped with a thirteen gallon coolant sump. The metal removal fluid is delivered from the sump to the cut zone through a 0.5 horsepower pump at a flow rate of 1.7 gallons/minute ( 6.5 liters/minute).
4 Pollution Prevention Guide to Using Metal Removal Fluids in Machining Operations, TechSolve, Inc. Cincinnati, OH, pp 61, (2000).
Microlubrication in Metal Machining Operations Report # 320-889-302
Page 6 of 126
All tests (flood and microlubrication) were performed before switching to a different fluid. Within the fluid itself, the microlubrication and flood fluid application methods were conducted in pairs. The order of the pairs was randomized and each pair was completed on the same day. Completing each pair on the same day and randomizing the fluid application method minimized the effect of variations in the environmental conditions of the testing laboratory. Drilling Test Procedure The IWIG drilling test measures the effect of metal removal fluids on the tool life of uncoated, high speed steel drills during drilling of AISI/SEA 4340. For purposes of this evaluation, tool life is defined as the number of holes drilled before the test drill demonstrates a thrust cutting force of 535 lbs. Experimentation has shown this thrust force, in most cases, approximately corresponds to a uniform drill wear of 0.010 inch. The IWIG drilling test procedures require 5 repetitions of the milling tests for each fluid
Workpiece : AISI/SAE 4340 pre-hardened alloy steel; HRC ~32 (6 x 6 x 1.25in) Tool : ½ inch diameter 1350 split point oxide coated HSS drill, Speed : 55 sfpm Feed : 0.007 ipr Hole : 1-inch deep blind hole (pilot holes were not drilled)
All the tests were conducted using the Tongil TNV 80 CNC vertical machining center located in the M Eugene Merchant Machining Laboratory of TechSolve, Inc. The holes were drilled in AISI/SAE 4340 steel plates. The metal removal forces (thrust) and tool wear were measured at regular intervals until the uniform flank wear reached 0.010 inch or corner drill-wear reached 0.015 inch. Catastrophic tool failure superseded all the other end of life criteria and resulted in the immediate suspension of the test. End Milling Test Procedure The IWIG end milling test measures the effect of metal removal fluids on the tool life of uncoated carbide inserts during end milling of AISI/SEA 4140 steel. For purposes of this evaluation, tool life is defined as the number of milling passes the insert experiences before it demonstrates a resultant cutting force of 75 lbs. Experimentation has shown this resultant force, in most cases, approximates an insert uniform wear of 0.010 inch. The IWIG end milling test procedures require 5 repetitions of the milling tests for each fluid. All the tests were conducted using the Tongil TNV 80 CNC vertical machining center located in the M Eugene Merchant Machining Laboratory of TechSolve, Inc. The following machining conditions were used for this evaluation:
Workpiece : AISI/SAE 4140 steel plate; HRC 24-26 (12 x 4 x 0.5 in.), Tools : 1-inch diameter inserted end-mill cutter body (RA215.44-25MN25-15C)
Uncoated carbide inserts (R215.44-15T308-AAM; grade: SM-30) Speed : 400 sfpm Feed Rate : 0.005 ipt
Microlubrication in Metal Machining Operations Report # 320-889-302
Page 7 of 126
Depth of cut : Axial – 0.5 inch; Radial – 0.06 inch Length of Cut : 4 inch/pass
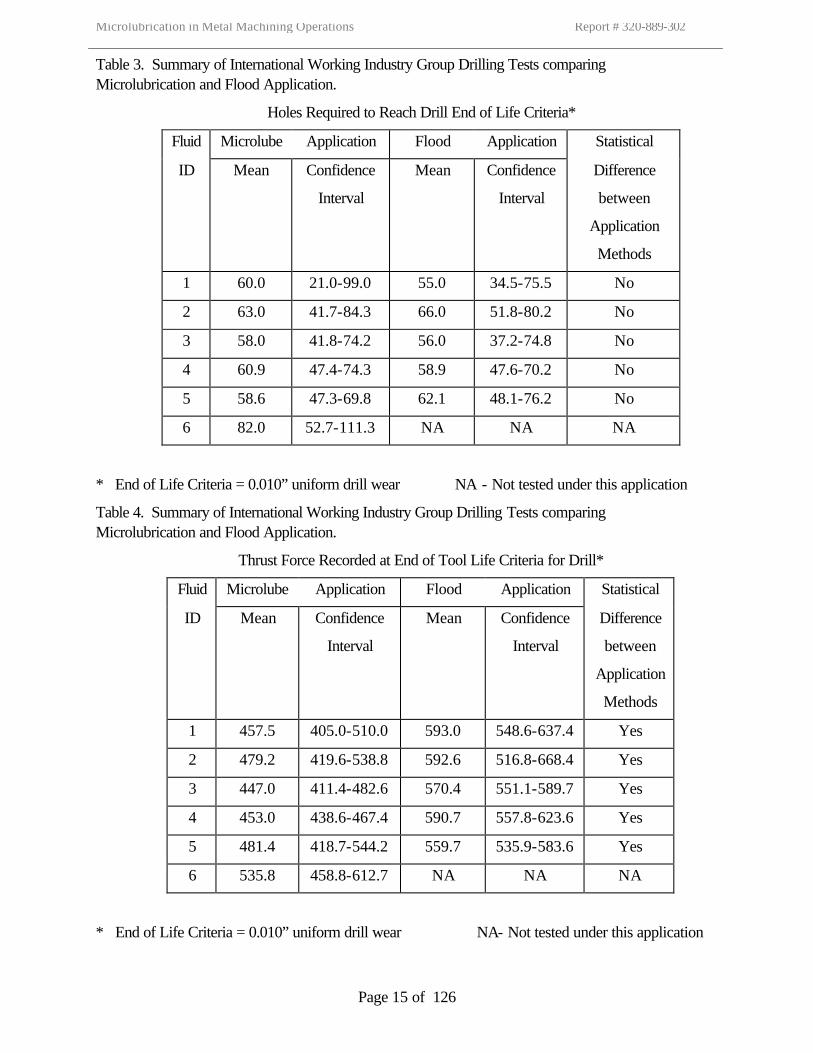
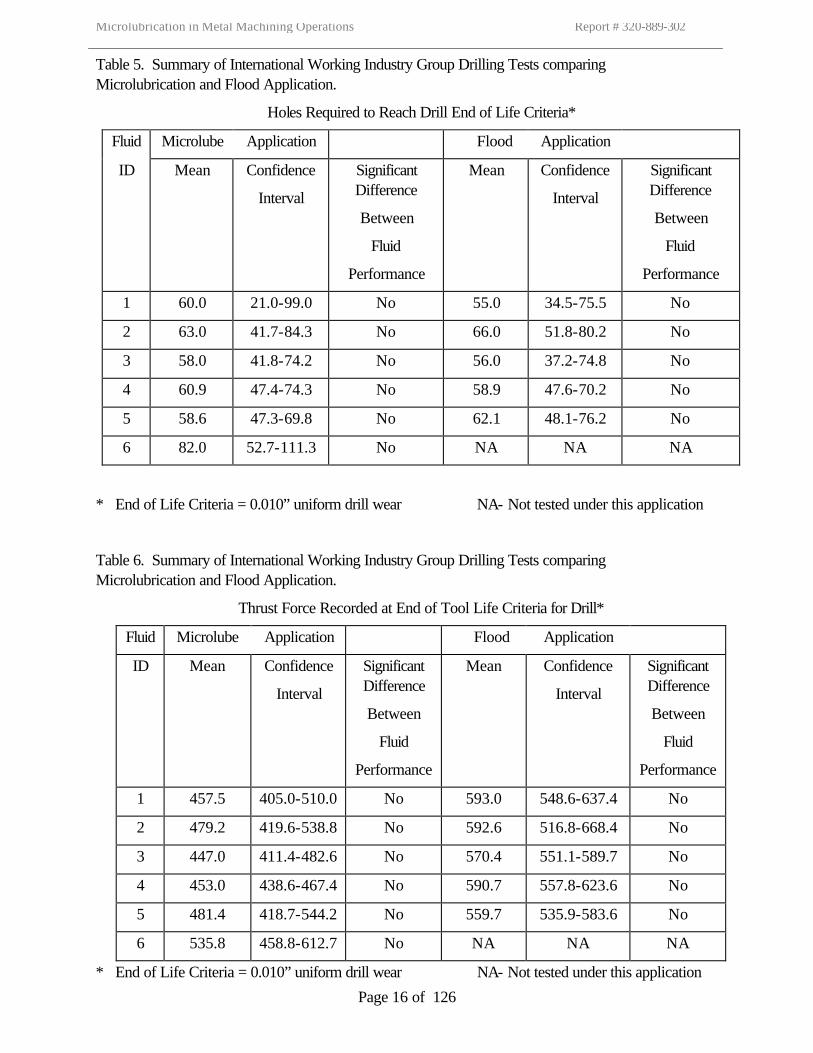
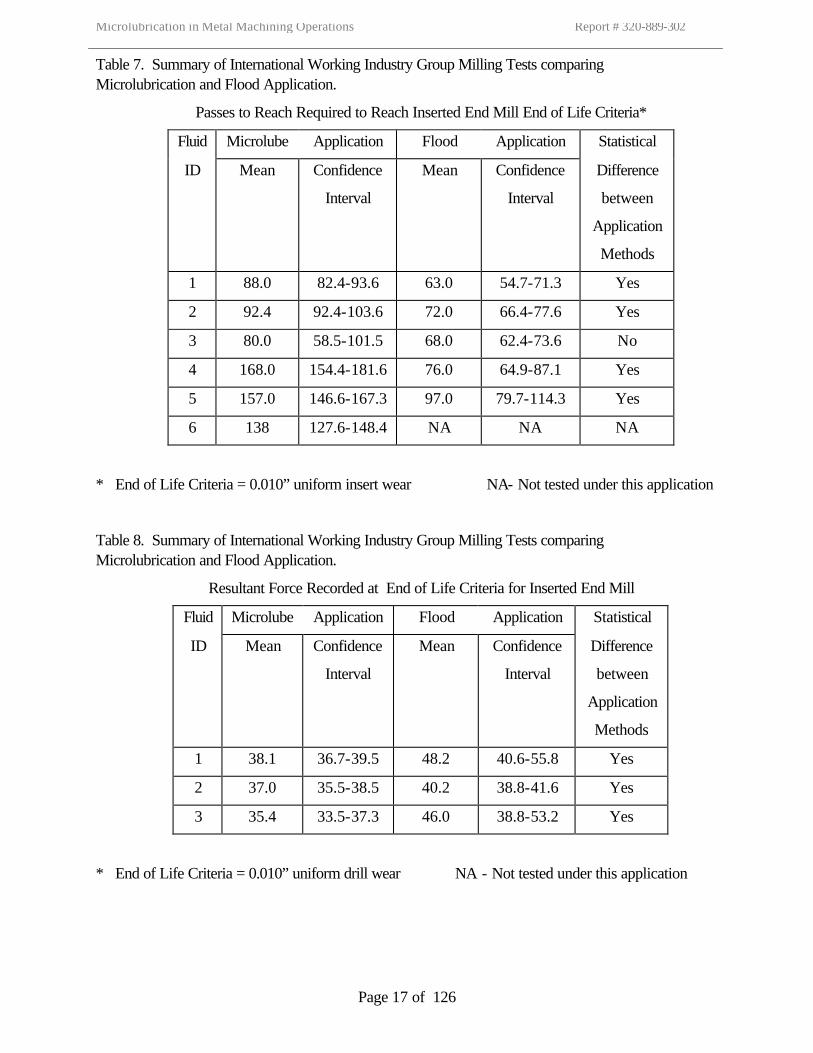
While end-milling AISI/SAE 4140 steel plates, the metal removal forces and tool wear were measured at regular intervals until the uniform flank wear reached 0.010 inch. Catastrophic tool failure superseded all other end of test criteria and resulted in the immediate conclusion of the test. RESULTS Drilling Tabular results of the tool wear and thrust force for each fluid and application method is presented in Appendix 3. Results of statistical analysis are presented in Appendix 4. The tool life end points (wear and forces) were collected and examined using a 2-tailed t-test to determine significance of differences between means. Similarly, the performance differences between the individual test fluids were analyzed by subjecting the tool life end points (wear and forces) to a 1-way pairwise ANOVA analysis. All statistical tests were conducted using a 95% confidence interval. The results of the statistical analysis are presented in Appendix 4. A summary of the test results is presented in Tables 3 -6. Table 3 shows no statistical difference in the drill life obtained between flood application and microlubrication application of the metal removal fluids. Table 4 shows the thrust forces encountered during drilling with microlubrication are lower than those encountered during flood application of the metal removal fluids. Generally, when one experiences lower cutting forces, one would expect to see longer drill life. As the test results indicate, this is not the case in this study. Additionally, the tests indicate no statistical difference in the performance of the fluids in the drilling operation. Previous experience conducting the International Working Industry Group drilling test procedure shows that typically 535 lbs of thrust force approximates 0.010 inch of tool wear. In these tests, drills cooled and lubricated by flood application, thrust forces exceeded 535 lbs within the first 10 –20 holes. (Fluid 2 was the exception to this requiring approximately 50 holes before 535 lb of thrust force was exceeded.) An explanation for this behavior cannot be offered at this time. Milling Tabular results of the tool wear and thrust force for each fluid and application method is presented in Appendix 5. Results of statistical analysis are presented in Appendix 6. A summary of the test results is presented in Table 7-10. Unlike the drilling tests, the results of the milling test presented in Table 7 show statistical differences in insert life depending upon the metal removal fluid application method. With the exception of Fluid 3, the inserts cooled and lubricated using microlubrication application demonstrates superior tool life over those inserts cooled and lubricated using flood application. In the best case, the metal removal fluid applied by
Microlubrication in Metal Machining Operations Report # 320-889-302
Page 8 of 126
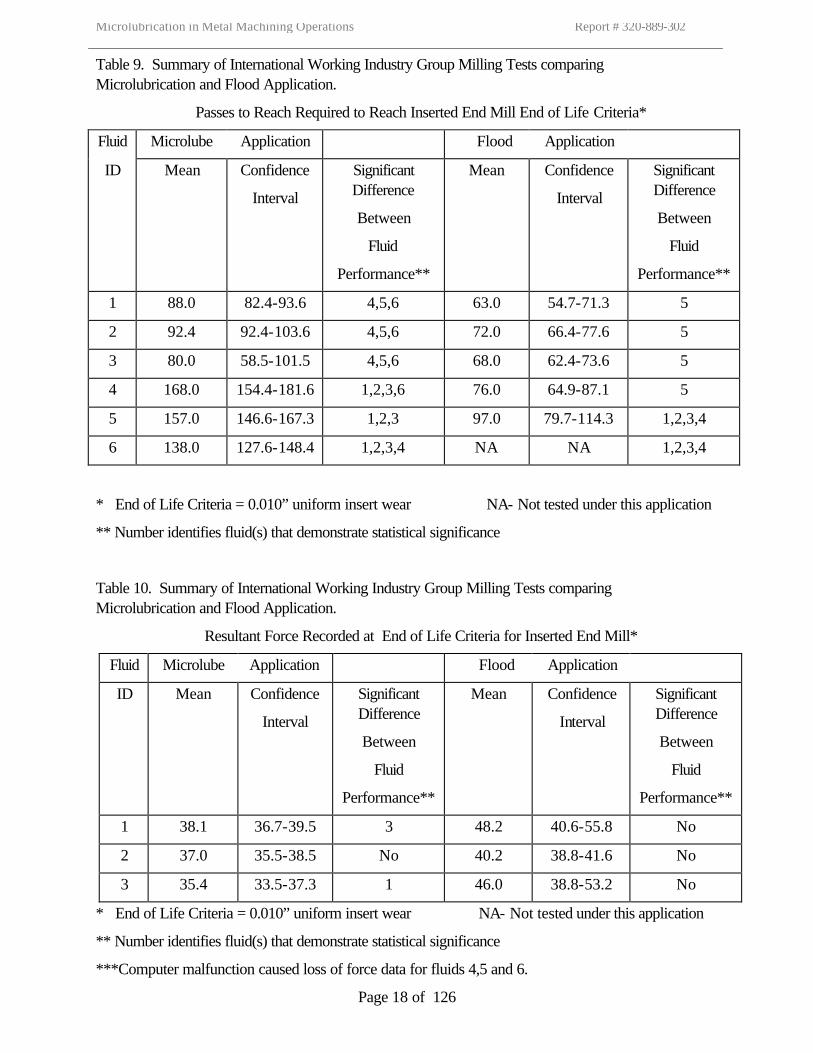
microlubrication offered a 123% improvement in insert life (Fluid 5). In the worst case, the metal removal fluid applied by microlubrication offered a 36% improvement in insert life (Fluid 2). There is no statistical difference in performance when Fluid 3 is applied by flood or microlubrication application. Unfortunately, a computer malfunction resulted in the loss of the majority of the machining force data from the milling tests for Fluids 4, 5 and 6. The data for Fluids 1,2 and 3 and the limited data for Fluids 4, 5 and 6 which could be retrieved shows the resultant force to be significantly lower when the inserts are cooled and lubricated with microlubrication application. The test data indicates that some test fluids performed statistically better than others. Under microlubrication application, fluids 4, 5, and 6 performed statistically better than Fluids 1,2, and 3. When the metal removal fluid was applied by flood application, only fluid 5 demonstrated statistically better performance than the other fluids during milling applications. It should be noted that in milling, the use of a straight oil during microlubrication provided excellent tool life. It outperformed three of the water-soluble metal removal tested. However, one of the water based metal removal fluids tested provided significantly better tool life than the straight oil. This may have resulted from certain additives present in the water soluble metal removal fluid or may have resulted from the mist delivery conditions established in these tests. TechSolve made no attempt to optimize mist delivery application for the straight oil product and this may have been detrimental to the milling tool life. The International Working Industry Group milling test procedure has established that 75 pounds of resultant machining force corresponds to approximately 0.010 inches of insert wear. As in the drilling test, the resultant forces for inserts cooled and lubricated by microlubrication or flood application did not approach the 75 lb level. Once again, no explanation can be given for this behavior. Mist Generation A separate report detailing the procedures, analyses, and observations of mist generated during microlubrication and flood application is presented in Appendix 1. ECONOMIC ANALYSES As previously mentioned, the reduced use of metal removal fluid in machining operations has generally resulted in lower tool life, increased tooling costs and lowered productivity. For many manufacturers, this is an unacceptable compromise. The manufacturers must be convinced that, for a particular application, the benefits and savings from microlubrication will not be overshadowed by a potential for increased tool cost and lower productivity. One of the goals of this research was to identify the performance difference, primarily tool life, of cutting tools lubricated and cooled by microlubrication and flood application in typical machining operations (milling and drilling). Having completed these tests, we can now compare the effect of the tool life differences on the economics and productivity of the drilling and milling operations at the machining conditions used in this research. The Machining Data Handbook presents a number of generalized equations for a variety of machining processes, operating time per piece and production rate. The economic equations consist of two basic
Microlubrication in Metal Machining Operations Report # 320-889-302
Page 9 of 126
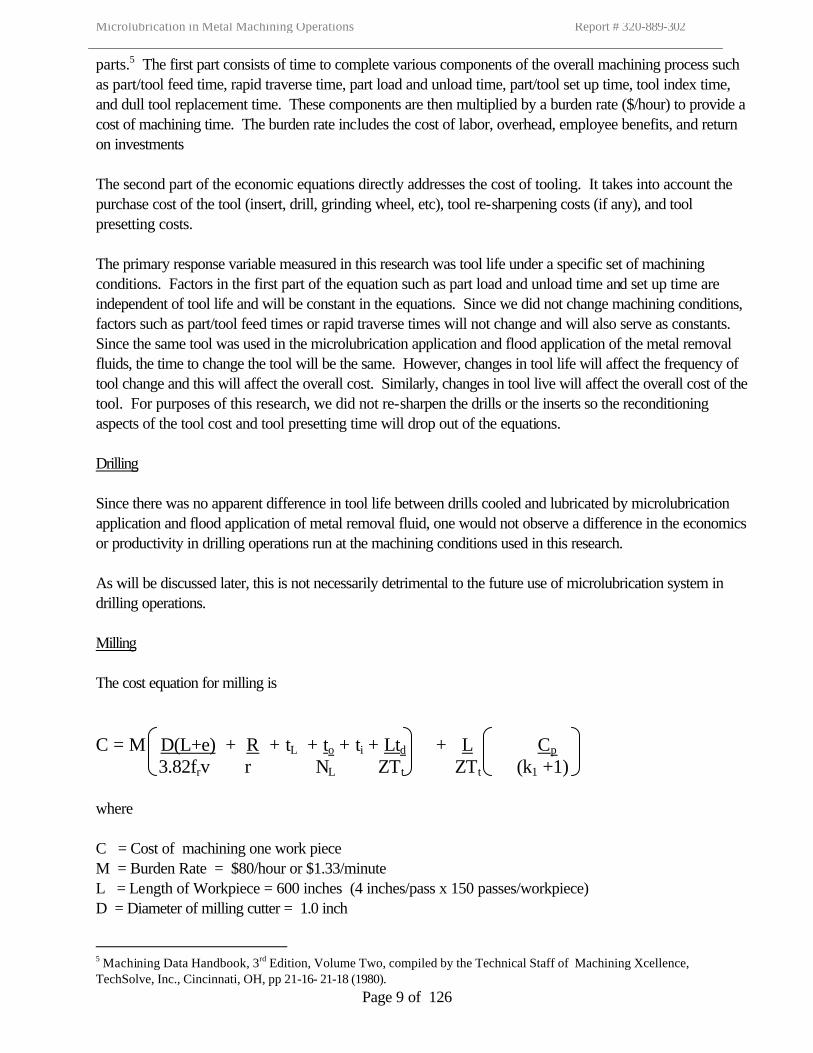
parts.5 The first part consists of time to complete various components of the overall machining process such as part/tool feed time, rapid traverse time, part load and unload time, part/tool set up time, tool index time, and dull tool replacement time. These components are then multiplied by a burden rate ($/hour) to provide a cost of machining time. The burden rate includes the cost of labor, overhead, employee benefits, and return on investments The second part of the economic equations directly addresses the cost of tooling. It takes into account the purchase cost of the tool (insert, drill, grinding wheel, etc), tool re-sharpening costs (if any), and tool presetting costs. The primary response variable measured in this research was tool life under a specific set of machining conditions. Factors in the first part of the equation such as part load and unload time and set up time are independent of tool life and will be constant in the equations. Since we did not change machining conditions, factors such as part/tool feed times or rapid traverse times will not change and will also serve as constants. Since the same tool was used in the microlubrication application and flood application of the metal removal fluids, the time to change the tool will be the same. However, changes in tool life will affect the frequency of tool change and this will affect the overall cost. Similarly, changes in tool live will affect the overall cost of the tool. For purposes of this research, we did not re-sharpen the drills or the inserts so the reconditioning aspects of the tool cost and tool presetting time will drop out of the equations. Drilling Since there was no apparent difference in tool life between drills cooled and lubricated by microlubrication application and flood application of metal removal fluid, one would not observe a difference in the economics or productivity in drilling operations run at the machining conditions used in this research. As will be discussed later, this is not necessarily detrimental to the future use of microlubrication system in drilling operations. Milling The cost equation for milling is C = M D(L+e) + R + tL + to + ti + Ltd + L Cp 3.82frv r NL ZTt ZTt (k1 +1) where C = Cost of machining one work piece M = Burden Rate = $80/hour or $1.33/minute L = Length of Workpiece = 600 inches (4 inches/pass x 150 passes/workpiece) D = Diameter of milling cutter = 1.0 inch
5 Machining Data Handbook, 3rd Edition, Volume Two, compiled by the Technical Staff of Machining Xcellence, TechSolve, Inc., Cincinnati, OH, pp 21-16- 21-18 (1980).
Microlubrication in Metal Machining Operations Report # 320-889-302
Page 10 of 126
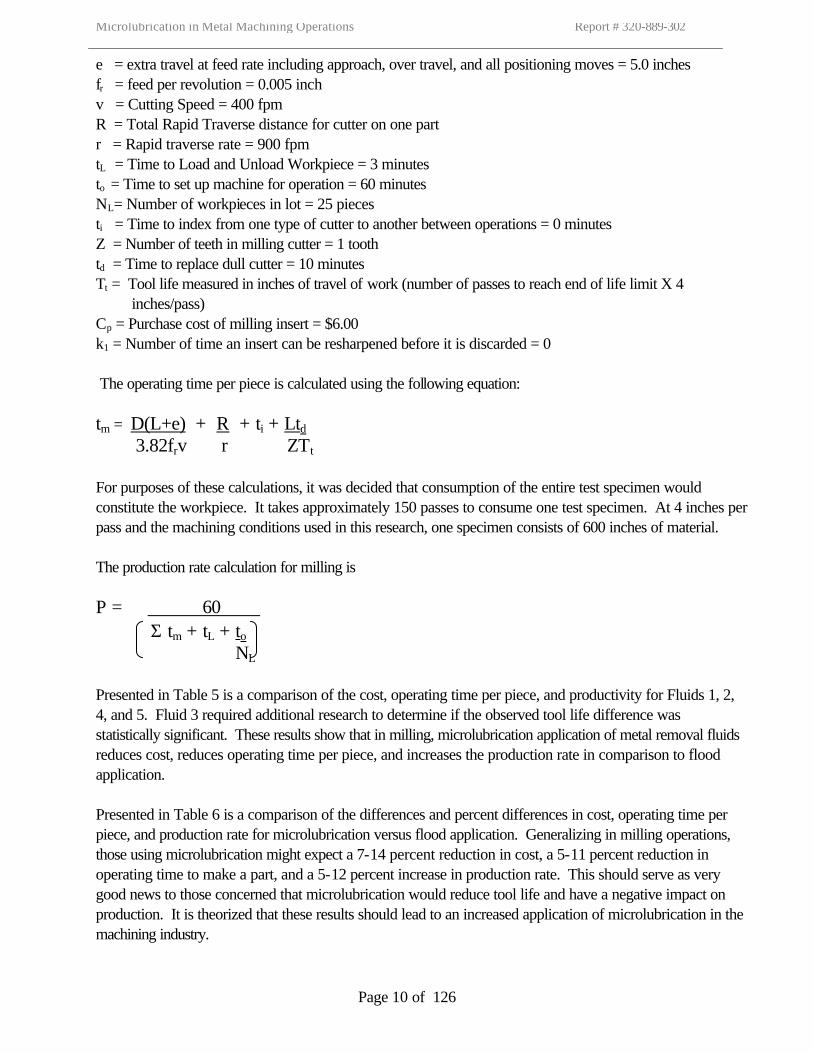
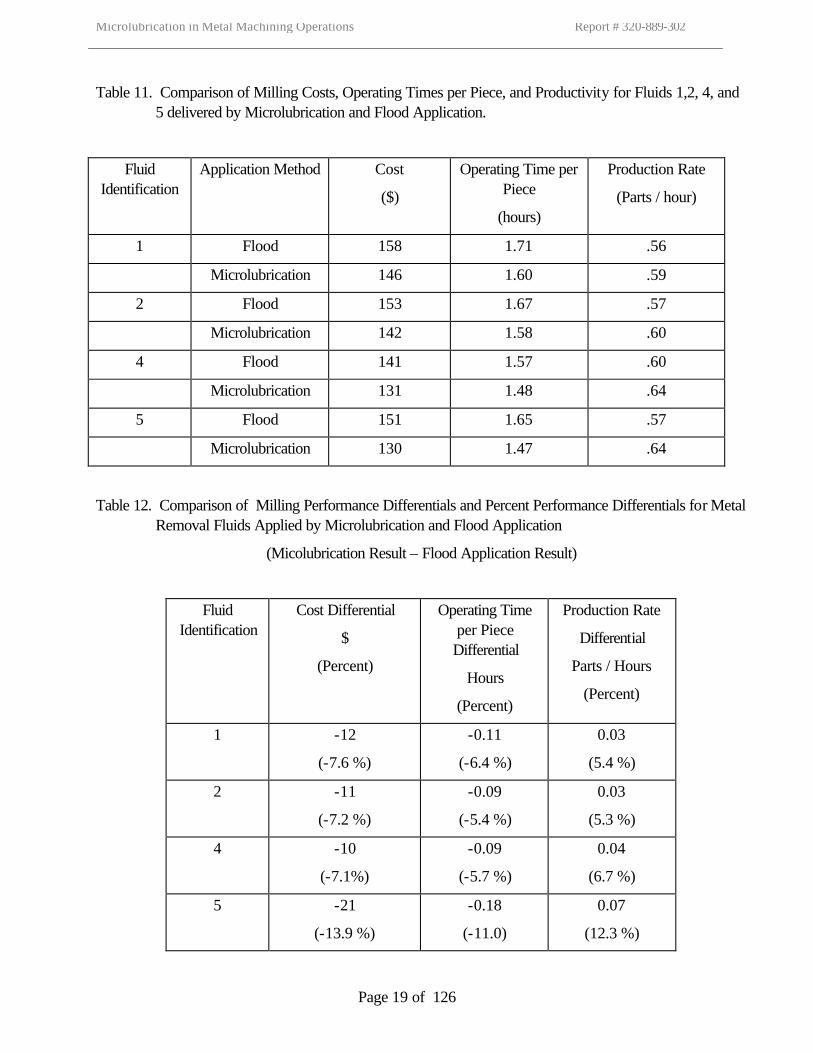
e = extra travel at feed rate including approach, over travel, and all positioning moves = 5.0 inches fr = feed per revolution = 0.005 inch v = Cutting Speed = 400 fpm R = Total Rapid Traverse distance for cutter on one part r = Rapid traverse rate = 900 fpm tL = Time to Load and Unload Workpiece = 3 minutes to = Time to set up machine for operation = 60 minutes NL= Number of workpieces in lot = 25 pieces ti = Time to index from one type of cutter to another between operations = 0 minutes Z = Number of teeth in milling cutter = 1 tooth td = Time to replace dull cutter = 10 minutes Tt = Tool life measured in inches of travel of work (number of passes to reach end of life limit X 4 inches/pass) Cp = Purchase cost of milling insert = $6.00 k1 = Number of time an insert can be resharpened before it is discarded = 0 The operating time per piece is calculated using the following equation: tm = D(L+e) + R + ti + Ltd 3.82frv r ZTt For purposes of these calculations, it was decided that consumption of the entire test specimen would constitute the workpiece. It takes approximately 150 passes to consume one test specimen. At 4 inches per pass and the machining conditions used in this research, one specimen consists of 600 inches of material. The production rate calculation for milling is P = 60 . Σ tm + tL + to NL Presented in Table 5 is a comparison of the cost, operating time per piece, and productivity for Fluids 1, 2, 4, and 5. Fluid 3 required additional research to determine if the observed tool life difference was statistically significant. These results show that in milling, microlubrication application of metal removal fluids reduces cost, reduces operating time per piece, and increases the production rate in comparison to flood application. Presented in Table 6 is a comparison of the differences and percent differences in cost, operating time per piece, and production rate for microlubrication versus flood application. Generalizing in milling operations, those using microlubrication might expect a 7-14 percent reduction in cost, a 5-11 percent reduction in operating time to make a part, and a 5-12 percent increase in production rate. This should serve as very good news to those concerned that microlubrication would reduce tool life and have a negative impact on production. It is theorized that these results should lead to an increased application of microlubrication in the machining industry.
Microlubrication in Metal Machining Operations Report # 320-889-302
Page 11 of 126
OTHER ECONOMIC CONSIDERATIONS Having demonstrated the potential of microlubrication to provide enhanced machining performance over flood application and its potential economic benefits, at least under these machining conditions, it should be recognized that there are other economic considerations associated with the elimination of flood metal removal fluid application. Since microlubrication uses substantially less metal removal fluid than flood application, this will drastically reduce the quantity of metal removal fluids purchased and warehoused by the machining organization. This will not only directly impact the profitability of the machining organization, but it will free up space for new equipment, etc., potentially allowing the machining company to accept new work and grow. Presently, in an effort to reduce spent metal removal fluid disposal, metal removal fluid maintenance programs are underway. These programs generally involve some level of manpower, as well as the purchase of equipment, chemicals, and miscellaneous items. Since microlubrication is a once through system (the metal removal fluid is misted on to the part and remains there to provide corrosion protection.), the need for fluid maintenance programs will be greatly reduced. Additionally, it is expected that the amount of metal removal fluid requiring disposal would also greatly diminish. With the once through system, the metal removal fluids would not be collected and subjected to the environmental conditions that lead to their degradation, contamination, and eventual disposal. Disposal of spent metal removal fluid is very expensive due to various federal, state, and local government regulations that are presently associated with it. It is expected, with time, that these regulations will become increasingly stringent, thereby increasing the cost. Minimizing disposal would greatly reduce the cost associated with metal removal fluid usage. Earlier, it was mentioned that TechSolve, Inc had conducted a survey concerning the cost of using metal removal fluid in machining operations. It was estimated that an average shop purchasing 500 gallons of metal removal fluid per year spent $57,000 per year to purchase, use, and dispose of the metal removal fluid. Approximately 52 percent of this $57,000 is associated with disposal of the spent metal removal fluid. Obviously, substantial savings might be achieved by switching to microlubrication. Additionally, the metal removal fluid user now assumes cradle to grave responsibility for the metal removal fluid. This creates an additional liability on the metal removal fluid user. Depending upon the circumstances of the company, he may be forced to pay for some remediation of a landfill or other site where spent metal removal fluids were held. Microlubrication minimizes the potential and liability issues associated with metal removal fluid disposal. This is why even though there was no difference in tool life in drilling when metal removal fluid was applied by microlubrication application or flood application, microlubrication might offer an advantage over flood application. These factors, combined with the performance enhancements associated with microlubrication, should lead to consideration and adoption of microlubrication techniques in machining operations. POTENTIAL DRAWBACK
Microlubrication in Metal Machining Operations Report # 320-889-302
Page 12 of 126
Perhaps, the biggest drawback associated with the use of microlubrication application of metal removal fluids is the generation of cutting fluid mists. In recent years, the role of metal removal fluid mist as an occupational hazard has received increasing study. The findings of the United States Occupational Health and Safety Administration (OSHA) standards advisory committee found that exposure to metal removal fluids may result in asthma, hypersensitivity pneumonitis, other respiratory disorders and dermatitis. The committee also recognized that there were other health conditions, including cancer, related to metal removal fluid exposure, for which the evidence is still evolving. The standards advisory committee recommended that OSHA adopt a permissible exposure limit of 0.4mg/m3 thoracic or 0.5 mg/m3 total particulate. While it is unclear as to when and if OSHA will act on this recommendation, it is clear that any application system generating significant quantities of metal removal fluid might find difficulties gaining widespread application and acceptance. The results of the mist generation studies conducted by the Division of Applied Research and Technology of the National Institute of Occupational Safety and Health (NIOSH). Their results indicate that mist generation during microlubrication is 340 to 3300 times the rate of flood application when drilling and 100 to 140 times the rate when milling. The results also indicate that while there are differences in mist generation from fluid to fluid, the type of fluid (water soluble versus straight oil) being used may play a larger role and result in higher levels of worker exposure to metal removal fluid mists. Thus, it appears that microlubrication offers an increased risk of worker exposure to metal removal fluid mists. As a result, at least a portion of the savings associated with the use of microlubrication would most likely have to spent on improving mist collection equipment and improving ventilation around the machine tools and the manufacturing facility in general. Report Addendum After reviewing a preliminary copy of this report, Unist, Inc. took exception to some of the findings of the NIOSH mist study and the conditions under which the tests were operated. Presented in Appendix 2 is their response.
Microlubrication in Metal Machining Operations Report # 320-889-302
Page 13 of 126
Figure 1. Idealized Chip Formation Process (Turning)
Figure 2. Effect of Metal Removal Fluid on Chip Formation
ClearanceFace
Workpiece
Chip
Tool
t
Οf
V
α
Rake Face
Workpiece
Chip
Tool
SMALLShearAngle
HIGH ENERGY
LARGEShearAngle
Workpiece
ToolChip
LOW ENERGY(HIGH COEFFICIENT OF
FRICTION)(LOW COEFFICIENT OF
FRICTION)
Microlubrication in Metal Machining Operations Report # 320-889-302
Page 14 of 126
Table 1. Definition of Metal Removal Fluid Types Metal Removal Fluid Type % Mineral Oil in Concentrate Straight Oil 100 Soluble Oil 60-90 Semisynthetic 3-30 Synthetic 0 Table 2. Types of Metal Removal Fluid Evaluated and Fluid Manufacturer
Fluid Metal Removal Fluid Manufacturer Identification Type
1 Soluble Oil Spartan Chemical Company (EP Additive) Toledo, OH 2 Semi-synthetic Master Chemical Company (EP Additive) Perrysburg, OH 3 Soluble Oil Midwest Biological, Inc. Woodburn, IN 4 Soluble Oil Milacron, Inc. Cincinnati, OH 5 Soluble Oil Hangsterfer's Laboratories Mantua, NJ 6 Straight Oil Unist, Inc. Grand Rapids, MI
Microlubrication in Metal Machining Operations Report # 320-889-302
Page 15 of 126
Table 3. Summary of International Working Industry Group Drilling Tests comparing Microlubrication and Flood Application.
Holes Required to Reach Drill End of Life Criteria*
Fluid Microlube Application MiFloodbe Application Statistical
ID Mean
Confidence
Interval
Mean
Confidence
Interval
Difference
between
Application
Methods
1 60.0 21.0-99.0 55.0 34.5-75.5 No
2 63.0 41.7-84.3 66.0 51.8-80.2 No
3 58.0 41.8-74.2 56.0 37.2-74.8 No
4 60.9 47.4-74.3 58.9 47.6-70.2 No
5 58.6 47.3-69.8 62.1 48.1-76.2 No
6 82.0 52.7-111.3 NA NA NA
* End of Life Criteria = 0.010” uniform drill wear NA - Not tested under this application
Table 4. Summary of International Working Industry Group Drilling Tests comparing Microlubrication and Flood Application.
Thrust Force Recorded at End of Tool Life Criteria for Drill*
Fluid Microlube Application MiFloodbe Application Statistical
ID Mean
Confidence
Interval
Mean
Confidence
Interval
Difference
between
Application
Methods
1 457.5 405.0-510.0 593.0 548.6-637.4 Yes
2 479.2 419.6-538.8 592.6 516.8-668.4 Yes
3 447.0 411.4-482.6 570.4 551.1-589.7 Yes
4 453.0 438.6-467.4 590.7 557.8-623.6 Yes
5 481.4 418.7-544.2 559.7 535.9-583.6 Yes
6 535.8 458.8-612.7 NA NA NA
* End of Life Criteria = 0.010” uniform drill wear NA- Not tested under this application
Microlubrication in Metal Machining Operations Report # 320-889-302
Page 16 of 126
Table 5. Summary of International Working Industry Group Drilling Tests comparing Microlubrication and Flood Application.
Holes Required to Reach Drill End of Life Criteria*
Fluid Microlube Application MicFloode Application
ID Mean Confidence
Interval
Significant Difference
Between
Fluid
Performance
Mean
Confidence
Interval
Significant Difference
Between
Fluid
Performance
1 60.0 21.0-99.0 No 55.0 34.5-75.5 No
2 63.0 41.7-84.3 No 66.0 51.8-80.2 No
3 58.0 41.8-74.2 No 56.0 37.2-74.8 No
4 60.9 47.4-74.3 No 58.9 47.6-70.2 No
5 58.6 47.3-69.8 No 62.1 48.1-76.2 No
6 82.0 52.7-111.3 No NA NA NA
* End of Life Criteria = 0.010” uniform drill wear NA- Not tested under this application
Table 6. Summary of International Working Industry Group Drilling Tests comparing Microlubrication and Flood Application.
Thrust Force Recorded at End of Tool Life Criteria for Drill*
Fluid Microlube Application MicFloode Application
ID Mean
Confidence
Interval
Significant Difference
Between
Fluid
Performance
Mean
Confidence
Interval
Significant Difference
Between
Fluid
Performance
1 457.5 405.0-510.0 No 593.0 548.6-637.4 No
2 479.2 419.6-538.8 No 592.6 516.8-668.4 No
3 447.0 411.4-482.6 No 570.4 551.1-589.7 No
4 453.0 438.6-467.4 No 590.7 557.8-623.6 No
5 481.4 418.7-544.2 No 559.7 535.9-583.6 No
6 535.8 458.8-612.7 No NA NA NA
* End of Life Criteria = 0.010” uniform drill wear NA- Not tested under this application
Microlubrication in Metal Machining Operations Report # 320-889-302
Page 17 of 126
Table 7. Summary of International Working Industry Group Milling Tests comparing Microlubrication and Flood Application.
Passes to Reach Required to Reach Inserted End Mill End of Life Criteria*
Fluid Microlube Application MiFloodbe Application Statistical
ID Mean
Confidence
Interval
Mean
Confidence
Interval
Difference
between
Application
Methods
1 88.0 82.4-93.6 63.0 54.7-71.3 Yes
2 92.4 92.4-103.6 72.0 66.4-77.6 Yes
3 80.0 58.5-101.5 68.0 62.4-73.6 No
4 168.0 154.4-181.6 76.0 64.9-87.1 Yes
5 157.0 146.6-167.3 97.0 79.7-114.3 Yes
6 138 127.6-148.4 NA NA NA
* End of Life Criteria = 0.010” uniform insert wear NA- Not tested under this application
Table 8. Summary of International Working Industry Group Milling Tests comparing Microlubrication and Flood Application.
Resultant Force Recorded at End of Life Criteria for Inserted End Mill
Fluid Microlube Application MiFloodbe Application Statistical
ID Mean
Confidence
Interval
Mean
Confidence
Interval
Difference
between
Application
Methods
1 38.1 36.7-39.5 48.2 40.6-55.8 Yes
2 37.0 35.5-38.5 40.2 38.8-41.6 Yes
3 35.4 33.5-37.3 46.0 38.8-53.2 Yes
* End of Life Criteria = 0.010” uniform drill wear NA - Not tested under this application
Microlubrication in Metal Machining Operations Report # 320-889-302
Page 18 of 126
Table 9. Summary of International Working Industry Group Milling Tests comparing Microlubrication and Flood Application.
Passes to Reach Required to Reach Inserted End Mill End of Life Criteria*
Fluid Microlube Application MicFloode Application
ID Mean Confidence
Interval
Significant Difference
Between
Fluid
Performance**
Mean
Confidence
Interval
Significant Difference
Between
Fluid
Performance**
1 88.0 82.4-93.6 4,5,6 63.0 54.7-71.3 5
2 92.4 92.4-103.6 4,5,6 72.0 66.4-77.6 5
3 80.0 58.5-101.5 4,5,6 68.0 62.4-73.6 5
4 168.0 154.4-181.6 1,2,3,6 76.0 64.9-87.1 5
5 157.0 146.6-167.3 1,2,3 97.0 79.7-114.3 1,2,3,4
6 138.0 127.6-148.4 1,2,3,4 NA NA 1,2,3,4
* End of Life Criteria = 0.010” uniform insert wear NA- Not tested under this application
** Number identifies fluid(s) that demonstrate statistical significance
Table 10. Summary of International Working Industry Group Milling Tests comparing Microlubrication and Flood Application.
Resultant Force Recorded at End of Life Criteria for Inserted End Mill*
Fluid Microlube Application MicFloode Application
ID Mean
Confidence
Interval
Significant Difference
Between
Fluid
Performance**
Mean
Confidence
Interval
Significant Difference
Between
Fluid
Performance**
1 38.1 36.7-39.5 3 48.2 40.6-55.8 No
2 37.0 35.5-38.5 No 40.2 38.8-41.6 No
3 35.4 33.5-37.3 1 46.0 38.8-53.2 No
* End of Life Criteria = 0.010” uniform insert wear NA- Not tested under this application
** Number identifies fluid(s) that demonstrate statistical significance
***Computer malfunction caused loss of force data for fluids 4,5 and 6.
Microlubrication in Metal Machining Operations Report # 320-889-302
Page 19 of 126
Table 11. Comparison of Milling Costs, Operating Times per Piece, and Productivity for Fluids 1,2, 4, and 5 delivered by Microlubrication and Flood Application.
Fluid Identification
Application Method Cost
($)
Operating Time per Piece
(hours)
Production Rate
(Parts / hour)
1 Flood 158 1.71 .56
Microlubrication 146 1.60 .59
2 Flood 153 1.67 .57
Microlubrication 142 1.58 .60
4 Flood 141 1.57 .60
Microlubrication 131 1.48 .64
5 Flood 151 1.65 .57
Microlubrication 130 1.47 .64
Table 12. Comparison of Milling Performance Differentials and Percent Performance Differentials for Metal Removal Fluids Applied by Microlubrication and Flood Application
(Micolubrication Result – Flood Application Result)
Fluid Identification
Cost Differential
$
(Percent)
Operating Time per Piece Differential
Hours
(Percent)
Production Rate
Differential
Parts / Hours
(Percent)
1 -12
(-7.6 %)
-0.11
(-6.4 %)
0.03
(5.4 %)
2 -11
(-7.2 %)
-0.09
(-5.4 %)
0.03
(5.3 %)
4 -10
(-7.1%)
-0.09
(-5.7 %)
0.04
(6.7 %)
5 -21
(-13.9 %)
-0.18
(-11.0)
0.07
(12.3 %)
Microlubrication in Metal Machining Operations Report # 320-889-302
Page 20 of 126
APPENDIX 1
Comparison of Mist Generation Of
Microlubrication and Flood Application Of
Metalworking Fluids During Machining
U.S. DEPARTMENT OF HEALTH AND HUMAN SERVICES
Public Health Services
Centers for Disease Control and Prevention
National Institute of Occupational Health and Safety
Division of Applied Research and Technology
4676 Columbia Parkway, R5
Cincinnati, Ohio 45266
COMPARISON OF MIST GENERATION OF MICRO-LUBRICATION AND FLOOD APPLICATION OF METALWORKING FLUIDS
DURING MACHINING
PRINCIPAL AUTHORS:Michael G. GresselStanley A. Shulman
REPORT DATE:April 2001
FILE NO.:EPHB 218-05r
U.S. DEPARTMENT OF HEALTH AND HUMAN SERVICESPublic Health Service
Centers for Disease Control and PreventionNational Institute for Occupational Safety and Health
Division of Applied Research and Technology4676 Columbia Parkway, R5
Cincinnati, Ohio 45226
ABSTRACT
While cutting fluids have been used since before the mid-1800's, their use and formulation havechanged dramatically over the years, for both performance as well as health and safety reasons. Morerecently, adverse health effects were reported in industries using cutting fluids, drawing renewedattention to methods for controlling occupational exposures to cutting fluids. In addition to the potentialoccupational hazards associated with cutting fluids, disposal of the used cutting fluids is also a concernto many machining operations. One approach to reducing the volume of fluids used in the machiningprocess is micro-lubrication, also known as near-dry and semi-dry machining. Micro-lubricationprovides the machining process with a very limited amount of cutting fluid. While the more traditionalapproach to cutting fluid application has been to flood the part and tool with fluid, with micro-lubrication, the fluid is applied as a mist, at flow rates that are usually several orders of magnitude lowerthan for flooding. The primary goal of this research is to determine how micro-lubrication, as a fluidapplication method, affects worker exposures to cutting fluid mists.
This project was conducted in conjunction with TechSolve, Inc. (formerly the Institute for AdvancedManufacturing Sciences, IAMS), and sponsored by the Illinois State Department of Natural Resources. TechSolve evaluated the effects of micro-lubrication on tool life, cutting forces, power consumption,and part quality, while the work described here focused on the mist generation potential of micro-lubrication.
The primary objective of this study was to determine the generation rate of respirable aerosols from theapplication of cutting fluids using micro-lubrication. Generation rates for flood application were alsoevaluated to put the micro-lubrication generation rates into perspective. The flood applicationprocesses used the same machining equipment, tooling and machining parameters as the micro-lubrication processes, the only differences being the method of fluid application and the flow rate. Twodifferent machining processes were studied: milling and drilling. Six different fluids were evaluated, fivedifferent soluble oils and one straight synthetic fluid. The goal was to determine and compare respirableaerosol generation rates so that we can understand how micro-lubrication may affect occupationalexposures to cutting fluids.
The results of this study showed that micro-lubrication resulted in significantly higher cutting fluid mistgeneration rates than flood application. Estimates of the workplace concentrations resulting from thesegeneration rates showed that, for the process parameters studied, flood application would result in mistexposure concentrations below any applicable exposure criteria, while micro-lubrication would result incutting fluid mist concentrations that would exceed many of the exposure limits. As a result of this data,facilities considering micro-lubrication should recognize the need for adequate cutting fluid mist controls,including machine enclosure, ventilation, and air cleaning. Micro-lubrication has many potential benefits,but the challenges associated with this fluid application method must be recognized and addressedbefore it is implemented.
1
INTRODUCTION
While metal cutting has been practiced in various forms dating back to ancient times, it has taken on amore critical role since the Industrial Revolution. It is during this time, the mid-1800's, that one of thefirst publications discussing cutting fluids appeared.1 Perhaps the most comprehensive early work oncutting fluids was reported by Taylor in the early 1900's.2 Since Taylor, cutting fluids have changeddramatically, for both performance as well as health and safety reasons. Some of the components inmany early cutting fluids were identified as problematic, contributing to a variety of illnesses.
More recently, adverse health effects were reported in industries using cutting fluids, drawing renewedattention to methods for controlling occupational exposures to cutting fluids. These health effectsinclude skin diseases, acute respiratory illnesses, and potentially, cancers. Cutting fluid mist isgenerated by the machining process, from splashing, and from the application of fluid to spinning partsand tools. The aerosol generated in the machining process may contain the components of the cuttingfluid, as well as particulate from both the metal being cut and from tool wear. The components of thefluid can present a potential hazard to the worker along with any contaminants of the cutting fluid. Forexample, the cutting fluid can be contaminated with microorganisms and/or tramp oil. Thesecontaminants can be as hazardous as any of the components of the cutting fluid, and may be extremelydifficult to control.
In addition to the potential occupational hazards associated with cutting fluids, disposal of the usedcutting fluids is also a concern in many machining operations. Several approaches have beeninvestigated to address these disposal costs, including fluid maintenance programs to extend the life ofthe fluid, recycling programs to reuse the fluids, and dry machining to completely eliminate the cuttingfluid. Another approach, and the topic of this current research, focuses on the application of the cuttingfluid. Micro-lubrication, also known as near-dry and semi-dry machining, provides the machiningprocess with a very limited amount of cutting fluid. The more traditional approach to cutting fluidapplication has been to flood the part and tool with fluid. With micro-lubrication, the fluid is applied asa mist, at flow rates that are usually several orders of magnitude lower than for flooding. But from anoccupational perspective, how does micro-lubrication, as a fluid application method, affect workerexposures to cutting fluids? This is the primary question to be answered by this current research.
This project was conducted in conjunction with TechSolve, Inc. (formerly the Institute for AdvancedManufacturing Sciences, IAMS). TechSolve was sponsored by the Illinois State Department ofNatural Resources, to evaluate the effects of micro-lubrication on tool life and cutting forces. Oneconcern the Department had was the impact of micro-lubrication on occupational exposures to cuttingfluids. The research described here was undertaken to address this concern.
2
Cutting Fluids and Micro-LubricationCutting fluids serve several functions in the machining process. For some processes, the primaryfunction is lubrication, while for others, it is cooling. In many processes, cutting fluids are also used forchip removal; in some facilities, a large portion of the cutting fluid pumped throughout the plant is forchip handling. In addition, cutting fluids may also provide corrosion protection for the newly machinedsurface of the part being produced. All of these functions have an impact on the process, from tool lifeand power consumption, to part quality and operability.
One of the primary driving forces behind the implementation of micro-lubrication is waste reduction. The fluid is atomized, often with compressed air, and delivered to the cutting interface through a numberof nozzles. Because the fluid is applied at such low rates, most or all of the fluid used is carried out withthe part. This eliminates the need to collect the fluid while still providing some fluid for lubrication,corrosion prevention, and a limited amount of cooling. Because of the low flow rates, coolant cannotbe used to transport chips, meaning alternative methods for chip extraction must be implemented. However, the chips that are extracted should be of higher value since they are not contaminated withlarge quantities of cutting fluid.
Project ObjectivesThe primary objective of this study was to determine the generation rate of respirable aerosols ofcutting fluids from the application of micro-lubrication. Generation rates for flood application of cuttingfluids were also evaluated to put the micro-lubrication generation rates into perspective. The floodapplication processes used the same machining equipment, tooling and machining parameters as themicro-lubrication processes; the only differences were the method of fluid application and the flow rate. Two different machining processes were studied: milling and drilling. Six different fluids wereevaluated, four soluble mineral oils, one soy-based soluble oil, and one synthetic cutting fluid. Thesynthetic fluid, used straight, was evaluated for using micro-lubrication only. The goal was to determineand compare respirable aerosol generation rates to understand how micro-lubrication may affectoccupational exposures to cutting fluids. This information will be useful to facilities considering theimplementation of micro-lubrication, so that mist collection needs can be adequately considered.
METHODOLOGY
The overall objective of this study was to determine the effect of fluid application, micro-lubrication orflood application, on cutting fluid mist generation. To achieve this goal, the mist concentrations from themachining process were measured and the generation rates calculated based upon a known air flowrate from the machine enclosure. Measurements were made using five different cutting fluids (foursoluble mineral oils and one soluble vegetable oil) with two different machining processes (milling anddrilling), with both micro-lubrication and flood application of the cutting fluids. A sixth fluid, a straightoil, was evaluated for milling and drilling with micro-lubrication only.
3
Cutting Fluid Mist MeasurementsThe cutting fluid mist concentrations from the studied machining operations were measured with a TSIAerodynamic Particle Sizer (APS) Model 3320 (TSI, Inc., St. Paul, MN). The APS is a time of flightaerosol spectrometer which counts particles over a range of aerodynamic diameters from 0.5 to32 :m. It samples at a total flow rate of 5.0 l/min; 1.0 l/min is analyzed, 4.0 l/min is filtered andsupplied as sheath air to the sample stream. Time of flight aerosol spectrometers such as the APS, arebased on the principle that the magnitude of a particle's lag in an accelerating air flow is directly relatedto the particle's aerodynamic diameter. The lag is determined by measuring the transit time required fora particle to pass through two laser beams perpendicular to the air flow. A timer measures the timebetween the two pulses generated by the particle passing through the two laser beams. The transit timeis related to the aerodynamic diameter through a calibration with spheres of a known density.3 TheAPS was calibrated prior to the start of this study.
Two diluters for the APSs, TSI Model 3302A (TSI, Inc., St. Paul, MN), were available to dilute thesample stream in the event that the sample concentration was high enough to saturate the detector. These diluters were capable of diluting the sample stream by a factor of 20 or 100, depending upon thenozzle installed. If additional dilution was needed beyond a factor of 100, two diluters could be used inseries, providing dilution factors of 400, 2,000, and 10,000. The use of the diluters with thebackground samplers was not required.
The APSs were controlled by separate IBM compatible computers, a Dell Dimension, 300 MHz,Pentium II desktop computer and a Dell Inspiron 3500, 350 MHz, Pentium II notebook computer(Dell Computer Corp., Austin, TX). Each computer ran the Aerosol Instrument Manager software,version 1.6 (TSI, Inc., St. Paul, MN), allowing remote access to the instruments’ parameters so thatthe sampling process could be controlled appropriately. In addition, this software received, displayed,and recorded the aerosol data as measurements were being made. At the conclusion of a sampling run,the software also allowed the data to be exported to an ASCII text file, which in turn, could then beimported to other software packages for data analysis.
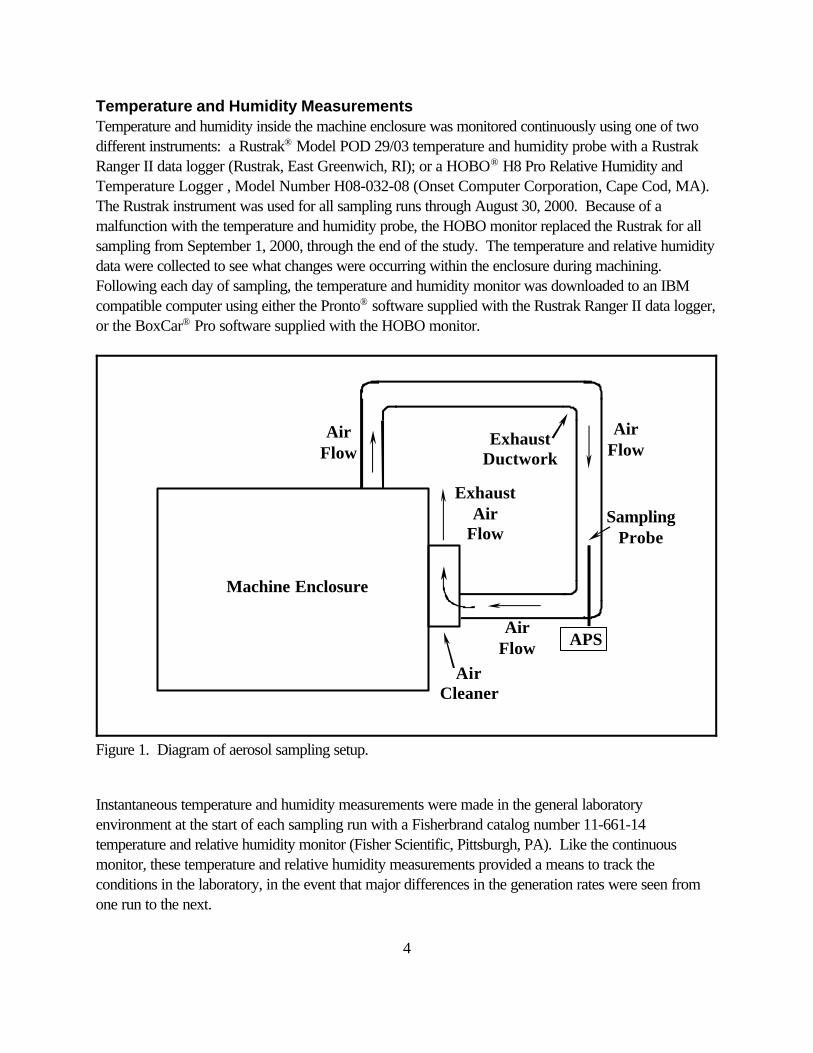
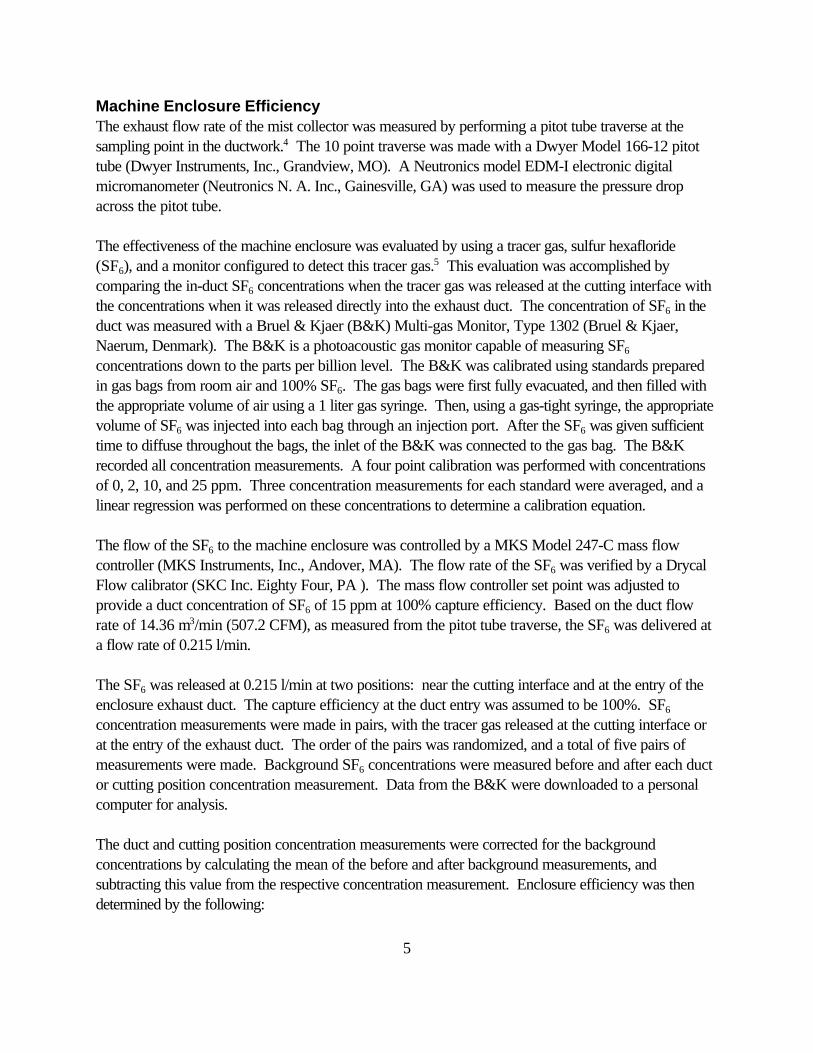
The machining center used in this study was equipped with an enclosure and mist collector. One APSwas configured to sample from the mist collector ductwork using an isokinetic sampling probe, reducingaerosol losses in the sampling train. The probe was designed so that the air and aerosols in the exhauststream entered the sampling probe at the same velocity as the air stream in the duct. The diameter ofthe sampling probe gradually increased to the diameter of the inlet of the APS. In this way, particlelosses due to the changes in air stream velocity were minimized. The sampling probe was insertedthrough an elbow into a straight section of the exhaust ductwork. The sampling point was at the centerline of the straight duct, more than 7.5 duct diameters (45 in, 1.15 m) downstream and 3 duct diameters(18 in, 0.46 m) upstream of any major air disturbance, in this case, two 90° elbows.4 A simplifieddiagram of the sampling setup is given in Figure 1. A second APS was used to monitor generalbackground particulate concentrations.
4
AirCleaner
Machine Enclosure
APS
AirFlow
ExhaustDuctwork
AirFlow
AirFlow
SamplingProbe
ExhaustAir
Flow
Figure 1. Diagram of aerosol sampling setup.
Temperature and Humidity MeasurementsTemperature and humidity inside the machine enclosure was monitored continuously using one of twodifferent instruments: a Rustrak® Model POD 29/03 temperature and humidity probe with a RustrakRanger II data logger (Rustrak, East Greenwich, RI); or a HOBO® H8 Pro Relative Humidity andTemperature Logger , Model Number H08-032-08 (Onset Computer Corporation, Cape Cod, MA). The Rustrak instrument was used for all sampling runs through August 30, 2000. Because of amalfunction with the temperature and humidity probe, the HOBO monitor replaced the Rustrak for allsampling from September 1, 2000, through the end of the study. The temperature and relative humiditydata were collected to see what changes were occurring within the enclosure during machining. Following each day of sampling, the temperature and humidity monitor was downloaded to an IBMcompatible computer using either the Pronto® software supplied with the Rustrak Ranger II data logger,or the BoxCar® Pro software supplied with the HOBO monitor.
Instantaneous temperature and humidity measurements were made in the general laboratoryenvironment at the start of each sampling run with a Fisherbrand catalog number 11-661-14temperature and relative humidity monitor (Fisher Scientific, Pittsburgh, PA). Like the continuousmonitor, these temperature and relative humidity measurements provided a means to track theconditions in the laboratory, in the event that major differences in the generation rates were seen fromone run to the next.
5
Machine Enclosure EfficiencyThe exhaust flow rate of the mist collector was measured by performing a pitot tube traverse at thesampling point in the ductwork.4 The 10 point traverse was made with a Dwyer Model 166-12 pitottube (Dwyer Instruments, Inc., Grandview, MO). A Neutronics model EDM-I electronic digitalmicromanometer (Neutronics N. A. Inc., Gainesville, GA) was used to measure the pressure dropacross the pitot tube.
The effectiveness of the machine enclosure was evaluated by using a tracer gas, sulfur hexafloride(SF6), and a monitor configured to detect this tracer gas.5 This evaluation was accomplished bycomparing the in-duct SF6 concentrations when the tracer gas was released at the cutting interface withthe concentrations when it was released directly into the exhaust duct. The concentration of SF6 in theduct was measured with a Bruel & Kjaer (B&K) Multi-gas Monitor, Type 1302 (Bruel & Kjaer,Naerum, Denmark). The B&K is a photoacoustic gas monitor capable of measuring SF6
concentrations down to the parts per billion level. The B&K was calibrated using standards preparedin gas bags from room air and 100% SF6. The gas bags were first fully evacuated, and then filled withthe appropriate volume of air using a 1 liter gas syringe. Then, using a gas-tight syringe, the appropriatevolume of SF6 was injected into each bag through an injection port. After the SF6 was given sufficienttime to diffuse throughout the bags, the inlet of the B&K was connected to the gas bag. The B&Krecorded all concentration measurements. A four point calibration was performed with concentrationsof 0, 2, 10, and 25 ppm. Three concentration measurements for each standard were averaged, and alinear regression was performed on these concentrations to determine a calibration equation.
The flow of the SF6 to the machine enclosure was controlled by a MKS Model 247-C mass flowcontroller (MKS Instruments, Inc., Andover, MA). The flow rate of the SF6 was verified by a DrycalFlow calibrator (SKC Inc. Eighty Four, PA ). The mass flow controller set point was adjusted toprovide a duct concentration of SF6 of 15 ppm at 100% capture efficiency. Based on the duct flowrate of 14.36 m3/min (507.2 CFM), as measured from the pitot tube traverse, the SF6 was delivered ata flow rate of 0.215 l/min.
The SF6 was released at 0.215 l/min at two positions: near the cutting interface and at the entry of theenclosure exhaust duct. The capture efficiency at the duct entry was assumed to be 100%. SF6
concentration measurements were made in pairs, with the tracer gas released at the cutting interface orat the entry of the exhaust duct. The order of the pairs was randomized, and a total of five pairs ofmeasurements were made. Background SF6 concentrations were measured before and after each ductor cutting position concentration measurement. Data from the B&K were downloaded to a personalcomputer for analysis.
The duct and cutting position concentration measurements were corrected for the backgroundconcentrations by calculating the mean of the before and after background measurements, andsubtracting this value from the respective concentration measurement. Enclosure efficiency was thendetermined by the following:
6
E = CC
100%Cut
Duct
× (1)
where: E = the enclosure efficiency,Ccut = background corrected SF6 concentration with SF6 supply located near the cutting
interface,CDuct = background corrected SF6 concentration with SF6 supply located at the duct entry.
The exhaust flow rate of the enclosure was calculated from the duct position concentration by thefollowing equation:
Q = w
CEnclosureSF
Duct
6 (2)
where: QEnclosure = the air flow rate from the machine enclosure, = the mass flow rate of SF6 to the enclosure.wSF6
The exhaust flow rate determined by the pitot tube traverse was compared to the calculated flow ratefrom the tracer gas evaluation.
Machining ProceduresMist generation was characterized for milling and drilling, using both micro-lubrication and floodapplication of the cutting fluids. The tests were conducted according to a published method for theevaluation of the effectiveness of cutting fluids, in a Tongil TNV-80 CNC vertical machining center.6 Fluid for the flooding tests was pumped from a sump and collected for reuse. A special small volumework cell was constructed inside the machine enclosure to contain the fluid and to allow for more rapidfluid changes. The micro-lubrication tests were conducted using a three nozzle Unist mist applicationdispenser, model 25034 (Unist, Inc., Grand Rapids MI).
Sampling ProceduresThe sampling procedures were designed to collect time dependent data from the APS, to determine thefactors affecting the generation of cutting fluid mist. Equipment used in this study included the twoAPSs (with diluters if needed), an instantaneous temperature and humidity monitor, a continuousrecording temperature and humidity monitor, two IBM compatible computers, and a video camcorder. The desktop computer controlled the APS monitoring background mist concentrations while thenotebook computer controlled the APS measuring the in-duct aerosols. The camcorder was used todocument the process activities such as machining start and stop times. The clocks on the twocomputers and the camcorder were synchronized manually to within less than one second. Both APSswere allowed to warm-up at least one hour prior to any sampling.
7
Using the Aerosol Instrument Manager software, the APSs were configured to record 2880 fivesecond samples. This gave a sampling period of four hours, although sampling for a given test could beterminated earlier without the loss of data. If the diluter was used, a dilution file corresponding to therequired dilution ratio was selected in the Aerosol Instrument Manager. This file contained thenecessary values to calculate the size distributions accounting for the dilution of the sample stream. Particle size data were collected for aerosols between 0.523 and 20.535 :m. After setting thesampling parameters, the APSs were set to begin sampling at a specific time, several minutes beforemachining commenced. Both the in-duct and background APSs were configured similarly, with theexception of the use of the diluter.
Individual sampling sheets were used to document each machining test. The sampling sheet includedentries for: date, fluid type, fluid concentration, sample start time, temperature, humidity, testidentification number, in-duct sample filename, background sample filename, and machining process. The sampling sheet also included entries for sample numbers by pass or hole (i.e., first pass startedduring APS sample 30, fifth pass started during APS sample 74, etc.). Temperature and humiditymeasurements were made at the start of a test. In addition to the sampling sheets, additional noteswere recorded for each machining test. This information included the machining start times, the passesor holes at which cutting force and tool wear measurements were made, and information on processupsets.
Like the APSs, the camcorder was started prior to the start of machining. The camcorder was used todocument process upsets and the start and stop times for each pass or hole. Sample numbers forvarious passes or holes (usually every 4-6 passes) were recorded on the sampling sheets to ensure thatstart and stop times of the machining passes matched with the appropriate samples in the APS data file. Prior to the torque and cutting force measurements, the machining process was placed on hold toconfigure the data acquisition system for the dynamometer. After collecting the torque and cutting data,fluid delivery was halted and the tool was removed for wear measurements. The tool was then placedback into the machine, fluid application was restarted, and machining continued. Machining progressedwith periodic torque, force, and tool wear measurements (as previously discussed) until the measuredtool wear reached the pre-specified value. At that point, air sampling was discontinued, and the APSdata exported to formatted text files. These data files contained particle count aerosol size distributionsfor each of the five second sampling periods.
Data CalculationsThe text files containing the size distribution data from the APSs were imported into an Excelspreadsheet (Microsoft Corp., Redmond, WA), where additional calculations were made to convertthe size distributions to generation rates. The data recorded from the APS consisted of a series of 5second count distributions of particle size. While these files contained size data from 0.523 to20.535 :m, the sizes of interest in this study were 10 :m and smaller. Therefore, the particle countsfor each of 43 sizes ranges between 0.523 and 10.37 :m were included in these analyses. From thecount distributions, particle volume was determined by calculating the volume of particulate for each
8
size interval, and then summing all of the intervals for all sizes less than 10.37 :m, as shown in Equation3. This gives the particle volume for each 5 second sampling interval.
V = cd2P i
i
i 1j
43
343
π
=∑ (3)
where: ci = the particle counts for the ith size range,di = the midpoint diameter of the of the ith size range,V = the volume of the particles in the jth sample.Pj
The particle volume data were then converted to mass measurements by Equation 4.
M = V P Pj jρ (4)
where: M = mass of particulate in the jth sample,Pj
D = density of the fluid, 1.0 g/cc.
The volume of air sampled for each measurement, VS, was 8.33x10⁻⁵ m3 (1.0 l/min for 5 sec). Equation 5, then gives the mean particle concentration for each 5 sec sampling interval.
C = M
Vj
P
S
j (5)
where: Cj = mean concentration over the during the jth sample.
To this point, both the in-duct and background measurements were treated the same, converting thesize distribution data to concentration measurements. The background measurements were used tocorrect the corresponding duct measurements to account for other activities occurring in the laboratory. The magnitude of this correction was determined by calculating the mean of the lowest 10% of thebackground measurements over the duration of the sampling run. In plotting the background data, itwas apparent that there was a baseline concentration of particulate, above which, the backgroundconcentrations normally remained. This calculation methodology provides an estimate of this baselineconcentration and corrects for it.
The duct sample data were coded with a pass or hole variable, so that a specific sample could beassociated with the number of the pass or hole being cut at a particular time. If no pass or hole wasbeing cut during the collection of a particular sample, this variable was left blank. Each pass or holehad several particle volume samples associated with it, depending upon the length of time required tomake the cut.
9
G = C Q⋅ (6)
The duct sample data sets contained 5-second concentration measurements over the entire life of thegiven tool. For the determination of the generation rates, however, a selected sample of theconcentration data from the middle of the tool’s life was used. The main concern with using data fromthe entire life of the tool was that the samples at the beginning and the end of the tool’s life would reflectaerosol generation during startup or process upset conditions. Data from the middle of the tool’s lifewould better reflect the generation rate over the majority of the life of the tool. At the beginning of thetool’s life, the tool’s wear pattern is just being established, while at the end of tool life, the cutting forcesare increasing with more heat being generated. These factors may impact the generation rate of thecutting fluid aerosols. The data in the middle of the tool’s life, however, will be closer to steady-state,with wear patterns established and the cutting forces and heat generation being more consistent. Forboth the drilling and the milling tests, concentration data from the middle 11 holes or passes were usedto calculate the mean concentration for the run.
In most instances, the data used for the mean concentration for the sampling run covered the period oftime where tool wear measurements were made. When the tool was inspected for wear, the machinewas not operating, no fluid was being delivered and the enclosure was opened. To address theseconditions, two data points after the last pass before the tool inspection, and two data point before thefirst pass after tool inspection were included in the mean calculation. Data during tool measurementswere excluded from the calculation, while data during tool movement between passes were included, asthe enclosure was not opened, the tool was still turning and the fluid was still flowing to the tool. Forexample, assume a tool’s life was 70 passes with tool measurements made every 10 passes. The datapoints included in the mean concentration calculation would include: two points before pass 30, all ofthe points during pass 30, two points after pass 30, two points before pass 31, all of the points forpasses 31-40 as well as periods between these passes, and two points after pass 40.
After determining the data to be included in the calculations, the mean concentration, , was calculatedCfor the 11 passes (or holes) of the tool’s life. This mean concentration was corrected for thebackground aerosols by subtracting the background concentration (as determined from the backgroundcalculation discussed above). This results in a mean concentration for the mid-life of the tool, whichwas then converted to a generation rate. For a given generation rate, the measured concentration willbe a function of the generation rate and the ventilation rate diluting the contaminant. Therefore, for agiven concentration and ventilation flow rate, the generation rate can be determined from Equation 6.
where: G = aerosol generation rate,= background corrected mean concentration for middle 11 passes (holes) of a given run,C
Q = ventilation flow rate through the machine enclosure.
Calculations for each run were made to develop a data set that included the date of the sampling run,the machining process, the fluid application method, the fluid identification, and the generation rate.
10
These data were then analyzed first to determine if there was a difference in the generation rates due tothe fluid application methods, and then if there were differences between the fluids or the machiningprocesses.
STUDY DESIGN
The primary factor of interest in this study is the effect of fluid application (micro-lubrication versusflood) on the cutting fluid mist generation rate. A secondary factor was the effect of the cutting fluidformulation (six different fluids). For the primary factor (fluid application method), the null hypothesiscould be stated as follows:
= The ratio of flood application to micro-lubrication generation rates is greater than 0.5.H0A
The alternative hypothesis would then be:= The ratio of flood application to micro-lubrication generation rates is less than 0.5.H1A
From the preliminary data, the ratio of flood to micro-lubrication generation rates was 0.25 or less. Therefore, a ratio of 0.5 was chosen as a reasonable value upon which to design this study. A ratio of0.5 would indicate that micro-lubrication application of cutting fluid had a mist generation rate that wastwice as high as flood application.
For the secondary factor, cutting fluid formulation, the null hypothesis would be the following:= The average ratio of flood application to micro-lubrication generation rates for a givenH0B
fluid and machining process will not differ from the ratio for another fluid for the samemachining process.
The alternative hypothesis would then be:= The average ratio of flood application to micro-lubrication generation rates for a givenH1B
fluid and machining process would differ from the ratio for another fluid for the samemachining process.
For study design purposes, to be considered different, the generation rate ratios would have to differ byat least a factor of 2 in order to be considered different.
Several conditions needed to be considered in order to design and carry out this study. Fluids couldnot be switched at random because of the cleaning needed for each fluid change. Second, themachining process could not be changed at random due to differences in the fixtures, dynamometers,and tools for milling and drilling. Therefore, the study was designed so that all tests of a given processwere performed before switching to a different process. Within the process, all tests for a given fluidwere performed before switching to a different fluid. Within the fluid, the fluid application method couldbe randomized in pairs. In addition to fluid, application method, and machining process, test timing
11
(date, time) was also a concern. Conditions such as temperature and humidity could vary from day today, even hour to hour. While the laboratory where the tests were conducted did have HVACcontrols, small changes in the environmental conditions did occur. If the time of day or date of a testaffected the generation rate, the study design would need to account for these differences. The study,therefore, was designed with micro-lubrication and flood application tests conducted in pairs. Theorder of the pairs were randomized, and each pair was completed on the same day, with one to threepairs of tests conducted on any given day. By completing each pair on the same day and randomizingthe order of the pairs, the effect of changes during the day can be minimized. Five different fluids, allsoluble oils, were tested in this flood application versus micro-lubrication evaluation. A sixth fluid, astraight synthetic, was also used for micro-lubrication application only. The data from this sixth fluidwas not included in the flood versus micro-lubrication evaluation. Rather, it was evaluated only todetermine if it was significantly different (in terms of mist generation) from the other fluids. Fivereplications of each pair for each fluid-process combination were conducted.
A series of preliminary tests were made to address two major concerns. The first centered on theevaluation of the test methodology, to determine if the methods would be capable of generating the typeand quality of data desired. The second related to the study design, specifically, what number ofreplications would be needed to detect the desired differences between the mist generation rates of thetwo fluid application methods. These preliminary tests were conducted in conjunction with fluidevaluation tests conducted by TechSolve for projects not directly associated with this research. Thesetests provided an opportunity to test the study methodology while estimating the variability of theaerosol concentration data.
A total of 43 preliminary test runs were conducted in the Tongil machining center, with a variety ofcutting fluids. Milling and drilling, with both flood and mist application, were evaluated. Although alarge number of tests were conducted, many of the test results were discarded for the purpose ofdetermining the sampling variability. Tests were discarded for a variety of reasons, including changes inthe machining process (i.e. different tool insert material), limited samples for a particular fluid, process,or application method, or changes in the sampling methodology. At the end of the preliminary sampling,sufficient data were available for milling to estimate the sample variability of both flood and micro-lubrication application of the cutting fluid. These data also provided the basis of the test hypotheses. Due to resource limitations (a limited amount of machine time was available) additional preliminarysampling for drilling was not possible. However, for study design purposes, the variability of drilling, forboth flood and micro-lubrication application were assumed to be similar to milling.
Several modifications to the sampling methodology were made over the course of the preliminary tests. Early testing illustrated the need to record process event continuously, rather than manually (notetaking). To address this problem, video recording of the machining process was added to the testmethod. This allowed all start and stop times to be determined, along with process upsets and othersignificant events. Also in early tests, the APS instrument measuring background concentrations werelocated near the exhaust outlet of the air cleaner. To address the concern of the exhaust affecting the
12
background concentrations, the background APS was relocated to the far side of the machining center,away from the air cleaner. Finally, major modifications were made to the sampling sheets used torecord the process and sampling data for each run. Most of these changes concerned organization ofthe sheet or adding spaces for additional data such as temperature and humidity. The organizationalchanges were made to ease process data entry, reducing the amount of manual note taking required.
Of the 43 preliminary tests conducted, 15 were used to determine the number of replications neededfor the study. The remaining 28 tests involved either sampling methods that were not effective,machining processes which were not to be tested, or fluids for which fewer than five tests wereperformed. The 15 tests, therefore, represented three different sets of conditions. Two sets, or tentests, used flood application while the remaining set used micro-lubrication. Two different fluids wereused for the three different sets; however, all the fluids were soluble oils. One fluid was used for theflood applications, while a different fluid was used for the micro-lubrication tests. In developing thestudy design, the differences between the fluids (in terms of their mist generation) was assumed to benegligible. This assumption would be evaluated in the analysis of the data from the full study.
The number of replications of each application pair was determined by evaluating the three sets ofpreliminary measurements made to determine the variability of the sampling data. These preliminarymeasurements were made following the sampling procedures outlined in an earlier section of this report. As mentioned, the primary goal of this study was to determine if there was a difference in mistgeneration rates between micro-lubrication and flood application of cutting fluids, while the secondarygoal was to determine if there were differences between the mist generation rates of the different cuttingfluids and between the different machining processes. The study design must attempt to meet these twogoals, while at the same time, be feasible in terms of the laboratory time and resources required to carryout the study.
Sample size determinations were made through as series of calculations. A t-test was performed todetermine the probability that the average flood to micro-lubrication ratio for a given process was lessthan 0.5. The calculations were made assuming mean ratios of 0.15, 0.25, and 0.35, with CVs of0.05, 0.10, 0.15, 0.20, 0.25, and 0.30. These values provide a full range (both high and low extremes)given the flood to micro-lubrication ratio and CV from the preliminary data. The results of thesecalculations showed that for flood to micro-lubrication ratios of 0.15 and 0.25, all the tested CVs hadprobabilities in excess of 0.99 for five replications. For a ratio of 0.35, all CVs except 0.25 and 0.30had probabilities of 0.99 or greater. The two cases where the probabilities are not greater than 0.99can be considered extreme cases for both the ratio and the CV. Based upon these results, fivereplications for each pair of application methods appeared to be adequate to achieve the primary goalof this study, assuming that there was not excess variability over time.
13
RESULTS
Study results are given in two sections: enclosure efficiency and aerosol measurements and generationrates. The results of the enclosure efficiency tests were needed to perform the required calculations forthe cutting fluid mist generation rates. If the results indicate enclosure efficiencies significantly differentthan 1.0, the cutting fluid mist generation rates would be adjusted to account for aerosol losses from theenclosure.
Enclosure Efficiency ResultsA series of tests were conducted to determine the efficiency of the enclosure of the Tongil machiningcenter. As discussed earlier, measurements were made in pairs, with one measurement made with theSF6 released at the cutting interface, and the other measurement with the SF6 released into the exhaustventilation duct. Using Equation 1, the enclosure efficiency for each pair of measurements was made,resulting in five efficiency values. For the Tongil machining center, the mean efficiency was 98.04%. At-test of the duct and cutting position concentration was performed to determine if the efficiency of theenclosure was different than 100%. If the differences in the duct and cutting position concentrationswere statistically significant, the enclosure efficiency could be said to be different than 100%, and themist generation data would need to be adjusted. For the Tongil machining center, the t-test resultsshowed no statistically significant differences between the duct and cutting position concentrations(P(T$t)=0.3269). Because of this result, no correction for enclosure efficiency was made to the cuttingfluid mist generation rate data collected in this study.
From the tracer gas measurements, the air flow rate through the machine enclosure can be calculatedfrom Equation 2. In Equation 2, CDuct was determined by calculating the mean concentration from thefive duct concentration samples for each enclosure. The Tongil machining center’s calculated exhaustair flow rate was 14.44 m3/min (510.0 CFM). This compared closely to the pitot tube traverse flowrate of 14.36 m3/min (507.2 CFM). The pressure drop measurements for the pitot tube traverse arealso given in Appendix D.
Aerosol Measurement ResultsThe aerosol data from the APSs were exported by the APS software to text files, which were thenimported into individual Excel spreadsheets. Data for particles smaller than 10.37 :m were included inthe calculations of the mist generation rates as earlier outlined in the Methodology section of this report. For the analysis of the data from this study, all data were log transformed, and residuals from the fittedmodels supported the log normality of the data. Three different models were developed to evaluate thecollected data. Similar models were used to evaluate flood and micro-lubrication separately, as well asthe ratio of flood to micro-lubrication. All three models took the form of the following:
ln(determination) errorprocess fluid process*fluid= + + + +µ α β α β (7)
where: : = overall mean,
14
"process = process effect, milling or drilling,$fluid = fluid effect, fluids 1-5 for flood and ratio models, 1-6 for micro-lubrication model,"$process*fluid = interaction between process and fluid effects, anderror = random components.
For all three models, the initial form of the error term was as follows:
error a b c
d e residualrep rep,process date(fluid,process, rep)
rep,fluid rep,fluid, process
= + +
+ + +(8)
where: arep = randomly chosen replicate effect,brep,process = randomly chosen process over replicates effect,cdate(fluid,process,rep) = randomly chosen date of measurement effect,drep,fluid = randomly chosen fluid over replicate effect, erep,fluid,process = randomly chosen fluid-process interaction over replication effect, andresidual = residual variability after accounting for the above effects.
Proc Mixed in the statistical analysis program SAS7 provided estimates for the fixed effects in themodel, as well as estimates of the variance components of the random effects. Likelihood methodswere used to reduce the number of terms in the error expression. A solution for each of the three fullmodels (flood, micro-lubrication, and the ratio of flood to micro-lubrication) was determined. A Waldtest was performed, whereby components of the error expression were removed from the model if theywere not significantly different from 0 at the 5% level. Only those components yielding a statisticallysignificant result, as well as the residual term, were retained in the model. For the flood analysis, all theerror components except the residual were eliminated, and the resulting model was as follows:
ln(flood) residualprocess fluid process*fluid= + + + +µ α β α β (9)
For the micro-lubrication model, all of the components except cdate(fluid,process,rep) (randomly chosen dateof measurement effect) and the residual were eliminated. Therefore, the model for micro-lubricationwas as follows:
ln(Micro lubrication)
c residualprocess fluid process*fluid
date(fluid,process,rep)
− = + + + +
+
µ α β α β(10)
Like the flood application, all terms except the residual were eliminated from the model for the ratio offlood to micro-lubrication, and was reduced to the following:
15
ln(ratio) residualprocess fluid process,fluid= + + +µ + α β α β (11)
The Wald test used here is intended for large samples. However, the replicate components for thisstudy are not based upon a large sample. Therefore, two alternative data analysis methods wereevaluated to see if a better test was available and to determine how well the initial test evaluated thedata. One alternative was to treat the random effects included in the original model as fixed effects. Using similar methods to eliminate terms which are not statistically significant, this alternative approachleads to flood and micro-lubrication models which included more statistically significant terms than theoriginal model. The model for the ratio of flood-to-micro-lubrication was the same. A major limitationwith this approach, though, is that there is no reason to assume that the test of the factors when treatedas fixed is equivalent to the test treating them as random. The result of this alternative approach, whileyielding different models in two of the three cases, did not alter the findings regarding the cutting fluidmist generation rates for micro-lubrication and flood application.
The other alternative approach evaluated the effects of replication without including replication in themodel. Because the second replication was not a full replication, this alternative approach evaluated thestudy data with and without the second replication data, and compared the two results. For most of thecomparison of interest, there was little difference in the conclusions from the two different analyses. The result of this approach, that replication variability is unimportant compared to the variability of otherfactors studied, suggests that the initial approach to the analysis of the data in this study is appropriateand the models from this approach are the ones used to estimate the cutting fluid mist generation ratesfor micro-lubrication and flood application.
Figure 5 shows the estimated cutting fluid mist generation rates for each fluid, machining process (millingor drilling), and fluid application method (flood or micro-lubrication). This figure also includes barsshowing the 95% confidence interval about the estimated generation rate. The axis of this chart isshown on the log scale, and the chart graphically illustrates the differences between the micro-lubrication and the flood fluid application methods. Values for the data displayed in Figure 5 are givenin Table 2 for drilling and Table 3 for milling. Unless otherwise indicated, significance is at the 5% level.
This study was designed to test two different sets of hypotheses. The primary hypothesis was whetherthe mist generation rates for flood and micro-lubrication were statistically significantly different. Table 4gives the results of the ratio of flood application to micro-lubrication generation rates for the each fluidduring drilling and milling, while Figure 6 shows a chart comparing these ratios. The ratios were allsignificantly different from 1.0, indicating that flood application and micro-lubrication result insignificantly different cutting fluid mist generation rates.
Table 5 gives the results of the multiple comparison tests (Bonferroni method) conducted on the floodapplication to micro-lubrication ratios to evaluate the secondary hypothesis, that individual fluids weresignificantly different from each other. The results of the multiple comparison tests showed that, for

16
milling, none of the fluids were statistically significantly different from the others. For drilling, however,several of the comparisons showed significant differences.
Comparisons between machining operations were also made. Table 6 shows the results of thesecomparisons. Comparisons were made between milling and drilling for a given fluid and fluidapplication method. This comparison was made to help determine if differences in generation rateswere due to the fluid, the fluid application method, or the machining process.
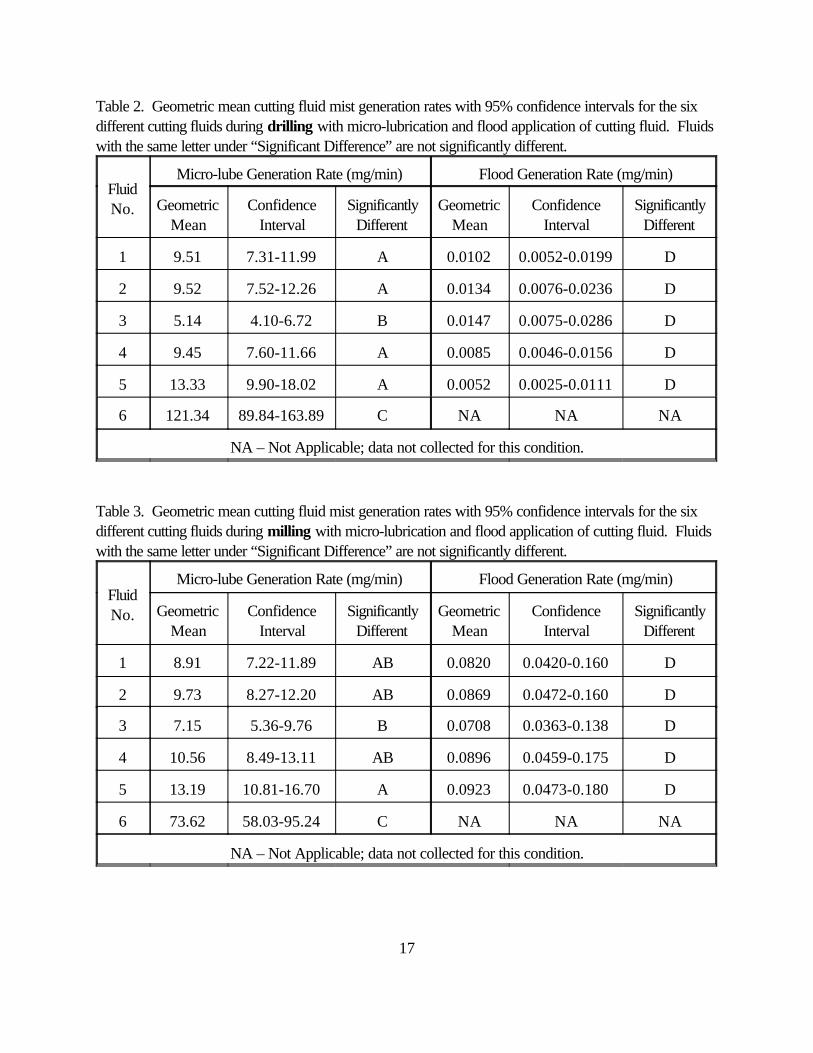
17
Table 2. Geometric mean cutting fluid mist generation rates with 95% confidence intervals for the sixdifferent cutting fluids during drilling with micro-lubrication and flood application of cutting fluid. Fluidswith the same letter under “Significant Difference” are not significantly different.
FluidNo.
Micro-lube Generation Rate (mg/min) Flood Generation Rate (mg/min)
GeometricMean
ConfidenceInterval
SignificantlyDifferent
GeometricMean
ConfidenceInterval
SignificantlyDifferent
1 9.51 7.31-11.99 A 0.0102 0.0052-0.0199 D
2 9.52 7.52-12.26 A 0.0134 0.0076-0.0236 D
3 5.14 4.10-6.72 B 0.0147 0.0075-0.0286 D
4 9.45 7.60-11.66 A 0.0085 0.0046-0.0156 D
5 13.33 9.90-18.02 A 0.0052 0.0025-0.0111 D
6 121.34 89.84-163.89 C NA NA NA
NA – Not Applicable; data not collected for this condition.
Table 3. Geometric mean cutting fluid mist generation rates with 95% confidence intervals for the sixdifferent cutting fluids during milling with micro-lubrication and flood application of cutting fluid. Fluidswith the same letter under “Significant Difference” are not significantly different.
FluidNo.
Micro-lube Generation Rate (mg/min) Flood Generation Rate (mg/min)
GeometricMean
ConfidenceInterval
SignificantlyDifferent
GeometricMean
ConfidenceInterval
SignificantlyDifferent
1 8.91 7.22-11.89 AB 0.0820 0.0420-0.160 D
2 9.73 8.27-12.20 AB 0.0869 0.0472-0.160 D
3 7.15 5.36-9.76 B 0.0708 0.0363-0.138 D
4 10.56 8.49-13.11 AB 0.0896 0.0459-0.175 D
5 13.19 10.81-16.70 A 0.0923 0.0473-0.180 D
6 73.62 58.03-95.24 C NA NA NA
NA – Not Applicable; data not collected for this condition.
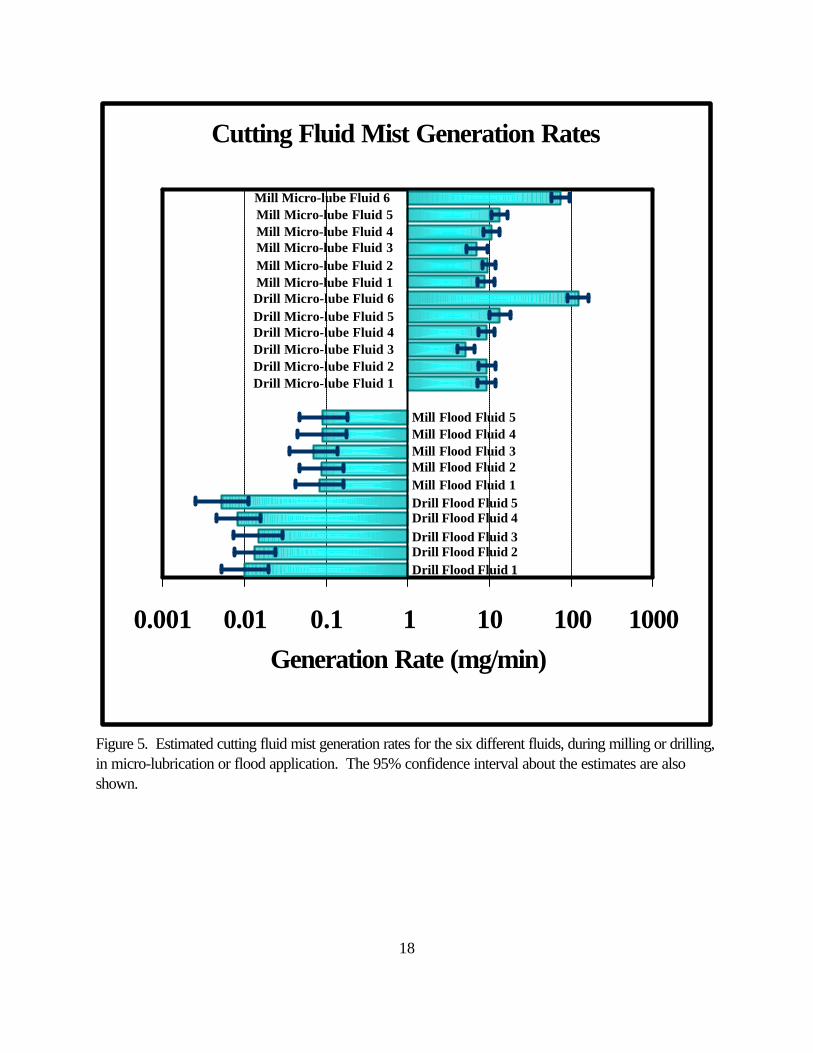
18
Cutting Fluid Mist Generation Rates
0.001 0.01 0.1 1 10 100 1000Generation Rate (mg/min)
Mill Micro-lube Fluid 6Mill Micro-lube Fluid 5Mill Micro-lube Fluid 4Mill Micro-lube Fluid 3Mill Micro-lube Fluid 2Mill Micro-lube Fluid 1Drill Micro-lube Fluid 6Drill Micro-lube Fluid 5Drill Micro-lube Fluid 4Drill Micro-lube Fluid 3Drill Micro-lube Fluid 2Drill Micro-lube Fluid 1
Mill Flood Fluid 5Mill Flood Fluid 4Mill Flood Fluid 3Mill Flood Fluid 2Mill Flood Fluid 1Drill Flood Fluid 5Drill Flood Fluid 4Drill Flood Fluid 3Drill Flood Fluid 2Drill Flood Fluid 1
Figure 5. Estimated cutting fluid mist generation rates for the six different fluids, during milling or drilling,in micro-lubrication or flood application. The 95% confidence interval about the estimates are alsoshown.
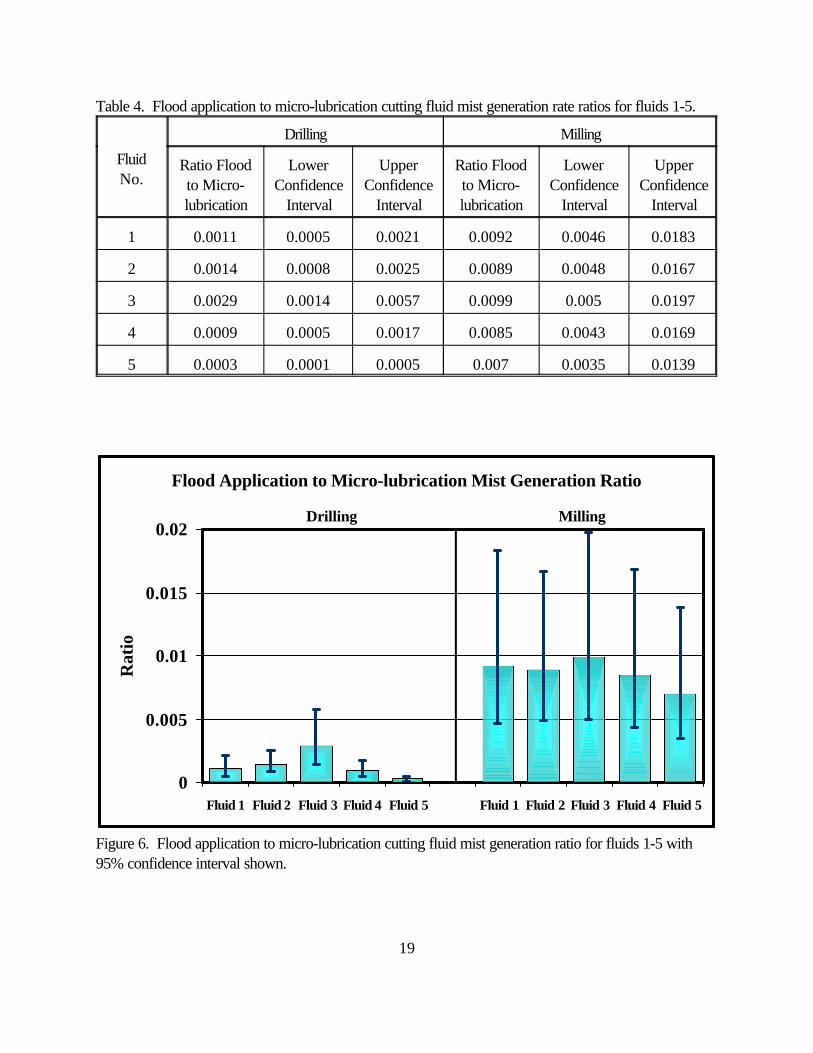
19
Flood Application to Micro-lubrication Mist Generation Ratio
0
0.005
0.01
0.015
0.02
Fluid 1 Fluid 2 Fluid 3 Fluid 4 Fluid 5 Fluid 1 Fluid 2 Fluid 3 Fluid 4 Fluid 5
Rat
io
Drilling Milling
Figure 6. Flood application to micro-lubrication cutting fluid mist generation ratio for fluids 1-5 with95% confidence interval shown.
Table 4. Flood application to micro-lubrication cutting fluid mist generation rate ratios for fluids 1-5.
FluidNo.
Drilling Milling
Ratio Floodto Micro-lubrication
LowerConfidence
Interval
UpperConfidence
Interval
Ratio Floodto Micro-lubrication
LowerConfidence
Interval
UpperConfidence
Interval
1 0.0011 0.0005 0.0021 0.0092 0.0046 0.0183
2 0.0014 0.0008 0.0025 0.0089 0.0048 0.0167
3 0.0029 0.0014 0.0057 0.0099 0.005 0.0197
4 0.0009 0.0005 0.0017 0.0085 0.0043 0.0169
5 0.0003 0.0001 0.0005 0.007 0.0035 0.0139
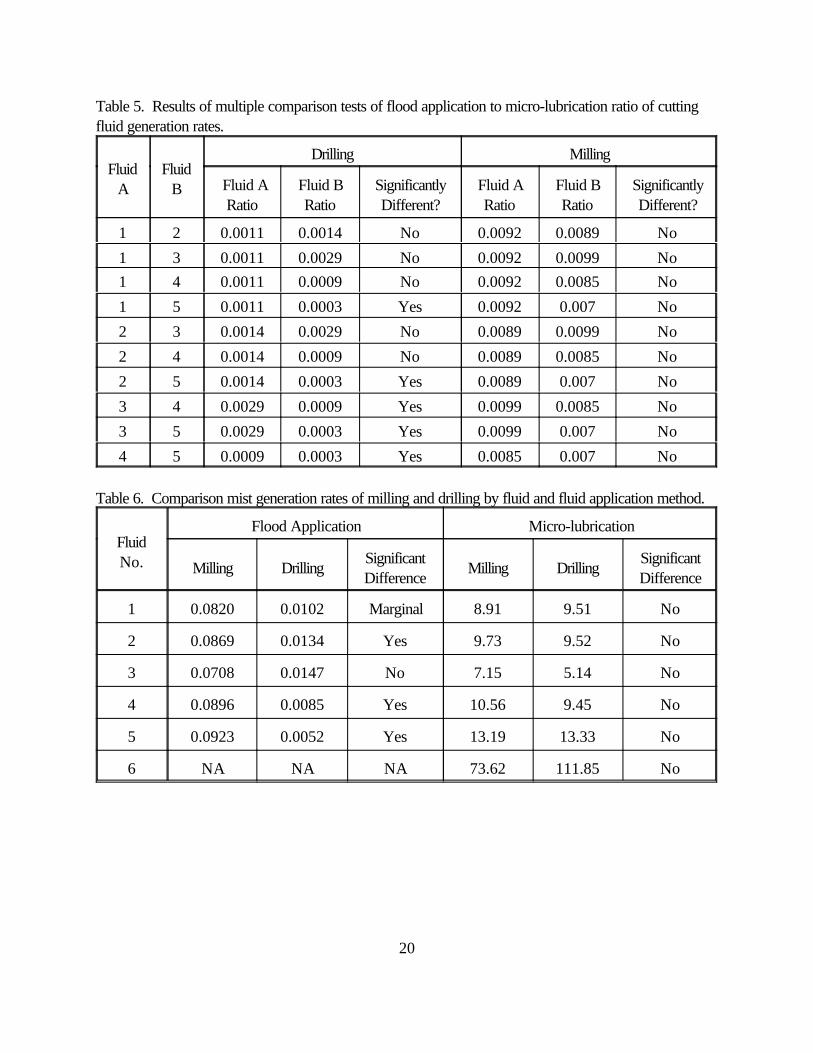
20
Table 5. Results of multiple comparison tests of flood application to micro-lubrication ratio of cuttingfluid generation rates.
FluidA
FluidB
Drilling Milling
Fluid ARatio
Fluid BRatio
SignificantlyDifferent?
Fluid ARatio
Fluid BRatio
SignificantlyDifferent?
1 2 0.0011 0.0014 No 0.0092 0.0089 No
1 3 0.0011 0.0029 No 0.0092 0.0099 No1 4 0.0011 0.0009 No 0.0092 0.0085 No
1 5 0.0011 0.0003 Yes 0.0092 0.007 No
2 3 0.0014 0.0029 No 0.0089 0.0099 No
2 4 0.0014 0.0009 No 0.0089 0.0085 No
2 5 0.0014 0.0003 Yes 0.0089 0.007 No
3 4 0.0029 0.0009 Yes 0.0099 0.0085 No
3 5 0.0029 0.0003 Yes 0.0099 0.007 No
4 5 0.0009 0.0003 Yes 0.0085 0.007 No
Table 6. Comparison mist generation rates of milling and drilling by fluid and fluid application method.
FluidNo.
Flood Application Micro-lubrication
Milling DrillingSignificantDifference
Milling DrillingSignificantDifference
1 0.0820 0.0102 Marginal 8.91 9.51 No
2 0.0869 0.0134 Yes 9.73 9.52 No
3 0.0708 0.0147 No 7.15 5.14 No
4 0.0896 0.0085 Yes 10.56 9.45 No
5 0.0923 0.0052 Yes 13.19 13.33 No
6 NA NA NA 73.62 111.85 No
21
DISCUSSION
The analysis of the data collected in this study showed statistically significant differences between themist generation rates for micro-lubrication and flood application of cutting fluids for the five differentfluids, in both milling and drilling. For milling, micro-lubrication had a mist generation rate of 100 to 140times the generation rate for flood application, depending on the cutting fluid. The differences fordrilling were more pronounced, with micro-lubrication generation rates being 340 to 3,300 times therates for drilling, depending on the cutting fluid. The flood application-to-micro-lubrication mistgenerations rate ratios were all significantly different from and less than 1.0. The smaller ratios indicatea greater difference between flood application and micro-lubrication. Fluids were compared byevaluating these flood application-to-micro-lubrication generations rate ratios against each other, bymachining process. As shown in Table 4, for drilling, Fluid 5 was significantly different than all of theother fluids, with the flood application-to-micro-lubrication generation rate ratios being lower (thedifference between flood application and micro-lubrication was greater). Fluid 3, in drilling, wassignificantly different than Fluids 1, 4, and 5. For Fluid 3, the flood application-to-micro-lubricationgeneration rate ratios were greater than the ratios for the other fluids (differences between floodapplication and micro-lubrication were not as great). For milling, none of the flood application-to-micro-lubrication generation rate ratios were significantly different.
The data collected in this study differed from the preliminary data collected for the purposes of thestudy design. First, the relative standard deviations for the flood data were much higher, approximately50%, than those measured in the preliminary tests, less than 25%. The relative standard deviations forthe micro-lubrication data were close to the relative standard deviations in the preliminary tests. As aresult, the power of the experiments would be diminished, meaning that the differences between thegeneration rates for flood application and micro-lubrication would need to be greater than the factor of4.0 assumed in the study design. In fact, the smallest micro-lubrication to flood generation rate ratiowas 100, much larger than anticipated. The reasons for the higher relative standard deviation for theflood data are unclear, but could have been due to a number of related factors. During the collection ofthe preliminary data, few activities occurred in the machining laboratory which would have contributedto higher background levels. Although the data were corrected for background aerosol levels, thebackground concentrations varied substantially during any particular sampling run. The mist generationrates during flood application were extremely low; the effects of background concentrations could havebeen substantial. During micro-lubrication application, however, mist generation rates were muchhigher, making the effects of the varying background concentration inconsequential. The low mistgeneration rates during flood application could also have been affected by certain cycles of the machine,namely the application of way oil. The way oil on this machine was applied pneumatically and couldhave contributed to the mist concentrations measured by the APS sampling from the ventilationductwork. Because the oil was applied within the enclosure, the way oil aerosols would not have beenmeasured by the background APS. And like the background concentrations, the generation of way oilaerosols, while potentially significant during flood application, would have been a minor component inthe aerosols measured during micro-lubrication.
22
Comparisons of the individual fluid generation rates within the fluid application method yielded someintriguing results. Comparisons were made within the machining process (milling or drilling) as well asacross the processes. The comparisons included within process, (comparing each of the fluids for agiven process, milling or drilling, and a given fluid application method, flood or micro-lubrication), withinfluid (comparing milling to drilling for a given fluid and given fluid application method), and within fluidapplication method (comparing one fluid to another across machining processes).
For flood application, five fluids were evaluated (Fluids 1-5 only; Fluid 6 was not used in floodapplication). As shown in Table 2, within drilling, none of the generation rates for a given cutting fluidwas significantly different from any other generation rate. The results for milling, shown in Table 3,were similar. The comparison of milling to drilling for a given fluid yielded a much different result, asshown in Table 6. For all fluids, milling had a mist generation rate that exceeded drilling generationrates in tests at the 5% significance level. On average over all fluids, the ratio of drilling to millinggeneration rates during flood application was about 0.10.
For micro-lubrication fluid application, six fluids were evaluated. As shown in Table 2, within drilling,Fluid 6 and Fluid 3 were statistically significantly different from each other and from the other fluidgeneration rates (adjusted p-value#0.05). Fluid 6 had a higher mist generation rate than the otherfluids, while Fluid 3 had a lower generation rate than all the others. For milling, shown in Table 3, theresults showed that the mist generation rate for Fluid 6 was statistically significantly higher than the otherfive fluids, while the generation rate for Fluid 3 was statistically significantly lower than the rates forFluids 5 and 6. Unlike flood, the comparison of milling to drilling for micro-lubrication for a given fluid,shown in Table 6, showed no statistically significant difference in mist generation rates for Fluids 1-5. For Fluid 6, the results are significantly different at the 5% level, with drilling being about 60% higherthan milling.
What do the results of these comparisons mean? In looking at the comparisons between milling anddrilling by fluid application method, the generation rate during micro-lubrication appears to beindependent of the machining process. Alternatively, during flood application, milling tended to result inhigher generation rates than drilling. In comparing the flood application-to-micro-lubrication generationrate ratios, drilling resulted in much lower ratios than milling or greater differences between floodapplication and micro-lubrication. The lower ratios, however, were not due to higher generation ratesduring micro-lubrication, but rather, lower generation rates for drilling during flood application. Therewere no significant differences between the generation rates for drilling and milling with micro-lubrication, suggesting that the contribution to the mist generation rate from the machining operation islimited. Most of the mist generated during micro-lubrication appears to derive from the fluid applicationequipment. During flood application, however, machining operation did have an impact, with severalfluids having a statistically significant difference between milling and drilling. These differences are evenmore profound considering the relative standard deviations for flood application were much higher thanfor micro-lubrication (about 50% versus about 12%).
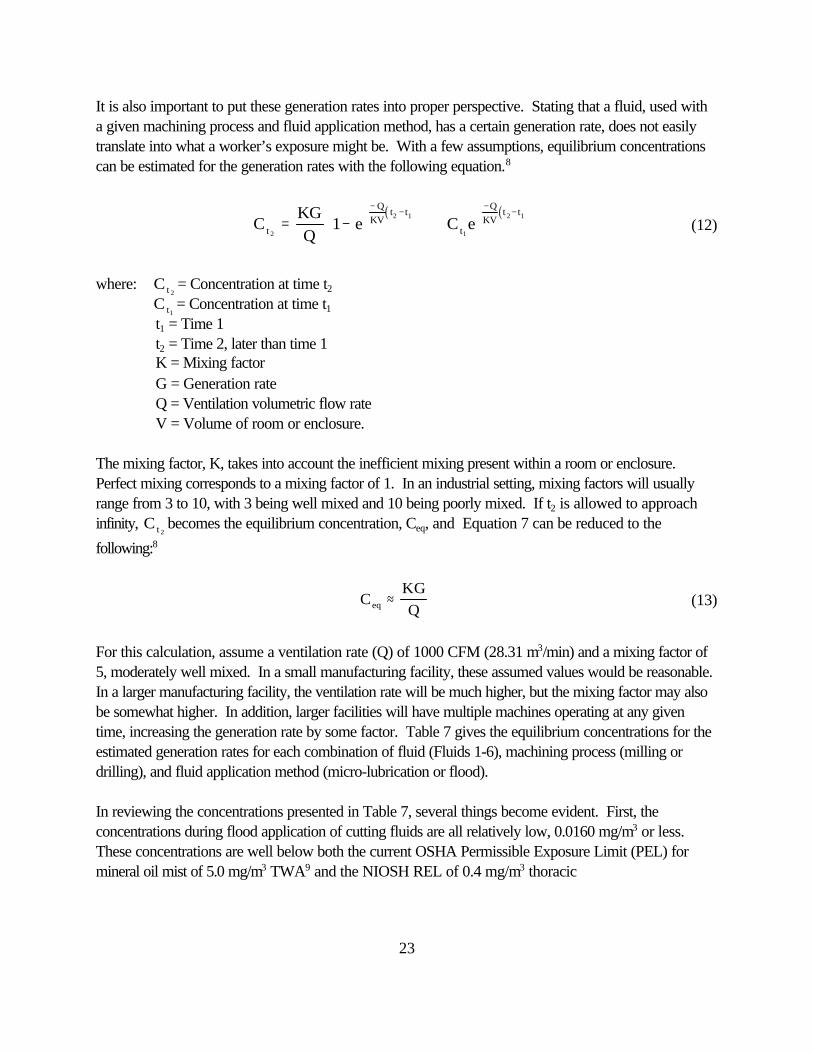
23
It is also important to put these generation rates into proper perspective. Stating that a fluid, used witha given machining process and fluid application method, has a certain generation rate, does not easilytranslate into what a worker’s exposure might be. With a few assumptions, equilibrium concentrationscan be estimated for the generation rates with the following equation.8
( ) ( )C
KGQ
1 e C et
QKV
t t
t
QKV
t t
2
2 1
1
2 1
= −
+−
−
−−
(12)
where: = Concentration at time t2C t 2
= Concentration at time t1C t1
t1 = Time 1 t2 = Time 2, later than time 1 K = Mixing factor G = Generation rate Q = Ventilation volumetric flow rate V = Volume of room or enclosure.
The mixing factor, K, takes into account the inefficient mixing present within a room or enclosure. Perfect mixing corresponds to a mixing factor of 1. In an industrial setting, mixing factors will usuallyrange from 3 to 10, with 3 being well mixed and 10 being poorly mixed. If t2 is allowed to approachinfinity, becomes the equilibrium concentration, Ceq, and Equation 7 can be reduced to theC t 2
following:8
CKGQeq ≈ (13)
For this calculation, assume a ventilation rate (Q) of 1000 CFM (28.31 m3/min) and a mixing factor of5, moderately well mixed. In a small manufacturing facility, these assumed values would be reasonable. In a larger manufacturing facility, the ventilation rate will be much higher, but the mixing factor may alsobe somewhat higher. In addition, larger facilities will have multiple machines operating at any giventime, increasing the generation rate by some factor. Table 7 gives the equilibrium concentrations for theestimated generation rates for each combination of fluid (Fluids 1-6), machining process (milling ordrilling), and fluid application method (micro-lubrication or flood).
In reviewing the concentrations presented in Table 7, several things become evident. First, theconcentrations during flood application of cutting fluids are all relatively low, 0.0160 mg/m3 or less. These concentrations are well below both the current OSHA Permissible Exposure Limit (PEL) formineral oil mist of 5.0 mg/m3 TWA9 and the NIOSH REL of 0.4 mg/m3 thoracic
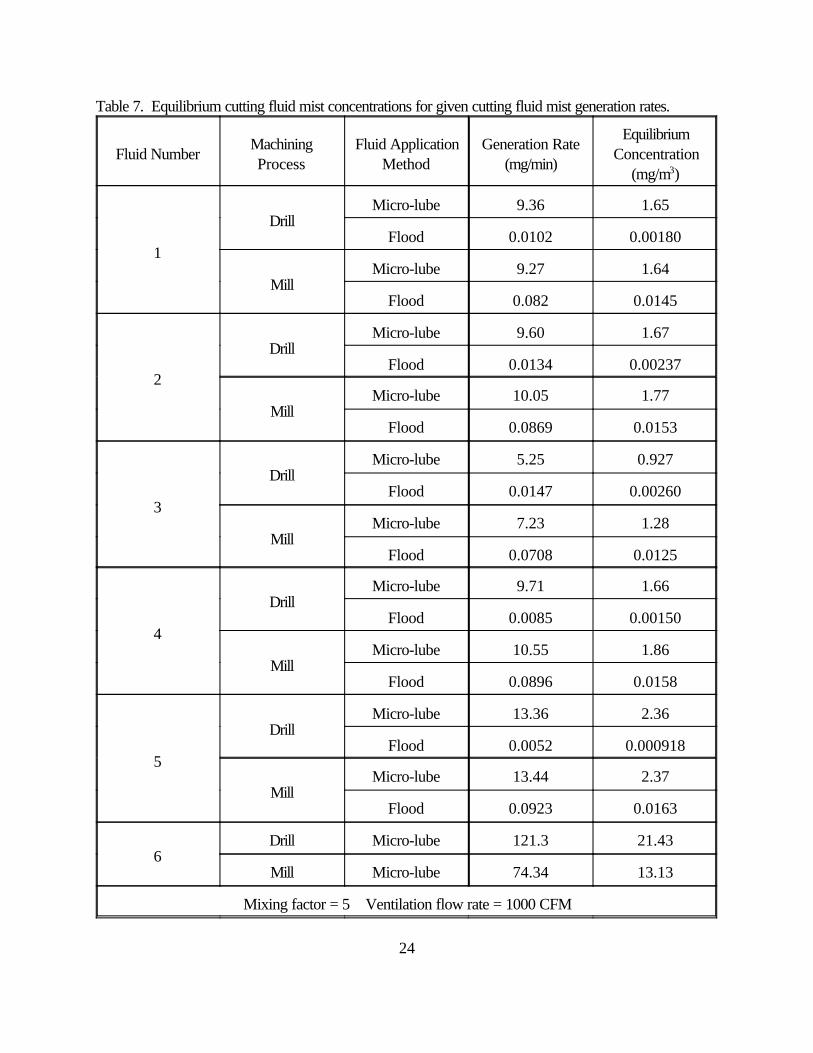
24
Table 7. Equilibrium cutting fluid mist concentrations for given cutting fluid mist generation rates.
Fluid NumberMachiningProcess
Fluid ApplicationMethod
Generation Rate(mg/min)
EquilibriumConcentration
(mg/m3)
1
DrillMicro-lube 9.36 1.65
Flood 0.0102 0.00180
MillMicro-lube 9.27 1.64
Flood 0.082 0.0145
2
DrillMicro-lube 9.60 1.67
Flood 0.0134 0.00237
MillMicro-lube 10.05 1.77
Flood 0.0869 0.0153
3
DrillMicro-lube 5.25 0.927
Flood 0.0147 0.00260
MillMicro-lube 7.23 1.28
Flood 0.0708 0.0125
4
DrillMicro-lube 9.71 1.66
Flood 0.0085 0.00150
MillMicro-lube 10.55 1.86
Flood 0.0896 0.0158
5
DrillMicro-lube 13.36 2.36
Flood 0.0052 0.000918
MillMicro-lube 13.44 2.37
Flood 0.0923 0.0163
6Drill Micro-lube 121.3 21.43
Mill Micro-lube 74.34 13.13
Mixing factor = 5 Ventilation flow rate = 1000 CFM
25
particle mass or 0.5 mg/m3 total particle mass.10 Second, the concentrations during micro-lubricationfor the soluble fluids (Fluids 1-5) are all relatively high, ranging from 0.927 to 2.37 mg/m3. Theseconcentrations were all above the NIOSH REL, approaching the OSHA PEL. Finally, for thesynthetic fluid used straight, the mist concentrations were estimated to be 21.43 mg/m3 and 13.13mg/m3 for drilling and milling, respectively. These levels are both well above both the NIOSH and theOSHA exposure criteria. These calculated concentrations suggest that worker exposures to cuttingfluid mists may be a problem when using the micro-lubrication fluid application method.
There are several limitations to the data collected in this study, the primary being the limited variation inthe machining parameters. Only milling and drilling were evaluated, and then only with a single set ofmachining conditions. Of the various machining parameters such as spindle speed, depth of cut, feedrate, metal hardness, metal type, etc., spindle speed is the one variable which may well have a dramaticimpact on the cutting fluid mist generation rate. The spindle can act as a spinning disk atomizer,generating aerosols as the fluid is sheared from the surface of the tool. At the slow spindle speedsaddressed in the study, aerosols generated in this manner would have been primarily larger particles,greater than 10 :m. The effects of process parameters affecting heat generation were also notevaluated. In addition to spindle speed, other parameters affecting the generation of heat include toolgeometry, metal removal rate (both feed rate and depth of cut), and metal hardness and type. Thegeneration of heat is a concern since evaporation and condensation of the cutting fluid is a mechanism ofcutting fluid mist generation.11 If a process generates more heat than was produced in this study (i.e.,during machining under severe conditions), cutting fluid mist generation rates would be expected toincrease due to the evaporation and condensation of the fluid sprayed into the cutting zone.
So what do these limitations mean to this study? Strictly speaking, the generation rates reported hereapply solely to the fluids tested under the machining conditions specified in the test methodology. However, given the magnitude of the differences in the cutting fluid mist generation rates between thetwo fluid application methods, micro-lubrication would be expected to result in higher cutting fluid mistgeneration rates than flood application for most milling and drilling applications. Similarly, many othermachining processes such as turning and boring, will likely behave in a similar fashion. Care should beused, however, when trying to extend these results to operations that are very different than milling ordrilling, such as grinding operation. In addition, while it is easy to say that micro-lubrication results in agreater cutting fluid mist generation rate than flood application, the magnitude of the differences mayvary greatly from one machining process to another.
CONCLUSIONS AND RECOMMENDATIONS
Based upon the data collected in this study, there are tremendous differences between the mistgeneration rates for micro-lubrication and flood application of cutting fluids. Under the conditionstested, micro-lubrication had cutting fluid mist generation rates 340 to 3,300 times the rates for floodapplication when drilling, and 100 to 140 times the rates when milling. While the machining conditionsfor the tests in this study would not be considered severe (relatively low RPM and metal removal rates),
26
differences between flood application and micro-lubrication cutting fluid mist generation rates would beexpected until machining conditions became much more aggressive, with significantly higher RPMs andmetal removal rates.
The evaluation of the six different cutting fluids also showed some statistically significant differences. Fluid 6, the straight synthetic fluid, had generation rates that were much higher than the soluble oilsevaluated. The estimated cutting fluid mist concentration calculations, shown in Table 7, showed thatthis fluid would likely result in workplace concentrations exceeding the current OSHA PEL and theNIOSH REL. There were some differences between the other soluble fluids as well, although none ofthe generation rates for these fluids were close to the generation rates for Fluid 6 in either drilling ormilling. For milling, there were no statistically significant differences in the flood application-to-micro-lubrication ratios. For drilling, the ratio for Fluid 5 was significantly smaller (the difference betweenflood application and micro-lubrication was greater) and the ratio for Fluid 3 was significantly greaterthan Fluid 4 and 5 (the difference between flood application and micro-lubrication was smaller for Fluid3). The primary conclusion from this analysis is that there are differences from one fluid to the next, butmore significantly, some types of fluids, as demonstrated by Fluid 6, may result in extremely highworker exposures.
Like so many others, this study raises quite a number of questions that warrant further investigation. Chief among these is the issue of machining parameters and their effects upon mist generation. In thisstudy, only a single set of machining parameters was evaluated for each machining process (milling anddrilling). The effects of such parameters as cutting speeds, metal removal rates, tool geometry, materialhardness, and metal type, could not be evaluated. Many of these factors may have impacted on thecutting fluid mist generation rates. Cutting speeds, particularly those associated with highspeedmachining, may well contribute to higher mist generation rates for both micro-lubrication and floodapplication of cutting fluids. Material may also have an impact on mist generation, as the heat generatedby the machining process will depend, among other things, upon the metal being machined. Greaterheat generation may result in high rates of evaporation and condensation of the cutting fluid, which inturn, could lead to a higher mist generation rate. Further research into some of these areas would helpplace the results of this current study into a better perspective.
Another area for additional research is on the micro-lubrication equipment. The lack of statisticallysignificant differences between milling and drilling during micro-lubrication suggests that the primarysource of mist generation comes not from the machining process, but from the delivery of the cuttingfluid through the application equipment. A single unit, the Unist equipment, was used in this study. Another micro-lubrication unit will be part of a limited evaluation by TechSolve in the near future. Thissecond unit is a much more complex device than the Unist unit, but its effect on cutting fluid mistgeneration is unknown. In addition to evaluating other micro-lubrication equipment available on themarket, further research on the design of the units is also needed. For example, would it be possible todevelop a micro-lubrication unit that did not generate mists of less than 10 :m, while at the same time,delivering similar machining performance? Most of the micro-lubrication units allowed for the
27
1. Northcott, WH: A Treatise on Lathes and Turning. Longmans Green and Company. London,1868.
2. Taylor, FW: On the Art of Metal Cutting. ASME. New York 1906.
3. Heitbrink, WA; Baron, P: Coincidence in Time-of-Flight Aerosol Spectrometer: PhantomParticle Creation. Aerosol Sci Tech 14:112-126. 1991
4. American Conference of Government Industrial Hygienists (ACGIH): Industrial Ventilation —A Manual of Recommended Practice, 23rd edition. Cincinnati, Ohio. 1996.
5. Earnest, GS; Heitbrink, WA; Mickelsen, RL; Mead, KR; D’Arcy, JB: Leakage from a MetalMachining Center – A Case Study. AAMA Symposium Proceedings: MetalworkingSymposium II – The Industrial Metalworking Environment: Assessment and Control of MetalRemoval Fluids, September 15-18, 1997, Detroit, Michigan. pp 163-167. American
adjustment of the fluid flow rate, and could operate at a range of air pressures. (Many, if not most ofthe units, required shop compressed air to deliver the fluid to the cutting zone.) What effects wouldfluid flow rate and air pressure have on the cutting fluid mist generation rates? The list of potentialresearch topics focusing on the micro-lubrication delivery units could be substantial.
The magnitude of the cutting fluid mist generation rates should be of concern. The estimated workplaceconcentration calculations showed that while all of the fluids applied using flood application resulted inconcentrations below the NIOSH REL and the OSHA PEL, all of the fluids applied using micro-lubrication resulted in concentrations exceeding the REL, with several approaching or exceeding thePEL. Because of the high mist generation rates associated with it, machining facilities interested inimplementing micro-lubrication should also make provisions for adequate machine enclosure, exhaustventilation, and air cleaning.12 Air cleaning will be vitally important, as this equipment will be required tohandle heavy mist loadings. Due to the size of the mist, the air cleaners also need to have high aerosolremoval efficiencies.
Micro-lubrication represents an opportunity to reduce the amount of cutting fluid being disposed, whilepotentially providing improved machining performance. It represents a departure from the moretraditional flood application of cutting fluids, exemplifying the idea of “doing more with less.” Theseprocess improvements, however, appear to come with their own set of challenges. While micro-lubrication would reduce the potential for occupational exposures to biologically contaminated fluids(micro-lubrication fluids are not recycled), micro-lubrication may also dramatically increase the potentialfor occupational exposures to cutting fluid mists. These challenges need to be adequately addressed sothat the advantages of micro-lubrication can be realized without jeopardizing the health and safety of theworkers operating these machining processes.
REFERENCES
28
Automobile Manufacturers Association, Washington D.C. 1998.
6. TechSolve: Pollution Prevention Guide to Using Metal Removal Fluids in MachiningOperations. http://www.iams.org/machine_xcellence/fluid_testing.htm. Institute for AdvancedManufacturing Sciences, Inc. Cincinnati, Ohio.
7. SAS Institute: SAS/STAT Software. Version 8.00. SAS Institute. Cary, North Carolina. 1999.
8. Gressel, MG; Heitbrink, WA; ed: Analyzing Workplace Exposures Using Direct ReadingInstruments and Video Exposure Monitoring Techniques. DHHS (NIOSH) Publication No.92-104. National Institute for Occupational Safety and Health, Cincinnati, Ohio. 1992.
9. Code of Federal Regulations. 29 CFR 1910.1000 Air Contaminants.
10. NIOSH: Criteria for a Recommended Standard: Occupational Exposure to MetalworkingFluids. DHHS (NIOSH) Publication No. 98-102. National Institute for Occupational Safetyand health, Cincinnati, Ohio. 1998.
11. Leith, D; Thornburg, J: Grant Report: Factors that Affect Generation of Coolant Mists. NIOSH Grant No. R01 0H03293-02. University of North Carolina. 1999.
12. Yacher, JM; Heitbrink, WA, Burroughs, GE: Mist control at a machining center, Part 2: Mistcontrol following installation of air cleaners. American Industrial Hygiene Association Journal. 61(2):282-289. 2000
Microlubrication in Metal Machining Operations Report # 320-889-302
Page 51 of 126
APPENDIX 2
Unist, Inc.’s
Response to Results of Microlubrication Study
Unist, Inc.
4134 36th Street, SE
Grand Rapids, MI 49512
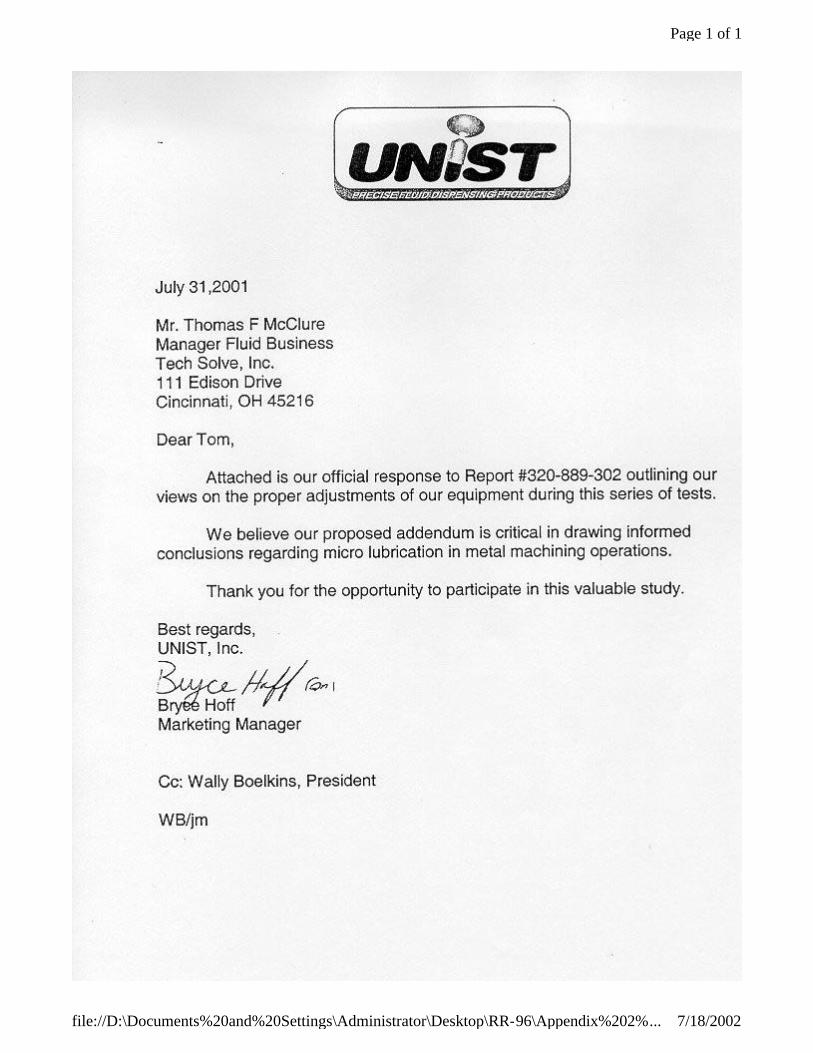
Page 1 of 1
7/18/2002file://D:\Documents%20and%20Settings\Administrator\Desktop\RR-96\Appendix%202%...
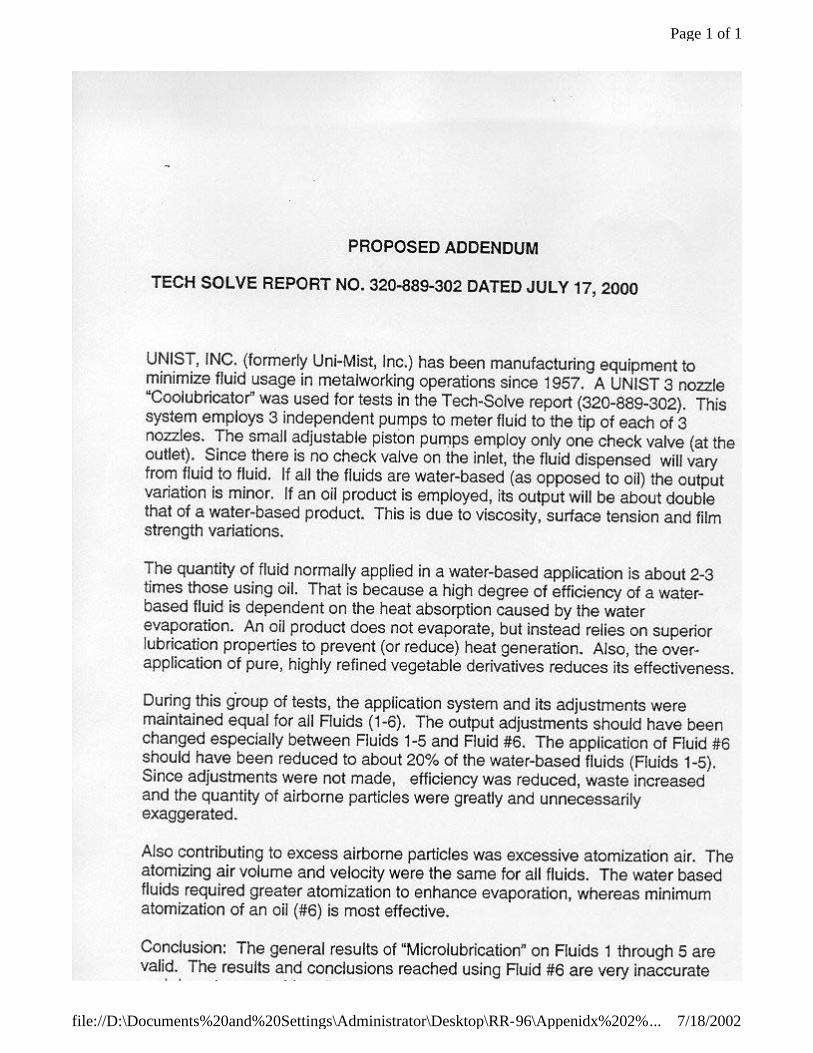
Page 1 of 1
7/18/2002file://D:\Documents%20and%20Settings\Administrator\Desktop\RR-96\Appenidx%202%...
Microlubrication in Metal Machining Operations Report # 320-889-302
Page 54 of 126
APPENDIX 3
Tabular Results
of Tool Wear and Thrust Force
Measurements from
International Working Industry Group Drilling
Test
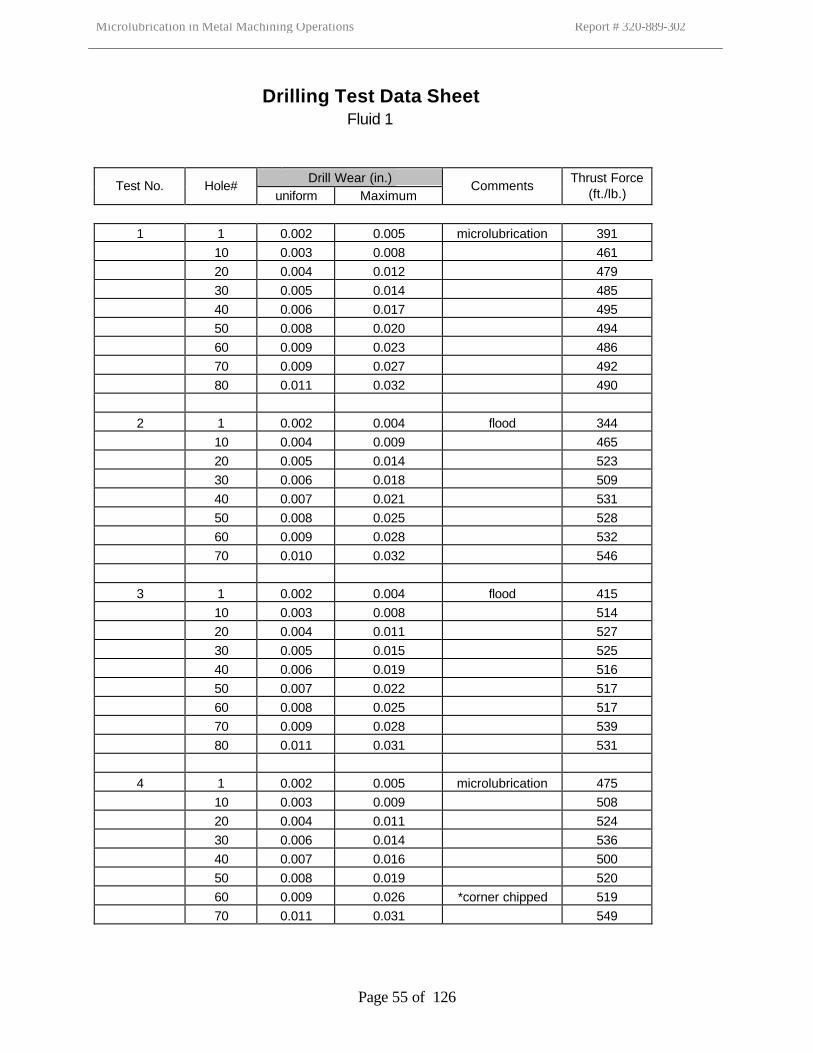
Microlubrication in Metal Machining Operations Report # 320-889-302
Page 55 of 126
Drilling Test Data Sheet Fluid 1
Drill Wear (in.) Test No. Hole#
uniform Maximum Comments
Thrust Force (ft./lb.)
1 1 0.002 0.005 microlubrication 391 10 0.003 0.008 461 20 0.004 0.012 479 30 0.005 0.014 485 40 0.006 0.017 495 50 0.008 0.020 494 60 0.009 0.023 486 70 0.009 0.027 492 80 0.011 0.032 490 2 1 0.002 0.004 flood 344 10 0.004 0.009 465 20 0.005 0.014 523 30 0.006 0.018 509 40 0.007 0.021 531 50 0.008 0.025 528 60 0.009 0.028 532 70 0.010 0.032 546 3 1 0.002 0.004 flood 415 10 0.003 0.008 514 20 0.004 0.011 527 30 0.005 0.015 525 40 0.006 0.019 516 50 0.007 0.022 517 60 0.008 0.025 517 70 0.009 0.028 539 80 0.011 0.031 531 4 1 0.002 0.005 microlubrication 475 10 0.003 0.009 508 20 0.004 0.011 524 30 0.006 0.014 536 40 0.007 0.016 500 50 0.008 0.019 520 60 0.009 0.026 *corner chipped 519 70 0.011 0.031 549
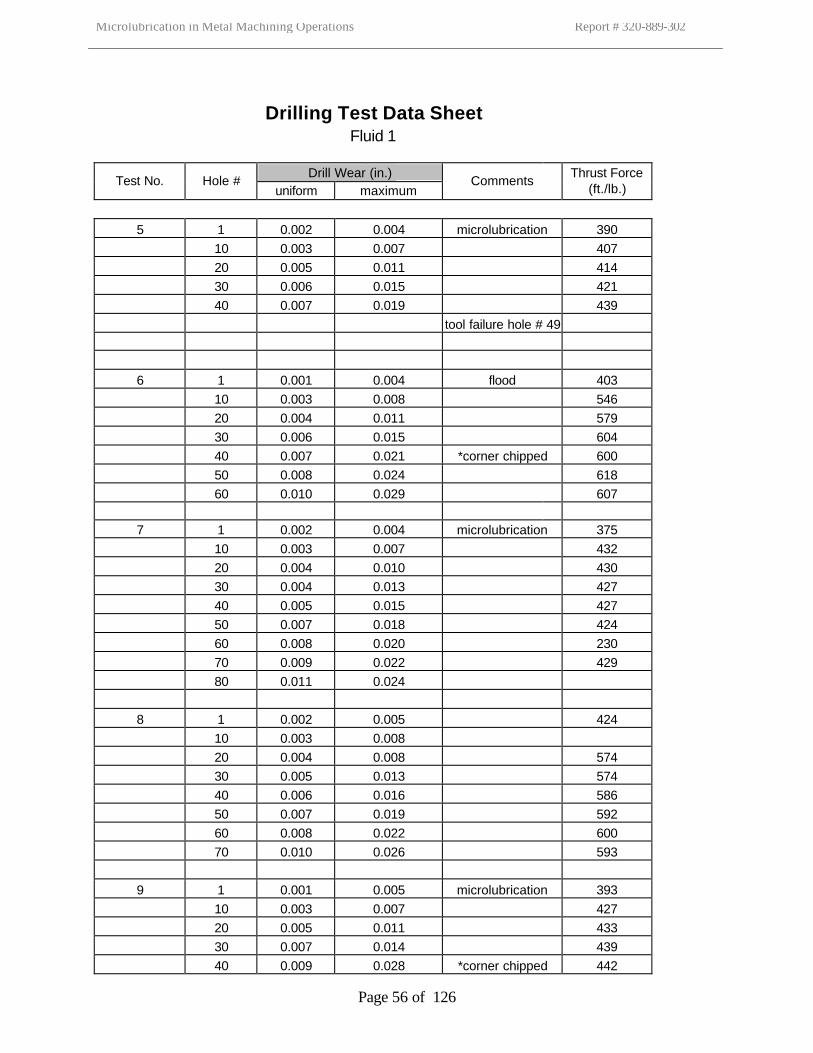
Microlubrication in Metal Machining Operations Report # 320-889-302
Page 56 of 126
Drilling Test Data Sheet Fluid 1
Drill Wear (in.)
Test No. Hole # uniform maximum
Comments Thrust Force
(ft./lb.)
5 1 0.002 0.004 microlubrication 390 10 0.003 0.007 407 20 0.005 0.011 414 30 0.006 0.015 421 40 0.007 0.019 439 tool failure hole # 49 6 1 0.001 0.004 flood 403 10 0.003 0.008 546 20 0.004 0.011 579 30 0.006 0.015 604 40 0.007 0.021 *corner chipped 600 50 0.008 0.024 618 60 0.010 0.029 607 7 1 0.002 0.004 microlubrication 375 10 0.003 0.007 432 20 0.004 0.010 430 30 0.004 0.013 427 40 0.005 0.015 427 50 0.007 0.018 424 60 0.008 0.020 230 70 0.009 0.022 429 80 0.011 0.024 8 1 0.002 0.005 424 10 0.003 0.008 20 0.004 0.008 574 30 0.005 0.013 574 40 0.006 0.016 586 50 0.007 0.019 592 60 0.008 0.022 600 70 0.010 0.026 593 9 1 0.001 0.005 microlubrication 393 10 0.003 0.007 427 20 0.005 0.011 433 30 0.007 0.014 439 40 0.009 0.028 *corner chipped 442
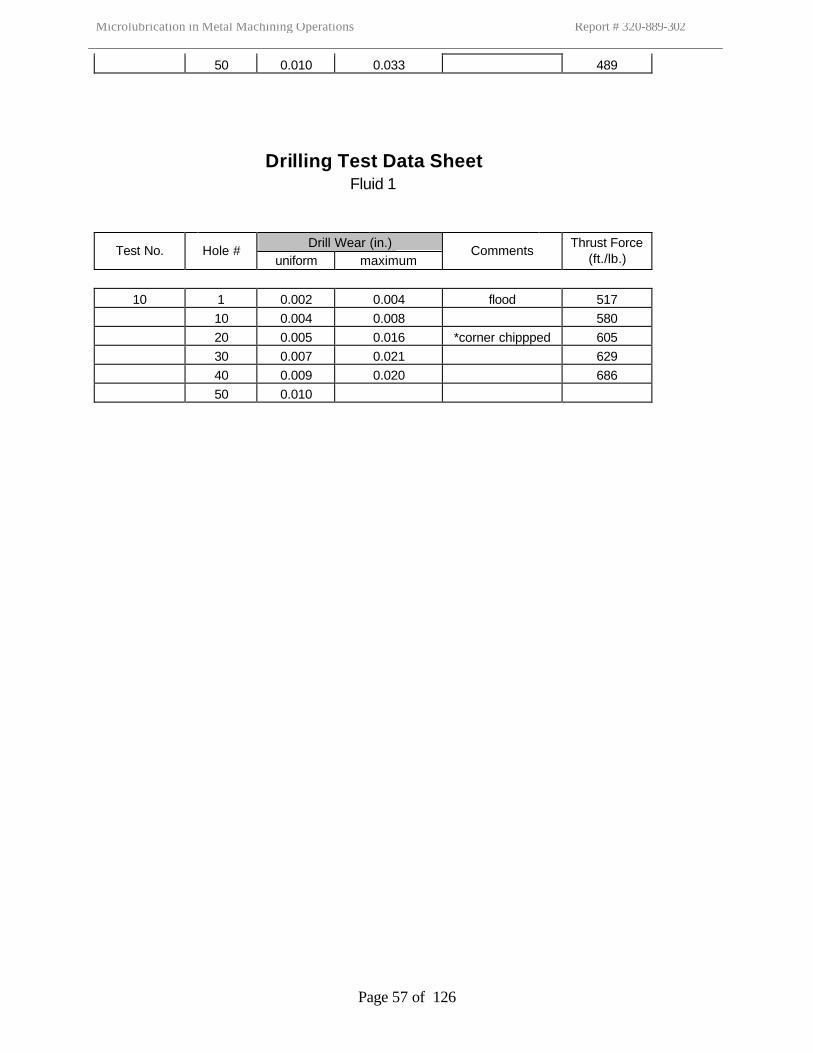
Microlubrication in Metal Machining Operations Report # 320-889-302
Page 57 of 126
50 0.010 0.033 489
Drilling Test Data Sheet Fluid 1
Drill Wear (in.) Test No. Hole #
uniform maximum Comments
Thrust Force (ft./lb.)
10 1 0.002 0.004 flood 517 10 0.004 0.008 580 20 0.005 0.016 *corner chippped 605 30 0.007 0.021 629 40 0.009 0.020 686 50 0.010
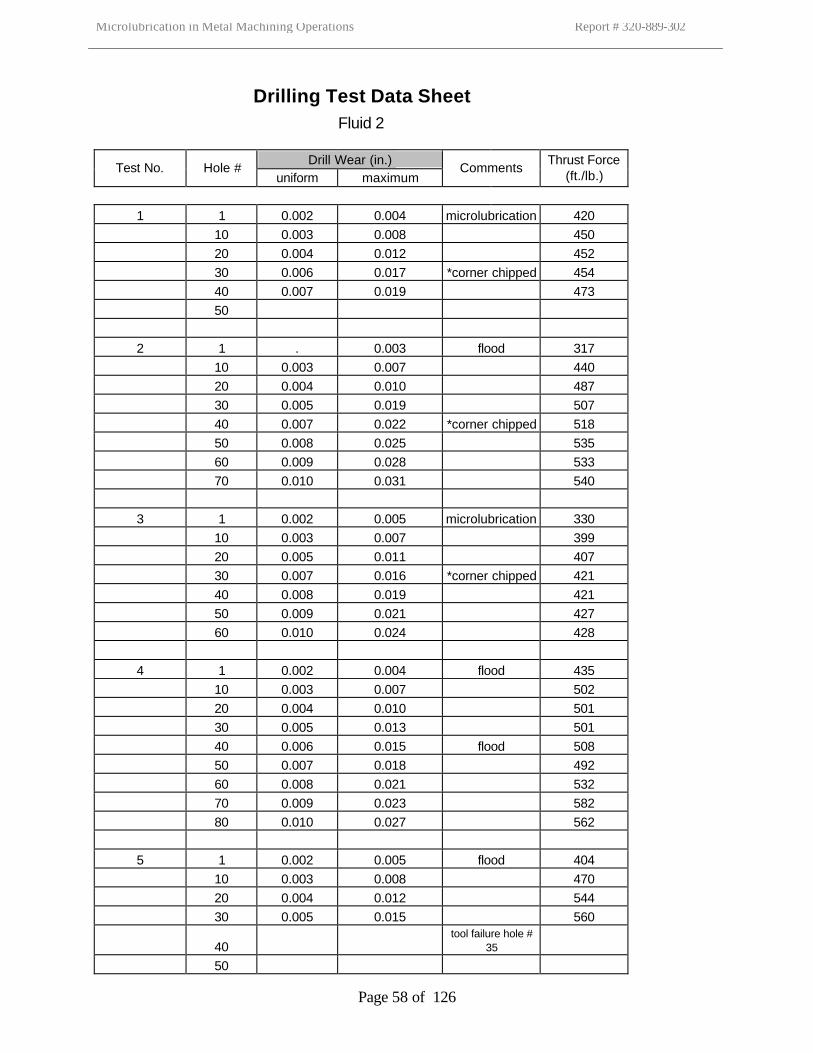
Microlubrication in Metal Machining Operations Report # 320-889-302
Page 58 of 126
Drilling Test Data Sheet Fluid 2
Drill Wear (in.)
Test No. Hole # uniform maximum
Comments Thrust Force
(ft./lb.)
1 1 0.002 0.004 microlubrication 420 10 0.003 0.008 450 20 0.004 0.012 452 30 0.006 0.017 *corner chipped 454 40 0.007 0.019 473 50 2 1 . 0.003 flood 317 10 0.003 0.007 440 20 0.004 0.010 487 30 0.005 0.019 507 40 0.007 0.022 *corner chipped 518 50 0.008 0.025 535 60 0.009 0.028 533 70 0.010 0.031 540 3 1 0.002 0.005 microlubrication 330 10 0.003 0.007 399 20 0.005 0.011 407 30 0.007 0.016 *corner chipped 421 40 0.008 0.019 421 50 0.009 0.021 427 60 0.010 0.024 428 4 1 0.002 0.004 flood 435 10 0.003 0.007 502 20 0.004 0.010 501 30 0.005 0.013 501 40 0.006 0.015 flood 508 50 0.007 0.018 492 60 0.008 0.021 532 70 0.009 0.023 582 80 0.010 0.027 562 5 1 0.002 0.005 flood 404 10 0.003 0.008 470 20 0.004 0.012 544 30 0.005 0.015 560
40 tool failure hole #
35 50
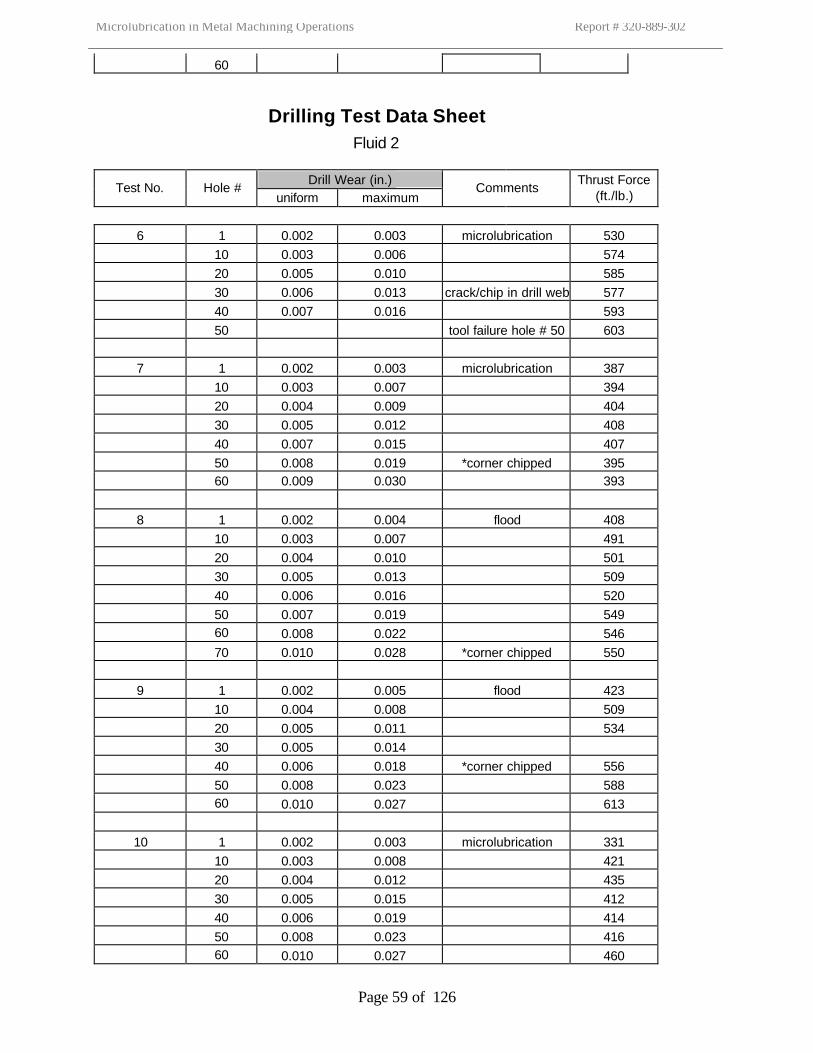
Microlubrication in Metal Machining Operations Report # 320-889-302
Page 59 of 126
60
Drilling Test Data Sheet Fluid 2
Drill Wear (in.)
Test No. Hole # uniform maximum
Comments Thrust Force
(ft./lb.)
6 1 0.002 0.003 microlubrication 530 10 0.003 0.006 574 20 0.005 0.010 585 30 0.006 0.013 crack/chip in drill web 577 40 0.007 0.016 593 50 tool failure hole # 50 603 7 1 0.002 0.003 microlubrication 387 10 0.003 0.007 394 20 0.004 0.009 404 30 0.005 0.012 408 40 0.007 0.015 407 50 0.008 0.019 *corner chipped 395 60 0.009 0.030 393
8 1 0.002 0.004 flood 408 10 0.003 0.007 491 20 0.004 0.010 501 30 0.005 0.013 509 40 0.006 0.016 520 50 0.007 0.019 549 60 0.008 0.022 546 70 0.010 0.028 *corner chipped 550 9 1 0.002 0.005 flood 423 10 0.004 0.008 509 20 0.005 0.011 534 30 0.005 0.014 40 0.006 0.018 *corner chipped 556 50 0.008 0.023 588 60 0.010 0.027 613
10 1 0.002 0.003 microlubrication 331 10 0.003 0.008 421 20 0.004 0.012 435 30 0.005 0.015 412 40 0.006 0.019 414 50 0.008 0.023 416 60 0.010 0.027 460
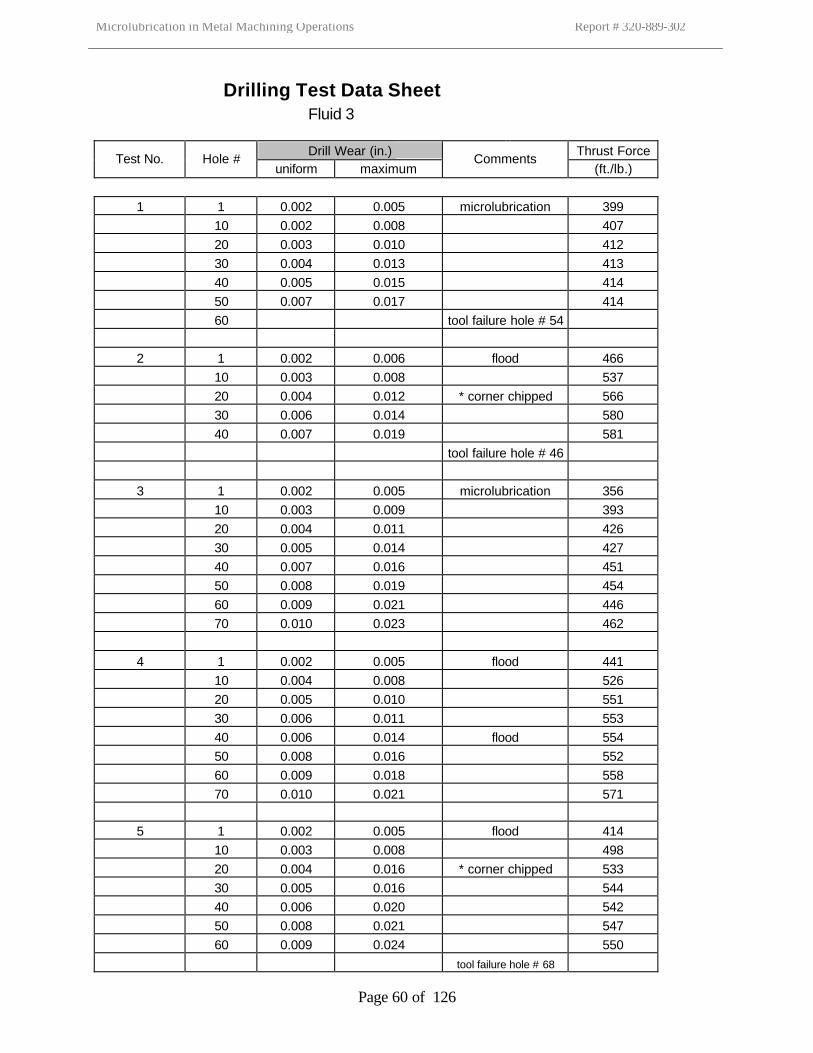
Microlubrication in Metal Machining Operations Report # 320-889-302
Page 60 of 126
Drilling Test Data Sheet
Fluid 3
Drill Wear (in.) Thrust Force Test No. Hole #
uniform maximum Comments
(ft./lb.) 1 1 0.002 0.005 microlubrication 399 10 0.002 0.008 407 20 0.003 0.010 412 30 0.004 0.013 413 40 0.005 0.015 414 50 0.007 0.017 414 60 tool failure hole # 54 2 1 0.002 0.006 flood 466 10 0.003 0.008 537 20 0.004 0.012 * corner chipped 566 30 0.006 0.014 580 40 0.007 0.019 581 tool failure hole # 46 3 1 0.002 0.005 microlubrication 356 10 0.003 0.009 393 20 0.004 0.011 426 30 0.005 0.014 427 40 0.007 0.016 451 50 0.008 0.019 454 60 0.009 0.021 446 70 0.010 0.023 462 4 1 0.002 0.005 flood 441 10 0.004 0.008 526 20 0.005 0.010 551 30 0.006 0.011 553 40 0.006 0.014 flood 554 50 0.008 0.016 552 60 0.009 0.018 558 70 0.010 0.021 571 5 1 0.002 0.005 flood 414 10 0.003 0.008 498 20 0.004 0.016 * corner chipped 533 30 0.005 0.016 544 40 0.006 0.020 542 50 0.008 0.021 547 60 0.009 0.024 550 tool failure hole # 68
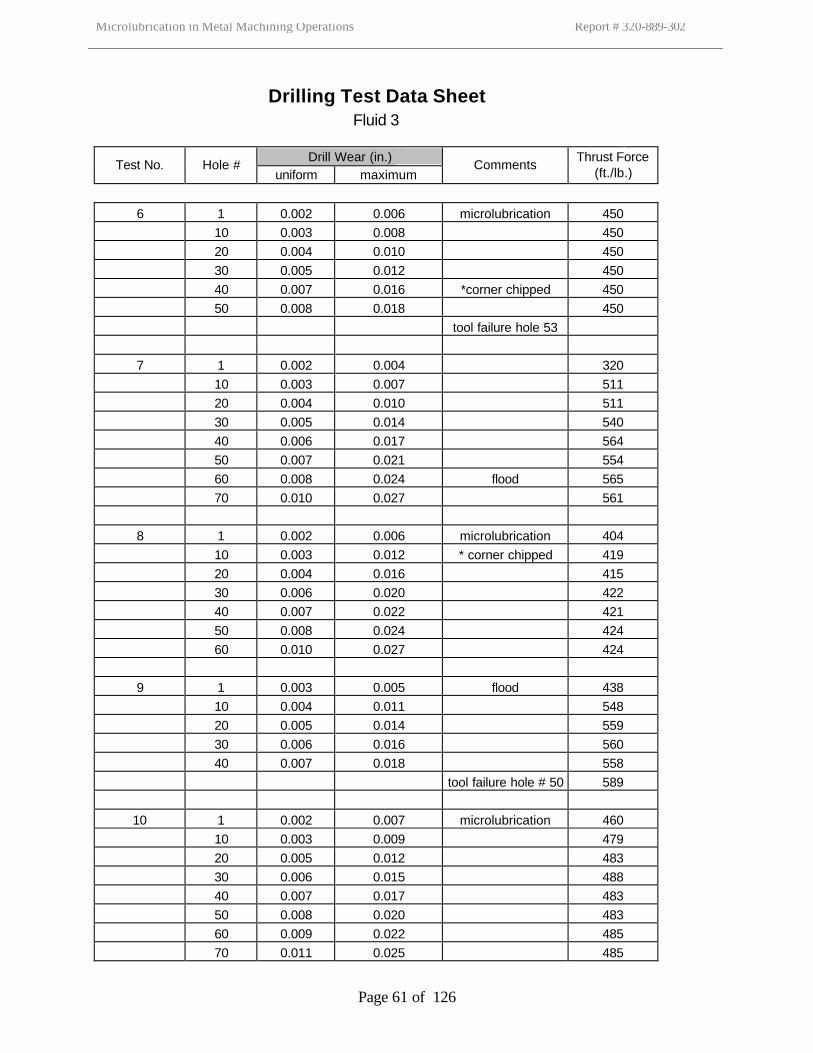
Microlubrication in Metal Machining Operations Report # 320-889-302
Page 61 of 126
Drilling Test Data Sheet Fluid 3
Drill Wear (in.)
Test No. Hole # uniform maximum
Comments Thrust Force
(ft./lb.)
6 1 0.002 0.006 microlubrication 450 10 0.003 0.008 450 20 0.004 0.010 450 30 0.005 0.012 450 40 0.007 0.016 *corner chipped 450 50 0.008 0.018 450 tool failure hole 53 7 1 0.002 0.004 320 10 0.003 0.007 511 20 0.004 0.010 511 30 0.005 0.014 540 40 0.006 0.017 564 50 0.007 0.021 554 60 0.008 0.024 flood 565 70 0.010 0.027 561 8 1 0.002 0.006 microlubrication 404 10 0.003 0.012 * corner chipped 419 20 0.004 0.016 415 30 0.006 0.020 422 40 0.007 0.022 421 50 0.008 0.024 424 60 0.010 0.027 424 9 1 0.003 0.005 flood 438 10 0.004 0.011 548 20 0.005 0.014 559 30 0.006 0.016 560 40 0.007 0.018 558 tool failure hole # 50 589
10 1 0.002 0.007 microlubrication 460 10 0.003 0.009 479 20 0.005 0.012 483 30 0.006 0.015 488 40 0.007 0.017 483 50 0.008 0.020 483 60 0.009 0.022 485 70 0.011 0.025 485
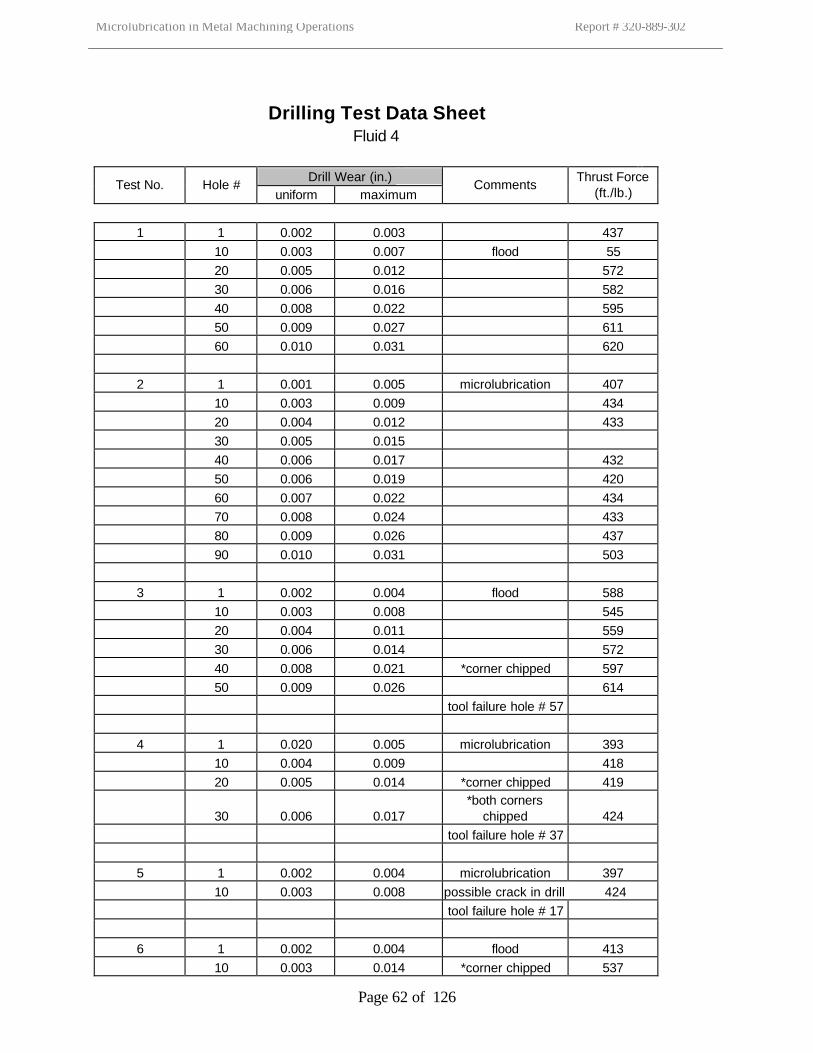
Microlubrication in Metal Machining Operations Report # 320-889-302
Page 62 of 126
Drilling Test Data Sheet Fluid 4
Drill Wear (in.)
Test No. Hole # uniform maximum
Comments Thrust Force
(ft./lb.)
1 1 0.002 0.003 437 10 0.003 0.007 flood 55 20 0.005 0.012 572 30 0.006 0.016 582 40 0.008 0.022 595 50 0.009 0.027 611 60 0.010 0.031 620 2 1 0.001 0.005 microlubrication 407 10 0.003 0.009 434 20 0.004 0.012 433 30 0.005 0.015 40 0.006 0.017 432 50 0.006 0.019 420 60 0.007 0.022 434 70 0.008 0.024 433 80 0.009 0.026 437 90 0.010 0.031 503 3 1 0.002 0.004 flood 588 10 0.003 0.008 545 20 0.004 0.011 559 30 0.006 0.014 572 40 0.008 0.021 *corner chipped 597 50 0.009 0.026 614 tool failure hole # 57 4 1 0.020 0.005 microlubrication 393 10 0.004 0.009 418 20 0.005 0.014 *corner chipped 419
30 0.006 0.017 *both corners
chipped 424 tool failure hole # 37 5 1 0.002 0.004 microlubrication 397 10 0.003 0.008 possible crack in drill 424 tool failure hole # 17 6 1 0.002 0.004 flood 413 10 0.003 0.014 *corner chipped 537
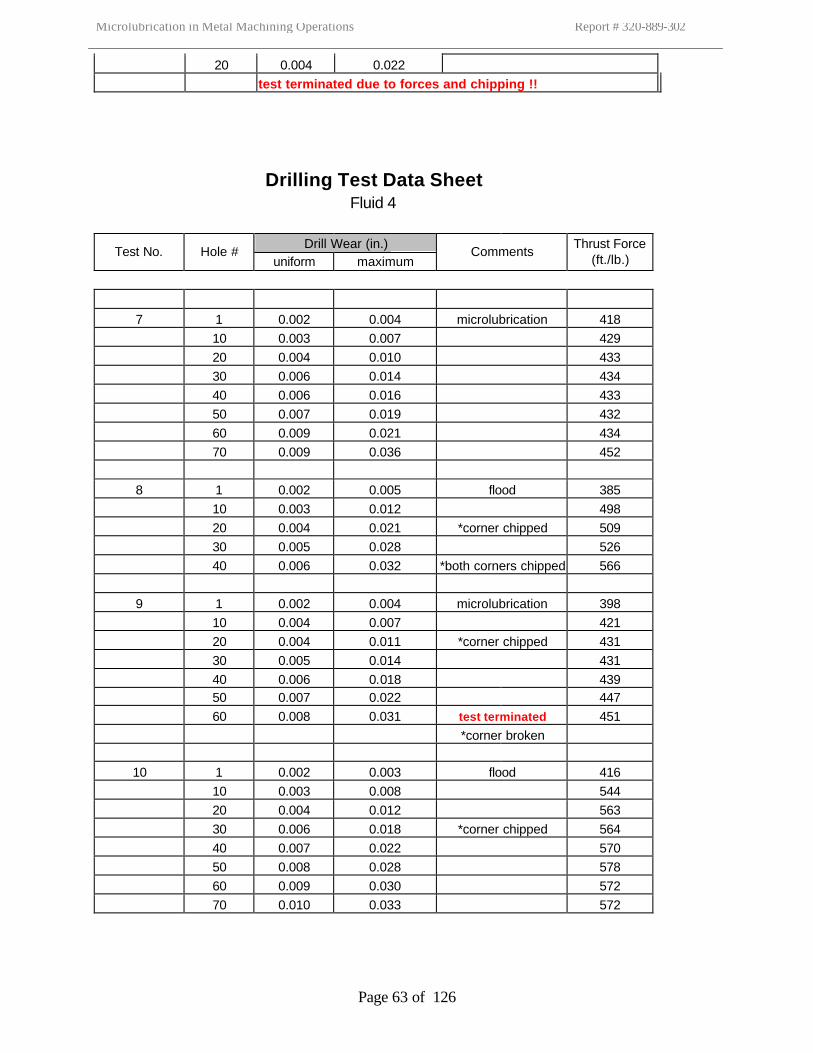
Microlubrication in Metal Machining Operations Report # 320-889-302
Page 63 of 126
20 0.004 0.022 test terminated due to forces and chipping !!
Drilling Test Data Sheet Fluid 4
Drill Wear (in.)
Test No. Hole # uniform maximum
Comments Thrust Force
(ft./lb.)
7 1 0.002 0.004 microlubrication 418 10 0.003 0.007 429 20 0.004 0.010 433 30 0.006 0.014 434 40 0.006 0.016 433 50 0.007 0.019 432 60 0.009 0.021 434 70 0.009 0.036 452 8 1 0.002 0.005 flood 385 10 0.003 0.012 498 20 0.004 0.021 *corner chipped 509 30 0.005 0.028 526 40 0.006 0.032 *both corners chipped 566 9 1 0.002 0.004 microlubrication 398 10 0.004 0.007 421 20 0.004 0.011 *corner chipped 431 30 0.005 0.014 431 40 0.006 0.018 439 50 0.007 0.022 447 60 0.008 0.031 test terminated 451 *corner broken
10 1 0.002 0.003 flood 416 10 0.003 0.008 544 20 0.004 0.012 563 30 0.006 0.018 *corner chipped 564 40 0.007 0.022 570 50 0.008 0.028 578 60 0.009 0.030 572 70 0.010 0.033 572
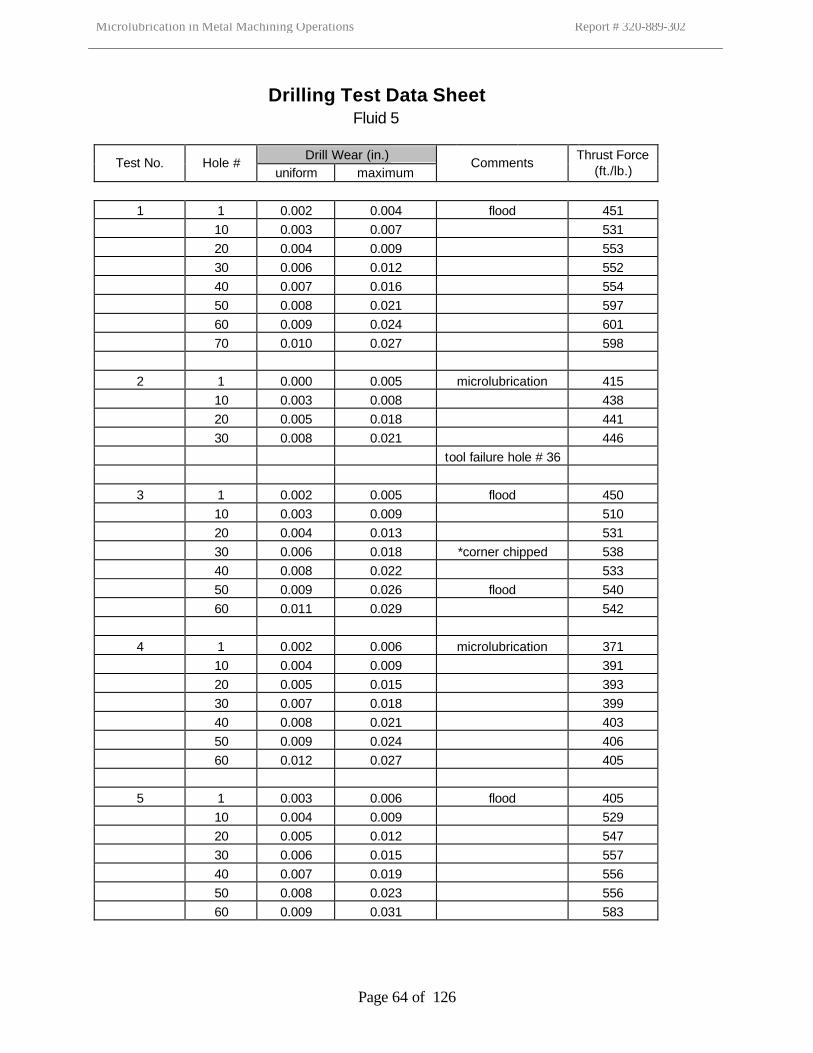
Microlubrication in Metal Machining Operations Report # 320-889-302
Page 64 of 126
Drilling Test Data Sheet Fluid 5
Drill Wear (in.)
Test No. Hole # uniform maximum
Comments Thrust Force
(ft./lb.)
1 1 0.002 0.004 flood 451 10 0.003 0.007 531 20 0.004 0.009 553 30 0.006 0.012 552 40 0.007 0.016 554 50 0.008 0.021 597 60 0.009 0.024 601 70 0.010 0.027 598 2 1 0.000 0.005 microlubrication 415 10 0.003 0.008 438 20 0.005 0.018 441 30 0.008 0.021 446 tool failure hole # 36 3 1 0.002 0.005 flood 450 10 0.003 0.009 510 20 0.004 0.013 531 30 0.006 0.018 *corner chipped 538 40 0.008 0.022 533 50 0.009 0.026 flood 540 60 0.011 0.029 542 4 1 0.002 0.006 microlubrication 371 10 0.004 0.009 391 20 0.005 0.015 393 30 0.007 0.018 399 40 0.008 0.021 403 50 0.009 0.024 406 60 0.012 0.027 405 5 1 0.003 0.006 flood 405 10 0.004 0.009 529 20 0.005 0.012 547 30 0.006 0.015 557 40 0.007 0.019 556 50 0.008 0.023 556 60 0.009 0.031 583
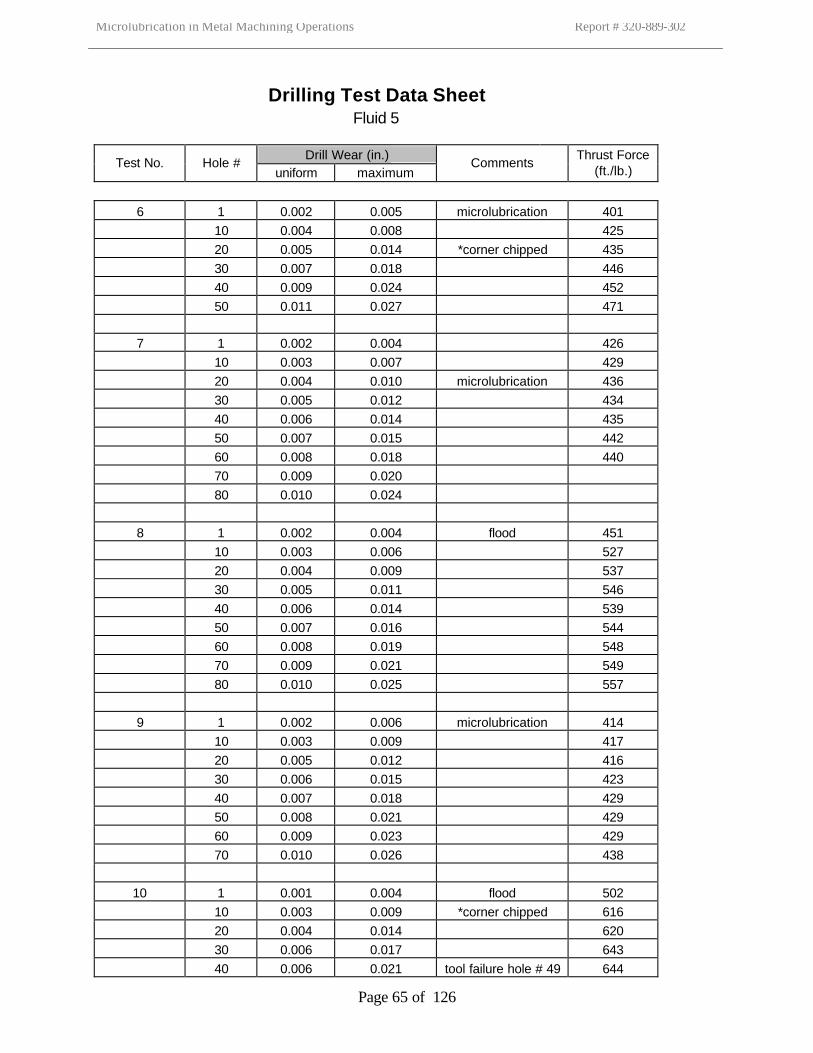
Microlubrication in Metal Machining Operations Report # 320-889-302
Page 65 of 126
Drilling Test Data Sheet Fluid 5
Drill Wear (in.)
Test No. Hole # uniform maximum
Comments Thrust Force
(ft./lb.)
6 1 0.002 0.005 microlubrication 401 10 0.004 0.008 425 20 0.005 0.014 *corner chipped 435 30 0.007 0.018 446 40 0.009 0.024 452 50 0.011 0.027 471 7 1 0.002 0.004 426 10 0.003 0.007 429 20 0.004 0.010 microlubrication 436 30 0.005 0.012 434 40 0.006 0.014 435 50 0.007 0.015 442 60 0.008 0.018 440 70 0.009 0.020 80 0.010 0.024 8 1 0.002 0.004 flood 451 10 0.003 0.006 527 20 0.004 0.009 537 30 0.005 0.011 546 40 0.006 0.014 539 50 0.007 0.016 544 60 0.008 0.019 548 70 0.009 0.021 549 80 0.010 0.025 557 9 1 0.002 0.006 microlubrication 414 10 0.003 0.009 417 20 0.005 0.012 416 30 0.006 0.015 423 40 0.007 0.018 429 50 0.008 0.021 429 60 0.009 0.023 429 70 0.010 0.026 438
10 1 0.001 0.004 flood 502 10 0.003 0.009 *corner chipped 616 20 0.004 0.014 620 30 0.006 0.017 643 40 0.006 0.021 tool failure hole # 49 644
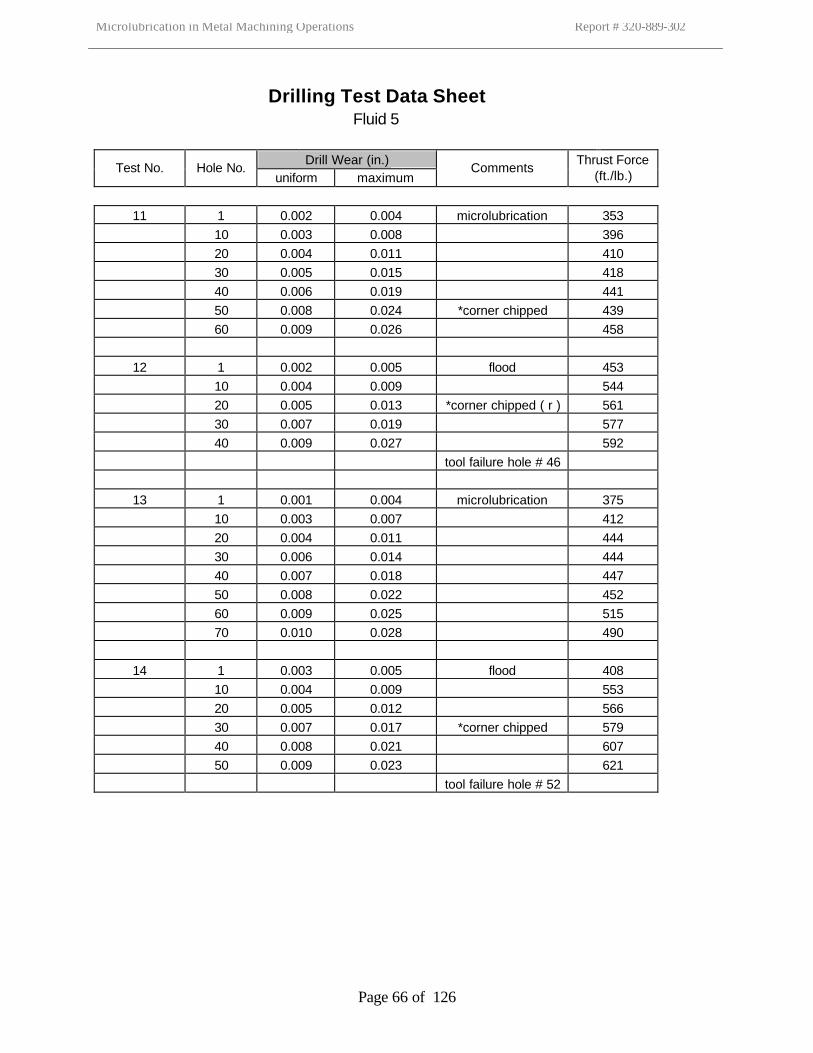
Microlubrication in Metal Machining Operations Report # 320-889-302
Page 66 of 126
Drilling Test Data Sheet Fluid 5
Drill Wear (in.)
Test No. Hole No. uniform maximum
Comments Thrust Force
(ft./lb.)
11 1 0.002 0.004 microlubrication 353 10 0.003 0.008 396 20 0.004 0.011 410 30 0.005 0.015 418 40 0.006 0.019 441 50 0.008 0.024 *corner chipped 439 60 0.009 0.026 458
12 1 0.002 0.005 flood 453 10 0.004 0.009 544 20 0.005 0.013 *corner chipped ( r ) 561 30 0.007 0.019 577 40 0.009 0.027 592 tool failure hole # 46
13 1 0.001 0.004 microlubrication 375 10 0.003 0.007 412 20 0.004 0.011 444 30 0.006 0.014 444 40 0.007 0.018 447 50 0.008 0.022 452 60 0.009 0.025 515 70 0.010 0.028 490
14 1 0.003 0.005 flood 408 10 0.004 0.009 553 20 0.005 0.012 566 30 0.007 0.017 *corner chipped 579 40 0.008 0.021 607 50 0.009 0.023 621 tool failure hole # 52
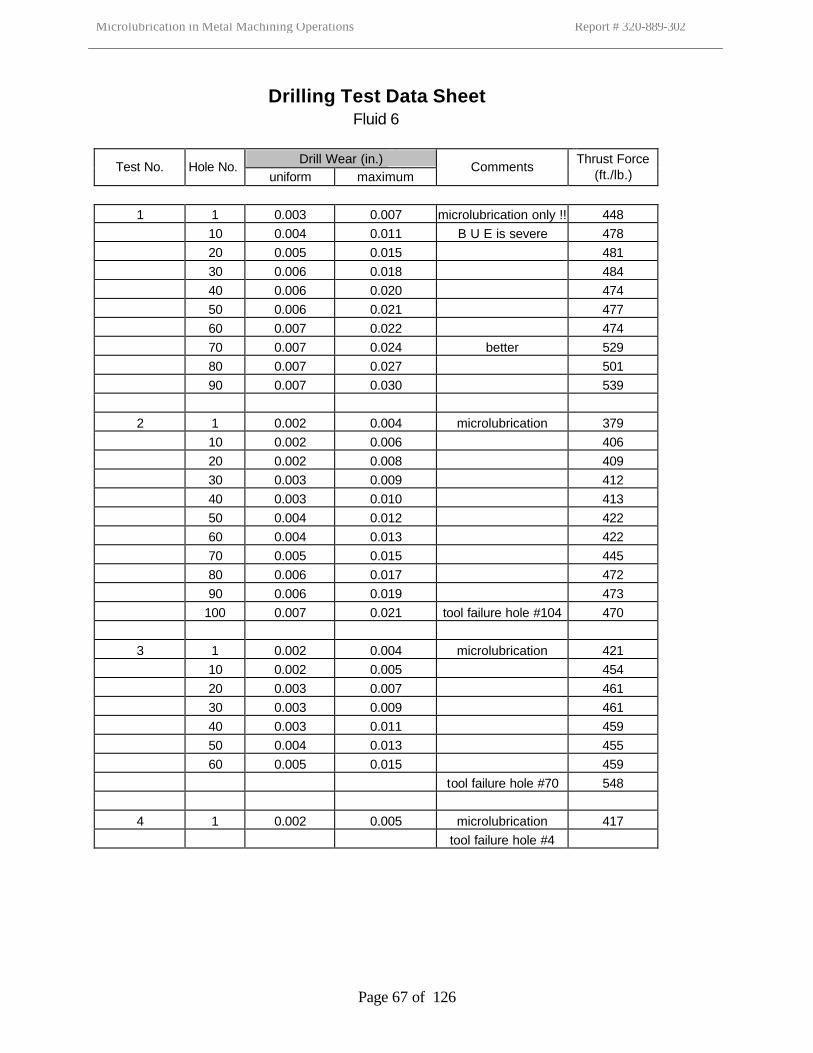
Microlubrication in Metal Machining Operations Report # 320-889-302
Page 67 of 126
Drilling Test Data Sheet Fluid 6
Drill Wear (in.)
Test No. Hole No. uniform maximum
Comments Thrust Force
(ft./lb.)
1 1 0.003 0.007 microlubrication only !! 448 10 0.004 0.011 B U E is severe 478 20 0.005 0.015 481 30 0.006 0.018 484 40 0.006 0.020 474 50 0.006 0.021 477 60 0.007 0.022 474 70 0.007 0.024 better 529 80 0.007 0.027 501 90 0.007 0.030 539 2 1 0.002 0.004 microlubrication 379 10 0.002 0.006 406 20 0.002 0.008 409 30 0.003 0.009 412 40 0.003 0.010 413 50 0.004 0.012 422 60 0.004 0.013 422 70 0.005 0.015 445 80 0.006 0.017 472 90 0.006 0.019 473 100 0.007 0.021 tool failure hole #104 470 3 1 0.002 0.004 microlubrication 421 10 0.002 0.005 454 20 0.003 0.007 461 30 0.003 0.009 461 40 0.003 0.011 459 50 0.004 0.013 455 60 0.005 0.015 459 tool failure hole #70 548 4 1 0.002 0.005 microlubrication 417 tool failure hole #4
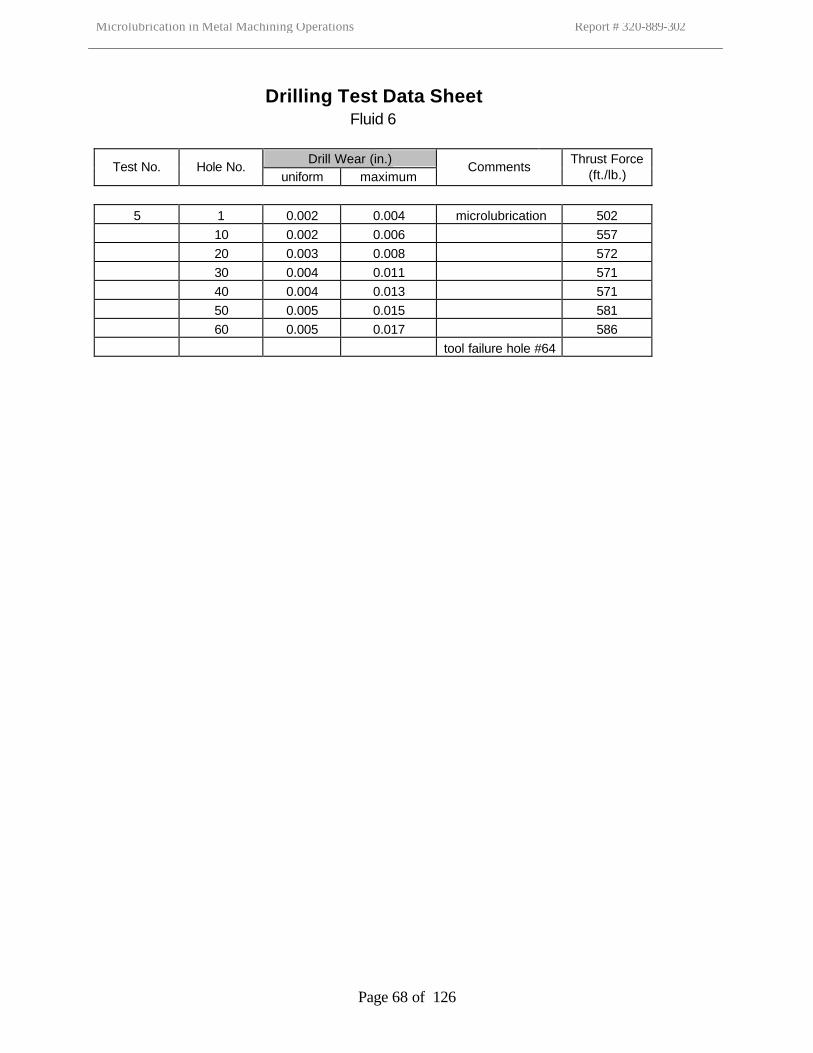
Microlubrication in Metal Machining Operations Report # 320-889-302
Page 68 of 126
Drilling Test Data Sheet Fluid 6
Drill Wear (in.)
Test No. Hole No. uniform maximum
Comments Thrust Force
(ft./lb.)
5 1 0.002 0.004 microlubrication 502 10 0.002 0.006 557 20 0.003 0.008 572 30 0.004 0.011 571 40 0.004 0.013 571 50 0.005 0.015 581 60 0.005 0.017 586 tool failure hole #64
Microlubrication in Metal Machining Operations Report # 320-889-302
Page 69 of 126
APPENDIX 4
Statistical Analysis Of
Drilling Tests

Microlubrication in Metal Machining Operations Report # 320-889-302
Page 70 of 126
Drill Wear
analysed with: Analyse-it + General 1.62
Test Comparative descriptives Microlube vs Flood (Fluid 1) Microlube, Flood
Performed by McClure Date 4 February 2002
n Mean SD SE 95% CI of Mean Median IQR 95% CI of MedianMicrolube 4 60.000 24.4949 12.2474 21.023 to 98.977 60.000 30.000 - to -
Flood 4 55.000 12.9099 6.4550 34.457 to 75.543 55.000 20.000 - to -
10
20
30
40
50
60
70
80
90
100
110
Microlube Flood
analysed with: Analyse-it + General 1.62
Test Paired samples t-test Microlube vs Flood (Fluid 1) Microlube ≠ Flood
Performed by McClure Date 4 February 2002
n 4 (cases excluded: 1 due to missing values)
n Mean SD SEMicrolube 4 60.000 24.495 12.2474
Flood 4 55.000 12.910 6.4550Difference 4 5.000 23.805 11.9024
Difference between means 5.00095% CI -32.879 to 42.879
t statistic 0.422-tailed p 0.7027

Microlubrication in Metal Machining Operations Report # 320-889-302
Page 71 of 126
Drill Wear
analysed with: Analyse-it + General 1.62
Test Comparative descriptives Microlube vs Flood (Fluid 2) Microlube, Flood
Performed by McClure Date 4 February 2002
n Mean SD SE 95% CI of Mean Median IQR 95% CI of MedianMicrolube 5 63.000 17.1756 7.6811 41.674 to 84.326 70.000 25.000 - to -
Flood 5 66.000 11.4018 5.0990 51.843 to 80.157 70.000 10.000 - to -
30
40
50
60
70
80
90
100
Microlube Flood
analysed with: Analyse-it + General 1.62
Test Paired samples t-test Microlube vs Flood (Fluid 2) Microlube ≠ Flood
Performed by McClure Date 4 February 2002
n 5
n Mean SD SEMicrolube 5 63.000 17.176 7.6811
Flood 5 66.000 11.402 5.0990Difference 5 -3.000 12.042 5.3852
Difference between means -3.00095% CI -17.952 to 11.952
t statistic -0.562-tailed p 0.6072
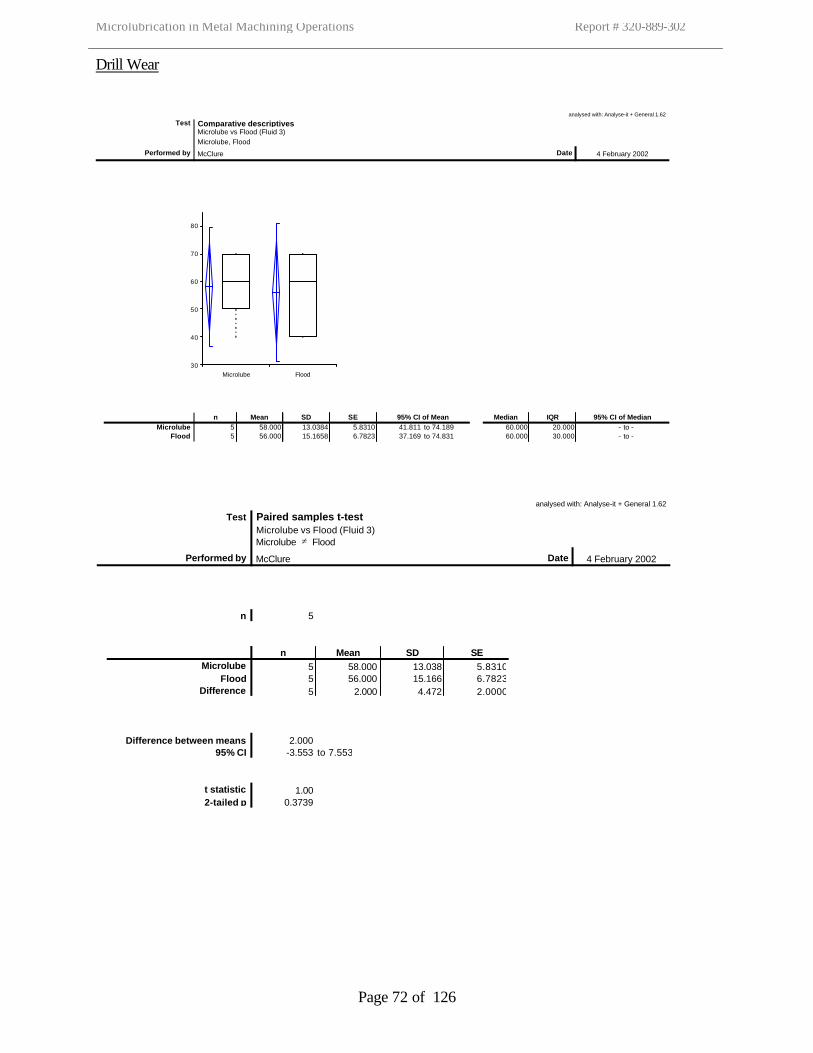
Microlubrication in Metal Machining Operations Report # 320-889-302
Page 72 of 126
Drill Wear
analysed with: Analyse-it + General 1.62
Test Comparative descriptives Microlube vs Flood (Fluid 3) Microlube, Flood
Performed by McClure Date 4 February 2002
n Mean SD SE 95% CI of Mean Median IQR 95% CI of MedianMicrolube 5 58.000 13.0384 5.8310 41.811 to 74.189 60.000 20.000 - to -
Flood 5 56.000 15.1658 6.7823 37.169 to 74.831 60.000 30.000 - to -
30
40
50
60
70
80
Microlube Flood
analysed with: Analyse-it + General 1.62
Test Paired samples t-test Microlube vs Flood (Fluid 3) Microlube ≠ Flood
Performed by McClure Date 4 February 2002
n 5
n Mean SD SEMicrolube 5 58.000 13.038 5.8310
Flood 5 56.000 15.166 6.7823Difference 5 2.000 4.472 2.0000
Difference between means 2.00095% CI -3.553 to 7.553
t statistic 1.002-tailed p 0.3739
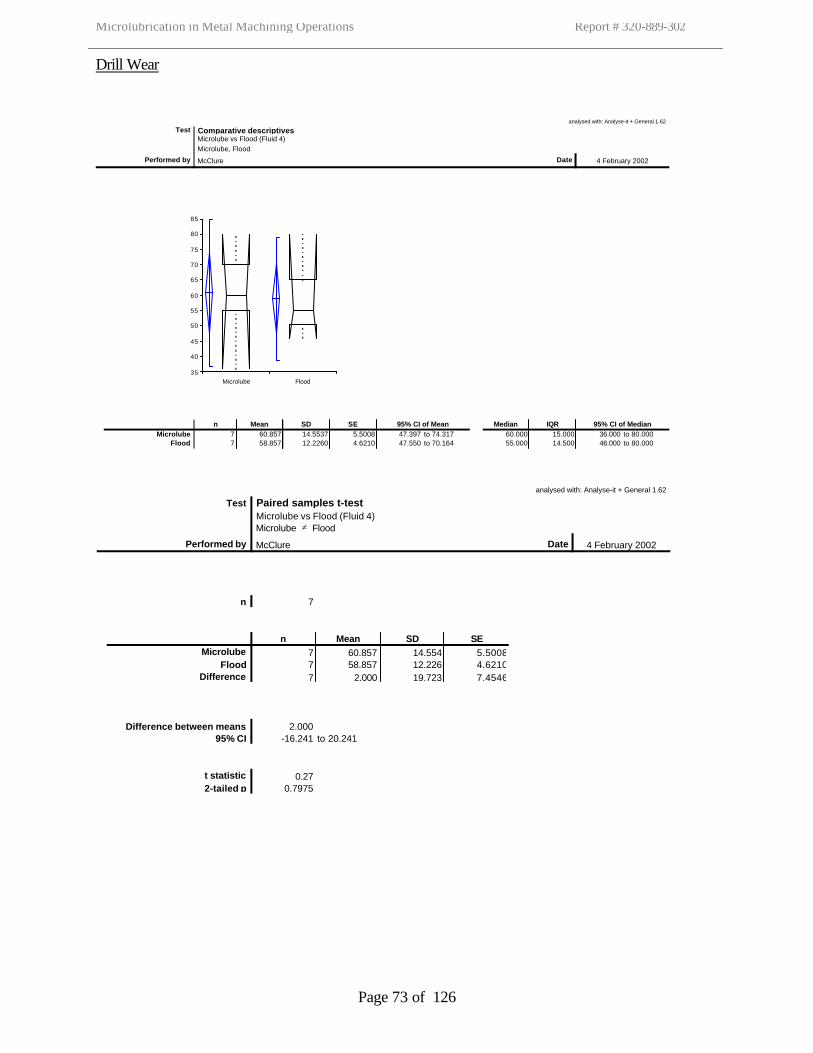
Microlubrication in Metal Machining Operations Report # 320-889-302
Page 73 of 126
Drill Wear
analysed with: Analyse-it + General 1.62
Test Comparative descriptives Microlube vs Flood (Fluid 4) Microlube, Flood
Performed by McClure Date 4 February 2002
n Mean SD SE 95% CI of Mean Median IQR 95% CI of MedianMicrolube 7 60.857 14.5537 5.5008 47.397 to 74.317 60.000 15.000 36.000 to 80.000
Flood 7 58.857 12.2260 4.6210 47.550 to 70.164 55.000 14.500 46.000 to 80.000
35
40
45
50
55
60
65
70
75
80
85
Microlube Flood
analysed with: Analyse-it + General 1.62
Test Paired samples t-test Microlube vs Flood (Fluid 4) Microlube ≠ Flood
Performed by McClure Date 4 February 2002
n 7
n Mean SD SEMicrolube 7 60.857 14.554 5.5008
Flood 7 58.857 12.226 4.6210Difference 7 2.000 19.723 7.4546
Difference between means 2.00095% CI -16.241 to 20.241
t statistic 0.272-tailed p 0.7975
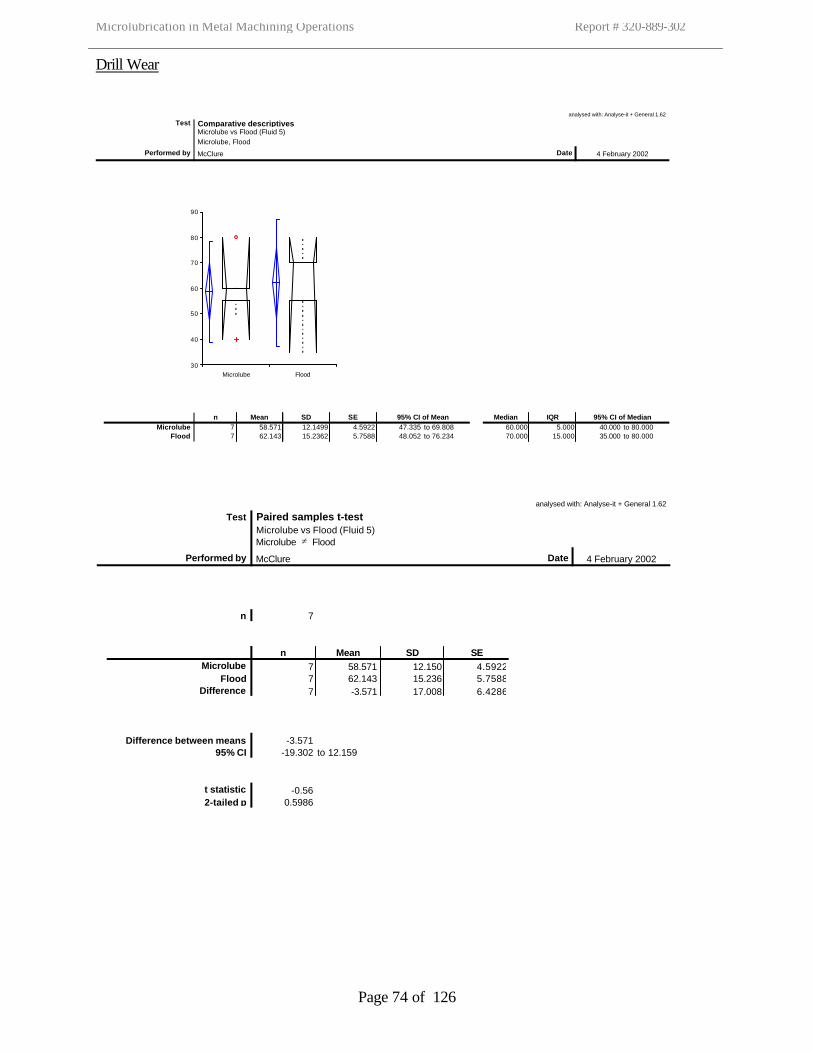
Microlubrication in Metal Machining Operations Report # 320-889-302
Page 74 of 126
Drill Wear
analysed with: Analyse-it + General 1.62
Test Comparative descriptives Microlube vs Flood (Fluid 5) Microlube, Flood
Performed by McClure Date 4 February 2002
n Mean SD SE 95% CI of Mean Median IQR 95% CI of MedianMicrolube 7 58.571 12.1499 4.5922 47.335 to 69.808 60.000 5.000 40.000 to 80.000
Flood 7 62.143 15.2362 5.7588 48.052 to 76.234 70.000 15.000 35.000 to 80.000
30
40
50
60
70
80
90
Microlube Flood
analysed with: Analyse-it + General 1.62
Test Paired samples t-test Microlube vs Flood (Fluid 5) Microlube ≠ Flood
Performed by McClure Date 4 February 2002
n 7
n Mean SD SEMicrolube 7 58.571 12.150 4.5922
Flood 7 62.143 15.236 5.7588Difference 7 -3.571 17.008 6.4286
Difference between means -3.57195% CI -19.302 to 12.159
t statistic -0.562-tailed p 0.5986
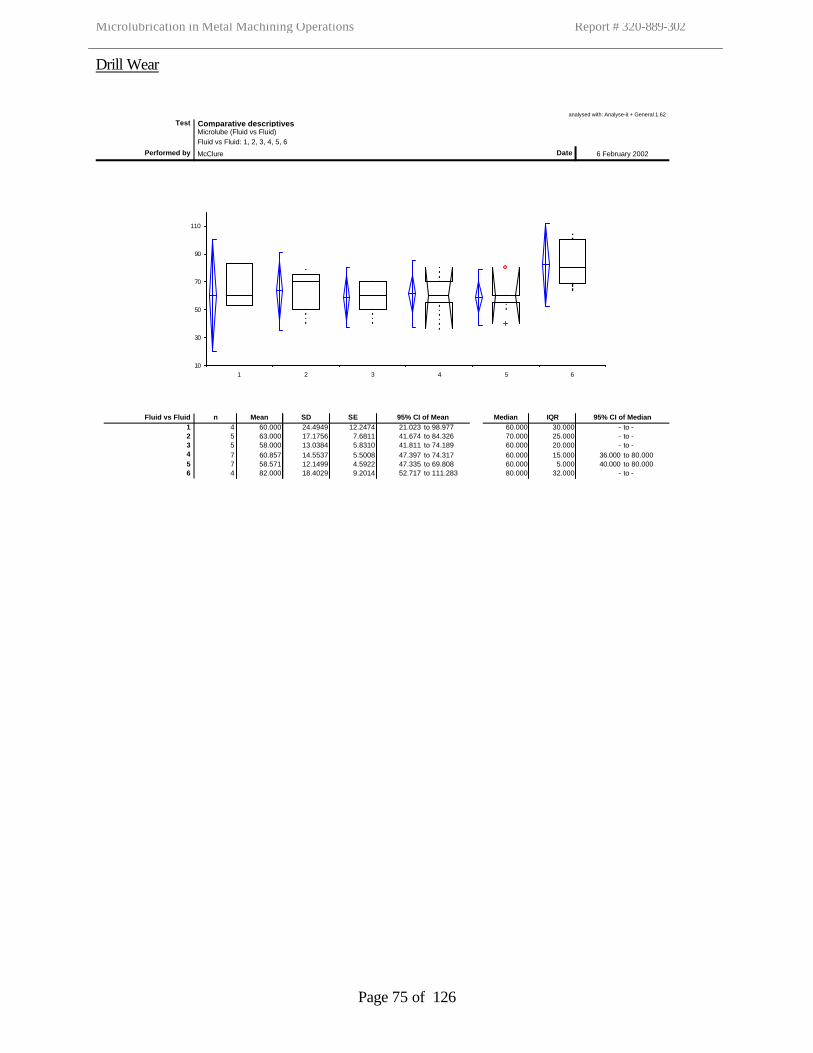
Microlubrication in Metal Machining Operations Report # 320-889-302
Page 75 of 126
Drill Wear
analysed with: Analyse-it + General 1.62
Test Comparative descriptives Microlube (Fluid vs Fluid) Fluid vs Fluid: 1, 2, 3, 4, 5, 6
Performed by McClure Date 6 February 2002
Fluid vs Fluid n Mean SD SE 95% CI of Mean Median IQR 95% CI of Median1 4 60.000 24.4949 12.2474 21.023 to 98.977 60.000 30.000 - to -2 5 63.000 17.1756 7.6811 41.674 to 84.326 70.000 25.000 - to -3 5 58.000 13.0384 5.8310 41.811 to 74.189 60.000 20.000 - to -4 7 60.857 14.5537 5.5008 47.397 to 74.317 60.000 15.000 36.000 to 80.0005 7 58.571 12.1499 4.5922 47.335 to 69.808 60.000 5.000 40.000 to 80.0006 4 82.000 18.4029 9.2014 52.717 to 111.283 80.000 32.000 - to -
10
30
50
70
90
110
1 2 3 4 5 6
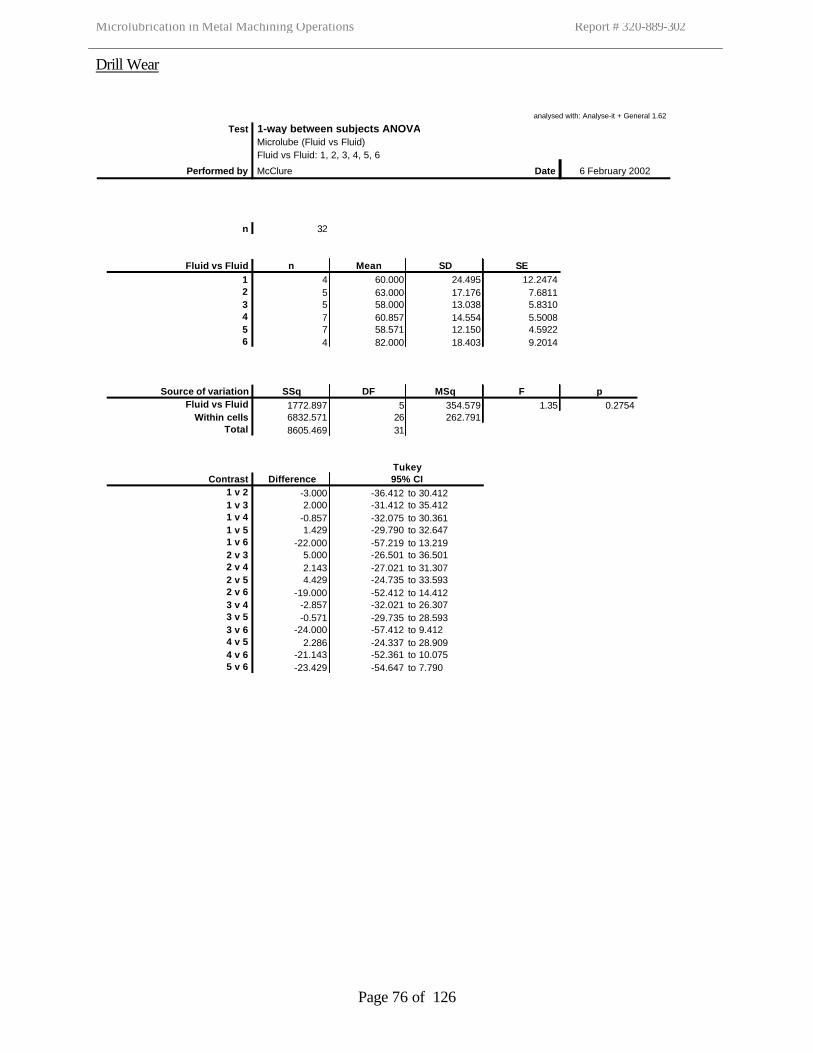
Microlubrication in Metal Machining Operations Report # 320-889-302
Page 76 of 126
Drill Wear
analysed with: Analyse-it + General 1.62
Test 1-way between subjects ANOVA Microlube (Fluid vs Fluid) Fluid vs Fluid: 1, 2, 3, 4, 5, 6
Performed by McClure Date 6 February 2002
n 32
Fluid vs Fluid n Mean SD SE1 4 60.000 24.495 12.24742 5 63.000 17.176 7.68113 5 58.000 13.038 5.83104 7 60.857 14.554 5.50085 7 58.571 12.150 4.59226 4 82.000 18.403 9.2014
Source of variation SSq DF MSq F pFluid vs Fluid 1772.897 5 354.579 1.35 0.2754
Within cells 6832.571 26 262.791Total 8605.469 31
TukeyContrast Difference 95% CI
1 v 2 -3.000 -36.412 to 30.412
1 v 3 2.000 -31.412 to 35.412
1 v 4 -0.857 -32.075 to 30.361
1 v 5 1.429 -29.790 to 32.647
1 v 6 -22.000 -57.219 to 13.219
2 v 3 5.000 -26.501 to 36.501
2 v 4 2.143 -27.021 to 31.307
2 v 5 4.429 -24.735 to 33.593
2 v 6 -19.000 -52.412 to 14.412
3 v 4 -2.857 -32.021 to 26.307
3 v 5 -0.571 -29.735 to 28.593
3 v 6 -24.000 -57.412 to 9.412
4 v 5 2.286 -24.337 to 28.909
4 v 6 -21.143 -52.361 to 10.075
5 v 6 -23.429 -54.647 to 7.790
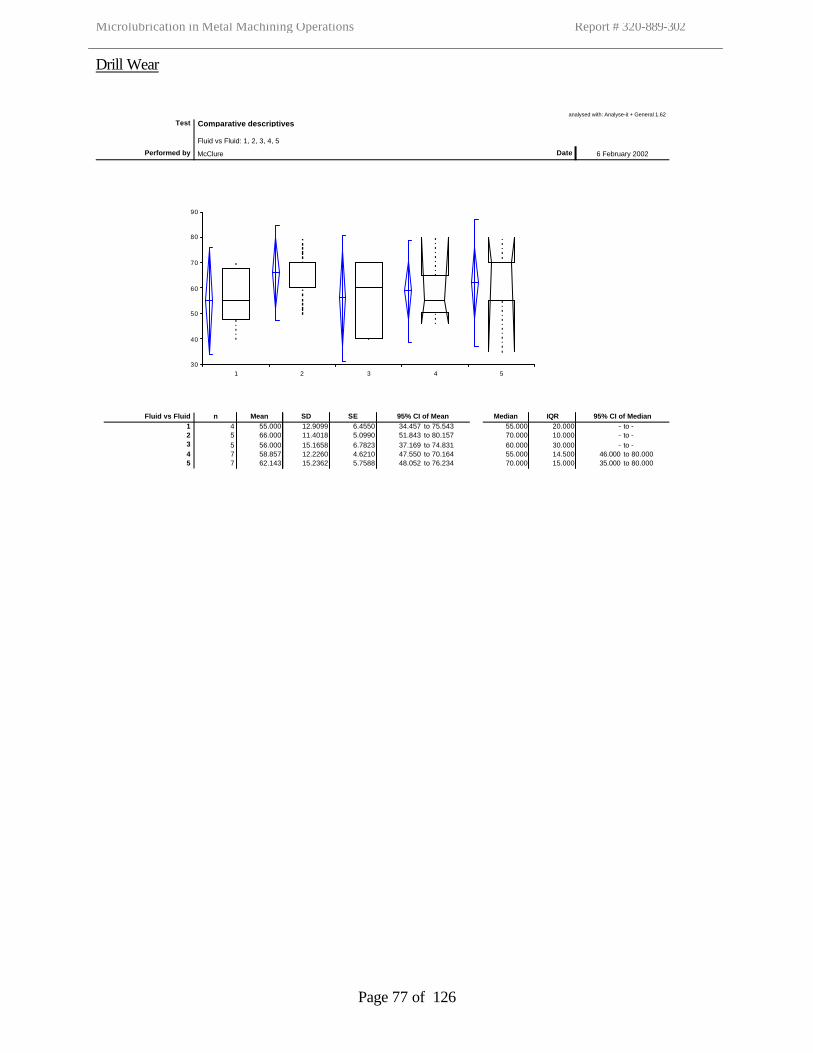
Microlubrication in Metal Machining Operations Report # 320-889-302
Page 77 of 126
Drill Wear
analysed with: Analyse-it + General 1.62
Test Comparative descriptives Fluid vs Fluid: 1, 2, 3, 4, 5
Performed by McClure Date 6 February 2002
Fluid vs Fluid n Mean SD SE 95% CI of Mean Median IQR 95% CI of Median1 4 55.000 12.9099 6.4550 34.457 to 75.543 55.000 20.000 - to -2 5 66.000 11.4018 5.0990 51.843 to 80.157 70.000 10.000 - to -3 5 56.000 15.1658 6.7823 37.169 to 74.831 60.000 30.000 - to -4 7 58.857 12.2260 4.6210 47.550 to 70.164 55.000 14.500 46.000 to 80.0005 7 62.143 15.2362 5.7588 48.052 to 76.234 70.000 15.000 35.000 to 80.000
30
40
50
60
70
80
90
1 2 3 4 5
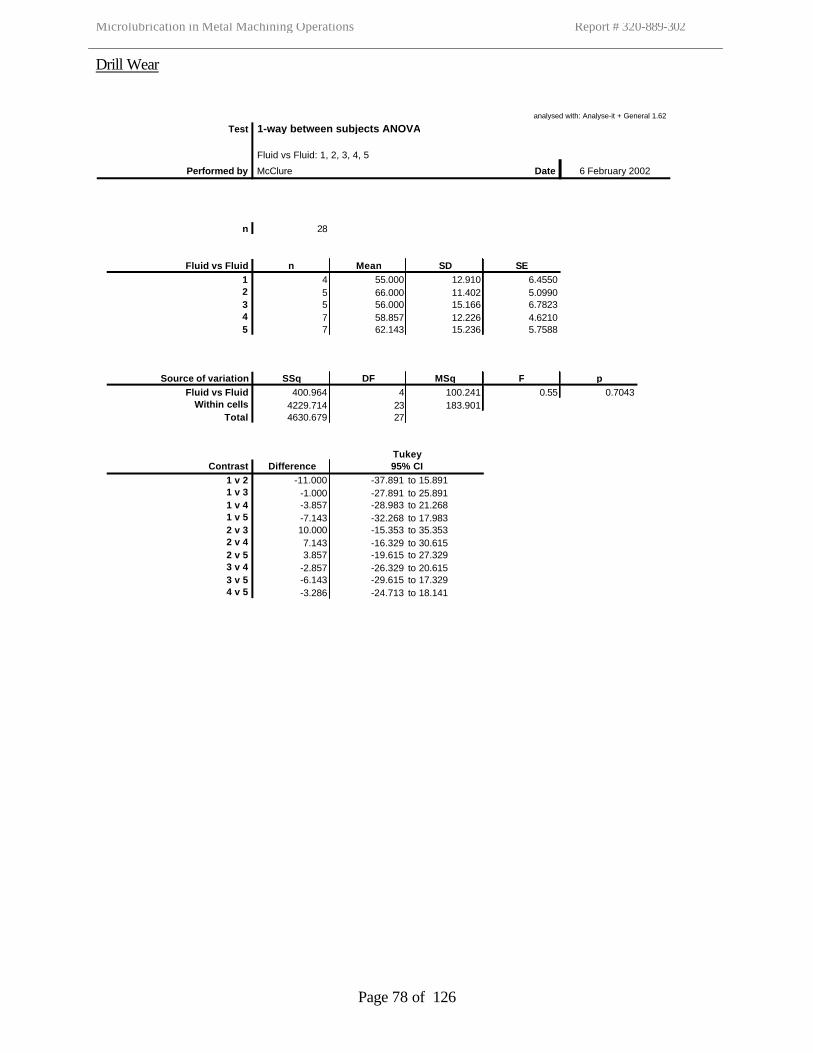
Microlubrication in Metal Machining Operations Report # 320-889-302
Page 78 of 126
Drill Wear
analysed with: Analyse-it + General 1.62
Test 1-way between subjects ANOVA Fluid vs Fluid: 1, 2, 3, 4, 5
Performed by McClure Date 6 February 2002
n 28
Fluid vs Fluid n Mean SD SE1 4 55.000 12.910 6.45502 5 66.000 11.402 5.09903 5 56.000 15.166 6.78234 7 58.857 12.226 4.62105 7 62.143 15.236 5.7588
Source of variation SSq DF MSq F pFluid vs Fluid 400.964 4 100.241 0.55 0.7043
Within cells 4229.714 23 183.901Total 4630.679 27
TukeyContrast Difference 95% CI
1 v 2 -11.000 -37.891 to 15.891
1 v 3 -1.000 -27.891 to 25.891
1 v 4 -3.857 -28.983 to 21.268
1 v 5 -7.143 -32.268 to 17.983
2 v 3 10.000 -15.353 to 35.353
2 v 4 7.143 -16.329 to 30.615
2 v 5 3.857 -19.615 to 27.329
3 v 4 -2.857 -26.329 to 20.615
3 v 5 -6.143 -29.615 to 17.329
4 v 5 -3.286 -24.713 to 18.141
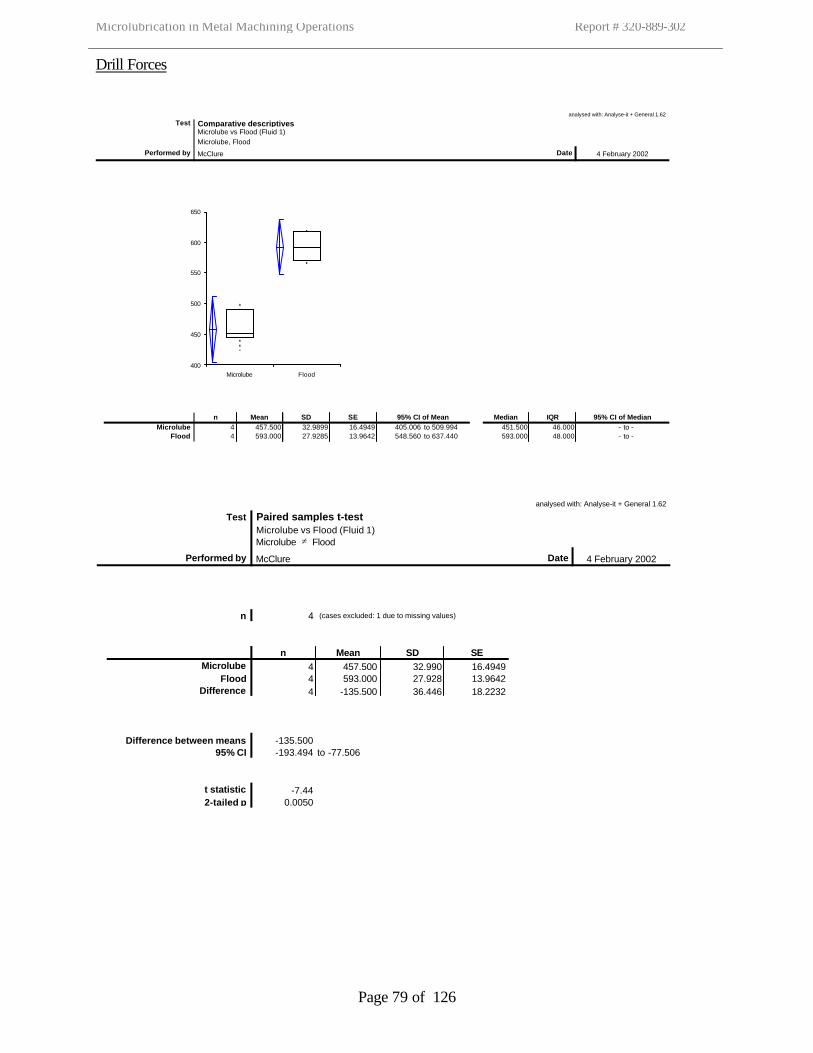
Microlubrication in Metal Machining Operations Report # 320-889-302
Page 79 of 126
Drill Forces
analysed with: Analyse-it + General 1.62
Test Comparative descriptives Microlube vs Flood (Fluid 1) Microlube, Flood
Performed by McClure Date 4 February 2002
n Mean SD SE 95% CI of Mean Median IQR 95% CI of MedianMicrolube 4 457.500 32.9899 16.4949 405.006 to 509.994 451.500 46.000 - to -
Flood 4 593.000 27.9285 13.9642 548.560 to 637.440 593.000 48.000 - to -
400
450
500
550
600
650
Microlube Flood
analysed with: Analyse-it + General 1.62
Test Paired samples t-test Microlube vs Flood (Fluid 1) Microlube ≠ Flood
Performed by McClure Date 4 February 2002
n 4 (cases excluded: 1 due to missing values)
n Mean SD SEMicrolube 4 457.500 32.990 16.4949
Flood 4 593.000 27.928 13.9642Difference 4 -135.500 36.446 18.2232
Difference between means -135.50095% CI -193.494 to -77.506
t statistic -7.442-tailed p 0.0050
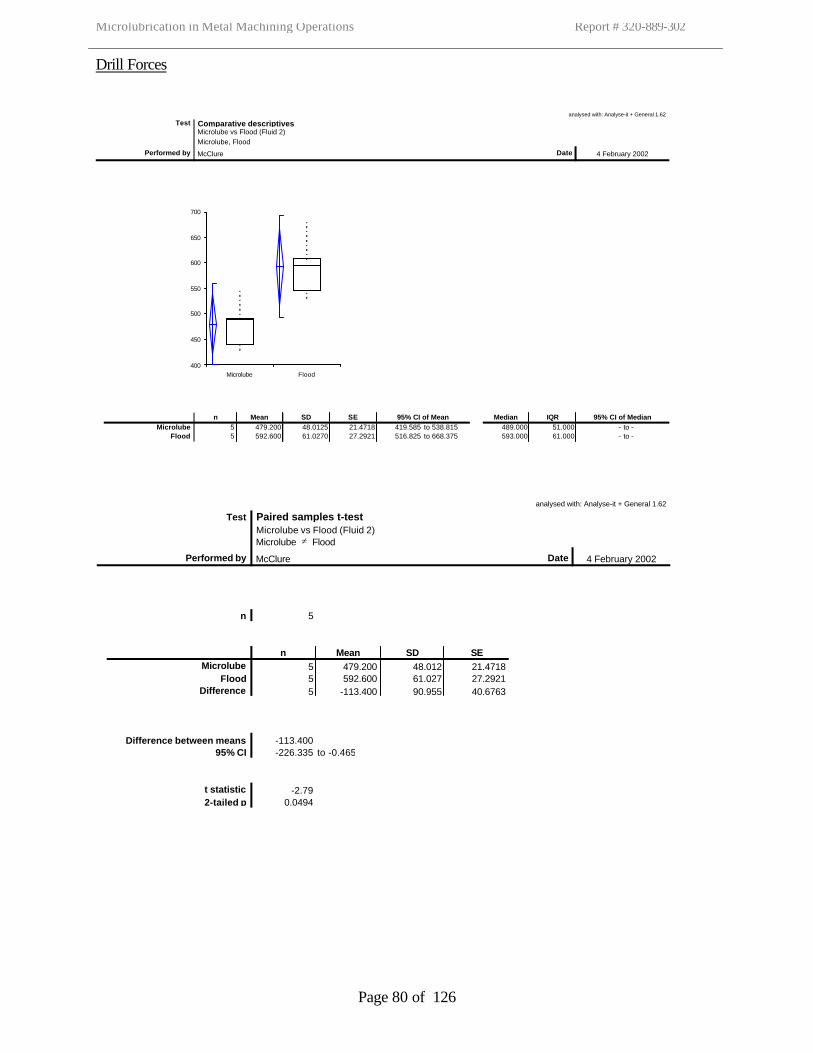
Microlubrication in Metal Machining Operations Report # 320-889-302
Page 80 of 126
Drill Forces
analysed with: Analyse-it + General 1.62
Test Comparative descriptives Microlube vs Flood (Fluid 2) Microlube, Flood
Performed by McClure Date 4 February 2002
n Mean SD SE 95% CI of Mean Median IQR 95% CI of MedianMicrolube 5 479.200 48.0125 21.4718 419.585 to 538.815 489.000 51.000 - to -
Flood 5 592.600 61.0270 27.2921 516.825 to 668.375 593.000 61.000 - to -
400
450
500
550
600
650
700
Microlube Flood
analysed with: Analyse-it + General 1.62
Test Paired samples t-test Microlube vs Flood (Fluid 2) Microlube ≠ Flood
Performed by McClure Date 4 February 2002
n 5
n Mean SD SEMicrolube 5 479.200 48.012 21.4718
Flood 5 592.600 61.027 27.2921Difference 5 -113.400 90.955 40.6763
Difference between means -113.40095% CI -226.335 to -0.465
t statistic -2.792-tailed p 0.0494
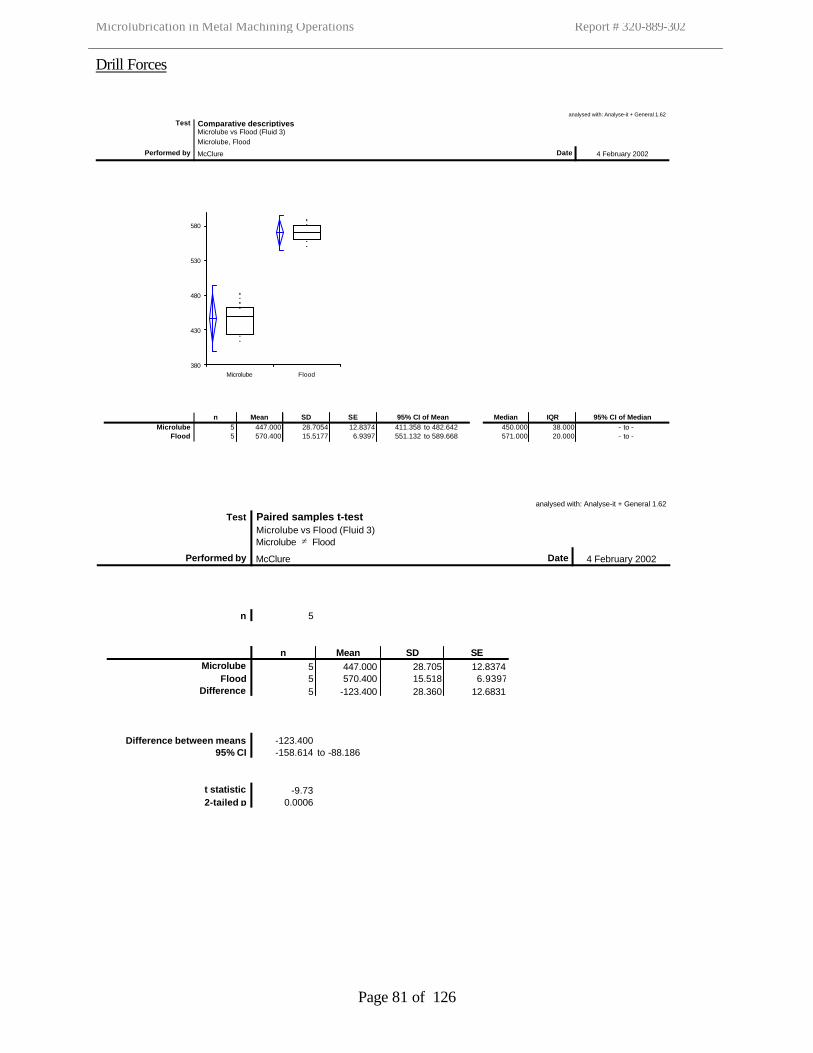
Microlubrication in Metal Machining Operations Report # 320-889-302
Page 81 of 126
Drill Forces
analysed with: Analyse-it + General 1.62
Test Comparative descriptives Microlube vs Flood (Fluid 3) Microlube, Flood
Performed by McClure Date 4 February 2002
n Mean SD SE 95% CI of Mean Median IQR 95% CI of MedianMicrolube 5 447.000 28.7054 12.8374 411.358 to 482.642 450.000 38.000 - to -
Flood 5 570.400 15.5177 6.9397 551.132 to 589.668 571.000 20.000 - to -
380
430
480
530
580
Microlube Flood
analysed with: Analyse-it + General 1.62
Test Paired samples t-test Microlube vs Flood (Fluid 3) Microlube ≠ Flood
Performed by McClure Date 4 February 2002
n 5
n Mean SD SEMicrolube 5 447.000 28.705 12.8374
Flood 5 570.400 15.518 6.9397Difference 5 -123.400 28.360 12.6831
Difference between means -123.40095% CI -158.614 to -88.186
t statistic -9.732-tailed p 0.0006
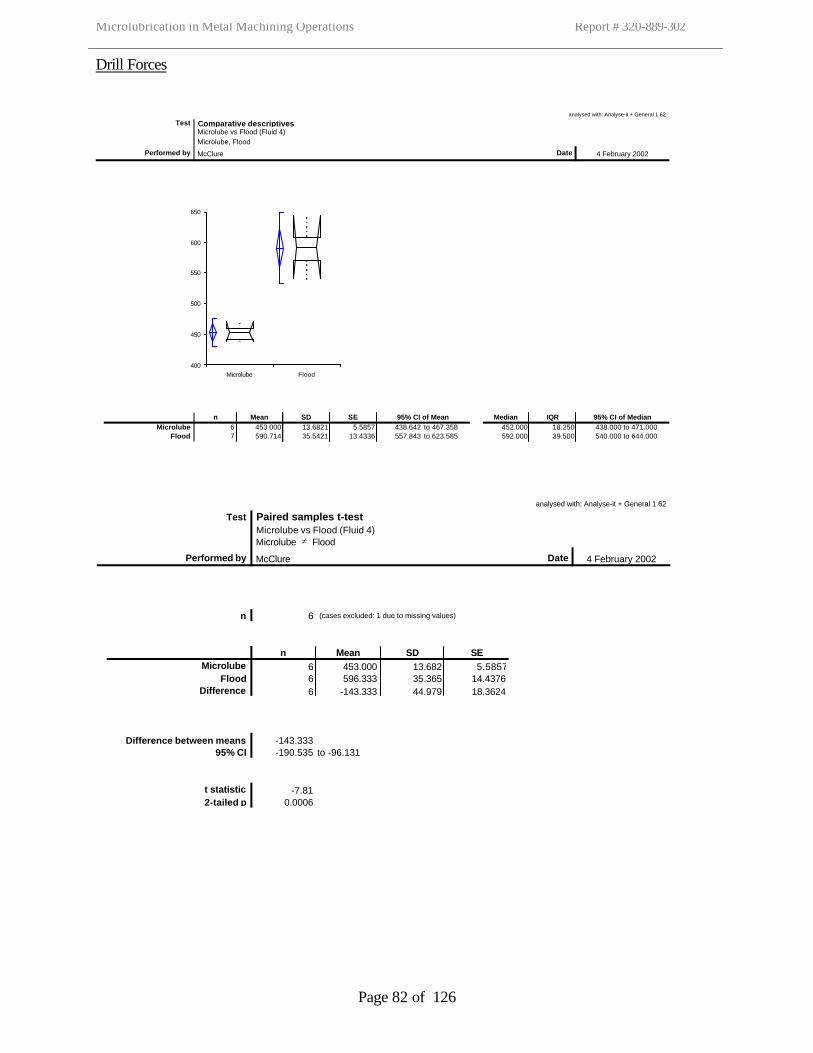
Microlubrication in Metal Machining Operations Report # 320-889-302
Page 82 of 126
Drill Forces
analysed with: Analyse-it + General 1.62
Test Comparative descriptives Microlube vs Flood (Fluid 4) Microlube, Flood
Performed by McClure Date 4 February 2002
n Mean SD SE 95% CI of Mean Median IQR 95% CI of MedianMicrolube 6 453.000 13.6821 5.5857 438.642 to 467.358 452.000 18.250 438.000 to 471.000
Flood 7 590.714 35.5421 13.4336 557.843 to 623.585 592.000 39.500 540.000 to 644.000
400
450
500
550
600
650
Microlube Flood
analysed with: Analyse-it + General 1.62
Test Paired samples t-test Microlube vs Flood (Fluid 4) Microlube ≠ Flood
Performed by McClure Date 4 February 2002
n 6 (cases excluded: 1 due to missing values)
n Mean SD SEMicrolube 6 453.000 13.682 5.5857
Flood 6 596.333 35.365 14.4376Difference 6 -143.333 44.979 18.3624
Difference between means -143.33395% CI -190.535 to -96.131
t statistic -7.812-tailed p 0.0006
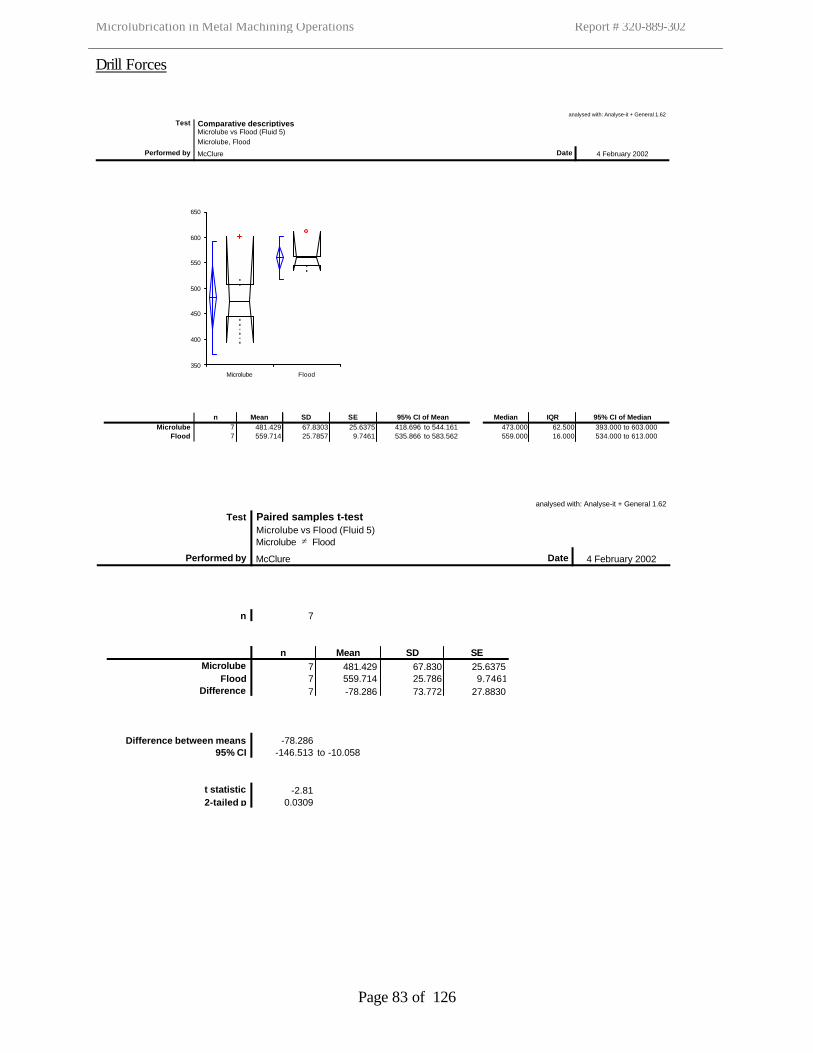
Microlubrication in Metal Machining Operations Report # 320-889-302
Page 83 of 126
Drill Forces
analysed with: Analyse-it + General 1.62
Test Comparative descriptives Microlube vs Flood (Fluid 5) Microlube, Flood
Performed by McClure Date 4 February 2002
n Mean SD SE 95% CI of Mean Median IQR 95% CI of MedianMicrolube 7 481.429 67.8303 25.6375 418.696 to 544.161 473.000 62.500 393.000 to 603.000
Flood 7 559.714 25.7857 9.7461 535.866 to 583.562 559.000 16.000 534.000 to 613.000
350
400
450
500
550
600
650
Microlube Flood
analysed with: Analyse-it + General 1.62
Test Paired samples t-test Microlube vs Flood (Fluid 5) Microlube ≠ Flood
Performed by McClure Date 4 February 2002
n 7
n Mean SD SEMicrolube 7 481.429 67.830 25.6375
Flood 7 559.714 25.786 9.7461Difference 7 -78.286 73.772 27.8830
Difference between means -78.28695% CI -146.513 to -10.058
t statistic -2.812-tailed p 0.0309
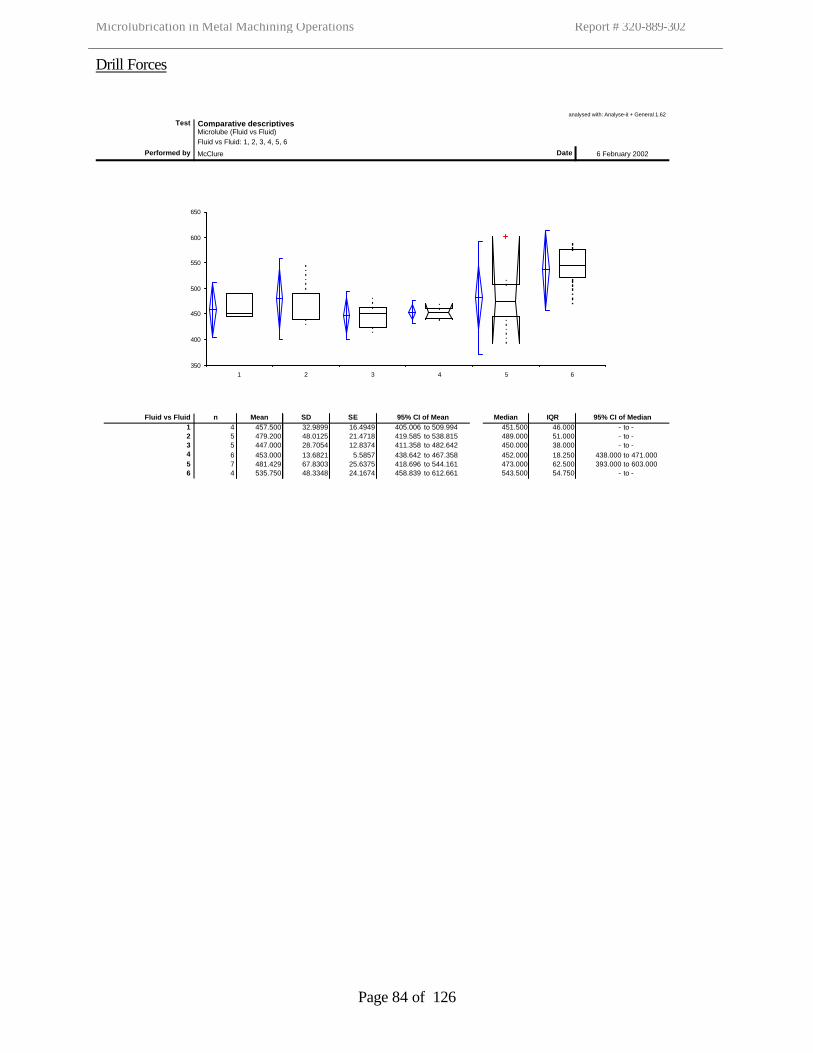
Microlubrication in Metal Machining Operations Report # 320-889-302
Page 84 of 126
Drill Forces
analysed with: Analyse-it + General 1.62
Test Comparative descriptives Microlube (Fluid vs Fluid) Fluid vs Fluid: 1, 2, 3, 4, 5, 6
Performed by McClure Date 6 February 2002
Fluid vs Fluid n Mean SD SE 95% CI of Mean Median IQR 95% CI of Median1 4 457.500 32.9899 16.4949 405.006 to 509.994 451.500 46.000 - to -2 5 479.200 48.0125 21.4718 419.585 to 538.815 489.000 51.000 - to -3 5 447.000 28.7054 12.8374 411.358 to 482.642 450.000 38.000 - to -4 6 453.000 13.6821 5.5857 438.642 to 467.358 452.000 18.250 438.000 to 471.0005 7 481.429 67.8303 25.6375 418.696 to 544.161 473.000 62.500 393.000 to 603.0006 4 535.750 48.3348 24.1674 458.839 to 612.661 543.500 54.750 - to -
350
400
450
500
550
600
650
1 2 3 4 5 6
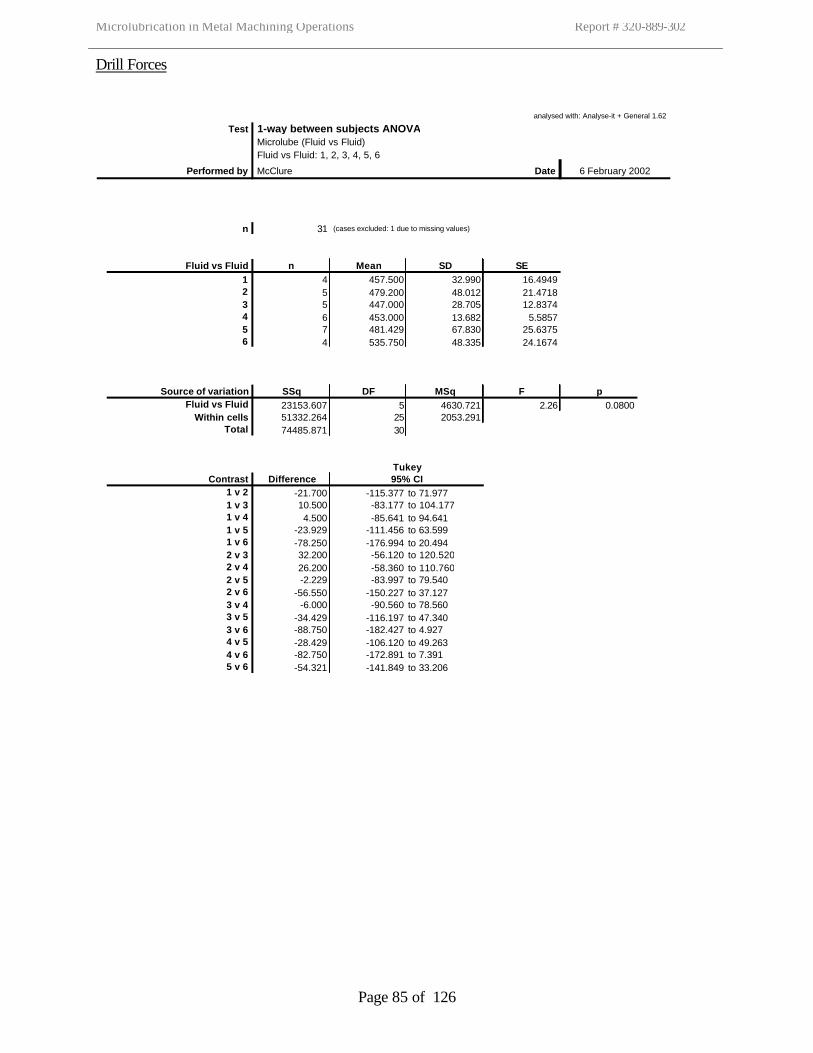
Microlubrication in Metal Machining Operations Report # 320-889-302
Page 85 of 126
Drill Forces
analysed with: Analyse-it + General 1.62
Test 1-way between subjects ANOVA Microlube (Fluid vs Fluid) Fluid vs Fluid: 1, 2, 3, 4, 5, 6
Performed by McClure Date 6 February 2002
n 31 (cases excluded: 1 due to missing values)
Fluid vs Fluid n Mean SD SE1 4 457.500 32.990 16.49492 5 479.200 48.012 21.47183 5 447.000 28.705 12.83744 6 453.000 13.682 5.58575 7 481.429 67.830 25.63756 4 535.750 48.335 24.1674
Source of variation SSq DF MSq F pFluid vs Fluid 23153.607 5 4630.721 2.26 0.0800
Within cells 51332.264 25 2053.291Total 74485.871 30
TukeyContrast Difference 95% CI
1 v 2 -21.700 -115.377 to 71.977
1 v 3 10.500 -83.177 to 104.177
1 v 4 4.500 -85.641 to 94.641
1 v 5 -23.929 -111.456 to 63.599
1 v 6 -78.250 -176.994 to 20.494
2 v 3 32.200 -56.120 to 120.520
2 v 4 26.200 -58.360 to 110.760
2 v 5 -2.229 -83.997 to 79.540
2 v 6 -56.550 -150.227 to 37.127
3 v 4 -6.000 -90.560 to 78.560
3 v 5 -34.429 -116.197 to 47.340
3 v 6 -88.750 -182.427 to 4.927
4 v 5 -28.429 -106.120 to 49.263
4 v 6 -82.750 -172.891 to 7.391
5 v 6 -54.321 -141.849 to 33.206
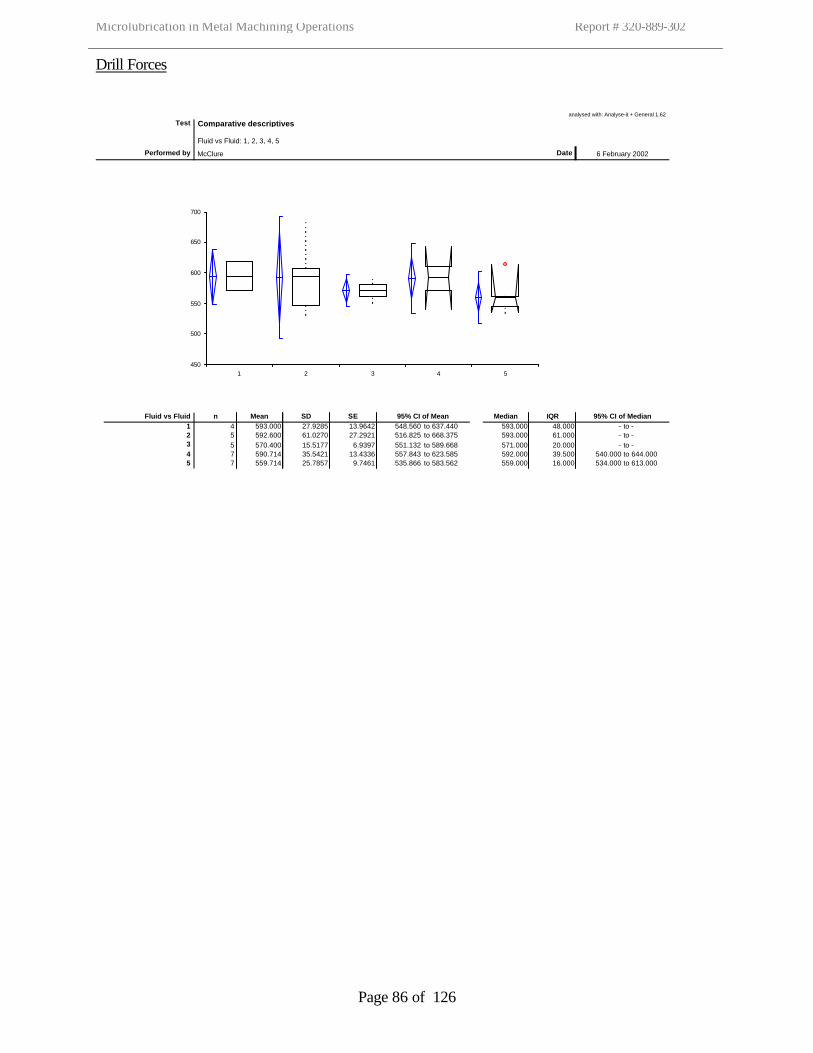
Microlubrication in Metal Machining Operations Report # 320-889-302
Page 86 of 126
Drill Forces
analysed with: Analyse-it + General 1.62
Test Comparative descriptives Fluid vs Fluid: 1, 2, 3, 4, 5
Performed by McClure Date 6 February 2002
Fluid vs Fluid n Mean SD SE 95% CI of Mean Median IQR 95% CI of Median1 4 593.000 27.9285 13.9642 548.560 to 637.440 593.000 48.000 - to -2 5 592.600 61.0270 27.2921 516.825 to 668.375 593.000 61.000 - to -3 5 570.400 15.5177 6.9397 551.132 to 589.668 571.000 20.000 - to -4 7 590.714 35.5421 13.4336 557.843 to 623.585 592.000 39.500 540.000 to 644.0005 7 559.714 25.7857 9.7461 535.866 to 583.562 559.000 16.000 534.000 to 613.000
450
500
550
600
650
700
1 2 3 4 5

Microlubrication in Metal Machining Operations Report # 320-889-302
Page 87 of 126
Drill Forces
analysed with: Analyse-it + General 1.62
Test 1-way between subjects ANOVA Fluid vs Fluid: 1, 2, 3, 4, 5
Performed by McClure Date 4 February 2002
n 28
Fluid vs Fluid n Mean SD SE1 4 593.000 27.928 13.96422 5 592.600 61.027 27.29213 5 570.400 15.518 6.93974 7 590.714 35.542 13.43365 7 559.714 25.786 9.7461
Source of variation SSq DF MSq F pFluid vs Fluid 5614.743 4 1403.686 1.08 0.3873
Within cells 29769.257 23 1294.316Total 35384.000 27
TukeyContrast Difference 95% CI
1 v 2 0.400 -70.940 to 71.740
1 v 3 22.600 -48.740 to 93.940
1 v 4 2.286 -64.371 to 68.943
1 v 5 33.286 -33.371 to 99.943
2 v 3 22.200 -45.060 to 89.460
2 v 4 1.886 -60.385 to 64.157
2 v 5 32.886 -29.385 to 95.157
3 v 4 -20.314 -82.585 to 41.957
3 v 5 10.686 -51.585 to 72.957
4 v 5 31.000 -25.845 to 87.845
Microlubrication in Metal Machining Operations Report # 320-889-302
Page 88 of 126
APPENDIX 5
Tabular Results of
Tool Wear and Resultant Force Measurements
from International Working Industry Group
Milling Test
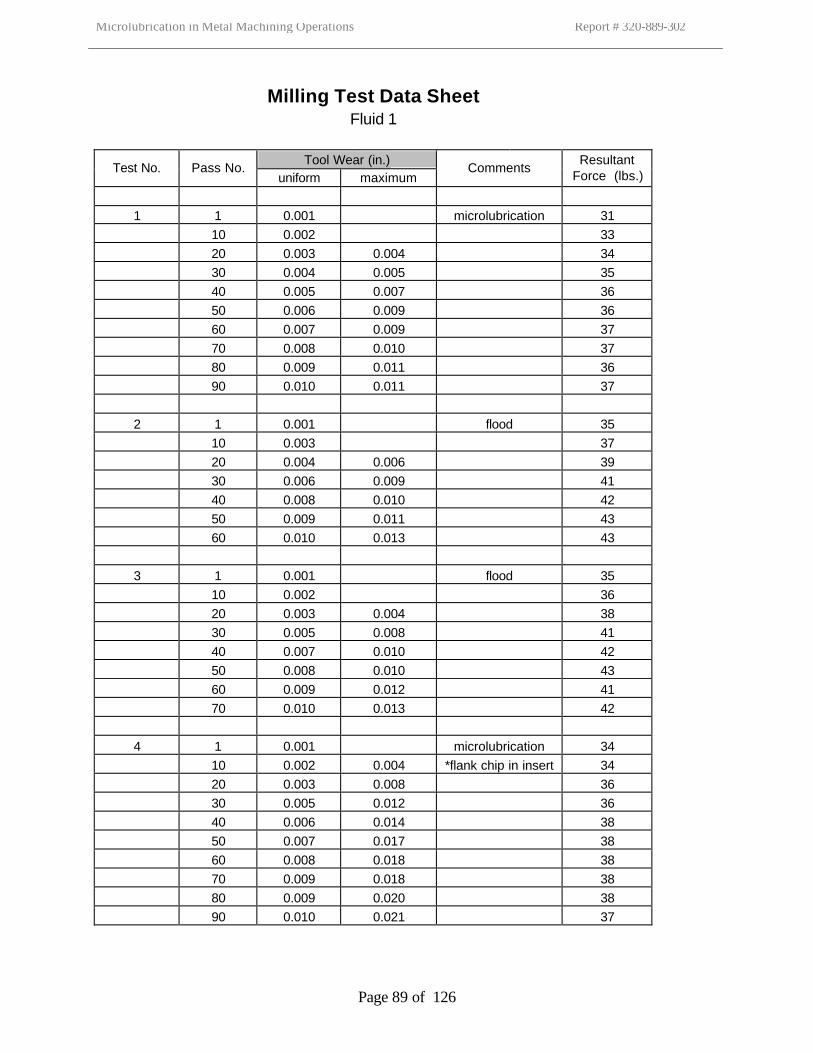
Microlubrication in Metal Machining Operations Report # 320-889-302
Page 89 of 126
Milling Test Data Sheet Fluid 1
Tool Wear (in.)
Test No. Pass No. uniform maximum
Comments Resultant
Force (lbs.)
1 1 0.001 microlubrication 31 10 0.002 33 20 0.003 0.004 34 30 0.004 0.005 35 40 0.005 0.007 36 50 0.006 0.009 36 60 0.007 0.009 37 70 0.008 0.010 37 80 0.009 0.011 36 90 0.010 0.011 37 2 1 0.001 flood 35 10 0.003 37 20 0.004 0.006 39 30 0.006 0.009 41 40 0.008 0.010 42 50 0.009 0.011 43 60 0.010 0.013 43 3 1 0.001 flood 35 10 0.002 36 20 0.003 0.004 38 30 0.005 0.008 41 40 0.007 0.010 42 50 0.008 0.010 43 60 0.009 0.012 41 70 0.010 0.013 42 4 1 0.001 microlubrication 34 10 0.002 0.004 *flank chip in insert 34 20 0.003 0.008 36 30 0.005 0.012 36 40 0.006 0.014 38 50 0.007 0.017 38 60 0.008 0.018 38 70 0.009 0.018 38 80 0.009 0.020 38 90 0.010 0.021 37
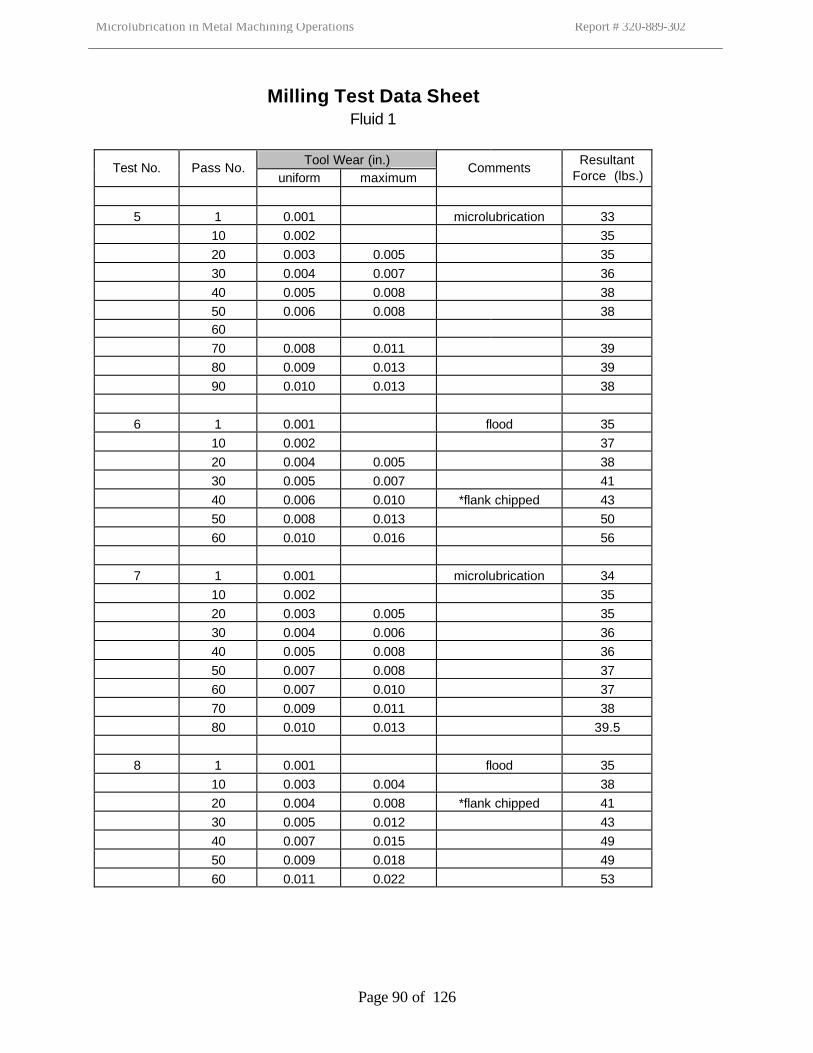
Microlubrication in Metal Machining Operations Report # 320-889-302
Page 90 of 126
Milling Test Data Sheet Fluid 1
Tool Wear (in.)
Test No. Pass No. uniform maximum
Comments Resultant
Force (lbs.)
5 1 0.001 microlubrication 33 10 0.002 35 20 0.003 0.005 35 30 0.004 0.007 36 40 0.005 0.008 38 50 0.006 0.008 38 60 70 0.008 0.011 39 80 0.009 0.013 39 90 0.010 0.013 38 6 1 0.001 flood 35 10 0.002 37 20 0.004 0.005 38 30 0.005 0.007 41 40 0.006 0.010 *flank chipped 43 50 0.008 0.013 50 60 0.010 0.016 56 7 1 0.001 microlubrication 34 10 0.002 35 20 0.003 0.005 35 30 0.004 0.006 36 40 0.005 0.008 36 50 0.007 0.008 37 60 0.007 0.010 37 70 0.009 0.011 38 80 0.010 0.013 39.5 8 1 0.001 flood 35 10 0.003 0.004 38 20 0.004 0.008 *flank chipped 41 30 0.005 0.012 43 40 0.007 0.015 49 50 0.009 0.018 49 60 0.011 0.022 53
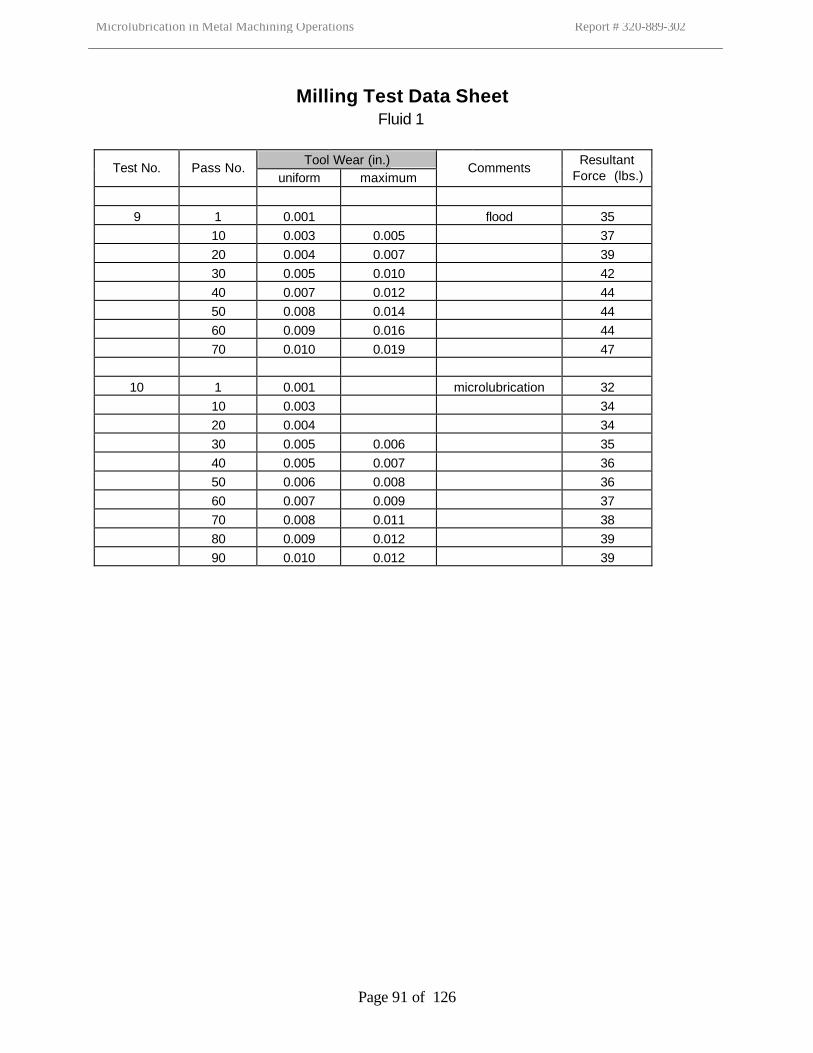
Microlubrication in Metal Machining Operations Report # 320-889-302
Page 91 of 126
Milling Test Data Sheet Fluid 1
Tool Wear (in.)
Test No. Pass No. uniform maximum
Comments Resultant
Force (lbs.)
9 1 0.001 flood 35 10 0.003 0.005 37 20 0.004 0.007 39 30 0.005 0.010 42 40 0.007 0.012 44 50 0.008 0.014 44 60 0.009 0.016 44 70 0.010 0.019 47
10 1 0.001 microlubrication 32 10 0.003 34 20 0.004 34 30 0.005 0.006 35 40 0.005 0.007 36 50 0.006 0.008 36 60 0.007 0.009 37 70 0.008 0.011 38 80 0.009 0.012 39 90 0.010 0.012 39
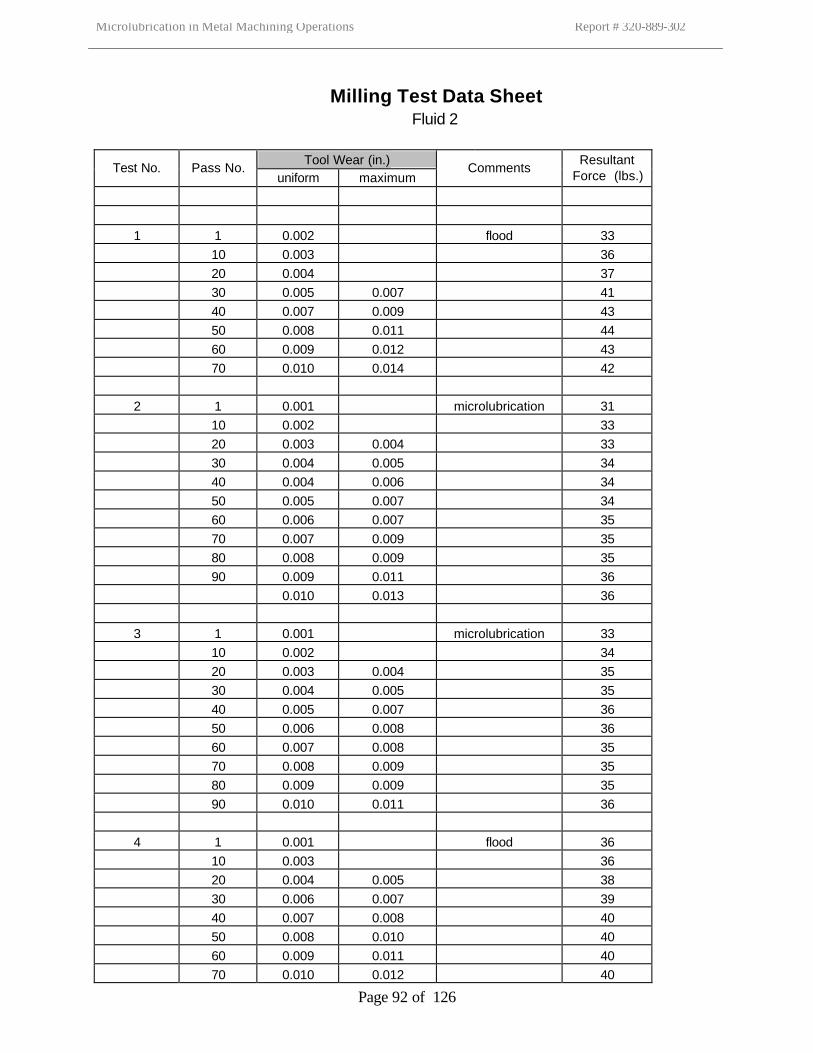
Microlubrication in Metal Machining Operations Report # 320-889-302
Page 92 of 126
Milling Test Data Sheet Fluid 2
Tool Wear (in.)
Test No. Pass No. uniform maximum
Comments Resultant
Force (lbs.)
1 1 0.002 flood 33 10 0.003 36 20 0.004 37 30 0.005 0.007 41 40 0.007 0.009 43 50 0.008 0.011 44 60 0.009 0.012 43 70 0.010 0.014 42 2 1 0.001 microlubrication 31 10 0.002 33 20 0.003 0.004 33 30 0.004 0.005 34 40 0.004 0.006 34 50 0.005 0.007 34 60 0.006 0.007 35 70 0.007 0.009 35 80 0.008 0.009 35 90 0.009 0.011 36 0.010 0.013 36 3 1 0.001 microlubrication 33 10 0.002 34 20 0.003 0.004 35 30 0.004 0.005 35 40 0.005 0.007 36 50 0.006 0.008 36 60 0.007 0.008 35 70 0.008 0.009 35 80 0.009 0.009 35 90 0.010 0.011 36 4 1 0.001 flood 36 10 0.003 36 20 0.004 0.005 38 30 0.006 0.007 39 40 0.007 0.008 40 50 0.008 0.010 40 60 0.009 0.011 40 70 0.010 0.012 40
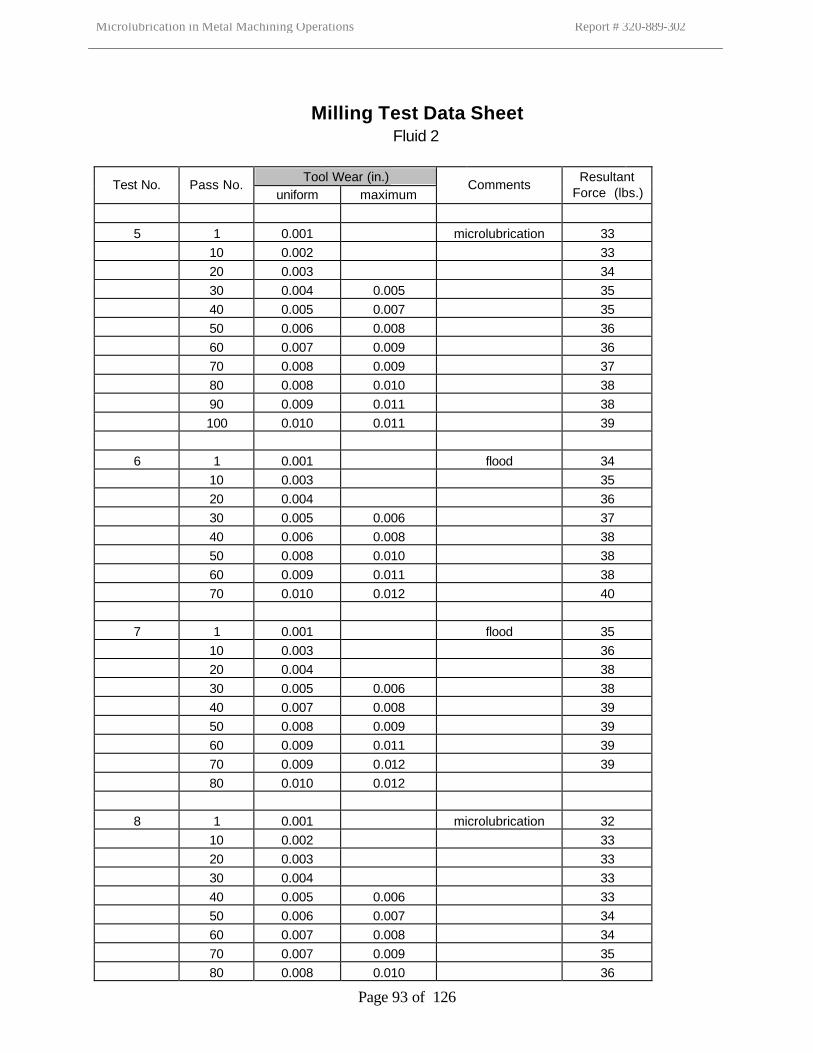
Microlubrication in Metal Machining Operations Report # 320-889-302
Page 93 of 126
Milling Test Data Sheet Fluid 2
Tool Wear (in.)
Test No. Pass No. uniform maximum
Comments Resultant
Force (lbs.)
5 1 0.001 microlubrication 33 10 0.002 33 20 0.003 34 30 0.004 0.005 35 40 0.005 0.007 35 50 0.006 0.008 36 60 0.007 0.009 36 70 0.008 0.009 37 80 0.008 0.010 38 90 0.009 0.011 38 100 0.010 0.011 39 6 1 0.001 flood 34 10 0.003 35 20 0.004 36 30 0.005 0.006 37 40 0.006 0.008 38 50 0.008 0.010 38 60 0.009 0.011 38 70 0.010 0.012 40 7 1 0.001 flood 35 10 0.003 36 20 0.004 38 30 0.005 0.006 38 40 0.007 0.008 39 50 0.008 0.009 39 60 0.009 0.011 39 70 0.009 0.012 39 80 0.010 0.012 8 1 0.001 microlubrication 32 10 0.002 33 20 0.003 33 30 0.004 33 40 0.005 0.006 33 50 0.006 0.007 34 60 0.007 0.008 34 70 0.007 0.009 35 80 0.008 0.010 36
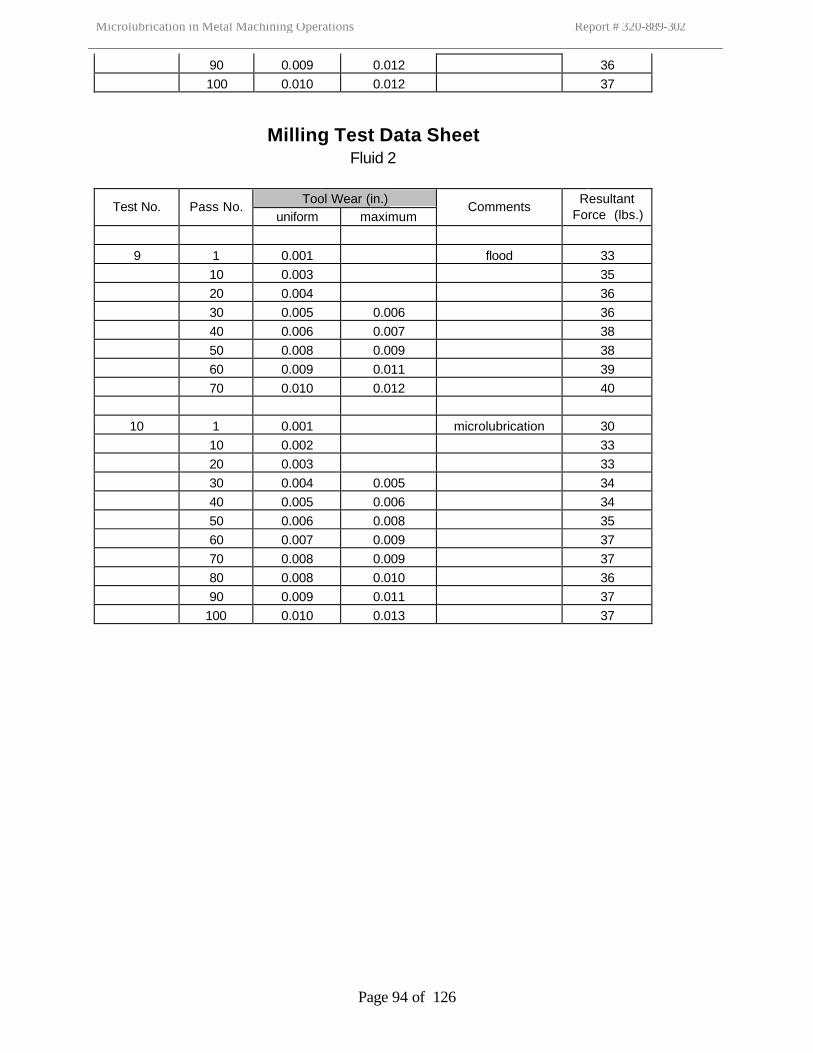
Microlubrication in Metal Machining Operations Report # 320-889-302
Page 94 of 126
90 0.009 0.012 36 100 0.010 0.012 37
Milling Test Data Sheet Fluid 2
Tool Wear (in.)
Test No. Pass No. uniform maximum
Comments Resultant
Force (lbs.)
9 1 0.001 flood 33 10 0.003 35 20 0.004 36 30 0.005 0.006 36 40 0.006 0.007 38 50 0.008 0.009 38 60 0.009 0.011 39 70 0.010 0.012 40
10 1 0.001 microlubrication 30 10 0.002 33 20 0.003 33 30 0.004 0.005 34 40 0.005 0.006 34 50 0.006 0.008 35 60 0.007 0.009 37 70 0.008 0.009 37 80 0.008 0.010 36 90 0.009 0.011 37 100 0.010 0.013 37
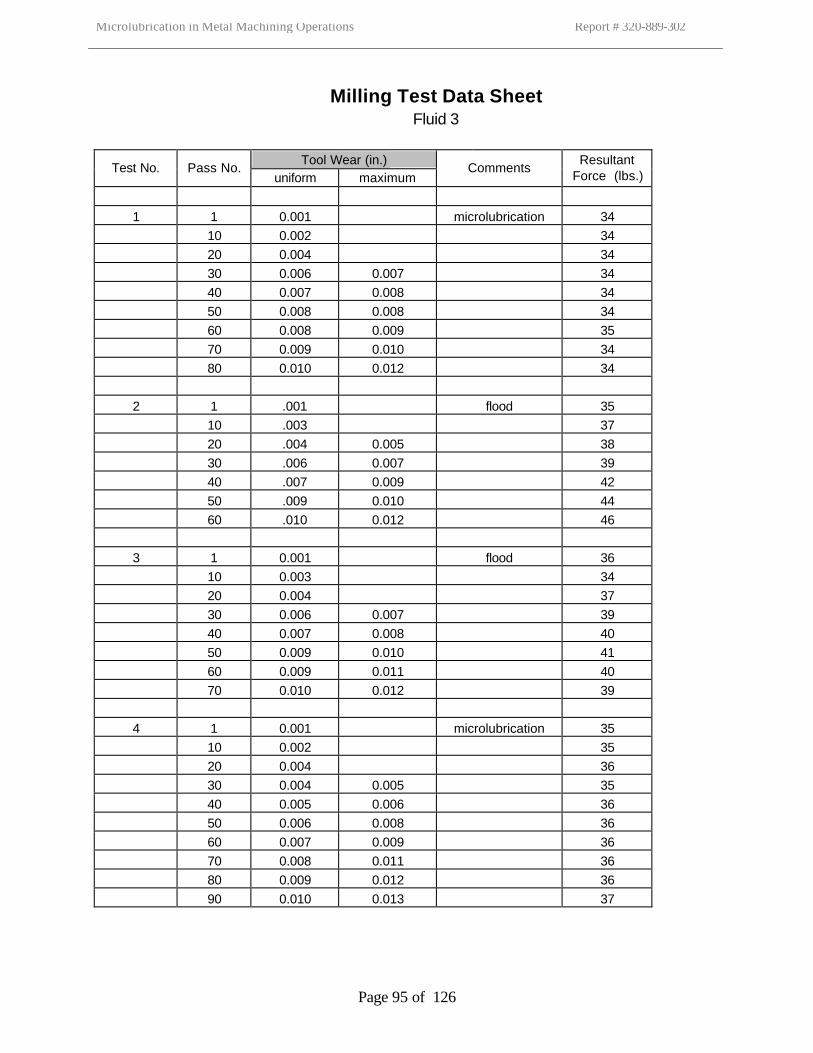
Microlubrication in Metal Machining Operations Report # 320-889-302
Page 95 of 126
Milling Test Data Sheet Fluid 3
Tool Wear (in.)
Test No. Pass No. uniform maximum
Comments Resultant
Force (lbs.)
1 1 0.001 microlubrication 34 10 0.002 34 20 0.004 34 30 0.006 0.007 34 40 0.007 0.008 34 50 0.008 0.008 34 60 0.008 0.009 35 70 0.009 0.010 34 80 0.010 0.012 34 2 1 .001 flood 35 10 .003 37 20 .004 0.005 38 30 .006 0.007 39 40 .007 0.009 42 50 .009 0.010 44 60 .010 0.012 46 3 1 0.001 flood 36 10 0.003 34 20 0.004 37 30 0.006 0.007 39 40 0.007 0.008 40 50 0.009 0.010 41 60 0.009 0.011 40 70 0.010 0.012 39 4 1 0.001 microlubrication 35 10 0.002 35 20 0.004 36 30 0.004 0.005 35 40 0.005 0.006 36 50 0.006 0.008 36 60 0.007 0.009 36 70 0.008 0.011 36 80 0.009 0.012 36 90 0.010 0.013 37
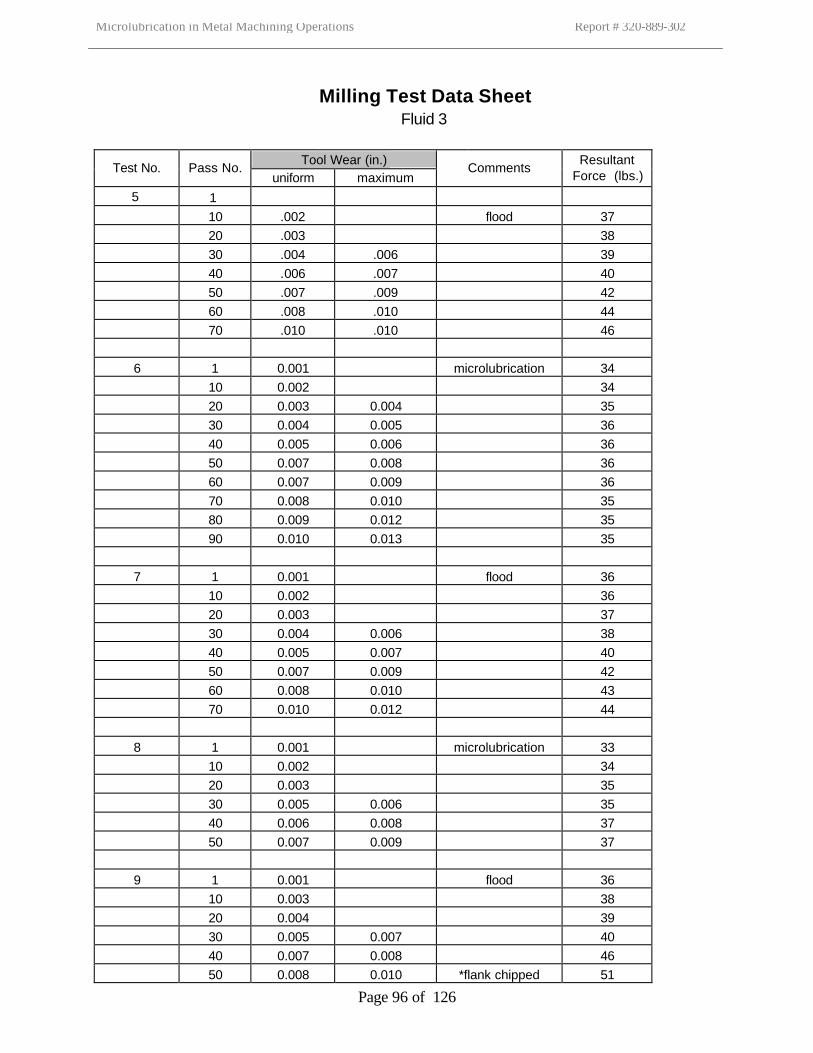
Microlubrication in Metal Machining Operations Report # 320-889-302
Page 96 of 126
Milling Test Data Sheet Fluid 3
Tool Wear (in.)
Test No. Pass No. uniform maximum
Comments Resultant
Force (lbs.)
5 1
10 .002 flood 37 20 .003 38 30 .004 .006 39 40 .006 .007 40 50 .007 .009 42 60 .008 .010 44 70 .010 .010 46 6 1 0.001 microlubrication 34 10 0.002 34 20 0.003 0.004 35 30 0.004 0.005 36 40 0.005 0.006 36 50 0.007 0.008 36 60 0.007 0.009 36 70 0.008 0.010 35 80 0.009 0.012 35 90 0.010 0.013 35 7 1 0.001 flood 36 10 0.002 36 20 0.003 37 30 0.004 0.006 38 40 0.005 0.007 40 50 0.007 0.009 42 60 0.008 0.010 43 70 0.010 0.012 44 8 1 0.001 microlubrication 33 10 0.002 34 20 0.003 35 30 0.005 0.006 35 40 0.006 0.008 37 50 0.007 0.009 37 9 1 0.001 flood 36 10 0.003 38 20 0.004 39 30 0.005 0.007 40 40 0.007 0.008 46 50 0.008 0.010 *flank chipped 51
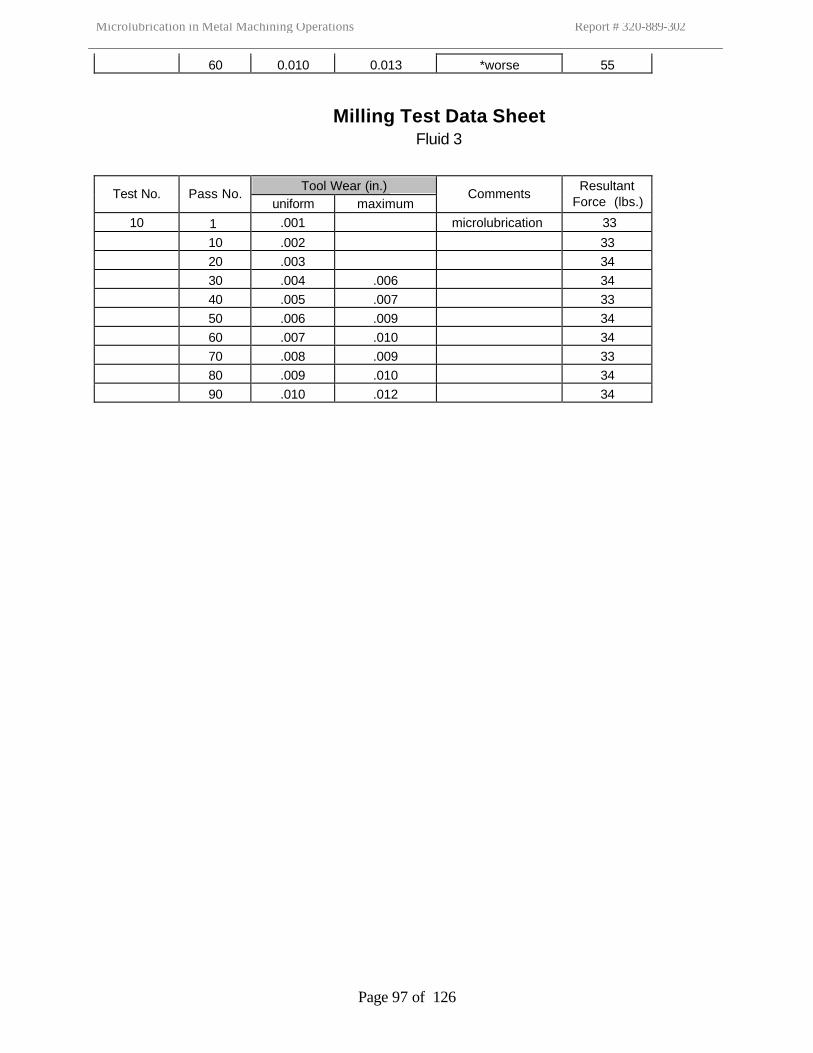
Microlubrication in Metal Machining Operations Report # 320-889-302
Page 97 of 126
60 0.010 0.013 *worse 55
Milling Test Data Sheet Fluid 3
Tool Wear (in.) Test No. Pass No.
uniform maximum Comments
Resultant Force (lbs.)
10 1 .001 microlubrication 33
10 .002 33 20 .003 34 30 .004 .006 34 40 .005 .007 33 50 .006 .009 34 60 .007 .010 34 70 .008 .009 33 80 .009 .010 34 90 .010 .012 34
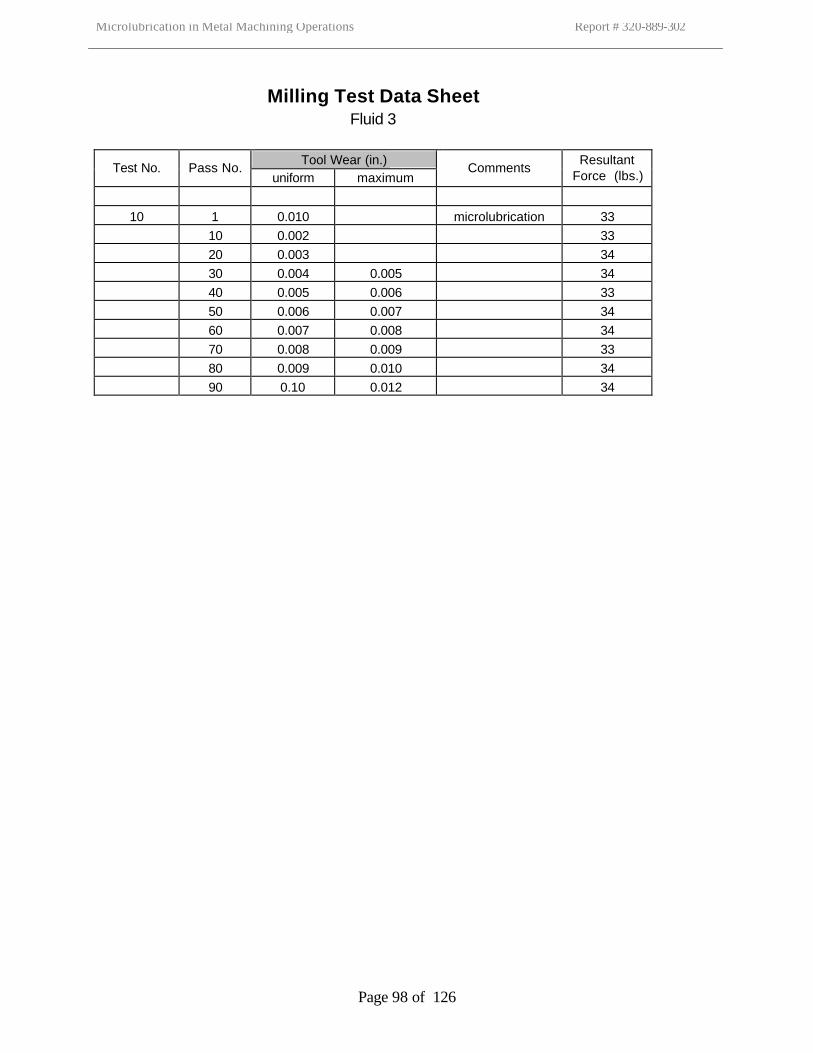
Microlubrication in Metal Machining Operations Report # 320-889-302
Page 98 of 126
Milling Test Data Sheet Fluid 3
Tool Wear (in.)
Test No. Pass No. uniform maximum
Comments Resultant
Force (lbs.)
10 1 0.010 microlubrication 33 10 0.002 33 20 0.003 34 30 0.004 0.005 34 40 0.005 0.006 33 50 0.006 0.007 34 60 0.007 0.008 34 70 0.008 0.009 33 80 0.009 0.010 34 90 0.10 0.012 34
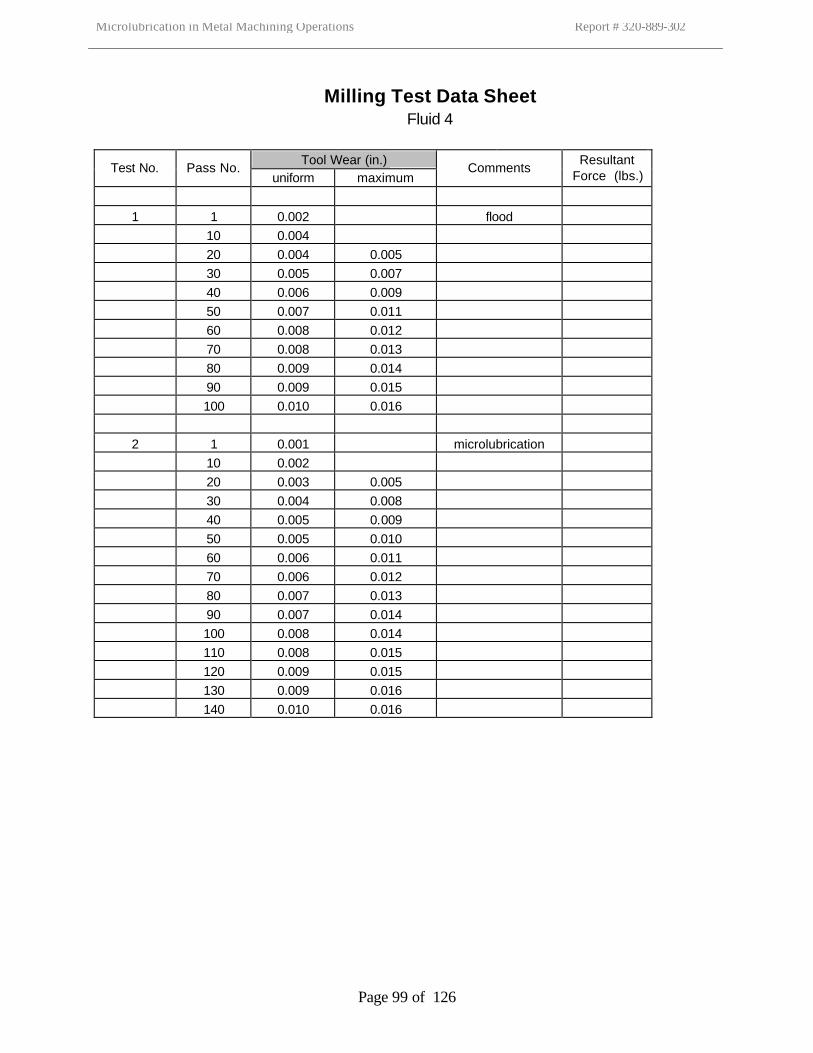
Microlubrication in Metal Machining Operations Report # 320-889-302
Page 99 of 126
Milling Test Data Sheet Fluid 4
Tool Wear (in.)
Test No. Pass No. uniform maximum
Comments Resultant
Force (lbs.)
1 1 0.002 flood 10 0.004 20 0.004 0.005 30 0.005 0.007 40 0.006 0.009 50 0.007 0.011 60 0.008 0.012 70 0.008 0.013 80 0.009 0.014 90 0.009 0.015 100 0.010 0.016 2 1 0.001 microlubrication 10 0.002 20 0.003 0.005 30 0.004 0.008 40 0.005 0.009 50 0.005 0.010 60 0.006 0.011 70 0.006 0.012 80 0.007 0.013 90 0.007 0.014 100 0.008 0.014 110 0.008 0.015 120 0.009 0.015 130 0.009 0.016 140 0.010 0.016
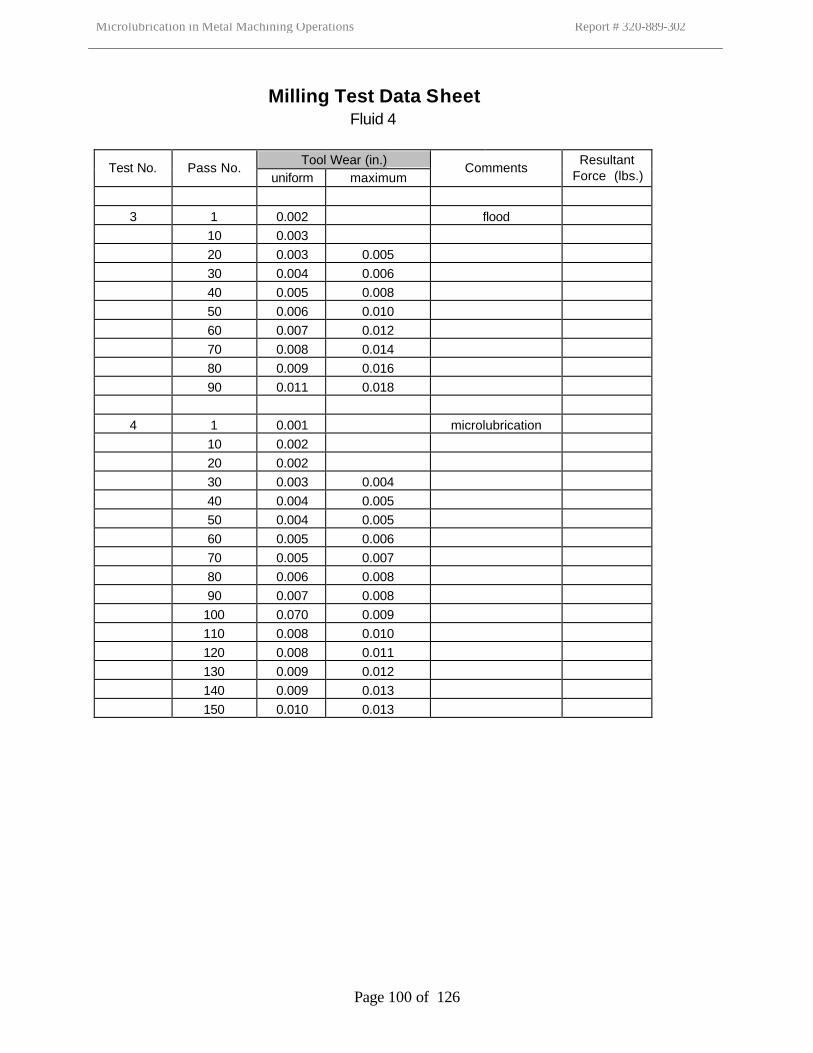
Microlubrication in Metal Machining Operations Report # 320-889-302
Page 100 of 126
Milling Test Data Sheet Fluid 4
Tool Wear (in.)
Test No. Pass No. uniform maximum
Comments Resultant
Force (lbs.)
3 1 0.002 flood 10 0.003 20 0.003 0.005 30 0.004 0.006 40 0.005 0.008 50 0.006 0.010 60 0.007 0.012 70 0.008 0.014 80 0.009 0.016 90 0.011 0.018 4 1 0.001 microlubrication 10 0.002 20 0.002 30 0.003 0.004 40 0.004 0.005 50 0.004 0.005 60 0.005 0.006 70 0.005 0.007 80 0.006 0.008 90 0.007 0.008 100 0.070 0.009 110 0.008 0.010 120 0.008 0.011 130 0.009 0.012 140 0.009 0.013 150 0.010 0.013
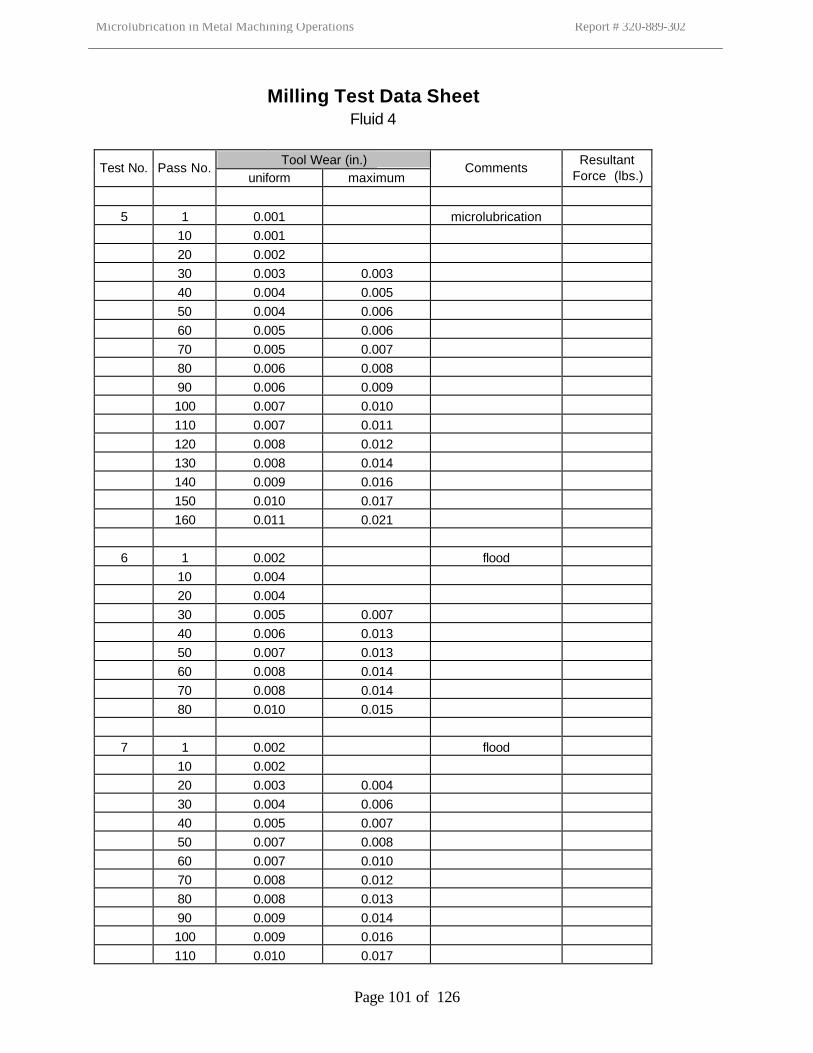
Microlubrication in Metal Machining Operations Report # 320-889-302
Page 101 of 126
Milling Test Data Sheet Fluid 4
Tool Wear (in.)
Test No. Pass No. uniform maximum
Comments Resultant
Force (lbs.)
5 1 0.001 microlubrication 10 0.001 20 0.002 30 0.003 0.003 40 0.004 0.005 50 0.004 0.006 60 0.005 0.006 70 0.005 0.007 80 0.006 0.008 90 0.006 0.009 100 0.007 0.010 110 0.007 0.011 120 0.008 0.012 130 0.008 0.014 140 0.009 0.016 150 0.010 0.017 160 0.011 0.021 6 1 0.002 flood 10 0.004 20 0.004 30 0.005 0.007 40 0.006 0.013 50 0.007 0.013 60 0.008 0.014 70 0.008 0.014 80 0.010 0.015 7 1 0.002 flood 10 0.002 20 0.003 0.004 30 0.004 0.006 40 0.005 0.007 50 0.007 0.008 60 0.007 0.010 70 0.008 0.012 80 0.008 0.013 90 0.009 0.014 100 0.009 0.016 110 0.010 0.017
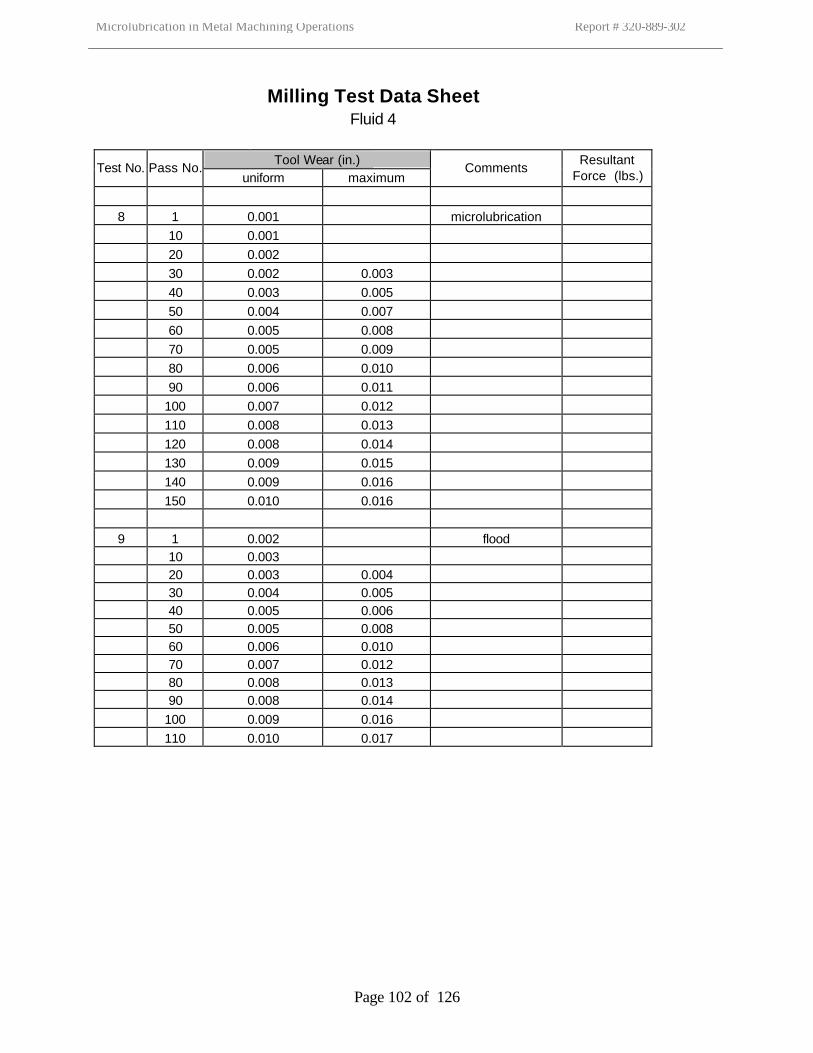
Microlubrication in Metal Machining Operations Report # 320-889-302
Page 102 of 126
Milling Test Data Sheet Fluid 4
Tool Wear (in.)
Test No. Pass No. uniform maximum
Comments Resultant
Force (lbs.)
8 1 0.001 microlubrication 10 0.001 20 0.002 30 0.002 0.003 40 0.003 0.005 50 0.004 0.007 60 0.005 0.008 70 0.005 0.009 80 0.006 0.010 90 0.006 0.011 100 0.007 0.012 110 0.008 0.013 120 0.008 0.014 130 0.009 0.015 140 0.009 0.016 150 0.010 0.016 9 1 0.002 flood 10 0.003 20 0.003 0.004 30 0.004 0.005 40 0.005 0.006 50 0.005 0.008 60 0.006 0.010 70 0.007 0.012 80 0.008 0.013 90 0.008 0.014 100 0.009 0.016 110 0.010 0.017
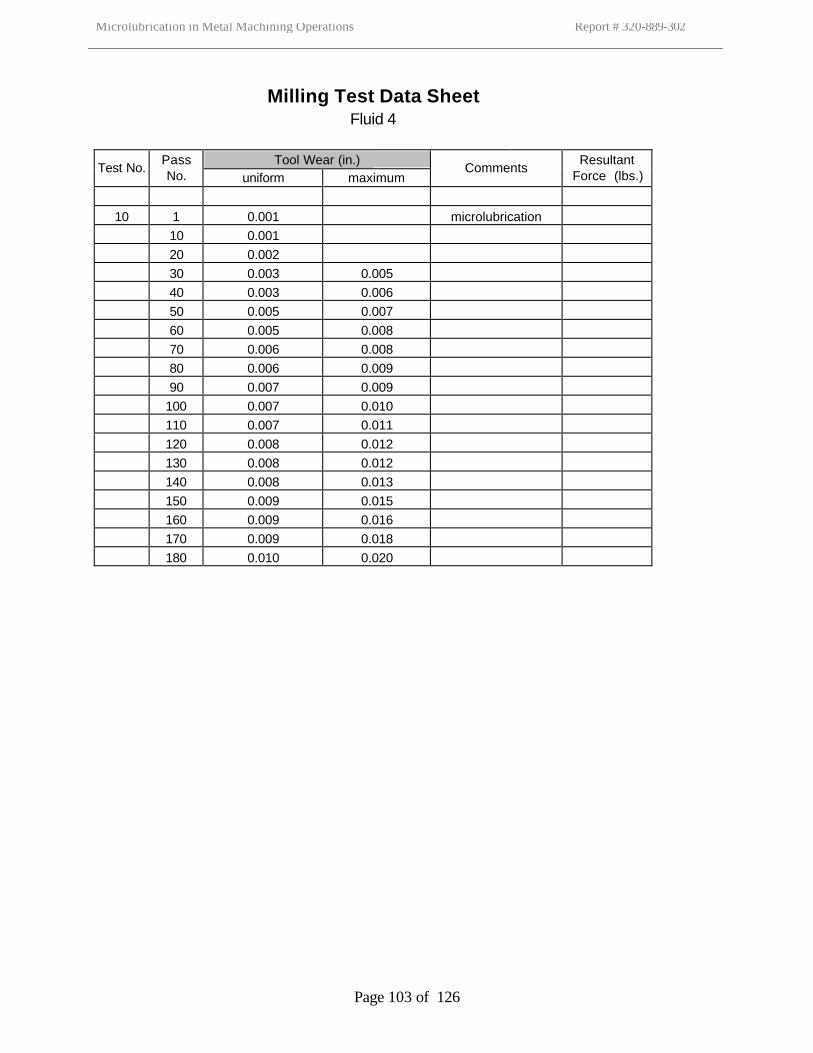
Microlubrication in Metal Machining Operations Report # 320-889-302
Page 103 of 126
Milling Test Data Sheet Fluid 4
Tool Wear (in.)
Test No. Pass No. uniform maximum
Comments Resultant
Force (lbs.)
10 1 0.001 microlubrication 10 0.001 20 0.002 30 0.003 0.005 40 0.003 0.006 50 0.005 0.007 60 0.005 0.008 70 0.006 0.008 80 0.006 0.009 90 0.007 0.009 100 0.007 0.010 110 0.007 0.011 120 0.008 0.012 130 0.008 0.012 140 0.008 0.013 150 0.009 0.015 160 0.009 0.016 170 0.009 0.018 180 0.010 0.020
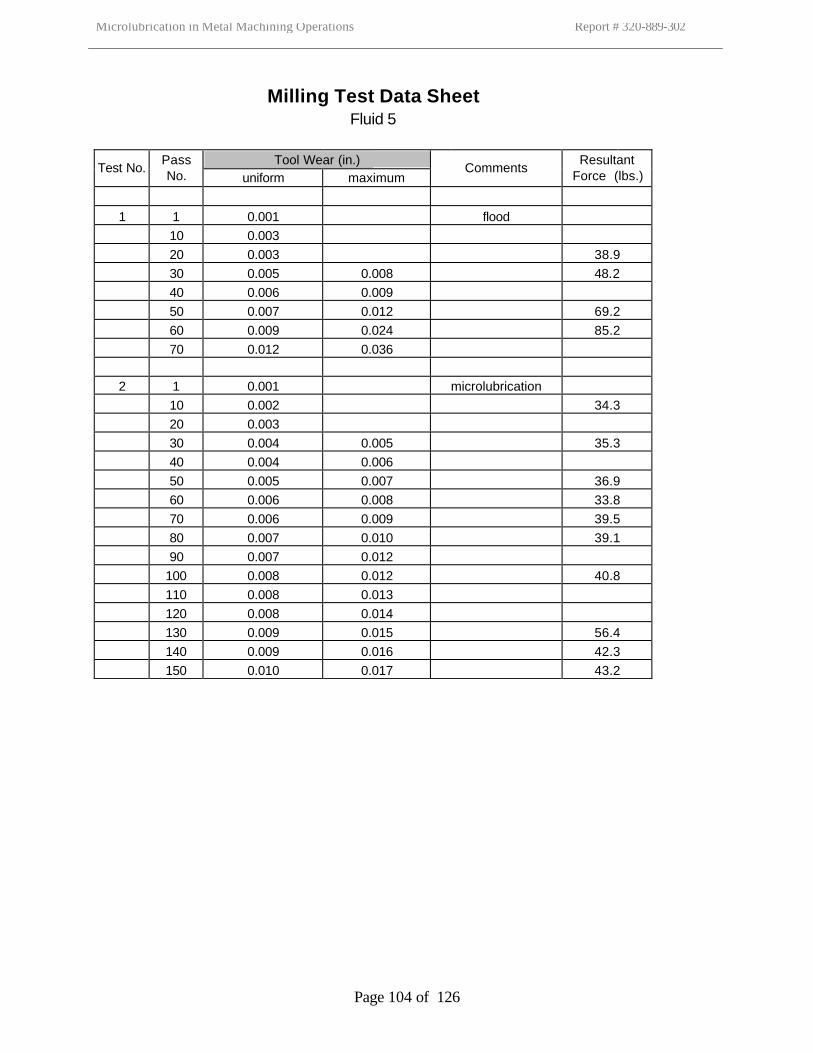
Microlubrication in Metal Machining Operations Report # 320-889-302
Page 104 of 126
Milling Test Data Sheet Fluid 5
Tool Wear (in.)
Test No. Pass No. uniform maximum
Comments Resultant
Force (lbs.)
1 1 0.001 flood 10 0.003 20 0.003 38.9 30 0.005 0.008 48.2 40 0.006 0.009 50 0.007 0.012 69.2 60 0.009 0.024 85.2 70 0.012 0.036 2 1 0.001 microlubrication 10 0.002 34.3 20 0.003 30 0.004 0.005 35.3 40 0.004 0.006 50 0.005 0.007 36.9 60 0.006 0.008 33.8 70 0.006 0.009 39.5 80 0.007 0.010 39.1 90 0.007 0.012 100 0.008 0.012 40.8 110 0.008 0.013 120 0.008 0.014 130 0.009 0.015 56.4 140 0.009 0.016 42.3 150 0.010 0.017 43.2
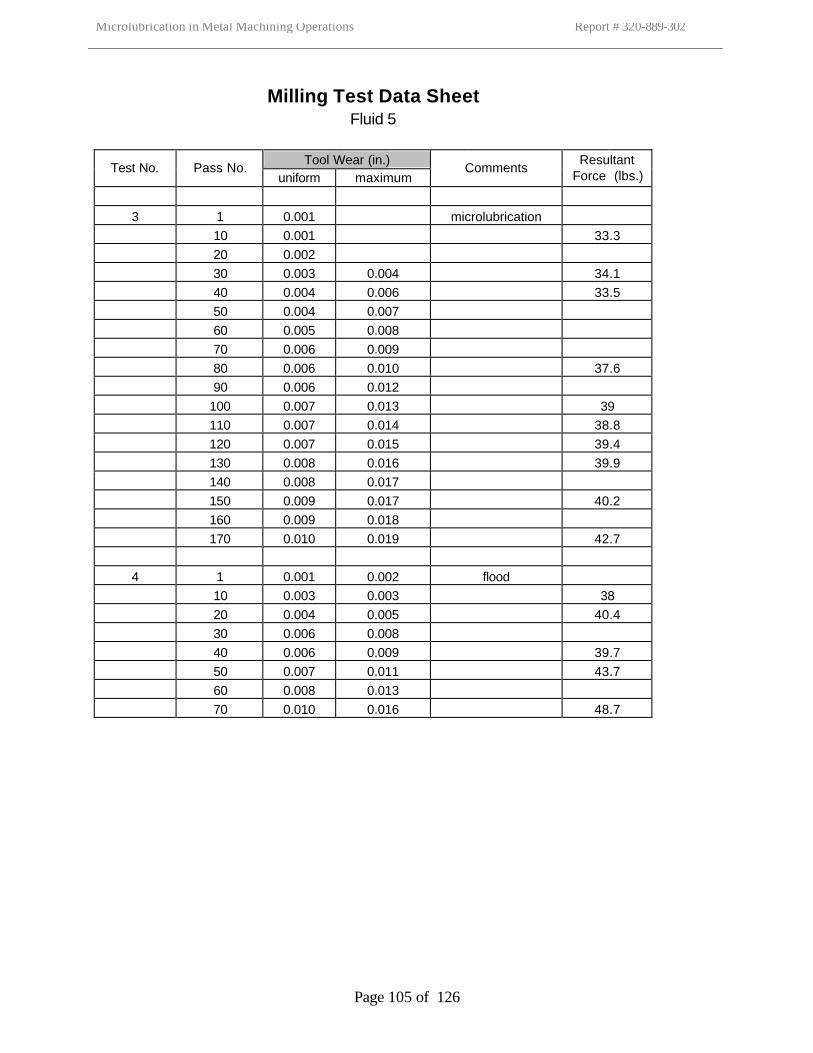
Microlubrication in Metal Machining Operations Report # 320-889-302
Page 105 of 126
Milling Test Data Sheet Fluid 5
Tool Wear (in.)
Test No. Pass No. uniform maximum
Comments Resultant
Force (lbs.)
3 1 0.001 microlubrication 10 0.001 33.3 20 0.002 30 0.003 0.004 34.1 40 0.004 0.006 33.5 50 0.004 0.007 60 0.005 0.008 70 0.006 0.009 80 0.006 0.010 37.6 90 0.006 0.012 100 0.007 0.013 39 110 0.007 0.014 38.8 120 0.007 0.015 39.4 130 0.008 0.016 39.9 140 0.008 0.017 150 0.009 0.017 40.2 160 0.009 0.018 170 0.010 0.019 42.7 4 1 0.001 0.002 flood 10 0.003 0.003 38 20 0.004 0.005 40.4 30 0.006 0.008 40 0.006 0.009 39.7 50 0.007 0.011 43.7 60 0.008 0.013 70 0.010 0.016 48.7
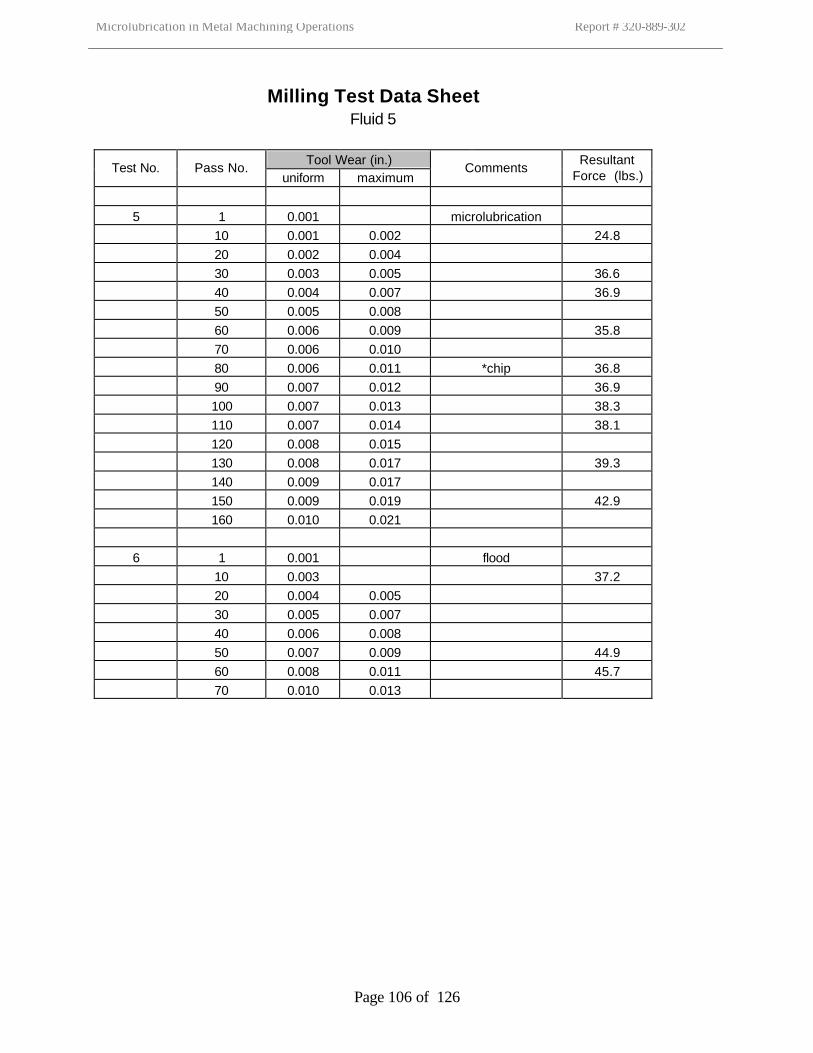
Microlubrication in Metal Machining Operations Report # 320-889-302
Page 106 of 126
Milling Test Data Sheet Fluid 5
Tool Wear (in.)
Test No. Pass No. uniform maximum
Comments Resultant
Force (lbs.)
5 1 0.001 microlubrication 10 0.001 0.002 24.8 20 0.002 0.004 30 0.003 0.005 36.6 40 0.004 0.007 36.9 50 0.005 0.008 60 0.006 0.009 35.8 70 0.006 0.010 80 0.006 0.011 *chip 36.8 90 0.007 0.012 36.9 100 0.007 0.013 38.3 110 0.007 0.014 38.1 120 0.008 0.015 130 0.008 0.017 39.3 140 0.009 0.017 150 0.009 0.019 42.9 160 0.010 0.021 6 1 0.001 flood 10 0.003 37.2 20 0.004 0.005 30 0.005 0.007 40 0.006 0.008 50 0.007 0.009 44.9 60 0.008 0.011 45.7 70 0.010 0.013
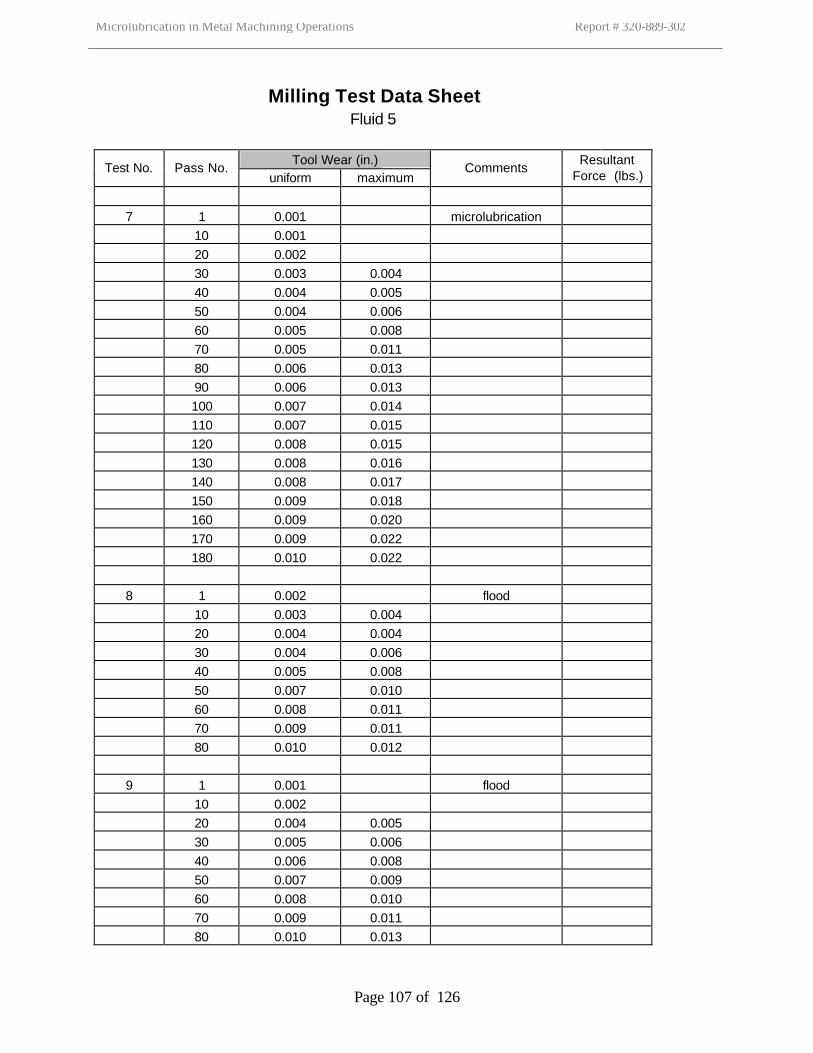
Microlubrication in Metal Machining Operations Report # 320-889-302
Page 107 of 126
Milling Test Data Sheet Fluid 5
Tool Wear (in.)
Test No. Pass No. uniform maximum
Comments Resultant
Force (lbs.)
7 1 0.001 microlubrication 10 0.001 20 0.002 30 0.003 0.004 40 0.004 0.005 50 0.004 0.006 60 0.005 0.008 70 0.005 0.011 80 0.006 0.013 90 0.006 0.013 100 0.007 0.014 110 0.007 0.015 120 0.008 0.015 130 0.008 0.016 140 0.008 0.017 150 0.009 0.018 160 0.009 0.020 170 0.009 0.022 180 0.010 0.022 8 1 0.002 flood 10 0.003 0.004 20 0.004 0.004 30 0.004 0.006 40 0.005 0.008 50 0.007 0.010 60 0.008 0.011 70 0.009 0.011 80 0.010 0.012 9 1 0.001 flood 10 0.002 20 0.004 0.005 30 0.005 0.006 40 0.006 0.008 50 0.007 0.009 60 0.008 0.010 70 0.009 0.011 80 0.010 0.013
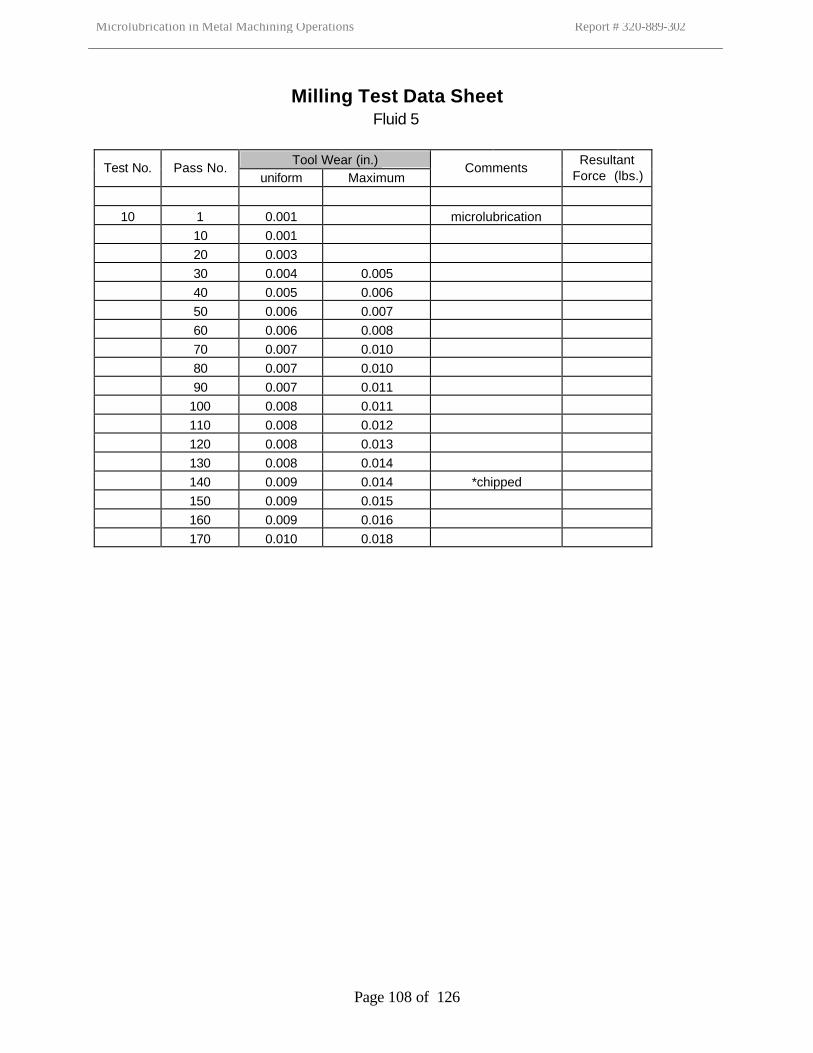
Microlubrication in Metal Machining Operations Report # 320-889-302
Page 108 of 126
Milling Test Data Sheet Fluid 5
Tool Wear (in.)
Test No. Pass No. uniform Maximum
Comments Resultant
Force (lbs.)
10 1 0.001 microlubrication 10 0.001 20 0.003 30 0.004 0.005 40 0.005 0.006 50 0.006 0.007 60 0.006 0.008 70 0.007 0.010 80 0.007 0.010 90 0.007 0.011 100 0.008 0.011 110 0.008 0.012 120 0.008 0.013 130 0.008 0.014 140 0.009 0.014 *chipped 150 0.009 0.015 160 0.009 0.016 170 0.010 0.018
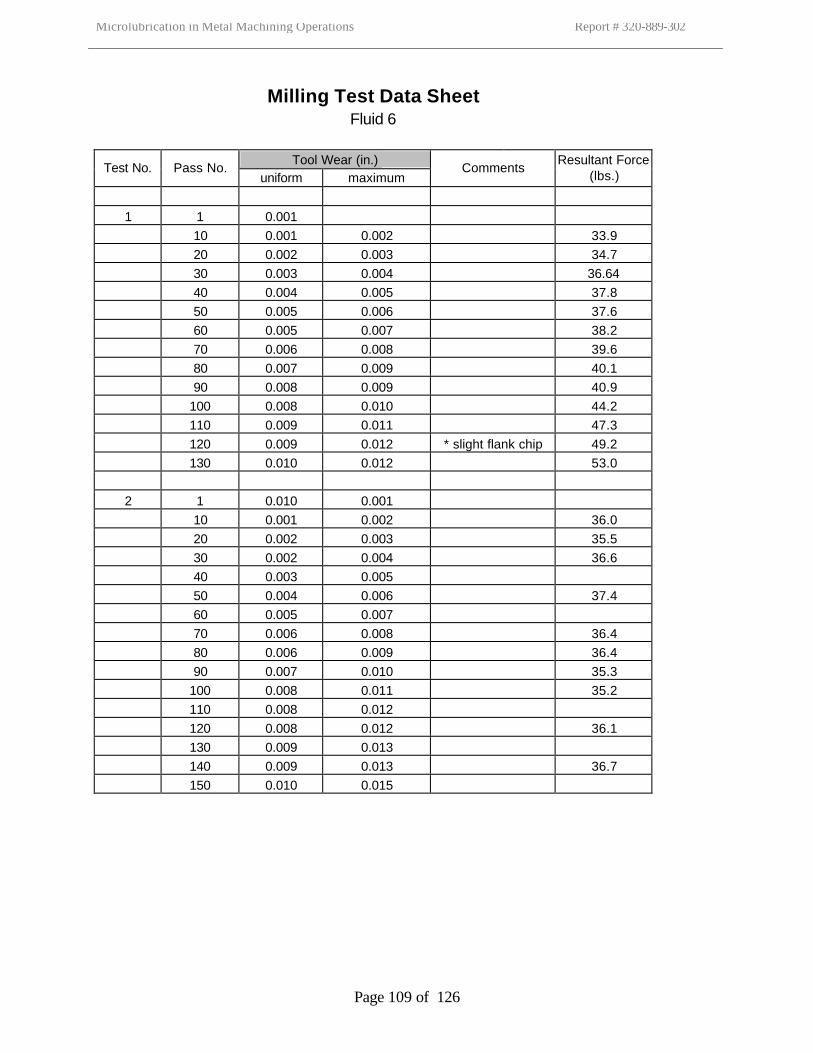
Microlubrication in Metal Machining Operations Report # 320-889-302
Page 109 of 126
Milling Test Data Sheet Fluid 6
Tool Wear (in.)
Test No. Pass No. uniform maximum
Comments Resultant Force
(lbs.)
1 1 0.001 10 0.001 0.002 33.9 20 0.002 0.003 34.7 30 0.003 0.004 36.64 40 0.004 0.005 37.8 50 0.005 0.006 37.6 60 0.005 0.007 38.2 70 0.006 0.008 39.6 80 0.007 0.009 40.1 90 0.008 0.009 40.9 100 0.008 0.010 44.2 110 0.009 0.011 47.3 120 0.009 0.012 * slight flank chip 49.2 130 0.010 0.012 53.0 2 1 0.010 0.001 10 0.001 0.002 36.0 20 0.002 0.003 35.5 30 0.002 0.004 36.6 40 0.003 0.005 50 0.004 0.006 37.4 60 0.005 0.007 70 0.006 0.008 36.4 80 0.006 0.009 36.4 90 0.007 0.010 35.3 100 0.008 0.011 35.2 110 0.008 0.012 120 0.008 0.012 36.1 130 0.009 0.013 140 0.009 0.013 36.7 150 0.010 0.015
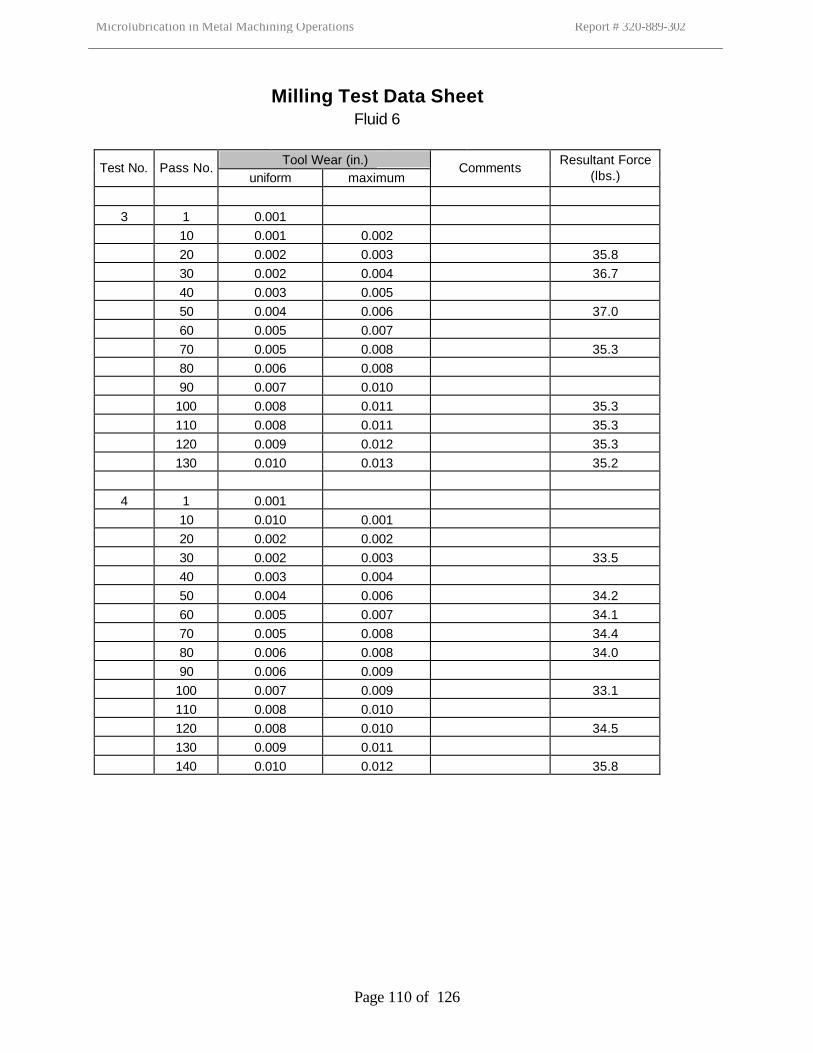
Microlubrication in Metal Machining Operations Report # 320-889-302
Page 110 of 126
Milling Test Data Sheet Fluid 6
Tool Wear (in.)
Test No. Pass No. uniform maximum
Comments Resultant Force
(lbs.)
3 1 0.001 10 0.001 0.002 20 0.002 0.003 35.8 30 0.002 0.004 36.7 40 0.003 0.005 50 0.004 0.006 37.0 60 0.005 0.007 70 0.005 0.008 35.3 80 0.006 0.008 90 0.007 0.010 100 0.008 0.011 35.3 110 0.008 0.011 35.3 120 0.009 0.012 35.3 130 0.010 0.013 35.2 4 1 0.001 10 0.010 0.001 20 0.002 0.002 30 0.002 0.003 33.5 40 0.003 0.004 50 0.004 0.006 34.2 60 0.005 0.007 34.1 70 0.005 0.008 34.4 80 0.006 0.008 34.0 90 0.006 0.009 100 0.007 0.009 33.1 110 0.008 0.010 120 0.008 0.010 34.5 130 0.009 0.011 140 0.010 0.012 35.8
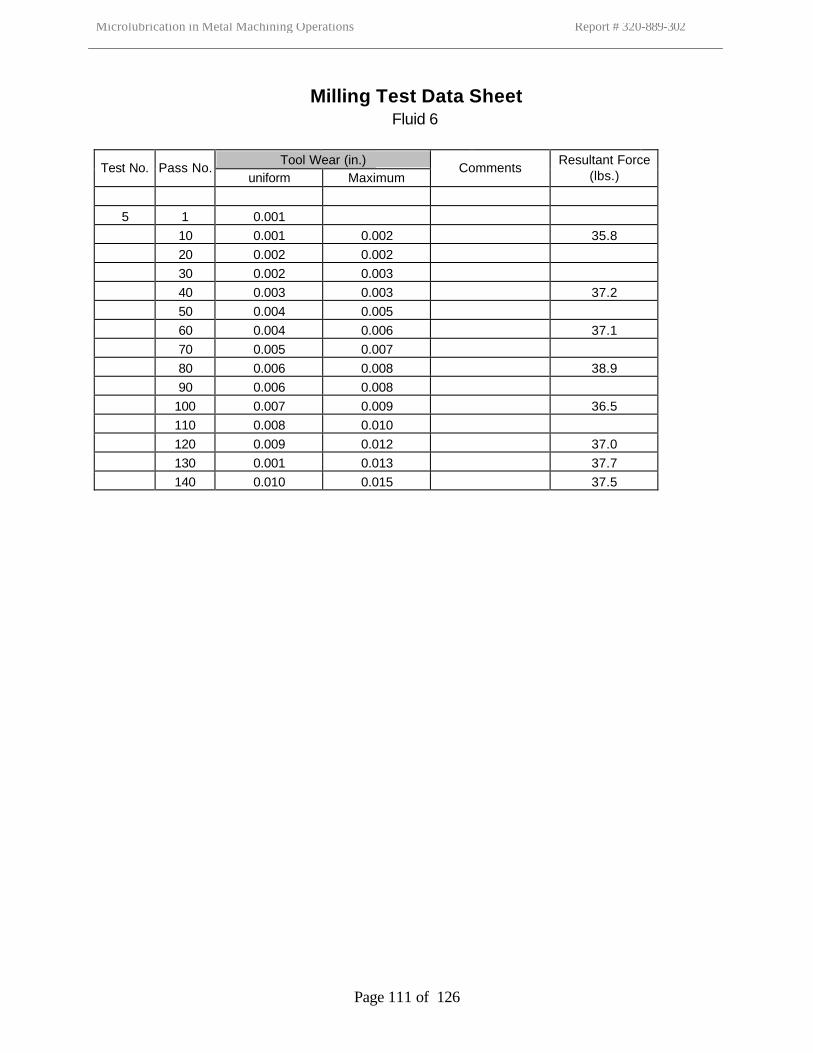
Microlubrication in Metal Machining Operations Report # 320-889-302
Page 111 of 126
Milling Test Data Sheet Fluid 6
Tool Wear (in.)
Test No. Pass No. uniform Maximum
Comments Resultant Force
(lbs.)
5 1 0.001 10 0.001 0.002 35.8 20 0.002 0.002 30 0.002 0.003 40 0.003 0.003 37.2 50 0.004 0.005 60 0.004 0.006 37.1 70 0.005 0.007 80 0.006 0.008 38.9 90 0.006 0.008 100 0.007 0.009 36.5 110 0.008 0.010 120 0.009 0.012 37.0 130 0.001 0.013 37.7 140 0.010 0.015 37.5
Microlubrication in Metal Machining Operations Report # 320-889-302
Page 112 of 126
APPENDIX 6
Statistical Analysis
Of Milling Test
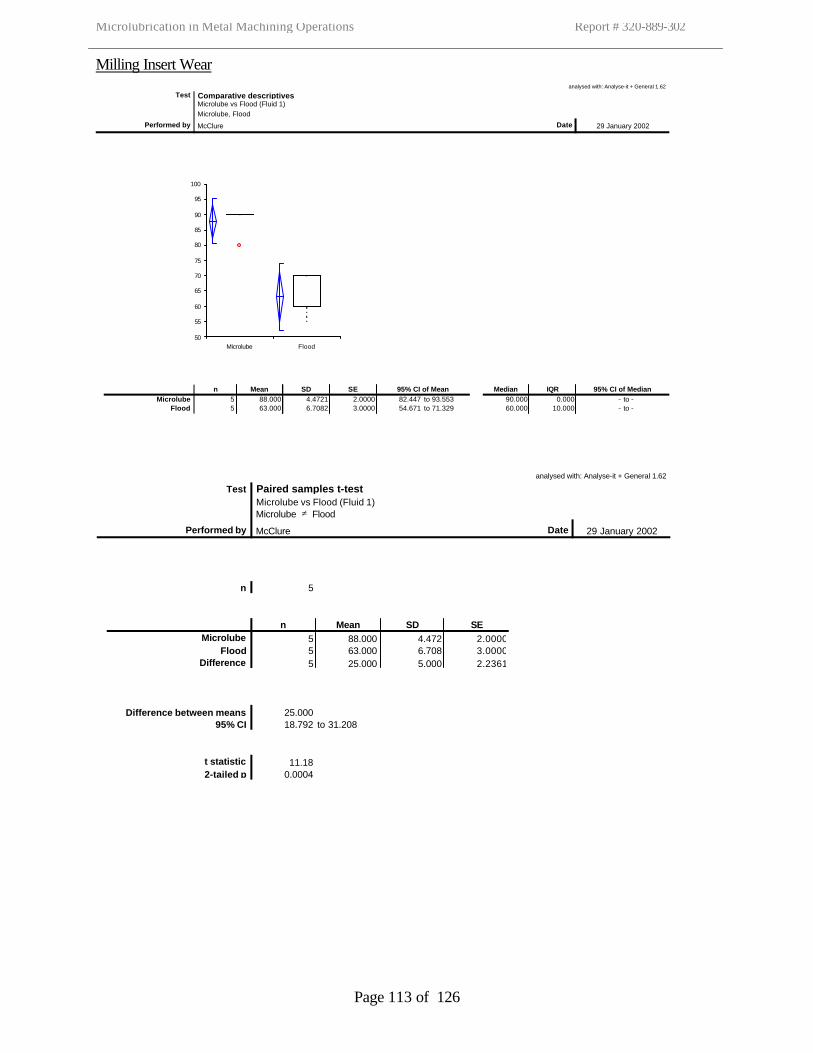
Microlubrication in Metal Machining Operations Report # 320-889-302
Page 113 of 126
Milling Insert Wear
analysed with: Analyse-it + General 1.62
Test Comparative descriptives Microlube vs Flood (Fluid 1) Microlube, Flood
Performed by McClure Date 29 January 2002
n Mean SD SE 95% CI of Mean Median IQR 95% CI of MedianMicrolube 5 88.000 4.4721 2.0000 82.447 to 93.553 90.000 0.000 - to -
Flood 5 63.000 6.7082 3.0000 54.671 to 71.329 60.000 10.000 - to -
50
55
60
65
70
75
80
85
90
95
100
Microlube Flood
analysed with: Analyse-it + General 1.62
Test Paired samples t-test Microlube vs Flood (Fluid 1) Microlube ≠ Flood
Performed by McClure Date 29 January 2002
n 5
n Mean SD SEMicrolube 5 88.000 4.472 2.0000
Flood 5 63.000 6.708 3.0000Difference 5 25.000 5.000 2.2361
Difference between means 25.00095% CI 18.792 to 31.208
t statistic 11.182-tailed p 0.0004
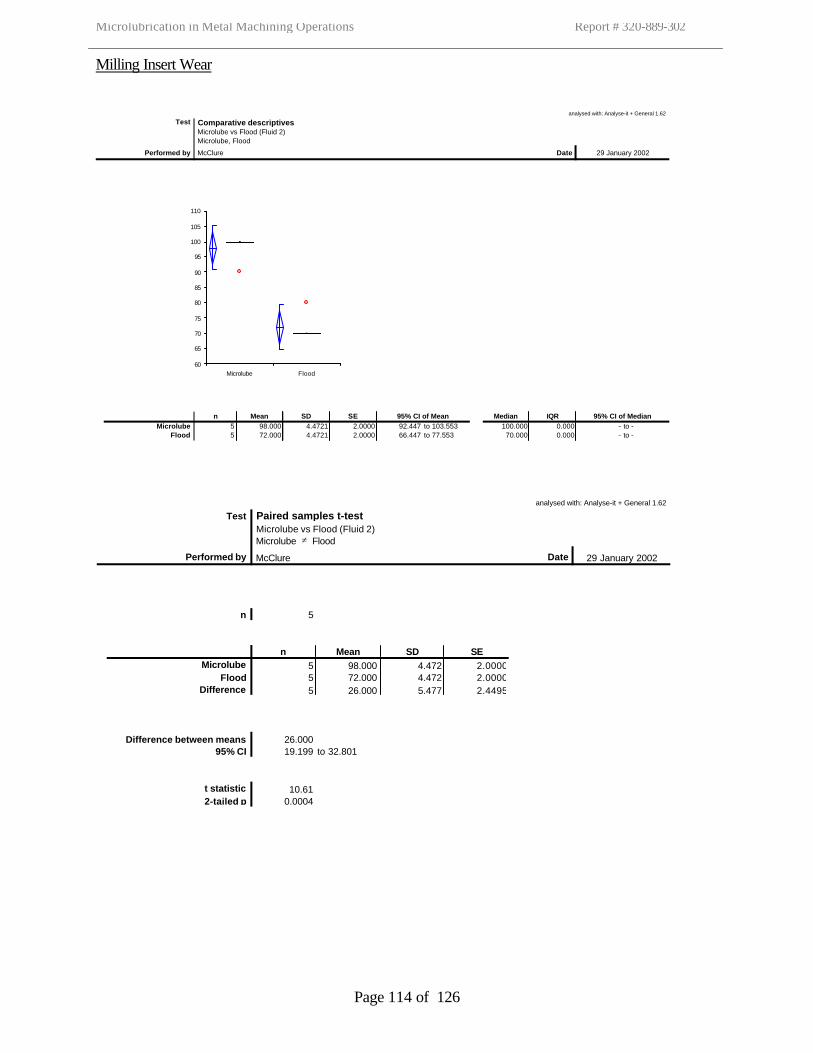
Microlubrication in Metal Machining Operations Report # 320-889-302
Page 114 of 126
Milling Insert Wear
analysed with: Analyse-it + General 1.62
Test Comparative descriptives Microlube vs Flood (Fluid 2) Microlube, Flood
Performed by McClure Date 29 January 2002
n Mean SD SE 95% CI of Mean Median IQR 95% CI of MedianMicrolube 5 98.000 4.4721 2.0000 92.447 to 103.553 100.000 0.000 - to -
Flood 5 72.000 4.4721 2.0000 66.447 to 77.553 70.000 0.000 - to -
60
65
70
75
80
85
90
95
100
105
110
Microlube Flood
analysed with: Analyse-it + General 1.62
Test Paired samples t-test Microlube vs Flood (Fluid 2) Microlube ≠ Flood
Performed by McClure Date 29 January 2002
n 5
n Mean SD SEMicrolube 5 98.000 4.472 2.0000
Flood 5 72.000 4.472 2.0000Difference 5 26.000 5.477 2.4495
Difference between means 26.00095% CI 19.199 to 32.801
t statistic 10.612-tailed p 0.0004
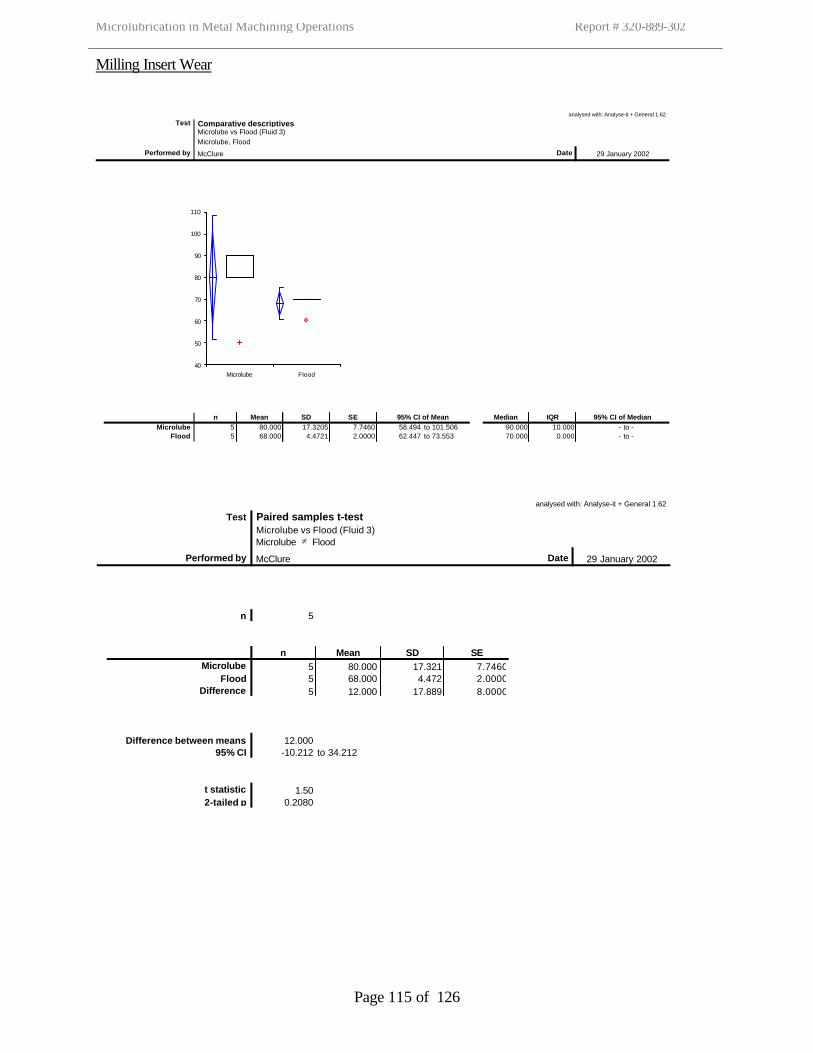
Microlubrication in Metal Machining Operations Report # 320-889-302
Page 115 of 126
Milling Insert Wear
analysed with: Analyse-it + General 1.62
Test Comparative descriptives Microlube vs Flood (Fluid 3) Microlube, Flood
Performed by McClure Date 29 January 2002
n Mean SD SE 95% CI of Mean Median IQR 95% CI of MedianMicrolube 5 80.000 17.3205 7.7460 58.494 to 101.506 90.000 10.000 - to -
Flood 5 68.000 4.4721 2.0000 62.447 to 73.553 70.000 0.000 - to -
40
50
60
70
80
90
100
110
Microlube Flood
analysed with: Analyse-it + General 1.62
Test Paired samples t-test Microlube vs Flood (Fluid 3) Microlube ≠ Flood
Performed by McClure Date 29 January 2002
n 5
n Mean SD SEMicrolube 5 80.000 17.321 7.7460
Flood 5 68.000 4.472 2.0000Difference 5 12.000 17.889 8.0000
Difference between means 12.00095% CI -10.212 to 34.212
t statistic 1.502-tailed p 0.2080
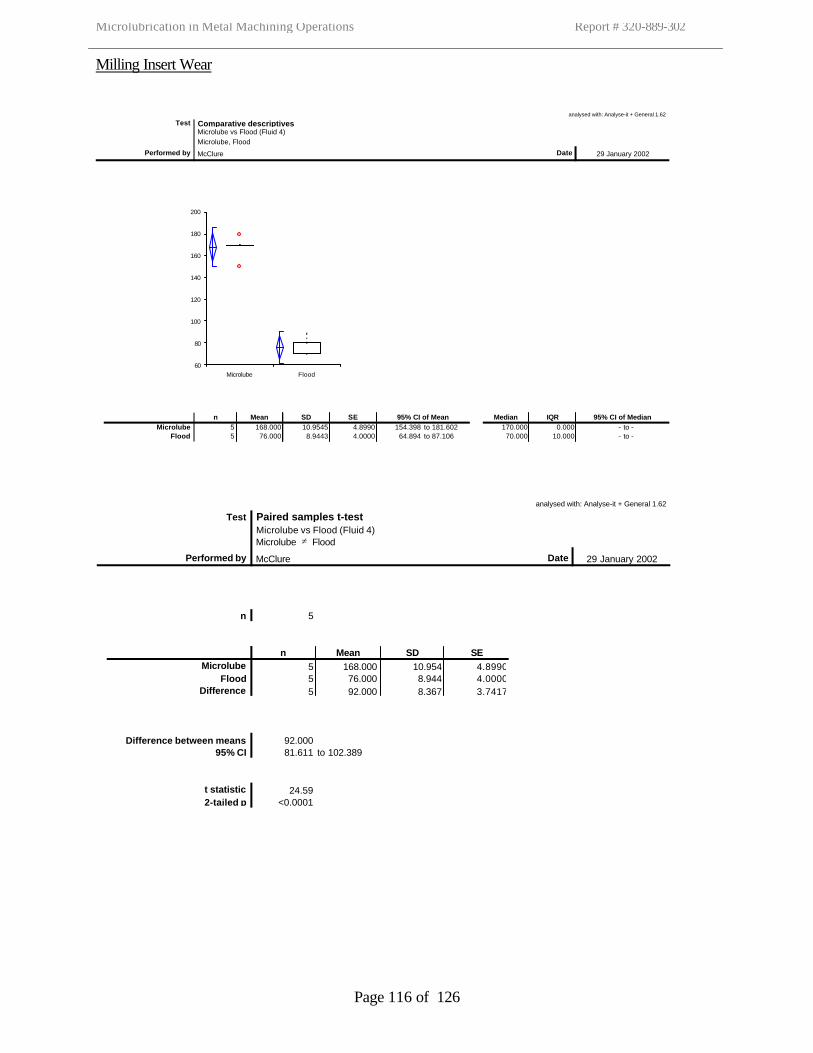
Microlubrication in Metal Machining Operations Report # 320-889-302
Page 116 of 126
Milling Insert Wear
analysed with: Analyse-it + General 1.62
Test Comparative descriptives Microlube vs Flood (Fluid 4) Microlube, Flood
Performed by McClure Date 29 January 2002
n Mean SD SE 95% CI of Mean Median IQR 95% CI of MedianMicrolube 5 168.000 10.9545 4.8990 154.398 to 181.602 170.000 0.000 - to -
Flood 5 76.000 8.9443 4.0000 64.894 to 87.106 70.000 10.000 - to -
60
80
100
120
140
160
180
200
Microlube Flood
analysed with: Analyse-it + General 1.62
Test Paired samples t-test Microlube vs Flood (Fluid 4) Microlube ≠ Flood
Performed by McClure Date 29 January 2002
n 5
n Mean SD SEMicrolube 5 168.000 10.954 4.8990
Flood 5 76.000 8.944 4.0000Difference 5 92.000 8.367 3.7417
Difference between means 92.00095% CI 81.611 to 102.389
t statistic 24.592-tailed p <0.0001
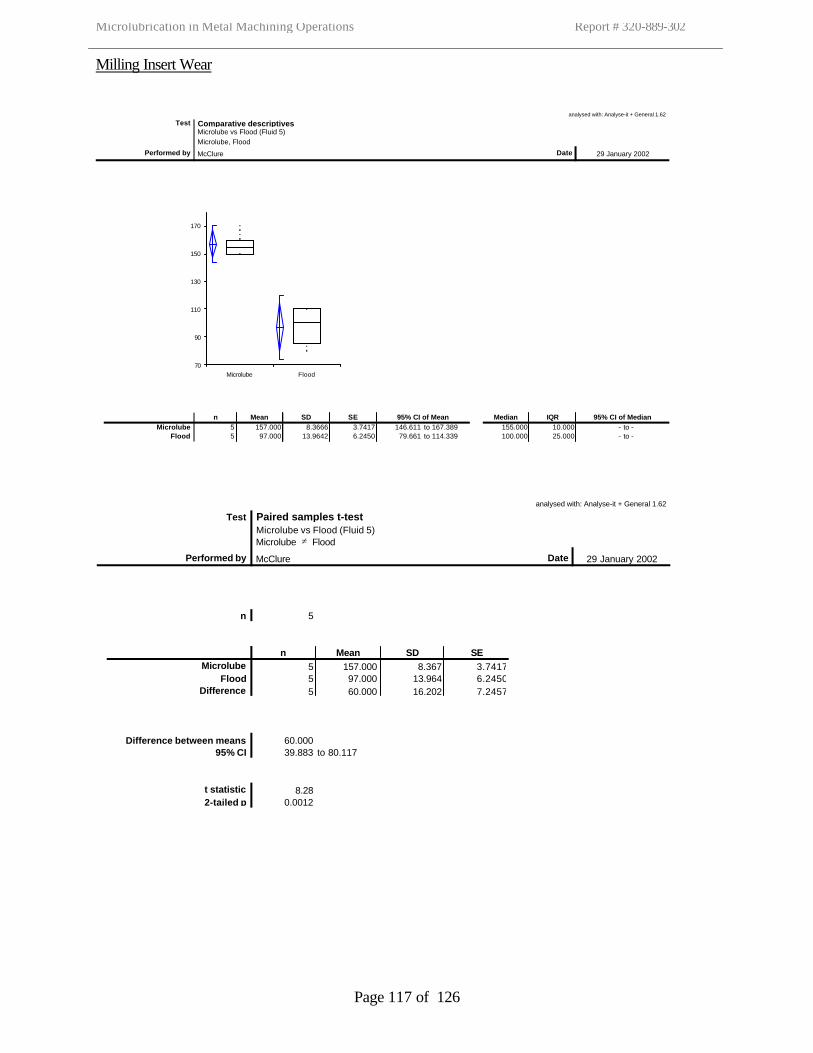
Microlubrication in Metal Machining Operations Report # 320-889-302
Page 117 of 126
Milling Insert Wear
analysed with: Analyse-it + General 1.62
Test Comparative descriptives Microlube vs Flood (Fluid 5) Microlube, Flood
Performed by McClure Date 29 January 2002
n Mean SD SE 95% CI of Mean Median IQR 95% CI of MedianMicrolube 5 157.000 8.3666 3.7417 146.611 to 167.389 155.000 10.000 - to -
Flood 5 97.000 13.9642 6.2450 79.661 to 114.339 100.000 25.000 - to -
70
90
110
130
150
170
Microlube Flood
analysed with: Analyse-it + General 1.62
Test Paired samples t-test Microlube vs Flood (Fluid 5) Microlube ≠ Flood
Performed by McClure Date 29 January 2002
n 5
n Mean SD SEMicrolube 5 157.000 8.367 3.7417
Flood 5 97.000 13.964 6.2450Difference 5 60.000 16.202 7.2457
Difference between means 60.00095% CI 39.883 to 80.117
t statistic 8.282-tailed p 0.0012
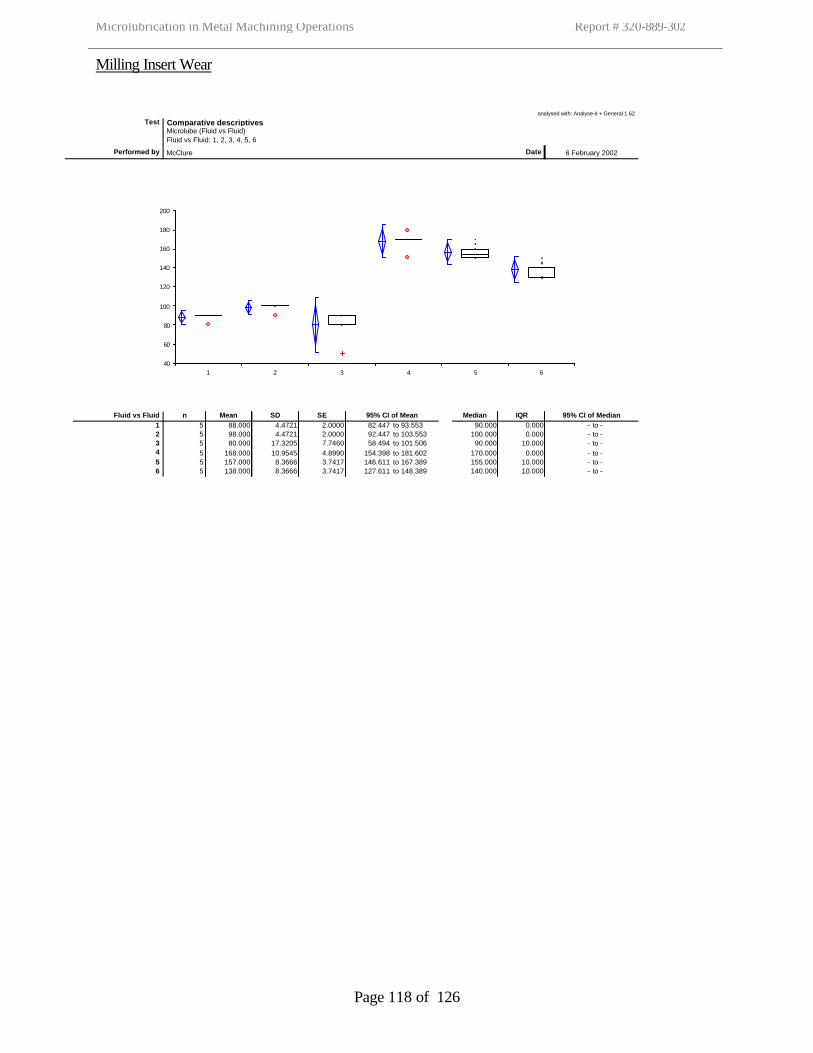
Microlubrication in Metal Machining Operations Report # 320-889-302
Page 118 of 126
Milling Insert Wear
analysed with: Analyse-it + General 1.62
Test Comparative descriptives Microlube (Fluid vs Fluid) Fluid vs Fluid: 1, 2, 3, 4, 5, 6
Performed by McClure Date 6 February 2002
Fluid vs Fluid n Mean SD SE 95% CI of Mean Median IQR 95% CI of Median1 5 88.000 4.4721 2.0000 82.447 to 93.553 90.000 0.000 - to -2 5 98.000 4.4721 2.0000 92.447 to 103.553 100.000 0.000 - to -3 5 80.000 17.3205 7.7460 58.494 to 101.506 90.000 10.000 - to -4 5 168.000 10.9545 4.8990 154.398 to 181.602 170.000 0.000 - to -5 5 157.000 8.3666 3.7417 146.611 to 167.389 155.000 10.000 - to -6 5 138.000 8.3666 3.7417 127.611 to 148.389 140.000 10.000 - to -
40
60
80
100
120
140
160
180
200
1 2 3 4 5 6
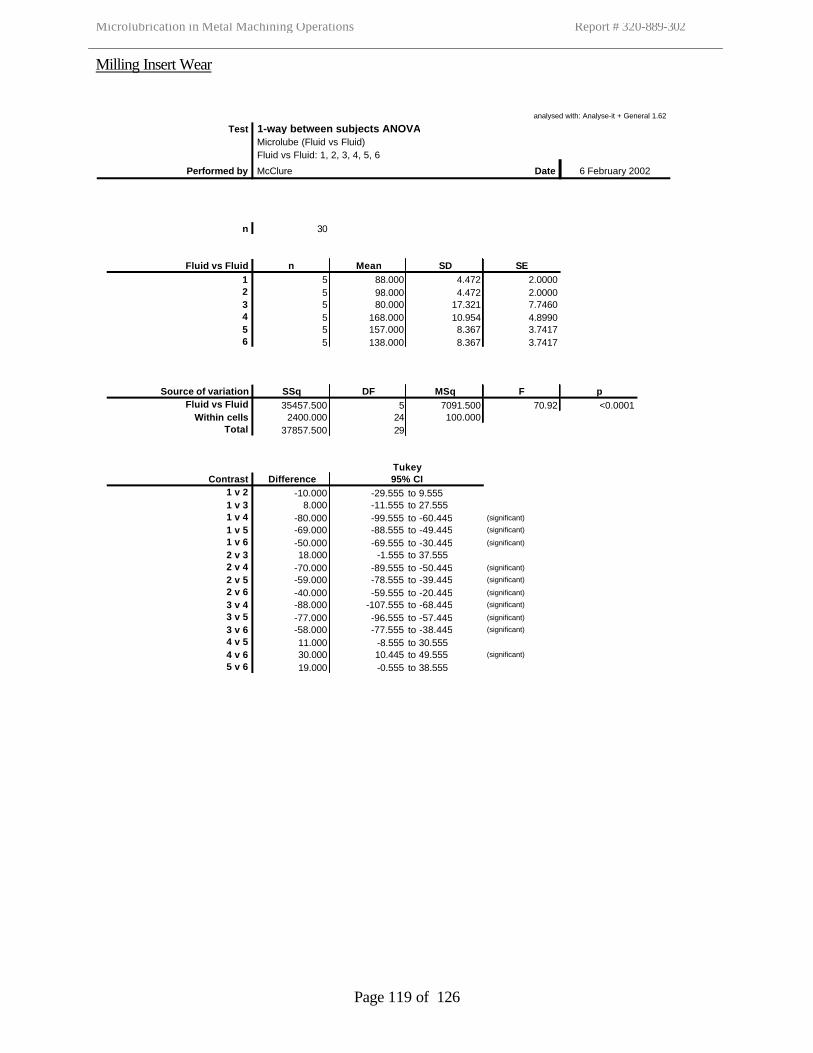
Microlubrication in Metal Machining Operations Report # 320-889-302
Page 119 of 126
Milling Insert Wear
analysed with: Analyse-it + General 1.62
Test 1-way between subjects ANOVA Microlube (Fluid vs Fluid) Fluid vs Fluid: 1, 2, 3, 4, 5, 6
Performed by McClure Date 6 February 2002
n 30
Fluid vs Fluid n Mean SD SE1 5 88.000 4.472 2.00002 5 98.000 4.472 2.00003 5 80.000 17.321 7.74604 5 168.000 10.954 4.89905 5 157.000 8.367 3.74176 5 138.000 8.367 3.7417
Source of variation SSq DF MSq F pFluid vs Fluid 35457.500 5 7091.500 70.92 <0.0001
Within cells 2400.000 24 100.000Total 37857.500 29
TukeyContrast Difference 95% CI
1 v 2 -10.000 -29.555 to 9.555
1 v 3 8.000 -11.555 to 27.555
1 v 4 -80.000 -99.555 to -60.445 (significant)
1 v 5 -69.000 -88.555 to -49.445 (significant)
1 v 6 -50.000 -69.555 to -30.445 (significant)
2 v 3 18.000 -1.555 to 37.555
2 v 4 -70.000 -89.555 to -50.445 (significant)
2 v 5 -59.000 -78.555 to -39.445 (significant)
2 v 6 -40.000 -59.555 to -20.445 (significant)
3 v 4 -88.000 -107.555 to -68.445 (significant)
3 v 5 -77.000 -96.555 to -57.445 (significant)
3 v 6 -58.000 -77.555 to -38.445 (significant)
4 v 5 11.000 -8.555 to 30.555
4 v 6 30.000 10.445 to 49.555 (significant)
5 v 6 19.000 -0.555 to 38.555
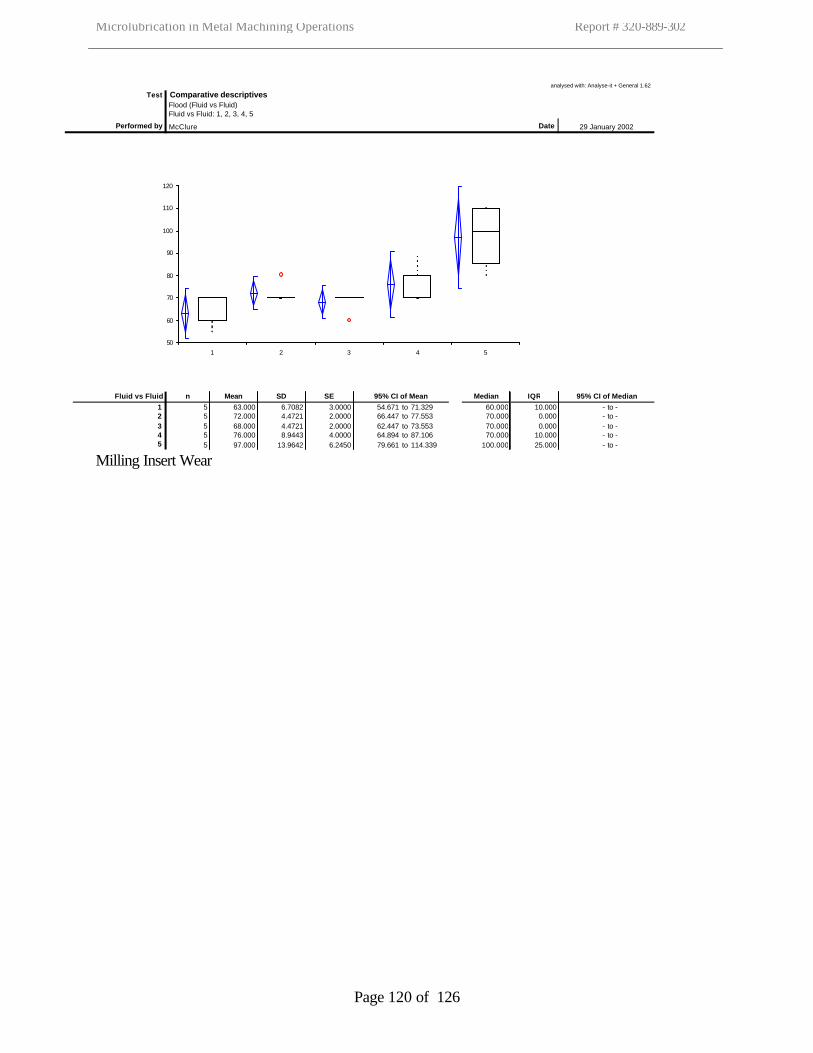
Microlubrication in Metal Machining Operations Report # 320-889-302
Page 120 of 126
Milling Insert Wear
analysed with: Analyse-it + General 1.62
Test Comparative descriptives Flood (Fluid vs Fluid) Fluid vs Fluid: 1, 2, 3, 4, 5
Performed by McClure Date 29 January 2002
Fluid vs Fluid n Mean SD SE 95% CI of Mean Median IQR 95% CI of Median1 5 63.000 6.7082 3.0000 54.671 to 71.329 60.000 10.000 - to -2 5 72.000 4.4721 2.0000 66.447 to 77.553 70.000 0.000 - to -3 5 68.000 4.4721 2.0000 62.447 to 73.553 70.000 0.000 - to -4 5 76.000 8.9443 4.0000 64.894 to 87.106 70.000 10.000 - to -5 5 97.000 13.9642 6.2450 79.661 to 114.339 100.000 25.000 - to -
50
60
70
80
90
100
110
120
1 2 3 4 5
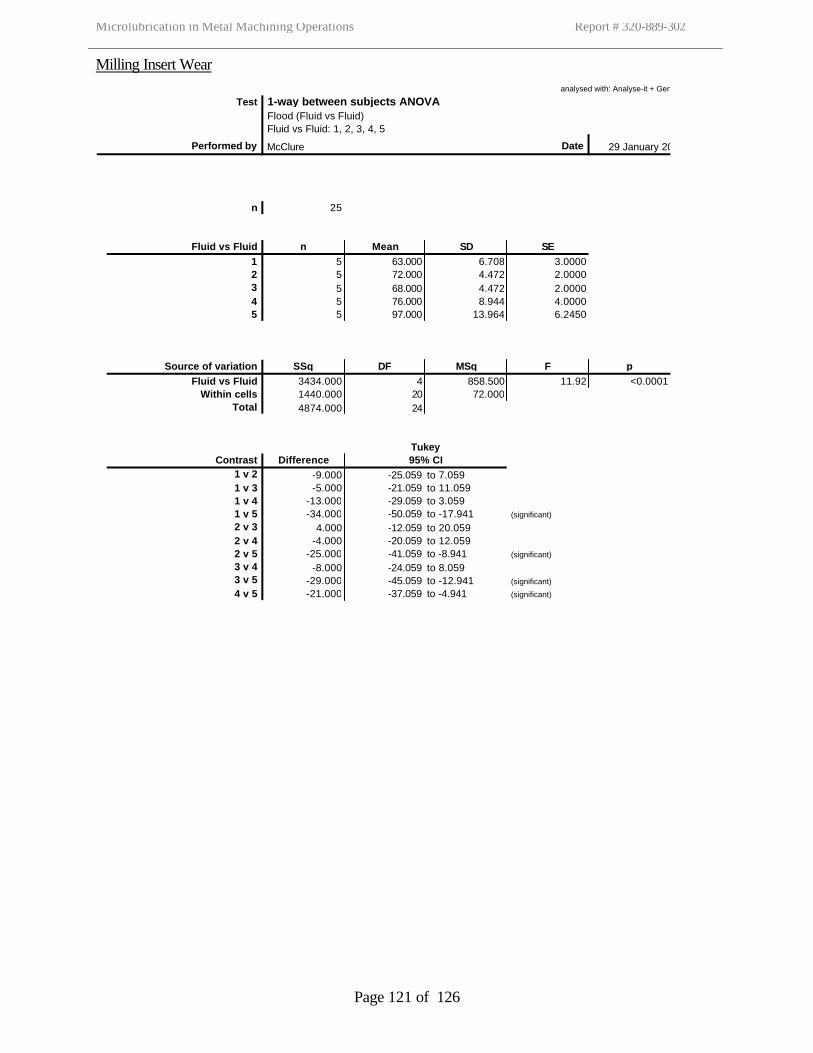
Microlubrication in Metal Machining Operations Report # 320-889-302
Page 121 of 126
Milling Insert Wear
analysed with: Analyse-it + General 1.62
Test 1-way between subjects ANOVA Flood (Fluid vs Fluid) Fluid vs Fluid: 1, 2, 3, 4, 5
Performed by McClure Date 29 January 2002
n 25
Fluid vs Fluid n Mean SD SE1 5 63.000 6.708 3.00002 5 72.000 4.472 2.00003 5 68.000 4.472 2.00004 5 76.000 8.944 4.00005 5 97.000 13.964 6.2450
Source of variation SSq DF MSq F pFluid vs Fluid 3434.000 4 858.500 11.92 <0.0001
Within cells 1440.000 20 72.000Total 4874.000 24
TukeyContrast Difference 95% CI
1 v 2 -9.000 -25.059 to 7.059
1 v 3 -5.000 -21.059 to 11.059
1 v 4 -13.000 -29.059 to 3.059
1 v 5 -34.000 -50.059 to -17.941 (significant)
2 v 3 4.000 -12.059 to 20.059
2 v 4 -4.000 -20.059 to 12.059
2 v 5 -25.000 -41.059 to -8.941 (significant)
3 v 4 -8.000 -24.059 to 8.059
3 v 5 -29.000 -45.059 to -12.941 (significant)
4 v 5 -21.000 -37.059 to -4.941 (significant)
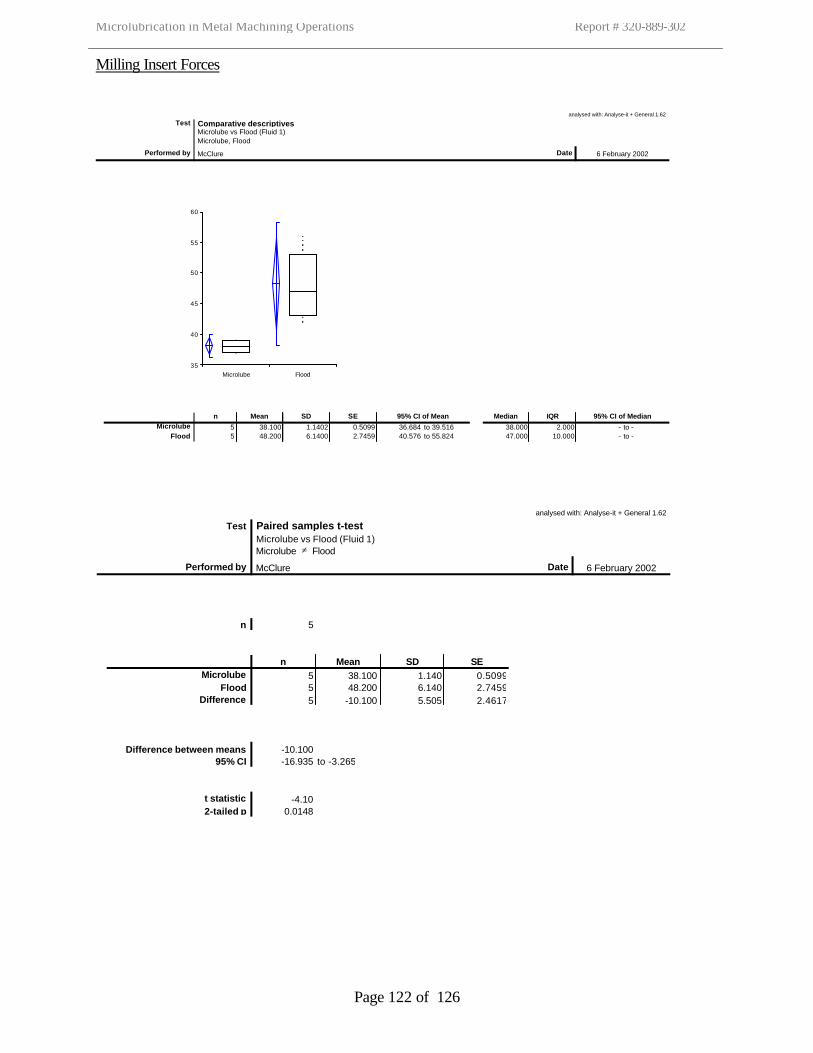
Microlubrication in Metal Machining Operations Report # 320-889-302
Page 122 of 126
Milling Insert Forces
analysed with: Analyse-it + General 1.62
Test Comparative descriptives Microlube vs Flood (Fluid 1) Microlube, Flood
Performed by McClure Date 6 February 2002
n Mean SD SE 95% CI of Mean Median IQR 95% CI of MedianMicrolube 5 38.100 1.1402 0.5099 36.684 to 39.516 38.000 2.000 - to -
Flood 5 48.200 6.1400 2.7459 40.576 to 55.824 47.000 10.000 - to -
35
40
45
50
55
60
Microlube Flood
analysed with: Analyse-it + General 1.62
Test Paired samples t-test Microlube vs Flood (Fluid 1) Microlube ≠ Flood
Performed by McClure Date 6 February 2002
n 5
n Mean SD SEMicrolube 5 38.100 1.140 0.5099
Flood 5 48.200 6.140 2.7459Difference 5 -10.100 5.505 2.4617
Difference between means -10.10095% CI -16.935 to -3.265
t statistic -4.102-tailed p 0.0148
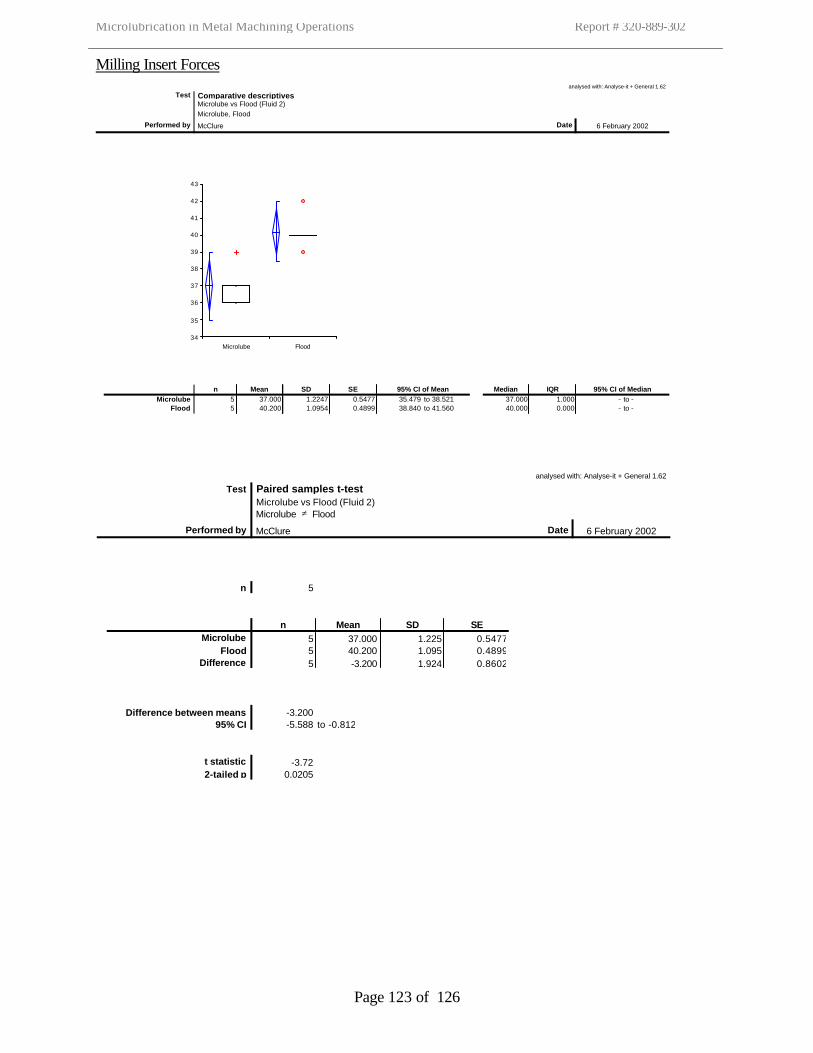
Microlubrication in Metal Machining Operations Report # 320-889-302
Page 123 of 126
Milling Insert Forces
analysed with: Analyse-it + General 1.62
Test Comparative descriptives Microlube vs Flood (Fluid 2) Microlube, Flood
Performed by McClure Date 6 February 2002
n Mean SD SE 95% CI of Mean Median IQR 95% CI of MedianMicrolube 5 37.000 1.2247 0.5477 35.479 to 38.521 37.000 1.000 - to -
Flood 5 40.200 1.0954 0.4899 38.840 to 41.560 40.000 0.000 - to -
34
35
36
37
38
39
40
41
42
43
Microlube Flood
analysed with: Analyse-it + General 1.62
Test Paired samples t-test Microlube vs Flood (Fluid 2) Microlube ≠ Flood
Performed by McClure Date 6 February 2002
n 5
n Mean SD SEMicrolube 5 37.000 1.225 0.5477
Flood 5 40.200 1.095 0.4899Difference 5 -3.200 1.924 0.8602
Difference between means -3.20095% CI -5.588 to -0.812
t statistic -3.722-tailed p 0.0205
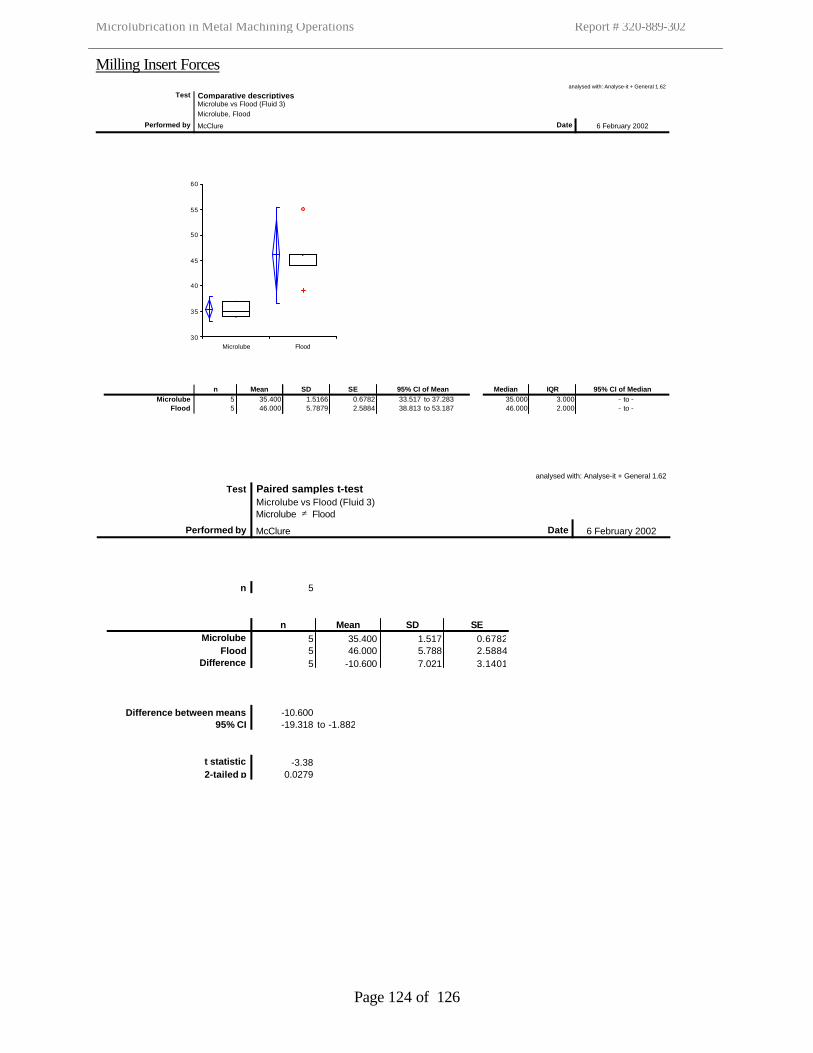
Microlubrication in Metal Machining Operations Report # 320-889-302
Page 124 of 126
Milling Insert Forces
analysed with: Analyse-it + General 1.62
Test Comparative descriptives Microlube vs Flood (Fluid 3) Microlube, Flood
Performed by McClure Date 6 February 2002
n Mean SD SE 95% CI of Mean Median IQR 95% CI of MedianMicrolube 5 35.400 1.5166 0.6782 33.517 to 37.283 35.000 3.000 - to -
Flood 5 46.000 5.7879 2.5884 38.813 to 53.187 46.000 2.000 - to -
30
35
40
45
50
55
60
Microlube Flood
analysed with: Analyse-it + General 1.62
Test Paired samples t-test Microlube vs Flood (Fluid 3) Microlube ≠ Flood
Performed by McClure Date 6 February 2002
n 5
n Mean SD SEMicrolube 5 35.400 1.517 0.6782
Flood 5 46.000 5.788 2.5884Difference 5 -10.600 7.021 3.1401
Difference between means -10.60095% CI -19.318 to -1.882
t statistic -3.382-tailed p 0.0279
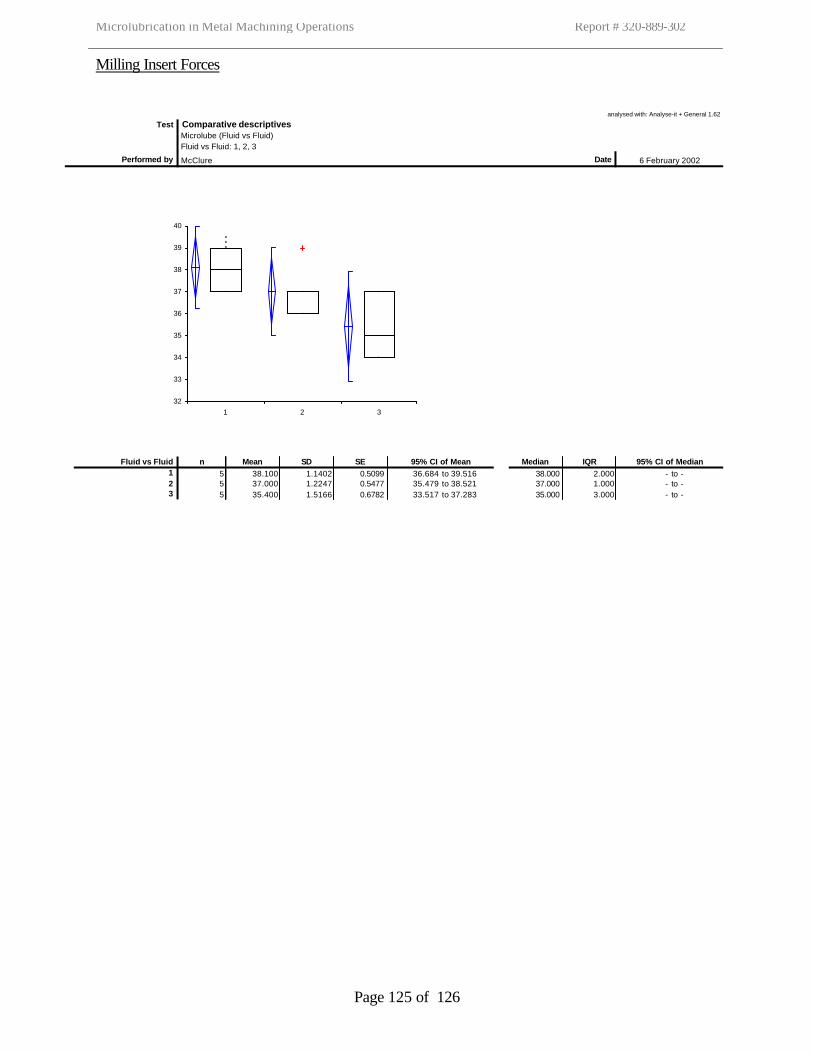
Microlubrication in Metal Machining Operations Report # 320-889-302
Page 125 of 126
Milling Insert Forces
analysed with: Analyse-it + General 1.62
Test Comparative descriptives Microlube (Fluid vs Fluid) Fluid vs Fluid: 1, 2, 3
Performed by McClure Date 6 February 2002
Fluid vs Fluid n Mean SD SE 95% CI of Mean Median IQR 95% CI of Median1 5 38.100 1.1402 0.5099 36.684 to 39.516 38.000 2.000 - to -2 5 37.000 1.2247 0.5477 35.479 to 38.521 37.000 1.000 - to -3 5 35.400 1.5166 0.6782 33.517 to 37.283 35.000 3.000 - to -
32
33
34
35
36
37
38
39
40
1 2 3
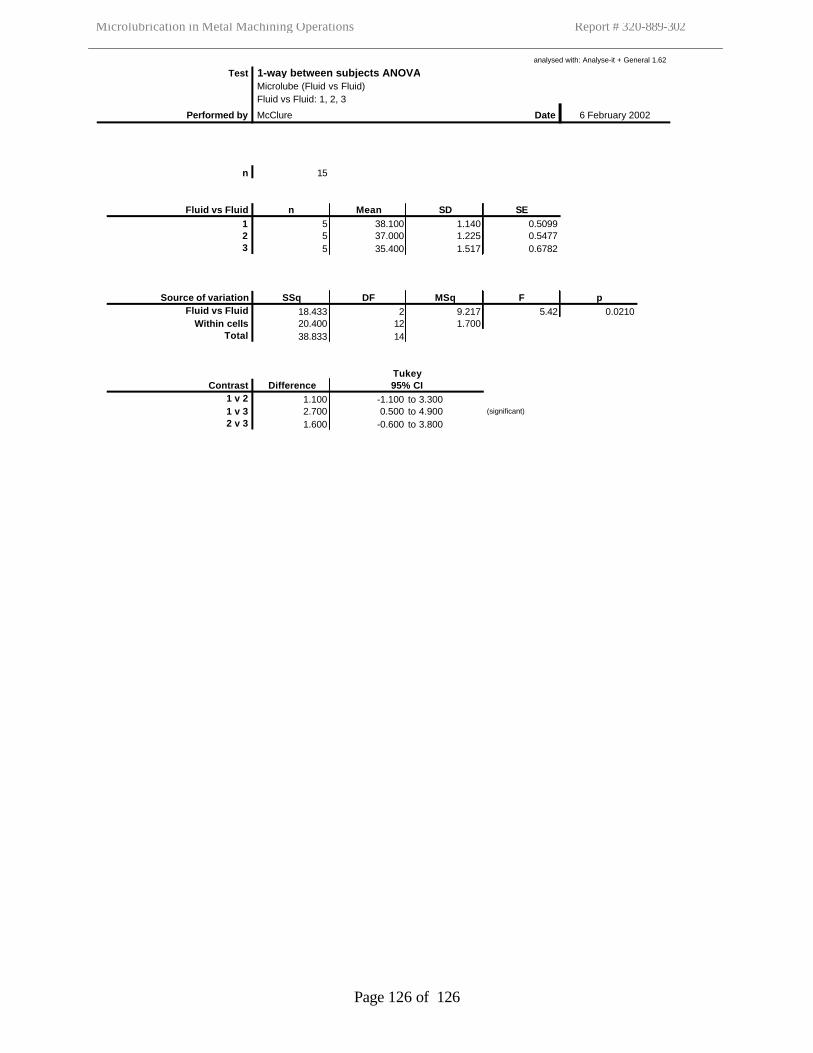
Microlubrication in Metal Machining Operations Report # 320-889-302
Page 126 of 126
analysed with: Analyse-it + General 1.62
Test 1-way between subjects ANOVA Microlube (Fluid vs Fluid) Fluid vs Fluid: 1, 2, 3
Performed by McClure Date 6 February 2002
n 15
Fluid vs Fluid n Mean SD SE1 5 38.100 1.140 0.50992 5 37.000 1.225 0.54773 5 35.400 1.517 0.6782
Source of variation SSq DF MSq F pFluid vs Fluid 18.433 2 9.217 5.42 0.0210
Within cells 20.400 12 1.700Total 38.833 14
TukeyContrast Difference 95% CI
1 v 2 1.100 -1.100 to 3.300
1 v 3 2.700 0.500 to 4.900 (significant)
2 v 3 1.600 -0.600 to 3.800
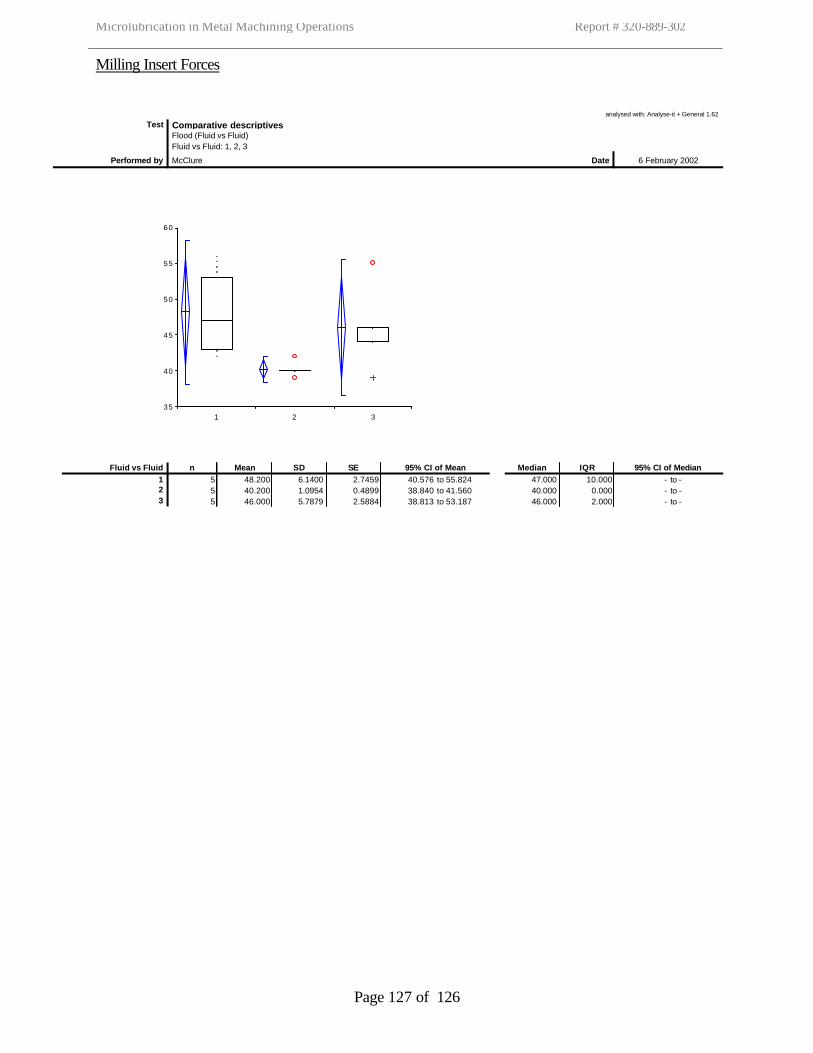
Microlubrication in Metal Machining Operations Report # 320-889-302
Page 127 of 126
Milling Insert Forces
analysed with: Analyse-it + General 1.62
Test Comparative descriptives Flood (Fluid vs Fluid) Fluid vs Fluid: 1, 2, 3
Performed by McClure Date 6 February 2002
Fluid vs Fluid n Mean SD SE 95% CI of Mean Median IQR 95% CI of Median1 5 48.200 6.1400 2.7459 40.576 to 55.824 47.000 10.000 - to -2 5 40.200 1.0954 0.4899 38.840 to 41.560 40.000 0.000 - to -3 5 46.000 5.7879 2.5884 38.813 to 53.187 46.000 2.000 - to -
35
40
45
50
55
60
1 2 3
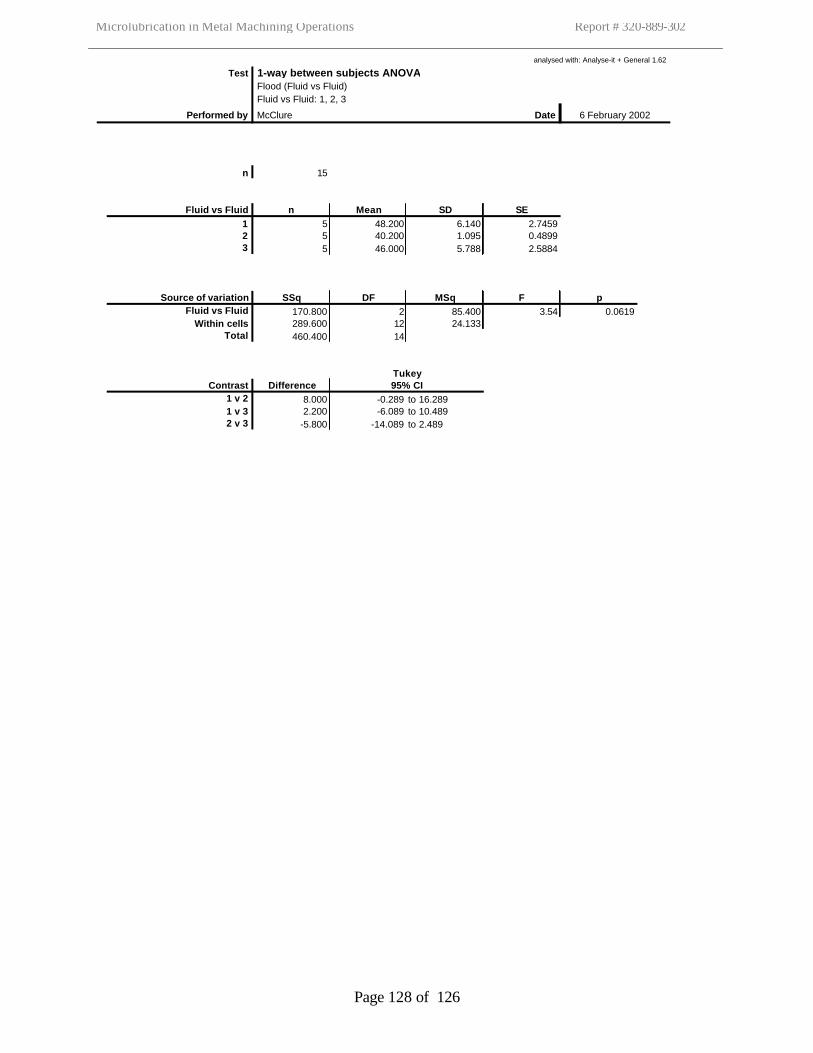
Microlubrication in Metal Machining Operations Report # 320-889-302
Page 128 of 126
analysed with: Analyse-it + General 1.62
Test 1-way between subjects ANOVA Flood (Fluid vs Fluid) Fluid vs Fluid: 1, 2, 3
Performed by McClure Date 6 February 2002
n 15
Fluid vs Fluid n Mean SD SE1 5 48.200 6.140 2.74592 5 40.200 1.095 0.48993 5 46.000 5.788 2.5884
Source of variation SSq DF MSq F pFluid vs Fluid 170.800 2 85.400 3.54 0.0619
Within cells 289.600 12 24.133Total 460.400 14
TukeyContrast Difference 95% CI
1 v 2 8.000 -0.289 to 16.289
1 v 3 2.200 -6.089 to 10.489
2 v 3 -5.800 -14.089 to 2.489