Embed Size (px)
Citation preview
1/29/2019
1
WASTE CHARACTERISATION,
WASTE QUALITY AND
WASTE PARAMETERS
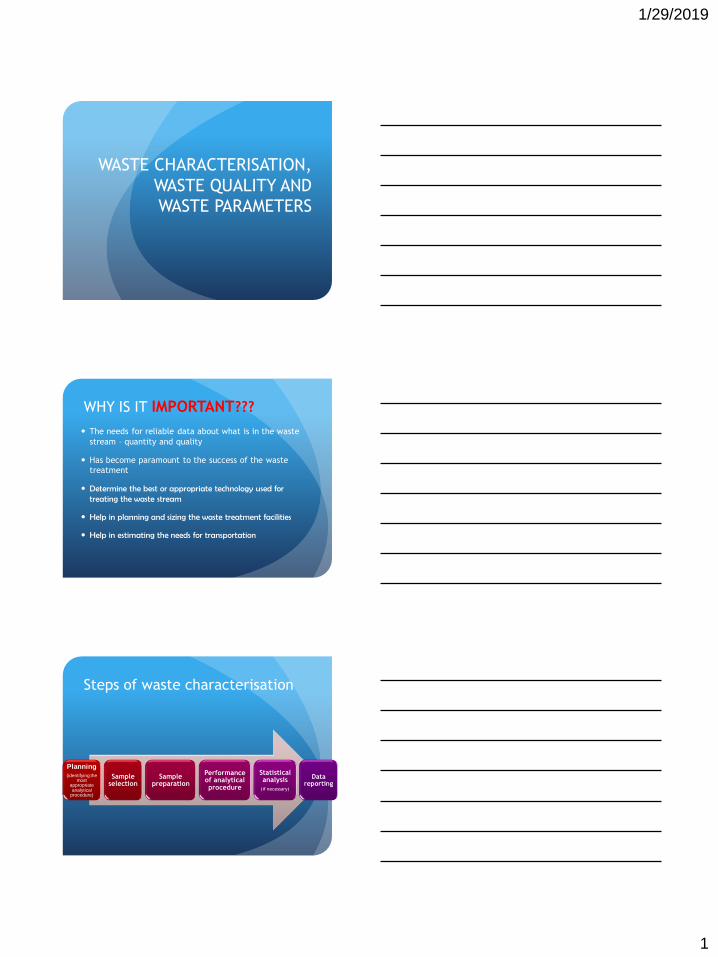
The needs for reliable data about what is in the waste
stream – quantity and quality
Has become paramount to the success of the waste
treatment
Determine the best or appropriate technology used for treating the waste stream
Help in planning and sizing the waste treatment facilities
Help in estimating the needs for transportation
WHY IS IT IMPORTANT???
Steps of waste characterisation
Planning
(identifying the most
appropriate analytical
procedure)
Sample selection
Sample preparation
Performance of analytical procedure
Statistical analysis
(if necessary)
Data reporting

1/29/2019
2
Level sophistication of analytical procedures
Manual handling or extraction
(oven drying, furnace burning, centrifuge, grinding, etc)
Manual extraction and semi-sophisticated equipment
(UV spectrophotometer, automatic titration, etc.)
Simple, easy and fast test–kit
(Hach reagent)
Sophisticated equipment (FTIR, Raman, NMR, etc.)
WASTEWATER CHARACTERISATION
Approaches in wastewater
characterisation
Traditional Modern Focus on point sources Classification of receiving water based on
use:• A - drinking, environmentally sensitive• B - bathing, fish-life• C - irrigation, fish-life, agricultural use
Mainly concerned with local effect Definition of stream quality standards for specific use
Definition of maximum limits (BOD, SS, T, pH, nutrients etc.)
Usually concentration limits and total flow rate limit
1/29/2019
3
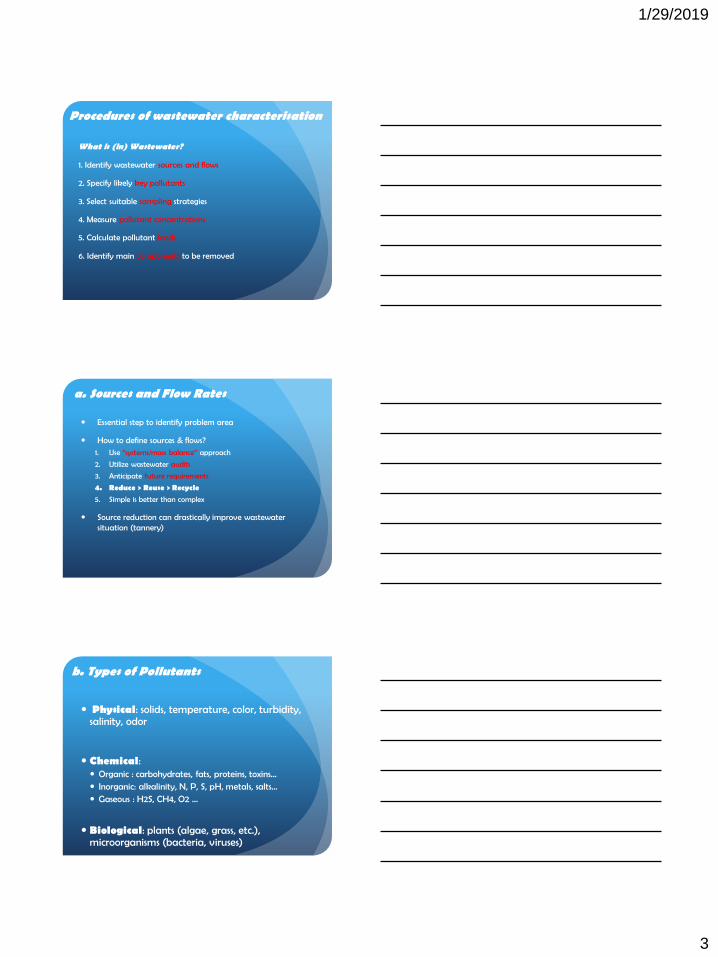
Procedures of wastewater characterisation
What is (in) Wastewater?
1. Identify wastewater sources and flows
2. Specify likely key pollutants
3. Select suitable sampling strategies
4. Measure pollutant concentrations
5. Calculate pollutant loads
6. Identify main components to be removed
a. Sources and Flow Rates
Essential step to identify problem area
How to define sources & flows?
1. Use “systems/mass balance” approach
2. Utilize wastewater audits
3. Anticipate future requirements
4. Reduce > Reuse > Recycle5. Simple is better than complex
Source reduction can drastically improve wastewater situation (tannery)
b. Types of Pollutants
Physical: solids, temperature, color, turbidity, salinity, odor
Chemical: Organic : carbohydrates, fats, proteins, toxins… Inorganic: alkalinity, N, P, S, pH, metals, salts… Gaseous : H2S, CH4, O2 …
Biological: plants (algae, grass, etc.), microorganisms (bacteria, viruses)
1/29/2019
4
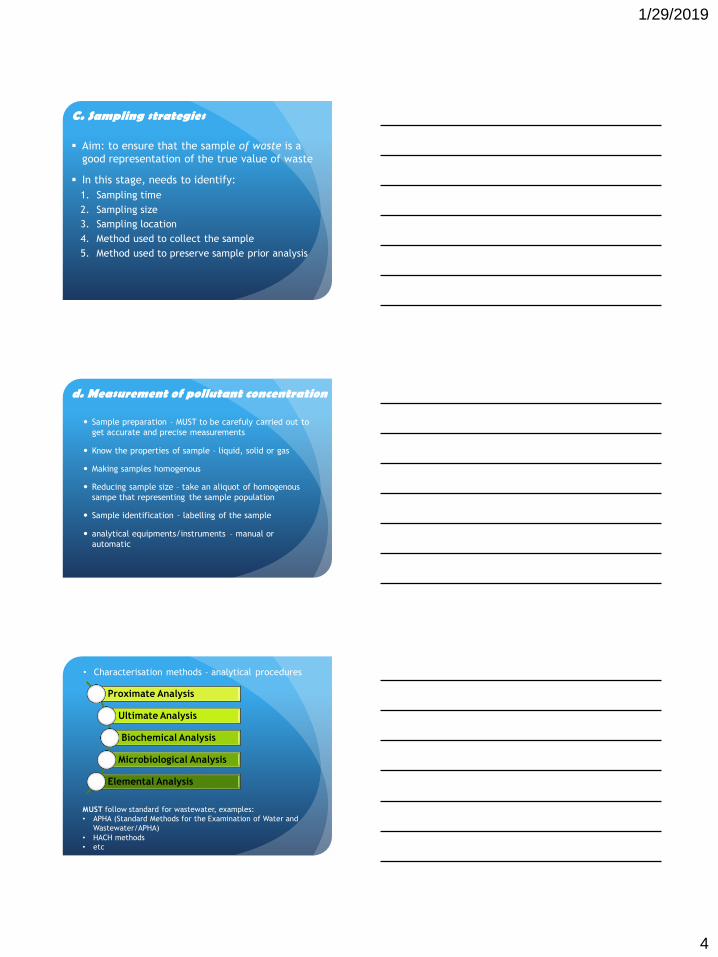
C. Sampling strategies
Aim: to ensure that the sample of waste is a
good representation of the true value of waste
In this stage, needs to identify:
1. Sampling time
2. Sampling size
3. Sampling location
4. Method used to collect the sample
5. Method used to preserve sample prior analysis
d. Measurement of pollutant concentration
Sample preparation – MUST to be carefuly carried out to
get accurate and precise measurements
Know the properties of sample – liquid, solid or gas
Making samples homogenous
Reducing sample size – take an aliquot of homogenous
sampe that representing the sample population
Sample identification – labelling of the sample
analytical equipments/instruments – manual or
automatic
Proximate Analysis
Ultimate Analysis
Biochemical Analysis
Microbiological Analysis
Elemental Analysis
• Characterisation methods – analytical procedures
MUST follow standard for wastewater, examples:
• APHA (Standard Methods for the Examination of Water and
Wastewater/APHA)
• HACH methods
• etc

1/29/2019
5
e. Calculate pollutant loads
depending on the analytical methods chosen
Used the formula in the standard method selected
Main wastewater parameters measured, include:
Total Suspended Solids
Suspended Solids
Volatile Suspended Solids
Temperature
pH
Salinity
Colour and Turbidity
BOD
COD
f. Identification of pollutant to be removed
Based on the highest concentration of pollutants
present in wastewater
This will influence the selection of technology to be
used in treating wastewater – physical, chemical,
biological, enzyme, thermal, or combined treatment
technology
SOLID WASTECHARACTERISATION
1/29/2019
6
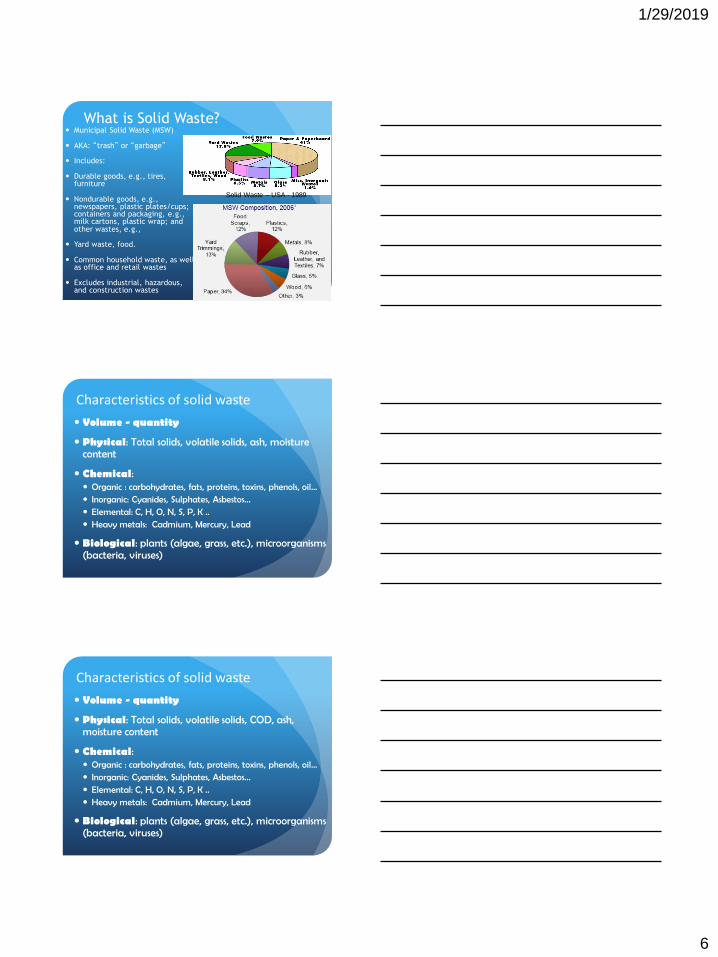
What is Solid Waste? Municipal Solid Waste (MSW)
AKA: “trash” or “garbage”
Includes:
Durable goods, e.g., tires, furniture
Nondurable goods, e.g., newspapers, plastic plates/cups; containers and packaging, e.g., milk cartons, plastic wrap; and other wastes, e.g.,
Yard waste, food.
Common household waste, as well as office and retail wastes
Excludes industrial, hazardous, and construction wastes
Solid Waste – USA - 1989
Characteristics of solid waste
Volume - quantity
Physical: Total solids, volatile solids, ash, moisture content
Chemical: Organic : carbohydrates, fats, proteins, toxins, phenols, oil… Inorganic: Cyanides, Sulphates, Asbestos... Elemental: C, H, O, N, S, P, K .. Heavy metals: Cadmium, Mercury, Lead
Biological: plants (algae, grass, etc.), microorganisms (bacteria, viruses)
Characteristics of solid waste
Volume - quantity
Physical: Total solids, volatile solids, COD, ash, moisture content
Chemical: Organic : carbohydrates, fats, proteins, toxins, phenols, oil… Inorganic: Cyanides, Sulphates, Asbestos... Elemental: C, H, O, N, S, P, K .. Heavy metals: Cadmium, Mercury, Lead
Biological: plants (algae, grass, etc.), microorganisms (bacteria, viruses)
1/29/2019
7
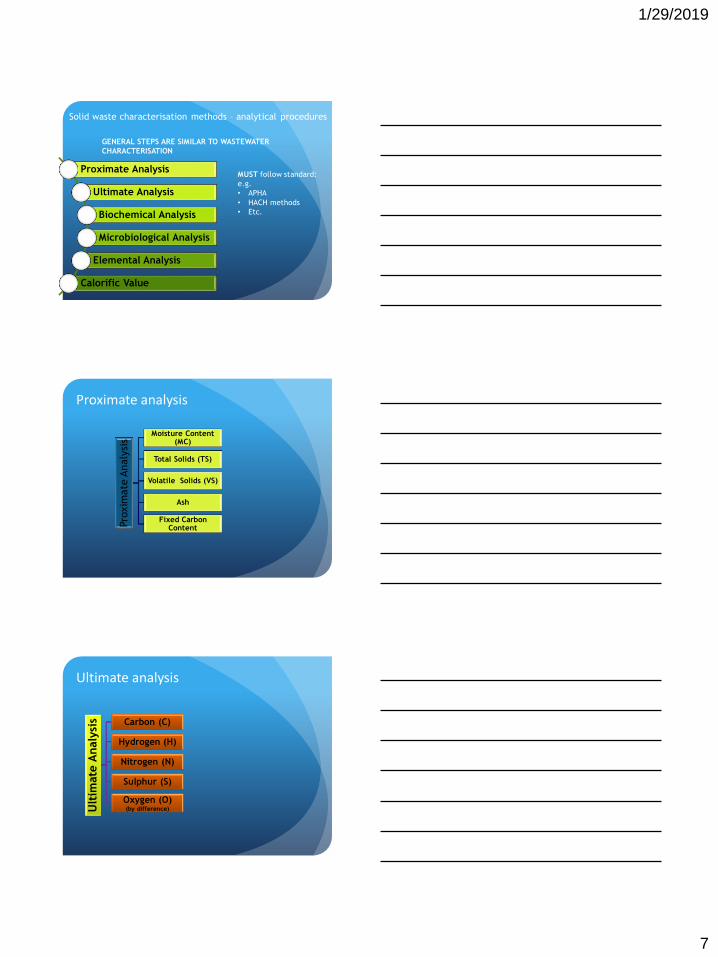
Solid waste characterisation methods – analytical procedures
MUST follow standard:
e.g.
• APHA
• HACH methods
• Etc.
GENERAL STEPS ARE SIMILAR TO WASTEWATER
CHARACTERISATION
Proximate Analysis
Ultimate Analysis
Biochemical Analysis
Microbiological Analysis
Elemental Analysis
Calorific Value
Proximate analysis
Pro
xim
ate
Analy
sis
Moisture Content (MC)
Total Solids (TS)
Volatile Solids (VS)
Ash
Fixed Carbon Content
Ultimate analysis
Ult
imate
Analy
sis Carbon (C)
Hydrogen (H)
Nitrogen (N)
Sulphur (S)
Oxygen (O)(by difference)
1/29/2019
8
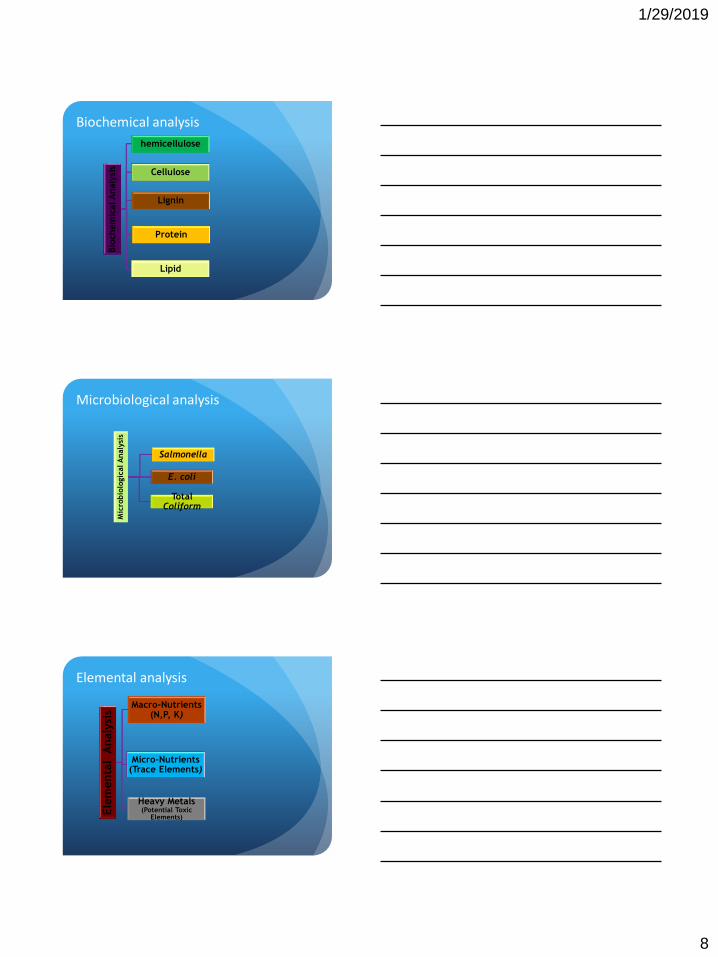
Biochemical analysisBio
chem
ical A
naly
sis
hemicellulose
Cellulose
Lignin
Protein
Lipid
Microbiological analysis
Mic
robio
logic
al A
naly
sis
Salmonella
E. coli
Total Coliform
Elemental analysis
Ele
menta
l A
naly
sis
Macro-Nutrients(N,P, K)
Micro-Nutrients (Trace Elements)
Heavy Metals (Potential Toxic
Elements)
1/29/2019
9
Calorific value of solid waste
• Use Bomb calorimeter• Is the measurement of the heat generated
on combustion
• Can be used to compare energy potential
from solid waste
•
EMISSIONS/AIR POLLUTANTSCHARACTERISATION
Typical of emissions/air pollutants
Classified into:
1. Primary pollutants
directly emmitted into the atmosphere from sources
to cause harm in high enough concentration
2. Secondary pollutants
not directly emitted from sources but instead from in the
atmoshpere from primary pollutants (known as precursors)
also to cause harm in high enough concentration
1/29/2019
10
Primary air pollutants
Carbon compounds – CO, CO2, CH4 and VOCS
Nitrogen compounds – NO, N2O and NH3
Sulfur compounds – H2S and SO2
Halogen compounds – chlorides fluorides and
bromides
Particulate matter (PM or aerosols) – either in
solid or liquid
Secondary air pollutants
NO2 and HNO3 are formed from NO
Ozone (O3) are formed from photochemical
reaction of NO2 and VOC
Sulfuric acid droplets from SO4
Nitric acid droplets formed NO2+
Sulfates and nitrates aerosols formed from
reaction of sulfuric acid droplet and nitric acid
droplet with NH3
Organic aerosolcs formed from VOS in gas to
particle reaction
Source of air pollution1. Nature – e.g. From volcanoes (ashes, dust),
land source (dust, soil particles), green plants
(vapor, pollen), forest fire, etc.
2. Manmade source – e.g. thermal power plant,
textile mills, nuclear reactions,
ttransportation, Industrial and domestic fuel
burning, Industrial processes. etc
3. Primary and secondary air pollutants
1/29/2019
11
Measurement of air pollution
General steps are similar to wastewater or
solid waste characterisation
Pollution can be measured in many ways, from simple
physical and chemical measurements, to sophisticated
electronic methods.
The three main methods are:
Passive Sampling Methods
Active Sampler Methods
Automatic Sampler Methods
Passive Sampling Methods
Diffusion Tubes:
Simple, inexpensive, simple plastic tubes or discs open at
one end to the atmosphere, with a chemical absorbent at
the other.
Give an indication of the average pollution over an area for
a period of weeks or months.
To indentify ‘hotspot’
32
Active Sampler Methods
Collect Pollutant samples, physically or chemically and
analyse in the Laboratory.
Regular measurements are easier and faster at less cost
than automatic sampling.
Provide good baseline data for comparison
33

1/29/2019
12
Automatic Methods Give hourly measurements at a particular point.
For example :
spectroscopic techniques
filtration techniques, e.g. For particulate matter
gas chromatography, e.g. for hydrocarbons.
Samples can be analysed on-line and in real-time, BUT expensive.
Provide accurate, reliable data need to ensure good maintenance
operational and quality assurance/control procedures.
34