Embed Size (px)
Citation preview
Washington StateEmployment Security Department
Karen T. Lee, Commissioner
Labor Market and Economic Analysis BranchGreg Weeks, Ph.D., Director
The Agricultural Workforce in Washington State:The Question of Shifts in the Composition of Agricultural Labor Employed in
Washington State, 2006 Through 2009a
by
Ernst W. Stromsdorfer, Ph.D., Economic AnalystJohn H. Wines, Economic Analyst
Presented at:
The 2010 Immigration, Agriculture, and Communities Conference
University of California – DavisDepartment of Agriculture and Resource Economics
University of California – D.C. CenterWashington, D.C.
May 27 and 28, 2010
aThis study is part of Chapter 4 of the 2009 Agricultural Workforce in Washington State.The 2009 report will be published online as of June 30, 2010.
It can be accessed at workforceexplorer.com.
Employment Security is an equal-opportunity employer and provider of programs and services.Auxiliary aids and services are available upon request to people with disabilities.
Cover photo courtesy of ©iStock/Angus Plummer; Mcswin; Pixartdesign; Michaels/’s Stock Photos
Acknowledgement
i
We would like to acknowledge the significant support and advice we have received in writing this report.
Toby Paterson, David Wallace, Greg Weeks, and Jeff Zahir gave clarifying guidance to many of the issues discussed in this study, both with respect to economic issues, and with respect to understanding the complexities of the data used.
Individuals at both the federal and state offices of the United States Department of Agriculture (USDA) National Agricultural Statistics Service (NASS) and the Economic Research Service (ERS) provided data sources and guidance on interpreting data. Roger Strickland, of the Economic Research Service, USDA, and Daniel Carroll, U.S. Department of Labor, were particularly helpful.
Sandra Jones artistically designed the printed version of the report. Bonnie Dalebout and Sandra Jones provided critical reading and editing of the report.
Our thanks to all.
Finally, we wish to accept responsibility for any remaining errors of fact or interpretation.
This study does not reflect the official policy of the Washington State Employment Security Department in any way.
Ernst W. Stromsdorfer, Ph.D., Economic Analyst
John H. Wines, Economic Analyst

Contents
Introduction............................................................................................................................ . 1
DesignoftheStudy....................................................................................................... 2
The.Number.of.Agricultural.Firms.and.Their.Employment........................................ . 2
SelectedSectorsinCropProduction............................................................................... 3
SelectedSubsectorsinSupportActivitiesforAgriculture................................................... 3
Summary..................................................................................................................... 3
Statistical.Tests:.Average.Hours.Worked.and.Average.Hourly.Earnings,2009.Compared.to.2006,.2007.and.2008............................................................ . 4
Average.Hours.Worked.per.Worker,.Selected.NAICS.Subsectors........................ . 4
StatisticalSignificance................................................................................................... 5
AverageHourlyEarnings,CurrentDollars...................................................................... 6
StatisticalSignificance................................................................................................... 7
DetailonCropProduction............................................................................................. 7
DetailonSupportActivitiesinAgriculture....................................................................... 8
AverageHourlyEarnings,ConstantDollars..................................................................... 8
DetailonCropProduction............................................................................................. 9
DetailonSupportActivitiesinAgriculture....................................................................... 9
Summary..................................................................................................................... 9
Summary.and.Conclusions................................................................................... . 10Endnotes............................................................................................................... . 10
ii
Preface
iii
The Employment Security Department (ESD) collects data on agricultural employment, unemployment, wage rates, and earnings to assist the Washington agricultural industry in the recruitment of farmworkers and in industry management. Over the seasons, it is important to estimate the number of workers needed across the agricultural regions of the state and the available labor supply to meet those needs. Reliable estimates of the wage rates paid to these workers for different jobs are crucial. Also, it is important to understand how the industry evolves and responds to economic and weather challenges yearly and over time.
A major source of agricultural farm labor data is the Employment Security Department’s Unemployment Insurance (UI) tax records on which the present study is based. Since 1990, the data compiled from the UI tax records include virtually all hired agricultural employment and wages paid. These highly reliable data are essential to measure the impact of agriculture on the state and local agricultural regions. Complementing this data source is the Quarterly Census of Employment and Wages (QCEW).
However, the UI tax records and the QCEW do not include information on employment in specific activities such as apple tree pruning as well as the corresponding wage rates for these activities. To obtain these data, the ESD conducts a monthly scientific survey – the Agricultural Labor Employment and Wage Trends Survey – in which approximately 1,800 agricultural producers participate. This survey estimates the number of seasonal employees working in specific jobs each month, such as cherry pruning in southeastern Washington, as well as their corresponding wage rates.
The next primary source for the data contained in this report is the yearly Washington Annual Agriculture Bulletin and supporting data from the national website of the United States Department of Agriculture (USDA) National Agricultural Statistics Service (NASS) – a very comprehensive information source.
The final primary source of data is from the various growers’ associations, such as the Northwest Cherry Growers and the U.S. Apple Association.
It is important to note that final, official, or even preliminary data are not always available for the relevant calendar or fiscal year. In such a case, typically the latest data available are used. This is the case in particular for the Washington Annual Agriculture Bulletin, compiled and published by the Washington Field Office of the USDA National Agricultural Statistics Service. Production data for 2009 will not be available until August 2010.
Taken as a whole, these data can assist agricultural employers in assessing their labor requirements. These data can also assist economists and policymakers in estimating the impact of seasonal farm work and agricultural labor in general, on Washington’s economy. Finally, for state and local officials and social service agencies, these data can provide a basis for estimating the impact of the farmworker population on their existing and proposed programs and facilities.
The Agricultural Workforce in Washington State
1
The Question of Shifts in the Composition of Agricultural Labor Employed in Washington State, 2006 through 2009
Introduction
The agricultural labor market in the United States and in Washington state has been in a condition of political and economic uncertainty with respect to whether the supply of labor, those individuals authorized to work in the United States and those who are not authorized, will be sufficient on a year-by-year basis to produce America’s agricultural output, whether it be apples in Washington or milk in Upstate New York.
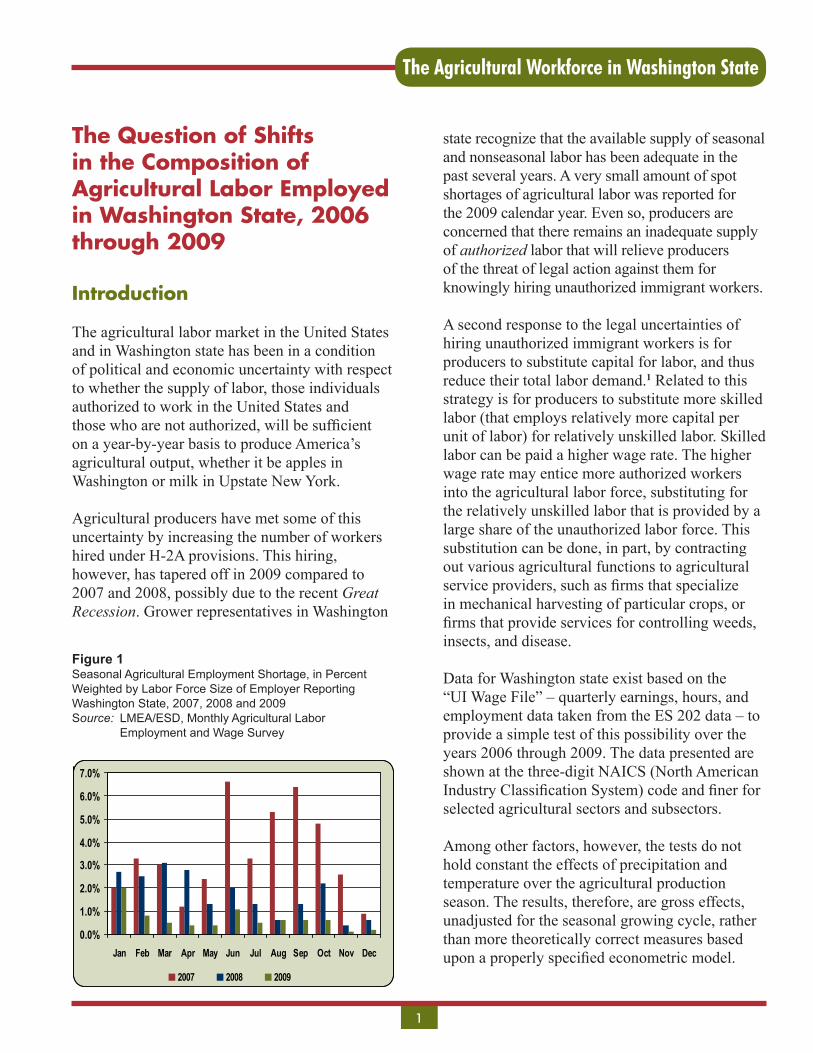
Agricultural producers have met some of this uncertainty by increasing the number of workers hired under H-2A provisions. This hiring, however, has tapered off in 2009 compared to 2007 and 2008, possibly due to the recent Great Recession. Grower representatives in Washington
state recognize that the available supply of seasonal and nonseasonal labor has been adequate in the past several years. A very small amount of spot shortages of agricultural labor was reported for the 2009 calendar year. Even so, producers are concerned that there remains an inadequate supply of authorized labor that will relieve producers of the threat of legal action against them for knowingly hiring unauthorized immigrant workers.
A second response to the legal uncertainties of hiring unauthorized immigrant workers is for producers to substitute capital for labor, and thus reduce their total labor demand.1 Related to this strategy is for producers to substitute more skilled labor (that employs relatively more capital per unit of labor) for relatively unskilled labor. Skilled labor can be paid a higher wage rate. The higher wage rate may entice more authorized workers into the agricultural labor force, substituting for the relatively unskilled labor that is provided by a large share of the unauthorized labor force. This substitution can be done, in part, by contracting out various agricultural functions to agricultural service providers, such as firms that specialize in mechanical harvesting of particular crops, or firms that provide services for controlling weeds, insects, and disease.
Data for Washington state exist based on the “UI Wage File” – quarterly earnings, hours, and employment data taken from the ES 202 data – to provide a simple test of this possibility over the years 2006 through 2009. The data presented are shown at the three-digit NAICS (North American Industry Classification System) code and finer for selected agricultural sectors and subsectors.
Among other factors, however, the tests do not hold constant the effects of precipitation and temperature over the agricultural production season. The results, therefore, are gross effects, unadjusted for the seasonal growing cycle, rather than more theoretically correct measures based upon a properly specified econometric model.
0.0%
1.0%
2.0%
3.0%
4.0%
5.0%
6.0%
7.0%
Jan Feb Mar Apr May Jun Jul Aug Sep Oct Nov Dec
2007 2008 2009
Figure 1 Seasonal Agricultural Employment Shortage, in Percent Weighted by Labor Force Size of Employer ReportingWashington State, 2007, 2008 and 2009 Source: LMEA/ESD, Monthly Agricultural Labor Employment and Wage Survey

The Agricultural Workforce in Washington State
2
Design of the Study
We proceed first with a discussion of the changing composition of agricultural firms and their employment over time. We then proceed to a discussion of average hours worked per worker per firm. Next we discuss the structure of current and constant dollar before-tax average hourly earnings. A conclusion follows.
The Number of Agricultural Firms and Their Employment Figure 2 reports the number of agricultural firms by selected NAICS subsectors and their total annualized employment for the 2006 through 2009 calendar years. Figure 3 reports total annual hours worked for the same calendar years. These data are based on the UI Wage File. Thus, they are highly accurate population counts of covered industry data. Almost all agricultural employment in Washington state is covered by the Unemployment Insurance program.
At the three-digit NAICS level, crop production, NAICS 111, dominates the total number of firms in the industry, with 5,110 firms in calendar year 2006 – 79.0 percent of the total industry, employing 55,218 non-duplicated employees that year – 71.6 percent of total industry employment.2 The number of firms in crop production drops steadily to 4,715 by 2009 – a drop over the four years of 4.1 percent. These 4,715 firms, employ a total of 61,614 workers in that year – an increase over 2006 employment of 11.6 percent. NAICS 112 – animal production, shows a similar pattern. The total number of firms drops from 886 in 2006 to 798 in 2009. Total employment rises from 6,014 in 2006 to 6,572 in 2009. In contrast, for NAICS 115 – support activities for agriculture – the number of firms rises from 471 in 2006 to 587 in 2009 – an increase of 24.6 percent in the number of firms in that sector. Total annual employment in that sector increases from 15,896 to 17,298 over the four-year period – an increase in employment of 8.8 percent. Based on these simple statistics, it thus appears that the sector of support activities for agriculture has been a growth sector over this four-year period. The increase of 1,402 workers is similar to the levels of H-2A workers hired in the state over the past several years.3
Figure 2 Number of Agricultural Firms and Employment, Selected NAICS SubsectorsWashington State, 2006 to 2009Source: Labor Market and Economic Analysis, Employment Security Department, UI Wage File
2006 2007 2008 2009
NAICS SubsectorDescription Firms Employment Firms Employment Firms Employment Firms Employment
111 CropProduction 5,110 55,218 4,917 55,919 4,806 57,583 4,715 61,614112 AnimalProduction 886 6,014 878 6,064 848 6,142 798 6,572115 SupportActivitiesforAgriculture 471 15,896 470 16,398 466 16,166 587 17,298 Total 6,467 77,128 6,265 78,381 6,120 79,891 6,100 85,484 1112 VegetableandMelonFarming 342 4,178 343 4,400 332 4,101 322 4,3881113 FruitandTreeNutFarming 2,272 38,394 2,143 38,973 2,068 39,961 2,219 42,7581114 Greenhouse,Nursery,andFloricultureProduction 347 5,128 347 5,212 341 5,153 326 5,514111998 AllOtherMiscellaneousCropFarming 341 4,738 301 4,498 306 5,449 361 5,830 Total 3,302 52,438 3,134 53,083 3,047 54,664 3,228 58,490 115112 SoilPreparation,Planting,andCultivating 89 364 98 353 97 356 92 381115113 CropHarvesting,PrimarilybyMachine 36 100 38 106 31 107 33 114115114 Post-HarvestCropActivities,exceptCottonGinning 118 11,841 116 12,053 116 11,666 117 12,483 Total 243 12,305 252 12,518 244 12,129 242 12,978 115115 FarmLaborContractors/CrewLeaders 31 1,105 31 1,302 36 1,431 36 1,531115116 FarmManagementServices 17 600 16 676 14 627 14 671 Total 48 1,705 47 1,978 50 2,058 50 2,202
The Agricultural Workforce in Washington State
3
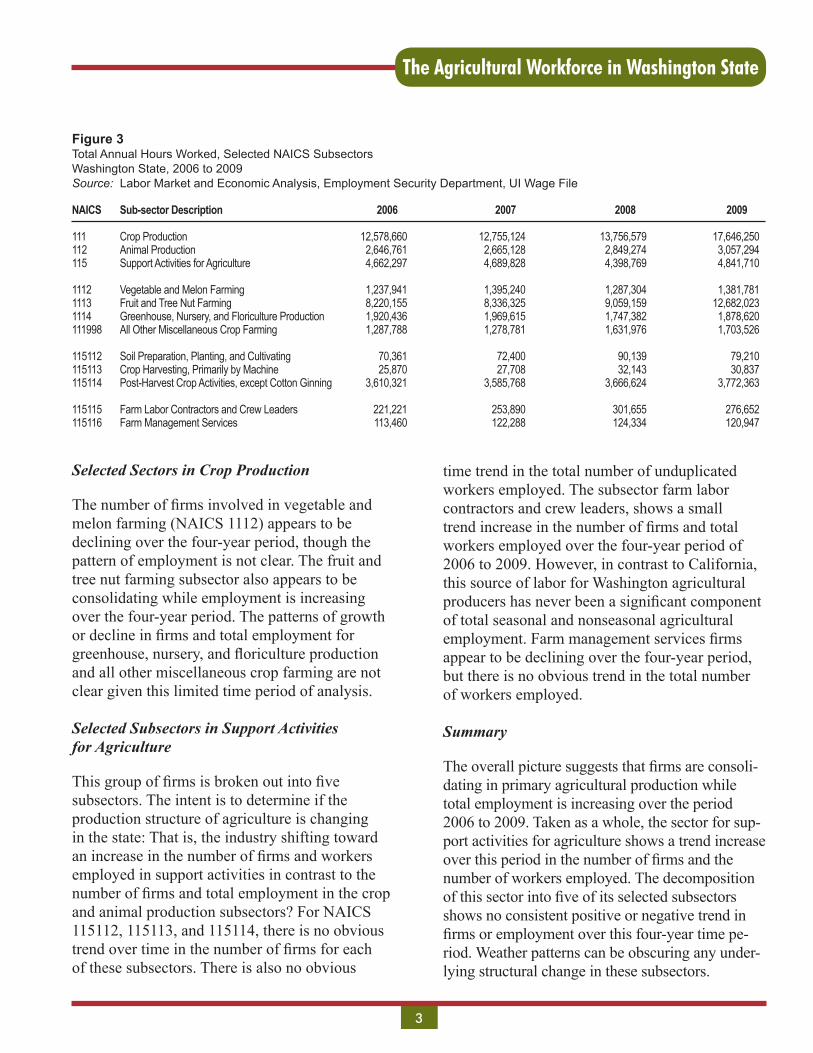
Selected Sectors in Crop Production
The number of firms involved in vegetable and melon farming (NAICS 1112) appears to be declining over the four-year period, though the pattern of employment is not clear. The fruit and tree nut farming subsector also appears to be consolidating while employment is increasing over the four-year period. The patterns of growth or decline in firms and total employment for greenhouse, nursery, and floriculture production and all other miscellaneous crop farming are not clear given this limited time period of analysis.
Selected Subsectors in Support Activities for Agriculture
This group of firms is broken out into five subsectors. The intent is to determine if the production structure of agriculture is changing in the state: That is, the industry shifting toward an increase in the number of firms and workers employed in support activities in contrast to the number of firms and total employment in the crop and animal production subsectors? For NAICS 115112, 115113, and 115114, there is no obvious trend over time in the number of firms for each of these subsectors. There is also no obvious
time trend in the total number of unduplicated workers employed. The subsector farm labor contractors and crew leaders, shows a small trend increase in the number of firms and total workers employed over the four-year period of 2006 to 2009. However, in contrast to California, this source of labor for Washington agricultural producers has never been a significant component of total seasonal and nonseasonal agricultural employment. Farm management services firms appear to be declining over the four-year period, but there is no obvious trend in the total number of workers employed.
Summary
The overall picture suggests that firms are consoli-dating in primary agricultural production while total employment is increasing over the period 2006 to 2009. Taken as a whole, the sector for sup-port activities for agriculture shows a trend increase over this period in the number of firms and the number of workers employed. The decomposition of this sector into five of its selected subsectors shows no consistent positive or negative trend in firms or employment over this four-year time pe-riod. Weather patterns can be obscuring any under-lying structural change in these subsectors.
Figure 3 Total Annual Hours Worked, Selected NAICS SubsectorsWashington State, 2006 to 2009Source: Labor Market and Economic Analysis, Employment Security Department, UI Wage File
NAICS Sub-sectorDescription 2006 2007 2008 2009
111 CropProduction 12,578,660 12,755,124 13,756,579 17,646,250112 AnimalProduction 2,646,761 2,665,128 2,849,274 3,057,294115 SupportActivitiesforAgriculture 4,662,297 4,689,828 4,398,769 4,841,710 1112 VegetableandMelonFarming 1,237,941 1,395,240 1,287,304 1,381,7811113 FruitandTreeNutFarming 8,220,155 8,336,325 9,059,159 12,682,0231114 Greenhouse,Nursery,andFloricultureProduction 1,920,436 1,969,615 1,747,382 1,878,620111998 AllOtherMiscellaneousCropFarming 1,287,788 1,278,781 1,631,976 1,703,526 115112 SoilPreparation,Planting,andCultivating 70,361 72,400 90,139 79,210115113 CropHarvesting,PrimarilybyMachine 25,870 27,708 32,143 30,837115114 Post-HarvestCropActivities,exceptCottonGinning 3,610,321 3,585,768 3,666,624 3,772,363 115115 FarmLaborContractorsandCrewLeaders 221,221 253,890 301,655 276,652115116 FarmManagementServices 113,460 122,288 124,334 120,947
The Agricultural Workforce in Washington State
4
Statistical Tests: Average Hours Worked and Average Hourly Earnings, 2009 Compared to 2006, 2007, and 2008
This section presents statistical tests of average hours worked per worker and before-tax average hourly earnings for a selected set of agricultural subsectors. These sectors are separated into crop production (NAICS 111) and selected subsectors of that sector; animal production (NAICS 112); and support activities for agriculture (NAICS 115) and selected subsectors of that sector. The basic idea is to determine if there has been a structural shift in the composition of average hours worked per worker per firm in the agricultural industry, with a relative shift away from employing labor in crop production and animal production, toward employing relatively more labor in support activi-ties for agriculture.
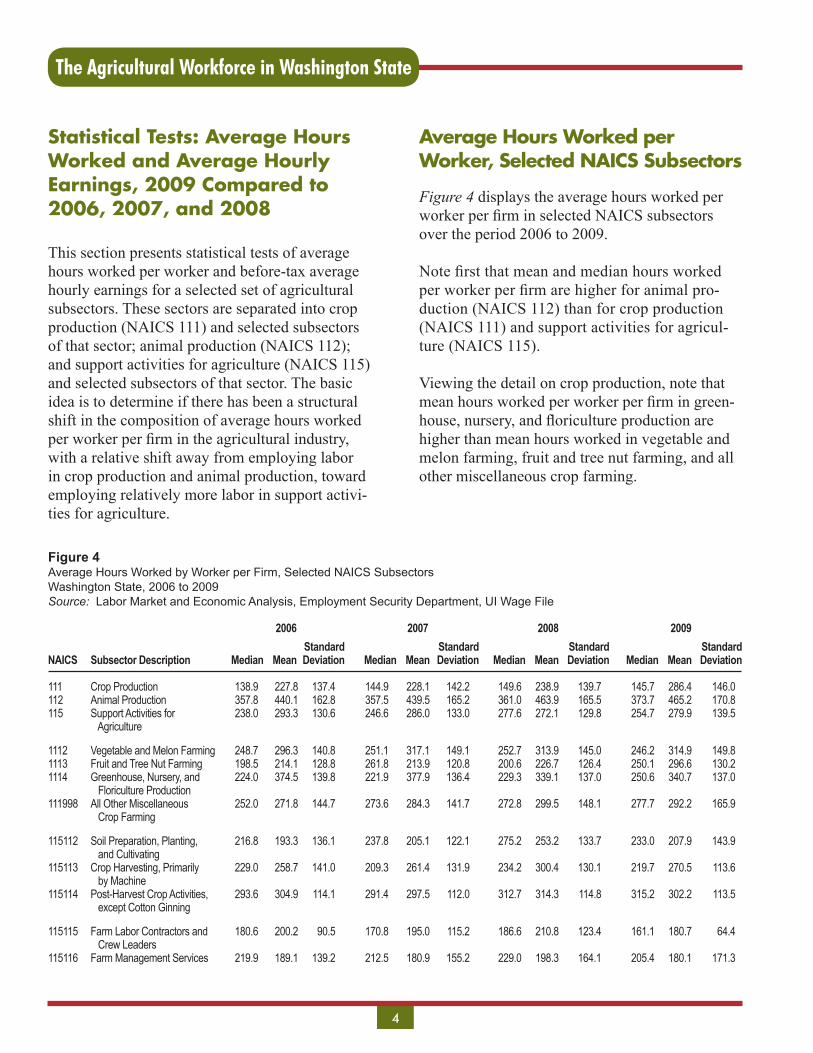
Average Hours Worked per Worker, Selected NAICS Subsectors
Figure 4 displays the average hours worked per worker per firm in selected NAICS subsectors over the period 2006 to 2009. Note first that mean and median hours worked per worker per firm are higher for animal pro-duction (NAICS 112) than for crop production (NAICS 111) and support activities for agricul-ture (NAICS 115). Viewing the detail on crop production, note that mean hours worked per worker per firm in green-house, nursery, and floriculture production are higher than mean hours worked in vegetable and melon farming, fruit and tree nut farming, and all other miscellaneous crop farming.
Figure 4 Average Hours Worked by Worker per Firm, Selected NAICS SubsectorsWashington State, 2006 to 2009Source: Labor Market and Economic Analysis, Employment Security Department, UI Wage File
2006 2007 2008 2009
Standard Standard Standard StandardNAICS SubsectorDescription Median Mean Deviation Median Mean Deviation Median Mean Deviation Median Mean Deviation
111 CropProduction 138.9 227.8 137.4 144.9 228.1 142.2 149.6 238.9 139.7 145.7 286.4 146.0112 AnimalProduction 357.8 440.1 162.8 357.5 439.5 165.2 361.0 463.9 165.5 373.7 465.2 170.8115 SupportActivitiesfor 238.0 293.3 130.6 246.6 286.0 133.0 277.6 272.1 129.8 254.7 279.9 139.5 Agriculture 1112 VegetableandMelonFarming 248.7 296.3 140.8 251.1 317.1 149.1 252.7 313.9 145.0 246.2 314.9 149.81113 FruitandTreeNutFarming 198.5 214.1 128.8 261.8 213.9 120.8 200.6 226.7 126.4 250.1 296.6 130.21114 Greenhouse,Nursery,and 224.0 374.5 139.8 221.9 377.9 136.4 229.3 339.1 137.0 250.6 340.7 137.0 FloricultureProduction111998 AllOtherMiscellaneous 252.0 271.8 144.7 273.6 284.3 141.7 272.8 299.5 148.1 277.7 292.2 165.9 CropFarming 115112 SoilPreparation,Planting, 216.8 193.3 136.1 237.8 205.1 122.1 275.2 253.2 133.7 233.0 207.9 143.9 andCultivating115113 CropHarvesting,Primarily 229.0 258.7 141.0 209.3 261.4 131.9 234.2 300.4 130.1 219.7 270.5 113.6 byMachine115114 Post-HarvestCropActivities, 293.6 304.9 114.1 291.4 297.5 112.0 312.7 314.3 114.8 315.2 302.2 113.5 exceptCottonGinning 115115 FarmLaborContractorsand 180.6 200.2 90.5 170.8 195.0 115.2 186.6 210.8 123.4 161.1 180.7 64.4 CrewLeaders115116 FarmManagementServices 219.9 189.1 139.2 212.5 180.9 155.2 229.0 198.3 164.1 205.4 180.1 171.3

The Agricultural Workforce in Washington State
5
Next, note that, in general, median hours worked per worker per firm for all the agricultural subsec-tors are lower than mean hours worked per worker per firm except for soil preparation, planting, and cultivating (NAICS 115112) and farm management services (NAICS 115116). Thus, on the whole, the distributions of average hours worked by agricultural worker per firm is skewed right – hours concentrate to the left of the median and trail off to the right.
Statistical Significance
Figure 5 tests for the pairwise statistical significance of mean hours worked per worker per firm for each of the NAICS subsectors, taken individually over time. The idea is that, if average hours worked per worker per firm increase for the workers in NAICS 115 – support activities for agriculture, then this is evidence suggesting an increase in demand for this type of agricultural labor.4 The important finding is that for most NAICS and pairwise years there is no statistically significant difference in mean annual hours worked per worker per firm. The exceptions are as follows:
u For crop production (NAICS 111), mean hours worked per worker per firm in 2006 are statisti-cally significantly different from mean hours worked per worker per firm in 2008 and 2009. For the comparison of 2006 with 2008, the odds are only 115 out of 10,000 that the actual dif-ference between the two years is zero. For the comparison 2006 with 2009, the odds are only 2 out of 10,000 that the actual difference between the two years is zero. Mean hours worked are higher in 2008 and 2009 compared to 2006.
u For support activities in agriculture (NAICS 115), mean hours worked per worker per firm in 2006 are statistically significantly different from mean hours worked in 2008 and 2009. Mean hours worked per worker per firm are higher in 2006 compared to both 2008 and 2009. Recall, however, that there are 15,896 workers in this sector in 2006 and there are 16,166 in 2008 and 17,298 in 2009. In 2006, 4,662,297 hours of labor were performed. This number fell to 4,398,769 in 2008 and rose to 4,841,710 in 2009 (Figure 3). Again, there is no adjustment for weather patterns among years.
Figure 5 Two-tailed t-Tests, Average Annual Hours Worked by Worker, by Selected NAICS Subsectors Washington State, 2006 to 2009Source: Labor Market and Economic Analysis, Employment Security Department, Figures 2 and 4 NAICS SubsectorDescription 2006vs2007 2006vs2008 2006vs2009 2007vs2008 2007vs2009 2008vs2009
111 CropProduction N.S. 0.0115 0.0002 N.S. N.S. N.S.112 AnimalProduction N.S. N.S. N.S. N.S. N.S. N.S.115 SupportActivitiesforAgriculture N.S. 0.0304 0.0372 N.S. N.S. N.S. 1112 VegetableandMelonFarming N.S. N.S. N.S. N.S. N.S. N.S.1113 FruitandTreeNutFarming 0.0482 0.0003 0.0001 N.S. N.S. N.S.1114 Greenhouse,Nursery,andFloricultureProduction N.S. N.S. N.S. N.S. N.S. N.S.111998 AllOtherMiscellaneousCropFarming N.S. N.S. N.S. N.S. N.S. N.S.
115112 SoilPreparation,Planting,andCultivating N.S. N.S. N.S. N.S. N.S. N.S.115113 CropHarvesting,PrimarilybyMachine N.S. N.S. N.S. N.S. N.S. N.S.115114 Post-HarvestCropActivities,exceptCottonGinning N.S. N.S. N.S. N.S. N.S. N.S.
115115 FarmLaborContractorsandCrewLeaders N.S. N.S. N.S. N.S. N.S. N.S.115116 FarmManagementServices N.S. N.S. N.S. N.S. N.S. N.S.
Notes: Thedatareportedinthisfigureareprobabilitiesofstatisticalsignificancebasedontwo-tailedt-Tests. N.S.=Notstatisticallysignificant.
The Agricultural Workforce in Washington State
6
u For fruit and tree nut farming, mean hours worked per worker per firm in 2006 are statis-tically significantly different from mean hours worked in 2007, 2008, and 2009. Mean hours for 2006 are a trifle higher than in 2007 and lower than in 2008 and 2009. Again, the effect of weather patterns influencing the quantity and quality of harvest cannot be discounted.
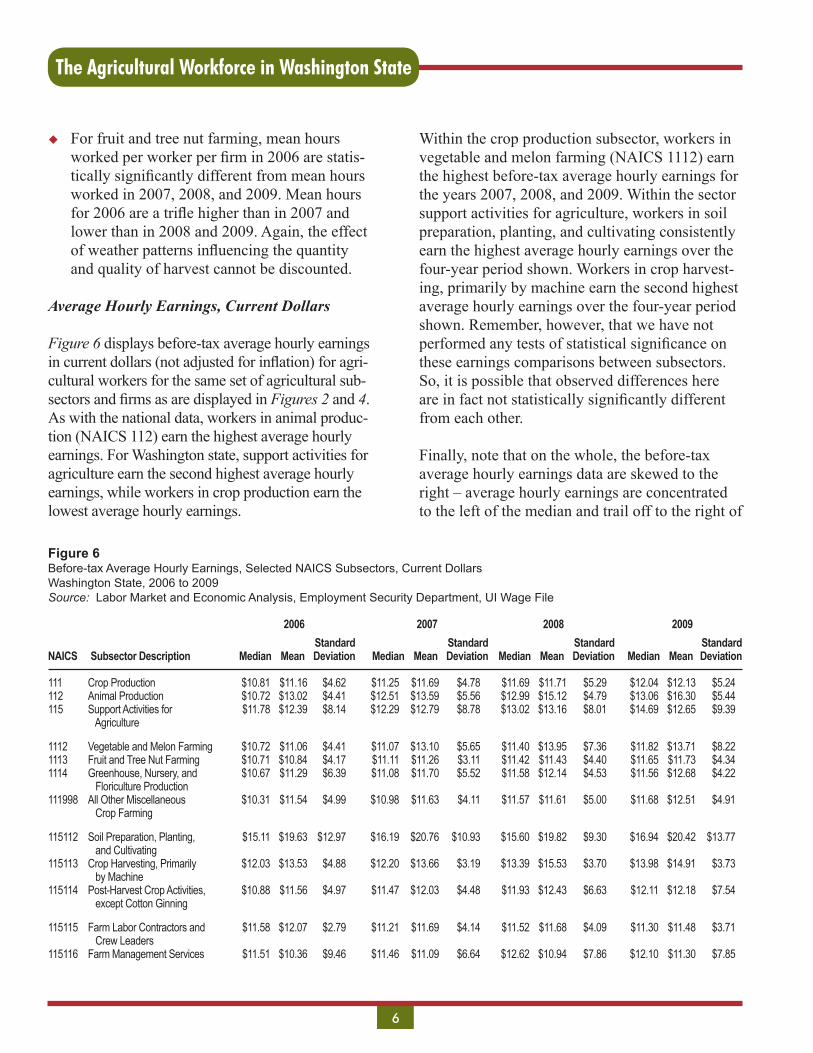
Average Hourly Earnings, Current Dollars
Figure 6 displays before-tax average hourly earnings in current dollars (not adjusted for inflation) for agri-cultural workers for the same set of agricultural sub-sectors and firms as are displayed in Figures 2 and 4. As with the national data, workers in animal produc-tion (NAICS 112) earn the highest average hourly earnings. For Washington state, support activities for agriculture earn the second highest average hourly earnings, while workers in crop production earn the lowest average hourly earnings.
Within the crop production subsector, workers in vegetable and melon farming (NAICS 1112) earn the highest before-tax average hourly earnings for the years 2007, 2008, and 2009. Within the sector support activities for agriculture, workers in soil preparation, planting, and cultivating consistently earn the highest average hourly earnings over the four-year period shown. Workers in crop harvest-ing, primarily by machine earn the second highest average hourly earnings over the four-year period shown. Remember, however, that we have not performed any tests of statistical significance on these earnings comparisons between subsectors. So, it is possible that observed differences here are in fact not statistically significantly different from each other.
Finally, note that on the whole, the before-tax average hourly earnings data are skewed to the right – average hourly earnings are concentrated to the left of the median and trail off to the right of
Figure 6 Before-tax Average Hourly Earnings, Selected NAICS Subsectors, Current DollarsWashington State, 2006 to 2009Source: Labor Market and Economic Analysis, Employment Security Department, UI Wage File
2006 2007 2008 2009
Standard Standard Standard StandardNAICS SubsectorDescription Median Mean Deviation Median Mean Deviation Median Mean Deviation Median Mean Deviation
111 CropProduction $10.81 $11.16 $4.62 $11.25 $11.69 $4.78 $11.69 $11.71 $5.29 $12.04 $12.13 $5.24112 AnimalProduction $10.72 $13.02 $4.41 $12.51 $13.59 $5.56 $12.99 $15.12 $4.79 $13.06 $16.30 $5.44115 SupportActivitiesfor $11.78 $12.39 $8.14 $12.29 $12.79 $8.78 $13.02 $13.16 $8.01 $14.69 $12.65 $9.39 Agriculture 1112 VegetableandMelonFarming $10.72 $11.06 $4.41 $11.07 $13.10 $5.65 $11.40 $13.95 $7.36 $11.82 $13.71 $8.221113 FruitandTreeNutFarming $10.71 $10.84 $4.17 $11.11 $11.26 $3.11 $11.42 $11.43 $4.40 $11.65 $11.73 $4.341114 Greenhouse,Nursery,and $10.67 $11.29 $6.39 $11.08 $11.70 $5.52 $11.58 $12.14 $4.53 $11.56 $12.68 $4.22 FloricultureProduction111998 AllOtherMiscellaneous $10.31 $11.54 $4.99 $10.98 $11.63 $4.11 $11.57 $11.61 $5.00 $11.68 $12.51 $4.91 CropFarming 115112 SoilPreparation,Planting, $15.11 $19.63 $12.97 $16.19 $20.76 $10.93 $15.60 $19.82 $9.30 $16.94 $20.42 $13.77 andCultivating115113 CropHarvesting,Primarily $12.03 $13.53 $4.88 $12.20 $13.66 $3.19 $13.39 $15.53 $3.70 $13.98 $14.91 $3.73 byMachine115114 Post-HarvestCropActivities, $10.88 $11.56 $4.97 $11.47 $12.03 $4.48 $11.93 $12.43 $6.63 $12.11 $12.18 $7.54 exceptCottonGinning 115115 FarmLaborContractorsand $11.58 $12.07 $2.79 $11.21 $11.69 $4.14 $11.52 $11.68 $4.09 $11.30 $11.48 $3.71 CrewLeaders115116 FarmManagementServices $11.51 $10.36 $9.46 $11.46 $11.09 $6.64 $12.62 $10.94 $7.86 $12.10 $11.30 $7.85
The Agricultural Workforce in Washington State
7
the median. The exception to this statement is for farm management services (NAICS 115116) for all four years and support activities for agriculture for the year 2009.
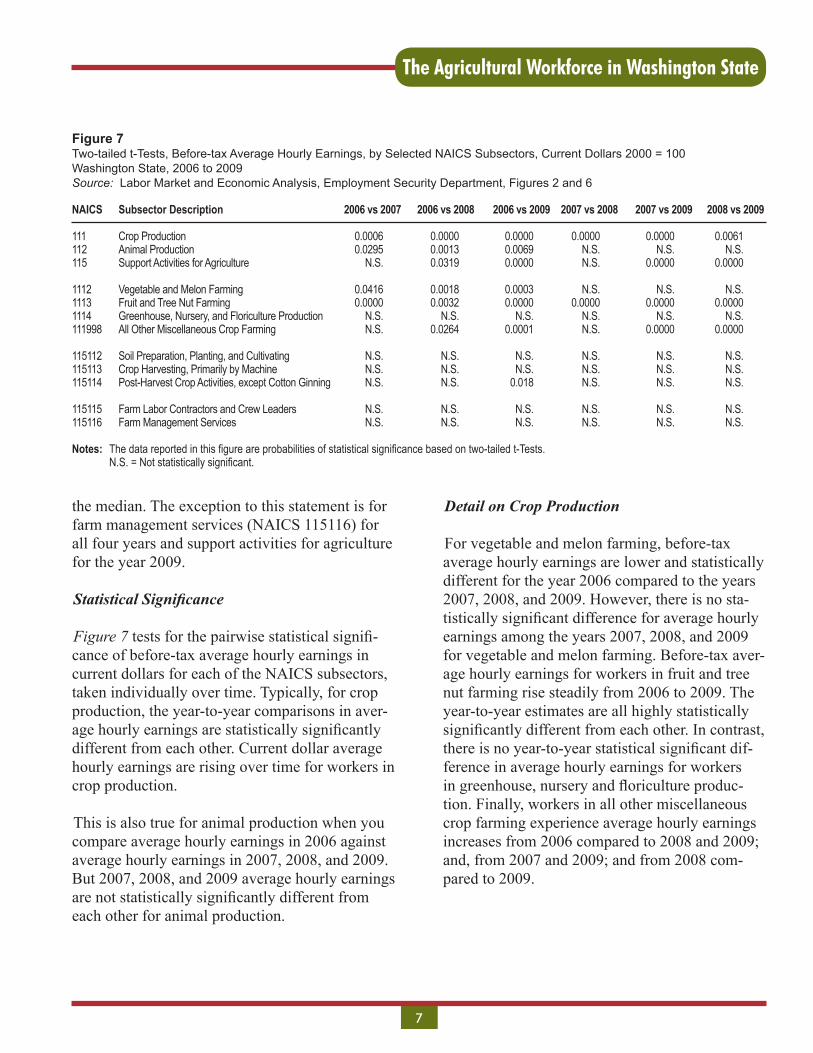
Statistical Significance
Figure 7 tests for the pairwise statistical signifi-cance of before-tax average hourly earnings in current dollars for each of the NAICS subsectors, taken individually over time. Typically, for crop production, the year-to-year comparisons in aver-age hourly earnings are statistically significantly different from each other. Current dollar average hourly earnings are rising over time for workers in crop production. This is also true for animal production when you compare average hourly earnings in 2006 against average hourly earnings in 2007, 2008, and 2009. But 2007, 2008, and 2009 average hourly earnings are not statistically significantly different from each other for animal production.
Detail on Crop Production
For vegetable and melon farming, before-tax average hourly earnings are lower and statistically different for the year 2006 compared to the years 2007, 2008, and 2009. However, there is no sta-tistically significant difference for average hourly earnings among the years 2007, 2008, and 2009 for vegetable and melon farming. Before-tax aver-age hourly earnings for workers in fruit and tree nut farming rise steadily from 2006 to 2009. The year-to-year estimates are all highly statistically significantly different from each other. In contrast, there is no year-to-year statistical significant dif-ference in average hourly earnings for workers in greenhouse, nursery and floriculture produc-tion. Finally, workers in all other miscellaneous crop farming experience average hourly earnings increases from 2006 compared to 2008 and 2009; and, from 2007 and 2009; and from 2008 com-pared to 2009.
Figure 7 Two-tailed t-Tests, Before-tax Average Hourly Earnings, by Selected NAICS Subsectors, Current Dollars 2000 = 100 Washington State, 2006 to 2009 Source: Labor Market and Economic Analysis, Employment Security Department, Figures 2 and 6 NAICS SubsectorDescription 2006vs2007 2006vs2008 2006vs2009 2007vs2008 2007vs2009 2008vs2009
111 CropProduction 0.0006 0.0000 0.0000 0.0000 0.0000 0.0061112 AnimalProduction 0.0295 0.0013 0.0069 N.S. N.S. N.S.115 SupportActivitiesforAgriculture N.S. 0.0319 0.0000 N.S. 0.0000 0.0000 1112 VegetableandMelonFarming 0.0416 0.0018 0.0003 N.S. N.S. N.S.1113 FruitandTreeNutFarming 0.0000 0.0032 0.0000 0.0000 0.0000 0.00001114 Greenhouse,Nursery,andFloricultureProduction N.S. N.S. N.S. N.S. N.S. N.S.111998 AllOtherMiscellaneousCropFarming N.S. 0.0264 0.0001 N.S. 0.0000 0.0000 115112 SoilPreparation,Planting,andCultivating N.S. N.S. N.S. N.S. N.S. N.S.115113 CropHarvesting,PrimarilybyMachine N.S. N.S. N.S. N.S. N.S. N.S.115114 Post-HarvestCropActivities,exceptCottonGinning N.S. N.S. 0.018 N.S. N.S. N.S.
115115 FarmLaborContractorsandCrewLeaders N.S. N.S. N.S. N.S. N.S. N.S.115116 FarmManagementServices N.S. N.S. N.S. N.S. N.S. N.S.
Notes: Thedatareportedinthisfigureareprobabilitiesofstatisticalsignificancebasedontwo-tailedt-Tests. N.S.=Notstatisticallysignificant.
The Agricultural Workforce in Washington State
8
Detail on Support Activities in AgricultureFinally, over time, average hourly earnings in support activities for agriculture are generally not statistically significantly different from each other. Note that average hourly earnings fall in 2009 compared to 2007 and 2008. When the sector for support activities for agriculture is decomposed, we see that none of the subsectors that comprise it shows any notable pattern of statistical signifi-cance in current dollar average hourly earnings.
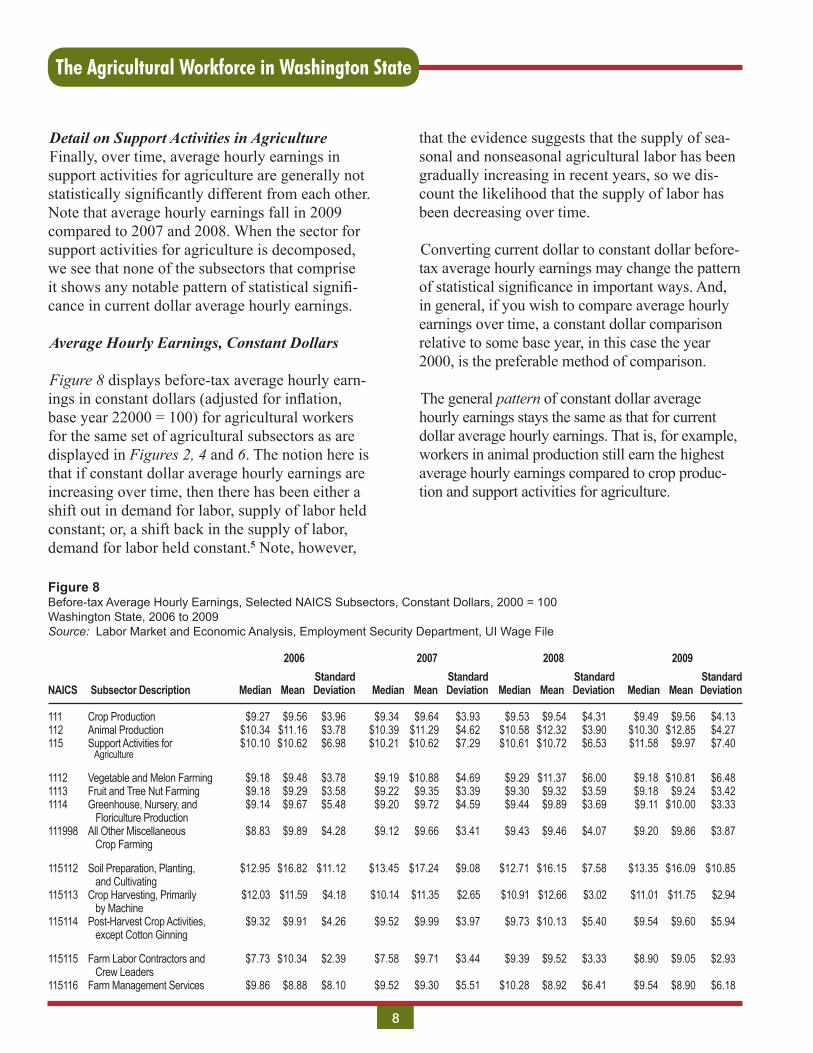
Average Hourly Earnings, Constant Dollars
Figure 8 displays before-tax average hourly earn-ings in constant dollars (adjusted for inflation, base year 22000 = 100) for agricultural workers for the same set of agricultural subsectors as are displayed in Figures 2, 4 and 6. The notion here is that if constant dollar average hourly earnings are increasing over time, then there has been either a shift out in demand for labor, supply of labor held constant; or, a shift back in the supply of labor, demand for labor held constant.5 Note, however,
that the evidence suggests that the supply of sea-sonal and nonseasonal agricultural labor has been gradually increasing in recent years, so we dis-count the likelihood that the supply of labor has been decreasing over time.
Converting current dollar to constant dollar before-tax average hourly earnings may change the pattern of statistical significance in important ways. And, in general, if you wish to compare average hourly earnings over time, a constant dollar comparison relative to some base year, in this case the year 2000, is the preferable method of comparison.
The general pattern of constant dollar average hourly earnings stays the same as that for current dollar average hourly earnings. That is, for example, workers in animal production still earn the highest average hourly earnings compared to crop produc-tion and support activities for agriculture.
Figure 8 Before-tax Average Hourly Earnings, Selected NAICS Subsectors, Constant Dollars, 2000 = 100Washington State, 2006 to 2009Source: Labor Market and Economic Analysis, Employment Security Department, UI Wage File
2006 2007 2008 2009
Standard Standard Standard StandardNAICS SubsectorDescription Median Mean Deviation Median Mean Deviation Median Mean Deviation Median Mean Deviation
111 CropProduction $9.27 $9.56 $3.96 $9.34 $9.64 $3.93 $9.53 $9.54 $4.31 $9.49 $9.56 $4.13112 AnimalProduction $10.34 $11.16 $3.78 $10.39 $11.29 $4.62 $10.58 $12.32 $3.90 $10.30 $12.85 $4.27115 SupportActivitiesfor $10.10 $10.62 $6.98 $10.21 $10.62 $7.29 $10.61 $10.72 $6.53 $11.58 $9.97 $7.40 Agriculture 1112 VegetableandMelonFarming $9.18 $9.48 $3.78 $9.19 $10.88 $4.69 $9.29 $11.37 $6.00 $9.18 $10.81 $6.481113 FruitandTreeNutFarming $9.18 $9.29 $3.58 $9.22 $9.35 $3.39 $9.30 $9.32 $3.59 $9.18 $9.24 $3.421114 Greenhouse,Nursery,and $9.14 $9.67 $5.48 $9.20 $9.72 $4.59 $9.44 $9.89 $3.69 $9.11 $10.00 $3.33 FloricultureProduction111998 AllOtherMiscellaneous $8.83 $9.89 $4.28 $9.12 $9.66 $3.41 $9.43 $9.46 $4.07 $9.20 $9.86 $3.87 CropFarming 115112 SoilPreparation,Planting, $12.95 $16.82 $11.12 $13.45 $17.24 $9.08 $12.71 $16.15 $7.58 $13.35 $16.09 $10.85 andCultivating115113 CropHarvesting,Primarily $12.03 $11.59 $4.18 $10.14 $11.35 $2.65 $10.91 $12.66 $3.02 $11.01 $11.75 $2.94 byMachine115114 Post-HarvestCropActivities, $9.32 $9.91 $4.26 $9.52 $9.99 $3.97 $9.73 $10.13 $5.40 $9.54 $9.60 $5.94 exceptCottonGinning 115115 FarmLaborContractorsand $7.73 $10.34 $2.39 $7.58 $9.71 $3.44 $9.39 $9.52 $3.33 $8.90 $9.05 $2.93 CrewLeaders115116 FarmManagementServices $9.86 $8.88 $8.10 $9.52 $9.30 $5.51 $10.28 $8.92 $6.41 $9.54 $8.90 $6.18
The Agricultural Workforce in Washington State
9
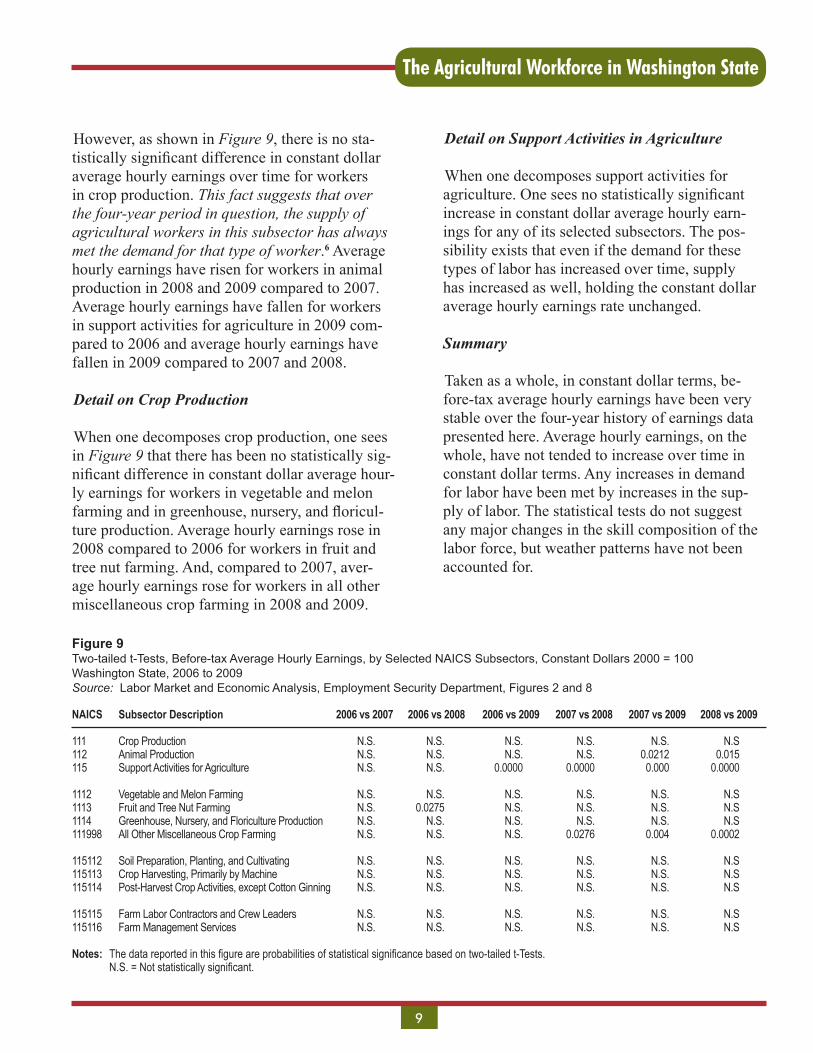
However, as shown in Figure 9, there is no sta-tistically significant difference in constant dollar average hourly earnings over time for workers in crop production. This fact suggests that over the four-year period in question, the supply of agricultural workers in this subsector has always met the demand for that type of worker.6 Average hourly earnings have risen for workers in animal production in 2008 and 2009 compared to 2007. Average hourly earnings have fallen for workers in support activities for agriculture in 2009 com-pared to 2006 and average hourly earnings have fallen in 2009 compared to 2007 and 2008.
Detail on Crop Production
When one decomposes crop production, one sees in Figure 9 that there has been no statistically sig-nificant difference in constant dollar average hour-ly earnings for workers in vegetable and melon farming and in greenhouse, nursery, and floricul-ture production. Average hourly earnings rose in 2008 compared to 2006 for workers in fruit and tree nut farming. And, compared to 2007, aver-age hourly earnings rose for workers in all other miscellaneous crop farming in 2008 and 2009.
Detail on Support Activities in Agriculture
When one decomposes support activities for agriculture. One sees no statistically significant increase in constant dollar average hourly earn-ings for any of its selected subsectors. The pos-sibility exists that even if the demand for these types of labor has increased over time, supply has increased as well, holding the constant dollar average hourly earnings rate unchanged.
Summary
Taken as a whole, in constant dollar terms, be-fore-tax average hourly earnings have been very stable over the four-year history of earnings data presented here. Average hourly earnings, on the whole, have not tended to increase over time in constant dollar terms. Any increases in demand for labor have been met by increases in the sup-ply of labor. The statistical tests do not suggest any major changes in the skill composition of the labor force, but weather patterns have not been accounted for.
Figure 9 Two-tailed t-Tests, Before-tax Average Hourly Earnings, by Selected NAICS Subsectors, Constant Dollars 2000 = 100 Washington State, 2006 to 2009 Source: Labor Market and Economic Analysis, Employment Security Department, Figures 2 and 8 NAICS SubsectorDescription 2006vs2007 2006vs2008 2006vs2009 2007vs2008 2007vs2009 2008vs2009
111 CropProduction N.S. N.S. N.S. N.S. N.S. N.S112 AnimalProduction N.S. N.S. N.S. N.S. 0.0212 0.015115 SupportActivitiesforAgriculture N.S. N.S. 0.0000 0.0000 0.000 0.0000 1112 VegetableandMelonFarming N.S. N.S. N.S. N.S. N.S. N.S1113 FruitandTreeNutFarming N.S. 0.0275 N.S. N.S. N.S. N.S1114 Greenhouse,Nursery,andFloricultureProduction N.S. N.S. N.S. N.S. N.S. N.S111998 AllOtherMiscellaneousCropFarming N.S. N.S. N.S. 0.0276 0.004 0.0002 115112 SoilPreparation,Planting,andCultivating N.S. N.S. N.S. N.S. N.S. N.S115113 CropHarvesting,PrimarilybyMachine N.S. N.S. N.S. N.S. N.S. N.S115114 Post-HarvestCropActivities,exceptCottonGinning N.S. N.S. N.S. N.S. N.S. N.S 115115 FarmLaborContractorsandCrewLeaders N.S. N.S. N.S. N.S. N.S. N.S115116 FarmManagementServices N.S. N.S. N.S. N.S. N.S. N.S
Notes: Thedatareportedinthisfigureareprobabilitiesofstatisticalsignificancebasedontwo-tailedt-Tests. N.S.=Notstatisticallysignificant.
The Agricultural Workforce in Washington State
10
Summary and Conclusions
u Average hourly before-tax earnings by de-tailed subsectors:
● Current dollar comparisons of levels in aver-age hourly earnings over time suggest, on the whole, that average hourly earnings increase for most detailed agricultural subsectors.
● This picture is largely reversed when one compares the subsectors over time based on constant dollars. Constant dollar aver-age hourly earnings have, on the whole, remained relatively stable over the period 2006 to 2009.
● This fact suggests that supply has gener-ally met demand for agricultural labor.
u Average annual hours worked per worker by detailed subsectors:
● Without controlling for the business cycle and year to year seasonal factors, it is dif-ficult to determine if there have been any long term changes in the average hours worked per worker across the detailed agricultural subsectors.
● Six of the 12 subsectors display a higher level of hours worked in 2008 compared to 2006, 2007 and 2009.
● Average hours worked appear to be de-creasing for workers in berry farming and floriculture farming.
● Average hours worked appear to be in-creasing for workers in wheat farming, all other grain farming, cattle feedlots, and support activities for animal production.
u These simple comparisons do not reveal whether there has been an increase in the amount of farm labor which is out-contracted over time, rela-tively shifting labor from crop and animal pro-duction to support activities for agriculture. Note,
however, that this set of comparisons has not been adjusted for seasonal year-to-year patterns in precipitation and temperature resulting in the declining constant dollar average hourly earnings. Nor, has there been any adjustment for business cycle effects.
Endnotes1 Some forms of capital substitution/techno-
logical innovation, through lowering of costs (increasing supply) can actually result in the use of more, rather than less, labor.
2 Though the count of workers is unduplicated, any given worker can have more than one job during the calendar year and work for more than one employer. Thus, the count of number of jobs employed and the number of workers employed is not the same.
3 Under certain conditions skilled and unskilled labor are complementary to each other and are not substitutes. Thus, it is possible that the increase in the use of skilled labor in agricul-ture could actually induce an increase in the employment of unskilled labor.
4 Average hours worked per worker per firm could also increase if there were a drop in sup-ply of these workers, demand held constant. Firms would then compensate for the fewer number of workers available by having the existing supply work more hours, on average.
5 Both demand and supply could be increasing, but demand increasing more than supply. And both demand and supply could be decreasing, but supply decreasing more than demand.
6 The data that we have on number of workers, average hours worked, and before-tax average hourly wage rates are equilibrium measures. That is, they measure workers, hours, and hourly earnings where supply of labor and the demand for labor intersect.