Embed Size (px)
Citation preview
PHYSICAL PROPERTIES
TERC.UCDAVIS.EDU 8
TERC.UCDAVIS.EDU
TAHOE: STATE OF THE LAKE REPORT 2015
8.1
Lake surface levelDaily since 1900
PHYSICAL PROPERTIES
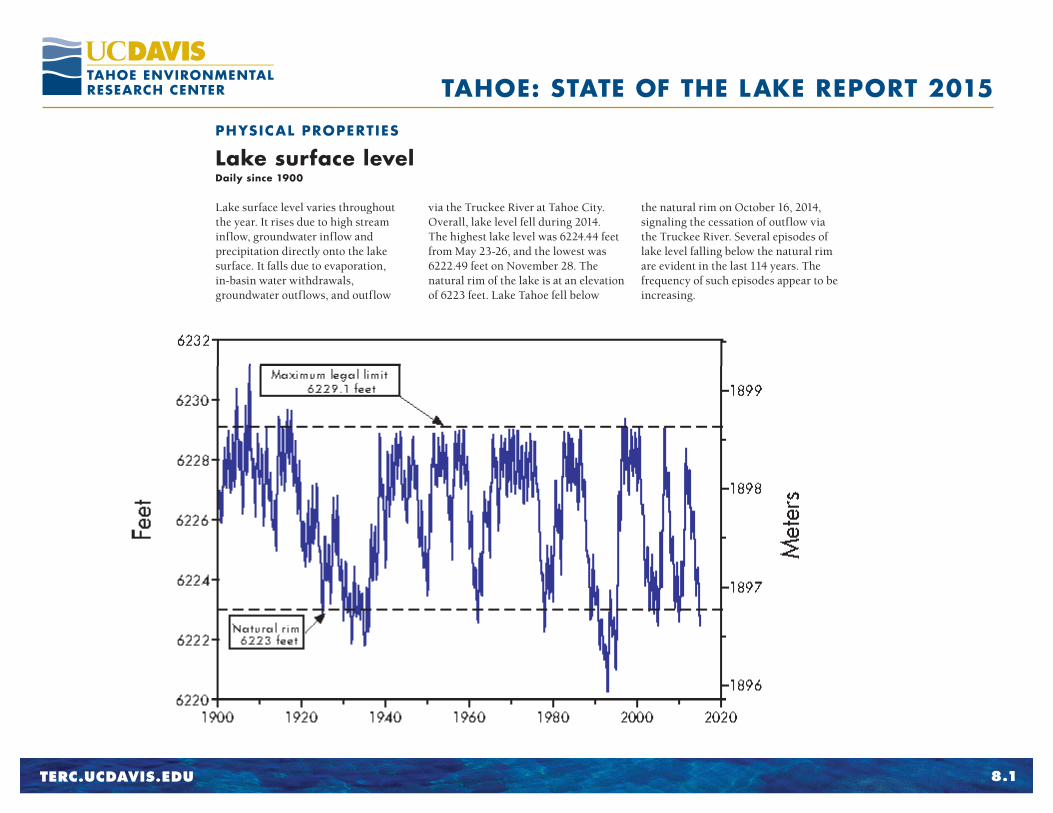
Lake surface level varies throughout the year. It rises due to high stream inflow, groundwater inflow and precipitation directly onto the lake surface. It falls due to evaporation, in-basin water withdrawals, groundwater outflows, and outflow
via the Truckee River at Tahoe City. Overall, lake level fell during 2014. The highest lake level was 6224.44 feet from May 23-26, and the lowest was 6222.49 feet on November 28. The natural rim of the lake is at an elevation of 6223 feet. Lake Tahoe fell below
the natural rim on October 16, 2014, signaling the cessation of outflow via the Truckee River. Several episodes of lake level falling below the natural rim are evident in the last 114 years. The frequency of such episodes appear to be increasing.
TERC.UCDAVIS.EDU
TAHOE: STATE OF THE LAKE REPORT 2015
8.2
Lake surface level, continued Daily since 2012
PHYSICAL PROPERTIES
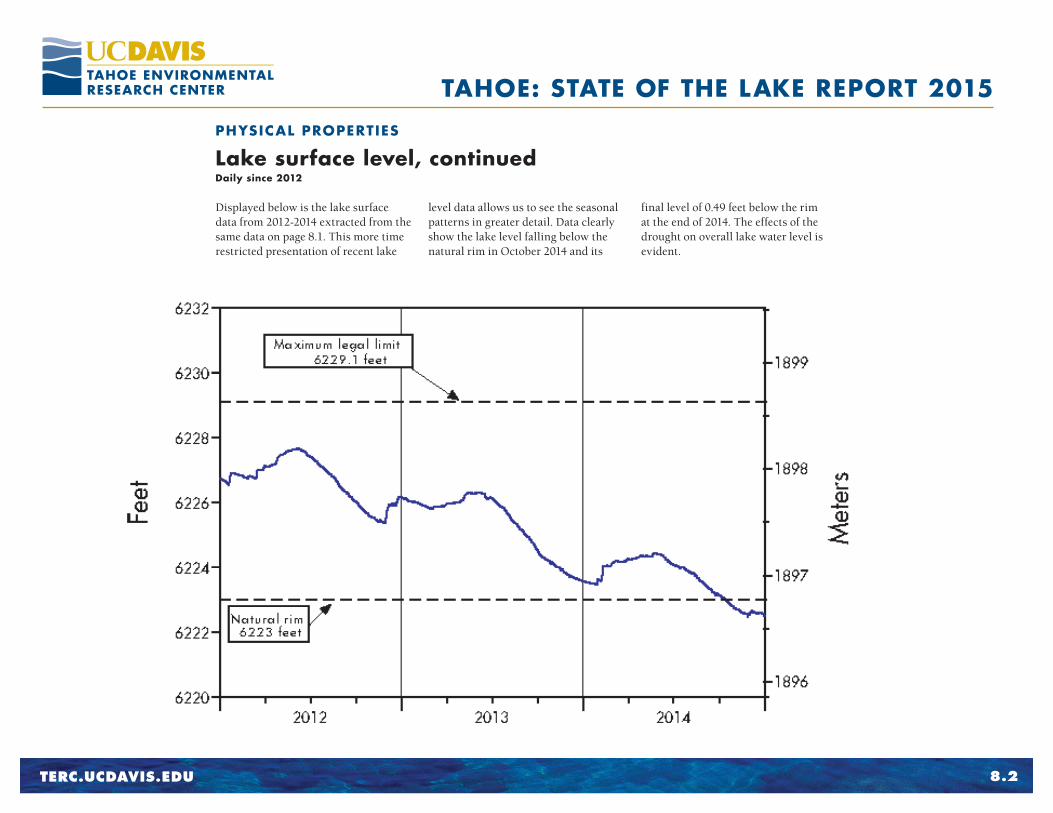
Displayed below is the lake surface data from 2012-2014 extracted from the same data on page 8.1. This more time restricted presentation of recent lake
level data allows us to see the seasonal patterns in greater detail. Data clearly show the lake level falling below the natural rim in October 2014 and its
final level of 0.49 feet below the rim at the end of 2014. The effects of the drought on overall lake water level is evident.
TERC.UCDAVIS.EDU
TAHOE: STATE OF THE LAKE REPORT 2015
8.3
Water temperature profileIn 2014
PHYSICAL PROPERTIES
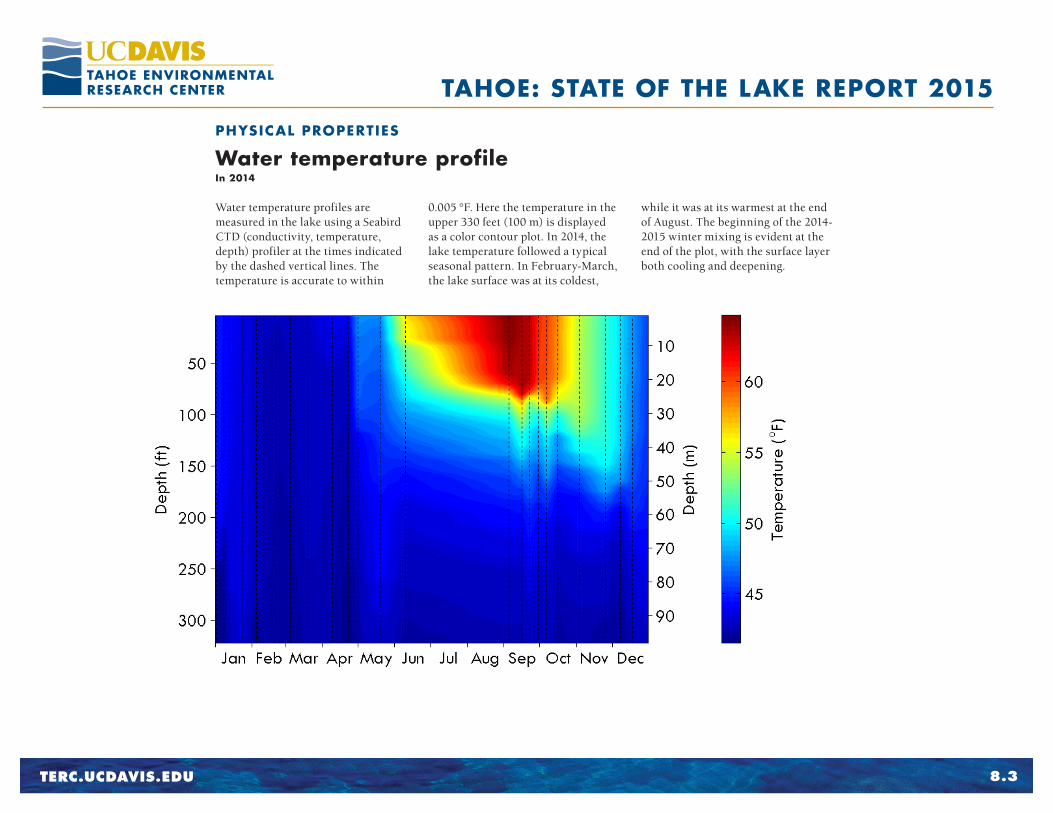
Water temperature profiles are measured in the lake using a Seabird CTD (conductivity, temperature, depth) profiler at the times indicated by the dashed vertical lines. The temperature is accurate to within
0.005 °F. Here the temperature in the upper 330 feet (100 m) is displayed as a color contour plot. In 2014, the lake temperature followed a typical seasonal pattern. In February-March, the lake surface was at its coldest,
while it was at its warmest at the end of August. The beginning of the 2014-2015 winter mixing is evident at the end of the plot, with the surface layer both cooling and deepening.
TERC.UCDAVIS.EDU
TAHOE: STATE OF THE LAKE REPORT 2015
8.4
Average water temperatureSince 1970
PHYSICAL PROPERTIES
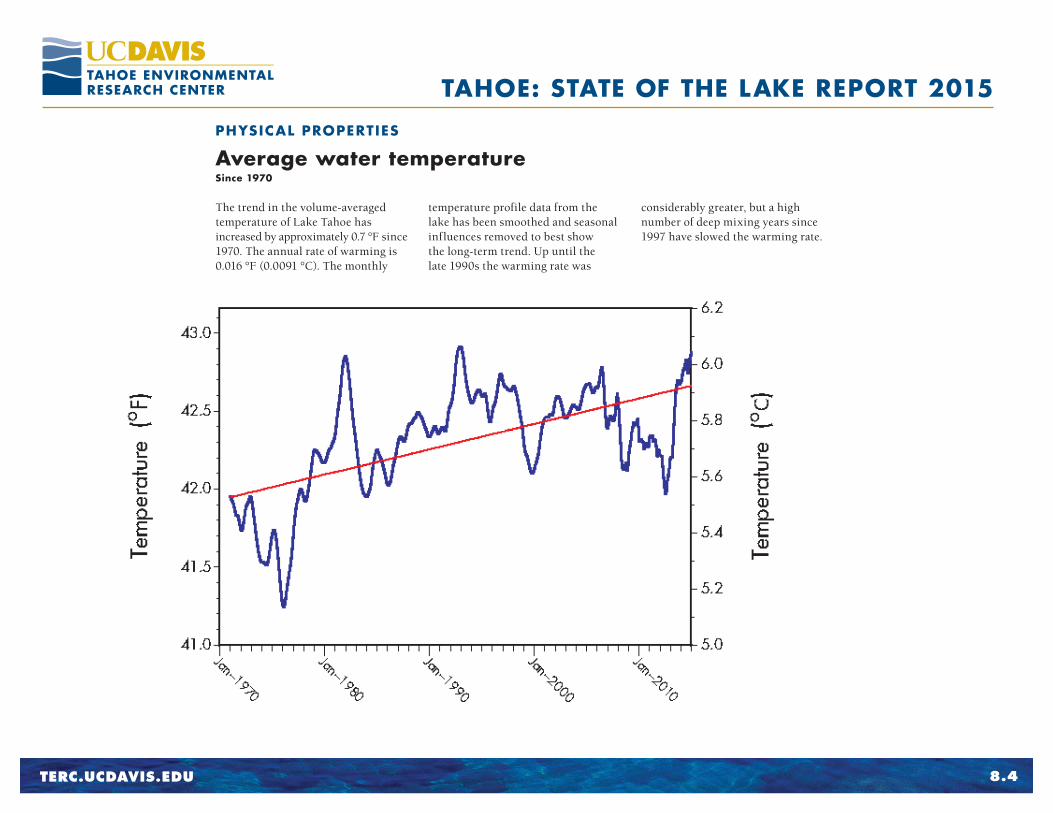
The trend in the volume-averaged temperature of Lake Tahoe has increased by approximately 0.7 °F since 1970. The annual rate of warming is 0.016 °F (0.0091 °C). The monthly
temperature profile data from the lake has been smoothed and seasonal influences removed to best show the long-term trend. Up until the late 1990s the warming rate was
considerably greater, but a high number of deep mixing years since 1997 have slowed the warming rate.

TERC.UCDAVIS.EDU
TAHOE: STATE OF THE LAKE REPORT 2015
8.5
Annual average water temperatureSince 1970
PHYSICAL PROPERTIES
The volume-averaged temperature of the lake for each year since 1970 is shown. In 2014 the volume-averaged temperature increased by 0.2 °F
(0.11 °C) over the previous year. The years with the largest decreases in temperature generally correspond to those years in which deep mixing
occurred. Years with increases in temperature are often associated with a lack of deep mixing.
TERC.UCDAVIS.EDU
TAHOE: STATE OF THE LAKE REPORT 2015
8.6
Surface water temperatureYearly since 1968
PHYSICAL PROPERTIES
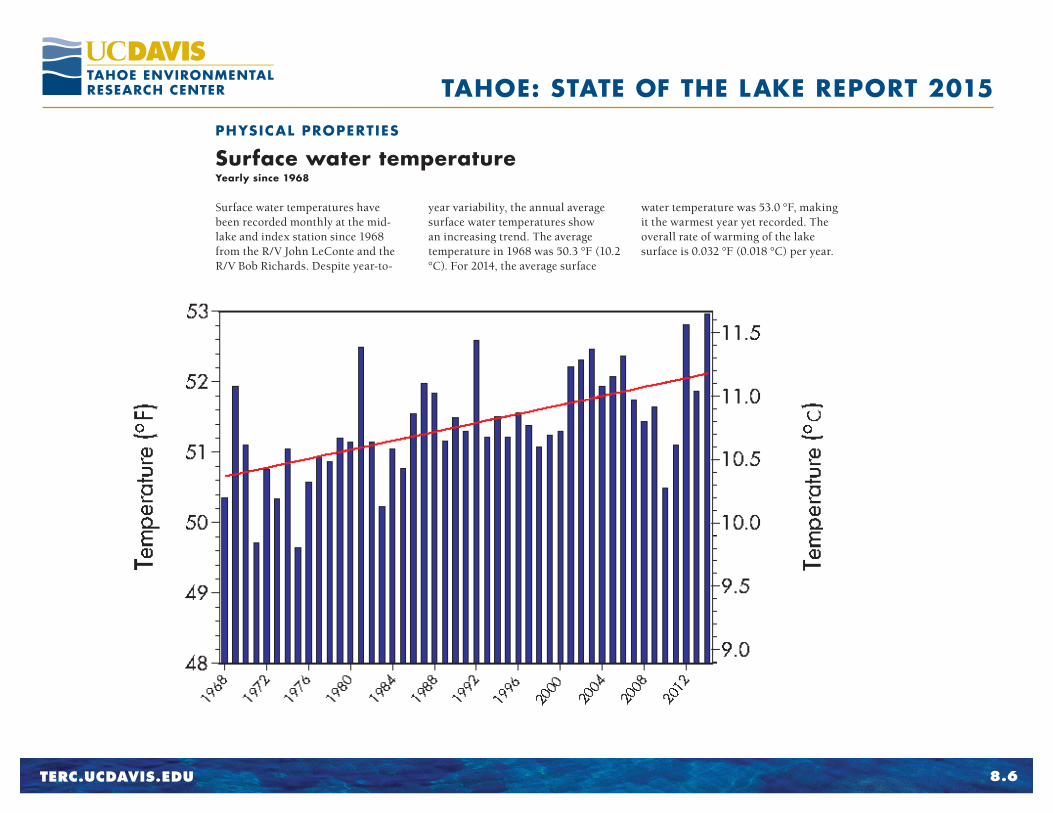
Surface water temperatures have been recorded monthly at the mid-lake and index station since 1968 from the R/V John LeConte and the R/V Bob Richards. Despite year-to-
year variability, the annual average surface water temperatures show an increasing trend. The average temperature in 1968 was 50.3 °F (10.2 °C). For 2014, the average surface
water temperature was 53.0 °F, making it the warmest year yet recorded. The overall rate of warming of the lake surface is 0.032 °F (0.018 °C) per year.

TERC.UCDAVIS.EDU
TAHOE: STATE OF THE LAKE REPORT 2015
8.7
Maximum daily surface water temperatureSurface temperature measured since 1999 every 2 minutes
PHYSICAL PROPERTIES
The maximum daily surface water temperature in 2014 was significantly warmer than it has been for the last 4 years, and for the winter-time maximum, it was the warmest surface water
temperature observed since 1999. The highest maximum daily surface water temperature (summer) was 76.33 °F, which was recorded on July 18, 2014. The lowest maximum daily surface water
temperature (winter) was 42.79 °F, which was recorded on February 9, 2014. These data are collected in real-time by NASA-JPL and UC Davis from 4 buoys located over the deepest parts of the lake.
TERC.UCDAVIS.EDU
TAHOE: STATE OF THE LAKE REPORT 2015
8.8
July average surface water temperatureMeasured since 1999 every 2 minutes
PHYSICAL PROPERTIES
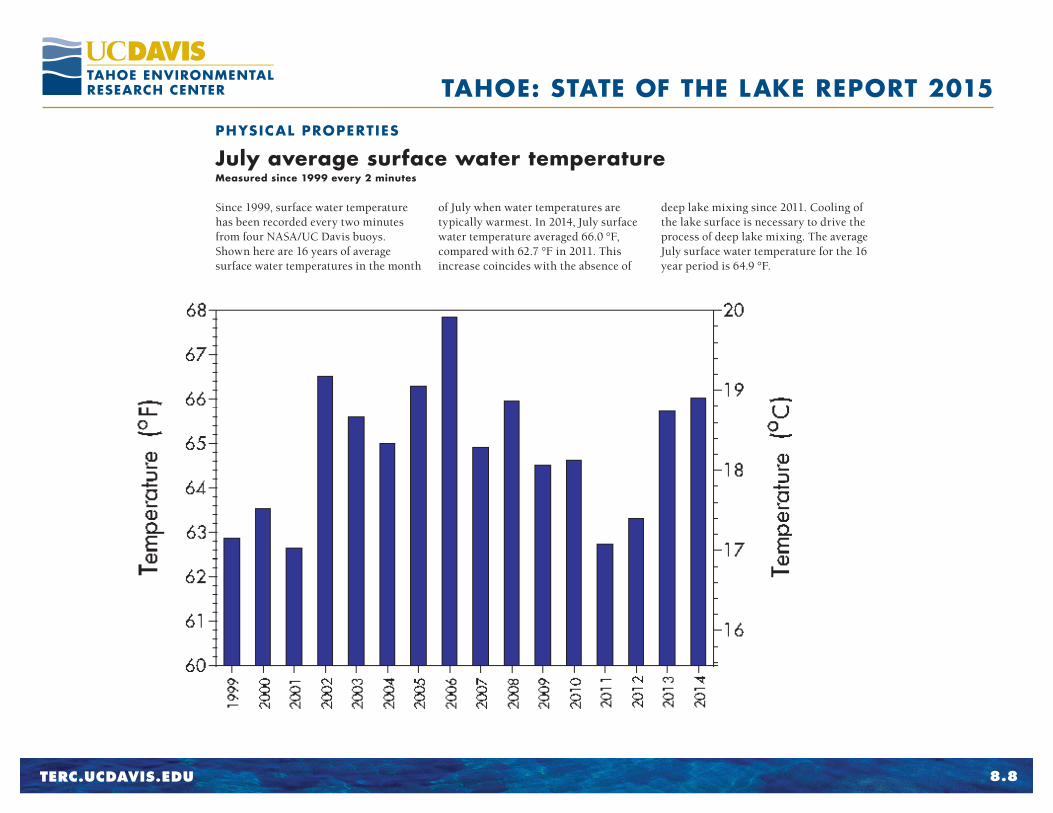
Since 1999, surface water temperature has been recorded every two minutes from four NASA/UC Davis buoys. Shown here are 16 years of average surface water temperatures in the month
of July when water temperatures are typically warmest. In 2014, July surface water temperature averaged 66.0 °F, compared with 62.7 °F in 2011. This increase coincides with the absence of
deep lake mixing since 2011. Cooling of the lake surface is necessary to drive the process of deep lake mixing. The average July surface water temperature for the 16 year period is 64.9 °F.
TERC.UCDAVIS.EDU
TAHOE: STATE OF THE LAKE REPORT 2015
8.9
Deep water temperatureSince 1970
PHYSICAL PROPERTIES
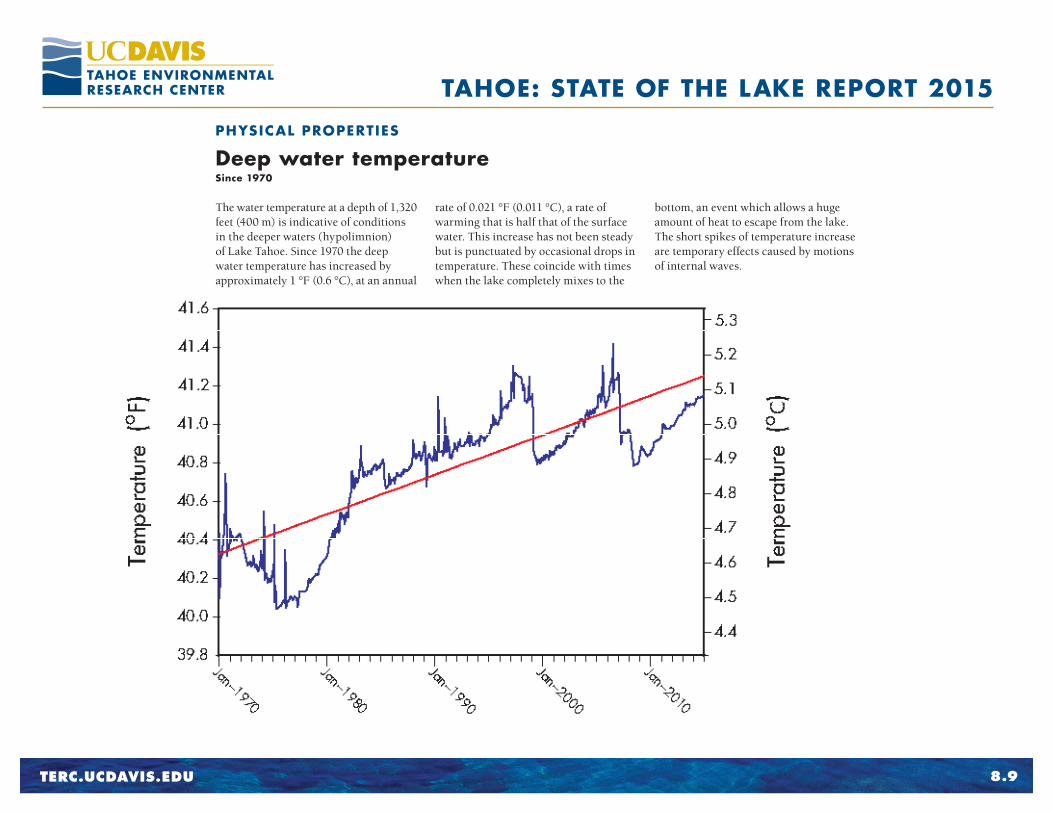
The water temperature at a depth of 1,320 feet (400 m) is indicative of conditions in the deeper waters (hypolimnion) of Lake Tahoe. Since 1970 the deep water temperature has increased by approximately 1 °F (0.6 °C), at an annual
rate of 0.021 °F (0.011 °C), a rate of warming that is half that of the surface water. This increase has not been steady but is punctuated by occasional drops in temperature. These coincide with times when the lake completely mixes to the
bottom, an event which allows a huge amount of heat to escape from the lake. The short spikes of temperature increase are temporary effects caused by motions of internal waves.

TERC.UCDAVIS.EDU
TAHOE: STATE OF THE LAKE REPORT 2015
8.10
Depth of mixingYearly since 1973
PHYSICAL PROPERTIES
Lake Tahoe mixes each winter as surface waters cool and sink downward. In a lake as deep as Tahoe, the wind energy and intense cooling of winter helps to determine how deep the lake mixes. Mixing depth has profound impacts on lake ecology and water quality. Deep mixing brings nutrients
to the surface, where they promote algal growth. It also moves oxygen to deep waters, promoting aquatic life throughout the water column. The deepest mixing typically occurs between February and March. In 2014, Lake Tahoe mixed to a depth of only 440 feet (134 m). This lack of deep mixing most
likely contributed to the warmer surface temperature, the build up of nitrate in lake, and the generally higher clarity. Beginning in 2013, the determination of the depth of mixing has been based on high-resolution temperature profiles rather than nitrate concentration sampled at discrete depths.
TERC.UCDAVIS.EDU
TAHOE: STATE OF THE LAKE REPORT 2015
8.11
Lake stabilitySince 1968
PHYSICAL PROPERTIES
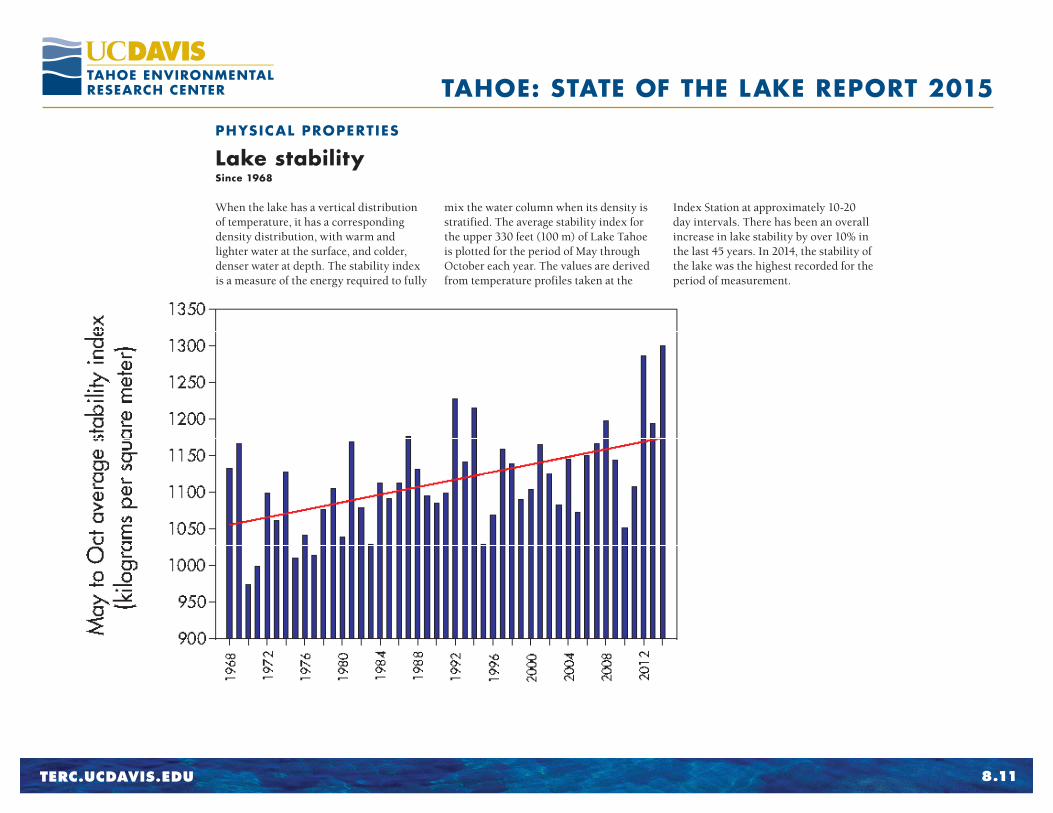
When the lake has a vertical distribution of temperature, it has a corresponding density distribution, with warm and lighter water at the surface, and colder, denser water at depth. The stability index is a measure of the energy required to fully
mix the water column when its density is stratified. The average stability index for the upper 330 feet (100 m) of Lake Tahoe is plotted for the period of May through October each year. The values are derived from temperature profiles taken at the
Index Station at approximately 10-20 day intervals. There has been an overall increase in lake stability by over 10% in the last 45 years. In 2014, the stability of the lake was the highest recorded for the period of measurement.
TERC.UCDAVIS.EDU
TAHOE: STATE OF THE LAKE REPORT 2015
8.12
Stratified season lengthSince 1968
PHYSICAL PROPERTIES
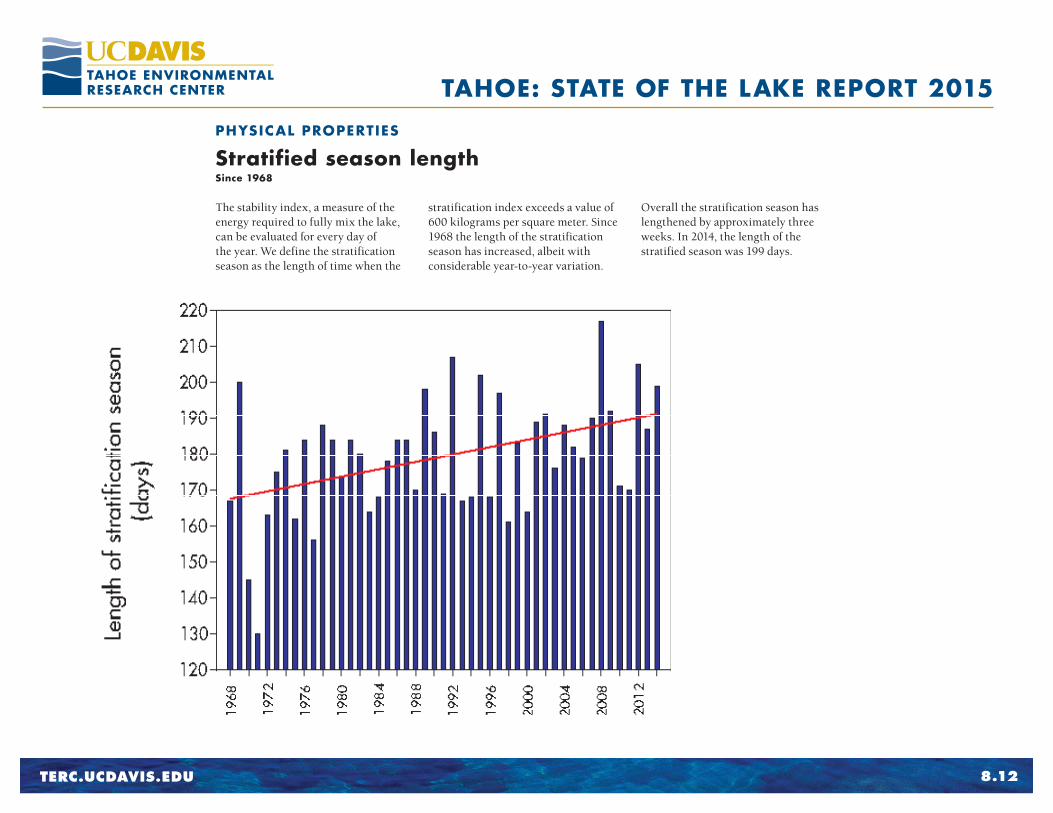
The stability index, a measure of the energy required to fully mix the lake, can be evaluated for every day of the year. We define the stratification season as the length of time when the
stratification index exceeds a value of 600 kilograms per square meter. Since 1968 the length of the stratification season has increased, albeit with considerable year-to-year variation.
Overall the stratification season has lengthened by approximately three weeks. In 2014, the length of the stratified season was 199 days.

TERC.UCDAVIS.EDU
TAHOE: STATE OF THE LAKE REPORT 2015
8.13
Beginning of the stratification season Since 1968
PHYSICAL PROPERTIES
The length of time that Lake Tahoe is stratified has been lengthening since 1968. One reason for this is the increasingly early arrival of spring as evidenced by the
earlier commencement of stratification. Stratification occurs approximately three days earlier than it did in 1968. The commencement of the stratification season
is typically in late May or early June. In 2014 stratification commenced on Day 150 (May 30).
(day
s)
TERC.UCDAVIS.EDU
TAHOE: STATE OF THE LAKE REPORT 2015
8.14
End of stratification season Since 1968
PHYSICAL PROPERTIES
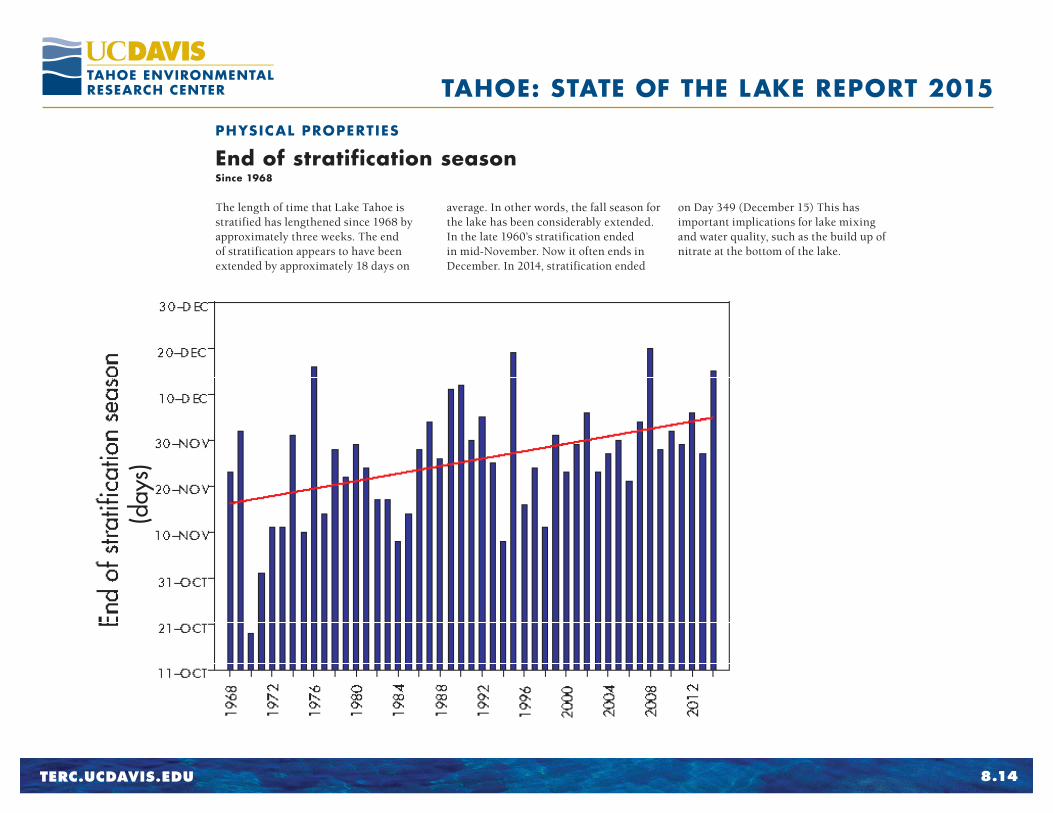
The length of time that Lake Tahoe is stratified has lengthened since 1968 by approximately three weeks. The end of stratification appears to have been extended by approximately 18 days on
average. In other words, the fall season for the lake has been considerably extended. In the late 1960’s stratification ended in mid-November. Now it often ends in December. In 2014, stratification ended
on Day 349 (December 15) This has important implications for lake mixing and water quality, such as the build up of nitrate at the bottom of the lake.
(day
s)

TERC.UCDAVIS.EDU
TAHOE: STATE OF THE LAKE REPORT 2015
8.15
Peak of stratification season Since 1968
PHYSICAL PROPERTIES
The day of the year when lake stratification reaches its maximum value has been plotted. There is considerable
year-to-year variation, but over time there has been only a slight delay in when the peak occurs.
(day
s)
1968
1972
1976
1980
1984
1988
1992
1996
2000
2004
2008
2012
Peak of stratification season
12-JUL
22-JUL
11-AU
G
21-AU
G
10-SEP
20-SEP
30-SEP
1-AU
G
31-AU
G
10-OC
T

TERC.UCDAVIS.EDU
TAHOE: STATE OF THE LAKE REPORT 2015
8.16
Mean daily streamflow of Upper Truckee River vs. Truckee River Water Year 2014
PHYSICAL PROPERTIES
The largest stream flowing into Lake Tahoe is the Upper Truckee River. The small peaks in the hydrograph generally represent rain events or short warm periods in winter or spring. The extended seasonal increase (March-May) represents the snowmelt. The peak snowmelt flow was approximately 200 cfs, compared to the long-term average of 300 cfs. The mean daily discharge was 44.3 cfs, compared to the long-
term mean of 93.9 cfs The Truckee River is the only outflow from Lake Tahoe. It is a regulated flow, with release quantity controlled by the Federal Water Master. As a result, the hydrograph has extended times of near-constant outflow. The release rates are set according to downstream demands for water and concerns for flooding. The maximum discharge in 2014 was approximately 300 cfs in mid-June.
This is a typical summer time flow rate. What was unusual in 2014 was the steep decline in flow rate in August and September due to the falling lake level. Streamflow data are collected by the U.S. Geological Survey under the Lake Tahoe Interagency Monitoring Program (LTIMP).
TERC.UCDAVIS.EDU
TAHOE: STATE OF THE LAKE REPORT 2015
8.17
Shift in snowmelt timing Yearly since 1961
PHYSICAL PROPERTIES
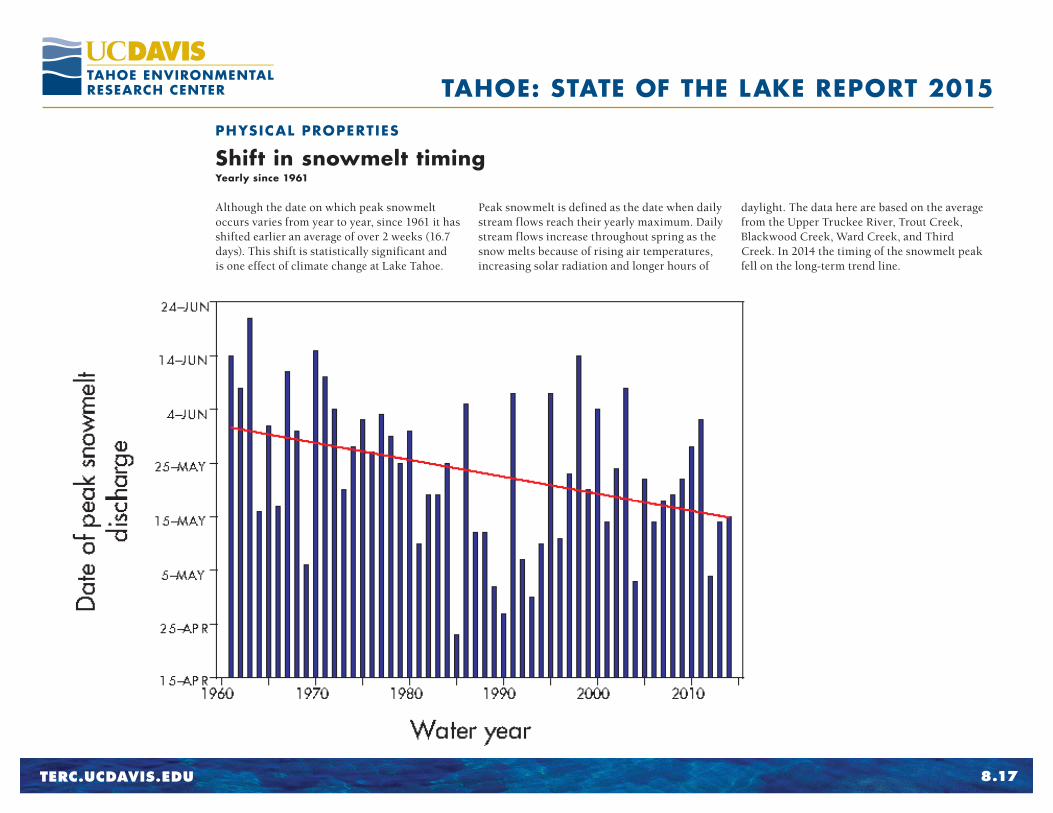
Although the date on which peak snowmelt occurs varies from year to year, since 1961 it has shifted earlier an average of over 2 weeks (16.7 days). This shift is statistically significant and is one effect of climate change at Lake Tahoe.
Peak snowmelt is defined as the date when daily stream flows reach their yearly maximum. Daily stream flows increase throughout spring as the snow melts because of rising air temperatures, increasing solar radiation and longer hours of
daylight. The data here are based on the average from the Upper Truckee River, Trout Creek, Blackwood Creek, Ward Creek, and Third Creek. In 2014 the timing of the snowmelt peak fell on the long-term trend line.
TERC.UCDAVIS.EDU
TAHOE: STATE OF THE LAKE REPORT 2015
8.18
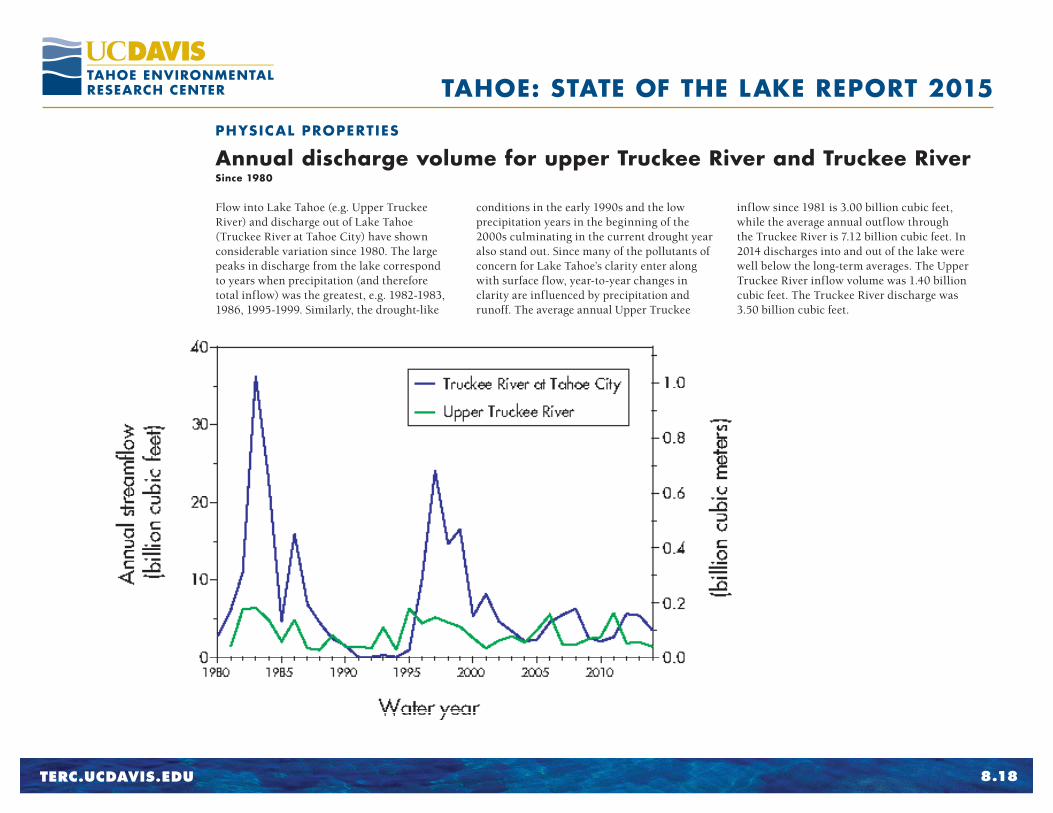
Annual discharge volume for upper Truckee River and Truckee RiverSince 1980
PHYSICAL PROPERTIES
Flow into Lake Tahoe (e.g. Upper Truckee River) and discharge out of Lake Tahoe (Truckee River at Tahoe City) have shown considerable variation since 1980. The large peaks in discharge from the lake correspond to years when precipitation (and therefore total inflow) was the greatest, e.g. 1982-1983, 1986, 1995-1999. Similarly, the drought-like
conditions in the early 1990s and the low precipitation years in the beginning of the 2000s culminating in the current drought year also stand out. Since many of the pollutants of concern for Lake Tahoe’s clarity enter along with surface flow, year-to-year changes in clarity are influenced by precipitation and runoff. The average annual Upper Truckee
inflow since 1981 is 3.00 billion cubic feet, while the average annual outflow through the Truckee River is 7.12 billion cubic feet. In 2014 discharges into and out of the lake were well below the long-term averages. The Upper Truckee River inflow volume was 1.40 billion cubic feet. The Truckee River discharge was 3.50 billion cubic feet.
TERC.UCDAVIS.EDU
TAHOE: STATE OF THE LAKE REPORT 2015
8.19
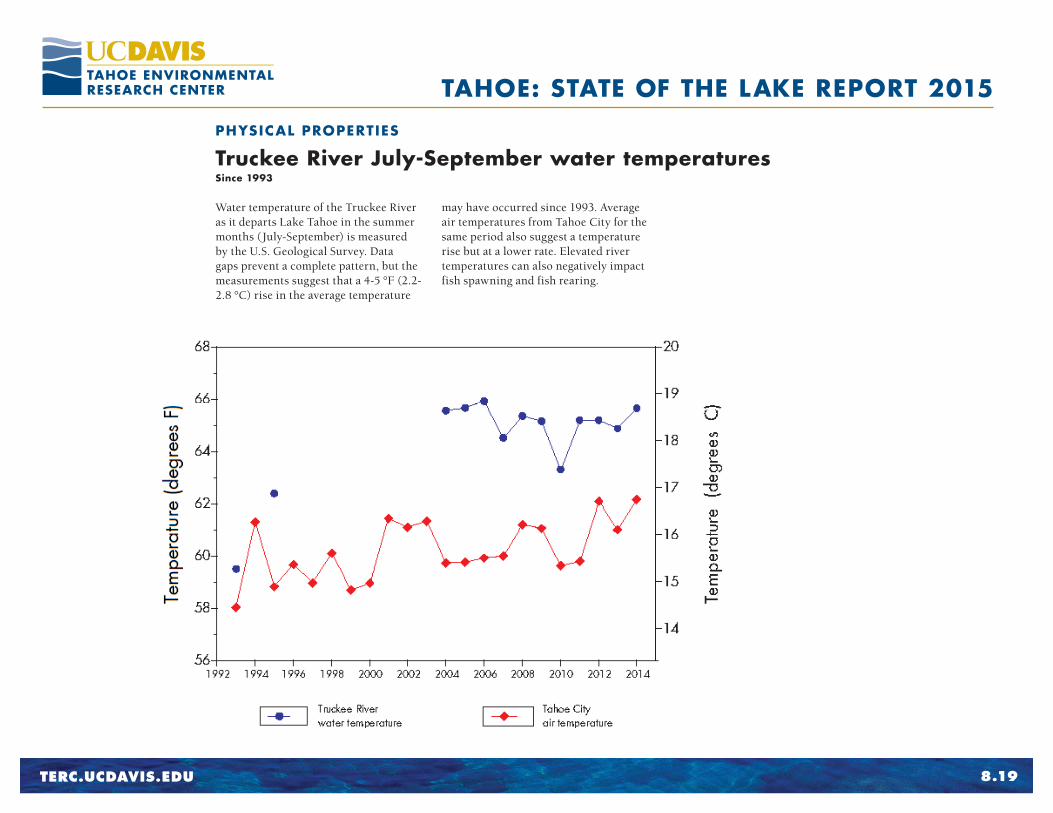
Truckee River July-September water temperaturesSince 1993
PHYSICAL PROPERTIES
Water temperature of the Truckee River as it departs Lake Tahoe in the summer months (July-September) is measured by the U.S. Geological Survey. Data gaps prevent a complete pattern, but the measurements suggest that a 4-5 °F (2.2-2.8 °C) rise in the average temperature
may have occurred since 1993. Average air temperatures from Tahoe City for the same period also suggest a temperature rise but at a lower rate. Elevated river temperatures can also negatively impact fish spawning and fish rearing.
TERC.UCDAVIS.EDU
TAHOE: STATE OF THE LAKE REPORT 2015
8.20
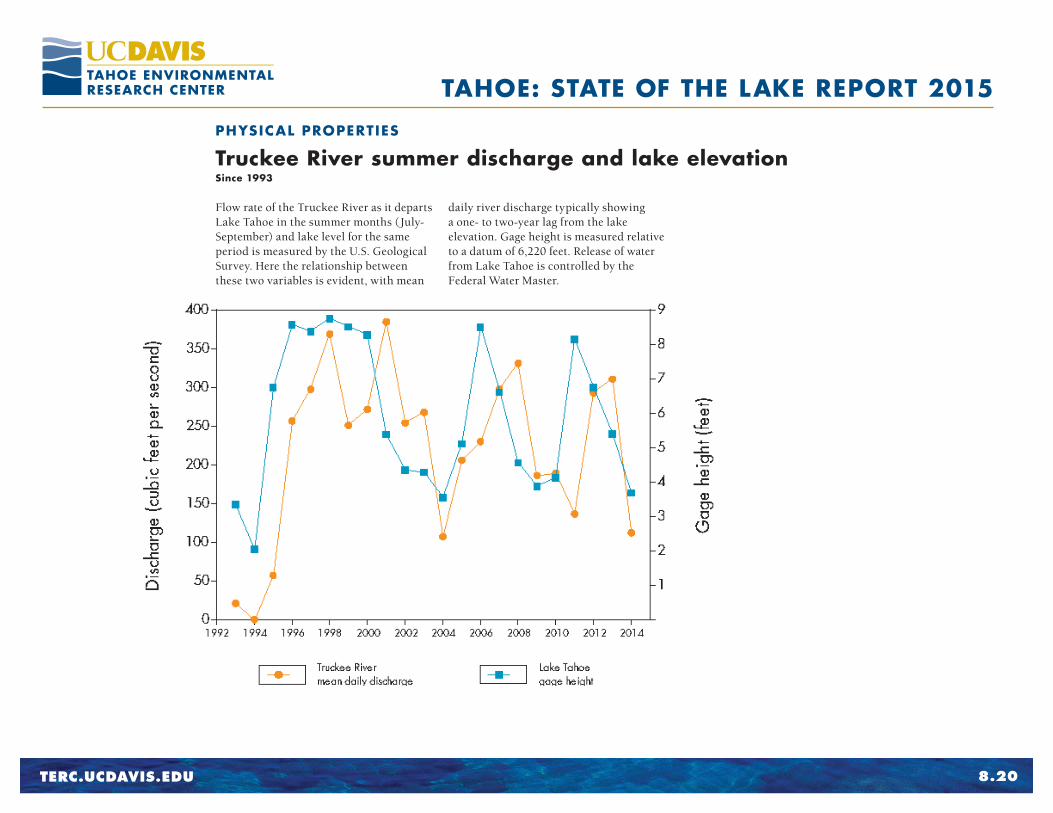
Truckee River summer discharge and lake elevationSince 1993
PHYSICAL PROPERTIES
Flow rate of the Truckee River as it departs Lake Tahoe in the summer months (July-September) and lake level for the same period is measured by the U.S. Geological Survey. Here the relationship between these two variables is evident, with mean
daily river discharge typically showing a one- to two-year lag from the lake elevation. Gage height is measured relative to a datum of 6,220 feet. Release of water from Lake Tahoe is controlled by the Federal Water Master.