Embed Size (px)
Citation preview
Washington State Transportation Commission Road Usage Charge Assessment
Household Inventory of Vehicles
In Washington State
June & November 2014 Executive Summary Presentation
2 WSTC June-Novermber 2014 Road Usage Charge Study
Introduction
• The Washington State Transportation Commission (WSTC) conducted a statewide survey using the Voice of Washington State (VOWS) web panel to inform the WSTC’s Road Usage Charge (RUC) urban/rural impact analysis.
• The survey was designed to help better understand the makeup of our state’s residential vehicle fleet and residents’ usage of our roads and highways
• The survey was emailed to VOWS panel members on June 12th through the June 28th and November 7th through 21st.
• There were a total of 7,917 valid surveys before weighting
• The data was weighted by age within each county and then the counties were weighted to their state proportion
3 WSTC June-Novermber 2014 Road Usage Charge Study
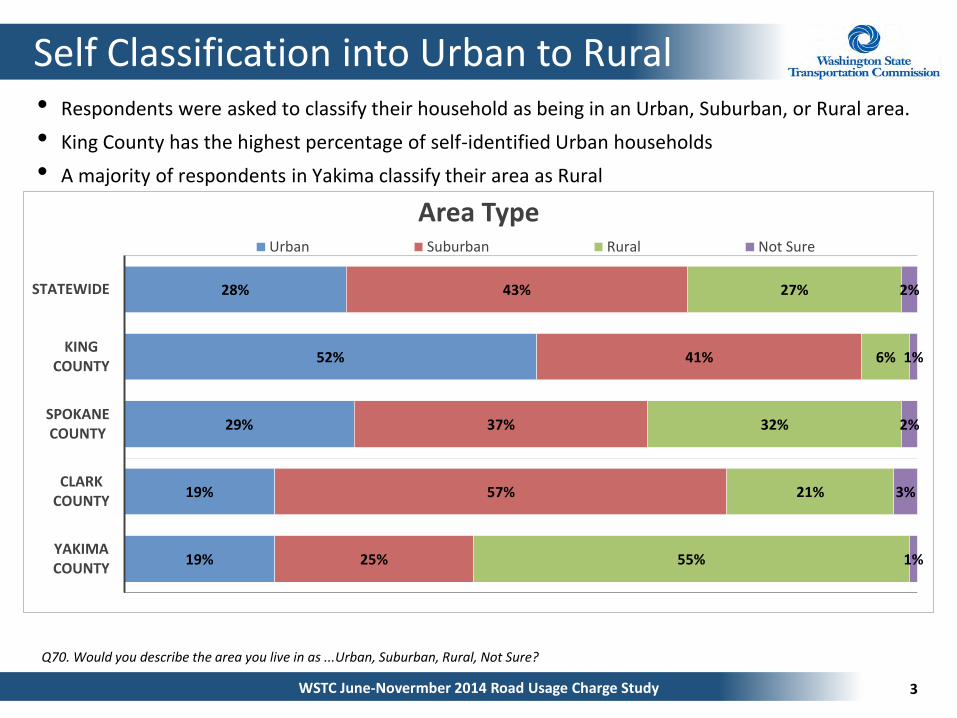
Self Classification into Urban to Rural • Respondents were asked to classify their household as being in an Urban, Suburban, or Rural area.
• King County has the highest percentage of self-identified Urban households
• A majority of respondents in Yakima classify their area as Rural
Q70. Would you describe the area you live in as ...Urban, Suburban, Rural, Not Sure?
28%
52%
29%
19%
19%
43%
41%
37%
57%
25%
27%
6%
32%
21%
55%
2%
1%
2%
3%
1%
STATEWIDE
KING COUNTY
SPOKANE COUNTY
CLARK COUNTY
YAKIMA COUNTY
Area Type Urban Suburban Rural Not Sure
4 WSTC June-Novermber 2014 Road Usage Charge Study
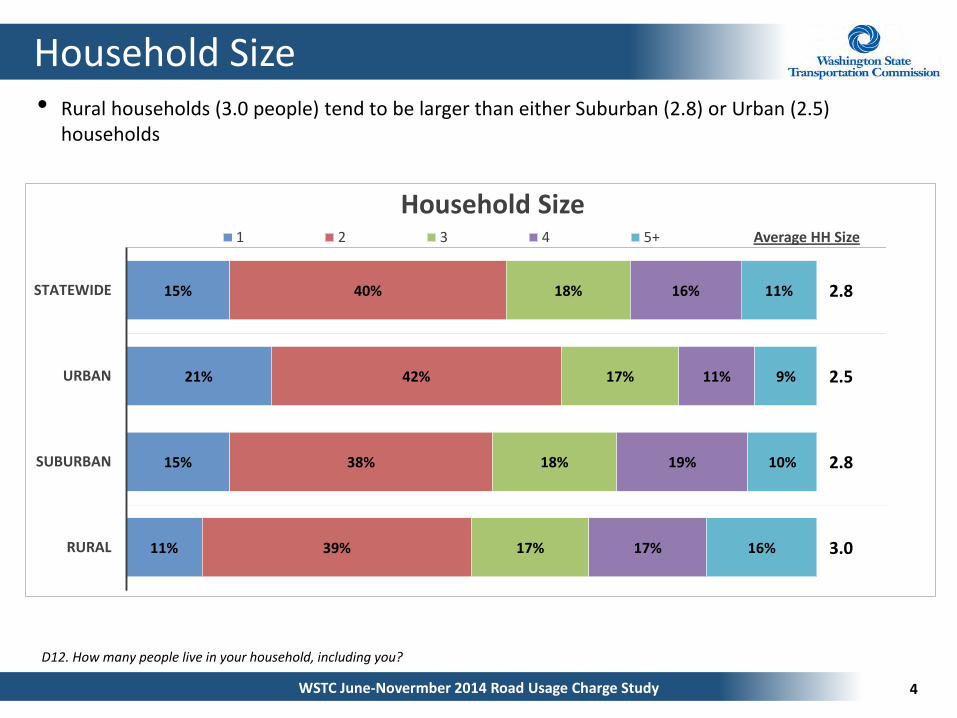
Household Size • Rural households (3.0 people) tend to be larger than either Suburban (2.8) or Urban (2.5)
households
D12. How many people live in your household, including you?
15%
21%
15%
11%
40%
42%
38%
39%
18%
17%
18%
17%
16%
11%
19%
17%
11%
9%
10%
16%
2.8
2.5
2.8
3.0
STATEWIDE
URBAN
SUBURBAN
RURAL
Household Size 1 2 3 4 5+ Average HH Size
5 WSTC June-Novermber 2014 Road Usage Charge Study
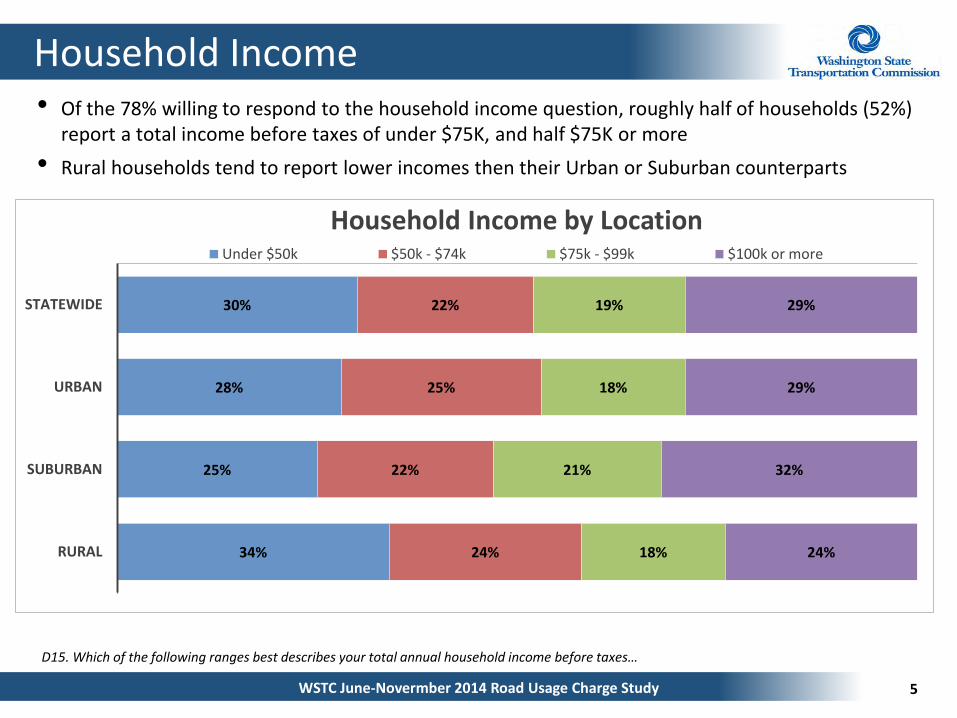
Household Income • Of the 78% willing to respond to the household income question, roughly half of households (52%)
report a total income before taxes of under $75K, and half $75K or more
• Rural households tend to report lower incomes then their Urban or Suburban counterparts
D15. Which of the following ranges best describes your total annual household income before taxes…
30%
28%
25%
34%
22%
25%
22%
24%
19%
18%
21%
18%
29%
29%
32%
24%
STATEWIDE
URBAN
SUBURBAN
RURAL
Household Income by Location Under $50k $50k - $74k $75k - $99k $100k or more
6 WSTC June-Novermber 2014 Road Usage Charge Study
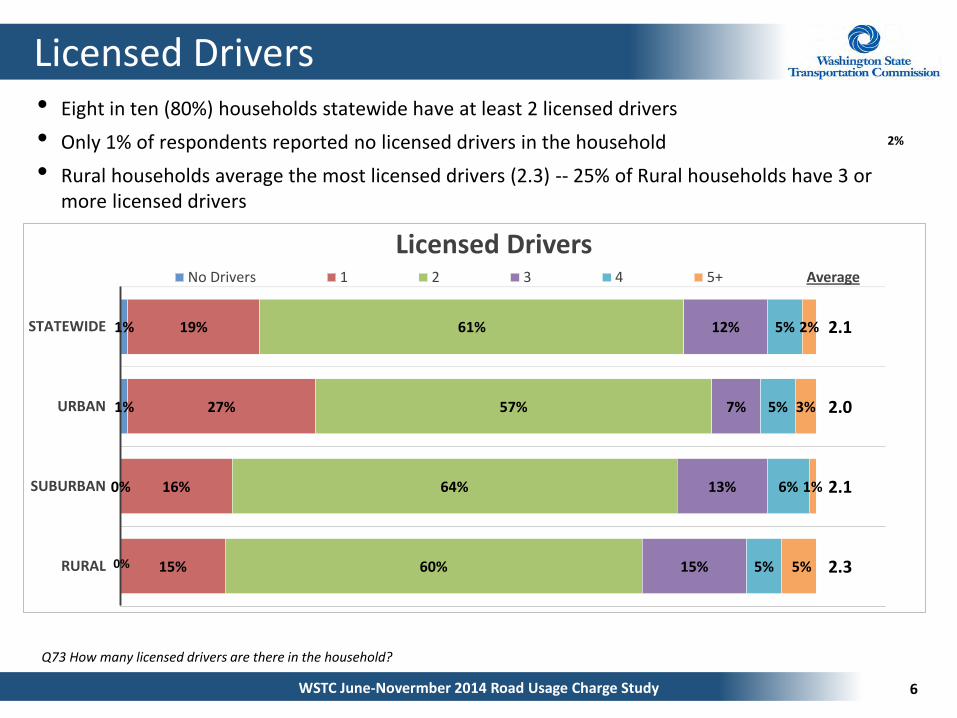
Licensed Drivers • Eight in ten (80%) households statewide have at least 2 licensed drivers
• Only 1% of respondents reported no licensed drivers in the household
• Rural households average the most licensed drivers (2.3) -- 25% of Rural households have 3 or more licensed drivers
Q73 How many licensed drivers are there in the household?
1%
1%
0%
19%
27%
16%
15%
61%
57%
64%
60%
12%
7%
13%
15%
5%
5%
6%
5%
2%
3%
1%
2.1
2.0
2.1
2.3
STATEWIDE
URBAN
SUBURBAN
RURAL
Licensed Drivers No Drivers 1 2 3 4 5+ Average
2%
5% 0%
7 WSTC June-Novermber 2014 Road Usage Charge Study
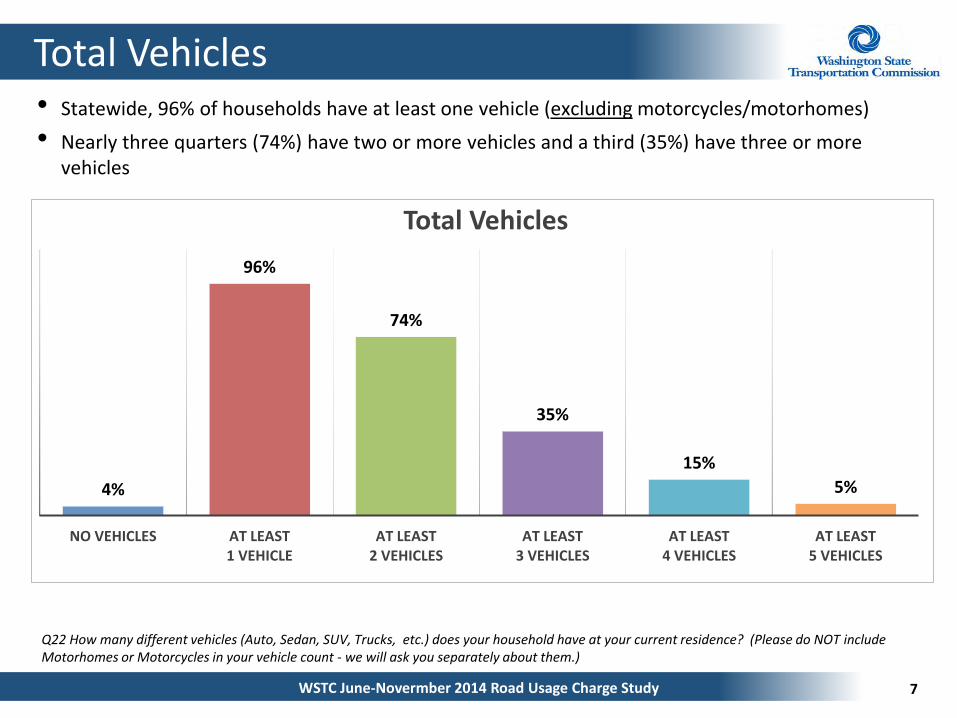
Total Vehicles • Statewide, 96% of households have at least one vehicle (excluding motorcycles/motorhomes)
• Nearly three quarters (74%) have two or more vehicles and a third (35%) have three or more vehicles
Q22 How many different vehicles (Auto, Sedan, SUV, Trucks, etc.) does your household have at your current residence? (Please do NOT include Motorhomes or Motorcycles in your vehicle count - we will ask you separately about them.)
4%
96%
74%
35%
15%
5%
NO VEHICLES AT LEAST 1 VEHICLE
AT LEAST 2 VEHICLES
AT LEAST 3 VEHICLES
AT LEAST 4 VEHICLES
AT LEAST 5 VEHICLES
Total Vehicles
8 WSTC June-Novermber 2014 Road Usage Charge Study
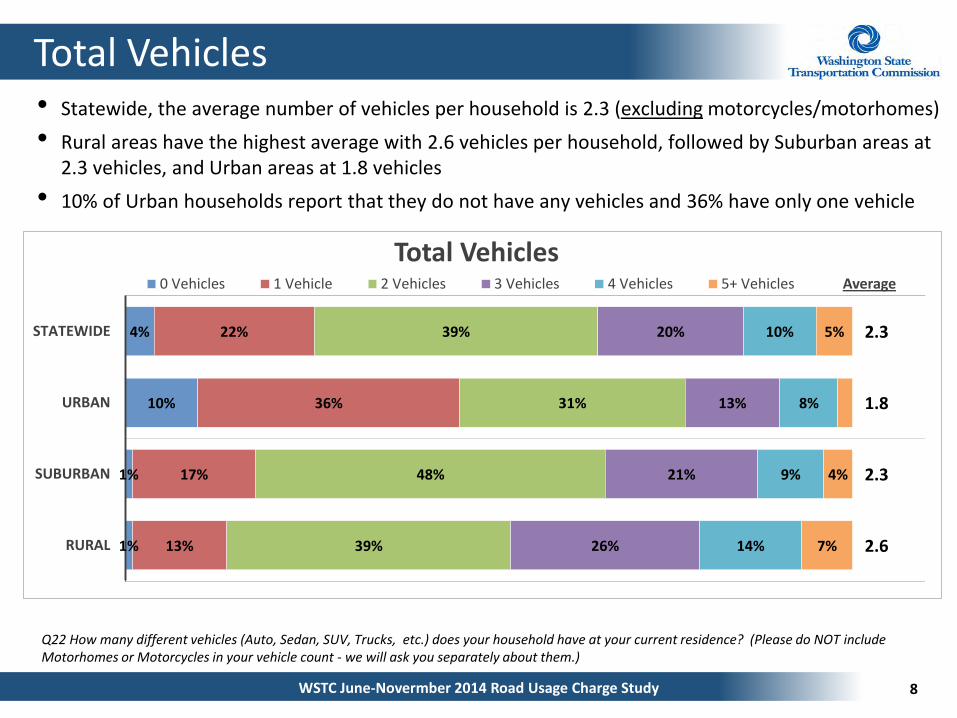
Total Vehicles • Statewide, the average number of vehicles per household is 2.3 (excluding motorcycles/motorhomes)
• Rural areas have the highest average with 2.6 vehicles per household, followed by Suburban areas at 2.3 vehicles, and Urban areas at 1.8 vehicles
• 10% of Urban households report that they do not have any vehicles and 36% have only one vehicle
Q22 How many different vehicles (Auto, Sedan, SUV, Trucks, etc.) does your household have at your current residence? (Please do NOT include Motorhomes or Motorcycles in your vehicle count - we will ask you separately about them.)
4%
10%
1%
1%
22%
36%
17%
13%
39%
31%
48%
39%
20%
13%
21%
26%
10%
8%
9%
14%
5%
4%
7%
2.3
1.8
2.3
2.6
STATEWIDE
URBAN
SUBURBAN
RURAL
Total Vehicles 0 Vehicles 1 Vehicle 2 Vehicles 3 Vehicles 4 Vehicles 5+ Vehicles Average
9 WSTC June-Novermber 2014 Road Usage Charge Study
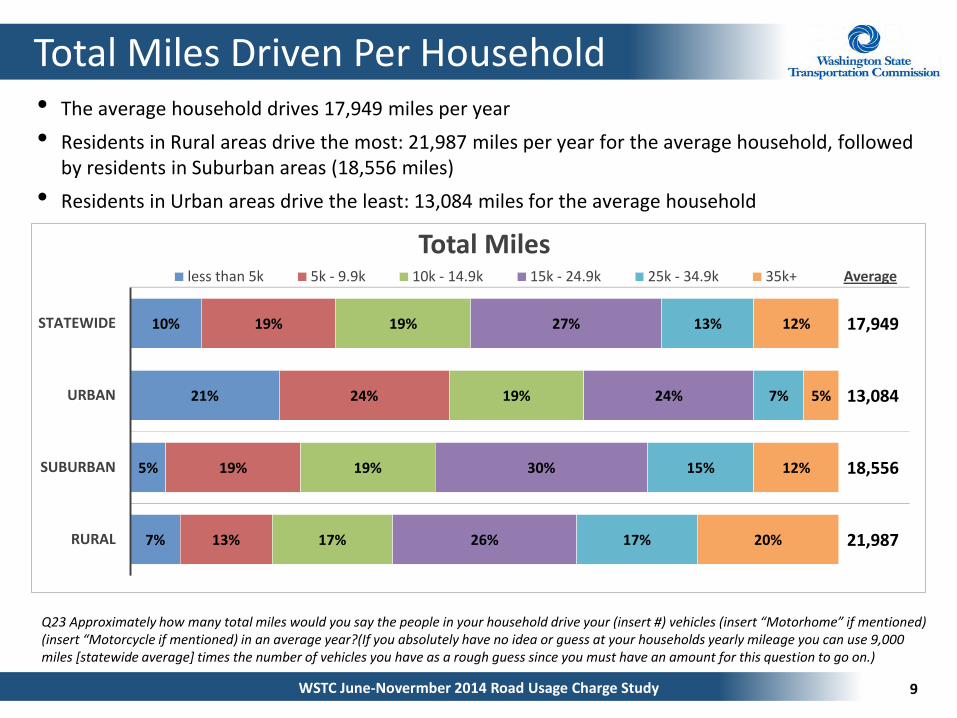
Total Miles Driven Per Household • The average household drives 17,949 miles per year
• Residents in Rural areas drive the most: 21,987 miles per year for the average household, followed by residents in Suburban areas (18,556 miles)
• Residents in Urban areas drive the least: 13,084 miles for the average household
Q23 Approximately how many total miles would you say the people in your household drive your (insert #) vehicles (insert “Motorhome” if mentioned) (insert “Motorcycle if mentioned) in an average year?(If you absolutely have no idea or guess at your households yearly mileage you can use 9,000 miles [statewide average] times the number of vehicles you have as a rough guess since you must have an amount for this question to go on.)
10%
21%
5%
7%
19%
24%
19%
13%
19%
19%
19%
17%
27%
24%
30%
26%
13%
7%
15%
17%
12%
5%
12%
20%
17,949
13,084
18,556
21,987
STATEWIDE
URBAN
SUBURBAN
RURAL
Total Miles less than 5k 5k - 9.9k 10k - 14.9k 15k - 24.9k 25k - 34.9k 35k+ Average
10 WSTC June-Novermber 2014 Road Usage Charge Study
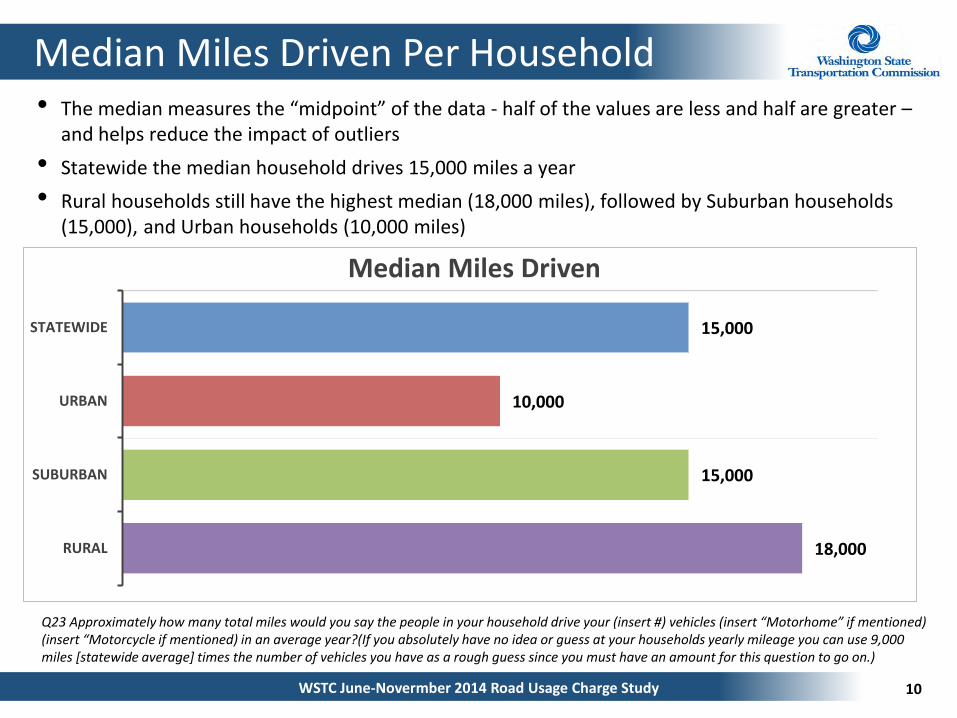
Median Miles Driven Per Household • The median measures the “midpoint” of the data - half of the values are less and half are greater –
and helps reduce the impact of outliers
• Statewide the median household drives 15,000 miles a year
• Rural households still have the highest median (18,000 miles), followed by Suburban households (15,000), and Urban households (10,000 miles)
Q23 Approximately how many total miles would you say the people in your household drive your (insert #) vehicles (insert “Motorhome” if mentioned) (insert “Motorcycle if mentioned) in an average year?(If you absolutely have no idea or guess at your households yearly mileage you can use 9,000 miles [statewide average] times the number of vehicles you have as a rough guess since you must have an amount for this question to go on.)
15,000
10,000
15,000
18,000
STATEWIDE
URBAN
SUBURBAN
RURAL
Median Miles Driven
11 WSTC June-Novermber 2014 Road Usage Charge Study
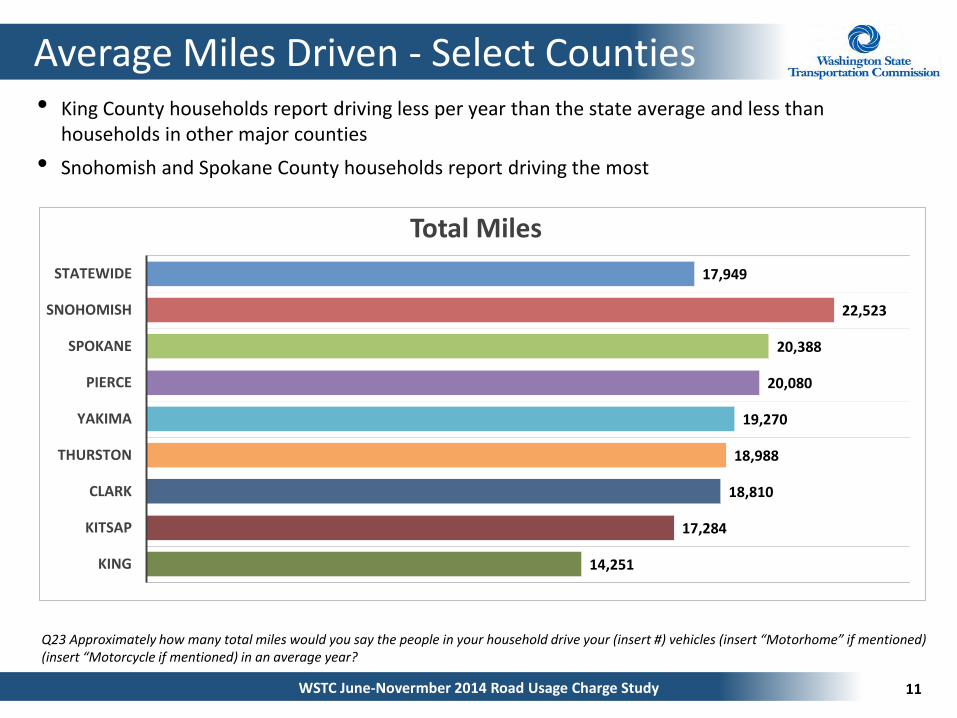
Average Miles Driven - Select Counties • King County households report driving less per year than the state average and less than
households in other major counties
• Snohomish and Spokane County households report driving the most
Q23 Approximately how many total miles would you say the people in your household drive your (insert #) vehicles (insert “Motorhome” if mentioned) (insert “Motorcycle if mentioned) in an average year?
17,949
22,523
20,388
20,080
19,270
18,988
18,810
17,284
14,251
STATEWIDE
SNOHOMISH
SPOKANE
PIERCE
YAKIMA
THURSTON
CLARK
KITSAP
KING
Total Miles
12 WSTC June-Novermber 2014 Road Usage Charge Study
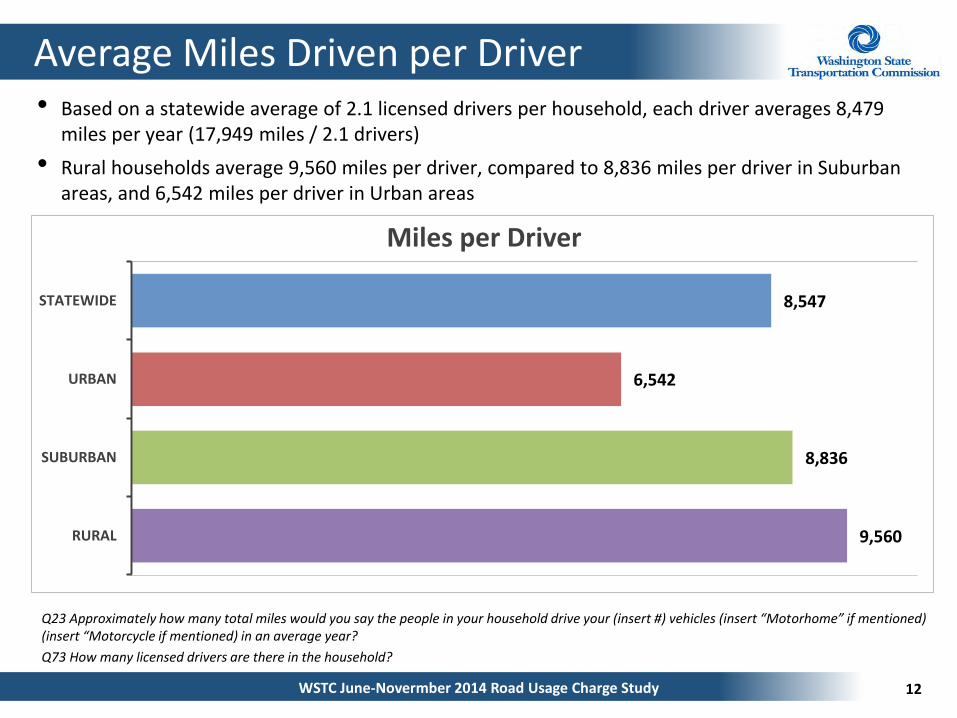
Average Miles Driven per Driver • Based on a statewide average of 2.1 licensed drivers per household, each driver averages 8,479
miles per year (17,949 miles / 2.1 drivers)
• Rural households average 9,560 miles per driver, compared to 8,836 miles per driver in Suburban areas, and 6,542 miles per driver in Urban areas
Q23 Approximately how many total miles would you say the people in your household drive your (insert #) vehicles (insert “Motorhome” if mentioned) (insert “Motorcycle if mentioned) in an average year?
Q73 How many licensed drivers are there in the household?
8,547
6,542
8,836
9,560
STATEWIDE
URBAN
SUBURBAN
RURAL
Miles per Driver
13 WSTC June-Novermber 2014 Road Usage Charge Study
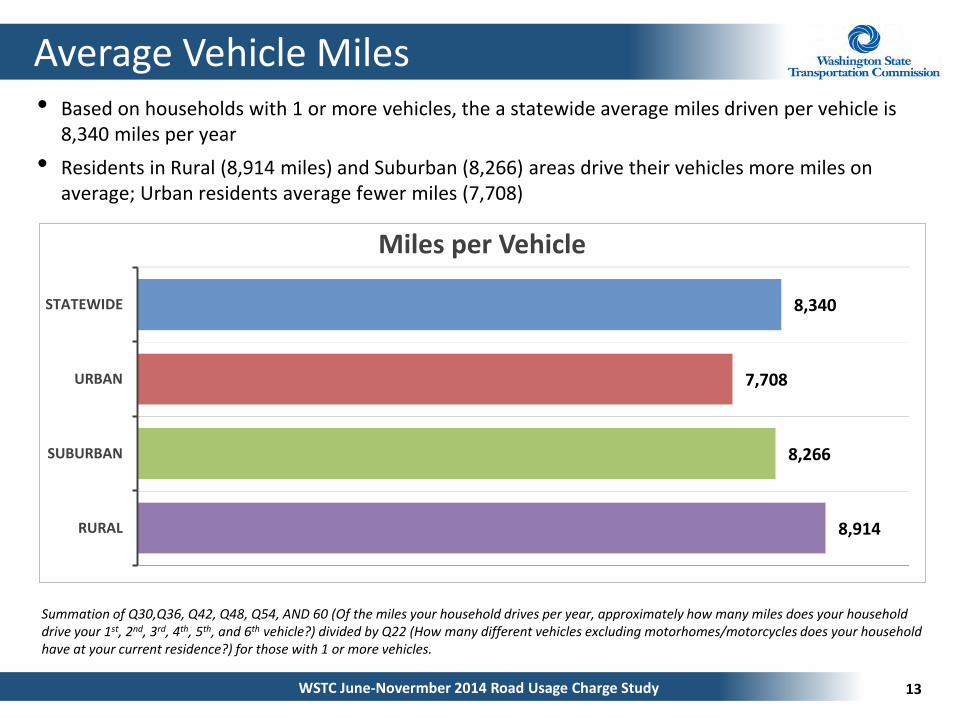
Average Vehicle Miles • Based on households with 1 or more vehicles, the a statewide average miles driven per vehicle is
8,340 miles per year
• Residents in Rural (8,914 miles) and Suburban (8,266) areas drive their vehicles more miles on average; Urban residents average fewer miles (7,708)
Summation of Q30,Q36, Q42, Q48, Q54, AND 60 (Of the miles your household drives per year, approximately how many miles does your household drive your 1st, 2nd, 3rd, 4th, 5th, and 6th vehicle?) divided by Q22 (How many different vehicles excluding motorhomes/motorcycles does your household have at your current residence?) for those with 1 or more vehicles.
8,340
7,708
8,266
8,914
STATEWIDE
URBAN
SUBURBAN
RURAL
Miles per Vehicle
14 WSTC June-Novermber 2014 Road Usage Charge Study
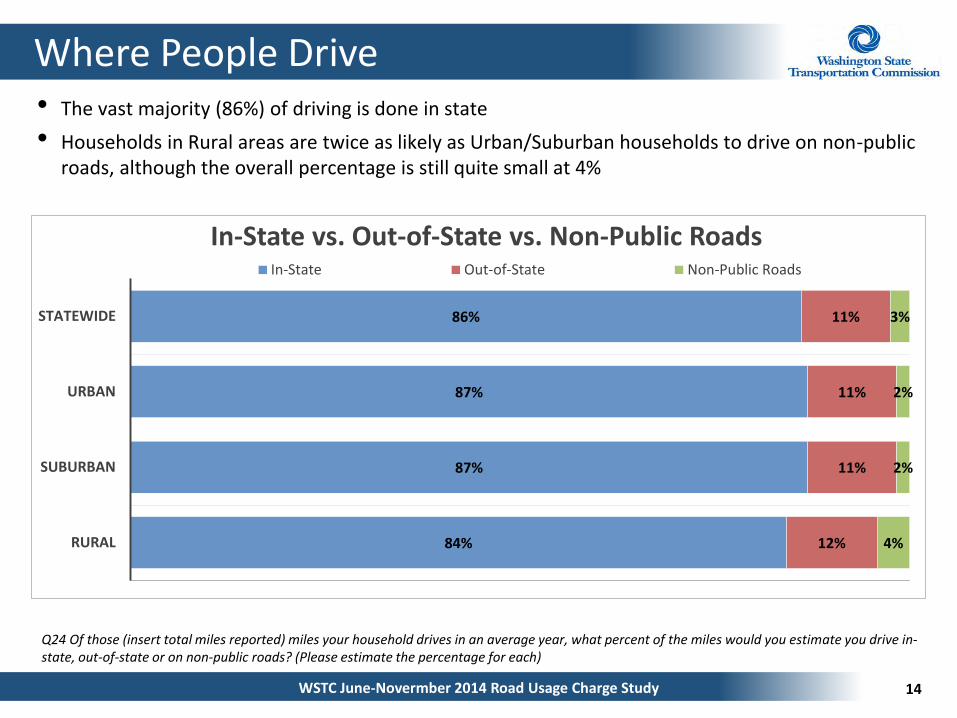
Where People Drive • The vast majority (86%) of driving is done in state
• Households in Rural areas are twice as likely as Urban/Suburban households to drive on non-public roads, although the overall percentage is still quite small at 4%
Q24 Of those (insert total miles reported) miles your household drives in an average year, what percent of the miles would you estimate you drive in-state, out-of-state or on non-public roads? (Please estimate the percentage for each)
86%
87%
87%
84%
11%
11%
11%
12%
3%
2%
2%
4%
STATEWIDE
URBAN
SUBURBAN
RURAL
In-State vs. Out-of-State vs. Non-Public Roads In-State Out-of-State Non-Public Roads
15 WSTC June-Novermber 2014 Road Usage Charge Study
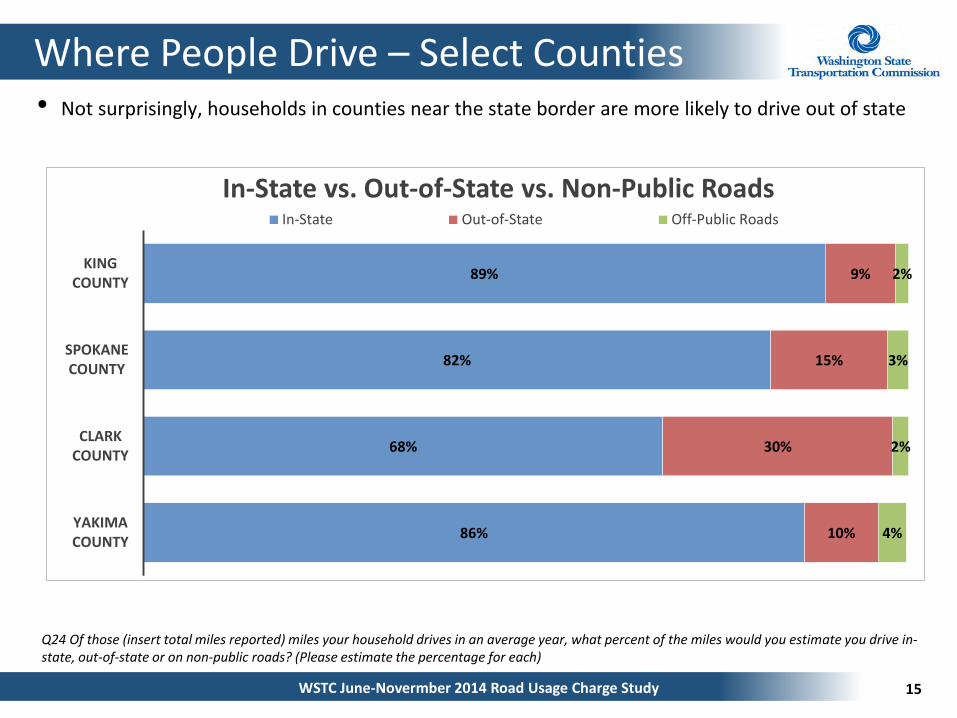
Where People Drive – Select Counties • Not surprisingly, households in counties near the state border are more likely to drive out of state
Q24 Of those (insert total miles reported) miles your household drives in an average year, what percent of the miles would you estimate you drive in-state, out-of-state or on non-public roads? (Please estimate the percentage for each)
89%
82%
68%
86%
9%
15%
30%
10%
2%
3%
2%
4%
KING COUNTY
SPOKANE COUNTY
CLARK COUNTY
YAKIMA COUNTY
In-State vs. Out-of-State vs. Non-Public Roads In-State Out-of-State Off-Public Roads
16 WSTC June-Novermber 2014 Road Usage Charge Study
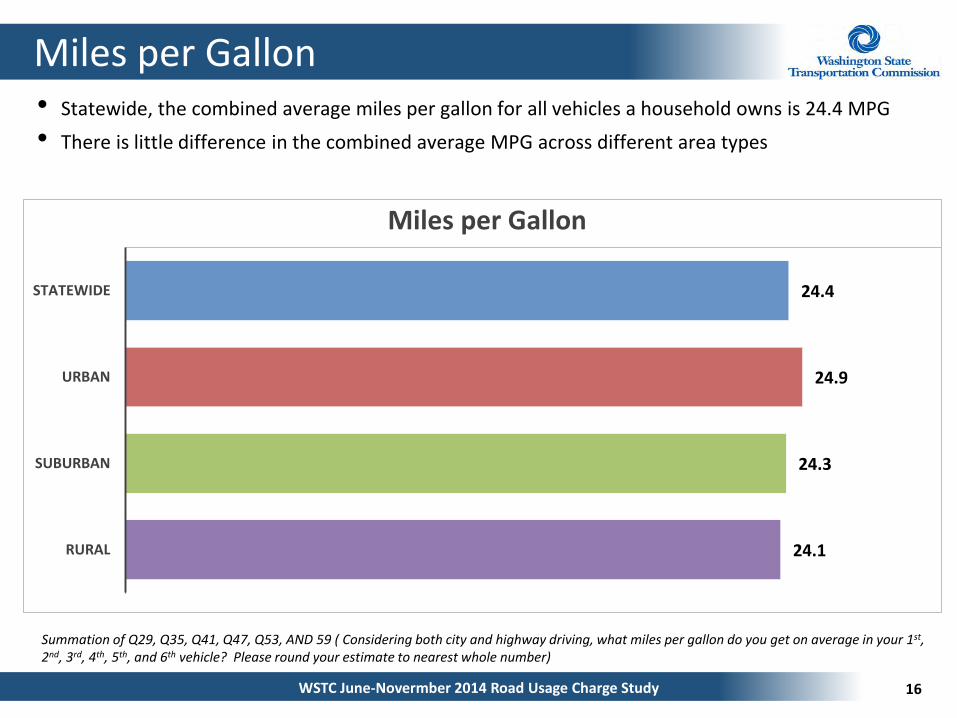
Miles per Gallon • Statewide, the combined average miles per gallon for all vehicles a household owns is 24.4 MPG
• There is little difference in the combined average MPG across different area types
Summation of Q29, Q35, Q41, Q47, Q53, AND 59 ( Considering both city and highway driving, what miles per gallon do you get on average in your 1st, 2nd, 3rd, 4th, 5th, and 6th vehicle? Please round your estimate to nearest whole number)
24.4
24.9
24.3
24.1
STATEWIDE
URBAN
SUBURBAN
RURAL
Miles per Gallon
17 WSTC June-Novermber 2014 Road Usage Charge Study
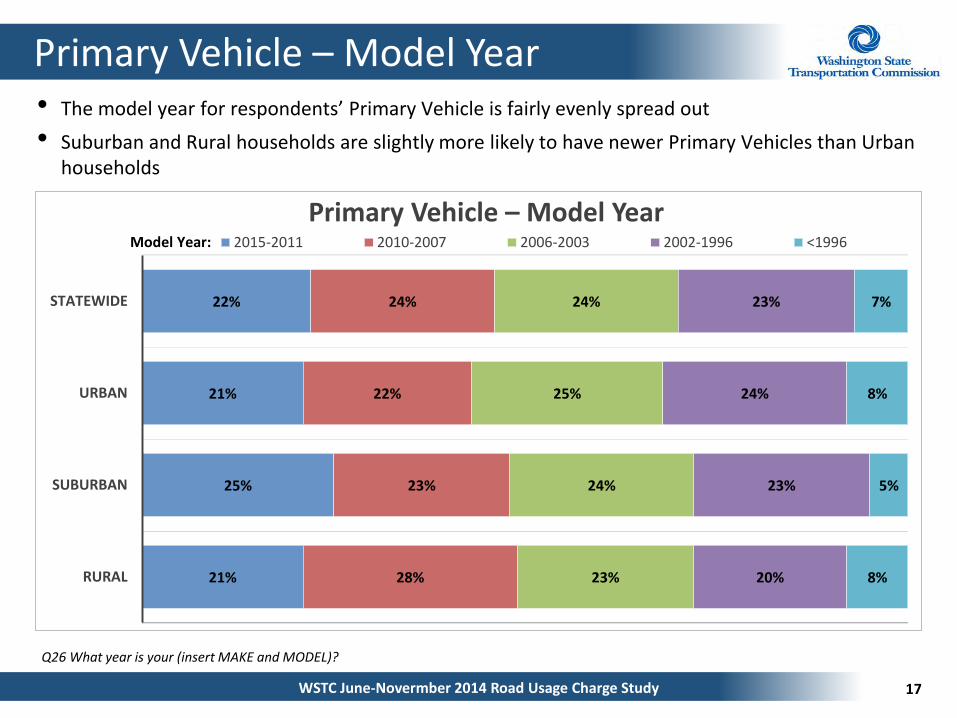
Primary Vehicle – Model Year • The model year for respondents’ Primary Vehicle is fairly evenly spread out
• Suburban and Rural households are slightly more likely to have newer Primary Vehicles than Urban households
Q26 What year is your (insert MAKE and MODEL)?
22%
21%
25%
21%
24%
22%
23%
28%
24%
25%
24%
23%
23%
24%
23%
20%
7%
8%
5%
8%
STATEWIDE
URBAN
SUBURBAN
RURAL
Primary Vehicle – Model Year 2015-2011 2010-2007 2006-2003 2002-1996 <1996Model Year:
18 WSTC June-Novermber 2014 Road Usage Charge Study
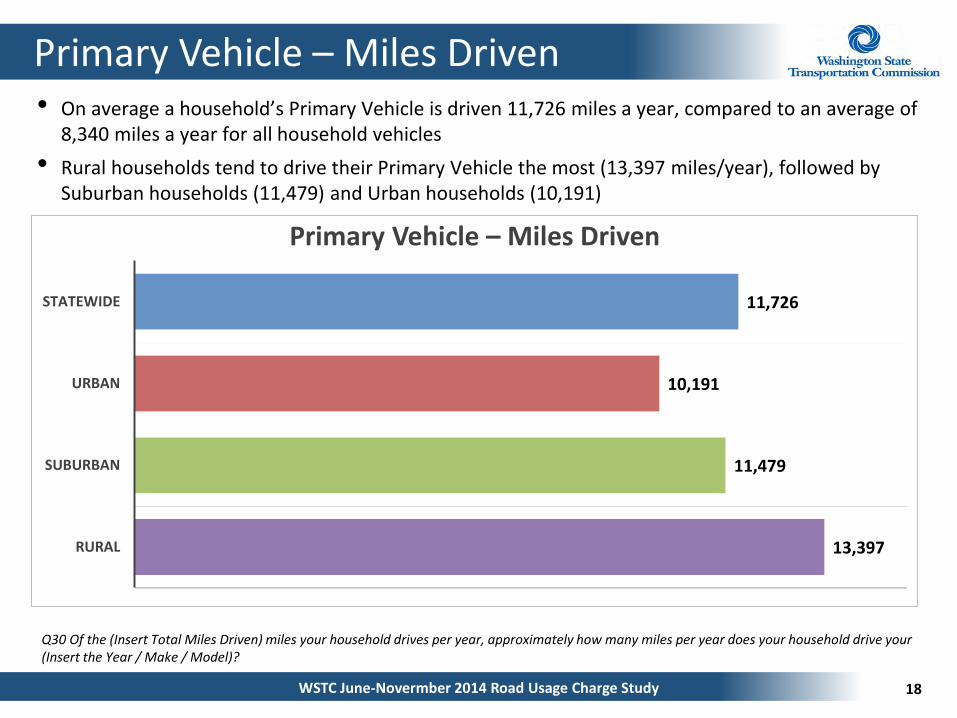
Primary Vehicle – Miles Driven • On average a household’s Primary Vehicle is driven 11,726 miles a year, compared to an average of
8,340 miles a year for all household vehicles
• Rural households tend to drive their Primary Vehicle the most (13,397 miles/year), followed by Suburban households (11,479) and Urban households (10,191)
Q30 Of the (Insert Total Miles Driven) miles your household drives per year, approximately how many miles per year does your household drive your (Insert the Year / Make / Model)?
11,726
10,191
11,479
13,397
STATEWIDE
URBAN
SUBURBAN
RURAL
Primary Vehicle – Miles Driven
19 WSTC June-Novermber 2014 Road Usage Charge Study
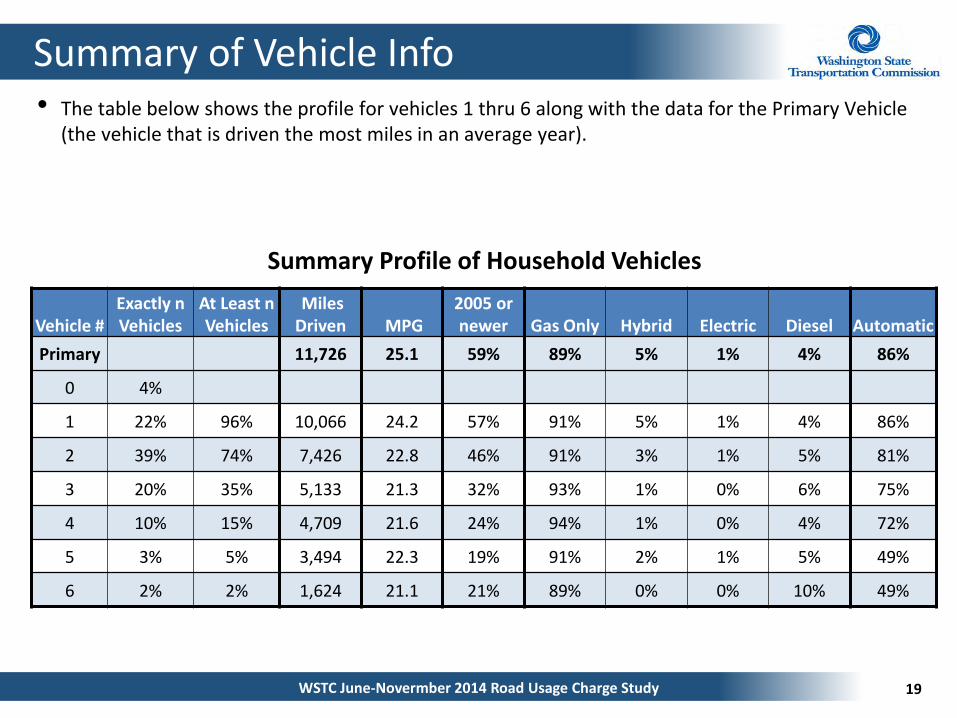
Summary of Vehicle Info • The table below shows the profile for vehicles 1 thru 6 along with the data for the Primary Vehicle
(the vehicle that is driven the most miles in an average year).
Summary Profile of Household Vehicles
Vehicle # Exactly n Vehicles
At Least n Vehicles
Miles Driven MPG
2005 or newer Gas Only Hybrid Electric Diesel Automatic
Primary 11,726 25.1 59% 89% 5% 1% 4% 86%
0 4%
1 22% 96% 10,066 24.2 57% 91% 5% 1% 4% 86%
2 39% 74% 7,426 22.8 46% 91% 3% 1% 5% 81%
3 20% 35% 5,133 21.3 32% 93% 1% 0% 6% 75%
4 10% 15% 4,709 21.6 24% 94% 1% 0% 4% 72%
5 3% 5% 3,494 22.3 19% 91% 2% 1% 5% 49%
6 2% 2% 1,624 21.1 21% 89% 0% 0% 10% 49%
20 WSTC June-Novermber 2014 Road Usage Charge Study
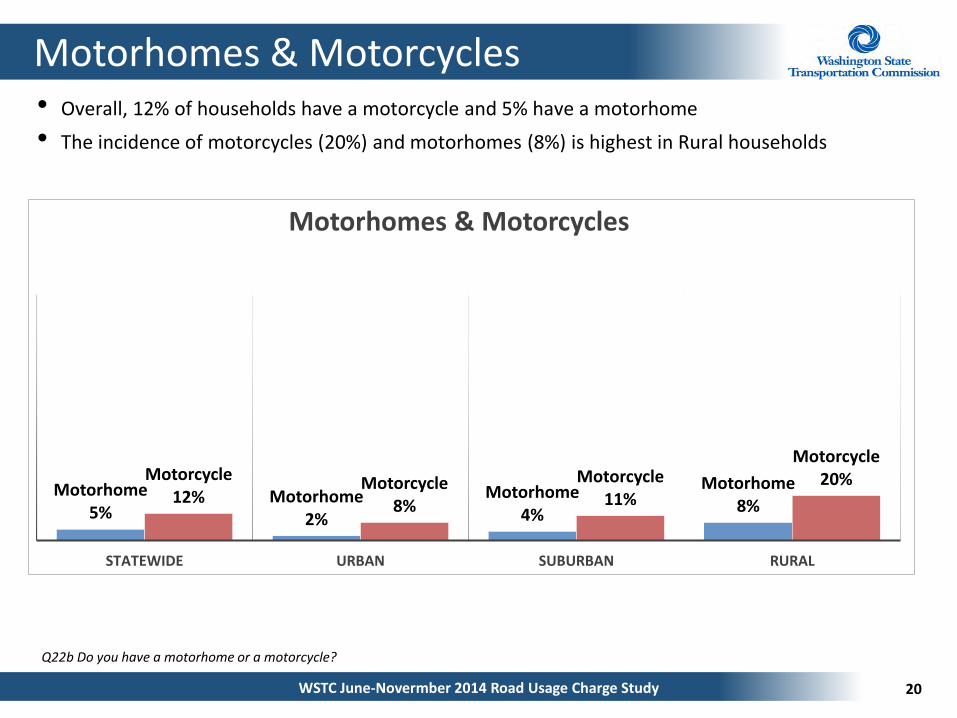
Motorhomes & Motorcycles • Overall, 12% of households have a motorcycle and 5% have a motorhome
• The incidence of motorcycles (20%) and motorhomes (8%) is highest in Rural households
Q22b Do you have a motorhome or a motorcycle?
Motorhome 5%
Motorhome 2%
Motorhome 4%
Motorhome 8%
Motorcycle 12%
Motorcycle 8%
Motorcycle 11%
Motorcycle 20%
STATEWIDE URBAN SUBURBAN RURAL
Motorhomes & Motorcycles
21 WSTC June-Novermber 2014 Road Usage Charge Study
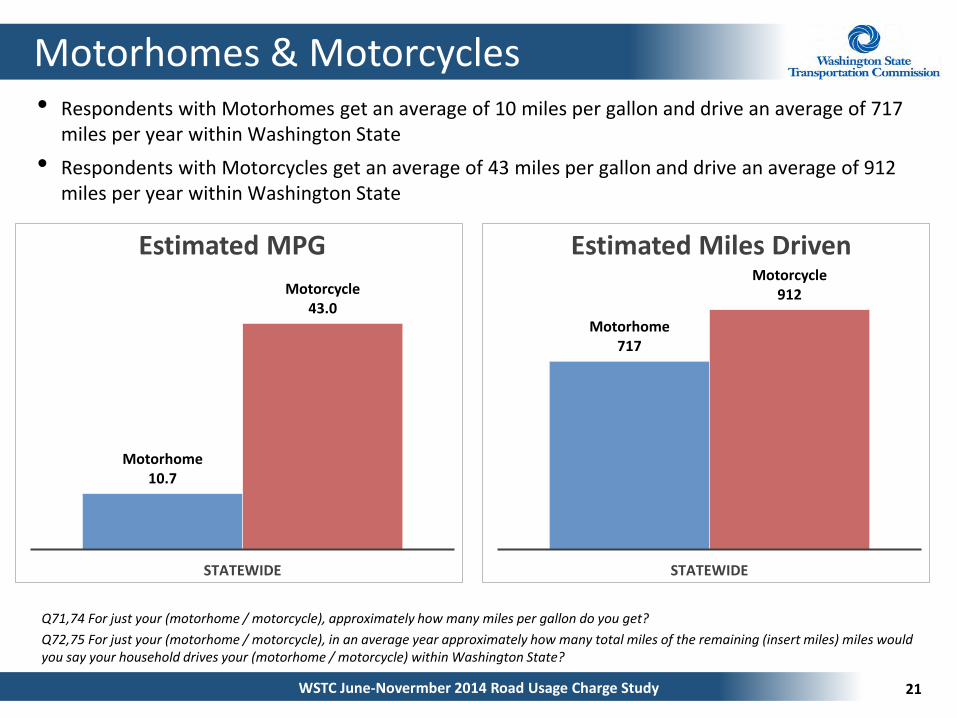
Motorhomes & Motorcycles • Respondents with Motorhomes get an average of 10 miles per gallon and drive an average of 717
miles per year within Washington State
• Respondents with Motorcycles get an average of 43 miles per gallon and drive an average of 912 miles per year within Washington State
Q71,74 For just your (motorhome / motorcycle), approximately how many miles per gallon do you get?
Q72,75 For just your (motorhome / motorcycle), in an average year approximately how many total miles of the remaining (insert miles) miles would you say your household drives your (motorhome / motorcycle) within Washington State?
Motorhome 10.7
Motorcycle 43.0
STATEWIDE
Estimated MPG
Motorhome 717
Motorcycle 912
STATEWIDE
Estimated Miles Driven
22 WSTC June-Novermber 2014 Road Usage Charge Study
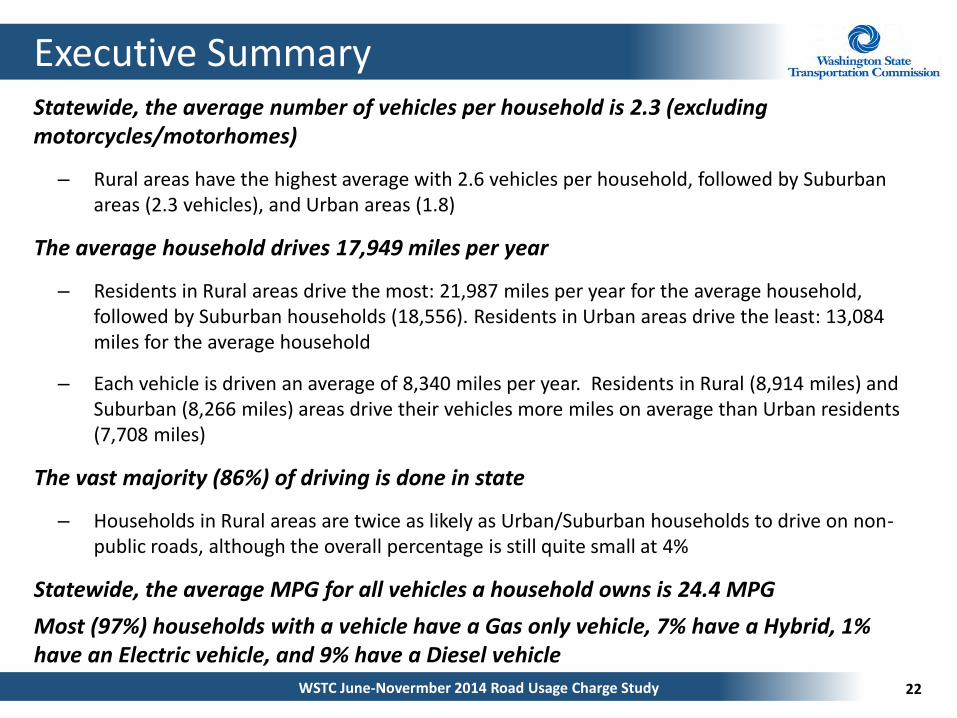
Executive Summary Statewide, the average number of vehicles per household is 2.3 (excluding motorcycles/motorhomes)
– Rural areas have the highest average with 2.6 vehicles per household, followed by Suburban areas (2.3 vehicles), and Urban areas (1.8)
The average household drives 17,949 miles per year
– Residents in Rural areas drive the most: 21,987 miles per year for the average household, followed by Suburban households (18,556). Residents in Urban areas drive the least: 13,084 miles for the average household
– Each vehicle is driven an average of 8,340 miles per year. Residents in Rural (8,914 miles) and Suburban (8,266 miles) areas drive their vehicles more miles on average than Urban residents (7,708 miles)
The vast majority (86%) of driving is done in state
– Households in Rural areas are twice as likely as Urban/Suburban households to drive on non-public roads, although the overall percentage is still quite small at 4%
Statewide, the average MPG for all vehicles a household owns is 24.4 MPG
Most (97%) households with a vehicle have a Gas only vehicle, 7% have a Hybrid, 1% have an Electric vehicle, and 9% have a Diesel vehicle
23 WSTC June-Novermber 2014 Road Usage Charge Study
THANK YOU! For More Information Contact:
Reema Griffith, WSTC Executive Director Bill Young, Survey Program Project Manager
360.705.7070
24 WSTC June-Novermber 2014 Road Usage Charge Study
Definitions
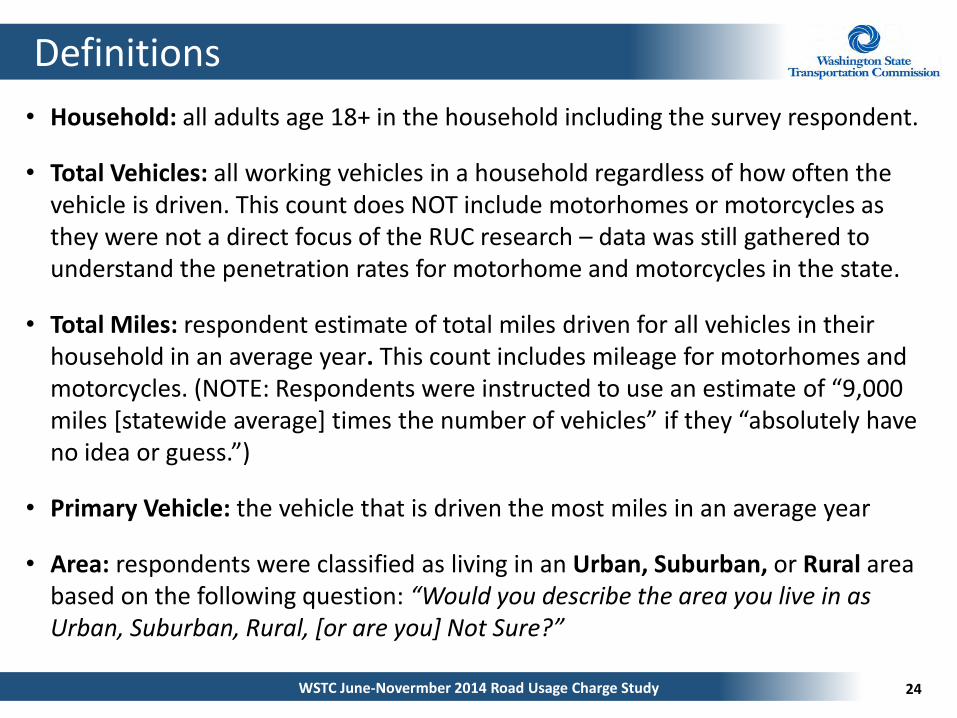
• Household: all adults age 18+ in the household including the survey respondent.
• Total Vehicles: all working vehicles in a household regardless of how often the vehicle is driven. This count does NOT include motorhomes or motorcycles as they were not a direct focus of the RUC research – data was still gathered to understand the penetration rates for motorhome and motorcycles in the state.
• Total Miles: respondent estimate of total miles driven for all vehicles in their household in an average year. This count includes mileage for motorhomes and motorcycles. (NOTE: Respondents were instructed to use an estimate of “9,000 miles [statewide average] times the number of vehicles” if they “absolutely have no idea or guess.”)
• Primary Vehicle: the vehicle that is driven the most miles in an average year
• Area: respondents were classified as living in an Urban, Suburban, or Rural area based on the following question: “Would you describe the area you live in as Urban, Suburban, Rural, [or are you] Not Sure?”