Embed Size (px)
Citation preview
Washington State Freight and
Goods Transportation System
(FGTS) 2015 Update
March 2016
Prepared by:
Freight Systems Division
Washington State Freight and
Goods Transportation System
(FGTS) 2015 Update
March 2016
2015 Update Team
Wenjuan Zhao WSDOT Freight Systems Division
Chris Herman WSDOT Freight Systems Division
Mark Bozanich WSDOT Transportation Data & GIS Offi ce
John Anderson WSDOT Transportation Data & GIS Offi ce
Dave Bushnell WSDOT Transportation Data & GIS Offi ce
Ed Spilker WSDOT Local Programs
Dave Catterson Association of Washington Cities
Don Zimmer County Road Administration Board
Prepared by:
Washington State Department of Transportation
Freight Systems Division
Washington State Freight and Goods Transportation System 2015 Update | March 2016 i
FGTS 2015 Update - Table of Contents
FGTS 2015 Update Executive Summary ...................................................................... iii
Introduction .....................................................................................................................1
The FGTS Tonnage Classifi cation System ...................................................................1
Data Source and Methodology .....................................................................................2
State Highway Data ..............................................................................................................2
Data Source ................................................................................................................................ 2
Truck Tonnage Estimation Methodology .............................................................................. 3
County Road Data ................................................................................................................4
City Street Data ....................................................................................................................4
Railroad Data ........................................................................................................................5
Waterway Data .....................................................................................................................5
Results and Findings of the FGTS 2015 Update ..........................................................6
State Highway ......................................................................................................................6
County Road and City Street................................................................................................7
Railroad ................................................................................................................................7
Waterway ..............................................................................................................................9
Data Limitations and Recommendations .....................................................................9
Washington State Freight and Goods Transportation System 2015 Update | March 2016ii
Appendices
Appendix A: Maps of FGTS 2015 Update T-1 and T-2 Routes ...................................................12
Appendix B: Maps of 2013 to 2015 FGTS State Route T-1 and T-2 Changes ............................14
Appendix C: Map of FGTS 2015 Strategic Rail Corridors ...........................................................16
Appendix D: Map of FGTS 2015 All Freight Railroads in Washington State ...............................17
Appendix E: Map of FGTS 2015 Strategic Waterway Corridors .................................................18
Appendix F: Map of FGTS 2015 Freight Waterway Corridors .....................................................19
Appendix G: 2015 FGTS State Route T-1 and T-2, Sorted by State Route ................................20
Appendix H: 2015 FGTS State Route T-1 and T-2, Sorted by County ........................................30
Appendix I: FGTS State Route T-1 and T-2 Changes, 2013 to 2015 ..........................................38
Appendix J: 2015 FGTS County Road T-1 and T-2 Classifi cation ..............................................40
Appendix K: FGTS County Road T-1 and T-2 Changes, 2013 to 2015 .......................................47
Appendix L: 2015 FGTS City Street T-1 and T-2 Classifi cations .................................................53
Appendix M: FGTS City Street T-1 and T-2 Changes, 2013 to 2015 ..........................................64
Appendix N: Request to Cities for FGTS Data ............................................................................70
Appendix O: Instructions for FGTS Truck Tonnage Estimation ...................................................72
Appendix P: Assumptions Made When Interpreting the Data .....................................................74
Appendices
Washington State Freight and Goods Transportation System 2015 Update | March 2016 iii
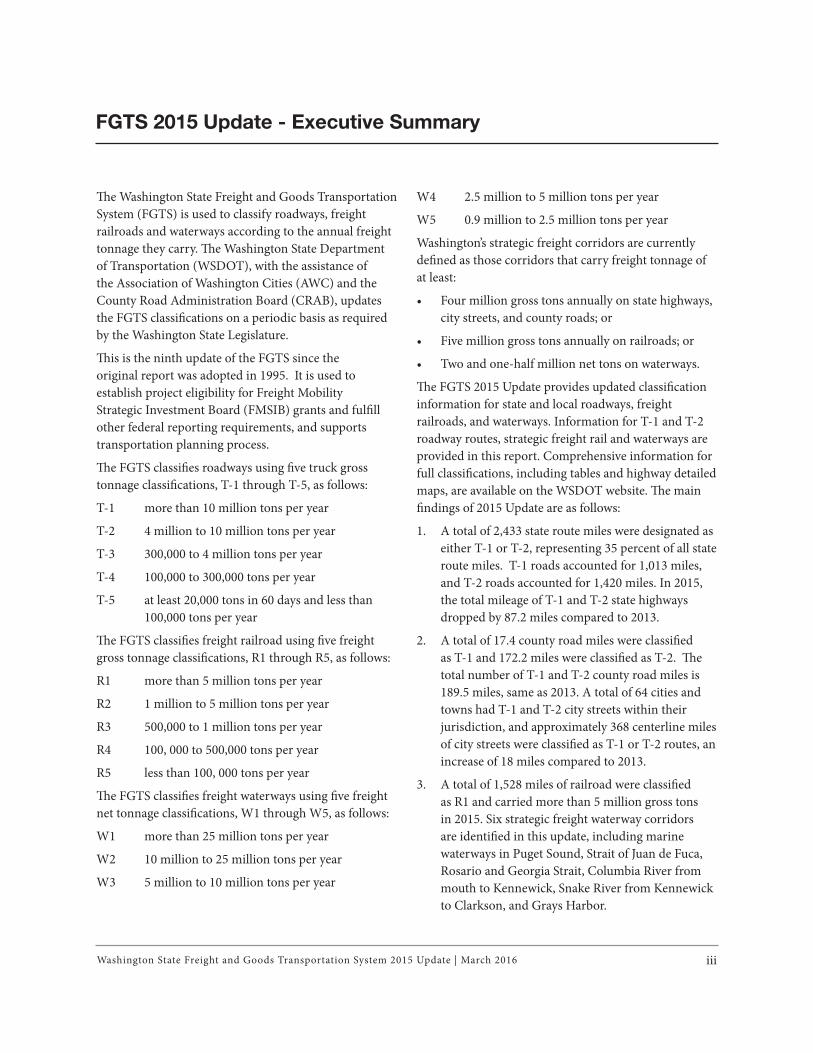
FGTS 2015 Update - Executive Summary
Th e Washington State Freight and Goods Transportation
System (FGTS) is used to classify roadways, freight
railroads and waterways according to the annual freight
tonnage they carry. Th e Washington State Department
of Transportation (WSDOT), with the assistance of
the Association of Washington Cities (AWC) and the
County Road Administration Board (CRAB), updates
the FGTS classifi cations on a periodic basis as required
by the Washington State Legislature.
Th is is the ninth update of the FGTS since the
original report was adopted in 1995. It is used to
establish project eligibility for Freight Mobility
Strategic Investment Board (FMSIB) grants and fulfi ll
other federal reporting requirements, and supports
transportation planning process.
Th e FGTS classifi es roadways using fi ve truck gross
tonnage classifi cations, T-1 through T-5, as follows:
T-1 more than 10 million tons per year
T-2 4 million to 10 million tons per year
T-3 300,000 to 4 million tons per year
T-4 100,000 to 300,000 tons per year
T-5 at least 20,000 tons in 60 days and less than
100,000 tons per year
Th e FGTS classifi es freight railroad using fi ve freight
gross tonnage classifi cations, R1 through R5, as follows:
R1 more than 5 million tons per year
R2 1 million to 5 million tons per year
R3 500,000 to 1 million tons per year
R4 100, 000 to 500,000 tons per year
R5 less than 100, 000 tons per year
Th e FGTS classifi es freight waterways using fi ve freight
net tonnage classifi cations, W1 through W5, as follows:
W1 more than 25 million tons per year
W2 10 million to 25 million tons per year
W3 5 million to 10 million tons per year
W4 2.5 million to 5 million tons per year
W5 0.9 million to 2.5 million tons per year
Washington’s strategic freight corridors are currently
defi ned as those corridors that carry freight tonnage of
at least:
• Four million gross tons annually on state highways,
city streets, and county roads; or
• Five million gross tons annually on railroads; or
• Two and one-half million net tons on waterways.
Th e FGTS 2015 Update provides updated classifi cation
information for state and local roadways, freight
railroads, and waterways. Information for T-1 and T-2
roadway routes, strategic freight rail and waterways are
provided in this report. Comprehensive information for
full classifi cations, including tables and highway detailed
maps, are available on the WSDOT website. Th e main
fi ndings of 2015 Update are as follows:
1. A total of 2,433 state route miles were designated as
either T-1 or T-2, representing 35 percent of all state
route miles. T-1 roads accounted for 1,013 miles,
and T-2 roads accounted for 1,420 miles. In 2015,
the total mileage of T-1 and T-2 state highways
dropped by 87.2 miles compared to 2013.
2. A total of 17.4 county road miles were classifi ed
as T-1 and 172.2 miles were classifi ed as T-2. Th e
total number of T-1 and T-2 county road miles is
189.5 miles, same as 2013. A total of 64 cities and
towns had T-1 and T-2 city streets within their
jurisdiction, and approximately 368 centerline miles
of city streets were classifi ed as T-1 or T-2 routes, an
increase of 18 miles compared to 2013.
3. A total of 1,528 miles of railroad were classifi ed
as R1 and carried more than 5 million gross tons
in 2015. Six strategic freight waterway corridors
are identifi ed in this update, including marine
waterways in Puget Sound, Strait of Juan de Fuca,
Rosario and Georgia Strait, Columbia River from
mouth to Kennewick, Snake River from Kennewick
to Clarkson, and Grays Harbor.
Washington State Freight and Goods Transportation System 2015 Update | March 2016iv
Th e FGTS provides practical and useful information
from available data sources, but it has limitations that
must be considered when using the data. Th e annual
tons of freight carried are estimated from truck traffi c
count data, which must also be estimated when actual
classifi cation counts are not available. WSDOT is aware
that freight tonnage data is not suffi cient to present a
comprehensive view of the state’s freight system. Th e
designation of Washington State Freight Economic
Corridors and other freight data collection eff orts
expand this analysis and can be accessed through the
WSDOT Freight Systems Division at
www.wsdot.wa.gov/freight.
Washington State Freight and Goods Transportation System 2015 Update | March 2016 1
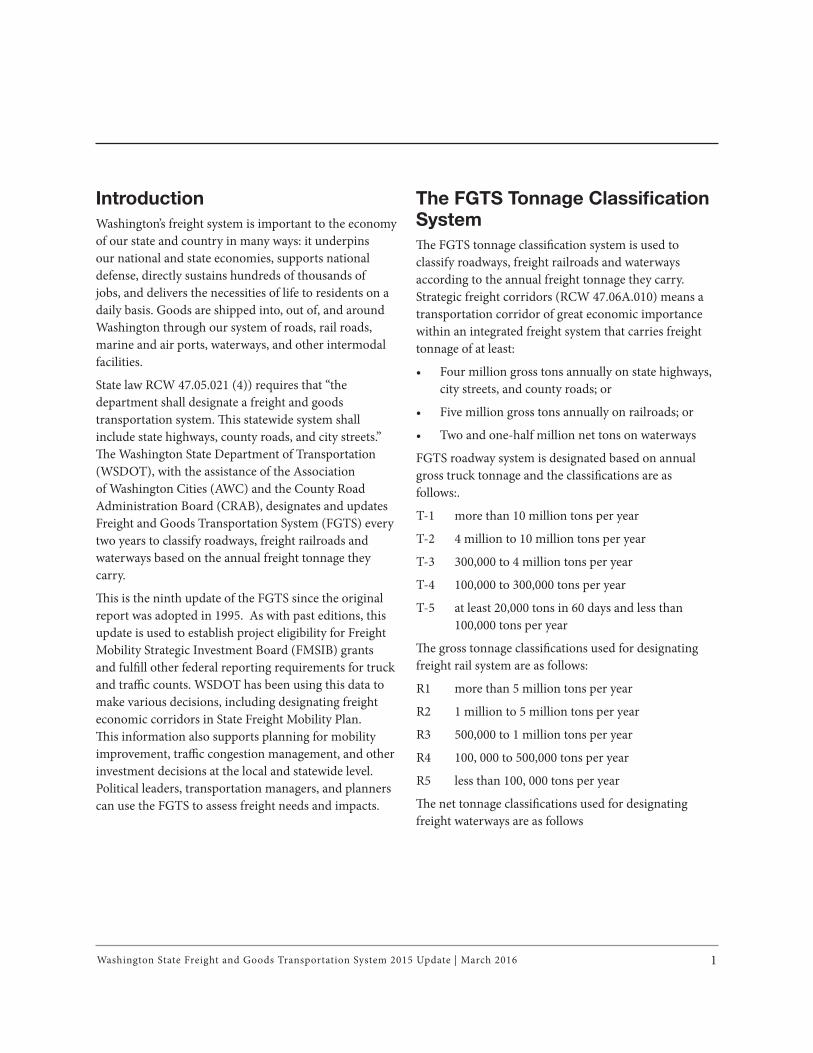
Introduction
Washington’s freight system is important to the economy
of our state and country in many ways: it underpins
our national and state economies, supports national
defense, directly sustains hundreds of thousands of
jobs, and delivers the necessities of life to residents on a
daily basis. Goods are shipped into, out of, and around
Washington through our system of roads, rail roads,
marine and air ports, waterways, and other intermodal
facilities.
State law RCW 47.05.021 (4)) requires that “the
department shall designate a freight and goods
transportation system. Th is statewide system shall
include state highways, county roads, and city streets.”
Th e Washington State Department of Transportation
(WSDOT), with the assistance of the Association
of Washington Cities (AWC) and the County Road
Administration Board (CRAB), designates and updates
Freight and Goods Transportation System (FGTS) every
two years to classify roadways, freight railroads and
waterways based on the annual freight tonnage they
carry.
Th is is the ninth update of the FGTS since the original
report was adopted in 1995. As with past editions, this
update is used to establish project eligibility for Freight
Mobility Strategic Investment Board (FMSIB) grants
and fulfi ll other federal reporting requirements for truck
and traffi c counts. WSDOT has been using this data to
make various decisions, including designating freight
economic corridors in State Freight Mobility Plan.
Th is information also supports planning for mobility
improvement, traffi c congestion management, and other
investment decisions at the local and statewide level.
Political leaders, transportation managers, and planners
can use the FGTS to assess freight needs and impacts.
The FGTS Tonnage Classifi cation System
Th e FGTS tonnage classifi cation system is used to
classify roadways, freight railroads and waterways
according to the annual freight tonnage they carry.
Strategic freight corridors (RCW 47.06A.010) means a
transportation corridor of great economic importance
within an integrated freight system that carries freight
tonnage of at least:
• Four million gross tons annually on state highways,
city streets, and county roads; or
• Five million gross tons annually on railroads; or
• Two and one-half million net tons on waterways
FGTS roadway system is designated based on annual
gross truck tonnage and the classifi cations are as
follows:.
T-1 more than 10 million tons per year
T-2 4 million to 10 million tons per year
T-3 300,000 to 4 million tons per year
T-4 100,000 to 300,000 tons per year
T-5 at least 20,000 tons in 60 days and less than
100,000 tons per year
Th e gross tonnage classifi cations used for designating
freight rail system are as follows:
R1 more than 5 million tons per year
R2 1 million to 5 million tons per year
R3 500,000 to 1 million tons per year
R4 100, 000 to 500,000 tons per year
R5 less than 100, 000 tons per year
Th e net tonnage classifi cations used for designating
freight waterways are as follows
Washington State Freight and Goods Transportation System 2015 Update | March 20162
W1 more than 25 million tons per year
W2 10 million to 25 million tons per year
W3 5 million to 10 million tons per year
W4 2.5 million to 5 million tons per year
W5 0.9 million to 2.5 million tons per year
Data Source and Methodology
State Highway Data
Data Source
Th e WSDOT Transportation Data & GIS Offi ce (TDGO)
provides truck and tonnage information that is used to
classify segments of the State highways for the FGTS
2015 update. And Washington State Ferries provides
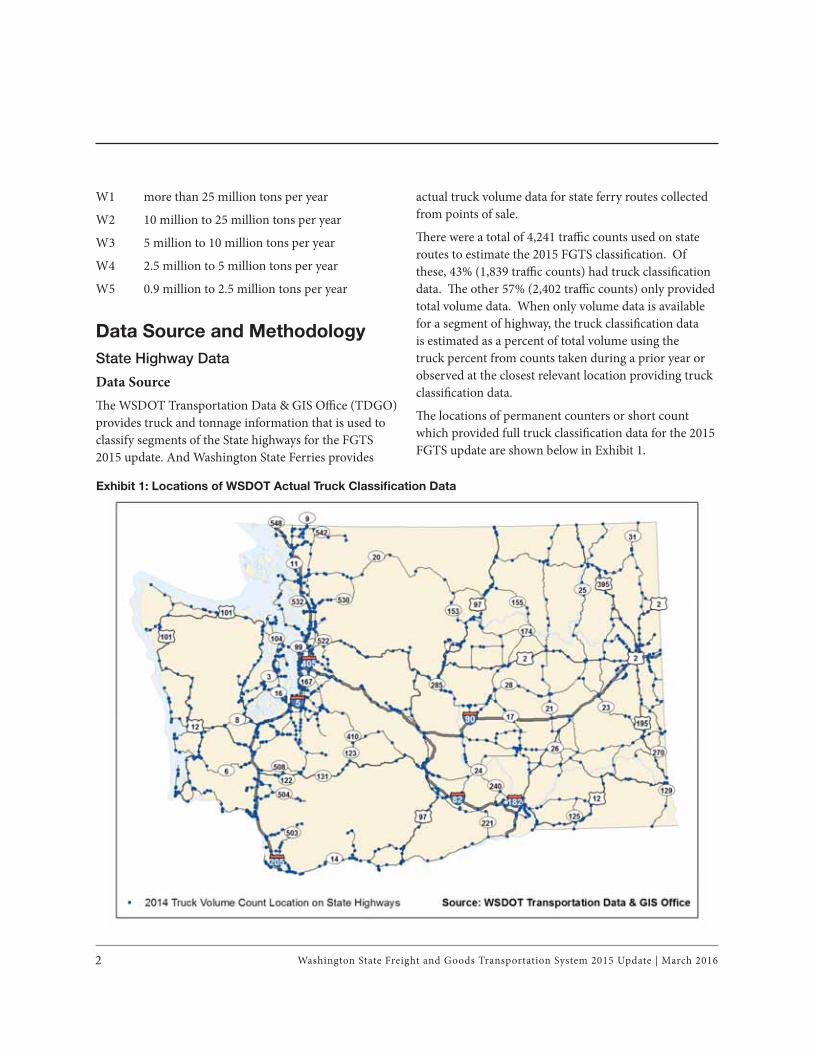
Exhibit 1: Locations of WSDOT Actual Truck Classifi cation Data
actual truck volume data for state ferry routes collected
from points of sale.
Th ere were a total of 4,241 traffi c counts used on state
routes to estimate the 2015 FGTS classifi cation. Of
these, 43% (1,839 traffi c counts) had truck classifi cation
data. Th e other 57% (2,402 traffi c counts) only provided
total volume data. When only volume data is available
for a segment of highway, the truck classifi cation data
is estimated as a percent of total volume using the
truck percent from counts taken during a prior year or
observed at the closest relevant location providing truck
classifi cation data.
Th e locations of permanent counters or short count
which provided full truck classifi cation data for the 2015
FGTS update are shown below in Exhibit 1.
Washington State Freight and Goods Transportation System 2015 Update | March 2016 3
Truck Tonnage Estimation Methodology
WSDOT methodology, described in Appendix O, was
used to convert traffi c count data to average gross annual
tons. Th e annual truck tonnage for a specifi c route is
estimated using the average annual daily traffi c (AADT),
truck percentage, truck type, average truck type tonnage,
and working days per year. In some locations, where
there is not a classifi cation counter or other appropriate
technology, truck volume is estimated based on the truck
percentage data obtained from adjacent classifi cation
counters.
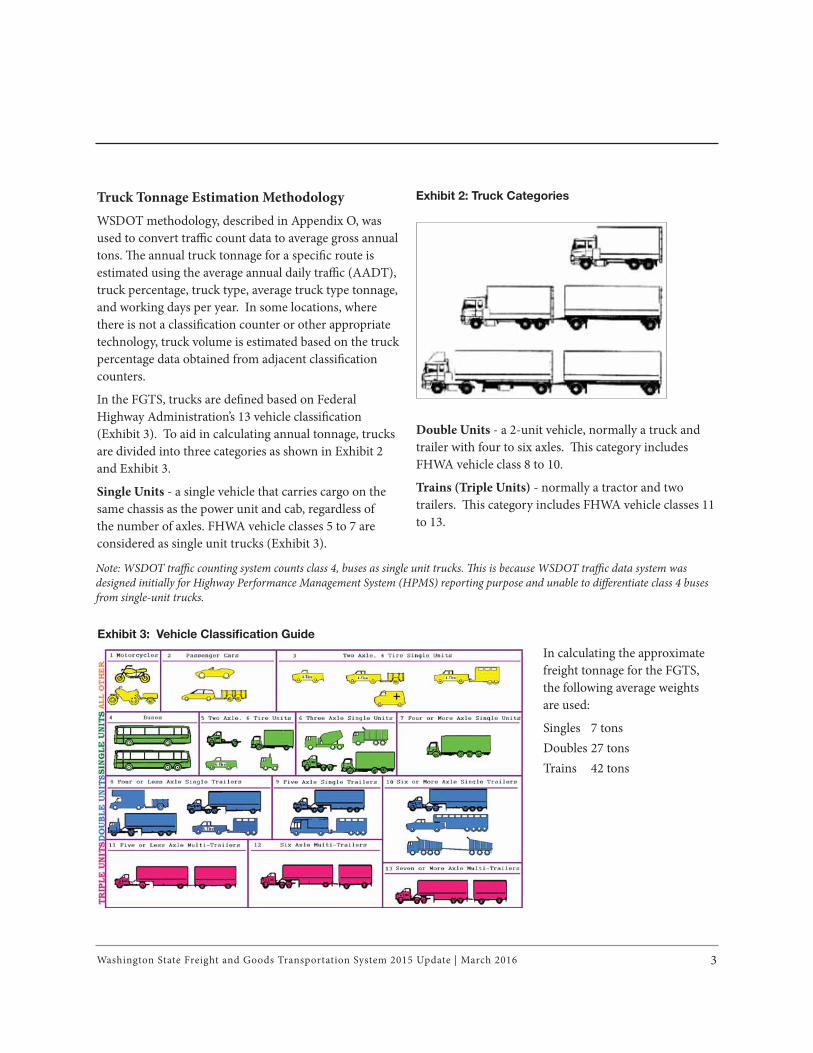
In the FGTS, trucks are defi ned based on Federal
Highway Administration’s 13 vehicle classifi cation
(Exhibit 3). To aid in calculating annual tonnage, trucks
are divided into three categories as shown in Exhibit 2
and Exhibit 3.
Single Units - a single vehicle that carries cargo on the
same chassis as the power unit and cab, regardless of
the number of axles. FHWA vehicle classes 5 to 7 are
considered as single unit trucks (Exhibit 3).
Exhibit 2: Truck Categories
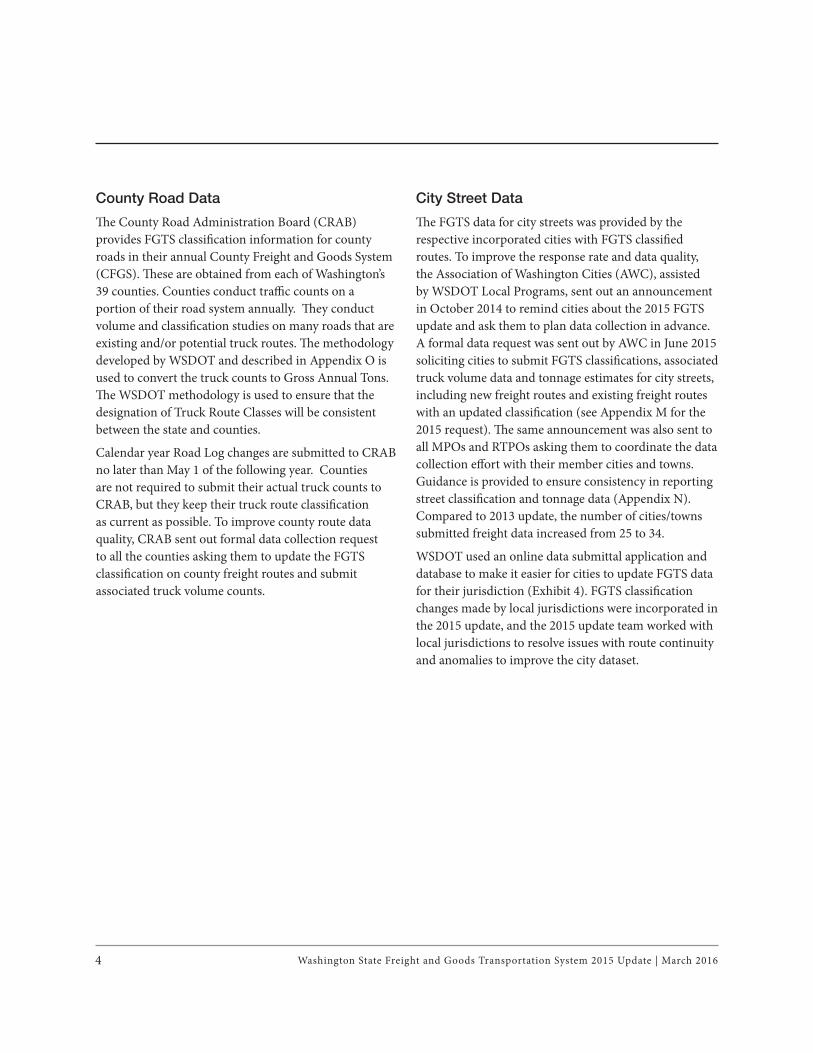
Exhibit 3: Vehicle Classifi cation Guide
In calculating the approximate
freight tonnage for the FGTS,
the following average weights
are used:
Singles 7 tons
Doubles 27 tons
Trains 42 tons
Double Units - a 2-unit vehicle, normally a truck and
trailer with four to six axles. Th is category includes
FHWA vehicle class 8 to 10.
Trains (Triple Units) - normally a tractor and two
trailers. Th is category includes FHWA vehicle classes 11
to 13.
Note: WSDOT traffi c counting system counts class 4, buses as single unit trucks. Th is is because WSDOT traffi c data system was
designed initially for Highway Performance Management System (HPMS) reporting purpose and unable to diff erentiate class 4 buses
from single-unit trucks.
Washington State Freight and Goods Transportation System 2015 Update | March 20164
County Road Data
Th e County Road Administration Board (CRAB)
provides FGTS classifi cation information for county
roads in their annual County Freight and Goods System
(CFGS). Th ese are obtained from each of Washington’s
39 counties. Counties conduct traffi c counts on a
portion of their road system annually. Th ey conduct
volume and classifi cation studies on many roads that are
existing and/or potential truck routes. Th e methodology
developed by WSDOT and described in Appendix O is
used to convert the truck counts to Gross Annual Tons.
Th e WSDOT methodology is used to ensure that the
designation of Truck Route Classes will be consistent
between the state and counties.
Calendar year Road Log changes are submitted to CRAB
no later than May 1 of the following year. Counties
are not required to submit their actual truck counts to
CRAB, but they keep their truck route classifi cation
as current as possible. To improve county route data
quality, CRAB sent out formal data collection request
to all the counties asking them to update the FGTS
classifi cation on county freight routes and submit
associated truck volume counts.
City Street Data
Th e FGTS data for city streets was provided by the
respective incorporated cities with FGTS classifi ed
routes. To improve the response rate and data quality,
the Association of Washington Cities (AWC), assisted
by WSDOT Local Programs, sent out an announcement
in October 2014 to remind cities about the 2015 FGTS
update and ask them to plan data collection in advance.
A formal data request was sent out by AWC in June 2015
soliciting cities to submit FGTS classifi cations, associated
truck volume data and tonnage estimates for city streets,
including new freight routes and existing freight routes
with an updated classifi cation (see Appendix M for the
2015 request). Th e same announcement was also sent to
all MPOs and RTPOs asking them to coordinate the data
collection eff ort with their member cities and towns.
Guidance is provided to ensure consistency in reporting
street classifi cation and tonnage data (Appendix N).
Compared to 2013 update, the number of cities/towns
submitted freight data increased from 25 to 34.
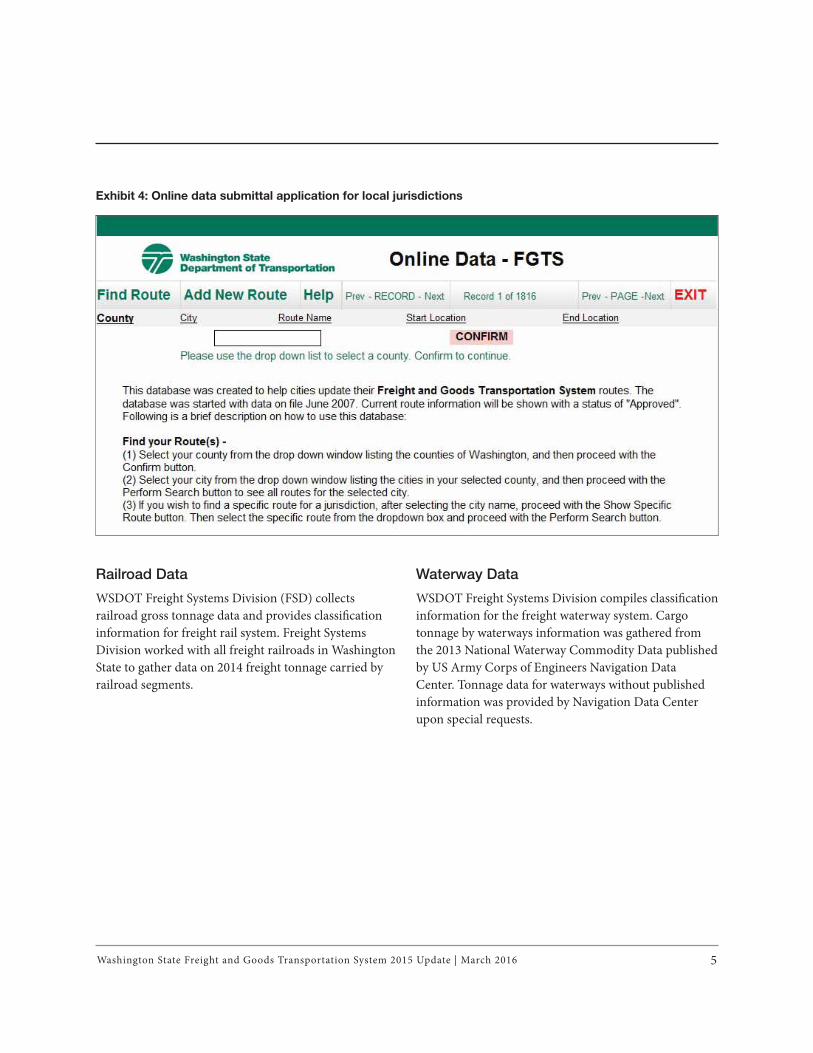
WSDOT used an online data submittal application and
database to make it easier for cities to update FGTS data
for their jurisdiction (Exhibit 4). FGTS classifi cation
changes made by local jurisdictions were incorporated in
the 2015 update, and the 2015 update team worked with
local jurisdictions to resolve issues with route continuity
and anomalies to improve the city dataset.
Washington State Freight and Goods Transportation System 2015 Update | March 2016 5
Exhibit 4: Online data submittal application for local jurisdictions
Railroad Data
WSDOT Freight Systems Division (FSD) collects
railroad gross tonnage data and provides classifi cation
information for freight rail system. Freight Systems
Division worked with all freight railroads in Washington
State to gather data on 2014 freight tonnage carried by
railroad segments.
Waterway Data
WSDOT Freight Systems Division compiles classifi cation
information for the freight waterway system. Cargo
tonnage by waterways information was gathered from
the 2013 National Waterway Commodity Data published
by US Army Corps of Engineers Navigation Data
Center. Tonnage data for waterways without published
information was provided by Navigation Data Center
upon special requests.
Washington State Freight and Goods Transportation System 2015 Update | March 20166
Results and Findings of the FGTS 2015
Update
Th e FGTS 2015 Update provides updated classifi cation
information for T 1 through T-5 roadways at the state,
county, and city levels, R1 through R5 freight railroads,
and W1 through W5 waterways. Classifi cations were
reviewed and validated by the 2015 FGTS Update team
as described in Appendix P. Information, tables, and
maps for T-1 and T-2 roadway routes, strategic freight
rail and waterways are provided in this report.
Highly detailed maps, displaying all T-1 through T-5
routes, are available on the WSDOT website. Th e
website includes:
• Th e FGTS 2015 Update Report with T-1 and T-2
tables and maps, strategic freight rail and waterway
maps
• Highly detailed maps at the county, urban area, and
city level of T-1 through T-5 roadway classifi cations
• Detailed data tables of 2015 FGTS classifi cations
State Highway
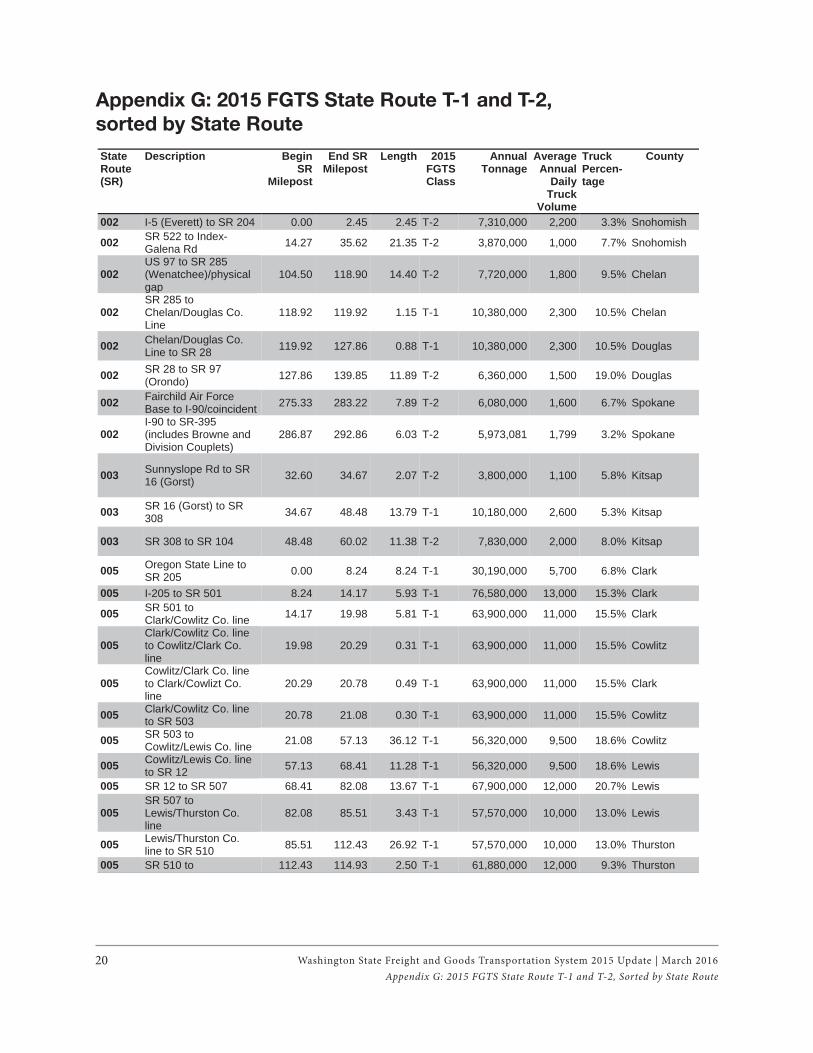
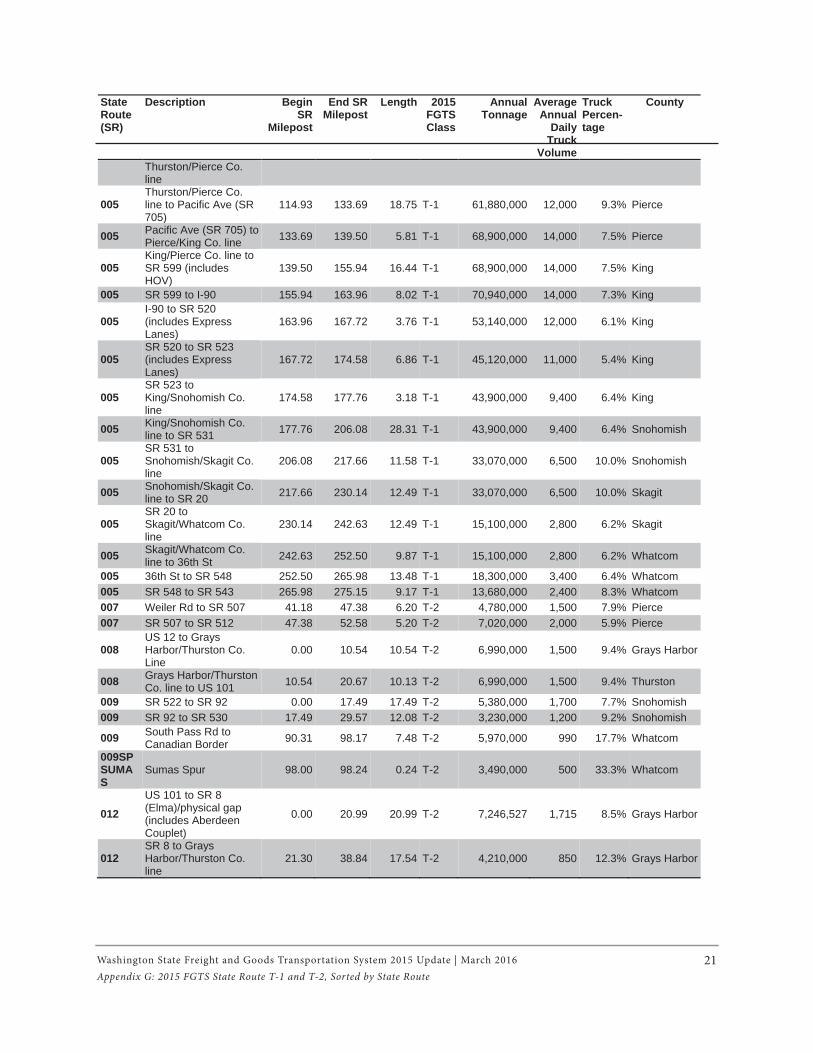
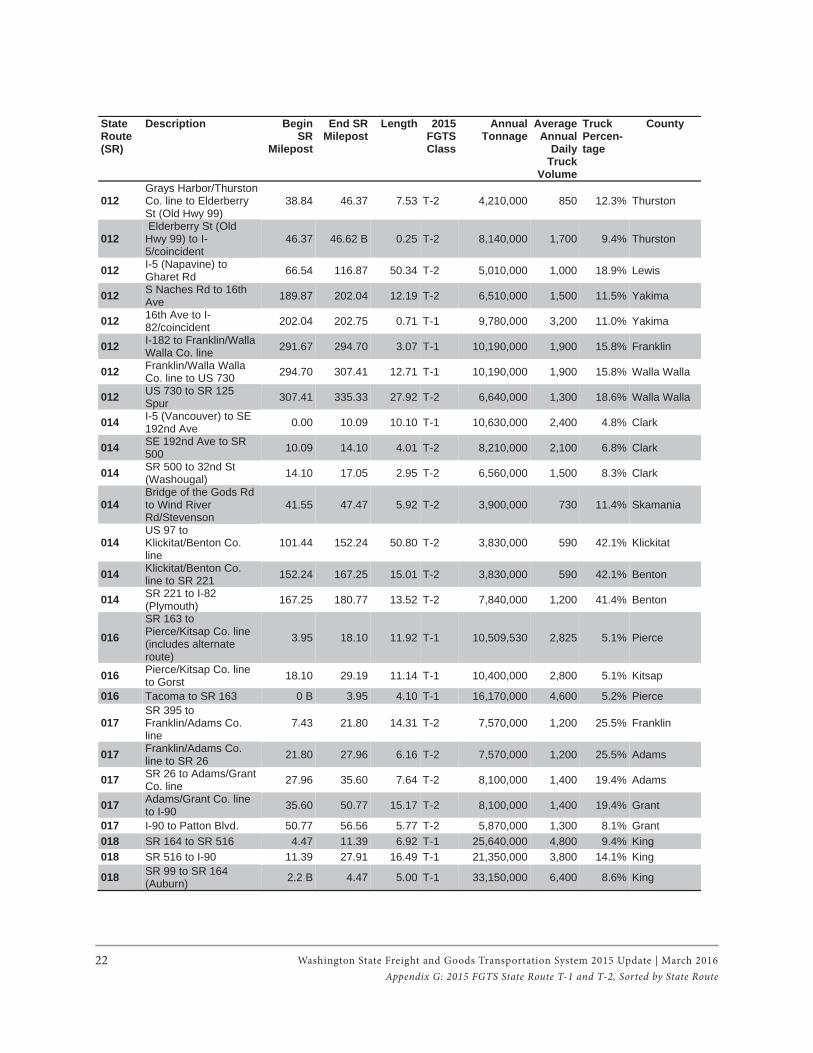
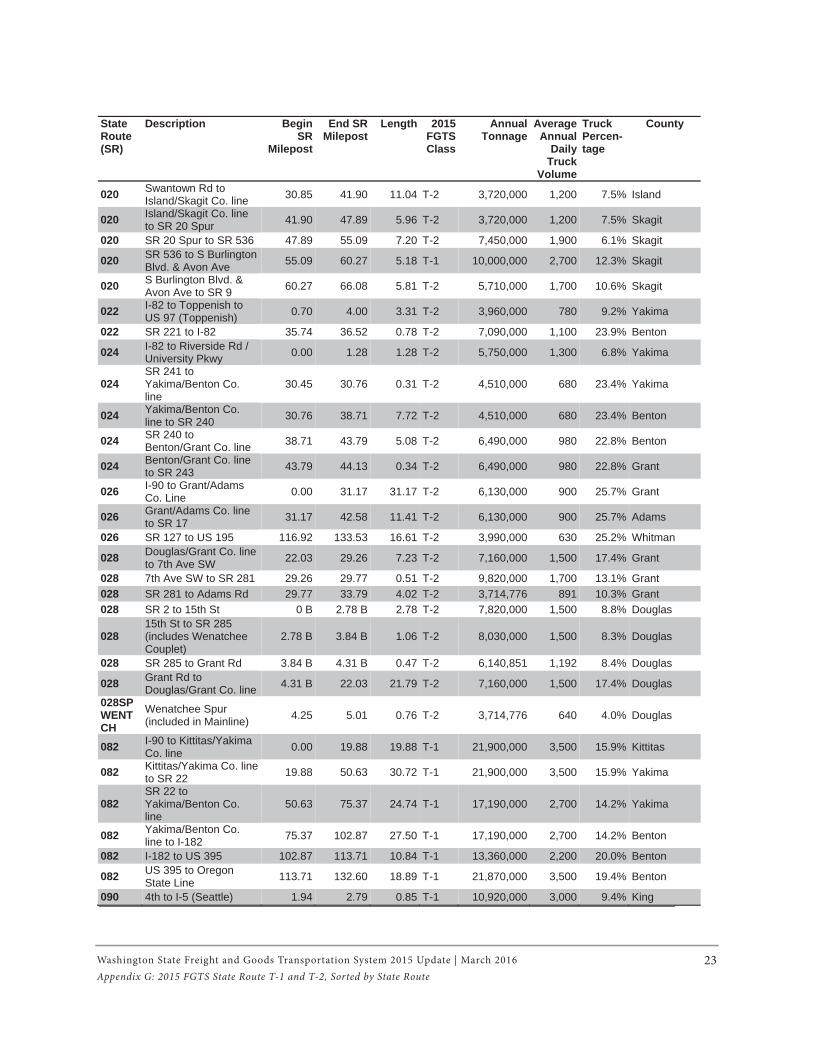
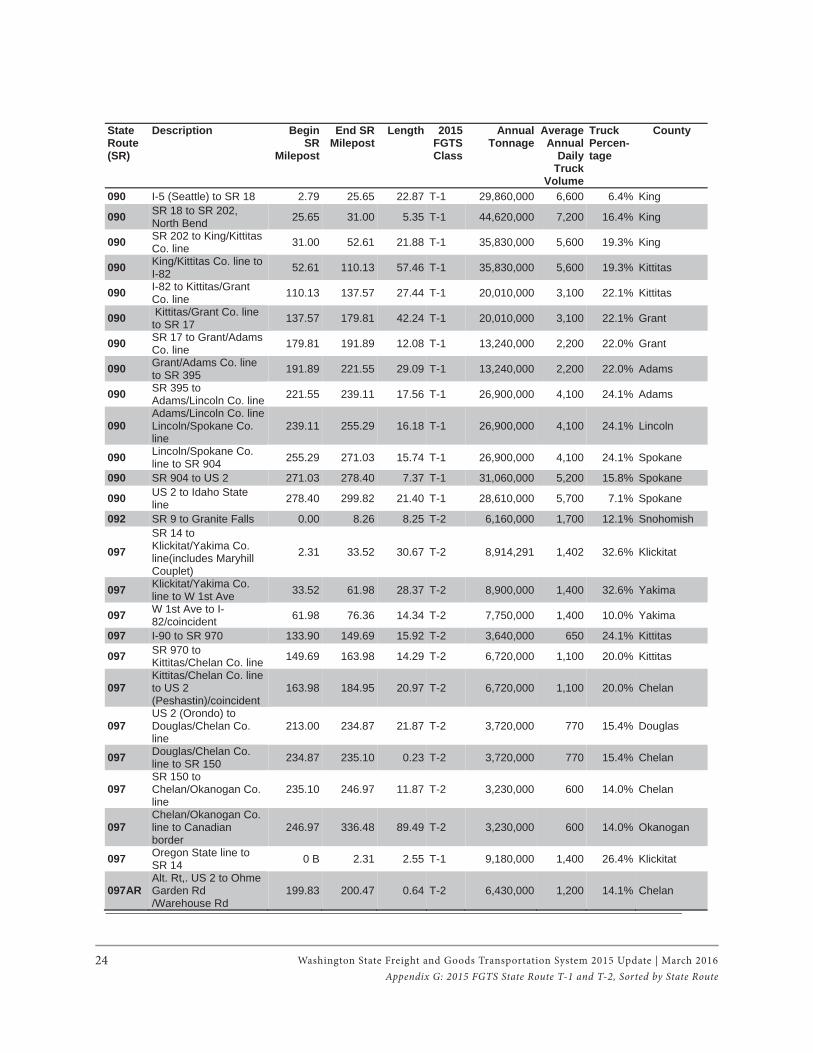
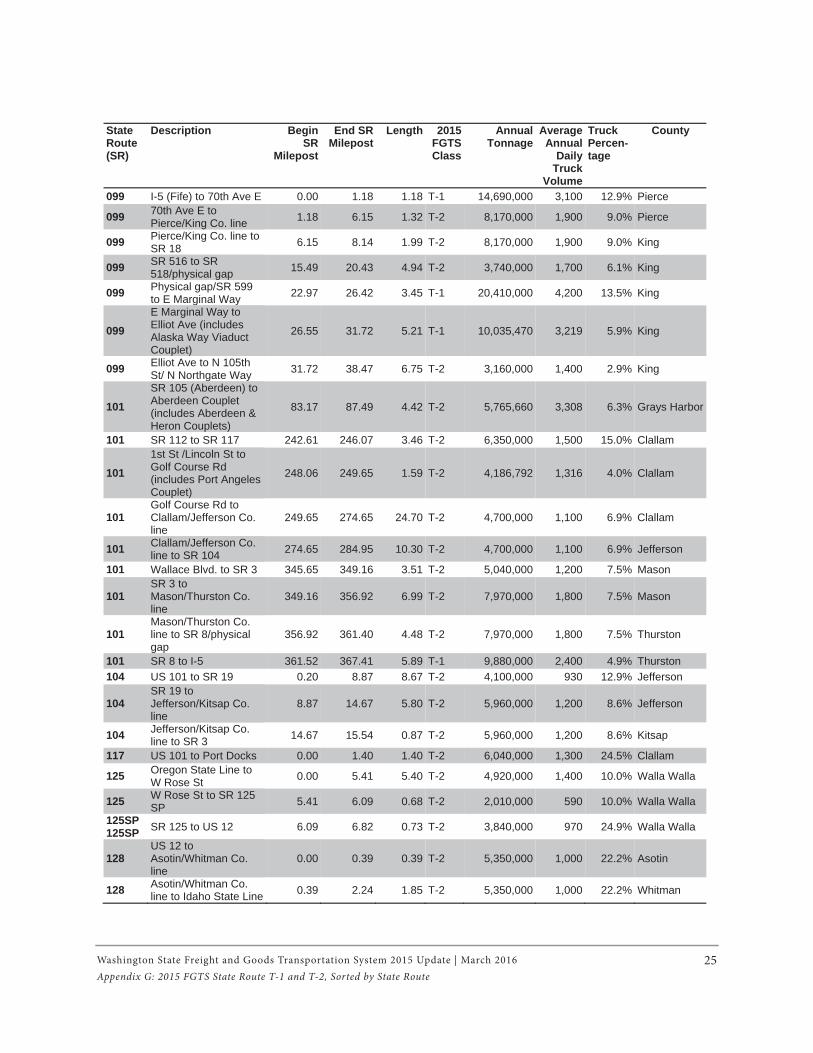
Th e 2015 FGTS tabular data for T-1 and T-2 state routes
is presented in Appendix G and Appendix H. Th e
data is listed in order by state route (SR) in Appendix
G and by county in Appendix H. Th ese tables include
the milepost, estimated annual truck tonnage, average
annual daily truck volume, truck percentage, and FGTS
classifi cation information for each highway segment.
Please note that the average annual daily truck volume
may use classifi cation data from multiple sources
(permanent traffi c recorder, short duration tube count,
or manual count) and is the weighted average volume
based on the traffi c data collected at multiple locations
along the roadway section. For some roadway segments
without classifi cation counts, truck classifi cation data
was spread from counts taken during a prior year or
nearby location.
In 2015, a total of 2,433 state route miles were designated
as either T-1 or T-2, representing 34.5 percent of all state
route miles. T-1 roads accounted for 1,013 miles, 14.4
percent of all state route miles, and T-2 roads accounted
for 1,420 miles, 20.1 percent of all state route miles.
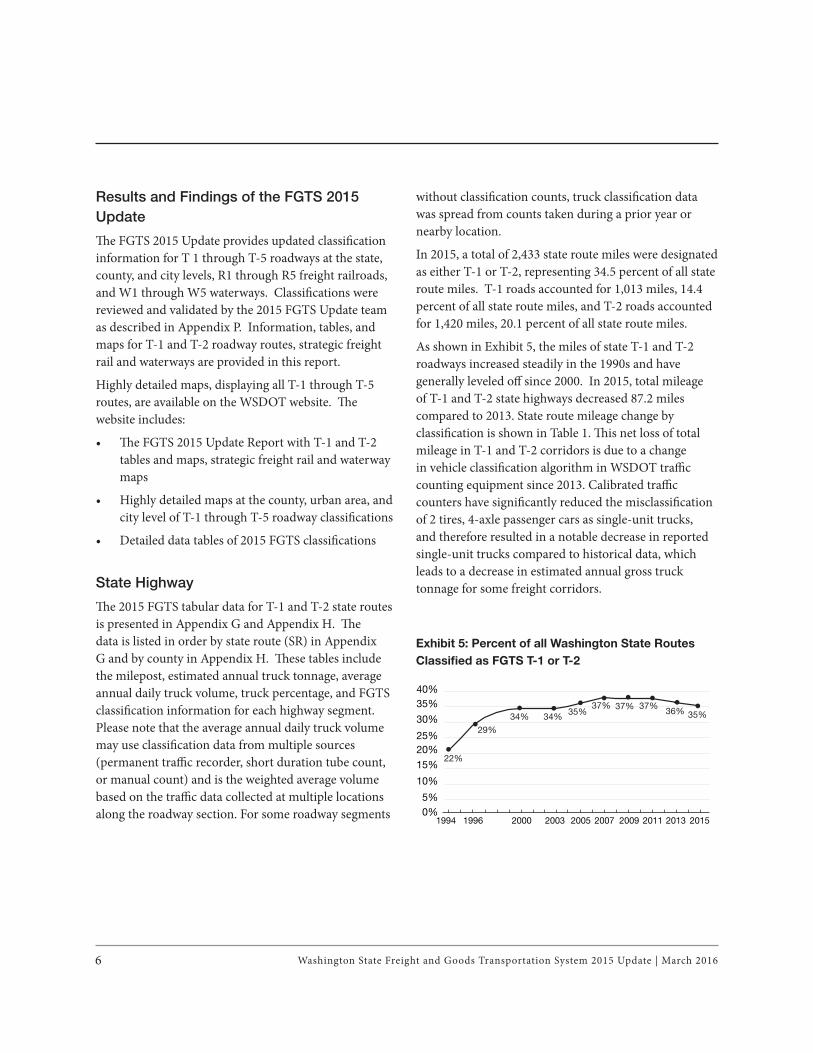
As shown in Exhibit 5, the miles of state T-1 and T-2
roadways increased steadily in the 1990s and have
generally leveled off since 2000. In 2015, total mileage
of T-1 and T-2 state highways decreased 87.2 miles
compared to 2013. State route mileage change by
classifi cation is shown in Table 1. Th is net loss of total
mileage in T-1 and T-2 corridors is due to a change
in vehicle classifi cation algorithm in WSDOT traffi c
counting equipment since 2013. Calibrated traffi c
counters have signifi cantly reduced the misclassifi cation
of 2 tires, 4-axle passenger cars as single-unit trucks,
and therefore resulted in a notable decrease in reported
single-unit trucks compared to historical data, which
leads to a decrease in estimated annual gross truck
tonnage for some freight corridors.
Exhibit 5: Percent of all Washington State Routes
Classifi ed as FGTS T-1 or T-2
5%
10%
15%
20%25%
30%
35%40%
0%1994 1996 2000 2003 2005 2007 2009 2011 2013 2015
37% 37%37%35%34%34%
29%
22%
36% 35%
Washington State Freight and Goods Transportation System 2015 Update | March 2016 7
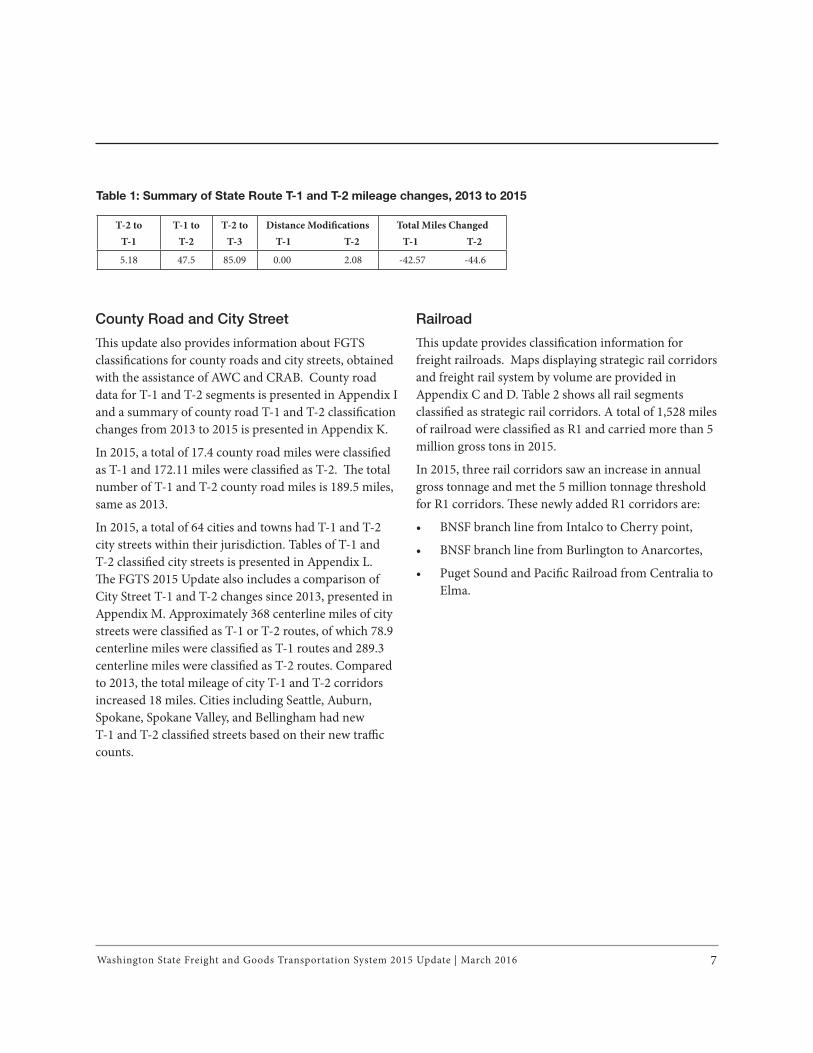
Table 1: Summary of State Route T-1 and T-2 mileage changes, 2013 to 2015
T-2 to
T-1
T-1 to
T-2
T-2 to
T-3
Distance Modifi cations
T-1 T-2
Total Miles Changed
T-1 T-2
5.18 47.5 85.09 0.00 2.08 -42.57 -44.6
County Road and City Street
Th is update also provides information about FGTS
classifi cations for county roads and city streets, obtained
with the assistance of AWC and CRAB. County road
data for T-1 and T-2 segments is presented in Appendix I
and a summary of county road T-1 and T-2 classifi cation
changes from 2013 to 2015 is presented in Appendix K.
In 2015, a total of 17.4 county road miles were classifi ed
as T-1 and 172.11 miles were classifi ed as T-2. Th e total
number of T-1 and T-2 county road miles is 189.5 miles,
same as 2013.
In 2015, a total of 64 cities and towns had T-1 and T-2
city streets within their jurisdiction. Tables of T-1 and
T-2 classifi ed city streets is presented in Appendix L.
Th e FGTS 2015 Update also includes a comparison of
City Street T-1 and T-2 changes since 2013, presented in
Appendix M. Approximately 368 centerline miles of city
streets were classifi ed as T-1 or T-2 routes, of which 78.9
centerline miles were classifi ed as T-1 routes and 289.3
centerline miles were classifi ed as T-2 routes. Compared
to 2013, the total mileage of city T-1 and T-2 corridors
increased 18 miles. Cities including Seattle, Auburn,
Spokane, Spokane Valley, and Bellingham had new
T-1 and T-2 classifi ed streets based on their new traffi c
counts.
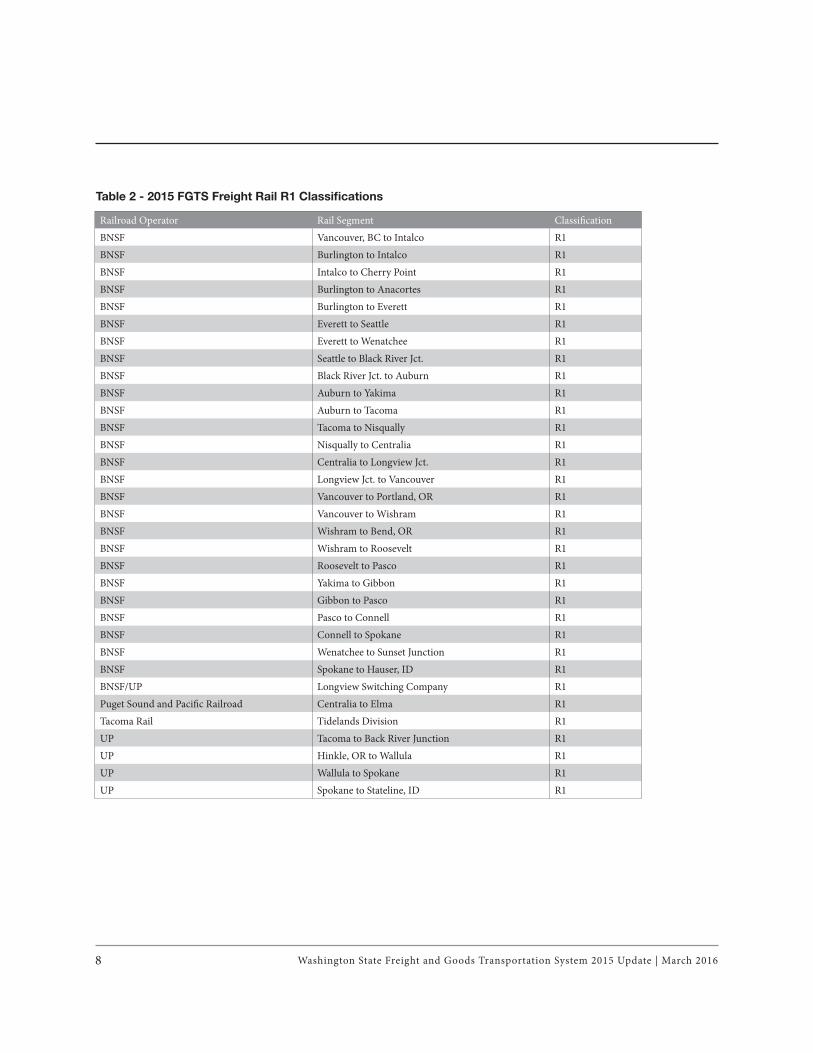
Railroad
Th is update provides classifi cation information for
freight railroads. Maps displaying strategic rail corridors
and freight rail system by volume are provided in
Appendix C and D. Table 2 shows all rail segments
classifi ed as strategic rail corridors. A total of 1,528 miles
of railroad were classifi ed as R1 and carried more than 5
million gross tons in 2015.
In 2015, three rail corridors saw an increase in annual
gross tonnage and met the 5 million tonnage threshold
for R1 corridors. Th ese newly added R1 corridors are:
• BNSF branch line from Intalco to Cherry point,
• BNSF branch line from Burlington to Anarcortes,
• Puget Sound and Pacifi c Railroad from Centralia to
Elma.
Washington State Freight and Goods Transportation System 2015 Update | March 20168
Table 2 - 2015 FGTS Freight Rail R1 Classifi cations
Railroad Operator Rail Segment Classifi cation
BNSF Vancouver, BC to Intalco R1
BNSF Burlington to Intalco R1
BNSF Intalco to Cherry Point R1
BNSF Burlington to Anacortes R1
BNSF Burlington to Everett R1
BNSF Everett to Seattle R1
BNSF Everett to Wenatchee R1
BNSF Seattle to Black River Jct. R1
BNSF Black River Jct. to Auburn R1
BNSF Auburn to Yakima R1
BNSF Auburn to Tacoma R1
BNSF Tacoma to Nisqually R1
BNSF Nisqually to Centralia R1
BNSF Centralia to Longview Jct. R1
BNSF Longview Jct. to Vancouver R1
BNSF Vancouver to Portland, OR R1
BNSF Vancouver to Wishram R1
BNSF Wishram to Bend, OR R1
BNSF Wishram to Roosevelt R1
BNSF Roosevelt to Pasco R1
BNSF Yakima to Gibbon R1
BNSF Gibbon to Pasco R1
BNSF Pasco to Connell R1
BNSF Connell to Spokane R1
BNSF Wenatchee to Sunset Junction R1
BNSF Spokane to Hauser, ID R1
BNSF/UP Longview Switching Company R1
Puget Sound and Pacifi c Railroad Centralia to Elma R1
Tacoma Rail Tidelands Division R1
UP Tacoma to Back River Junction R1
UP Hinkle, OR to Wallula R1
UP Wallula to Spokane R1
UP Spokane to Stateline, ID R1
Washington State Freight and Goods Transportation System 2015 Update | March 2016 9
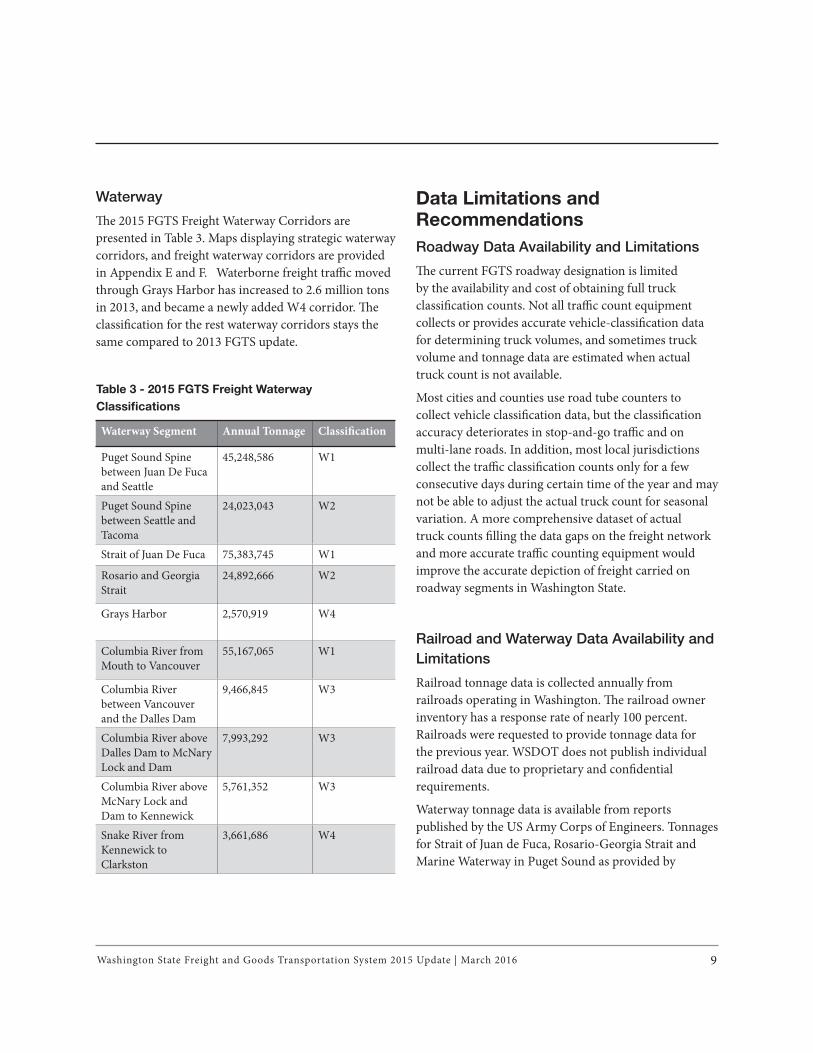
Waterway
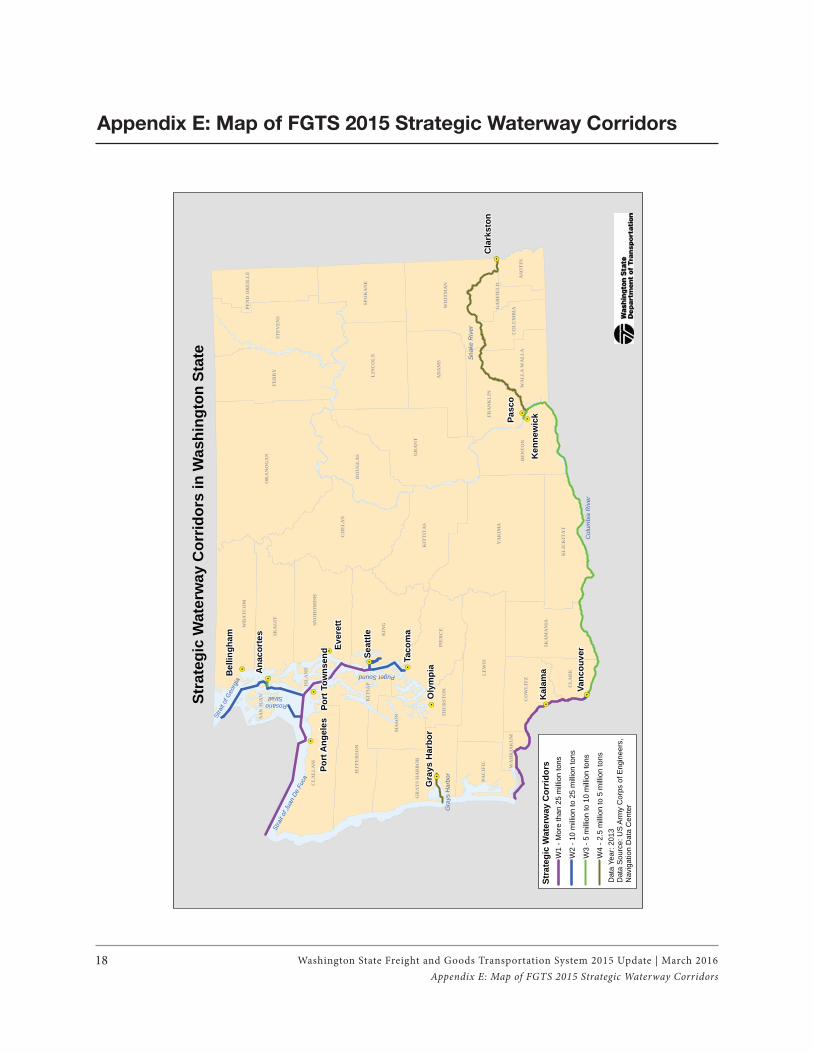
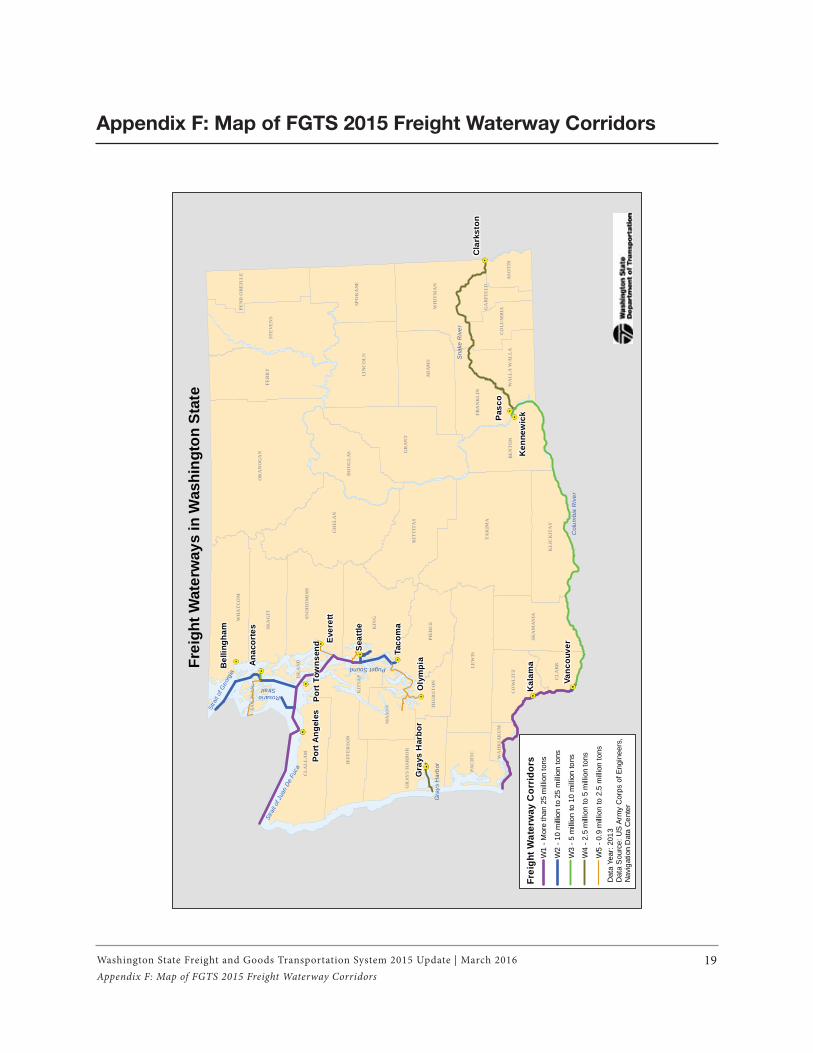
Th e 2015 FGTS Freight Waterway Corridors are
presented in Table 3. Maps displaying strategic waterway
corridors, and freight waterway corridors are provided
in Appendix E and F. Waterborne freight traffi c moved
through Grays Harbor has increased to 2.6 million tons
in 2013, and became a newly added W4 corridor. Th e
classifi cation for the rest waterway corridors stays the
same compared to 2013 FGTS update.
Data Limitations and Recommendations
Roadway Data Availability and Limitations
Th e current FGTS roadway designation is limited
by the availability and cost of obtaining full truck
classifi cation counts. Not all traffi c count equipment
collects or provides accurate vehicle-classifi cation data
for determining truck volumes, and sometimes truck
volume and tonnage data are estimated when actual
truck count is not available.
Most cities and counties use road tube counters to
collect vehicle classifi cation data, but the classifi cation
accuracy deteriorates in stop-and-go traffi c and on
multi-lane roads. In addition, most local jurisdictions
collect the traffi c classifi cation counts only for a few
consecutive days during certain time of the year and may
not be able to adjust the actual truck count for seasonal
variation. A more comprehensive dataset of actual
truck counts fi lling the data gaps on the freight network
and more accurate traffi c counting equipment would
improve the accurate depiction of freight carried on
roadway segments in Washington State.
Railroad and Waterway Data Availability and
Limitations
Railroad tonnage data is collected annually from
railroads operating in Washington. Th e railroad owner
inventory has a response rate of nearly 100 percent.
Railroads were requested to provide tonnage data for
the previous year. WSDOT does not publish individual
railroad data due to proprietary and confi dential
requirements.
Waterway tonnage data is available from reports
published by the US Army Corps of Engineers. Tonnages
for Strait of Juan de Fuca, Rosario-Georgia Strait and
Marine Waterway in Puget Sound as provided by
Table 3 - 2015 FGTS Freight Waterway
Classifi cations
Waterway Segment Annual Tonnage Classifi cation
Puget Sound Spine
between Juan De Fuca
and Seattle
45,248,586 W1
Puget Sound Spine
between Seattle and
Tacoma
24,023,043 W2
Strait of Juan De Fuca 75,383,745 W1
Rosario and Georgia
Strait
24,892,666 W2
Grays Harbor 2,570,919 W4
Columbia River from
Mouth to Vancouver
55,167,065 W1
Columbia River
between Vancouver
and the Dalles Dam
9,466,845 W3
Columbia River above
Dalles Dam to McNary
Lock and Dam
7,993,292 W3
Columbia River above
McNary Lock and
Dam to Kennewick
5,761,352 W3
Snake River from
Kennewick to
Clarkston
3,661,686 W4
Washington State Freight and Goods Transportation System 2015 Update | March 201610
the Corps upon special request are not subject to the
rigorous data validation required for published reports.
Availability of waterway data is lagged by two years with
2013 data being the most recent available at 2015.
Additional Analysis Needed to Fully
Understand Freight System
While the use of freight tonnage data provides some
practical and useful information, when used without
additional data sources it presents a somewhat limited
view of overall freight movement. For example, it does
not provide information on users of the system, which
freight facilities or major freight-intensive land uses the
corridors serve, what commodities are moved through
the system and their origins/destinations, and the
economic importance of the corridors.
WSDOT has been able to consider those factors through
the development of Washington State Freight Economic
Corridors. In that eff ort WSDOT has identifi ed high-
volume freight corridors and the fi rst/last mile connector
routes connecting freight-intensive land uses to the
backbone freight system. Detailed freight economic
corridor maps can be viewed on WSDOT website at:
http://www.wsdot.wa.gov/Freight/EconCorridors.htm.
More information can be found online at www.wsdot.
wa.gov/freight/.
Recommendations
Th e FGTS 2015 Update team has identifi ed areas for
consideration in future updates to improve the accuracy
and usefulness of FGTS:
• Th e FGTS 2015 update represents the most
comprehensive city street information to date. Th e
number of cities which submitted truck volume and
freight corridor classifi cation data has increased
from 25 to 34 in this update. However, gaps in
the system remain and additional data are needed
to more accurately portray freight movement on
city streets. Resource constraints and information
availability make it diffi cult for many local
communities to submit information. Additional
assistance and better communication will improve
the ability of local jurisdictions to provide
information for FGTS update.
• Developing a more accurate and systematic
statewide freight data system requires more
collaboration between cities, counties, and the state.
More coordination will help fi ll the gaps to provide
a complete data-based picture of the freight system.
Washington State Freight and Goods Transportation System 2015 Update | March 2016 11
Washington State Freight and Goods Transportation System 2015 Update | March 201612
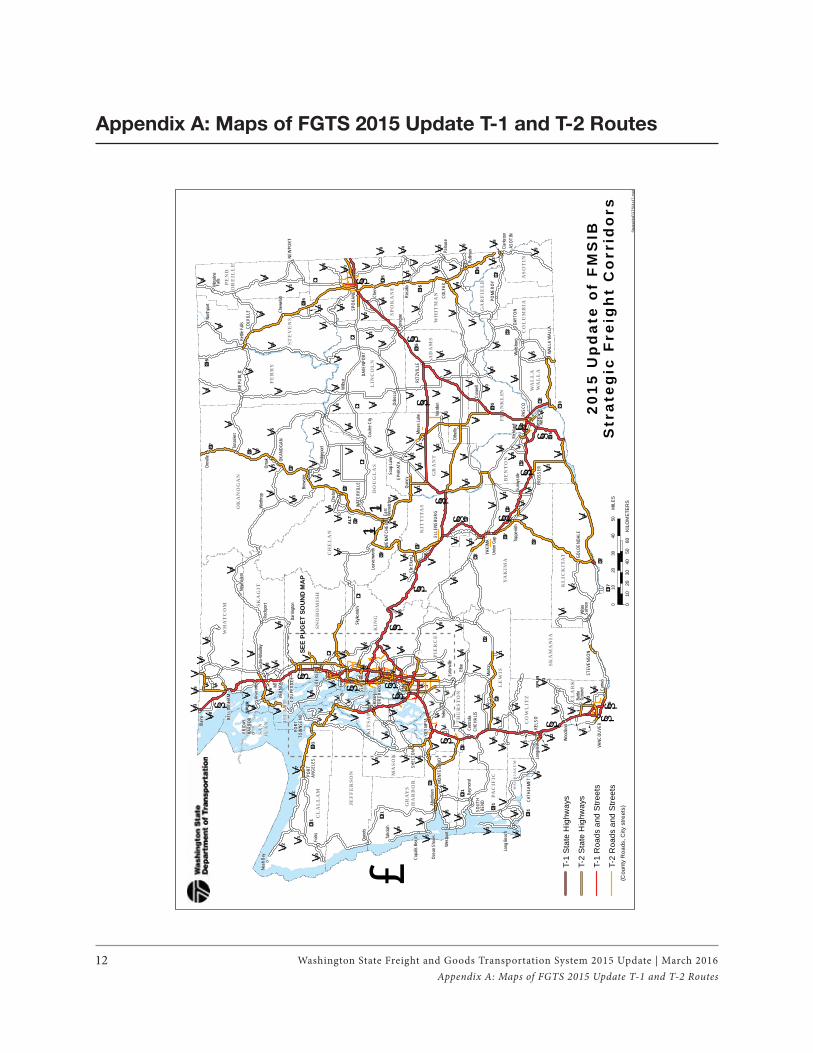
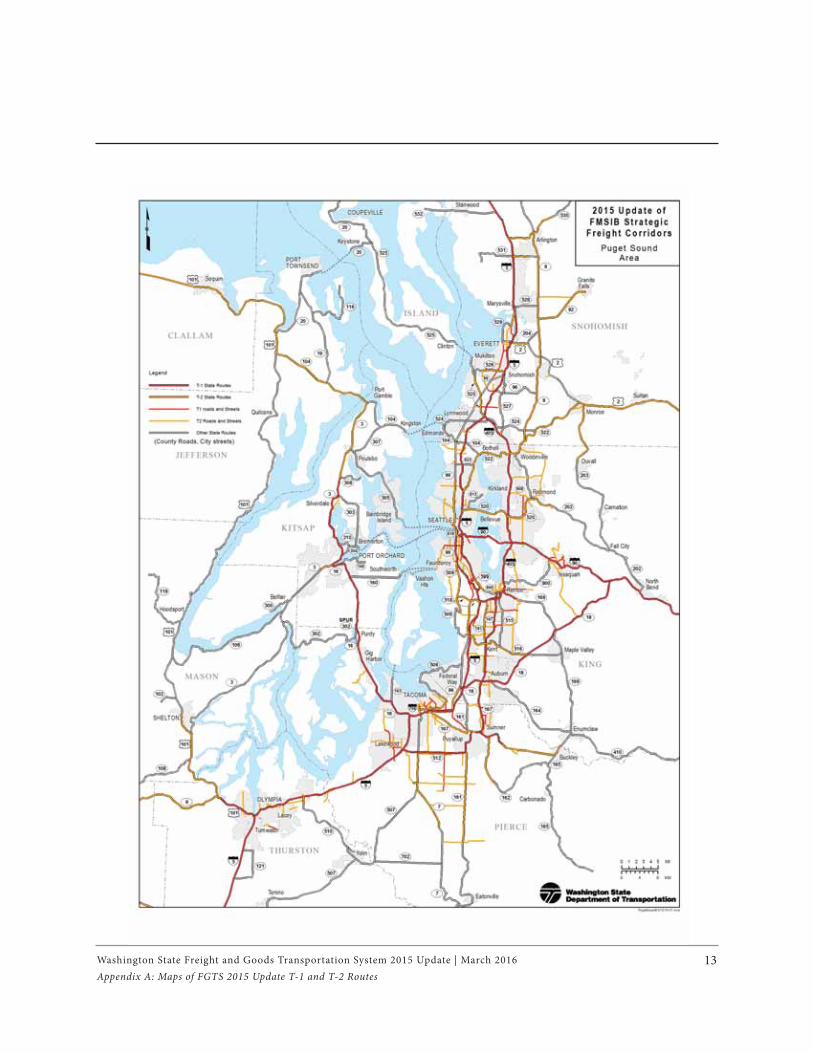
Appendix A: Maps of FGTS 2015 Update T-1 and T-2 Routes
Appendix A: Maps of FGTS 2015 Update T-1 and T-2 Routes
KELS
O
PASC
O
TACO
MA
DAYT
ONAS
OTIN
YAKI
MA
COLF
AX
SEAT
TLE
PROS
SER
POME
ROY
OLYM
PIA
SHEL
TON
EPHR
ATA
SPOK
ANE
EVER
ETT
NEW
PORT
CHEH
ALIS
OKAN
OGAN
COLV
ILLE
REPU
BLIC
VANC
OUVE
R
STEV
ENSO
N
CATH
LAM
ETMONT
ESAN
O
RITZ
VILL
E
WEN
ATCH
EE
DAVE
NPOR
T
GOLD
ENDA
LE
SOU
TH
BEND
ELLE
NSBU
RG
WAT
ERVI
LLE
COUP
EVIL
LE
BELL
INGH
AM
WAL
LA W
ALLA
PORT
O
RCHA
RD
PORT
ANGE
LES
MT
VE
RNON
PORT
TOW
NSEN
D
FRID
AY
HARB
OR
Elbe
Yelm
Cama
s
Forks
Quee
ts
Morto
n
Ward
en
Quinc
y
Odes
sa
Chen
ey
Wilb
ur
Chela
n
Blaine
Taho
lah
Raym
ond
Conn
ellPu
llman
Othe
llo
Palou
se
Rosa
liaSp
rague
Neah
Bay
Rock
port
Newh
alem
Woo
dland
Long
view
Rich
land
Wes
tport
Aberd
een
Cle E
lum
Brew
ster
Chew
elah
Wint
hrop
Tona
sket
Orov
ille
Kenn
e-wi
ck
Waits
burg
Sunn
yside
Topp
enish
Clar
kston
Union
Gap
Centr
alia
Soap
Lake
Skyk
omish
Anac
ortes
North
port
Long
Bea
ch
Eaton
ville
Mose
s Lak
e
Bridg
epor
t
Darri
ngton
Leav
enwo
rthCo
ulee C
ity
Whit
e S
almon
Ocea
n Sho
res
Kettle
Fall
s
Copa
lis B
each
Battle
G
roun
d
Sedro
-Woo
lley
East
Wen
atche
e
M
etalin
e Fa
lls
Omak
YA
KIM
A
OK
AN
OG
AN
KIN
G
GR
AN
T
LE
WIS
CH
EL
AN
FE
RR
Y
STE
VE
NS
AD
AM
S
CL
AL
LA
M
LIN
CO
LN
SKA
GIT
KIT
TIT
AS
PIE
RC
E
WH
AT
CO
M
BE
NT
ON
WH
ITM
AN
DO
UG
LA
S
JEF
FE
RSO
N
SPO
KA
NE
SNO
HO
MIS
H
KL
ICK
ITA
T
SKA
MA
NIA
PAC
IFIC
MA
SON
GR
AY
S
H
AR
BO
R
CO
WL
ITZ
FR
AN
KL
IN
PE
ND
OR
EIL
LE
CL
AR
K
WA
LL
A
WA
LL
A
ASO
TIN
CO
LU
MB
IA
KIT
SA
P
TH
UR
ST
ON
ISL
AN
D
GA
RF
IEL
D
SAN
JUA
N
WA
HK
IAK
UM
§̈ ¦90
§̈ ¦5
§̈ ¦82
§̈¦405
§̈ ¦705§̈ ¦5
§̈ ¦182
§̈ ¦205
§̈ ¦90
£ ¤101
£ ¤12
£ ¤97
£ ¤395
£ ¤195
£ ¤ALT 97
£ ¤730
£ ¤2
£ ¤101
£ ¤97
£ ¤12
£ ¤101
£ ¤2
£ ¤12
£ ¤2
* 12 97
U V20
U V28
U V26
U V25
U V410
U V14
U V21U V17
U V27
U V155
U V24
U V23
U V3
U V112
U V7
U V542
U V9
U V503
U V504
U V6U V105
U V530
U V124
U V231
UV507
U V174
U V109
U V129
U V260
U V22
U V142
U V172
U V240
U V291
U V508
U V153
U V202
U V261
U V141
UV167U V18
U V243U V127
U V16
U V31
U V221
U V161
U V241
U V821
U V104U V522
U V262
U V125
U V500U V525U V11
U V194U V165
U V8
U V106
U V505U V103
U V904
U V123
U V539
U V211
U V206
U V283
U V971
UV19
U V548
U V706
UV305
U V411
UV510
U V902
U V401
UV512U V108
UV397
U V225U V506
U V110
U V547
U V119
U V281U V903
U V113
U V263
UV544
U V271
U V150
U V107
UV122
UV121
UV304
U V292
U V823
U V278
U V536U V534
U V207
U VSPU
R20
U V409U VSP
UR
503
UV223
U V906
£ ¤197
U V102
U V131
U V543
U V28
U V9
U V14
U V4
U V4
U V169
U V290 U V272U V272
U V10
U V173
U V432
U V970
UV224
U V270
UV702
UV546
U V502
U V215
U V285
U V282
U V100
U V171
U V170
U V538
U V193
U V115
U V128
U V274
U V117
U V433
U V26
U V501
U V507
U V109
U V9U V20
£ ¤101
£ ¤12
£ ¤101
£ ¤101
U V503
£ ¤97
£ ¤12
UV7
§̈ ¦5
§̈ ¦5 §̈ ¦5
U V3
£ ¤2
U V410
£ ¤12
U V14
§̈ ¦82£ ¤1
2
U V24
£ ¤12
£ ¤395
£ ¤395
§̈ ¦82£ ¤1
2
£ ¤12£ ¤195U V27U V27
£ ¤195
£ ¤395
U V25
U V20
U V20
U V20U V20
U V20
U V21U V21U V21
U V23
U V261
U V21
U V21U V26
§̈ ¦90§̈ ¦90
U V17U V17U V155
£ ¤97
£ ¤97
U V17
£ ¤395
§̈ ¦90
U V20
U V17
£ ¤2
£ ¤97
§̈ ¦90
§̈ ¦5
§̈ ¦5
* 12 97
U V174
U V21
U V25
U V21
£ ¤2
£ ¤97
£ ¤97
U V231
U V28
§̈ ¦82 £ ¤97
UV241
£ ¤97
U V505
U V105
U V112
UV104
UV20
U V525
U V20
Sta
tew
ideF
GT
S11
x17.
mxd
20
15
Up
da
te o
f F
MS
IBS
tra
teg
ic F
reig
ht
Co
rrid
ors
010
2030
4050
MIL
ES
010
2030
4050
60KI
LOM
ETE
RS
SEE
PUG
ET S
OU
ND
MA
P
£ T-1
Sta
te H
ighw
ays
T-2
Sta
te H
ighw
ays
T-1
Roa
ds a
nd S
treet
s
T-2
Roa
ds a
nd S
treet
s(C
ount
y R
oads
, City
stre
ets)
Washington State Freight and Goods Transportation System 2015 Update | March 2016 13Appendix A: Maps of FGTS 2015 Update T-1 and T-2 Routes
Washington State Freight and Goods Transportation System 2015 Update | March 201614
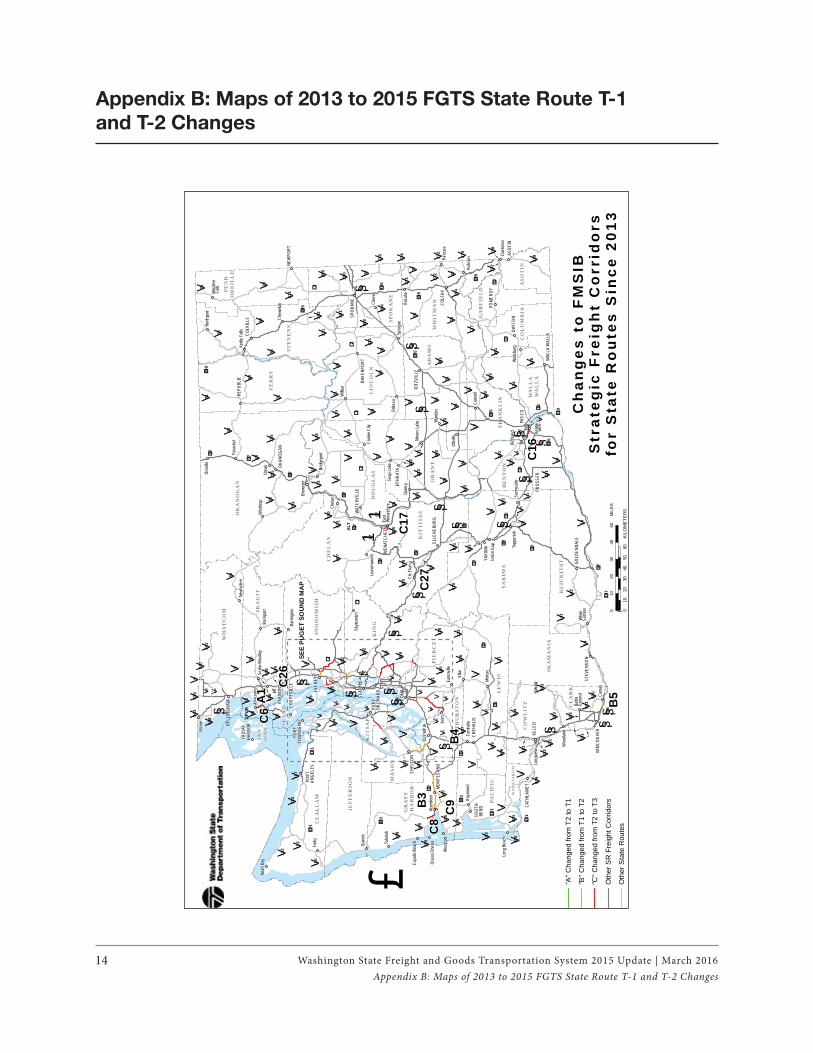
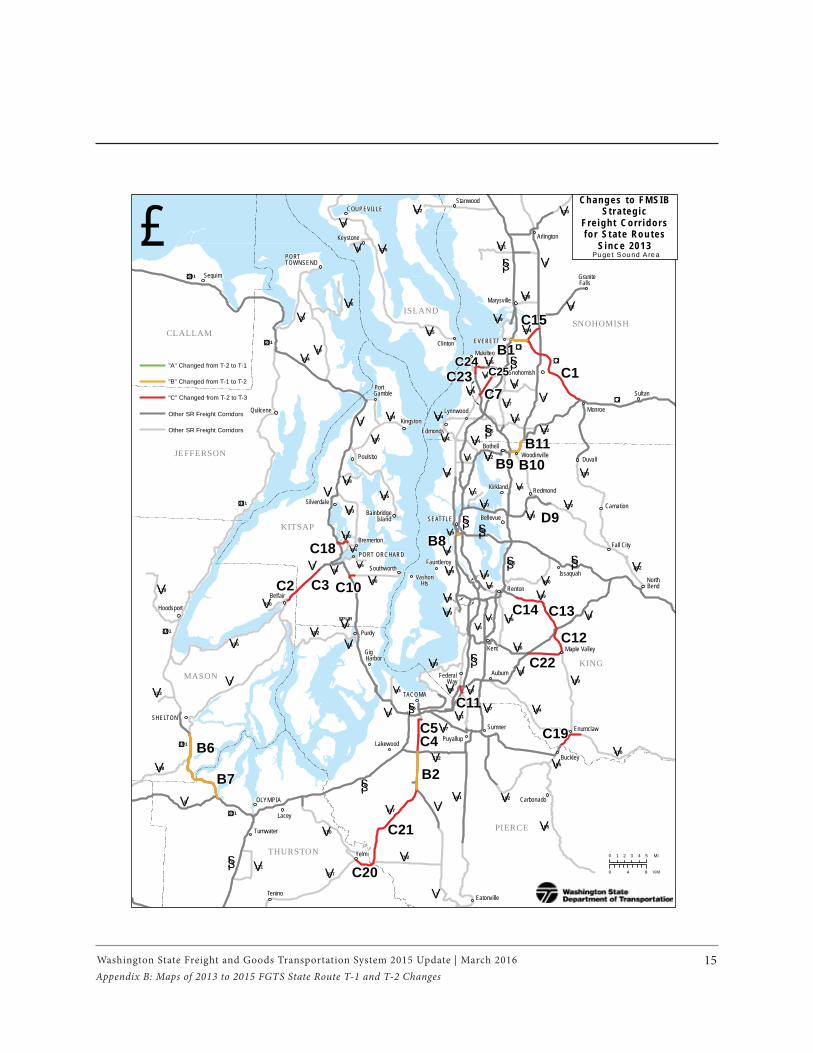
Appendix B: Maps of 2013 to 2015 FGTS State Route T-1
and T-2 Changes
Appendix B: Maps of 2013 to 2015 FGTS State Route T-1 and T-2 Changes
KELS
O
PASC
O
TACO
MA
DAYT
ONAS
OTIN
YAKI
MA
COLF
AX
SEAT
TLE
PROS
SER
POME
ROY
OLYM
PIA
SHEL
TON
EPHR
ATA
SPOK
ANE
EVER
ETT
NEW
PORT
CHEH
ALIS
OKAN
OGAN
COLV
ILLE
REPU
BLIC
VANC
OUVE
R
STEV
ENSO
N
CATH
LAM
ETMONT
ESAN
O
RITZ
VILL
E
WEN
ATCH
EE
DAVE
NPOR
T
GOLD
ENDA
LE
SOU
TH
BEND
ELLE
NSBU
RG
WAT
ERVI
LLE
COUP
EVIL
LE
BELL
INGH
AM
WAL
LA W
ALLA
PORT
O
RCHA
RD
PORT
ANGE
LES
MT
VE
RNON
PORT
TOW
NSEN
D
FRID
AY
HARB
OR
Elbe
Yelm
Cama
s
Forks
Quee
ts
Morto
n
Ward
en
Quinc
y
Odes
sa
Chen
ey
Wilb
ur
Chela
n
Blaine
Taho
lah
Raym
ond
Conn
ellPu
llman
Othe
llo
Palou
se
Rosa
liaSp
rague
Neah
Bay
Rock
port
Newh
alem
Woo
dland
Long
view
Rich
land
Wes
tport
Aberd
een
Cle E
lum
Brew
ster
Chew
elah
Wint
hrop
Tona
sket
Orov
ille
Kenn
e-wi
ck
Waits
burg
Sunn
yside
Topp
enish
Clar
kston
Union
Gap
Centr
alia
Soap
Lake
Skyk
omish
Anac
ortes
North
port
Long
Bea
ch
Eaton
ville
Mose
s Lak
e
Bridg
epor
t
Darri
ngton
Leav
enwo
rthCo
ulee C
ity
Whit
e S
almon
Ocea
n Sho
res
Kettle
Fall
s
Copa
lis B
each
Battle
G
roun
d
Sedro
-Woo
lley
East
Wen
atche
e
M
etalin
e Fa
lls
Omak
YA
KIM
A
OK
AN
OG
AN
KIN
G
GR
AN
T
LE
WIS
CH
EL
AN
FE
RR
Y
STE
VE
NS
AD
AM
S
CL
AL
LA
M
LIN
CO
LN
SKA
GIT
KIT
TIT
AS
PIE
RC
E
WH
AT
CO
M
BE
NT
ON
WH
ITM
AN
DO
UG
LA
S
JEF
FE
RSO
N
SPO
KA
NE
SNO
HO
MIS
H
KL
ICK
ITA
T
SKA
MA
NIA
PAC
IFIC
MA
SON
GR
AY
S
H
AR
BO
R
CO
WL
ITZ
FR
AN
KL
IN
PE
ND
OR
EIL
LE
CL
AR
K
WA
LL
A
WA
LL
A
ASO
TIN
CO
LU
MB
IA
KIT
SA
P
TH
UR
STO
N
ISL
AN
D
GA
RF
IEL
D
SAN
JUA
N
WA
HK
IAK
UM
§̈ ¦90
§̈ ¦5
§̈ ¦82
§̈¦405
§̈ ¦705§̈ ¦5
§̈ ¦182
§̈ ¦205
§̈ ¦90
£ ¤101
£ ¤12
£ ¤97
£ ¤395
£ ¤195
£ ¤ALT 97
£ ¤730
£ ¤2
£ ¤101
£ ¤97
£ ¤12
£ ¤101
£ ¤2
£ ¤12
£ ¤2
* 12 97
U V20
U V28
U V26
U V25
U V410
U V14
U V21U V17
U V27
U V155
U V24
U V23
U V3
U V112
U V7
U V542
U V9
U V503
U V504
U V6U V105
U V530
U V124
U V231
UV507
U V174
U V109
U V129
U V260
U V22
U V142
U V172
U V240
U V291
U V508
U V153
U V202
U V261
U V141
UV167U V18
U V243U V127
U V16
U V31
U V221
U V161
U V241
U V821
U V104U V522
U V262
U V125
U V500U V525U V11
U V194U V165
U V8
U V106
U V505U V103
U V904
U V123
U V539
U V211
U V206
U V283
U V971
UV19
U V548
U V706
UV305
U V411
UV510
U V902
U V401
UV512U V108
UV397
U V225U V506
U V110
U V547
U V119
U V281U V903
U V113
U V263
UV544
U V271
U V150
U V107
UV122
UV121
UV304
U V292
U V823
U V278
U V536U V534
U V207
U VSPU
R20
U V409U VSP
UR
503
UV223
U V906
£ ¤197
U V102
U V131
U V543
U V28
U V9
U V14
U V4
U V4
U V169
U V290 U V272U V272
U V10
U V173
U V432
U V970
UV224
U V270
UV702
UV546
U V502
U V215
U V285
U V282
U V100
U V171
U V170
U V538
U V193
U V115
U V128
U V274
U V117
U V433
U V26
U V501
U V507
U V109
U V9U V20
£ ¤101
£ ¤12
£ ¤101
£ ¤101
U V503
£ ¤97
£ ¤12
UV7
§̈ ¦5
§̈ ¦5 §̈ ¦5
U V3
£ ¤2
U V410
£ ¤12
U V14
§̈ ¦82£ ¤1
2
U V24
£ ¤12
£ ¤395
£ ¤395
§̈ ¦82£ ¤1
2
£ ¤12£ ¤195U V27U V27
£ ¤195
£ ¤395
U V25
U V20
U V20
U V20U V20
U V20
U V21U V21U V21
U V23
U V261
U V21
U V21U V26
§̈ ¦90§̈ ¦90
U V17U V17U V155
£ ¤97
£ ¤97
U V17
£ ¤395
§̈ ¦90
U V20
U V17
£ ¤2
£ ¤97
§̈ ¦90
§̈ ¦5
§̈ ¦5
* 12 97
U V174
U V21
U V25
U V21
£ ¤2
£ ¤97
£ ¤97
U V231
U V28
§̈ ¦82 £ ¤97
UV241
£ ¤97
U V505
U V105
U V112
UV104
UV20
U V525
U V20
Ch
an
ge
s t
o F
MS
IBS
tra
teg
ic F
reig
ht
Co
rrid
ors
for
Sta
te R
ou
tes
Sin
ce
20
13
010
2030
4050
MIL
ES
010
2030
4050
60KI
LOM
ETE
RS
SEE
PUG
ET S
OU
ND
MA
P
£ "A" C
hang
ed fr
om T
2 to
T1
"B" C
hang
ed fr
om T
1 to
T2
"C" C
hang
ed fr
om T
2 to
T3
Oth
er S
R F
reig
ht C
orrid
ors
Oth
er S
tate
Rou
tes
C27
C17
B3
B4
C6
C8
C9
A1
C16
C26
B5
Washington State Freight and Goods Transportation System 2015 Update | March 2016 15Appendix B: Maps of 2013 to 2015 FGTS State Route T-1 and T-2 Changes
KING
CLALLAM
PIERCE
JEFFERSON
SNOHOMISH
MASON
KITSAP
THURSTON
ISLAND
§̈¦5
§̈¦405
§̈¦705
§̈¦90§̈¦5
UV3
UV7
UV9
UV
UV507
UV99
UV202
UV167
UV18
UV16
UV161
UV169
UV104
UV522
UV203
UV525
UV165
UV8
UV106
UV509
UV162
UV302
UV516
UV164
UV524
UV19
UV305
UV510
UV520
UV512
UV108
UV527
UV119
UV532
UV531
UV116
UV900
UV702
UV303
UV92
UV515
UV529
UV121
UV160
UV96
UV307
UV526
UV528
UV308
UV300UV518
UV204
UV102
UV599
UVSPUR
302
UV99
UV16
UV167
UV310
UV530
UV20
UV20
UV20
£¤101
£¤101
£¤101
UV104
UV3
UV3
UV3
£¤101
£¤101
£¤101 UV507 UV7
UV165
UV410
§̈¦5
§̈¦5
UV16
UV169
UV18
UV18
UV509
§̈¦90
UV509
§̈¦405
UV202
UV520
£¤2
£¤2
£¤2
UV522
UV524
UV104 UV104
§̈¦5
UV99
UV525
UV525
§̈¦5
UV9
UV523
UV513UV908
UV519
UV900
UV181
UV163
UV166
UV304
UV167
UV99
UV161
TACOMA
OLYMPIA
SHELTON
SEATTLE
EVERETT
COUPEVILLE
PORT ORCHARD
PORT TOWNSEND
Kent
Lacey
Tenino
Sumner
Auburn
Renton
Duvall
Monroe
Sultan
Sequim
Buckley
Redmond
PoulsboBothell
Edmonds
Tumwater
LakewoodPuyallup
Enumclaw
Issaquah
Bellevue
Kirkland
Lynnwood
Mukilteo
Stanwood
Carbonado
Southworth
Carnation
Snohomish
Arlington
Gig Harbor
NorthBend
Marysville
Federal Way
Woodinville
Maple Valley
GraniteFalls
Bainbridge Island
Quilcene
Port Gamble
Kingston
Silverdale
Belfair
Hoodsport
Purdy
Fall City
VashonHts
Fauntleroy
Clinton
Bremerton
Keystone
Yelm
Eatonville
0 84 KM
0 51 2 3 4 MI
£
"A" Changed from T-2 to T-1
"B" Changed from T-1 to T-2
"C" Changed from T-2 to T-3
Other SR Freight Corridors
Other SR Freight Corridors
C15
C1
C11
C14
C22
C21
C25
D9
C4 C19
C2
B1
B8
B11
C3
B2
Ch a n g e s to F M SI BStr a te g i c
F re i g h t C o rr i d o r sfo r S t at e Ro u te s
S i n c e 20 1 3Pu ge t Sou nd A re a
B6
B7
B9 B10
C5
C20
C24C23
C7
C10
C18
C13
C12
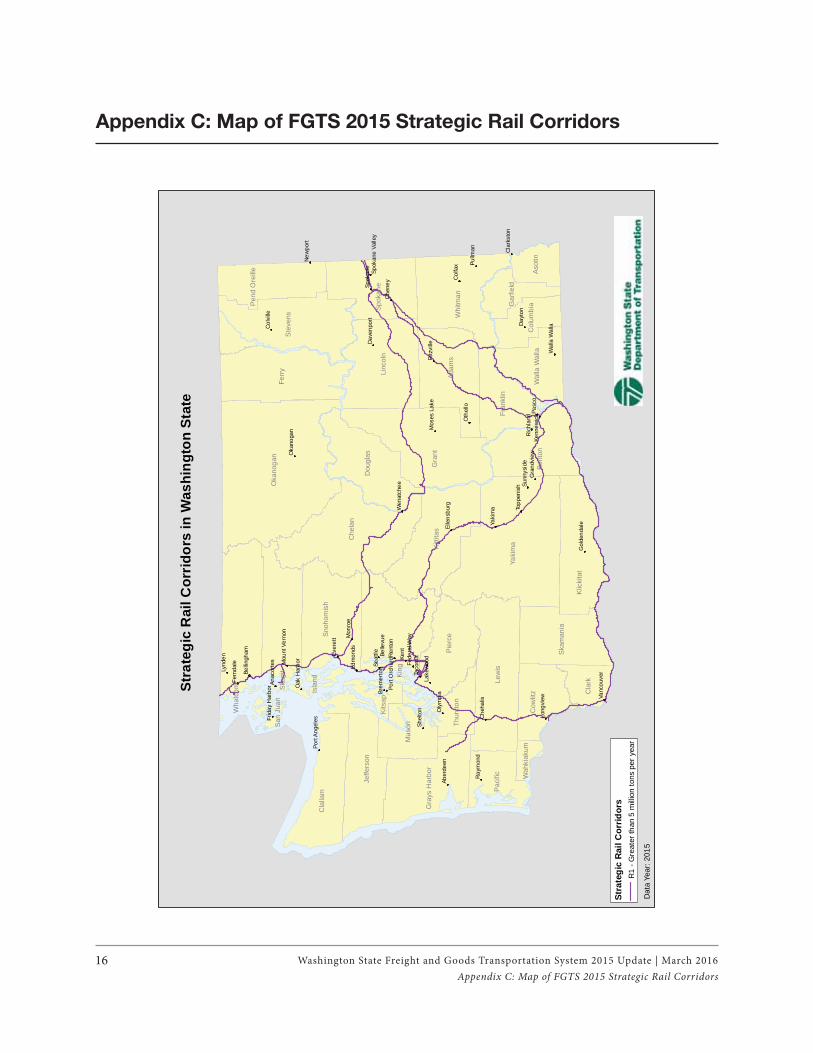
Washington State Freight and Goods Transportation System 2015 Update | March 201616Appendix C: Map of FGTS 2015 Strategic Rail Corridors
Appendix C: Map of FGTS 2015 Strategic Rail Corridors
Kent
Pasc
o
Taco
ma
Day
ton
Yaki
ma
Col
fax
Che
ney
Ren
ton
Mon
roe
Lynd
en
Ray
mon
dPu
llman
Oth
ello
Oly
mpi
a
Shel
ton
Seat
tleSp
okan
e
Edm
onds
Ever
ett
New
port
Long
view
Ric
hlan
d
Che
halis
Aber
deen
Lake
woo
dBelle
vue
Oka
noga
n
Col
ville
Fern
dale
Vanc
ouve
r
Kenn
ewic
kG
rand
view
Sunn
ysid
eTo
ppen
ish
Cla
rkst
on
Ritz
ville
Wen
atch
ee
Brem
erto
n
Dav
enpo
rt
Anac
orte
s
Oak
Har
bor
Gol
dend
ale
Elle
nsbu
rg
Mos
esLa
ke
Bellin
gham
Wal
laW
alla
Fede
ralW
ay
Port
Orc
hard
Port
Ang
eles
Mou
ntVe
rnon
Frid
ayH
arbo
r
Spok
ane
Valle
y
Yaki
ma
Kin
g
Oka
noga
n
Gra
nt
Ferr
y
Lew
is
Che
lan
Cla
llam
Kitt
itas
Linc
oln
Ste
vens
Ska
git
Pie
rce
Ada
ms
Wha
tcom
Ben
ton
Klic
kita
t
Whi
tman
Jeffe
rson
Dou
glas
Spo
kane
Sno
hom
ish
Pac
ific
Ska
man
ia
Gra
ysH
arbo
r
Cow
litz
Fran
klin
Mas
on
Cla
rk
Pen
dO
reille
Wal
laW
alla
Aso
tinC
olum
biaG
arfie
ld
Kits
ap
Thur
ston
Isla
nd
San
Juan
Wah
kiak
um
Stra
tegi
cR
ailC
orrid
ors
R1
-Gre
ater
than
5m
illion
tons
pery
ear
Dat
aYe
ar:2
015
Stra
tegi
cR
ailC
orri
dors
inW
ashi
ngto
nSt
ate
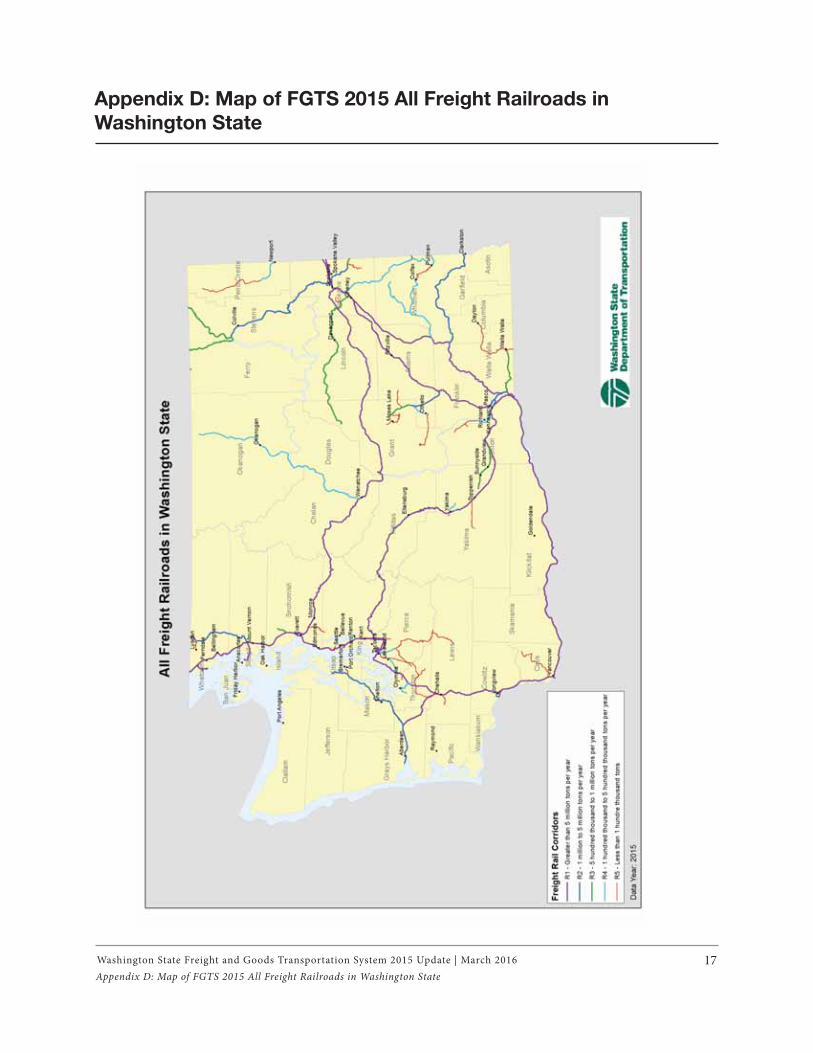
Washington State Freight and Goods Transportation System 2015 Update | March 2016 17Appendix D: Map of FGTS 2015 All Freight Railroads in Washington State
Appendix D: Map of FGTS 2015 All Freight Railroads in
Washington State
Washington State Freight and Goods Transportation System 2015 Update | March 201618Appendix E: Map of FGTS 2015 Strategic Waterway Corridors
Appendix E: Map of FGTS 2015 Strategic Waterway Corridors
Stra
it of
Geo
rgia
Rosario Strait
Stra
it of
Jua
n De
Fuc
a
Puget Sound
Col
umbi
a R
iver
Snak
e R
iver
Gra
ys H
arbo
r
Pasc
o
Taco
ma
Kal
ama
Seat
tle
Oly
mpi
a
Ever
ett
Vanc
ouve
r
Ken
new
ick
Cla
rkst
on
Ana
cort
es
Bel
lingh
am
Port
Ang
eles
Gra
ys H
arbo
r
Port
Tow
nsen
d
YA
KIM
A
OK
AN
OG
AN
KIN
G
GR
AN
T
LE
WIS
CH
EL
AN
FER
RY
STE
VE
NS
AD
AM
S
CL
AL
LA
M
LIN
CO
LN
SKA
GIT
KIT
TIT
AS
PIER
CE
WH
AT
CO
M
WH
ITM
AN
BE
NT
ON
JEFF
ER
SON
DO
UG
LA
SSP
OK
AN
E
SNO
HO
MIS
H
KL
ICK
ITA
T
SKA
MA
NIA
PAC
IFIC
MA
SON
GR
AY
S H
AR
BO
R
CO
WL
ITZ
FRA
NK
LIN
PEN
D O
RE
ILL
E
CL
AR
K
ASO
TIN
WA
LL
A W
AL
LA
CO
LU
MB
IA
KIT
SAP
TH
UR
STO
N
ISL
AN
D
GA
RFI
EL
D
SAN
JU
AN
WA
HK
IAK
UM
Stra
tegi
c W
ater
way
Cor
ridor
s in
Was
hing
ton
Stat
e
Stra
tegi
c W
ater
way
Cor
ridor
sW
1 - M
ore
than
25
mill
ion
tons
W2
- 10
milli
on to
25
milli
on to
ns
W3
- 5 m
illion
to 1
0 m
illion
tons
W4
- 2.5
mill
ion
to 5
milli
on to
nsD
ata
Year
: 201
3D
ata
Sour
ce: U
S Ar
my
Cor
ps o
f Eng
inee
rs,
Nav
igat
ion
Dat
a C
ente
r
Washington State Freight and Goods Transportation System 2015 Update | March 2016 19
Appendix F: Map of FGTS 2015 Freight Waterway Corridors
Appendix F: Map of FGTS 2015 Freight Waterway Corridors
Stra
itof
Geo
rgia
RosarioStrait
Stra
itof
Juan
DeFu
ca
PugetSound
Col
umbi
aR
iver
Sna
keR
iver
Gra
ysH
arbo
r
Pasc
o
Taco
ma
Kal
ama
Seat
tle
Oly
mpi
a
Ever
ett
Vanc
ouve
r
Ken
new
ick
Cla
rkst
on
Ana
cort
es
Bel
lingh
am
Port
Ang
eles
Gra
ysH
arbo
r
Port
Tow
nsen
d
YA
KIM
A
OK
AN
OG
AN
KIN
G
GR
AN
T
LEW
IS
CH
ELA
N
FER
RY
STE
VE
NS
AD
AM
S
CL
AL
LA
M
LIN
CO
LN
SKA
GIT
KIT
TIT
AS
PIE
RC
E
WH
AT
CO
M
WH
ITM
AN
BEN
TO
N
JEFF
ER
SON
DO
UG
LA
SSP
OK
AN
E
SNO
HO
MIS
H
KL
ICK
ITA
T
SKA
MA
NIA
PAC
IFIC
MA
SON
GR
AY
SH
AR
BO
R
CO
WL
ITZ
FRA
NK
LIN
PEN
DO
RE
ILL
E
CL
AR
K
ASO
TIN
WA
LLA
WA
LL
A
CO
LUM
BIA
KIT
SAP
THU
RST
ON
ISL
AN
D
GA
RFI
ELD
SAN
JUA
N
WA
HK
IAK
UM
Frei
ghtW
ater
way
sin
Was
hing
ton
Stat
e
Frei
ghtW
ater
way
Cor
ridor
sW
1-M
ore
than
25m
illion
tons
W2
-10
milli
onto
25m
illion
tons
W3
-5m
illio
nto
10m
illio
nto
ns
W4
-2.5
milli
onto
5m
illion
tons
W5
-0.9
milli
onto
2.5
milli
onto
nsD
ata
Year
:201
3D
ata
Sou
rce:
US
Arm
yC
orps
ofEn
gine
ers,
Nav
igat
ion
Dat
aC
ente
r
Washington State Freight and Goods Transportation System 2015 Update | March 201620
Appendix G: 2015 FGTS State Route T-1 and T-2,
sorted by State Route
Appendix G: 2015 FGTS State Route T-1 and T-2, Sorted by State Route
StateRoute (SR)
Description Begin SR
Milepost
End SR Milepost
Length 2015FGTSClass
Annual Tonnage
Average Annual
Daily Truck
Volume
Truck Percen-tage
County
002 I-5 (Everett) to SR 204 0.00 2.45 2.45 T-2 7,310,000 2,200 3.3% Snohomish
002 SR 522 to Index-Galena Rd 14.27 35.62 21.35 T-2 3,870,000 1,000 7.7% Snohomish
002 US 97 to SR 285 (Wenatchee)/physical gap
104.50 118.90 14.40 T-2 7,720,000 1,800 9.5% Chelan
002 SR 285 to Chelan/Douglas Co. Line
118.92 119.92 1.15 T-1 10,380,000 2,300 10.5% Chelan
002 Chelan/Douglas Co. Line to SR 28 119.92 127.86 0.88 T-1 10,380,000 2,300 10.5% Douglas
002 SR 28 to SR 97 (Orondo) 127.86 139.85 11.89 T-2 6,360,000 1,500 19.0% Douglas
002 Fairchild Air Force Base to I-90/coincident 275.33 283.22 7.89 T-2 6,080,000 1,600 6.7% Spokane
002 I-90 to SR-395 (includes Browne and Division Couplets)
286.87 292.86 6.03 T-2 5,973,081 1,799 3.2% Spokane
003 Sunnyslope Rd to SR 16 (Gorst) 32.60 34.67 2.07 T-2 3,800,000 1,100 5.8% Kitsap
003 SR 16 (Gorst) to SR 308 34.67 48.48 13.79 T-1 10,180,000 2,600 5.3% Kitsap
003 SR 308 to SR 104 48.48 60.02 11.38 T-2 7,830,000 2,000 8.0% Kitsap
005 Oregon State Line to SR 205 0.00 8.24 8.24 T-1 30,190,000 5,700 6.8% Clark
005 I-205 to SR 501 8.24 14.17 5.93 T-1 76,580,000 13,000 15.3% Clark
005 SR 501 to Clark/Cowlitz Co. line 14.17 19.98 5.81 T-1 63,900,000 11,000 15.5% Clark
005 Clark/Cowlitz Co. line to Cowlitz/Clark Co. line
19.98 20.29 0.31 T-1 63,900,000 11,000 15.5% Cowlitz
005 Cowlitz/Clark Co. line to Clark/Cowlizt Co. line
20.29 20.78 0.49 T-1 63,900,000 11,000 15.5% Clark
005 Clark/Cowlitz Co. line to SR 503 20.78 21.08 0.30 T-1 63,900,000 11,000 15.5% Cowlitz
005 SR 503 to Cowlitz/Lewis Co. line 21.08 57.13 36.12 T-1 56,320,000 9,500 18.6% Cowlitz
005 Cowlitz/Lewis Co. line to SR 12 57.13 68.41 11.28 T-1 56,320,000 9,500 18.6% Lewis
005 SR 12 to SR 507 68.41 82.08 13.67 T-1 67,900,000 12,000 20.7% Lewis
005 SR 507 to Lewis/Thurston Co. line
82.08 85.51 3.43 T-1 57,570,000 10,000 13.0% Lewis
005 Lewis/Thurston Co. line to SR 510 85.51 112.43 26.92 T-1 57,570,000 10,000 13.0% Thurston
005 SR 510 to 112.43 114.93 2.50 T-1 61,880,000 12,000 9.3% Thurston
Washington State Freight and Goods Transportation System 2015 Update | March 2016 21Appendix G: 2015 FGTS State Route T-1 and T-2, Sorted by State Route
StateRoute (SR)
Description Begin SR
Milepost
End SR Milepost
Length 2015FGTSClass
Annual Tonnage
Average Annual
Daily Truck
Volume
Truck Percen-tage
County
Thurston/Pierce Co. line
005 Thurston/Pierce Co. line to Pacific Ave (SR 705)
114.93 133.69 18.75 T-1 61,880,000 12,000 9.3% Pierce
005 Pacific Ave (SR 705) to Pierce/King Co. line 133.69 139.50 5.81 T-1 68,900,000 14,000 7.5% Pierce
005 King/Pierce Co. line to SR 599 (includes HOV)
139.50 155.94 16.44 T-1 68,900,000 14,000 7.5% King
005 SR 599 to I-90 155.94 163.96 8.02 T-1 70,940,000 14,000 7.3% King
005 I-90 to SR 520 (includes Express Lanes)
163.96 167.72 3.76 T-1 53,140,000 12,000 6.1% King
005 SR 520 to SR 523 (includes Express Lanes)
167.72 174.58 6.86 T-1 45,120,000 11,000 5.4% King
005 SR 523 to King/Snohomish Co. line
174.58 177.76 3.18 T-1 43,900,000 9,400 6.4% King
005 King/Snohomish Co. line to SR 531 177.76 206.08 28.31 T-1 43,900,000 9,400 6.4% Snohomish
005 SR 531 to Snohomish/Skagit Co. line
206.08 217.66 11.58 T-1 33,070,000 6,500 10.0% Snohomish
005 Snohomish/Skagit Co. line to SR 20 217.66 230.14 12.49 T-1 33,070,000 6,500 10.0% Skagit
005 SR 20 to Skagit/Whatcom Co. line
230.14 242.63 12.49 T-1 15,100,000 2,800 6.2% Skagit
005 Skagit/Whatcom Co. line to 36th St 242.63 252.50 9.87 T-1 15,100,000 2,800 6.2% Whatcom
005 36th St to SR 548 252.50 265.98 13.48 T-1 18,300,000 3,400 6.4% Whatcom 005 SR 548 to SR 543 265.98 275.15 9.17 T-1 13,680,000 2,400 8.3% Whatcom 007 Weiler Rd to SR 507 41.18 47.38 6.20 T-2 4,780,000 1,500 7.9% Pierce 007 SR 507 to SR 512 47.38 52.58 5.20 T-2 7,020,000 2,000 5.9% Pierce
008 US 12 to Grays Harbor/Thurston Co. Line
0.00 10.54 10.54 T-2 6,990,000 1,500 9.4% Grays Harbor
008 Grays Harbor/Thurston Co. line to US 101 10.54 20.67 10.13 T-2 6,990,000 1,500 9.4% Thurston
009 SR 522 to SR 92 0.00 17.49 17.49 T-2 5,380,000 1,700 7.7% Snohomish 009 SR 92 to SR 530 17.49 29.57 12.08 T-2 3,230,000 1,200 9.2% Snohomish
009 South Pass Rd to Canadian Border 90.31 98.17 7.48 T-2 5,970,000 990 17.7% Whatcom
009SPSUMAS
Sumas Spur 98.00 98.24 0.24 T-2 3,490,000 500 33.3% Whatcom
012 US 101 to SR 8 (Elma)/physical gap (includes Aberdeen Couplet)
0.00 20.99 20.99 T-2 7,246,527 1,715 8.5% Grays Harbor
012 SR 8 to Grays Harbor/Thurston Co. line
21.30 38.84 17.54 T-2 4,210,000 850 12.3% Grays Harbor
Washington State Freight and Goods Transportation System 2015 Update | March 201622
StateRoute (SR)
Description Begin SR
Milepost
End SR Milepost
Length 2015FGTSClass
Annual Tonnage
Average Annual
Daily Truck
Volume
Truck Percen-tage
County
012 Grays Harbor/Thurston Co. line to Elderberry St (Old Hwy 99)
38.84 46.37 7.53 T-2 4,210,000 850 12.3% Thurston
012 Elderberry St (Old Hwy 99) to I-5/coincident
46.37 46.62 B 0.25 T-2 8,140,000 1,700 9.4% Thurston
012 I-5 (Napavine) to Gharet Rd 66.54 116.87 50.34 T-2 5,010,000 1,000 18.9% Lewis
012 S Naches Rd to 16th Ave 189.87 202.04 12.19 T-2 6,510,000 1,500 11.5% Yakima
012 16th Ave to I-82/coincident 202.04 202.75 0.71 T-1 9,780,000 3,200 11.0% Yakima
012 I-182 to Franklin/Walla Walla Co. line 291.67 294.70 3.07 T-1 10,190,000 1,900 15.8% Franklin
012 Franklin/Walla Walla Co. line to US 730 294.70 307.41 12.71 T-1 10,190,000 1,900 15.8% Walla Walla
012 US 730 to SR 125 Spur 307.41 335.33 27.92 T-2 6,640,000 1,300 18.6% Walla Walla
014 I-5 (Vancouver) to SE 192nd Ave 0.00 10.09 10.10 T-1 10,630,000 2,400 4.8% Clark
014 SE 192nd Ave to SR 500 10.09 14.10 4.01 T-2 8,210,000 2,100 6.8% Clark
014 SR 500 to 32nd St (Washougal) 14.10 17.05 2.95 T-2 6,560,000 1,500 8.3% Clark
014 Bridge of the Gods Rd to Wind River Rd/Stevenson
41.55 47.47 5.92 T-2 3,900,000 730 11.4% Skamania
014 US 97 to Klickitat/Benton Co. line
101.44 152.24 50.80 T-2 3,830,000 590 42.1% Klickitat
014 Klickitat/Benton Co. line to SR 221 152.24 167.25 15.01 T-2 3,830,000 590 42.1% Benton
014 SR 221 to I-82 (Plymouth) 167.25 180.77 13.52 T-2 7,840,000 1,200 41.4% Benton
016 SR 163 to Pierce/Kitsap Co. line (includes alternate route)
3.95 18.10 11.92 T-1 10,509,530 2,825 5.1% Pierce
016 Pierce/Kitsap Co. line to Gorst 18.10 29.19 11.14 T-1 10,400,000 2,800 5.1% Kitsap
016 Tacoma to SR 163 0 B 3.95 4.10 T-1 16,170,000 4,600 5.2% Pierce
017 SR 395 to Franklin/Adams Co. line
7.43 21.80 14.31 T-2 7,570,000 1,200 25.5% Franklin
017 Franklin/Adams Co. line to SR 26 21.80 27.96 6.16 T-2 7,570,000 1,200 25.5% Adams
017 SR 26 to Adams/Grant Co. line 27.96 35.60 7.64 T-2 8,100,000 1,400 19.4% Adams
017 Adams/Grant Co. line to I-90 35.60 50.77 15.17 T-2 8,100,000 1,400 19.4% Grant
017 I-90 to Patton Blvd. 50.77 56.56 5.77 T-2 5,870,000 1,300 8.1% Grant 018 SR 164 to SR 516 4.47 11.39 6.92 T-1 25,640,000 4,800 9.4% King018 SR 516 to I-90 11.39 27.91 16.49 T-1 21,350,000 3,800 14.1% King
018 SR 99 to SR 164 (Auburn) 2.2 B 4.47 5.00 T-1 33,150,000 6,400 8.6% King
Appendix G: 2015 FGTS State Route T-1 and T-2, Sorted by State Route
Washington State Freight and Goods Transportation System 2015 Update | March 2016 23
StateRoute (SR)
Description Begin SR
Milepost
End SR Milepost
Length 2015FGTSClass
Annual Tonnage
Average Annual
Daily Truck
Volume
Truck Percen-tage
County
020 Swantown Rd to Island/Skagit Co. line 30.85 41.90 11.04 T-2 3,720,000 1,200 7.5% Island
020 Island/Skagit Co. line to SR 20 Spur 41.90 47.89 5.96 T-2 3,720,000 1,200 7.5% Skagit
020 SR 20 Spur to SR 536 47.89 55.09 7.20 T-2 7,450,000 1,900 6.1% Skagit
020 SR 536 to S Burlington Blvd. & Avon Ave 55.09 60.27 5.18 T-1 10,000,000 2,700 12.3% Skagit
020 S Burlington Blvd. & Avon Ave to SR 9 60.27 66.08 5.81 T-2 5,710,000 1,700 10.6% Skagit
022 I-82 to Toppenish to US 97 (Toppenish) 0.70 4.00 3.31 T-2 3,960,000 780 9.2% Yakima
022 SR 221 to I-82 35.74 36.52 0.78 T-2 7,090,000 1,100 23.9% Benton
024 I-82 to Riverside Rd / University Pkwy 0.00 1.28 1.28 T-2 5,750,000 1,300 6.8% Yakima
024 SR 241 to Yakima/Benton Co. line
30.45 30.76 0.31 T-2 4,510,000 680 23.4% Yakima
024 Yakima/Benton Co. line to SR 240 30.76 38.71 7.72 T-2 4,510,000 680 23.4% Benton
024 SR 240 to Benton/Grant Co. line 38.71 43.79 5.08 T-2 6,490,000 980 22.8% Benton
024 Benton/Grant Co. line to SR 243 43.79 44.13 0.34 T-2 6,490,000 980 22.8% Grant
026 I-90 to Grant/Adams Co. Line 0.00 31.17 31.17 T-2 6,130,000 900 25.7% Grant
026 Grant/Adams Co. line to SR 17 31.17 42.58 11.41 T-2 6,130,000 900 25.7% Adams
026 SR 127 to US 195 116.92 133.53 16.61 T-2 3,990,000 630 25.2% Whitman
028 Douglas/Grant Co. line to 7th Ave SW 22.03 29.26 7.23 T-2 7,160,000 1,500 17.4% Grant
028 7th Ave SW to SR 281 29.26 29.77 0.51 T-2 9,820,000 1,700 13.1% Grant 028 SR 281 to Adams Rd 29.77 33.79 4.02 T-2 3,714,776 891 10.3% Grant028 SR 2 to 15th St 0 B 2.78 B 2.78 T-2 7,820,000 1,500 8.8% Douglas
028 15th St to SR 285 (includes Wenatchee Couplet)
2.78 B 3.84 B 1.06 T-2 8,030,000 1,500 8.3% Douglas
028 SR 285 to Grant Rd 3.84 B 4.31 B 0.47 T-2 6,140,851 1,192 8.4% Douglas
028 Grant Rd to Douglas/Grant Co. line 4.31 B 22.03 21.79 T-2 7,160,000 1,500 17.4% Douglas
028SPWENTCH
Wenatchee Spur (included in Mainline) 4.25 5.01 0.76 T-2 3,714,776 640 4.0% Douglas
082 I-90 to Kittitas/Yakima Co. line 0.00 19.88 19.88 T-1 21,900,000 3,500 15.9% Kittitas
082 Kittitas/Yakima Co. line to SR 22 19.88 50.63 30.72 T-1 21,900,000 3,500 15.9% Yakima
082 SR 22 to Yakima/Benton Co. line
50.63 75.37 24.74 T-1 17,190,000 2,700 14.2% Yakima
082 Yakima/Benton Co. line to I-182 75.37 102.87 27.50 T-1 17,190,000 2,700 14.2% Benton
082 I-182 to US 395 102.87 113.71 10.84 T-1 13,360,000 2,200 20.0% Benton
082 US 395 to Oregon State Line 113.71 132.60 18.89 T-1 21,870,000 3,500 19.4% Benton
090 4th to I-5 (Seattle) 1.94 2.79 0.85 T-1 10,920,000 3,000 9.4% King
Appendix G: 2015 FGTS State Route T-1 and T-2, Sorted by State Route
Washington State Freight and Goods Transportation System 2015 Update | March 201624
StateRoute (SR)
Description Begin SR
Milepost
End SR Milepost
Length 2015FGTSClass
Annual Tonnage
Average Annual
Daily Truck
Volume
Truck Percen-tage
County
090 I-5 (Seattle) to SR 18 2.79 25.65 22.87 T-1 29,860,000 6,600 6.4% King
090 SR 18 to SR 202, North Bend 25.65 31.00 5.35 T-1 44,620,000 7,200 16.4% King
090 SR 202 to King/Kittitas Co. line 31.00 52.61 21.88 T-1 35,830,000 5,600 19.3% King
090 King/Kittitas Co. line to I-82 52.61 110.13 57.46 T-1 35,830,000 5,600 19.3% Kittitas
090 I-82 to Kittitas/Grant Co. line 110.13 137.57 27.44 T-1 20,010,000 3,100 22.1% Kittitas
090 Kittitas/Grant Co. line to SR 17 137.57 179.81 42.24 T-1 20,010,000 3,100 22.1% Grant
090 SR 17 to Grant/Adams Co. line 179.81 191.89 12.08 T-1 13,240,000 2,200 22.0% Grant
090 Grant/Adams Co. line to SR 395 191.89 221.55 29.09 T-1 13,240,000 2,200 22.0% Adams
090 SR 395 to Adams/Lincoln Co. line 221.55 239.11 17.56 T-1 26,900,000 4,100 24.1% Adams
090 Adams/Lincoln Co. line Lincoln/Spokane Co. line
239.11 255.29 16.18 T-1 26,900,000 4,100 24.1% Lincoln
090 Lincoln/Spokane Co. line to SR 904 255.29 271.03 15.74 T-1 26,900,000 4,100 24.1% Spokane
090 SR 904 to US 2 271.03 278.40 7.37 T-1 31,060,000 5,200 15.8% Spokane
090 US 2 to Idaho State line 278.40 299.82 21.40 T-1 28,610,000 5,700 7.1% Spokane
092 SR 9 to Granite Falls 0.00 8.26 8.25 T-2 6,160,000 1,700 12.1% Snohomish
097 SR 14 to Klickitat/Yakima Co. line(includes Maryhill Couplet)
2.31 33.52 30.67 T-2 8,914,291 1,402 32.6% Klickitat
097 Klickitat/Yakima Co. line to W 1st Ave 33.52 61.98 28.37 T-2 8,900,000 1,400 32.6% Yakima
097 W 1st Ave to I-82/coincident 61.98 76.36 14.34 T-2 7,750,000 1,400 10.0% Yakima
097 I-90 to SR 970 133.90 149.69 15.92 T-2 3,640,000 650 24.1% Kittitas
097 SR 970 to Kittitas/Chelan Co. line 149.69 163.98 14.29 T-2 6,720,000 1,100 20.0% Kittitas
097 Kittitas/Chelan Co. line to US 2 (Peshastin)/coincident
163.98 184.95 20.97 T-2 6,720,000 1,100 20.0% Chelan
097 US 2 (Orondo) to Douglas/Chelan Co. line
213.00 234.87 21.87 T-2 3,720,000 770 15.4% Douglas
097 Douglas/Chelan Co. line to SR 150 234.87 235.10 0.23 T-2 3,720,000 770 15.4% Chelan
097 SR 150 to Chelan/Okanogan Co. line
235.10 246.97 11.87 T-2 3,230,000 600 14.0% Chelan
097 Chelan/Okanogan Co. line to Canadian border
246.97 336.48 89.49 T-2 3,230,000 600 14.0% Okanogan
097 Oregon State line to SR 14 0 B 2.31 2.55 T-1 9,180,000 1,400 26.4% Klickitat
097AR Alt. Rt,. US 2 to Ohme Garden Rd /Warehouse Rd
199.83 200.47 0.64 T-2 6,430,000 1,200 14.1% Chelan
Appendix G: 2015 FGTS State Route T-1 and T-2, Sorted by State Route
Washington State Freight and Goods Transportation System 2015 Update | March 2016 25
StateRoute (SR)
Description Begin SR
Milepost
End SR Milepost
Length 2015FGTSClass
Annual Tonnage
Average Annual
Daily Truck
Volume
Truck Percen-tage
County
099 I-5 (Fife) to 70th Ave E 0.00 1.18 1.18 T-1 14,690,000 3,100 12.9% Pierce
099 70th Ave E to Pierce/King Co. line 1.18 6.15 1.32 T-2 8,170,000 1,900 9.0% Pierce
099 Pierce/King Co. line to SR 18 6.15 8.14 1.99 T-2 8,170,000 1,900 9.0% King
099 SR 516 to SR 518/physical gap 15.49 20.43 4.94 T-2 3,740,000 1,700 6.1% King
099 Physical gap/SR 599 to E Marginal Way 22.97 26.42 3.45 T-1 20,410,000 4,200 13.5% King
099 E Marginal Way to Elliot Ave (includes Alaska Way Viaduct Couplet)
26.55 31.72 5.21 T-1 10,035,470 3,219 5.9% King
099 Elliot Ave to N 105th St/ N Northgate Way 31.72 38.47 6.75 T-2 3,160,000 1,400 2.9% King
101 SR 105 (Aberdeen) to Aberdeen Couplet (includes Aberdeen & Heron Couplets)
83.17 87.49 4.42 T-2 5,765,660 3,308 6.3% Grays Harbor
101 SR 112 to SR 117 242.61 246.07 3.46 T-2 6,350,000 1,500 15.0% Clallam
101 1st St /Lincoln St to Golf Course Rd (includes Port Angeles Couplet)
248.06 249.65 1.59 T-2 4,186,792 1,316 4.0% Clallam
101 Golf Course Rd to Clallam/Jefferson Co. line
249.65 274.65 24.70 T-2 4,700,000 1,100 6.9% Clallam
101 Clallam/Jefferson Co. line to SR 104 274.65 284.95 10.30 T-2 4,700,000 1,100 6.9% Jefferson
101 Wallace Blvd. to SR 3 345.65 349.16 3.51 T-2 5,040,000 1,200 7.5% Mason
101 SR 3 to Mason/Thurston Co. line
349.16 356.92 6.99 T-2 7,970,000 1,800 7.5% Mason
101 Mason/Thurston Co. line to SR 8/physical gap
356.92 361.40 4.48 T-2 7,970,000 1,800 7.5% Thurston
101 SR 8 to I-5 361.52 367.41 5.89 T-1 9,880,000 2,400 4.9% Thurston 104 US 101 to SR 19 0.20 8.87 8.67 T-2 4,100,000 930 12.9% Jefferson
104 SR 19 to Jefferson/Kitsap Co. line
8.87 14.67 5.80 T-2 5,960,000 1,200 8.6% Jefferson
104 Jefferson/Kitsap Co. line to SR 3 14.67 15.54 0.87 T-2 5,960,000 1,200 8.6% Kitsap
117 US 101 to Port Docks 0.00 1.40 1.40 T-2 6,040,000 1,300 24.5% Clallam
125 Oregon State Line to W Rose St 0.00 5.41 5.40 T-2 4,920,000 1,400 10.0% Walla Walla
125 W Rose St to SR 125 SP 5.41 6.09 0.68 T-2 2,010,000 590 10.0% Walla Walla
125SP125SP SR 125 to US 12 6.09 6.82 0.73 T-2 3,840,000 970 24.9% Walla Walla
128 US 12 to Asotin/Whitman Co. line
0.00 0.39 0.39 T-2 5,350,000 1,000 22.2% Asotin
128 Asotin/Whitman Co. line to Idaho State Line 0.39 2.24 1.85 T-2 5,350,000 1,000 22.2% Whitman
Appendix G: 2015 FGTS State Route T-1 and T-2, Sorted by State Route
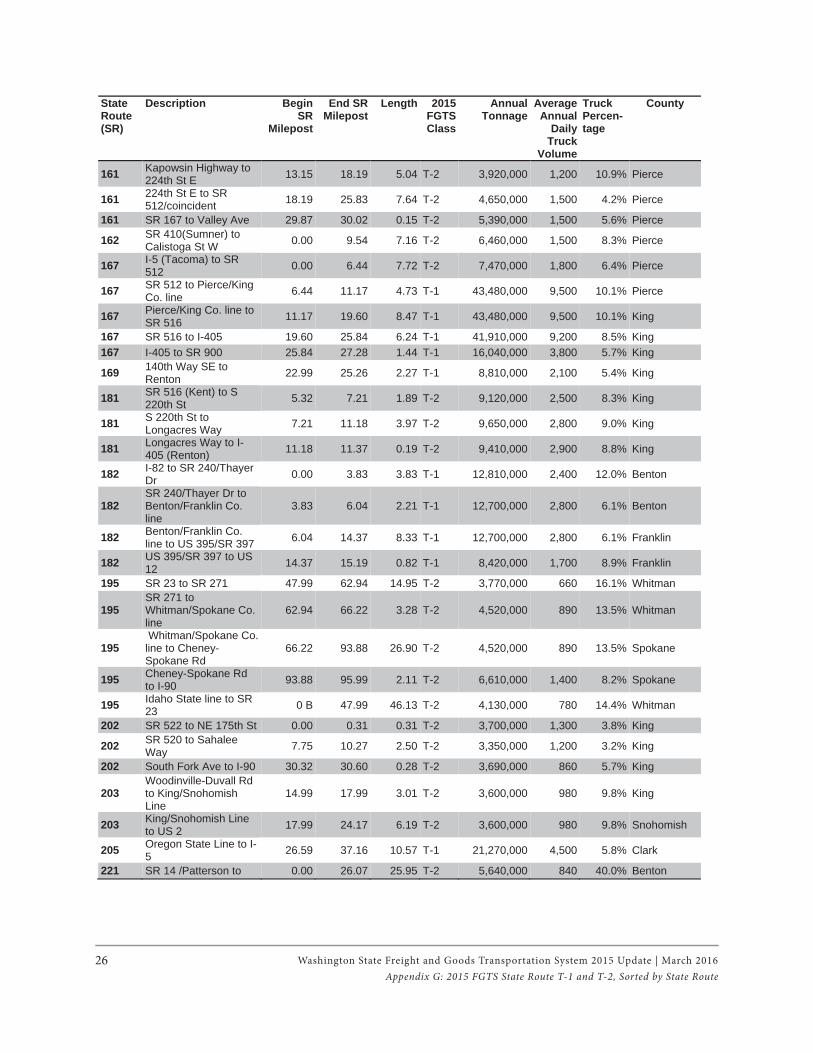
Washington State Freight and Goods Transportation System 2015 Update | March 201626
StateRoute (SR)
Description Begin SR
Milepost
End SR Milepost
Length 2015FGTSClass
Annual Tonnage
Average Annual
Daily Truck
Volume
Truck Percen-tage
County
161 Kapowsin Highway to 224th St E 13.15 18.19 5.04 T-2 3,920,000 1,200 10.9% Pierce
161 224th St E to SR 512/coincident 18.19 25.83 7.64 T-2 4,650,000 1,500 4.2% Pierce
161 SR 167 to Valley Ave 29.87 30.02 0.15 T-2 5,390,000 1,500 5.6% Pierce
162 SR 410(Sumner) to Calistoga St W 0.00 9.54 7.16 T-2 6,460,000 1,500 8.3% Pierce
167 I-5 (Tacoma) to SR 512 0.00 6.44 7.72 T-2 7,470,000 1,800 6.4% Pierce
167 SR 512 to Pierce/King Co. line 6.44 11.17 4.73 T-1 43,480,000 9,500 10.1% Pierce
167 Pierce/King Co. line to SR 516 11.17 19.60 8.47 T-1 43,480,000 9,500 10.1% King
167 SR 516 to I-405 19.60 25.84 6.24 T-1 41,910,000 9,200 8.5% King 167 I-405 to SR 900 25.84 27.28 1.44 T-1 16,040,000 3,800 5.7% King
169 140th Way SE to Renton 22.99 25.26 2.27 T-1 8,810,000 2,100 5.4% King
181 SR 516 (Kent) to S 220th St 5.32 7.21 1.89 T-2 9,120,000 2,500 8.3% King
181 S 220th St to Longacres Way 7.21 11.18 3.97 T-2 9,650,000 2,800 9.0% King
181 Longacres Way to I-405 (Renton) 11.18 11.37 0.19 T-2 9,410,000 2,900 8.8% King
182 I-82 to SR 240/Thayer Dr 0.00 3.83 3.83 T-1 12,810,000 2,400 12.0% Benton
182 SR 240/Thayer Dr to Benton/Franklin Co. line
3.83 6.04 2.21 T-1 12,700,000 2,800 6.1% Benton
182 Benton/Franklin Co. line to US 395/SR 397 6.04 14.37 8.33 T-1 12,700,000 2,800 6.1% Franklin
182 US 395/SR 397 to US 12 14.37 15.19 0.82 T-1 8,420,000 1,700 8.9% Franklin
195 SR 23 to SR 271 47.99 62.94 14.95 T-2 3,770,000 660 16.1% Whitman
195 SR 271 to Whitman/Spokane Co. line
62.94 66.22 3.28 T-2 4,520,000 890 13.5% Whitman
195 Whitman/Spokane Co. line to Cheney-Spokane Rd
66.22 93.88 26.90 T-2 4,520,000 890 13.5% Spokane
195 Cheney-Spokane Rd to I-90 93.88 95.99 2.11 T-2 6,610,000 1,400 8.2% Spokane
195 Idaho State line to SR 23 0 B 47.99 46.13 T-2 4,130,000 780 14.4% Whitman
202 SR 522 to NE 175th St 0.00 0.31 0.31 T-2 3,700,000 1,300 3.8% King
202 SR 520 to Sahalee Way 7.75 10.27 2.50 T-2 3,350,000 1,200 3.2% King
202 South Fork Ave to I-90 30.32 30.60 0.28 T-2 3,690,000 860 5.7% King
203 Woodinville-Duvall Rd to King/Snohomish Line
14.99 17.99 3.01 T-2 3,600,000 980 9.8% King
203 King/Snohomish Line to US 2 17.99 24.17 6.19 T-2 3,600,000 980 9.8% Snohomish
205 Oregon State Line to I-5 26.59 37.16 10.57 T-1 21,270,000 4,500 5.8% Clark
221 SR 14 /Patterson to 0.00 26.07 25.95 T-2 5,640,000 840 40.0% Benton
Appendix G: 2015 FGTS State Route T-1 and T-2, Sorted by State Route
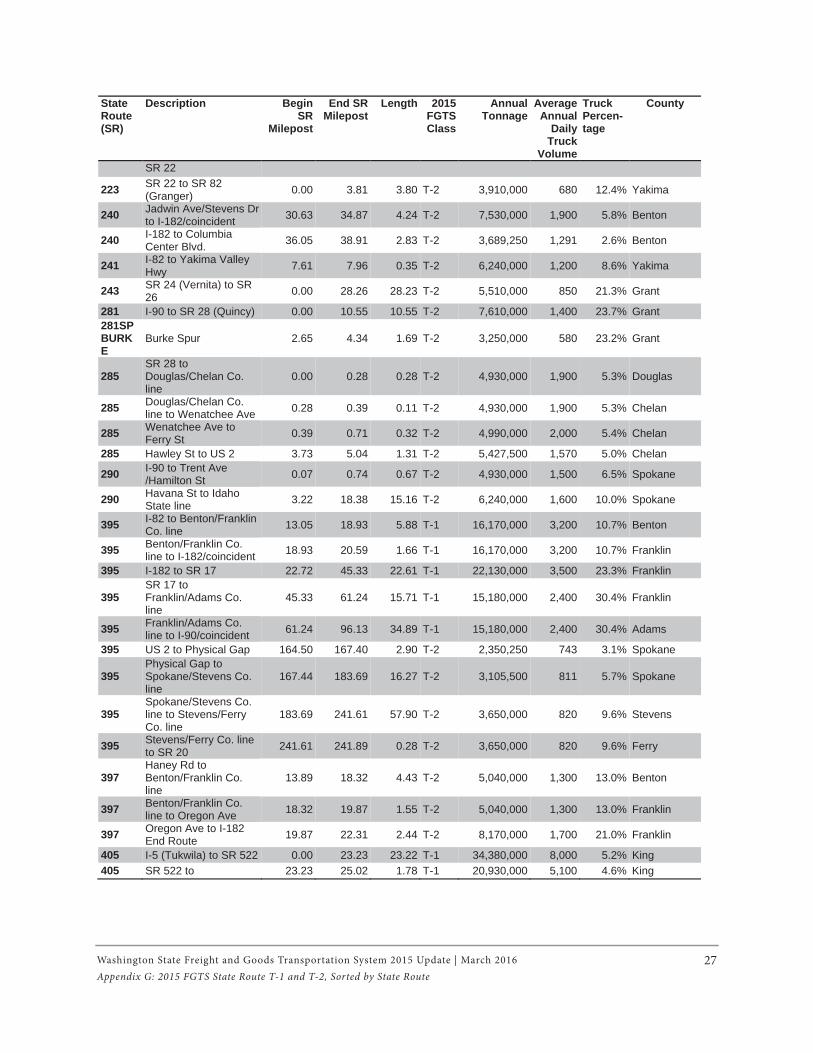
Washington State Freight and Goods Transportation System 2015 Update | March 2016 27
StateRoute (SR)
Description Begin SR
Milepost
End SR Milepost
Length 2015FGTSClass
Annual Tonnage
Average Annual
Daily Truck
Volume
Truck Percen-tage
County
SR 22
223 SR 22 to SR 82 (Granger) 0.00 3.81 3.80 T-2 3,910,000 680 12.4% Yakima
240 Jadwin Ave/Stevens Dr to I-182/coincident 30.63 34.87 4.24 T-2 7,530,000 1,900 5.8% Benton
240 I-182 to Columbia Center Blvd. 36.05 38.91 2.83 T-2 3,689,250 1,291 2.6% Benton
241 I-82 to Yakima Valley Hwy 7.61 7.96 0.35 T-2 6,240,000 1,200 8.6% Yakima
243 SR 24 (Vernita) to SR 26 0.00 28.26 28.23 T-2 5,510,000 850 21.3% Grant
281 I-90 to SR 28 (Quincy) 0.00 10.55 10.55 T-2 7,610,000 1,400 23.7% Grant281SPBURKE
Burke Spur 2.65 4.34 1.69 T-2 3,250,000 580 23.2% Grant
285 SR 28 to Douglas/Chelan Co. line
0.00 0.28 0.28 T-2 4,930,000 1,900 5.3% Douglas
285 Douglas/Chelan Co. line to Wenatchee Ave 0.28 0.39 0.11 T-2 4,930,000 1,900 5.3% Chelan
285 Wenatchee Ave to Ferry St 0.39 0.71 0.32 T-2 4,990,000 2,000 5.4% Chelan
285 Hawley St to US 2 3.73 5.04 1.31 T-2 5,427,500 1,570 5.0% Chelan
290 I-90 to Trent Ave /Hamilton St 0.07 0.74 0.67 T-2 4,930,000 1,500 6.5% Spokane
290 Havana St to Idaho State line 3.22 18.38 15.16 T-2 6,240,000 1,600 10.0% Spokane
395 I-82 to Benton/Franklin Co. line 13.05 18.93 5.88 T-1 16,170,000 3,200 10.7% Benton
395 Benton/Franklin Co. line to I-182/coincident 18.93 20.59 1.66 T-1 16,170,000 3,200 10.7% Franklin
395 I-182 to SR 17 22.72 45.33 22.61 T-1 22,130,000 3,500 23.3% Franklin
395 SR 17 to Franklin/Adams Co. line
45.33 61.24 15.71 T-1 15,180,000 2,400 30.4% Franklin
395 Franklin/Adams Co. line to I-90/coincident 61.24 96.13 34.89 T-1 15,180,000 2,400 30.4% Adams
395 US 2 to Physical Gap 164.50 167.40 2.90 T-2 2,350,250 743 3.1% Spokane
395 Physical Gap to Spokane/Stevens Co. line
167.44 183.69 16.27 T-2 3,105,500 811 5.7% Spokane
395 Spokane/Stevens Co. line to Stevens/Ferry Co. line
183.69 241.61 57.90 T-2 3,650,000 820 9.6% Stevens
395 Stevens/Ferry Co. line to SR 20 241.61 241.89 0.28 T-2 3,650,000 820 9.6% Ferry
397 Haney Rd to Benton/Franklin Co. line
13.89 18.32 4.43 T-2 5,040,000 1,300 13.0% Benton
397 Benton/Franklin Co. line to Oregon Ave 18.32 19.87 1.55 T-2 5,040,000 1,300 13.0% Franklin
397 Oregon Ave to I-182 End Route 19.87 22.31 2.44 T-2 8,170,000 1,700 21.0% Franklin
405 I-5 (Tukwila) to SR 522 0.00 23.23 23.22 T-1 34,380,000 8,000 5.2% King405 SR 522 to 23.23 25.02 1.78 T-1 20,930,000 5,100 4.6% King
Appendix G: 2015 FGTS State Route T-1 and T-2, Sorted by State Route
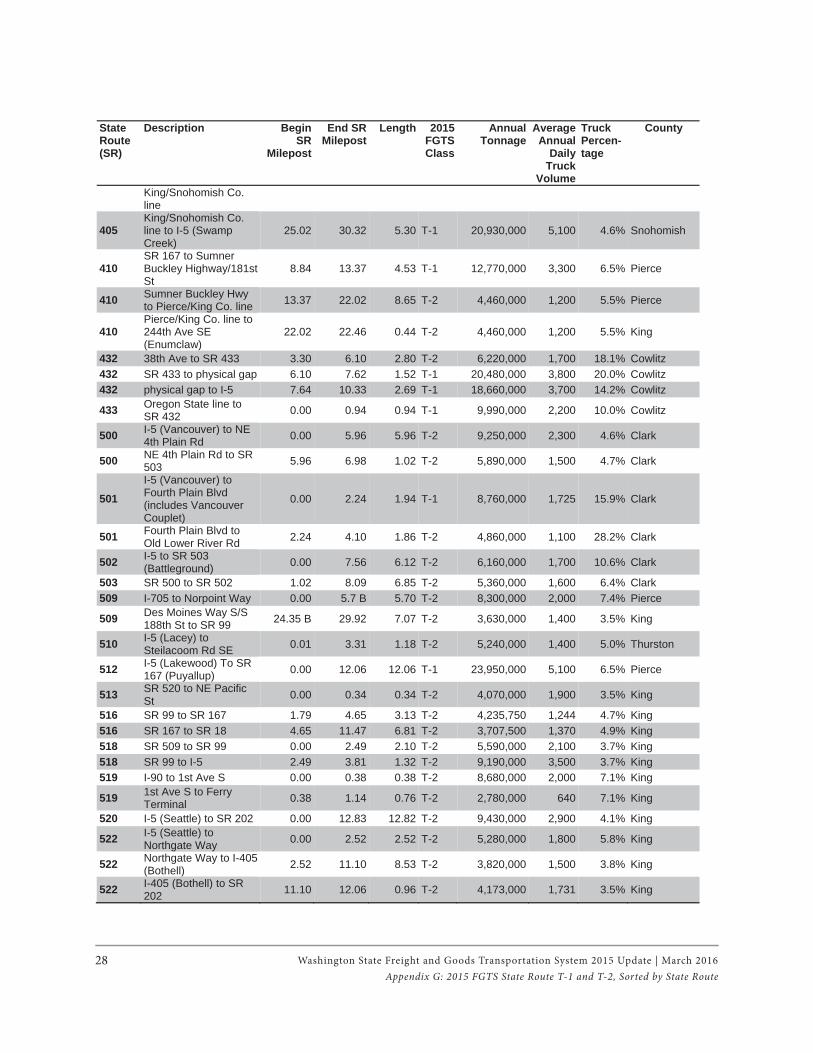
Washington State Freight and Goods Transportation System 2015 Update | March 201628
StateRoute (SR)
Description Begin SR
Milepost
End SR Milepost
Length 2015FGTSClass
Annual Tonnage
Average Annual
Daily Truck
Volume
Truck Percen-tage
County
King/Snohomish Co. line
405 King/Snohomish Co. line to I-5 (Swamp Creek)
25.02 30.32 5.30 T-1 20,930,000 5,100 4.6% Snohomish
410 SR 167 to Sumner Buckley Highway/181st St
8.84 13.37 4.53 T-1 12,770,000 3,300 6.5% Pierce
410 Sumner Buckley Hwy to Pierce/King Co. line 13.37 22.02 8.65 T-2 4,460,000 1,200 5.5% Pierce
410 Pierce/King Co. line to 244th Ave SE (Enumclaw)
22.02 22.46 0.44 T-2 4,460,000 1,200 5.5% King
432 38th Ave to SR 433 3.30 6.10 2.80 T-2 6,220,000 1,700 18.1% Cowlitz 432 SR 433 to physical gap 6.10 7.62 1.52 T-1 20,480,000 3,800 20.0% Cowlitz 432 physical gap to I-5 7.64 10.33 2.69 T-1 18,660,000 3,700 14.2% Cowlitz
433 Oregon State line to SR 432 0.00 0.94 0.94 T-1 9,990,000 2,200 10.0% Cowlitz
500 I-5 (Vancouver) to NE 4th Plain Rd 0.00 5.96 5.96 T-2 9,250,000 2,300 4.6% Clark
500 NE 4th Plain Rd to SR 503 5.96 6.98 1.02 T-2 5,890,000 1,500 4.7% Clark
501 I-5 (Vancouver) to Fourth Plain Blvd (includes Vancouver Couplet)
0.00 2.24 1.94 T-1 8,760,000 1,725 15.9% Clark
501 Fourth Plain Blvd to Old Lower River Rd 2.24 4.10 1.86 T-2 4,860,000 1,100 28.2% Clark
502 I-5 to SR 503 (Battleground) 0.00 7.56 6.12 T-2 6,160,000 1,700 10.6% Clark
503 SR 500 to SR 502 1.02 8.09 6.85 T-2 5,360,000 1,600 6.4% Clark 509 I-705 to Norpoint Way 0.00 5.7 B 5.70 T-2 8,300,000 2,000 7.4% Pierce
509 Des Moines Way S/S 188th St to SR 99 24.35 B 29.92 7.07 T-2 3,630,000 1,400 3.5% King
510 I-5 (Lacey) to Steilacoom Rd SE 0.01 3.31 1.18 T-2 5,240,000 1,400 5.0% Thurston
512 I-5 (Lakewood) To SR 167 (Puyallup) 0.00 12.06 12.06 T-1 23,950,000 5,100 6.5% Pierce
513 SR 520 to NE Pacific St 0.00 0.34 0.34 T-2 4,070,000 1,900 3.5% King
516 SR 99 to SR 167 1.79 4.65 3.13 T-2 4,235,750 1,244 4.7% King 516 SR 167 to SR 18 4.65 11.47 6.81 T-2 3,707,500 1,370 4.9% King518 SR 509 to SR 99 0.00 2.49 2.10 T-2 5,590,000 2,100 3.7% King 518 SR 99 to I-5 2.49 3.81 1.32 T-2 9,190,000 3,500 3.7% King519 I-90 to 1st Ave S 0.00 0.38 0.38 T-2 8,680,000 2,000 7.1% King
519 1st Ave S to Ferry Terminal 0.38 1.14 0.76 T-2 2,780,000 640 7.1% King
520 I-5 (Seattle) to SR 202 0.00 12.83 12.82 T-2 9,430,000 2,900 4.1% King
522 I-5 (Seattle) to Northgate Way 0.00 2.52 2.52 T-2 5,280,000 1,800 5.8% King
522 Northgate Way to I-405 (Bothell) 2.52 11.10 8.53 T-2 3,820,000 1,500 3.8% King
522 I-405 (Bothell) to SR 202 11.10 12.06 0.96 T-2 4,173,000 1,731 3.5% King
Appendix G: 2015 FGTS State Route T-1 and T-2, Sorted by State Route
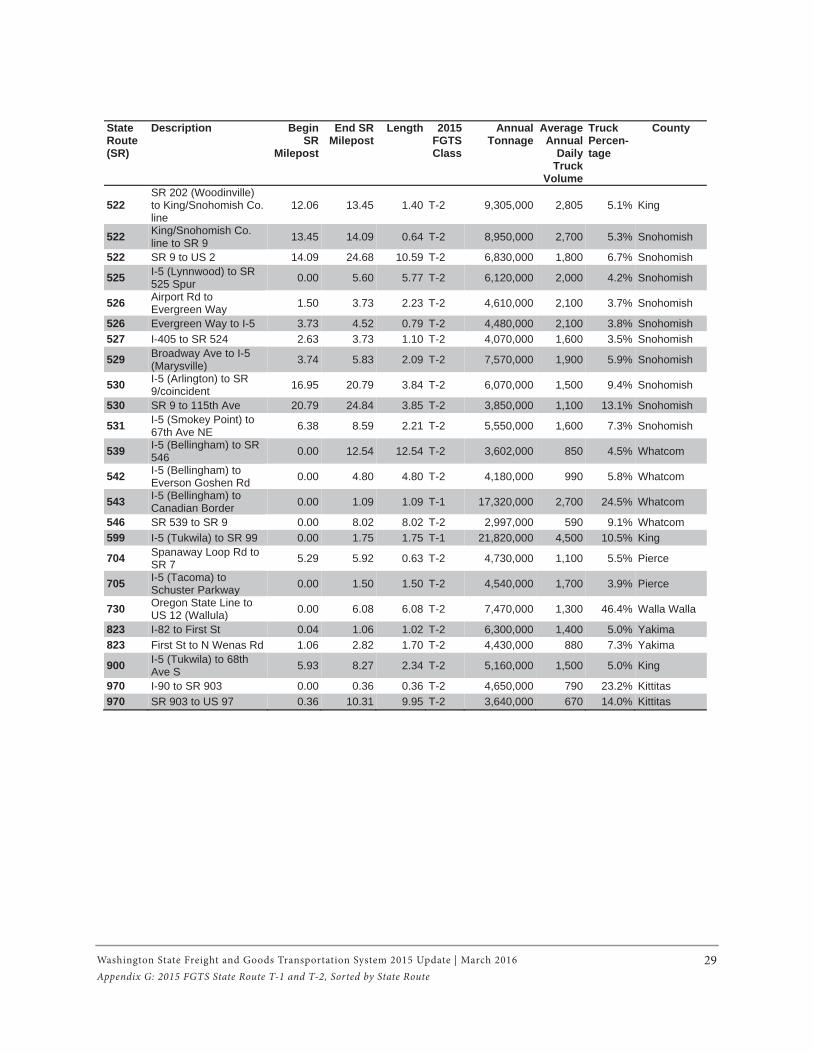
Washington State Freight and Goods Transportation System 2015 Update | March 2016 29
StateRoute (SR)
Description Begin SR
Milepost
End SR Milepost
Length 2015FGTSClass
Annual Tonnage
Average Annual
Daily Truck
Volume
Truck Percen-tage
County
522 SR 202 (Woodinville) to King/Snohomish Co. line
12.06 13.45 1.40 T-2 9,305,000 2,805 5.1% King
522 King/Snohomish Co. line to SR 9 13.45 14.09 0.64 T-2 8,950,000 2,700 5.3% Snohomish
522 SR 9 to US 2 14.09 24.68 10.59 T-2 6,830,000 1,800 6.7% Snohomish
525 I-5 (Lynnwood) to SR 525 Spur 0.00 5.60 5.77 T-2 6,120,000 2,000 4.2% Snohomish
526 Airport Rd to Evergreen Way 1.50 3.73 2.23 T-2 4,610,000 2,100 3.7% Snohomish
526 Evergreen Way to I-5 3.73 4.52 0.79 T-2 4,480,000 2,100 3.8% Snohomish 527 I-405 to SR 524 2.63 3.73 1.10 T-2 4,070,000 1,600 3.5% Snohomish
529 Broadway Ave to I-5 (Marysville) 3.74 5.83 2.09 T-2 7,570,000 1,900 5.9% Snohomish
530 I-5 (Arlington) to SR 9/coincident 16.95 20.79 3.84 T-2 6,070,000 1,500 9.4% Snohomish
530 SR 9 to 115th Ave 20.79 24.84 3.85 T-2 3,850,000 1,100 13.1% Snohomish
531 I-5 (Smokey Point) to 67th Ave NE 6.38 8.59 2.21 T-2 5,550,000 1,600 7.3% Snohomish
539 I-5 (Bellingham) to SR 546 0.00 12.54 12.54 T-2 3,602,000 850 4.5% Whatcom
542 I-5 (Bellingham) to Everson Goshen Rd 0.00 4.80 4.80 T-2 4,180,000 990 5.8% Whatcom
543 I-5 (Bellingham) to Canadian Border 0.00 1.09 1.09 T-1 17,320,000 2,700 24.5% Whatcom
546 SR 539 to SR 9 0.00 8.02 8.02 T-2 2,997,000 590 9.1% Whatcom 599 I-5 (Tukwila) to SR 99 0.00 1.75 1.75 T-1 21,820,000 4,500 10.5% King
704 Spanaway Loop Rd to SR 7 5.29 5.92 0.63 T-2 4,730,000 1,100 5.5% Pierce
705 I-5 (Tacoma) to Schuster Parkway 0.00 1.50 1.50 T-2 4,540,000 1,700 3.9% Pierce
730 Oregon State Line to US 12 (Wallula) 0.00 6.08 6.08 T-2 7,470,000 1,300 46.4% Walla Walla
823 I-82 to First St 0.04 1.06 1.02 T-2 6,300,000 1,400 5.0% Yakima823 First St to N Wenas Rd 1.06 2.82 1.70 T-2 4,430,000 880 7.3% Yakima
900 I-5 (Tukwila) to 68th Ave S 5.93 8.27 2.34 T-2 5,160,000 1,500 5.0% King
970 I-90 to SR 903 0.00 0.36 0.36 T-2 4,650,000 790 23.2% Kittitas 970 SR 903 to US 97 0.36 10.31 9.95 T-2 3,640,000 670 14.0% Kittitas
Appendix G: 2015 FGTS State Route T-1 and T-2, Sorted by State Route
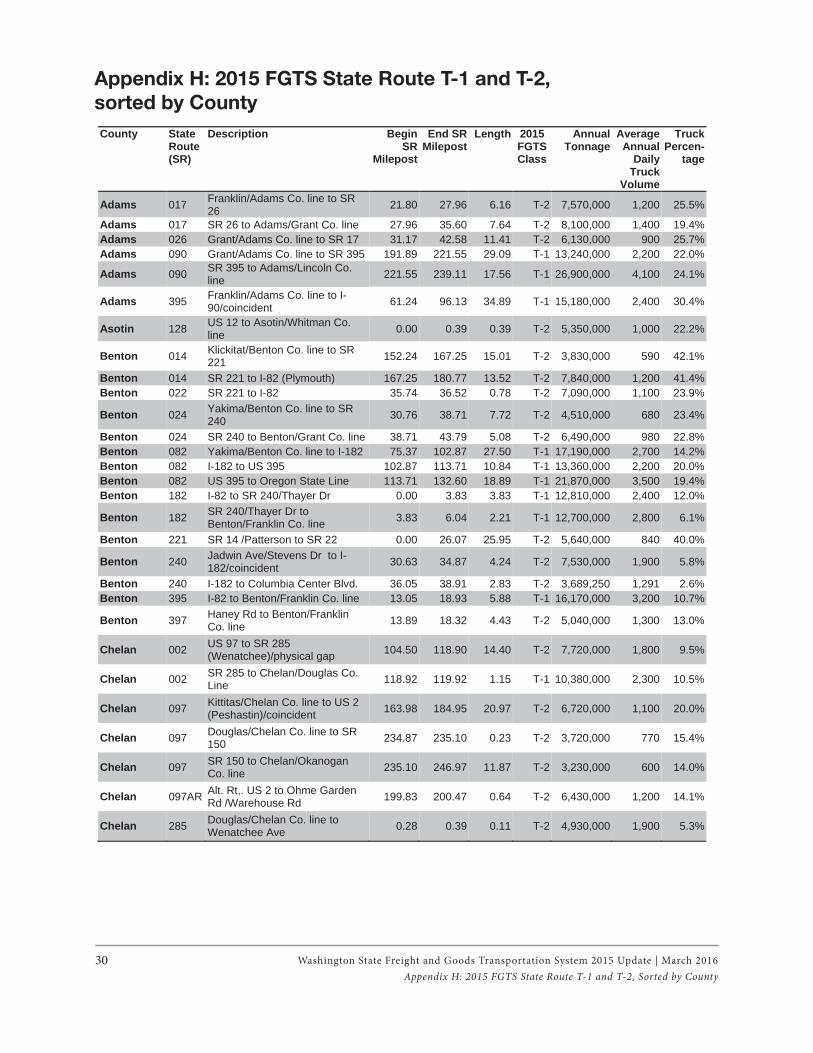
Washington State Freight and Goods Transportation System 2015 Update | March 201630
County State Route (SR)
Description Begin SR
Milepost
End SR Milepost
Length 2015 FGTSClass
Annual Tonnage
Average Annual
Daily Truck
Volume
Truck Percen-
tage
Adams 017 Franklin/Adams Co. line to SR 26 21.80 27.96 6.16 T-2 7,570,000 1,200 25.5%
Adams 017 SR 26 to Adams/Grant Co. line 27.96 35.60 7.64 T-2 8,100,000 1,400 19.4%Adams 026 Grant/Adams Co. line to SR 17 31.17 42.58 11.41 T-2 6,130,000 900 25.7%Adams 090 Grant/Adams Co. line to SR 395 191.89 221.55 29.09 T-1 13,240,000 2,200 22.0%
Adams 090 SR 395 to Adams/Lincoln Co. line 221.55 239.11 17.56 T-1 26,900,000 4,100 24.1%
Adams 395 Franklin/Adams Co. line to I-90/coincident 61.24 96.13 34.89 T-1 15,180,000 2,400 30.4%
Asotin 128 US 12 to Asotin/Whitman Co. line 0.00 0.39 0.39 T-2 5,350,000 1,000 22.2%
Benton 014 Klickitat/Benton Co. line to SR 221 152.24 167.25 15.01 T-2 3,830,000 590 42.1%
Benton 014 SR 221 to I-82 (Plymouth) 167.25 180.77 13.52 T-2 7,840,000 1,200 41.4%Benton 022 SR 221 to I-82 35.74 36.52 0.78 T-2 7,090,000 1,100 23.9%
Benton 024 Yakima/Benton Co. line to SR 240 30.76 38.71 7.72 T-2 4,510,000 680 23.4%
Benton 024 SR 240 to Benton/Grant Co. line 38.71 43.79 5.08 T-2 6,490,000 980 22.8%Benton 082 Yakima/Benton Co. line to I-182 75.37 102.87 27.50 T-1 17,190,000 2,700 14.2%Benton 082 I-182 to US 395 102.87 113.71 10.84 T-1 13,360,000 2,200 20.0%Benton 082 US 395 to Oregon State Line 113.71 132.60 18.89 T-1 21,870,000 3,500 19.4%Benton 182 I-82 to SR 240/Thayer Dr 0.00 3.83 3.83 T-1 12,810,000 2,400 12.0%
Benton 182 SR 240/Thayer Dr to Benton/Franklin Co. line 3.83 6.04 2.21 T-1 12,700,000 2,800 6.1%
Benton 221 SR 14 /Patterson to SR 22 0.00 26.07 25.95 T-2 5,640,000 840 40.0%
Benton 240 Jadwin Ave/Stevens Dr to I-182/coincident 30.63 34.87 4.24 T-2 7,530,000 1,900 5.8%
Benton 240 I-182 to Columbia Center Blvd. 36.05 38.91 2.83 T-2 3,689,250 1,291 2.6%Benton 395 I-82 to Benton/Franklin Co. line 13.05 18.93 5.88 T-1 16,170,000 3,200 10.7%
Benton 397 Haney Rd to Benton/Franklin Co. line 13.89 18.32 4.43 T-2 5,040,000 1,300 13.0%
Chelan 002 US 97 to SR 285 (Wenatchee)/physical gap 104.50 118.90 14.40 T-2 7,720,000 1,800 9.5%
Chelan 002 SR 285 to Chelan/Douglas Co. Line 118.92 119.92 1.15 T-1 10,380,000 2,300 10.5%
Chelan 097 Kittitas/Chelan Co. line to US 2 (Peshastin)/coincident 163.98 184.95 20.97 T-2 6,720,000 1,100 20.0%
Chelan 097 Douglas/Chelan Co. line to SR 150 234.87 235.10 0.23 T-2 3,720,000 770 15.4%
Chelan 097 SR 150 to Chelan/Okanogan Co. line 235.10 246.97 11.87 T-2 3,230,000 600 14.0%
Chelan 097AR Alt. Rt,. US 2 to Ohme Garden Rd /Warehouse Rd 199.83 200.47 0.64 T-2 6,430,000 1,200 14.1%
Chelan 285 Douglas/Chelan Co. line to Wenatchee Ave 0.28 0.39 0.11 T-2 4,930,000 1,900 5.3%
Appendix H: 2015 FGTS State Route T-1 and T-2,
sorted by County
Appendix H: 2015 FGTS State Route T-1 and T-2, Sorted by County
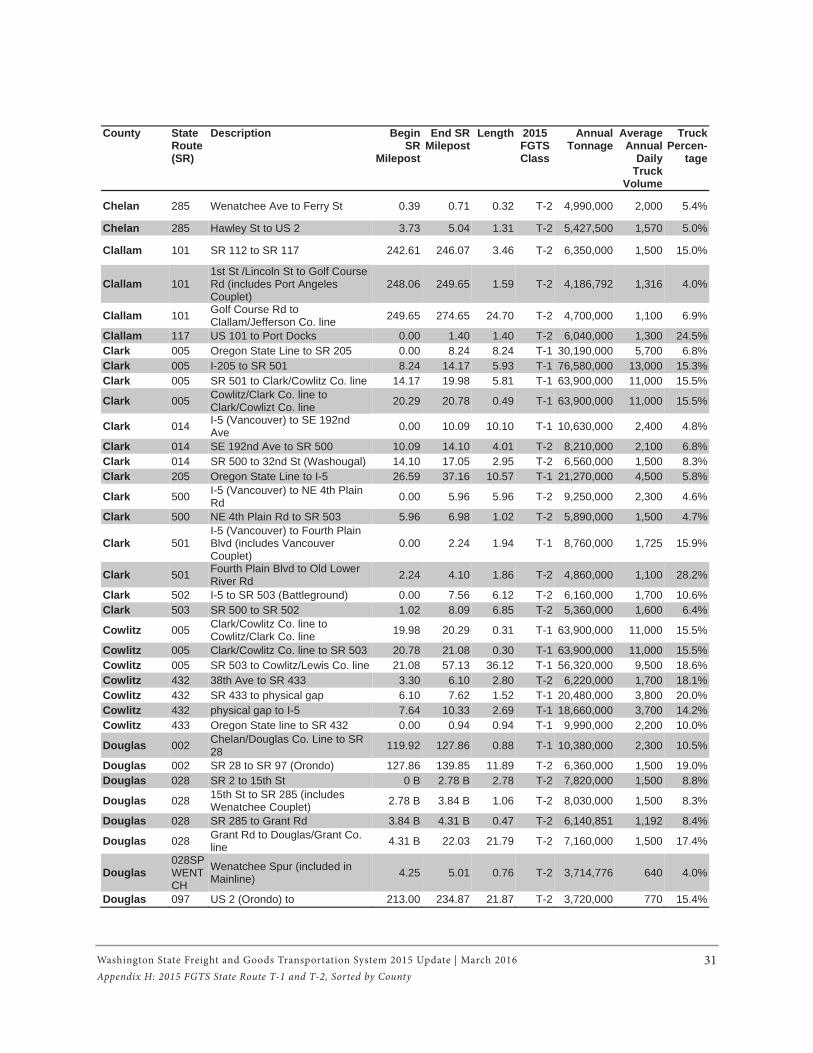
Washington State Freight and Goods Transportation System 2015 Update | March 2016 31
County State Route (SR)
Description Begin SR
Milepost
End SR Milepost
Length 2015 FGTSClass
Annual Tonnage
Average Annual
Daily Truck
Volume
Truck Percen-
tage
Chelan 285 Wenatchee Ave to Ferry St 0.39 0.71 0.32 T-2 4,990,000 2,000 5.4%
Chelan 285 Hawley St to US 2 3.73 5.04 1.31 T-2 5,427,500 1,570 5.0%
Clallam 101 SR 112 to SR 117 242.61 246.07 3.46 T-2 6,350,000 1,500 15.0%
Clallam 101 1st St /Lincoln St to Golf Course Rd (includes Port Angeles Couplet)
248.06 249.65 1.59 T-2 4,186,792 1,316 4.0%
Clallam 101 Golf Course Rd to Clallam/Jefferson Co. line 249.65 274.65 24.70 T-2 4,700,000 1,100 6.9%
Clallam 117 US 101 to Port Docks 0.00 1.40 1.40 T-2 6,040,000 1,300 24.5%Clark 005 Oregon State Line to SR 205 0.00 8.24 8.24 T-1 30,190,000 5,700 6.8%Clark 005 I-205 to SR 501 8.24 14.17 5.93 T-1 76,580,000 13,000 15.3%Clark 005 SR 501 to Clark/Cowlitz Co. line 14.17 19.98 5.81 T-1 63,900,000 11,000 15.5%
Clark 005 Cowlitz/Clark Co. line to Clark/Cowlizt Co. line 20.29 20.78 0.49 T-1 63,900,000 11,000 15.5%
Clark 014 I-5 (Vancouver) to SE 192nd Ave 0.00 10.09 10.10 T-1 10,630,000 2,400 4.8%
Clark 014 SE 192nd Ave to SR 500 10.09 14.10 4.01 T-2 8,210,000 2,100 6.8%Clark 014 SR 500 to 32nd St (Washougal) 14.10 17.05 2.95 T-2 6,560,000 1,500 8.3%Clark 205 Oregon State Line to I-5 26.59 37.16 10.57 T-1 21,270,000 4,500 5.8%
Clark 500 I-5 (Vancouver) to NE 4th Plain Rd 0.00 5.96 5.96 T-2 9,250,000 2,300 4.6%
Clark 500 NE 4th Plain Rd to SR 503 5.96 6.98 1.02 T-2 5,890,000 1,500 4.7%
Clark 501 I-5 (Vancouver) to Fourth Plain Blvd (includes Vancouver Couplet)
0.00 2.24 1.94 T-1 8,760,000 1,725 15.9%
Clark 501 Fourth Plain Blvd to Old Lower River Rd 2.24 4.10 1.86 T-2 4,860,000 1,100 28.2%
Clark 502 I-5 to SR 503 (Battleground) 0.00 7.56 6.12 T-2 6,160,000 1,700 10.6%Clark 503 SR 500 to SR 502 1.02 8.09 6.85 T-2 5,360,000 1,600 6.4%
Cowlitz 005 Clark/Cowlitz Co. line to Cowlitz/Clark Co. line 19.98 20.29 0.31 T-1 63,900,000 11,000 15.5%
Cowlitz 005 Clark/Cowlitz Co. line to SR 503 20.78 21.08 0.30 T-1 63,900,000 11,000 15.5%Cowlitz 005 SR 503 to Cowlitz/Lewis Co. line 21.08 57.13 36.12 T-1 56,320,000 9,500 18.6%Cowlitz 432 38th Ave to SR 433 3.30 6.10 2.80 T-2 6,220,000 1,700 18.1%Cowlitz 432 SR 433 to physical gap 6.10 7.62 1.52 T-1 20,480,000 3,800 20.0%Cowlitz 432 physical gap to I-5 7.64 10.33 2.69 T-1 18,660,000 3,700 14.2%Cowlitz 433 Oregon State line to SR 432 0.00 0.94 0.94 T-1 9,990,000 2,200 10.0%
Douglas 002 Chelan/Douglas Co. Line to SR 28 119.92 127.86 0.88 T-1 10,380,000 2,300 10.5%
Douglas 002 SR 28 to SR 97 (Orondo) 127.86 139.85 11.89 T-2 6,360,000 1,500 19.0%Douglas 028 SR 2 to 15th St 0 B 2.78 B 2.78 T-2 7,820,000 1,500 8.8%
Douglas 028 15th St to SR 285 (includes Wenatchee Couplet) 2.78 B 3.84 B 1.06 T-2 8,030,000 1,500 8.3%
Douglas 028 SR 285 to Grant Rd 3.84 B 4.31 B 0.47 T-2 6,140,851 1,192 8.4%
Douglas 028 Grant Rd to Douglas/Grant Co. line 4.31 B 22.03 21.79 T-2 7,160,000 1,500 17.4%
Douglas 028SPWENTCH
Wenatchee Spur (included in Mainline) 4.25 5.01 0.76 T-2 3,714,776 640 4.0%
Douglas 097 US 2 (Orondo) to 213.00 234.87 21.87 T-2 3,720,000 770 15.4%
Appendix H: 2015 FGTS State Route T-1 and T-2, Sorted by County
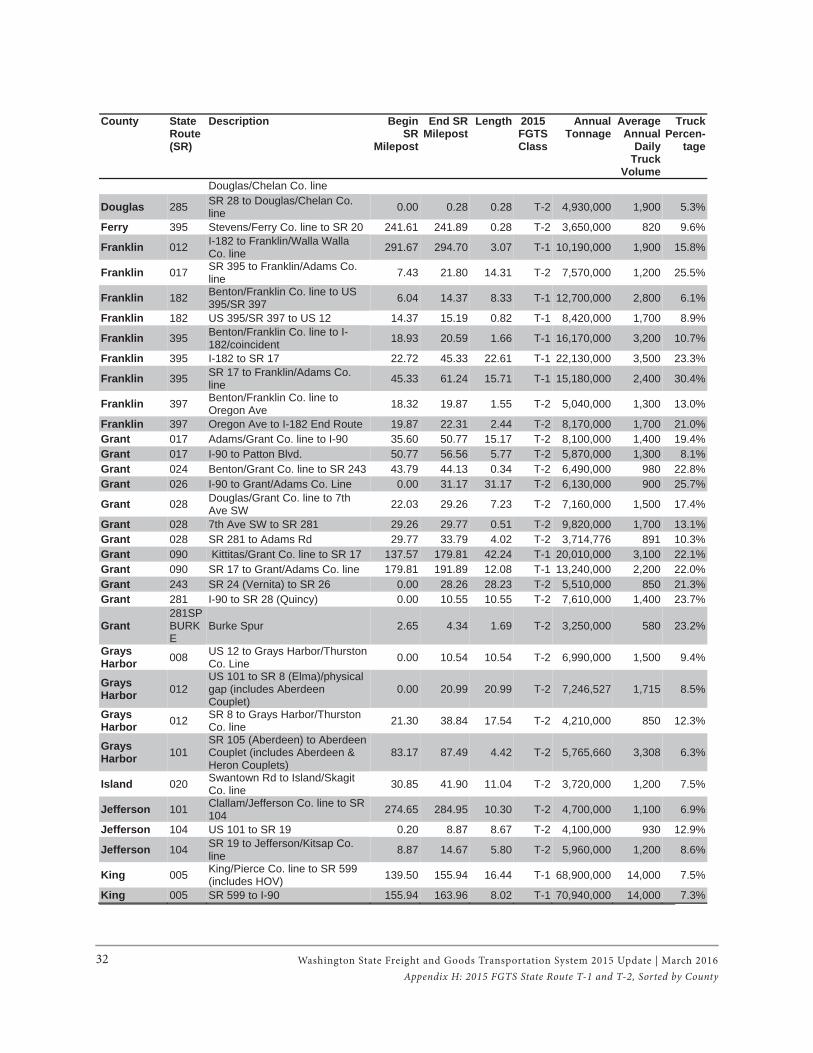
32
County State Route (SR)
Description Begin SR
Milepost
End SR Milepost
Length 2015 FGTSClass
Annual Tonnage
Average Annual
Daily Truck
Volume
Truck Percen-
tage
Douglas/Chelan Co. line
Douglas 285 SR 28 to Douglas/Chelan Co. line 0.00 0.28 0.28 T-2 4,930,000 1,900 5.3%
Ferry 395 Stevens/Ferry Co. line to SR 20 241.61 241.89 0.28 T-2 3,650,000 820 9.6%
Franklin 012 I-182 to Franklin/Walla Walla Co. line 291.67 294.70 3.07 T-1 10,190,000 1,900 15.8%
Franklin 017 SR 395 to Franklin/Adams Co. line 7.43 21.80 14.31 T-2 7,570,000 1,200 25.5%
Franklin 182 Benton/Franklin Co. line to US 395/SR 397 6.04 14.37 8.33 T-1 12,700,000 2,800 6.1%
Franklin 182 US 395/SR 397 to US 12 14.37 15.19 0.82 T-1 8,420,000 1,700 8.9%
Franklin 395 Benton/Franklin Co. line to I-182/coincident 18.93 20.59 1.66 T-1 16,170,000 3,200 10.7%
Franklin 395 I-182 to SR 17 22.72 45.33 22.61 T-1 22,130,000 3,500 23.3%
Franklin 395 SR 17 to Franklin/Adams Co. line 45.33 61.24 15.71 T-1 15,180,000 2,400 30.4%
Franklin 397 Benton/Franklin Co. line to Oregon Ave 18.32 19.87 1.55 T-2 5,040,000 1,300 13.0%
Franklin 397 Oregon Ave to I-182 End Route 19.87 22.31 2.44 T-2 8,170,000 1,700 21.0%Grant 017 Adams/Grant Co. line to I-90 35.60 50.77 15.17 T-2 8,100,000 1,400 19.4%Grant 017 I-90 to Patton Blvd. 50.77 56.56 5.77 T-2 5,870,000 1,300 8.1%Grant 024 Benton/Grant Co. line to SR 243 43.79 44.13 0.34 T-2 6,490,000 980 22.8%Grant 026 I-90 to Grant/Adams Co. Line 0.00 31.17 31.17 T-2 6,130,000 900 25.7%
Grant 028 Douglas/Grant Co. line to 7th Ave SW 22.03 29.26 7.23 T-2 7,160,000 1,500 17.4%
Grant 028 7th Ave SW to SR 281 29.26 29.77 0.51 T-2 9,820,000 1,700 13.1%Grant 028 SR 281 to Adams Rd 29.77 33.79 4.02 T-2 3,714,776 891 10.3%Grant 090 Kittitas/Grant Co. line to SR 17 137.57 179.81 42.24 T-1 20,010,000 3,100 22.1%Grant 090 SR 17 to Grant/Adams Co. line 179.81 191.89 12.08 T-1 13,240,000 2,200 22.0%Grant 243 SR 24 (Vernita) to SR 26 0.00 28.26 28.23 T-2 5,510,000 850 21.3%Grant 281 I-90 to SR 28 (Quincy) 0.00 10.55 10.55 T-2 7,610,000 1,400 23.7%
Grant281SPBURKE
Burke Spur 2.65 4.34 1.69 T-2 3,250,000 580 23.2%
Grays Harbor 008 US 12 to Grays Harbor/Thurston
Co. Line 0.00 10.54 10.54 T-2 6,990,000 1,500 9.4%
Grays Harbor 012
US 101 to SR 8 (Elma)/physical gap (includes Aberdeen Couplet)
0.00 20.99 20.99 T-2 7,246,527 1,715 8.5%
Grays Harbor 012 SR 8 to Grays Harbor/Thurston
Co. line 21.30 38.84 17.54 T-2 4,210,000 850 12.3%
Grays Harbor 101
SR 105 (Aberdeen) to Aberdeen Couplet (includes Aberdeen & Heron Couplets)
83.17 87.49 4.42 T-2 5,765,660 3,308 6.3%
Island 020 Swantown Rd to Island/Skagit Co. line 30.85 41.90 11.04 T-2 3,720,000 1,200 7.5%
Jefferson 101 Clallam/Jefferson Co. line to SR 104 274.65 284.95 10.30 T-2 4,700,000 1,100 6.9%
Jefferson 104 US 101 to SR 19 0.20 8.87 8.67 T-2 4,100,000 930 12.9%
Jefferson 104 SR 19 to Jefferson/Kitsap Co. line 8.87 14.67 5.80 T-2 5,960,000 1,200 8.6%
King 005 King/Pierce Co. line to SR 599 (includes HOV) 139.50 155.94 16.44 T-1 68,900,000 14,000 7.5%
King 005 SR 599 to I-90 155.94 163.96 8.02 T-1 70,940,000 14,000 7.3%
Washington State Freight and Goods Transportation System 2015 Update | March 2016
Appendix H: 2015 FGTS State Route T-1 and T-2, Sorted by County
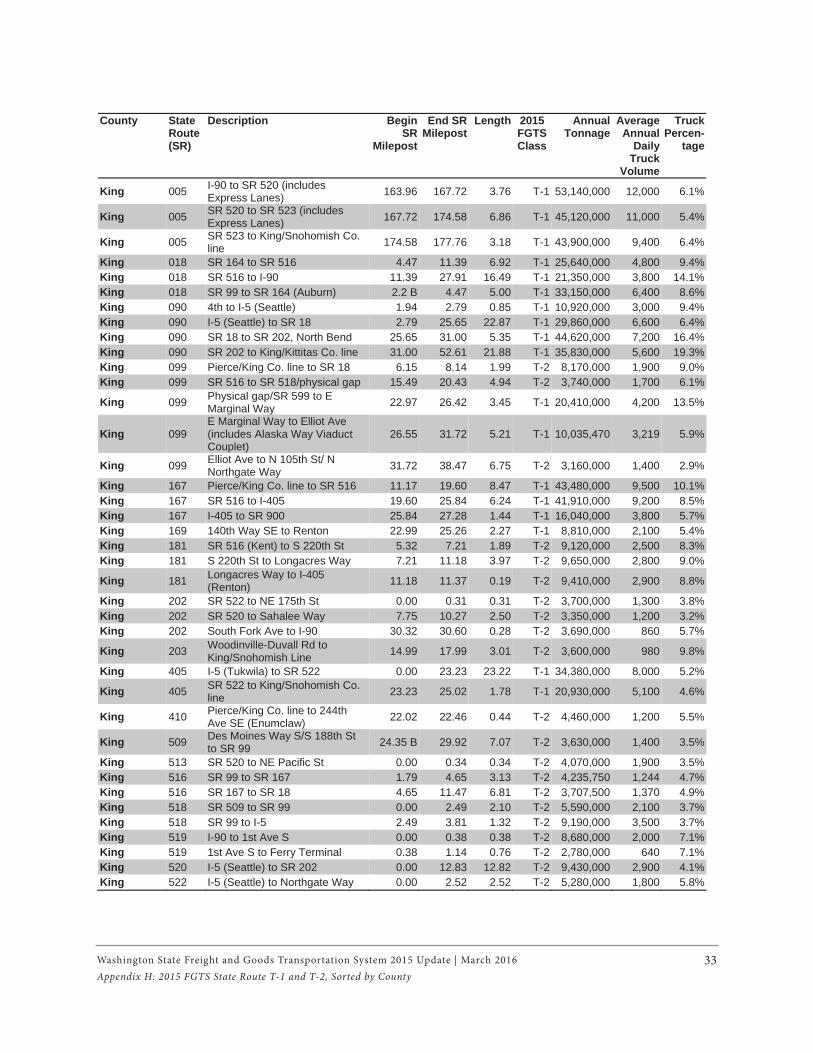
33
County State Route (SR)
Description Begin SR
Milepost
End SR Milepost
Length 2015 FGTSClass
Annual Tonnage
Average Annual
Daily Truck
Volume
Truck Percen-
tage
King 005 I-90 to SR 520 (includes Express Lanes) 163.96 167.72 3.76 T-1 53,140,000 12,000 6.1%
King 005 SR 520 to SR 523 (includes Express Lanes) 167.72 174.58 6.86 T-1 45,120,000 11,000 5.4%
King 005 SR 523 to King/Snohomish Co. line 174.58 177.76 3.18 T-1 43,900,000 9,400 6.4%
King 018 SR 164 to SR 516 4.47 11.39 6.92 T-1 25,640,000 4,800 9.4%King 018 SR 516 to I-90 11.39 27.91 16.49 T-1 21,350,000 3,800 14.1%King 018 SR 99 to SR 164 (Auburn) 2.2 B 4.47 5.00 T-1 33,150,000 6,400 8.6%King 090 4th to I-5 (Seattle) 1.94 2.79 0.85 T-1 10,920,000 3,000 9.4%King 090 I-5 (Seattle) to SR 18 2.79 25.65 22.87 T-1 29,860,000 6,600 6.4%King 090 SR 18 to SR 202, North Bend 25.65 31.00 5.35 T-1 44,620,000 7,200 16.4%King 090 SR 202 to King/Kittitas Co. line 31.00 52.61 21.88 T-1 35,830,000 5,600 19.3%King 099 Pierce/King Co. line to SR 18 6.15 8.14 1.99 T-2 8,170,000 1,900 9.0%King 099 SR 516 to SR 518/physical gap 15.49 20.43 4.94 T-2 3,740,000 1,700 6.1%
King 099 Physical gap/SR 599 to E Marginal Way 22.97 26.42 3.45 T-1 20,410,000 4,200 13.5%
King 099 E Marginal Way to Elliot Ave (includes Alaska Way Viaduct Couplet)
26.55 31.72 5.21 T-1 10,035,470 3,219 5.9%
King 099 Elliot Ave to N 105th St/ N Northgate Way 31.72 38.47 6.75 T-2 3,160,000 1,400 2.9%
King 167 Pierce/King Co. line to SR 516 11.17 19.60 8.47 T-1 43,480,000 9,500 10.1%King 167 SR 516 to I-405 19.60 25.84 6.24 T-1 41,910,000 9,200 8.5%King 167 I-405 to SR 900 25.84 27.28 1.44 T-1 16,040,000 3,800 5.7%King 169 140th Way SE to Renton 22.99 25.26 2.27 T-1 8,810,000 2,100 5.4%King 181 SR 516 (Kent) to S 220th St 5.32 7.21 1.89 T-2 9,120,000 2,500 8.3%King 181 S 220th St to Longacres Way 7.21 11.18 3.97 T-2 9,650,000 2,800 9.0%
King 181 Longacres Way to I-405 (Renton) 11.18 11.37 0.19 T-2 9,410,000 2,900 8.8%
King 202 SR 522 to NE 175th St 0.00 0.31 0.31 T-2 3,700,000 1,300 3.8%King 202 SR 520 to Sahalee Way 7.75 10.27 2.50 T-2 3,350,000 1,200 3.2%King 202 South Fork Ave to I-90 30.32 30.60 0.28 T-2 3,690,000 860 5.7%
King 203 Woodinville-Duvall Rd to King/Snohomish Line 14.99 17.99 3.01 T-2 3,600,000 980 9.8%
King 405 I-5 (Tukwila) to SR 522 0.00 23.23 23.22 T-1 34,380,000 8,000 5.2%
King 405 SR 522 to King/Snohomish Co. line 23.23 25.02 1.78 T-1 20,930,000 5,100 4.6%
King 410 Pierce/King Co. line to 244th Ave SE (Enumclaw) 22.02 22.46 0.44 T-2 4,460,000 1,200 5.5%
King 509 Des Moines Way S/S 188th St to SR 99 24.35 B 29.92 7.07 T-2 3,630,000 1,400 3.5%
King 513 SR 520 to NE Pacific St 0.00 0.34 0.34 T-2 4,070,000 1,900 3.5%King 516 SR 99 to SR 167 1.79 4.65 3.13 T-2 4,235,750 1,244 4.7%King 516 SR 167 to SR 18 4.65 11.47 6.81 T-2 3,707,500 1,370 4.9%King 518 SR 509 to SR 99 0.00 2.49 2.10 T-2 5,590,000 2,100 3.7%King 518 SR 99 to I-5 2.49 3.81 1.32 T-2 9,190,000 3,500 3.7%King 519 I-90 to 1st Ave S 0.00 0.38 0.38 T-2 8,680,000 2,000 7.1%King 519 1st Ave S to Ferry Terminal 0.38 1.14 0.76 T-2 2,780,000 640 7.1%King 520 I-5 (Seattle) to SR 202 0.00 12.83 12.82 T-2 9,430,000 2,900 4.1%King 522 I-5 (Seattle) to Northgate Way 0.00 2.52 2.52 T-2 5,280,000 1,800 5.8%
Washington State Freight and Goods Transportation System 2015 Update | March 2016
Appendix H: 2015 FGTS State Route T-1 and T-2, Sorted by County
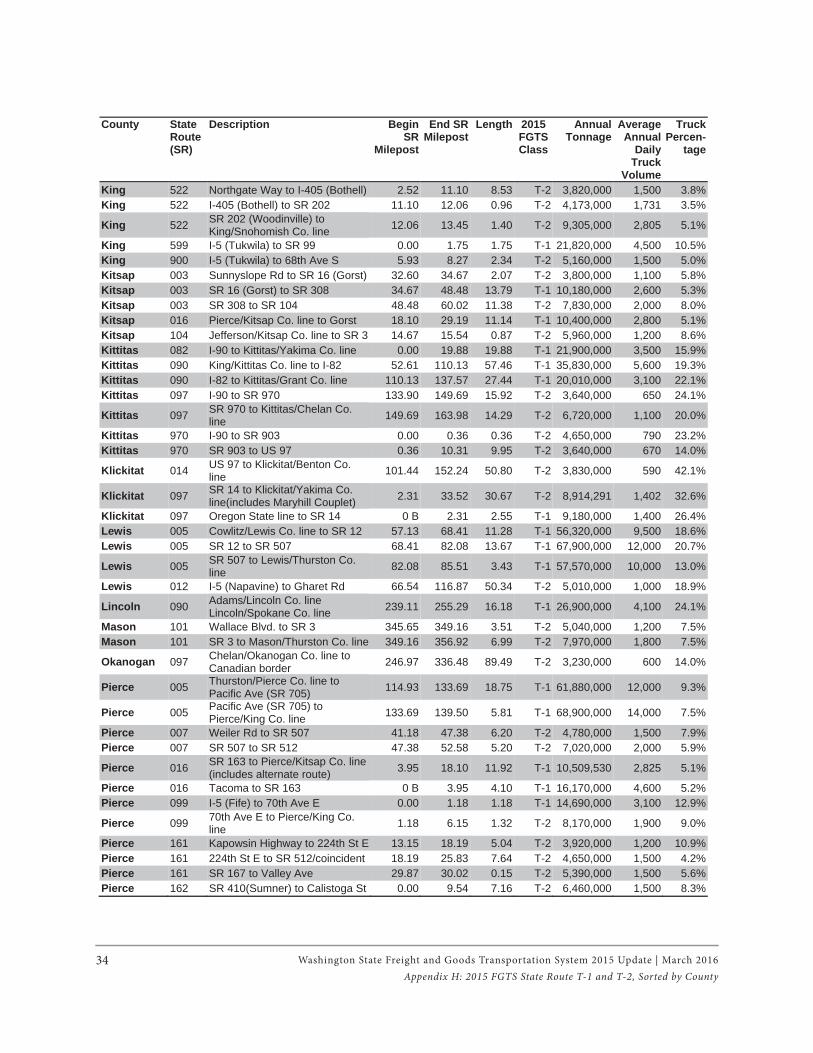
Washington State Freight and Goods Transportation System 2015 Update | March 201634Appendix H: 2015 FGTS State Route T-1 and T-2, Sorted by County
County State Route (SR)
Description Begin SR
Milepost
End SR Milepost
Length 2015 FGTSClass
Annual Tonnage
Average Annual
Daily Truck
Volume
Truck Percen-
tage
King 522 Northgate Way to I-405 (Bothell) 2.52 11.10 8.53 T-2 3,820,000 1,500 3.8%King 522 I-405 (Bothell) to SR 202 11.10 12.06 0.96 T-2 4,173,000 1,731 3.5%
King 522 SR 202 (Woodinville) to King/Snohomish Co. line 12.06 13.45 1.40 T-2 9,305,000 2,805 5.1%
King 599 I-5 (Tukwila) to SR 99 0.00 1.75 1.75 T-1 21,820,000 4,500 10.5%King 900 I-5 (Tukwila) to 68th Ave S 5.93 8.27 2.34 T-2 5,160,000 1,500 5.0%Kitsap 003 Sunnyslope Rd to SR 16 (Gorst) 32.60 34.67 2.07 T-2 3,800,000 1,100 5.8%Kitsap 003 SR 16 (Gorst) to SR 308 34.67 48.48 13.79 T-1 10,180,000 2,600 5.3%Kitsap 003 SR 308 to SR 104 48.48 60.02 11.38 T-2 7,830,000 2,000 8.0%Kitsap 016 Pierce/Kitsap Co. line to Gorst 18.10 29.19 11.14 T-1 10,400,000 2,800 5.1%Kitsap 104 Jefferson/Kitsap Co. line to SR 3 14.67 15.54 0.87 T-2 5,960,000 1,200 8.6%Kittitas 082 I-90 to Kittitas/Yakima Co. line 0.00 19.88 19.88 T-1 21,900,000 3,500 15.9%Kittitas 090 King/Kittitas Co. line to I-82 52.61 110.13 57.46 T-1 35,830,000 5,600 19.3%Kittitas 090 I-82 to Kittitas/Grant Co. line 110.13 137.57 27.44 T-1 20,010,000 3,100 22.1%Kittitas 097 I-90 to SR 970 133.90 149.69 15.92 T-2 3,640,000 650 24.1%
Kittitas 097 SR 970 to Kittitas/Chelan Co. line 149.69 163.98 14.29 T-2 6,720,000 1,100 20.0%
Kittitas 970 I-90 to SR 903 0.00 0.36 0.36 T-2 4,650,000 790 23.2%Kittitas 970 SR 903 to US 97 0.36 10.31 9.95 T-2 3,640,000 670 14.0%
Klickitat 014 US 97 to Klickitat/Benton Co. line 101.44 152.24 50.80 T-2 3,830,000 590 42.1%
Klickitat 097 SR 14 to Klickitat/Yakima Co. line(includes Maryhill Couplet) 2.31 33.52 30.67 T-2 8,914,291 1,402 32.6%
Klickitat 097 Oregon State line to SR 14 0 B 2.31 2.55 T-1 9,180,000 1,400 26.4%Lewis 005 Cowlitz/Lewis Co. line to SR 12 57.13 68.41 11.28 T-1 56,320,000 9,500 18.6%Lewis 005 SR 12 to SR 507 68.41 82.08 13.67 T-1 67,900,000 12,000 20.7%
Lewis 005 SR 507 to Lewis/Thurston Co. line 82.08 85.51 3.43 T-1 57,570,000 10,000 13.0%
Lewis 012 I-5 (Napavine) to Gharet Rd 66.54 116.87 50.34 T-2 5,010,000 1,000 18.9%
Lincoln 090 Adams/Lincoln Co. line Lincoln/Spokane Co. line 239.11 255.29 16.18 T-1 26,900,000 4,100 24.1%
Mason 101 Wallace Blvd. to SR 3 345.65 349.16 3.51 T-2 5,040,000 1,200 7.5%Mason 101 SR 3 to Mason/Thurston Co. line 349.16 356.92 6.99 T-2 7,970,000 1,800 7.5%
Okanogan 097 Chelan/Okanogan Co. line to Canadian border 246.97 336.48 89.49 T-2 3,230,000 600 14.0%
Pierce 005 Thurston/Pierce Co. line to Pacific Ave (SR 705) 114.93 133.69 18.75 T-1 61,880,000 12,000 9.3%
Pierce 005 Pacific Ave (SR 705) to Pierce/King Co. line 133.69 139.50 5.81 T-1 68,900,000 14,000 7.5%
Pierce 007 Weiler Rd to SR 507 41.18 47.38 6.20 T-2 4,780,000 1,500 7.9%Pierce 007 SR 507 to SR 512 47.38 52.58 5.20 T-2 7,020,000 2,000 5.9%
Pierce 016 SR 163 to Pierce/Kitsap Co. line (includes alternate route) 3.95 18.10 11.92 T-1 10,509,530 2,825 5.1%
Pierce 016 Tacoma to SR 163 0 B 3.95 4.10 T-1 16,170,000 4,600 5.2%Pierce 099 I-5 (Fife) to 70th Ave E 0.00 1.18 1.18 T-1 14,690,000 3,100 12.9%
Pierce 099 70th Ave E to Pierce/King Co. line 1.18 6.15 1.32 T-2 8,170,000 1,900 9.0%
Pierce 161 Kapowsin Highway to 224th St E 13.15 18.19 5.04 T-2 3,920,000 1,200 10.9%Pierce 161 224th St E to SR 512/coincident 18.19 25.83 7.64 T-2 4,650,000 1,500 4.2%Pierce 161 SR 167 to Valley Ave 29.87 30.02 0.15 T-2 5,390,000 1,500 5.6%Pierce 162 SR 410(Sumner) to Calistoga St 0.00 9.54 7.16 T-2 6,460,000 1,500 8.3%
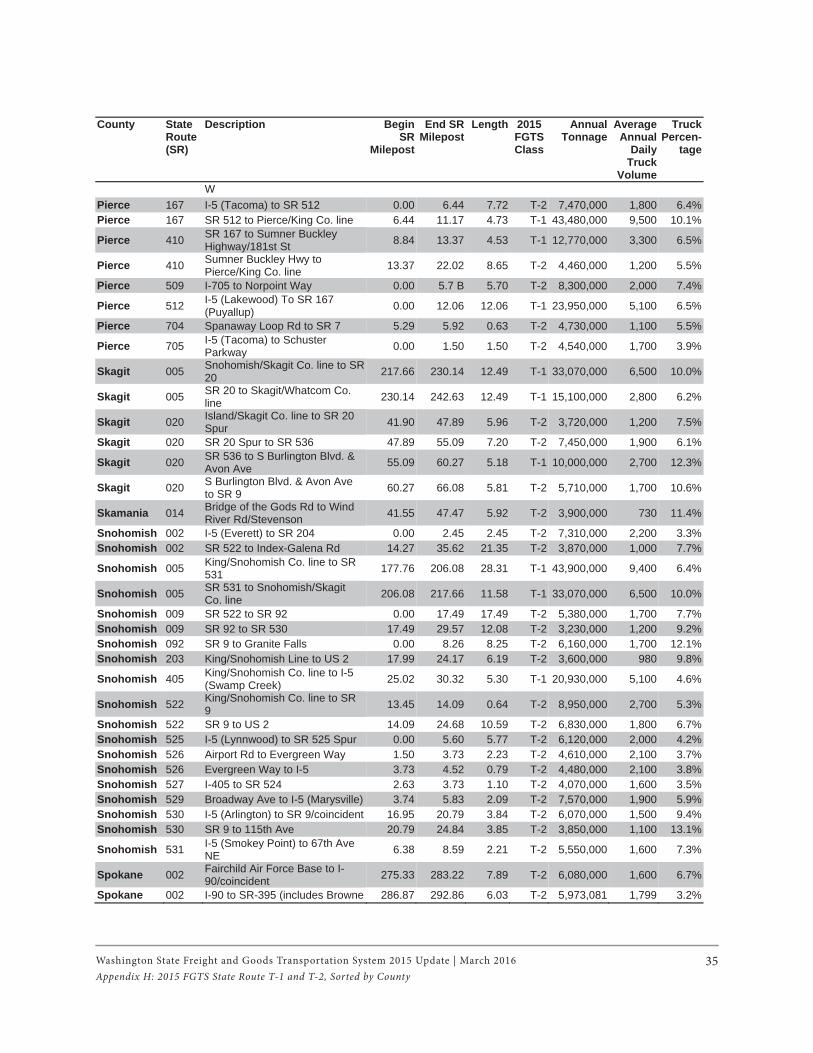
Washington State Freight and Goods Transportation System 2015 Update | March 2016 35Appendix H: 2015 FGTS State Route T-1 and T-2, Sorted by County
County State Route (SR)
Description Begin SR
Milepost
End SR Milepost
Length 2015 FGTSClass
Annual Tonnage
Average Annual
Daily Truck
Volume
Truck Percen-
tage
WPierce 167 I-5 (Tacoma) to SR 512 0.00 6.44 7.72 T-2 7,470,000 1,800 6.4%Pierce 167 SR 512 to Pierce/King Co. line 6.44 11.17 4.73 T-1 43,480,000 9,500 10.1%
Pierce 410 SR 167 to Sumner Buckley Highway/181st St 8.84 13.37 4.53 T-1 12,770,000 3,300 6.5%
Pierce 410 Sumner Buckley Hwy to Pierce/King Co. line 13.37 22.02 8.65 T-2 4,460,000 1,200 5.5%
Pierce 509 I-705 to Norpoint Way 0.00 5.7 B 5.70 T-2 8,300,000 2,000 7.4%
Pierce 512 I-5 (Lakewood) To SR 167 (Puyallup) 0.00 12.06 12.06 T-1 23,950,000 5,100 6.5%
Pierce 704 Spanaway Loop Rd to SR 7 5.29 5.92 0.63 T-2 4,730,000 1,100 5.5%
Pierce 705 I-5 (Tacoma) to Schuster Parkway 0.00 1.50 1.50 T-2 4,540,000 1,700 3.9%
Skagit 005 Snohomish/Skagit Co. line to SR20 217.66 230.14 12.49 T-1 33,070,000 6,500 10.0%
Skagit 005 SR 20 to Skagit/Whatcom Co. line 230.14 242.63 12.49 T-1 15,100,000 2,800 6.2%
Skagit 020 Island/Skagit Co. line to SR 20 Spur 41.90 47.89 5.96 T-2 3,720,000 1,200 7.5%
Skagit 020 SR 20 Spur to SR 536 47.89 55.09 7.20 T-2 7,450,000 1,900 6.1%
Skagit 020 SR 536 to S Burlington Blvd. & Avon Ave 55.09 60.27 5.18 T-1 10,000,000 2,700 12.3%
Skagit 020 S Burlington Blvd. & Avon Ave to SR 9 60.27 66.08 5.81 T-2 5,710,000 1,700 10.6%
Skamania 014 Bridge of the Gods Rd to Wind River Rd/Stevenson 41.55 47.47 5.92 T-2 3,900,000 730 11.4%
Snohomish 002 I-5 (Everett) to SR 204 0.00 2.45 2.45 T-2 7,310,000 2,200 3.3%Snohomish 002 SR 522 to Index-Galena Rd 14.27 35.62 21.35 T-2 3,870,000 1,000 7.7%
Snohomish 005 King/Snohomish Co. line to SR 531 177.76 206.08 28.31 T-1 43,900,000 9,400 6.4%
Snohomish 005 SR 531 to Snohomish/Skagit Co. line 206.08 217.66 11.58 T-1 33,070,000 6,500 10.0%
Snohomish 009 SR 522 to SR 92 0.00 17.49 17.49 T-2 5,380,000 1,700 7.7%Snohomish 009 SR 92 to SR 530 17.49 29.57 12.08 T-2 3,230,000 1,200 9.2%Snohomish 092 SR 9 to Granite Falls 0.00 8.26 8.25 T-2 6,160,000 1,700 12.1%Snohomish 203 King/Snohomish Line to US 2 17.99 24.17 6.19 T-2 3,600,000 980 9.8%
Snohomish 405 King/Snohomish Co. line to I-5 (Swamp Creek) 25.02 30.32 5.30 T-1 20,930,000 5,100 4.6%
Snohomish 522 King/Snohomish Co. line to SR 9 13.45 14.09 0.64 T-2 8,950,000 2,700 5.3%
Snohomish 522 SR 9 to US 2 14.09 24.68 10.59 T-2 6,830,000 1,800 6.7%Snohomish 525 I-5 (Lynnwood) to SR 525 Spur 0.00 5.60 5.77 T-2 6,120,000 2,000 4.2%Snohomish 526 Airport Rd to Evergreen Way 1.50 3.73 2.23 T-2 4,610,000 2,100 3.7%Snohomish 526 Evergreen Way to I-5 3.73 4.52 0.79 T-2 4,480,000 2,100 3.8%Snohomish 527 I-405 to SR 524 2.63 3.73 1.10 T-2 4,070,000 1,600 3.5%Snohomish 529 Broadway Ave to I-5 (Marysville) 3.74 5.83 2.09 T-2 7,570,000 1,900 5.9%Snohomish 530 I-5 (Arlington) to SR 9/coincident 16.95 20.79 3.84 T-2 6,070,000 1,500 9.4%Snohomish 530 SR 9 to 115th Ave 20.79 24.84 3.85 T-2 3,850,000 1,100 13.1%
Snohomish 531 I-5 (Smokey Point) to 67th Ave NE 6.38 8.59 2.21 T-2 5,550,000 1,600 7.3%
Spokane 002 Fairchild Air Force Base to I-90/coincident 275.33 283.22 7.89 T-2 6,080,000 1,600 6.7%
Spokane 002 I-90 to SR-395 (includes Browne 286.87 292.86 6.03 T-2 5,973,081 1,799 3.2%
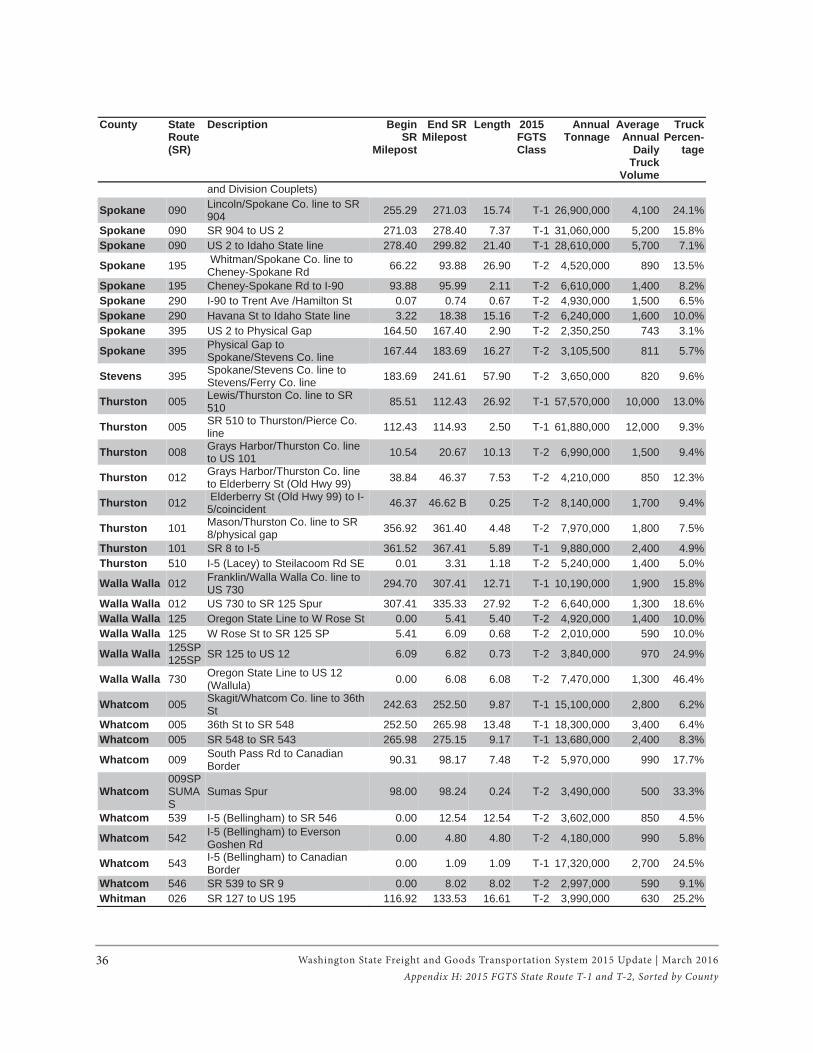
36
County State Route (SR)
Description Begin SR
Milepost
End SR Milepost
Length 2015 FGTSClass
Annual Tonnage
Average Annual
Daily Truck
Volume
Truck Percen-
tage
and Division Couplets)
Spokane 090 Lincoln/Spokane Co. line to SR 904 255.29 271.03 15.74 T-1 26,900,000 4,100 24.1%
Spokane 090 SR 904 to US 2 271.03 278.40 7.37 T-1 31,060,000 5,200 15.8%Spokane 090 US 2 to Idaho State line 278.40 299.82 21.40 T-1 28,610,000 5,700 7.1%
Spokane 195 Whitman/Spokane Co. line to Cheney-Spokane Rd 66.22 93.88 26.90 T-2 4,520,000 890 13.5%
Spokane 195 Cheney-Spokane Rd to I-90 93.88 95.99 2.11 T-2 6,610,000 1,400 8.2%Spokane 290 I-90 to Trent Ave /Hamilton St 0.07 0.74 0.67 T-2 4,930,000 1,500 6.5%Spokane 290 Havana St to Idaho State line 3.22 18.38 15.16 T-2 6,240,000 1,600 10.0%Spokane 395 US 2 to Physical Gap 164.50 167.40 2.90 T-2 2,350,250 743 3.1%
Spokane 395 Physical Gap to Spokane/Stevens Co. line 167.44 183.69 16.27 T-2 3,105,500 811 5.7%
Stevens 395 Spokane/Stevens Co. line to Stevens/Ferry Co. line 183.69 241.61 57.90 T-2 3,650,000 820 9.6%
Thurston 005 Lewis/Thurston Co. line to SR 510 85.51 112.43 26.92 T-1 57,570,000 10,000 13.0%
Thurston 005 SR 510 to Thurston/Pierce Co. line 112.43 114.93 2.50 T-1 61,880,000 12,000 9.3%
Thurston 008 Grays Harbor/Thurston Co. line to US 101 10.54 20.67 10.13 T-2 6,990,000 1,500 9.4%
Thurston 012 Grays Harbor/Thurston Co. line to Elderberry St (Old Hwy 99) 38.84 46.37 7.53 T-2 4,210,000 850 12.3%
Thurston 012 Elderberry St (Old Hwy 99) to I-5/coincident 46.37 46.62 B 0.25 T-2 8,140,000 1,700 9.4%
Thurston 101 Mason/Thurston Co. line to SR 8/physical gap 356.92 361.40 4.48 T-2 7,970,000 1,800 7.5%
Thurston 101 SR 8 to I-5 361.52 367.41 5.89 T-1 9,880,000 2,400 4.9%Thurston 510 I-5 (Lacey) to Steilacoom Rd SE 0.01 3.31 1.18 T-2 5,240,000 1,400 5.0%
Walla Walla 012 Franklin/Walla Walla Co. line to US 730 294.70 307.41 12.71 T-1 10,190,000 1,900 15.8%
Walla Walla 012 US 730 to SR 125 Spur 307.41 335.33 27.92 T-2 6,640,000 1,300 18.6%Walla Walla 125 Oregon State Line to W Rose St 0.00 5.41 5.40 T-2 4,920,000 1,400 10.0%Walla Walla 125 W Rose St to SR 125 SP 5.41 6.09 0.68 T-2 2,010,000 590 10.0%
Walla Walla 125SP125SP SR 125 to US 12 6.09 6.82 0.73 T-2 3,840,000 970 24.9%
Walla Walla 730 Oregon State Line to US 12 (Wallula) 0.00 6.08 6.08 T-2 7,470,000 1,300 46.4%
Whatcom 005 Skagit/Whatcom Co. line to 36th St 242.63 252.50 9.87 T-1 15,100,000 2,800 6.2%
Whatcom 005 36th St to SR 548 252.50 265.98 13.48 T-1 18,300,000 3,400 6.4%Whatcom 005 SR 548 to SR 543 265.98 275.15 9.17 T-1 13,680,000 2,400 8.3%
Whatcom 009 South Pass Rd to Canadian Border 90.31 98.17 7.48 T-2 5,970,000 990 17.7%
Whatcom 009SPSUMAS
Sumas Spur 98.00 98.24 0.24 T-2 3,490,000 500 33.3%
Whatcom 539 I-5 (Bellingham) to SR 546 0.00 12.54 12.54 T-2 3,602,000 850 4.5%
Whatcom 542 I-5 (Bellingham) to Everson Goshen Rd 0.00 4.80 4.80 T-2 4,180,000 990 5.8%
Whatcom 543 I-5 (Bellingham) to Canadian Border 0.00 1.09 1.09 T-1 17,320,000 2,700 24.5%
Whatcom 546 SR 539 to SR 9 0.00 8.02 8.02 T-2 2,997,000 590 9.1%Whitman 026 SR 127 to US 195 116.92 133.53 16.61 T-2 3,990,000 630 25.2%
Washington State Freight and Goods Transportation System 2015 Update | March 2016
Appendix H: 2015 FGTS State Route T-1 and T-2, Sorted by County
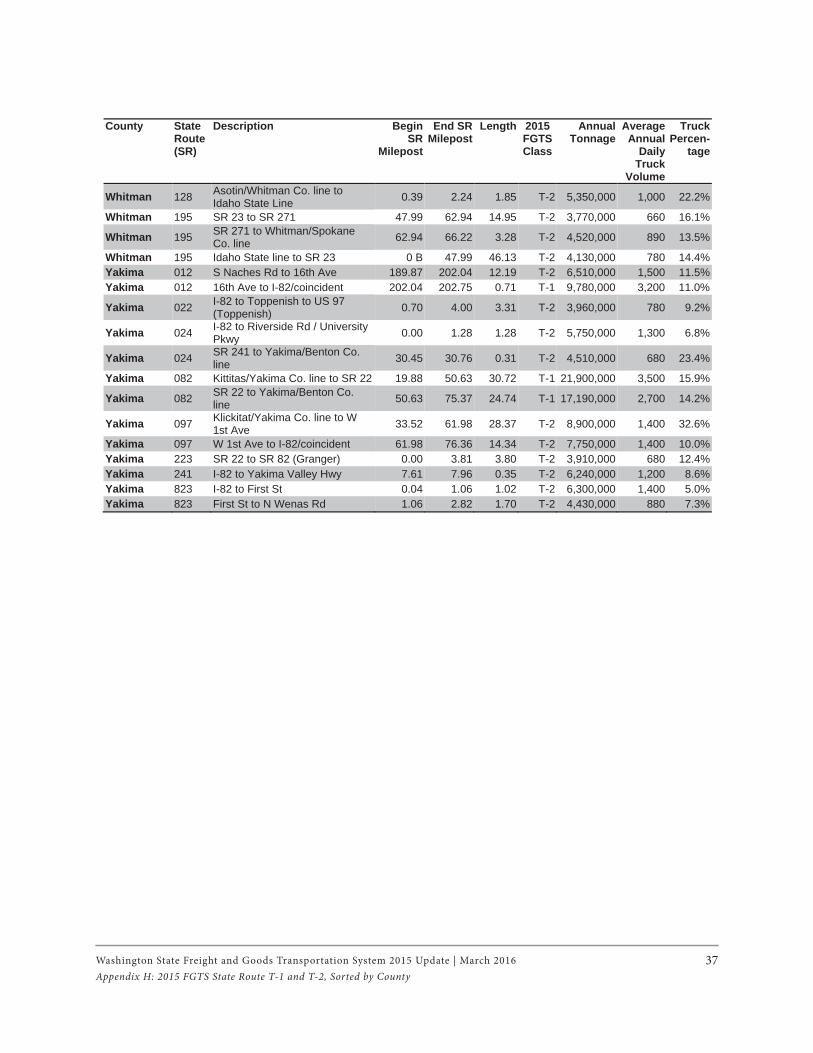
37
County State Route (SR)
Description Begin SR
Milepost
End SR Milepost
Length 2015 FGTSClass
Annual Tonnage
Average Annual
Daily Truck
Volume
Truck Percen-
tage
Whitman 128 Asotin/Whitman Co. line to Idaho State Line 0.39 2.24 1.85 T-2 5,350,000 1,000 22.2%
Whitman 195 SR 23 to SR 271 47.99 62.94 14.95 T-2 3,770,000 660 16.1%
Whitman 195 SR 271 to Whitman/Spokane Co. line 62.94 66.22 3.28 T-2 4,520,000 890 13.5%
Whitman 195 Idaho State line to SR 23 0 B 47.99 46.13 T-2 4,130,000 780 14.4%Yakima 012 S Naches Rd to 16th Ave 189.87 202.04 12.19 T-2 6,510,000 1,500 11.5%Yakima 012 16th Ave to I-82/coincident 202.04 202.75 0.71 T-1 9,780,000 3,200 11.0%
Yakima 022 I-82 to Toppenish to US 97 (Toppenish) 0.70 4.00 3.31 T-2 3,960,000 780 9.2%
Yakima 024 I-82 to Riverside Rd / University Pkwy 0.00 1.28 1.28 T-2 5,750,000 1,300 6.8%
Yakima 024 SR 241 to Yakima/Benton Co. line 30.45 30.76 0.31 T-2 4,510,000 680 23.4%
Yakima 082 Kittitas/Yakima Co. line to SR 22 19.88 50.63 30.72 T-1 21,900,000 3,500 15.9%
Yakima 082 SR 22 to Yakima/Benton Co. line 50.63 75.37 24.74 T-1 17,190,000 2,700 14.2%
Yakima 097 Klickitat/Yakima Co. line to W 1st Ave 33.52 61.98 28.37 T-2 8,900,000 1,400 32.6%
Yakima 097 W 1st Ave to I-82/coincident 61.98 76.36 14.34 T-2 7,750,000 1,400 10.0%Yakima 223 SR 22 to SR 82 (Granger) 0.00 3.81 3.80 T-2 3,910,000 680 12.4%Yakima 241 I-82 to Yakima Valley Hwy 7.61 7.96 0.35 T-2 6,240,000 1,200 8.6%Yakima 823 I-82 to First St 0.04 1.06 1.02 T-2 6,300,000 1,400 5.0%Yakima 823 First St to N Wenas Rd 1.06 2.82 1.70 T-2 4,430,000 880 7.3%
Washington State Freight and Goods Transportation System 2015 Update | March 2016
Appendix H: 2015 FGTS State Route T-1 and T-2, Sorted by County
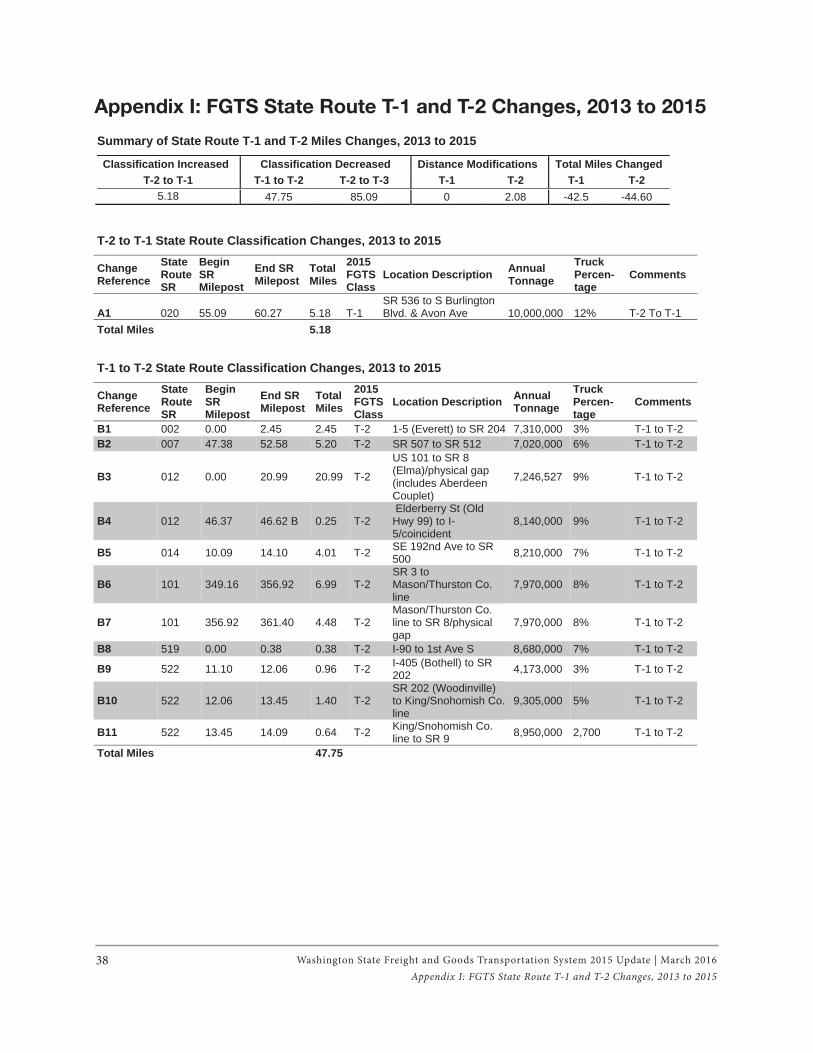
Washington State Freight and Goods Transportation System 2015 Update | March 201638Appendix I: FGTS State Route T-1 and T-2 Changes, 2013 to 2015
Summary of State Route T-1 and T-2 Miles Changes, 2013 to 2015
Classification Increased Classification Decreased Distance Modifications Total Miles Changed T-2 to T-1 T-1 to T-2 T-2 to T-3 T-1 T-2 T-1 T-2
5.18 47.75 85.09 0 2.08 -42.5 -44.60
T-2 to T-1 State Route Classification Changes, 2013 to 2015
Change Reference
StateRoute SR
Begin SRMilepost
End SR Milepost
Total Miles
2015FGTSClass
Location Description Annual Tonnage
Truck Percen-tage
Comments
A1 020 55.09 60.27 5.18 T-1 SR 536 to S Burlington Blvd. & Avon Ave 10,000,000 12% T-2 To T-1
Total Miles 5.18
T-1 to T-2 State Route Classification Changes, 2013 to 2015
Change Reference
StateRoute SR
Begin SRMilepost
End SR Milepost
Total Miles
2015FGTSClass
Location Description Annual Tonnage
Truck Percen-tage
Comments
B1 002 0.00 2.45 2.45 T-2 1-5 (Everett) to SR 204 7,310,000 3% T-1 to T-2 B2 007 47.38 52.58 5.20 T-2 SR 507 to SR 512 7,020,000 6% T-1 to T-2
B3 012 0.00 20.99 20.99 T-2
US 101 to SR 8 (Elma)/physical gap (includes Aberdeen Couplet)
7,246,527 9% T-1 to T-2
B4 012 46.37 46.62 B 0.25 T-2 Elderberry St (Old Hwy 99) to I-5/coincident
8,140,000 9% T-1 to T-2
B5 014 10.09 14.10 4.01 T-2 SE 192nd Ave to SR 500 8,210,000 7% T-1 to T-2
B6 101 349.16 356.92 6.99 T-2 SR 3 to Mason/Thurston Co. line
7,970,000 8% T-1 to T-2
B7 101 356.92 361.40 4.48 T-2 Mason/Thurston Co. line to SR 8/physical gap
7,970,000 8% T-1 to T-2
B8 519 0.00 0.38 0.38 T-2 I-90 to 1st Ave S 8,680,000 7% T-1 to T-2
B9 522 11.10 12.06 0.96 T-2 I-405 (Bothell) to SR 202 4,173,000 3% T-1 to T-2
B10 522 12.06 13.45 1.40 T-2 SR 202 (Woodinville) to King/Snohomish Co. line
9,305,000 5% T-1 to T-2
B11 522 13.45 14.09 0.64 T-2 King/Snohomish Co. line to SR 9 8,950,000 2,700 T-1 to T-2
Total Miles 47.75
Appendix I: FGTS State Route T-1 and T-2 Changes, 2013 to 2015
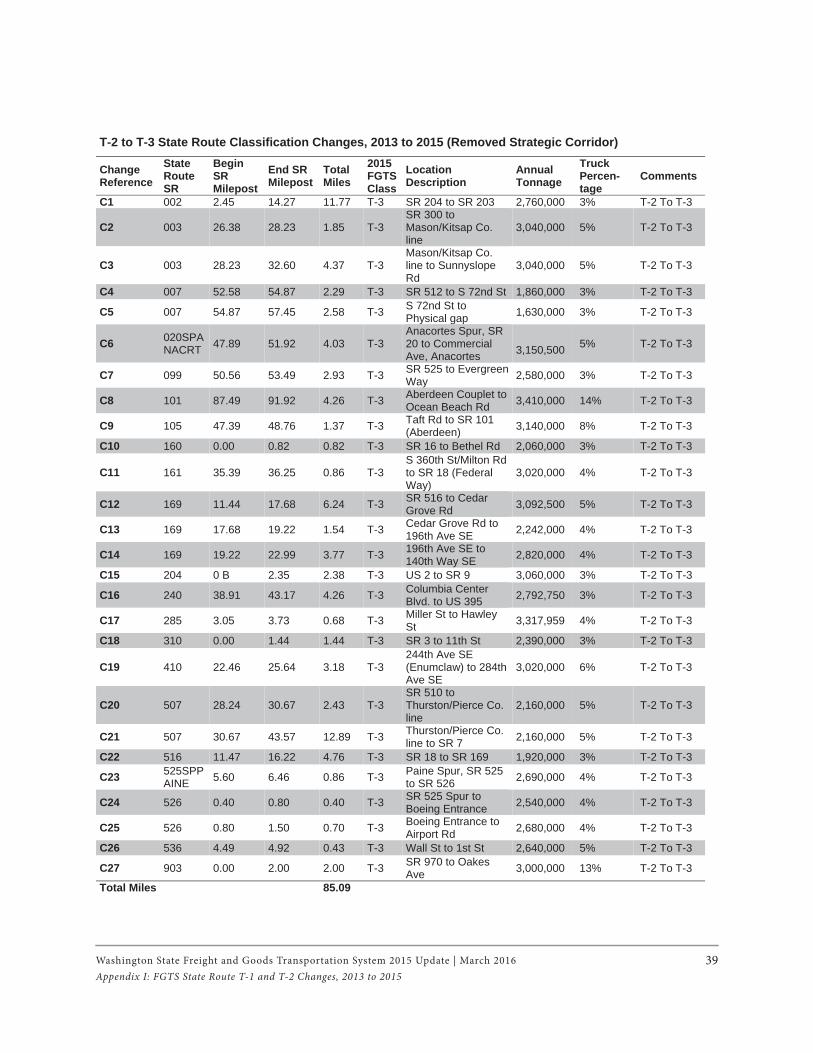
Washington State Freight and Goods Transportation System 2015 Update | March 2016 39Appendix I: FGTS State Route T-1 and T-2 Changes, 2013 to 2015
T-2 to T-3 State Route Classification Changes, 2013 to 2015 (Removed Strategic Corridor)
Change Reference
StateRoute SR
Begin SRMilepost
End SR Milepost
Total Miles
2015FGTSClass
Location Description
Annual Tonnage
Truck Percen-tage
Comments
C1 002 2.45 14.27 11.77 T-3 SR 204 to SR 203 2,760,000 3% T-2 To T-3
C2 003 26.38 28.23 1.85 T-3 SR 300 to Mason/Kitsap Co. line
3,040,000 5% T-2 To T-3
C3 003 28.23 32.60 4.37 T-3 Mason/Kitsap Co. line to Sunnyslope Rd
3,040,000 5% T-2 To T-3
C4 007 52.58 54.87 2.29 T-3 SR 512 to S 72nd St 1,860,000 3% T-2 To T-3
C5 007 54.87 57.45 2.58 T-3 S 72nd St to Physical gap 1,630,000 3% T-2 To T-3
C6 020SPANACRT 47.89 51.92 4.03 T-3
Anacortes Spur, SR 20 to Commercial Ave, Anacortes
3,150,500 5% T-2 To T-3
C7 099 50.56 53.49 2.93 T-3 SR 525 to Evergreen Way 2,580,000 3% T-2 To T-3
C8 101 87.49 91.92 4.26 T-3 Aberdeen Couplet to Ocean Beach Rd 3,410,000 14% T-2 To T-3
C9 105 47.39 48.76 1.37 T-3 Taft Rd to SR 101 (Aberdeen) 3,140,000 8% T-2 To T-3
C10 160 0.00 0.82 0.82 T-3 SR 16 to Bethel Rd 2,060,000 3% T-2 To T-3
C11 161 35.39 36.25 0.86 T-3 S 360th St/Milton Rd to SR 18 (Federal Way)
3,020,000 4% T-2 To T-3
C12 169 11.44 17.68 6.24 T-3 SR 516 to Cedar Grove Rd 3,092,500 5% T-2 To T-3
C13 169 17.68 19.22 1.54 T-3 Cedar Grove Rd to 196th Ave SE 2,242,000 4% T-2 To T-3
C14 169 19.22 22.99 3.77 T-3 196th Ave SE to 140th Way SE 2,820,000 4% T-2 To T-3
C15 204 0 B 2.35 2.38 T-3 US 2 to SR 9 3,060,000 3% T-2 To T-3
C16 240 38.91 43.17 4.26 T-3 Columbia Center Blvd. to US 395 2,792,750 3% T-2 To T-3
C17 285 3.05 3.73 0.68 T-3 Miller St to Hawley St 3,317,959 4% T-2 To T-3
C18 310 0.00 1.44 1.44 T-3 SR 3 to 11th St 2,390,000 3% T-2 To T-3
C19 410 22.46 25.64 3.18 T-3 244th Ave SE (Enumclaw) to 284th Ave SE
3,020,000 6% T-2 To T-3
C20 507 28.24 30.67 2.43 T-3 SR 510 to Thurston/Pierce Co. line
2,160,000 5% T-2 To T-3
C21 507 30.67 43.57 12.89 T-3 Thurston/Pierce Co. line to SR 7 2,160,000 5% T-2 To T-3
C22 516 11.47 16.22 4.76 T-3 SR 18 to SR 169 1,920,000 3% T-2 To T-3
C23 525SPPAINE 5.60 6.46 0.86 T-3 Paine Spur, SR 525
to SR 526 2,690,000 4% T-2 To T-3
C24 526 0.40 0.80 0.40 T-3 SR 525 Spur to Boeing Entrance 2,540,000 4% T-2 To T-3
C25 526 0.80 1.50 0.70 T-3 Boeing Entrance to Airport Rd 2,680,000 4% T-2 To T-3
C26 536 4.49 4.92 0.43 T-3 Wall St to 1st St 2,640,000 5% T-2 To T-3
C27 903 0.00 2.00 2.00 T-3 SR 970 to Oakes Ave 3,000,000 13% T-2 To T-3
Total Miles 85.09
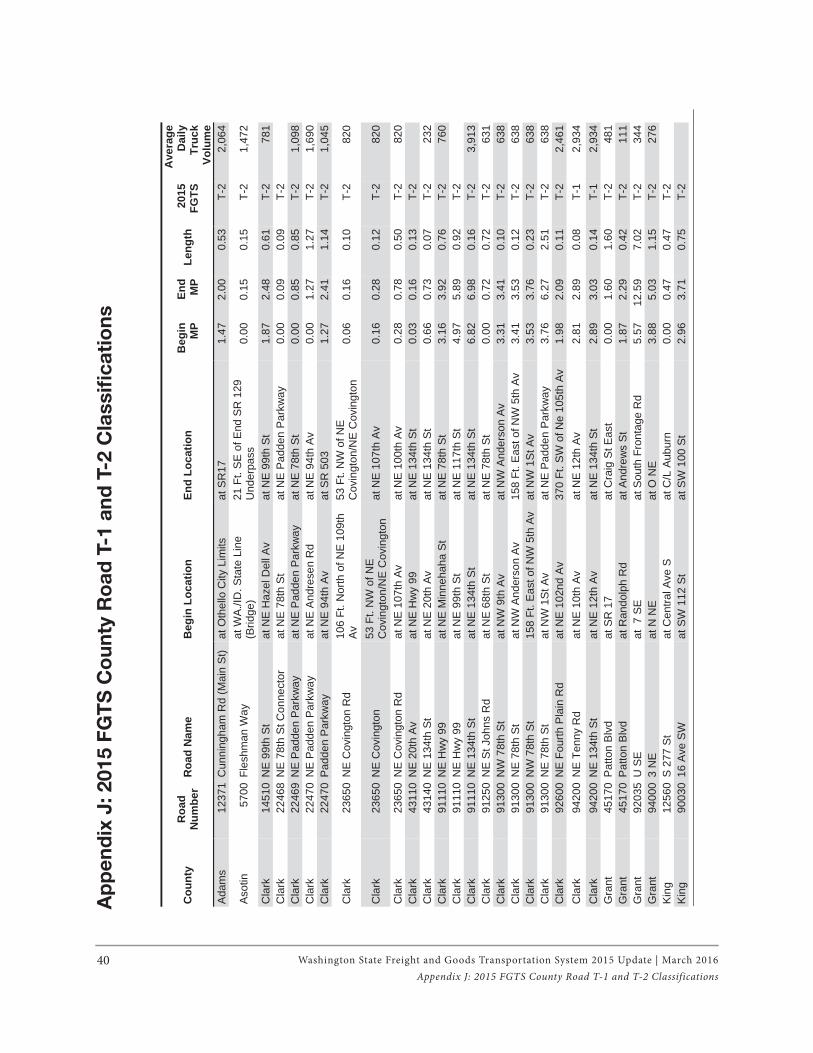
Washington State Freight and Goods Transportation System 2015 Update | March 201640Appendix J: 2015 FGTS County Road T-1 and T-2 Classifications
Ap
pe
nd
ix J
: 2015 F
GT
S C
ou
nty
Ro
ad
T-1
an
d T
-2 C
lassifi
ca
tio
ns
Cou
nty
Roa
dN
umbe
r R
oad
Nam
e B
egin
Loc
atio
n En
d Lo
catio
n B
egin
M
PEn
dM
PLe
ngth
2015
FG
TS
Ave
rage
D
aily
Tr
uck
Volu
me
Ada
ms
1237
1 C
unni
ngha
m R
d (M
ain
St)
at O
thel
lo C
ity L
imits
at
SR
17
1.47
2.00
0.53
T-2
2,06
4
Asot
in
5700
Fle
shm
an W
ay
at W
A./I
D. S
tate
Lin
e (B
ridge
)21
Ft.
SE
of E
nd S
R 1
29
Und
erpa
ss
0.00
0.15
0.15
T-2
1,47
2
Cla
rk
1451
0 N
E 9
9th
St
at N
E H
azel
Del
l Av
at N
E 9
9th
St
1.87
2.48
0.61
T-2
781
Cla
rk
2246
8 N
E 7
8th
St C
onne
ctor
at
NE
78t
h S
t at
NE
Pad
den
Par
kway
0.
000.
090.
09T-
2C
lark
22
469
NE
Pad
den
Par
kway
at
NE
Pad
den
Par
kway
at
NE
78t
h S
t 0.
000.
850.
85T-
21,
098
Cla
rk
2247
0 N
E P
adde
n P
arkw
ay
at N
E A
ndre
sen
Rd
at N
E 9
4th
Av
0.00
1.27
1.27
T-2
1,69
0C
lark
22
470
Padd
en P
arkw
ay
at N
E 9
4th
Av
at S
R 5
03
1.27
2.41
1.14
T-2
1,04
5
Cla
rk
2365
0 N
E C
ovin
gton
Rd
106
Ft. N
orth
of N
E 1
09th
A
v53
Ft.
NW
of N
E
Cov
ingt
on/N
E C
ovin
gton
0.
060.
160.
10T-
282
0
Cla
rk
2365
0 N
E C
ovin
gton
53
Ft.
NW
of N
E
Cov
ingt
on/N
E C
ovin
gton
at
NE
107
th A
v 0.
160.
280.
12T-
282
0
Cla
rk
2365
0 N
E C
ovin
gton
Rd
at N
E 1
07th
Av
at N
E 1
00th
Av
0.28
0.78
0.50
T-2
820
Cla
rk
4311
0 N
E 2
0th
Av
at N
E H
wy
99
at N
E 1
34th
St
0.03
0.16
0.13
T-2
Cla
rk
4314
0 N
E 1
34th
St
at N
E 2
0th
Av
at N
E 1
34th
St
0.66
0.73
0.07
T-2
232
Cla
rk
9111
0 N
E H
wy
99
at N
E M
inne
haha
St
at N
E 7
8th
St
3.16
3.92
0.76
T-2
760
Cla
rk
9111
0 N
E H
wy
99
at N
E 9
9th
St
at N
E 1
17th
St
4.97
5.89
0.92
T-2
Cla
rk
9111
0 N
E 1
34th
St
at N
E 1
34th
St
at N
E 1
34th
St
6.82
6.98
0.16
T-2
3,91
3C
lark
91
250
NE
St J
ohns
Rd
at N
E 6
8th
St
at N
E 7
8th
St
0.00
0.72
0.72
T-2
631
Cla
rk
9130
0 N
W 7
8th
St
at N
W 9
th A
v at
NW
And
erso
n A
v 3.
313.
410.
10T-
263
8C
lark
91
300
NE
78t
h S
t at
NW
And
erso
n A
v 15
8 Ft
. Eas
t of N
W 5
th A
v 3.
413.
530.
12T-
263
8C
lark
91
300
NW
78t
h S
t 15
8 Ft
. Eas
t of N
W 5
th A
v at
NW
1S
t Av
3.53
3.76
0.23
T-2
638
Cla
rk
9130
0 N
E 7
8th
St
at N
W 1
St A
v at
NE
Pad
den
Par
kway
3.
766.
272.
51T-
263
8C
lark
92
600
NE
Fou
rth P
lain
Rd
at N
E 1
02nd
Av
370
Ft. S
W o
f Ne
105t
h A
v 1.
982.
090.
11T-
22,
461
Cla
rk
9420
0 N
E T
enny
Rd
at N
E 1
0th
Av
at N
E 1
2th
Av
2.81
2.89
0.08
T-1
2,93
4C
lark
94
200
NE
134
th S
t at
NE
12t
h A
v at
NE
134
th S
t 2.
893.
030.
14T-
12,
934
Gra
nt
4517
0 P
atto
n B
lvd
at S
R 1
7 at
Cra
ig S
t Eas
t 0.
001.
601.
60T-
248
1G
rant
4517
0 P
atto
n B
lvd
at R
ando
lph
Rd
at A
ndre
ws
St
1.87
2.29
0.42
T-2
111
Gra
nt
9203
5 U
SE
at
7 S
E
at S
outh
Fro
ntag
e R
d 5.
5712
.59
7.02
T-2
344
Gra
nt94
000
3 N
E at
N N
E
at O
NE
3.88
5.03
1.15
T-2
276
Kin
g 12
560
S 2
77 S
t at
Cen
tral A
ve S
at
C/L
Aub
urn
0.00
0.47
0.47
T-2
Kin
g90
030
16 A
ve S
W
at S
W 1
12 S
t at
SW
100
St
2.96
3.71
0.75
T-2
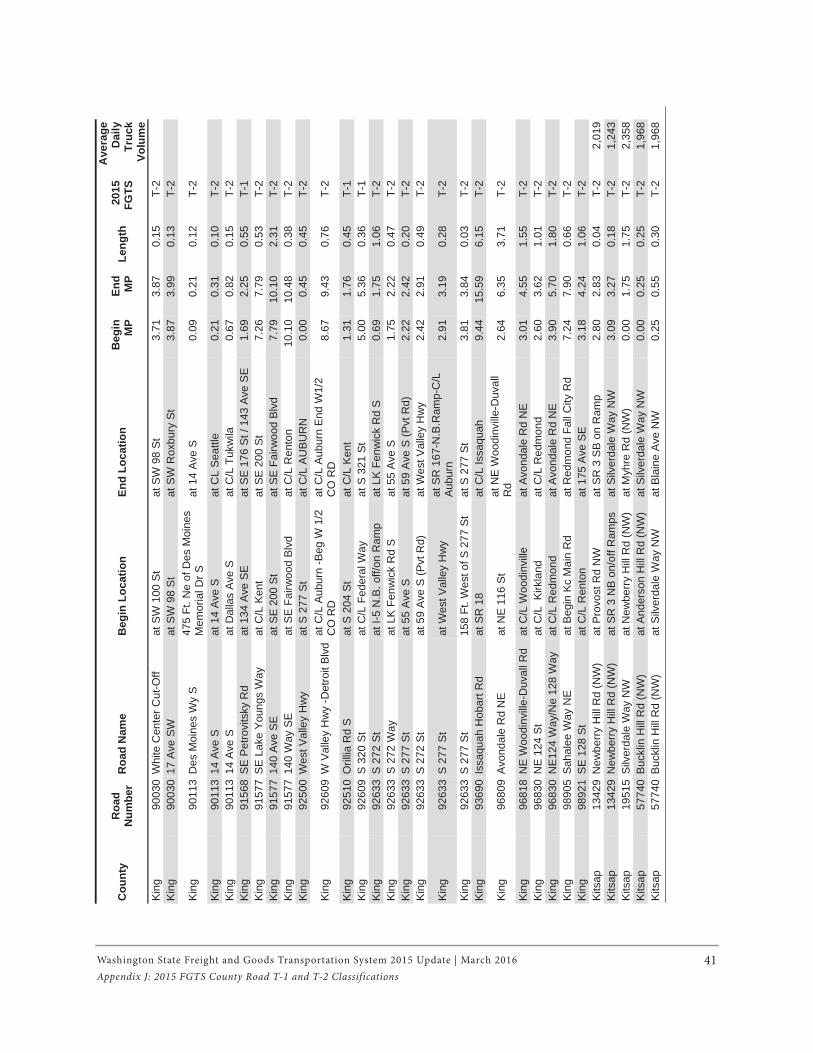
Washington State Freight and Goods Transportation System 2015 Update | March 2016 41Appendix J: 2015 FGTS County Road T-1 and T-2 Classifications
Cou
nty
Roa
dN
umbe
r R
oad
Nam
e B
egin
Loc
atio
n En
d Lo
catio
n B
egin
M
PEn
dM
PLe
ngth
2015
FG
TS
Ave
rage
D
aily
Tr
uck
Volu
me
Kin
g 90
030
Whi
te C
ente
r Cut
-Off
at S
W 1
00 S
t at
SW
98
St
3.71
3.87
0.15
T-2
Kin
g90
030
17 A
ve S
W
at S
W 9
8 S
t at
SW
Rox
bury
St
3.87
3.99
0.13
T-2
Kin
g 90
113
Des
Moi
nes
Wy
S
475
Ft. N
e of
Des
Moi
nes
Mem
oria
l Dr S
at
14
Ave
S
0.09
0.21
0.12
T-2
Kin
g90
113
14 A
ve S
at 1
4 A
ve S
at
CL
Sea
ttle
0.21
0.31
0.10
T-2
Kin
g 90
113
14 A
ve S
at
Dal
las
Ave
S
at C
/L T
ukw
ila
0.67
0.82
0.15
T-2
Kin
g91
568
SE
Pet
rovi
tsky
Rd
at 1
34 A
ve S
E
at S
E 1
76 S
t / 1
43 A
ve S
E
1.69
2.25
0.55
T-1
Kin
g 91
577
SE
Lak
e Y
oung
s W
ay
at C
/L K
ent
at S
E 2
00 S
t 7.
267.
790.
53T-
2K
ing
9157
7 14
0 Av
e SE
at
SE
200
St
at S
E F
airw
ood
Blv
d 7.
7910
.10
2.31
T-2
Kin
g 91
577
140
Way
SE
at
SE
Fai
rwoo
d B
lvd
at C
/L R
ento
n 10
.10
10.4
80.
38T-
2K
ing
9250
0 W
est V
alle
y H
wy
at S
277
St
at C
/L A
UB
UR
N
0.00
0.45
0.45
T-2
Kin
g 92
609
W V
alle
y H
wy
-Det
roit
Blv
dat
C/L
Aub
urn
-Beg
W 1
/2
CO
RD
at
C/L
Aub
urn
End
W1/
2 C
O R
D
8.67
9.43
0.76
T-2
Kin
g92
510
Oril
lia R
d S
at
S 2
04 S
t at
C/L
Ken
t 1.
311.
760.
45T-
1K
ing
9260
9 S
320
St
at C
/L F
eder
al W
ay
at S
321
St
5.00
5.36
0.36
T-1
Kin
g92
633
S 2
72 S
t at
I-5
N.B
. off/
on R
amp
at L
K F
enw
ick
Rd
S
0.69
1.75
1.06
T-2
Kin
g 92
633
S 2
72 W
ay
at L
K F
enw
ick
Rd
S
at 5
5 A
ve S
1.
752.
220.
47T-
2K
ing
9263
3 S
277
St
at 5
5 A
ve S
at
59
Ave
S (P
vt R
d)
2.22
2.42
0.20
T-2
Kin
g 92
633
S 2
72 S
t at
59
Ave
S (P
vt R
d)
at W
est V
alle
y H
wy
2.42
2.91
0.49
T-2
Kin
g92
633
S 2
77 S
t at
Wes
t Val
ley
Hw
y at
SR
167
-N.B
.Ram
p-C
/L
Aubu
rn
2.91
3.19
0.28
T-2
Kin
g 92
633
S 2
77 S
t 15
8 Ft
. Wes
t of S
277
St
at S
277
St
3.81
3.84
0.03
T-2
Kin
g93
690
Issa
quah
Hob
art R
d at
SR
18
at C
/L Is
saqu
ah
9.44
15.5
96.
15T-
2
Kin
g 96
809
Avo
ndal
e R
d N
E
at N
E 1
16 S
t at
NE
Woo
dinv
ille-D
uval
l R
d 2.
646.
353.
71T-
2
Kin
g96
818
NE
Woo
dinv
ille-
Duv
all R
d at
C/L
Woo
dinv
ille
at A
vond
ale
Rd
NE
3.
014.
551.
55T-
2K
ing
9683
0 N
E 1
24 S
t at
C/L
Kirk
land
at
C/L
Red
mon
d 2.
603.
621.
01T-
2K
ing
9683
0 N
E12
4 W
ay/N
e 12
8 W
ay
at C
/L R
edm
ond
at A
vond
ale
Rd
NE
3.
905.
701.
80T-
2Ki
ng
9890
5 Sa
hale
e W
ay N
E at
Beg
in K
c M
ain
Rd
at R
edm
ond
Fall
City
Rd
7.24
7.90
0.66
T-2
Kin
g98
921
SE
128
St
at C
/L R
ento
n at
175
Ave
SE
3.
184.
241.
06T-
2K
itsap
13
429
New
berr
y H
ill R
d (N
W)
at P
rovo
st R
d N
W
at S
R 3
SB
on
Ram
p 2.
802.
830.
04T-
22,
019
Kits
ap13
429
New
berr
y H
ill R
d (N
W)
at S
R 3
NB
on/
off R
amps
at
Silv
erda
le W
ay N
W
3.09
3.27
0.18
T-2
1,24
3K
itsap
19
515
Silv
erda
le W
ay N
W
at N
ewbe
rry
Hill
Rd
(NW
) at
Myh
re R
d (N
W)
0.00
1.75
1.75
T-2
2,35
8K
itsap
5774
0 B
uckl
in H
ill R
d (N
W)
at A
nder
son
Hill
Rd
(NW
) at
Silv
erda
le W
ay N
W
0.00
0.25
0.25
T-2
1,96
8K
itsap
57
740
Buc
klin
Hill
Rd
(NW
) at
Silv
erda
le W
ay N
W
at B
lain
e A
ve N
W
0.25
0.55
0.30
T-2
1,96
8
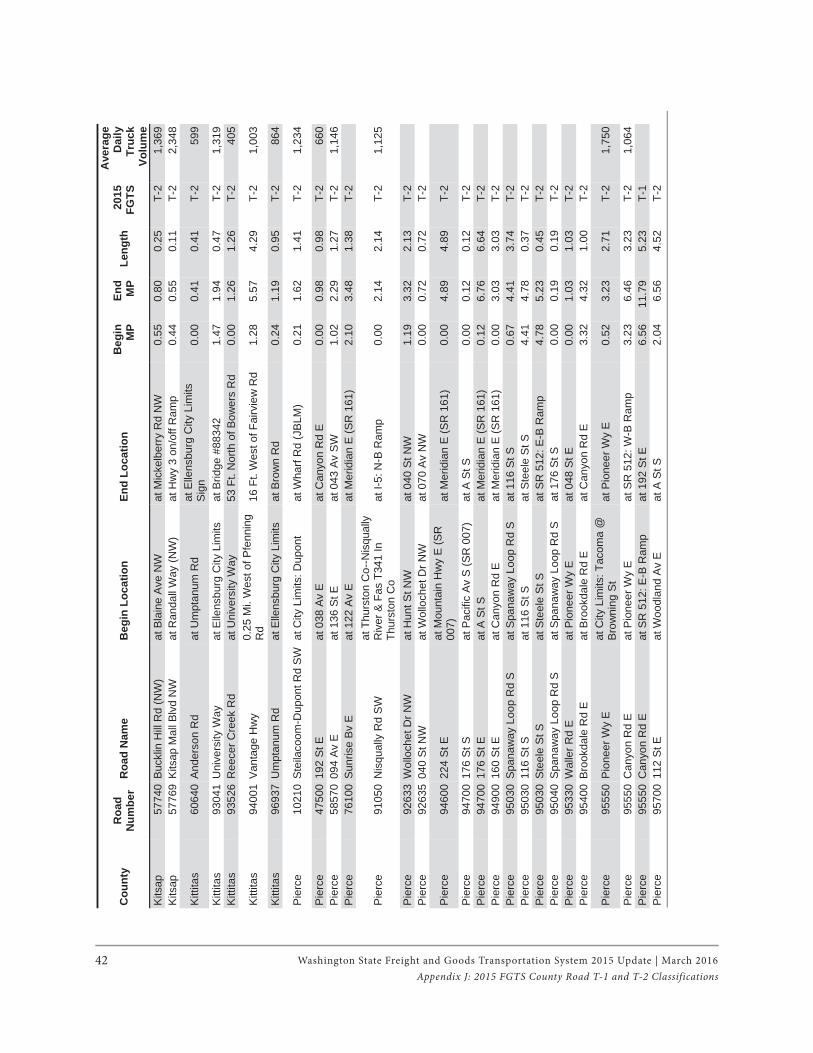
Washington State Freight and Goods Transportation System 2015 Update | March 201642Appendix J: 2015 FGTS County Road T-1 and T-2 Classifications
Cou
nty
Roa
dN
umbe
r R
oad
Nam
e B
egin
Loc
atio
n En
d Lo
catio
n B
egin
M
PEn
dM
PLe
ngth
2015
FG
TS
Ave
rage
D
aily
Tr
uck
Volu
me
Kits
ap57
740
Buc
klin
Hill
Rd
(NW
) at
Bla
ine
Ave
NW
at
Mic
kelb
erry
Rd
NW
0.
550.
800.
25T-
21,
369
Kits
ap
5776
9 K
itsap
Mal
l Blv
d N
W
at R
anda
ll W
ay (N
W)
at H
wy
3 on
/off
Ram
p 0.
440.
550.
11T-
22,
348
Kitt
itas
6064
0 An
ders
on R
d at
Um
ptan
um R
d at
Elle
nsbu
rg C
ity L
imits
S
ign
0.00
0.41
0.41
T-2
599
Kitt
itas
9304
1 U
nive
rsity
Way
at
Elle
nsbu
rg C
ity L
imits
at
Brid
ge #
8834
2 1.
471.
940.
47T-
21,
319
Kitt
itas
9352
6 R
eece
r Cre
ek R
d at
Uni
vers
ity W
ay
53 F
t. N
orth
of B
ower
s R
d 0.
001.
261.
26T-
240
5
Kitt
itas
9400
1 V
anta
ge H
wy
0.25
Mi.
Wes
t of P
fenn
ing
Rd
16 F
t. W
est o
f Fai
rvie
w R
d 1.
285.
574.
29T-
21,
003
Kitt
itas
9693
7 U
mpt
anum
Rd
at E
llens
burg
City
Lim
its
at B
row
n R
d 0.
241.
190.
95T-
286
4
Pie
rce
1021
0 S
teila
coom
-Dup
ont R
d S
Wat
City
Lim
its: D
upon
t at
Wha
rf R
d (J
BLM
) 0.
211.
621.
41T-
21,
234
Pie
rce
4750
0 19
2 S
t E
at 0
38 A
v E
at
Can
yon
Rd
E
0.00
0.98
0.98
T-2
660
Pie
rce
5857
0 09
4 A
v E
at
136
St E
at
043
Av
SW
1.
022.
291.
27T-
21,
146
Pie
rce
7610
0 S
unris
e B
v E
at
122
Av
E
at M
erid
ian
E (S
R 1
61)
2.10
3.48
1.38
T-2
Pier
ce
9105
0 N
isqu
ally
Rd
SW
at
Thu
rsto
n C
o--N
isqu
ally
R
iver
& F
as T
341
In
Thur
ston
Co
at I-
5: N
-B R
amp
0.00
2.14
2.14
T-2
1,12
5
Pie
rce
9263
3 W
ollo
chet
Dr N
W
at H
unt S
t NW
at
040
St N
W
1.19
3.32
2.13
T-2
Pie
rce
9263
5 04
0 S
t NW
at
Wol
loch
et D
r NW
at
070
Av
NW
0.
000.
720.
72T-
2
Pie
rce
9460
0 22
4 S
t E
at M
ount
ain
Hw
y E
(SR
00
7)
at M
erid
ian
E (S
R 1
61)
0.00
4.89
4.89
T-2
Pie
rce
9470
0 17
6 S
t S
at P
acifi
c A
v S
(SR
007
) at
A S
t S
0.00
0.12
0.12
T-2
Pie
rce
9470
0 17
6 S
t E
at A
St S
at
Mer
idia
n E
(SR
161
) 0.
126.
766.
64T-
2P
ierc
e 94
900
160
St E
at
Can
yon
Rd
E
at M
erid
ian
E (S
R 1
61)
0.00
3.03
3.03
T-2
Pie
rce
9503
0 Sp
anaw
ay L
oop
Rd
S
at S
pana
way
Loo
p R
d S
at 1
16 S
t S
0.67
4.41
3.74
T-2
Pie
rce
9503
0 11
6 S
t S
at 1
16 S
t S
at S
teel
e S
t S
4.41
4.78
0.37
T-2
Pie
rce
9503
0 S
teel
e S
t S
at S
teel
e S
t S
at S
R 5
12: E
-B R
amp
4.78
5.23
0.45
T-2
Pie
rce
9504
0 S
pana
way
Loo
p R
d S
at
Spa
naw
ay L
oop
Rd
S
at 1
76 S
t S
0.00
0.19
0.19
T-2
Pie
rce
9533
0 W
alle
r Rd
E
at P
ione
er W
y E
at
048
St E
0.
001.
031.
03T-
2P
ierc
e 95
400
Bro
okda
le R
d E
at
Bro
okda
le R
d E
at
Can
yon
Rd
E
3.32
4.32
1.00
T-2
Pie
rce
9555
0 P
ione
er W
y E
at
City
Lim
its: T
acom
a @
Br
owni
ng S
t at
Pio
neer
Wy
E
0.52
3.23
2.71
T-2
1,75
0
Pie
rce
9555
0 C
anyo
n R
d E
at
Pio
neer
Wy
E
at S
R 5
12: W
-B R
amp
3.23
6.46
3.23
T-2
1,06
4P
ierc
e95
550
Can
yon
Rd
E
at S
R 5
12: E
-B R
amp
at 1
92 S
t E
6.56
11.7
95.
23T-
1P
ierc
e 95
700
112
St E
at
Woo
dlan
d A
v E
at
A S
t S
2.04
6.56
4.52
T-2
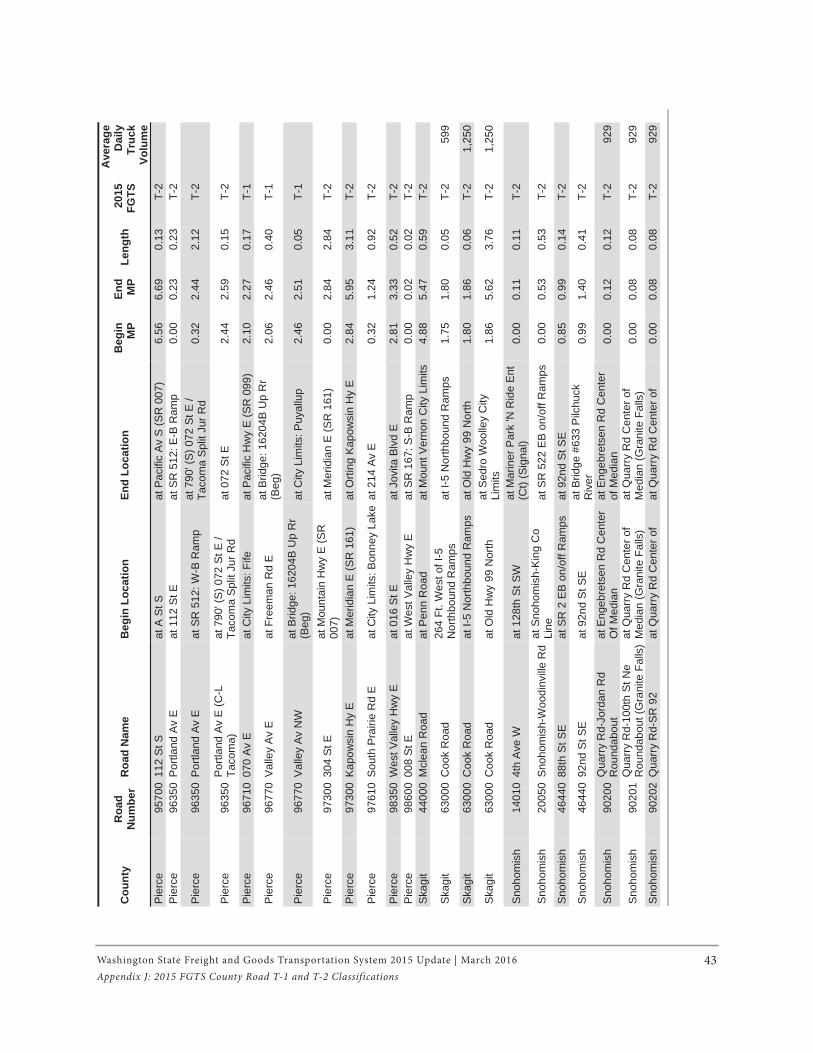
Washington State Freight and Goods Transportation System 2015 Update | March 2016 43Appendix J: 2015 FGTS County Road T-1 and T-2 Classifications
Cou
nty
Roa
dN
umbe
r R
oad
Nam
e B
egin
Loc
atio
n En
d Lo
catio
n B
egin
M
PEn
dM
PLe
ngth
2015
FG
TS
Ave
rage
D
aily
Tr
uck
Volu
me
Pie
rce
9570
0 11
2 S
t S
at A
St S
at
Pac
ific
Av
S (S
R 0
07)
6.56
6.69
0.13
T-2
Pie
rce
9635
0 P
ortla
nd A
v E
at
112
St E
at
SR
512
: E-B
Ram
p 0.
000.
230.
23T-
2
Pie
rce
9635
0 P
ortla
nd A
v E
at
SR
512
: W-B
Ram
p at
790
' (S
) 072
St E
/ Ta
com
a S
plit
Jur R
d 0.
322.
442.
12T-
2
Pier
ce
9635
0 P
ortla
nd A
v E
(C-L
Ta
com
a)
at 7
90' (
S) 0
72 S
t E /
Taco
ma
Spl
it Ju
r Rd
at 0
72 S
t E
2.44
2.59
0.15
T-2
Pie
rce
9671
0 07
0 A
v E
at
City
Lim
its: F
ife
at P
acifi
c H
wy
E (S
R 0
99)
2.10
2.27
0.17
T-1
Pie
rce
9677
0 V
alle
y A
v E
at
Fre
eman
Rd
E
at B
ridge
: 162
04B
Up
Rr
(Beg
) 2.
062.
460.
40T-
1
Pie
rce
9677
0 V
alle
y A
v N
W
at B
ridge
: 162
04B
Up
Rr
(Beg
) at
City
Lim
its: P
uyal
lup
2.46
2.51
0.05
T-1
Pie
rce
9730
0 30
4 S
t E
at M
ount
ain
Hw
y E
(SR
00
7)
at M
erid
ian
E (S
R 1
61)
0.00
2.84
2.84
T-2
Pie
rce
9730
0 K
apow
sin
Hy
E
at M
erid
ian
E (S
R 1
61)
at O
rting
Kap
owsi
n H
y E
2.
845.
953.
11T-
2
Pie
rce
9761
0 S
outh
Pra
irie
Rd
E
at C
ity L
imits
: Bon
ney
Lake
at 2
14 A
v E
0.
321.
240.
92T-
2
Pie
rce
9835
0 W
est V
alle
y H
wy
E
at 0
16 S
t E
at J
ovita
Blv
d E
2.
813.
330.
52T-
2P
ierc
e 98
600
008
St E
at
Wes
t Val
ley
Hw
y E
at
SR
167
: S-B
Ram
p 0.
000.
020.
02T-
2
Skag
it 44
000
Mcl
ean
Roa
d at
Pen
n R
oad
at M
ount
Ver
non
City
Lim
its4.
885.
470.
59T-
2
Skag
it 63
000
Coo
k R
oad
264
Ft. W
est o
f I-5
N
orth
boun
d R
amps
at
I-5
Nor
thbo
und
Ram
ps
1.75
1.80
0.05
T-2
599
Skag
it 63
000
Coo
k R
oad
at I-
5 N
orth
boun
d R
amps
at
Old
Hw
y 99
Nor
th
1.80
1.86
0.06
T-2
1,25
0
Skag
it 63
000
Coo
k R
oad
at O
ld H
wy
99 N
orth
at
Sed
ro W
oolle
y C
ity
Lim
its
1.86
5.62
3.76
T-2
1,25
0
Snoh
omis
h 14
010
4th
Ave
W
at 1
28th
St S
W
at M
arin
er P
ark
'N R
ide
Ent
(C
t) (S
igna
l) 0.
000.
110.
11T-
2
Snoh
omis
h 20
050
Snoh
omis
h-W
oodi
nvill
e R
dat
Sno
hom
ish-
King
Co
Line
at
SR
522
EB
on/
off R
amps
0.00
0.53
0.53
T-2
Snoh
omis
h 46
440
88th
St S
E
at S
R 2
EB
on/
off R
amps
at
92n
d S
t SE
0.
850.
990.
14T-
2
Sno
hom
ish
4644
0 92
nd S
t SE
at
92n
d S
t SE
at
Brid
ge #
633
Pilc
huck
R
iver
0.
991.
400.
41T-
2
Snoh
omis
h 90
200
Qua
rry
Rd-
Jord
an R
d R
ound
abou
t at
Eng
ebre
tsen
Rd
Cen
ter
Of M
edia
n at
Eng
ebre
tsen
Rd
Cen
ter
of M
edia
n 0.
000.
120.
12T-
292
9
Snoh
omis
h 90
201
Qua
rry
Rd-
100t
h S
t Ne
Rou
ndab
out (
Gra
nite
Fal
ls)
at Q
uarr
y R
d C
ente
r of
Med
ian
(Gra
nite
Fal
ls)
at Q
uarr
y R
d C
ente
r of
Med
ian
(Gra
nite
Fal
ls)
0.00
0.08
0.08
T-2
929
Snoh
omis
h 90
202
Qua
rry
Rd-
SR
92
at Q
uarr
y R
d C
ente
r of
at Q
uarr
y R
d C
ente
r of
0.00
0.08
0.08
T-2
929
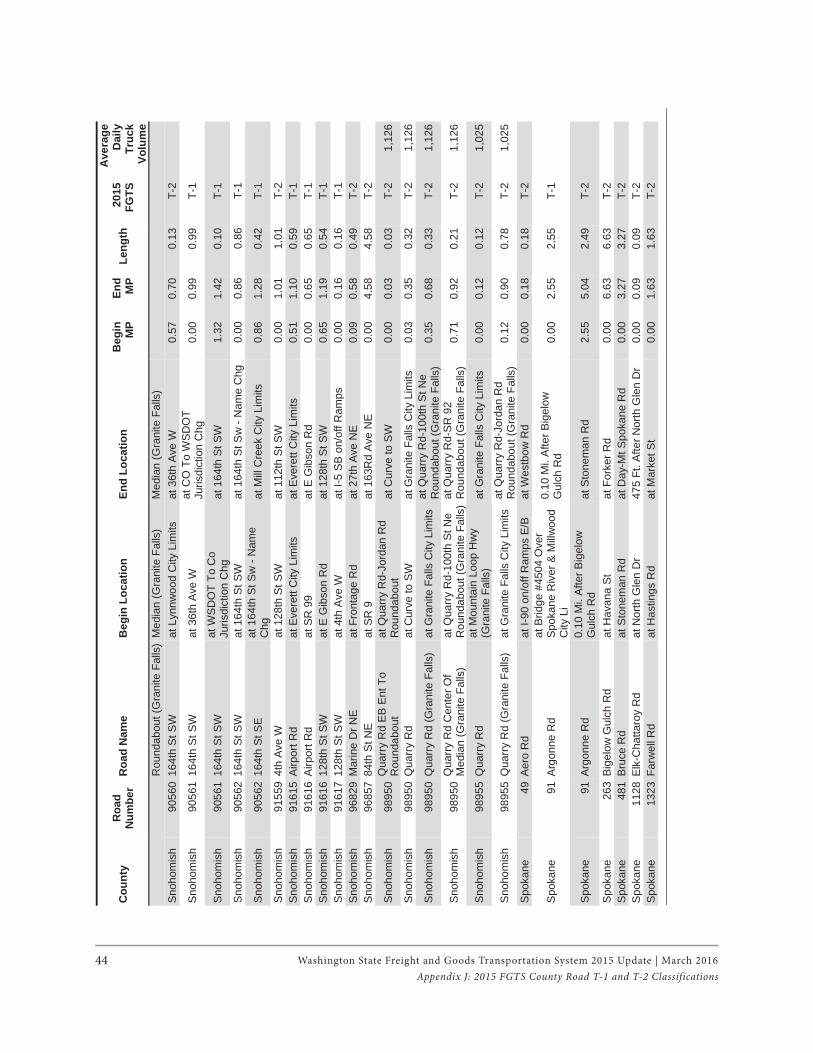
Washington State Freight and Goods Transportation System 2015 Update | March 201644Appendix J: 2015 FGTS County Road T-1 and T-2 Classifications
Cou
nty
Roa
dN
umbe
r R
oad
Nam
e B
egin
Loc
atio
n En
d Lo
catio
n B
egin
M
PEn
dM
PLe
ngth
2015
FG
TS
Ave
rage
D
aily
Tr
uck
Volu
me
Rou
ndab
out (
Gra
nite
Fal
ls)
Med
ian
(Gra
nite
Fal
ls)
Med
ian
(Gra
nite
Fal
ls)
Snoh
omis
h 90
560
164t
h S
t SW
at
Lyn
nwoo
d C
ity L
imits
at
36t
h A
ve W
0.
570.
700.
13T-
2
Sno
hom
ish
9056
1 16
4th
St S
W
at 3
6th
Ave
W
at C
O T
o W
SD
OT
Juris
dict
ion
Chg
0.
000.
990.
99T-
1
Snoh
omis
h 90
561
164t
h S
t SW
at
WS
DO
T To
Co
Juris
dict
ion
Chg
at
164
th S
t SW
1.
321.
420.
10T-
1
Sno
hom
ish
9056
2 16
4th
St S
W
at 1
64th
St S
W
at 1
64th
St S
w -
Nam
e C
hg0.
000.
860.
86T-
1
Snoh
omis
h 90
562
164t
h S
t SE
at
164
th S
t Sw
- N
ame
Chg
at
Mill
Cre
ek C
ity L
imits
0.
861.
280.
42T-
1
Sno
hom
ish
9155
9 4t
h A
ve W
at
128
th S
t SW
at
112
th S
t SW
0.
001.
011.
01T-
2Sn
ohom
ish
9161
5 A
irpor
t Rd
at E
vere
tt C
ity L
imits
at
Eve
rett
City
Lim
its
0.51
1.10
0.59
T-1
Sno
hom
ish
9161
6 A
irpor
t Rd
at S
R 9
9 at
E G
ibso
n R
d 0.
000.
650.
65T-
1Sn
ohom
ish
9161
6 12
8th
St S
W
at E
Gib
son
Rd
at 1
28th
St S
W
0.65
1.19
0.54
T-1
Sno
hom
ish
9161
7 12
8th
St S
W
at 4
th A
ve W
at
I-5
SB
on/
off R
amps
0.
000.
160.
16T-
1Sn
ohom
ish
9682
9 M
arin
e D
r NE
at
Fro
ntag
e R
d at
27t
h A
ve N
E
0.09
0.58
0.49
T-2
Sno
hom
ish
9685
7 84
th S
t NE
at
SR
9
at 1
63R
d A
ve N
E
0.00
4.58
4.58
T-2
Snoh
omis
h 98
950
Qua
rry
Rd
EB
Ent
To
Rou
ndab
out
at Q
uarr
y R
d-Jo
rdan
Rd
Rou
ndab
out
at C
urve
to S
W
0.00
0.03
0.03
T-2
1,12
6
Sno
hom
ish
9895
0 Q
uarr
y R
d at
Cur
ve to
SW
at
Gra
nite
Fal
ls C
ity L
imits
0.
030.
350.
32T-
21,
126
Snoh
omis
h 98
950
Qua
rry
Rd
(Gra
nite
Fal
ls)
at G
rani
te F
alls
City
Lim
its
at Q
uarr
y R
d-10
0th
St N
e R
ound
abou
t (G
rani
te F
alls
) 0.
350.
680.
33T-
21,
126
Snoh
omis
h 98
950
Qua
rry
Rd
Cen
ter O
f M
edia
n (G
rani
te F
alls
) at
Qua
rry
Rd-
100t
h S
t Ne
Rou
ndab
out (
Gra
nite
Fal
ls)
at Q
uarr
y R
d-S
R 9
2 R
ound
abou
t (G
rani
te F
alls
) 0.
710.
920.
21T-
21,
126
Snoh
omis
h 98
955
Qua
rry
Rd
at M
ount
ain
Loop
Hw
y (G
rani
te F
alls
) at
Gra
nite
Fal
ls C
ity L
imits
0.
000.
120.
12T-
21,
025
Sno
hom
ish
9895
5 Q
uarr
y R
d (G
rani
te F
alls
) at
Gra
nite
Fal
ls C
ity L
imits
at
Qua
rry
Rd-
Jord
an R
d R
ound
abou
t (G
rani
te F
alls
) 0.
120.
900.
78T-
21,
025
Spo
kane
49
Aer
o R
d at
I-90
on/
off R
amps
E/B
at
Wes
tbow
Rd
0.00
0.18
0.18
T-2
Spok
ane
91 A
rgon
ne R
d at
Brid
ge #
4504
Ove
r Sp
okan
e R
iver
& M
illw
ood
City
Li
0.10
Mi.
Afte
r Big
elow
G
ulch
Rd
0.00
2.55
2.55
T-1
Spo
kane
91
Arg
onne
Rd
0.10
Mi.
Afte
r Big
elow
G
ulch
Rd
at S
tone
man
Rd
2.55
5.04
2.49
T-2
Spo
kane
26
3 B
igel
ow G
ulch
Rd
at H
avan
a S
t at
For
ker R
d 0.
006.
636.
63T-
2S
poka
ne
481
Bru
ce R
d at
Sto
nem
an R
d at
Day
-Mt S
poka
ne R
d 0.
003.
273.
27T-
2S
poka
ne
1128
Elk
-Cha
ttaro
y R
d at
Nor
th G
len
Dr
475
Ft. A
fter N
orth
Gle
n D
r 0.
000.
090.
09T-
2S
poka
ne
1323
Far
wel
l Rd
at H
astin
gs R
d at
Mar
ket S
t 0.
001.
631.
63T-
2
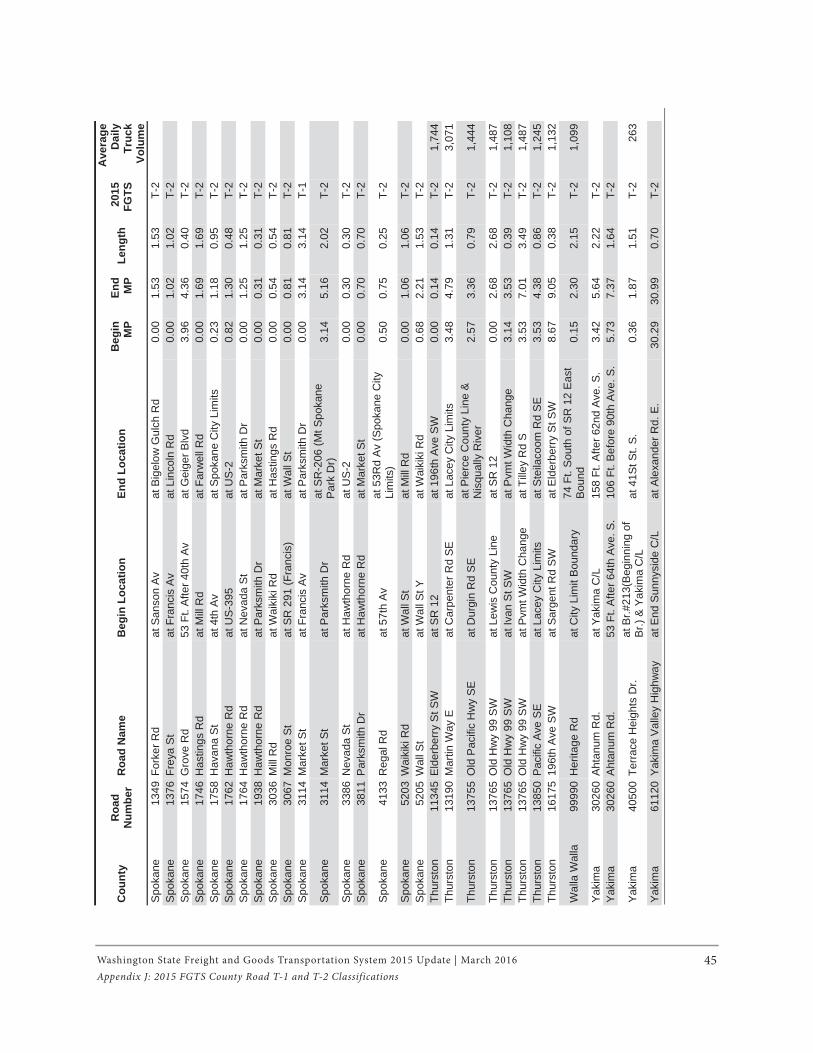
Washington State Freight and Goods Transportation System 2015 Update | March 2016 45Appendix J: 2015 FGTS County Road T-1 and T-2 Classifications
Cou
nty
Roa
dN
umbe
r R
oad
Nam
e B
egin
Loc
atio
n En
d Lo
catio
n B
egin
M
PEn
dM
PLe
ngth
2015
FG
TS
Ave
rage
D
aily
Tr
uck
Volu
me
Spo
kane
13
49 F
orke
r Rd
at S
anso
n A
v at
Big
elow
Gul
ch R
d 0.
001.
531.
53T-
2S
poka
ne
1376
Fre
ya S
t at
Fra
ncis
Av
at L
inco
ln R
d 0.
001.
021.
02T-
2S
poka
ne
1574
Gro
ve R
d 53
Ft.
Afte
r 40t
h A
v at
Gei
ger B
lvd
3.96
4.36
0.40
T-2
Spo
kane
17
46 H
astin
gs R
d at
Mill
Rd
at F
arw
ell R
d 0.
001.
691.
69T-
2Sp
okan
e 17
58 H
avan
a St
at
4th
Av
at S
poka
ne C
ity L
imits
0.
231.
180.
95T-
2S
poka
ne
1762
Haw
thor
ne R
d at
US
-395
at
US
-2
0.82
1.30
0.48
T-2
Spo
kane
17
64 H
awth
orne
Rd
at N
evad
a S
t at
Par
ksm
ith D
r 0.
001.
251.
25T-
2S
poka
ne
1938
Haw
thor
ne R
d at
Par
ksm
ith D
r at
Mar
ket S
t 0.
000.
310.
31T-
2S
poka
ne
3036
Mill
Rd
at W
aiki
ki R
d at
Has
tings
Rd
0.00
0.54
0.54
T-2
Spo
kane
30
67 M
onro
e S
t at
SR
291
(Fra
ncis
) at
Wal
l St
0.00
0.81
0.81
T-2
Spo
kane
31
14 M
arke
t St
at F
ranc
is A
v at
Par
ksm
ith D
r 0.
003.
143.
14T-
1
Spo
kane
31
14 M
arke
t St
at P
arks
mith
Dr
at S
R-2
06 (M
t Spo
kane
P
ark
Dr)
3.
145.
162.
02T-
2
Spo
kane
33
86 N
evad
a S
t at
Haw
thor
ne R
d at
US
-2
0.00
0.30
0.30
T-2
Spo
kane
38
11 P
arks
mith
Dr
at H
awth
orne
Rd
at M
arke
t St
0.00
0.70
0.70
T-2
Spo
kane
41
33 R
egal
Rd
at 5
7th
Av
at 5
3Rd
Av
(Spo
kane
City
Li
mits
) 0.
500.
750.
25T-
2
Spo
kane
52
03 W
aiki
ki R
d at
Wal
l St
at M
ill R
d 0.
001.
061.
06T-
2S
poka
ne
5205
Wal
l St
at W
all S
t Y
at W
aiki
ki R
d 0.
682.
211.
53T-
2Th
urst
on
1134
5 E
lder
berr
y S
t SW
at
SR
12
at 1
96th
Ave
SW
0.
000.
140.
14T-
21,
744
Thur
ston
13
190
Mar
tin W
ay E
at
Car
pent
er R
d S
E
at L
acey
City
Lim
its
3.48
4.79
1.31
T-2
3,07
1
Thur
ston
13
755
Old
Pac
ific
Hw
y S
E
at D
urgi
n R
d S
E
at P
ierc
e C
ount
y Li
ne &
N
isqu
ally
Riv
er
2.57
3.36
0.79
T-2
1,44
4
Thur
ston
13
765
Old
Hw
y 99
SW
at
Lew
is C
ount
y Li
ne
at S
R 1
2 0.
002.
682.
68T-
21,
487
Thur
ston
13
765
Old
Hw
y 99
SW
at
Ivan
St S
W
at P
vmt W
idth
Cha
nge
3.14
3.53
0.39
T-2
1,10
8Th
urst
on
1376
5 O
ld H
wy
99 S
W
at P
vmt W
idth
Cha
nge
at T
illey
Rd
S
3.53
7.01
3.49
T-2
1,48
7Th
urst
on
1385
0 P
acifi
c A
ve S
E
at L
acey
City
Lim
its
at S
teila
coom
Rd
SE
3.
534.
380.
86T-
21,
245
Thur
ston
16
175
196t
h A
ve S
W
at S
arge
nt R
d S
W
at E
lder
berr
y S
t SW
8.
679.
050.
38T-
21,
132
Wal
la W
alla
99
990
Her
itage
Rd
at C
ity L
imit
Bou
ndar
y 74
Ft.
Sou
th o
f SR
12
Eas
t B
ound
0.
152.
302.
15T-
21,
099
Yak
ima
3026
0 A
htan
um R
d.
at Y
akim
a C
/L
158
Ft. A
fter 6
2nd
Ave
. S.
3.42
5.64
2.22
T-2
Yak
ima
3026
0 A
htan
um R
d.
53 F
t. A
fter 6
4th
Ave
. S.
106
Ft. B
efor
e 90
th A
ve. S
. 5.
737.
371.
64T-
2
Yak
ima
4050
0 Te
rrace
Hei
ghts
Dr.
at B
r.#21
3(B
egin
ning
of
Br.)
& Y
akim
a C
/L
at 4
1St S
t. S
. 0.
361.
871.
51T-
226
3
Yak
ima
6112
0 Ya
kim
a Va
lley
Hig
hway
at
End
Sun
nysi
de C
/L
at A
lexa
nder
Rd.
E.
30.2
930
.99
0.70
T-2
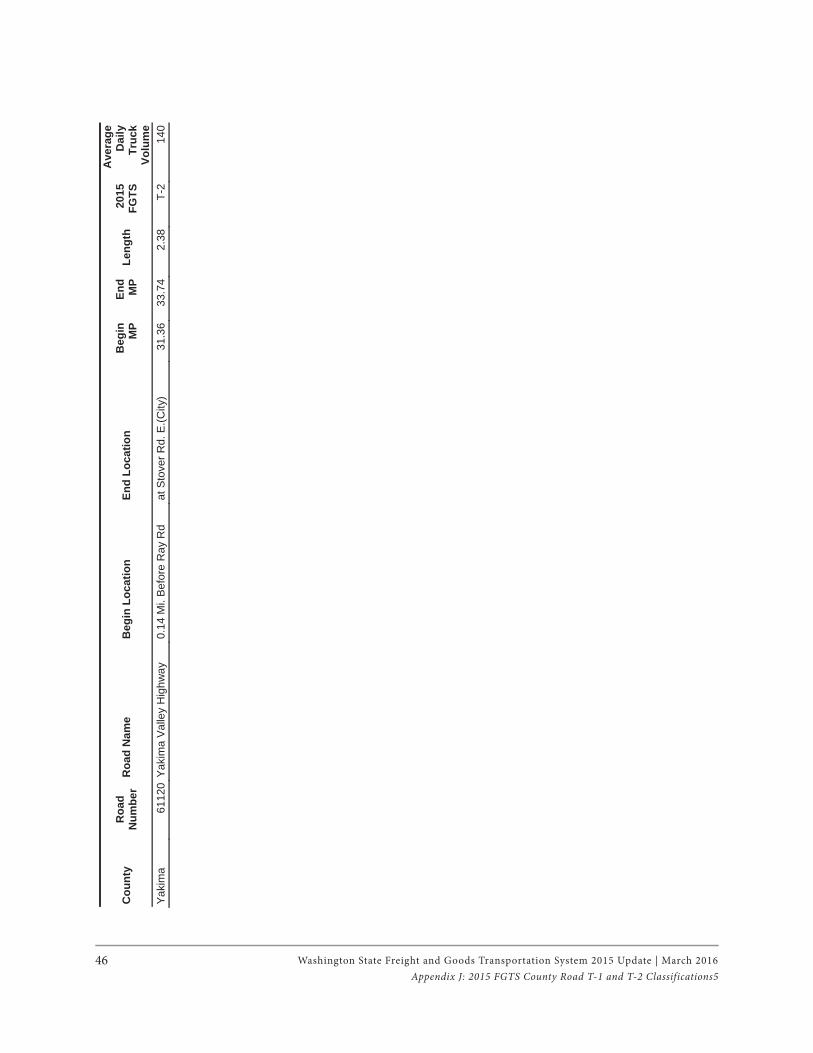
Washington State Freight and Goods Transportation System 2015 Update | March 201646Appendix J: 2015 FGTS County Road T-1 and T-2 Classifications5
Cou
nty
Roa
dN
umbe
r R
oad
Nam
e B
egin
Loc
atio
n En
d Lo
catio
n B
egin
M
PEn
dM
PLe
ngth
2015
FG
TS
Ave
rage
D
aily
Tr
uck
Volu
me
Yak
ima
6112
0 Y
akim
a V
alle
y H
ighw
ay
0.14
Mi.
Bef
ore
Ray
Rd
at S
tove
r Rd.
E.(C
ity)
31.3
633
.74
2.38
T-2
140
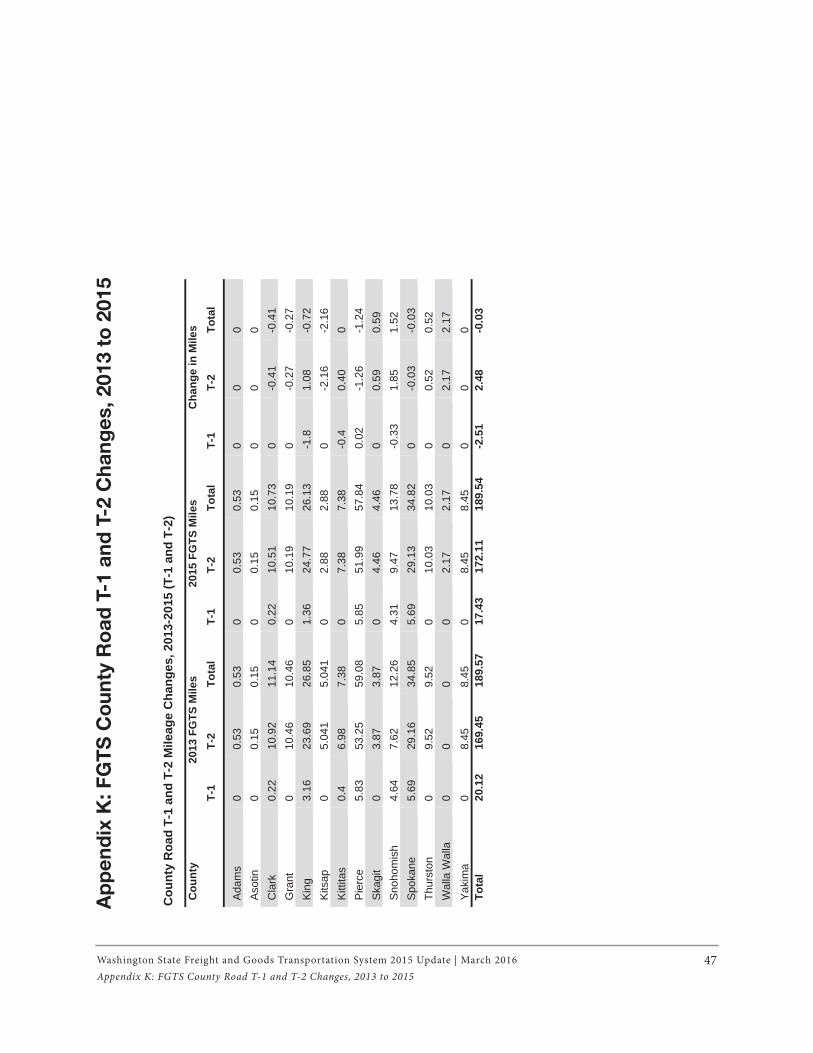
Washington State Freight and Goods Transportation System 2015 Update | March 2016 47Appendix K: FGTS County Road T-1 and T-2 Changes, 2013 to 2015
Cou
nty
Roa
d T-
1 an
d T-
2 M
ileag
e C
hang
es, 2
013-
2015
(T-1
and
T-2
)
Cou
nty
2013
FG
TS M
iles
2015
FG
TS M
iles
Cha
nge
in M
iles
T-1
T-2
Tota
lT-
1T-
2To
tal
T-1
T-2
Tota
l
Adam
s 0
0.53
0.
53
00.
53
0.53
0
00
Asot
in
0 0.
15
0.15
0
0.15
0.
15
0 0
0 C
lark
0.
22
10.9
2 11
.14
0.22
10
.51
10.7
3 0
-0.4
1-0
.41
Gra
nt
0 10
.46
10.4
6 0
10.1
9 10
.19
0 -0
.27
-0.2
7 K
ing
3.16
23
.69
26.8
5 1.
36
24.7
7 26
.13
-1.8
1.08
-0
.72
Kits
ap
0 5.
041
5.04
1 0
2.88
2.
88
0 -2
.16
-2.1
6 K
ittita
s0.
4 6.
98
7.38
0
7.38
7.
38
-0.4
0.40
0
Pier
ce
5.83
53
.25
59.0
8 5.
85
51.9
9 57
.84
0.02
-1
.26
-1.2
4 Sk
agit
03.
87
3.87
0
4.46
4.
46
00.
59
0.59
Sn
ohom
ish
4.64
7.
62
12.2
6 4.
31
9.47
13
.78
-0.3
3 1.
85
1.52
S
poka
ne
5.69
29
.16
34.8
5 5.
69
29.1
3 34
.82
0-0
.03
-0.0
3Th
urst
on
0 9.
52
9.52
0
10.0
3 10
.03
0 0.
52
0.52
W
alla
Wal
la
00
00
2.17
2.
17
02.
17
2.17
Yaki
ma
0 8.
45
8.45
0
8.45
8.
45
0 0
0 To
tal
20.1
2 16
9.45
18
9.57
17.4
317
2.11
189.
54-2
.51
2.48
-0.0
3
Ap
pe
nd
ix K
: F
GT
S C
ou
nty
Ro
ad
T-1
an
d T
-2 C
ha
ng
es,
2013
to
20
15
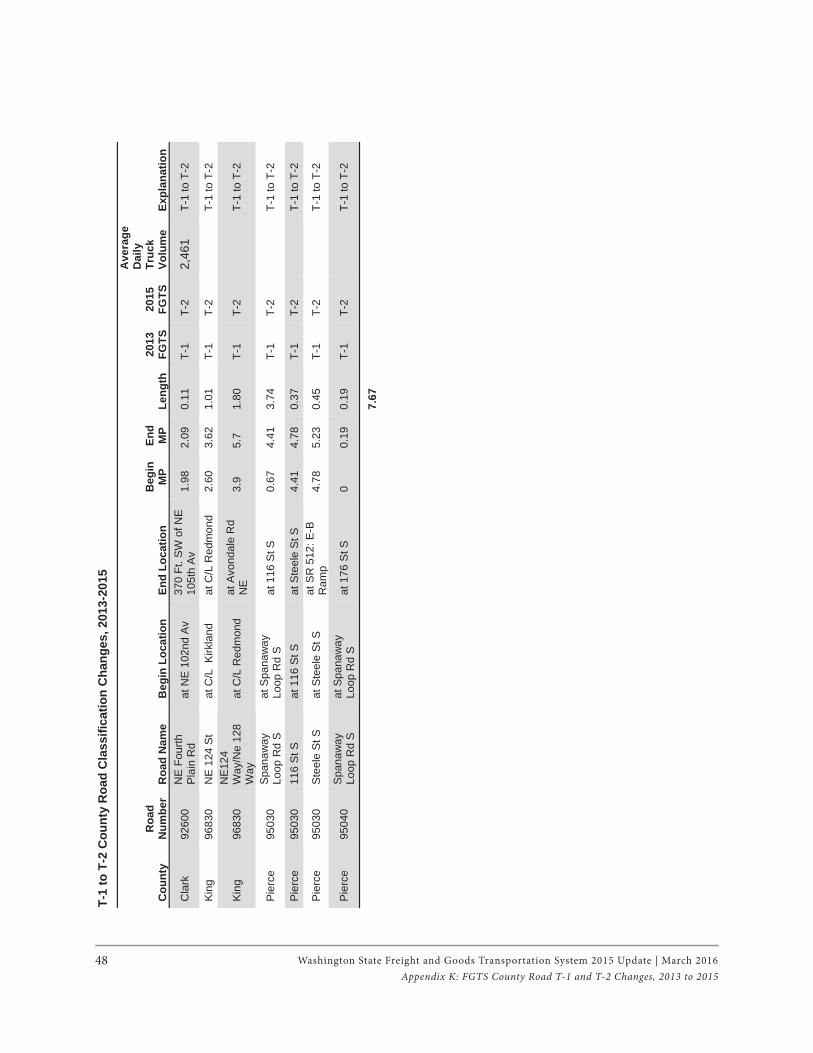
Washington State Freight and Goods Transportation System 2015 Update | March 201648Appendix K: FGTS County Road T-1 and T-2 Changes, 2013 to 2015
T-1
to T
-2 C
ount
y R
oad
Cla
ssifi
catio
n C
hang
es, 2
013-
2015
Cou
nty
Roa
dN
umbe
r R
oad
Nam
e B
egin
Loc
atio
n En
d Lo
catio
n B
egin
M
PEn
dM
P Le
ngth
20
13
FGTS
20
15
FGTS
Ave
rage
D
aily
Tr
uck
Volu
me
Expl
anat
ion
Cla
rk
9260
0 N
E F
ourth
Pl
ain
Rd
at N
E 1
02nd
Av
370
Ft. S
W o
f NE
10
5th
Av
1.98
2.
09
0.11
T-
1 T-
2 2,
461
T-1
to T
-2
Kin
g 96
830
NE
124
St
at C
/L K
irkla
nd
at C
/L R
edm
ond
2.60
3.
62
1.01
T-
1 T-
2 T-
1 to
T-2
Kin
g96
830
NE1
24
Way
/Ne
128
Way
at
C/L
Red
mon
d at
Avo
ndal
e R
d N
E3.
9 5.
7 1.
80
T-1
T-2
T-1
to T
-2
Pier
ce
9503
0 Sp
anaw
ay
Loop
Rd
S
at S
pana
way
Lo
op R
d S
at
116
St S
0.
67
4.41
3.
74
T-1
T-2
T-1
to T
-2
Pie
rce
9503
0 11
6 S
t S
at 1
16 S
t S
at S
teel
e S
t S
4.41
4.
78
0.37
T-
1 T-
2 T-
1 to
T-2
Pie
rce
9503
0 S
teel
e S
t S
at S
teel
e S
t S
at S
R 5
12: E
-B
Ram
p 4.
78
5.23
0.
45
T-1
T-2
T-1
to T
-2
Pie
rce
9504
0 Sp
anaw
ay
Loop
Rd
S
at S
pana
way
Lo
op R
d S
at
176
St S
0
0.19
0.
19
T-1
T-2
T-1
to T
-2
7.67
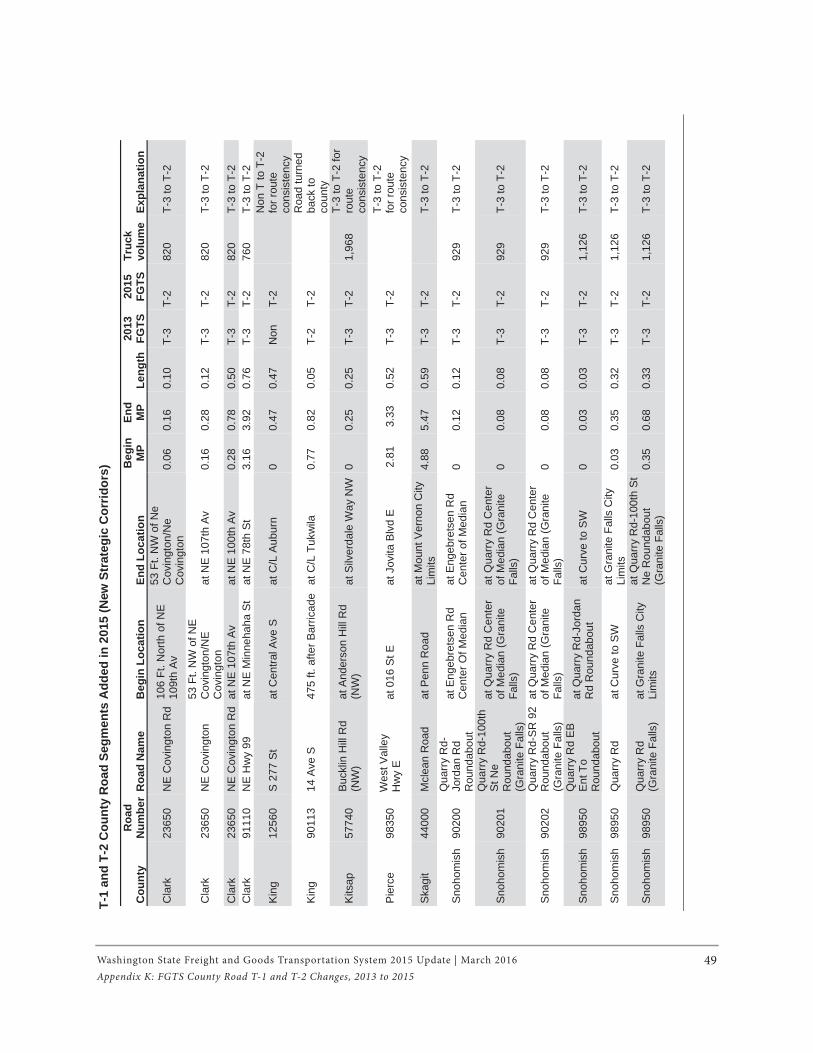
Washington State Freight and Goods Transportation System 2015 Update | March 2016 49Appendix K: FGTS County Road T-1 and T-2 Changes, 2013 to 2015
T-1
and
T-2
Cou
nty
Roa
d Se
gmen
ts A
dded
in 2
015
(New
Str
ateg
ic C
orrid
ors)
Cou
nty
Roa
dN
umbe
r R
oad
Nam
e B
egin
Loc
atio
n En
d Lo
catio
n B
egin
M
PEn
dM
P Le
ngth
2013
FG
TS20
15
FGTS
Tr
uck
volu
me
Expl
anat
ion
Cla
rk
2365
0 N
E C
ovin
gton
Rd
106
Ft. N
orth
of N
E
109t
h A
v
53 F
t. N
W o
f Ne
Cov
ingt
on/N
e C
ovin
gton
0.
06
0.16
0.
10
T-3
T-2
820
T-3
to T
-2
Cla
rk
2365
0 N
E C
ovin
gton
53
Ft.
NW
of N
E
Cov
ingt
on/N
E
Cov
ingt
on
at N
E 1
07th
Av
0.16
0.
28
0.12
T-
3 T-
2 82
0 T-
3 to
T-2
Cla
rk
2365
0 N
E C
ovin
gton
Rd
at N
E 1
07th
Av
at N
E 1
00th
Av
0.28
0.
78
0.50
T-
3 T-
2 82
0 T-
3 to
T-2
C
lark
91
110
NE
Hw
y 99
at
NE
Min
neha
ha S
t at
NE
78t
h S
t 3.
16
3.92
0.
76
T-3
T-2
760
T-3
to T
-2
Kin
g12
560
S 2
77 S
t at
Cen
tral A
ve S
at
C/L
Aub
urn
00.
47
0.47
N
on
T-2
Non
T to
T-2
fo
r rou
te
cons
iste
ncy
Kin
g 90
113
14 A
ve S
47
5 ft.
afte
r Bar
ricad
eat
C/L
Tuk
wila
0.
77
0.82
0.
05
T-2
T-2
Roa
d tu
rned
ba
ck to
co
unty
Kits
ap57
740
Buc
klin
Hill
Rd
(NW
)at
And
erso
n H
ill R
d (N
W)
at S
ilver
dale
Way
NW
00.
25
0.25
T-
3 T-
2 1,
968
T-3
to T
-2 fo
r ro
ute
cons
iste
ncy
Pier
ce
9835
0 W
est V
alle
y H
wy
E
at 0
16 S
t E
at J
ovita
Blv
d E
2.
81
3.33
0.
52
T-3
T-2
T-3
to T
-2
for r
oute
co
nsis
tenc
y
Skag
it 44
000
Mcl
ean
Roa
d at
Pen
n R
oad
at M
ount
Ver
non
City
Li
mits
4.
88
5.47
0.
59
T-3
T-2
T-3
to T
-2
Snoh
omis
h 90
200
Qua
rry
Rd-
Jord
an R
d R
ound
abou
t
at E
ngeb
rets
en R
d C
ente
r Of M
edia
n at
Eng
ebre
tsen
Rd
Cen
ter o
f Med
ian
0 0.
12
0.12
T-
3 T-
2 92
9 T-
3 to
T-2
Snoh
omis
h 90
201
Qua
rry
Rd-
100t
h S
t Ne
Rou
ndab
out
(Gra
nite
Fal
ls)
at Q
uarr
y R
d C
ente
r of
Med
ian
(Gra
nite
Fa
lls)
at Q
uarr
y R
d C
ente
r of
Med
ian
(Gra
nite
Fa
lls)
00.
08
0.08
T-
3 T-
2 92
9 T-
3 to
T-2
Snoh
omis
h 90
202
Qua
rry
Rd-
SR
92
Rou
ndab
out
(Gra
nite
Fal
ls)
at Q
uarr
y R
d C
ente
r of
Med
ian
(Gra
nite
Fa
lls)
at Q
uarr
y R
d C
ente
r of
Med
ian
(Gra
nite
Fa
lls)
0 0.
08
0.08
T-
3 T-
2 92
9 T-
3 to
T-2
Snoh
omis
h 98
950
Qua
rry
Rd
EB
E
nt T
o R
ound
abou
t
at Q
uarr
y R
d-Jo
rdan
R
d R
ound
abou
t at
Cur
ve to
SW
0
0.03
0.
03
T-3
T-2
1,12
6 T-
3 to
T-2
Sno
hom
ish
9895
0 Q
uarr
y R
d at
Cur
ve to
SW
at
Gra
nite
Fal
ls C
ity
Lim
its
0.03
0.
35
0.32
T-
3 T-
2 1,
126
T-3
to T
-2
Snoh
omis
h 98
950
Qua
rry
Rd
(Gra
nite
Fal
ls)
at G
rani
te F
alls
City
Li
mits
at Q
uarr
y R
d-10
0th
St
Ne
Rou
ndab
out
(Gra
nite
Fal
ls)
0.35
0.
68
0.33
T-
3 T-
2 1,
126
T-3
to T
-2
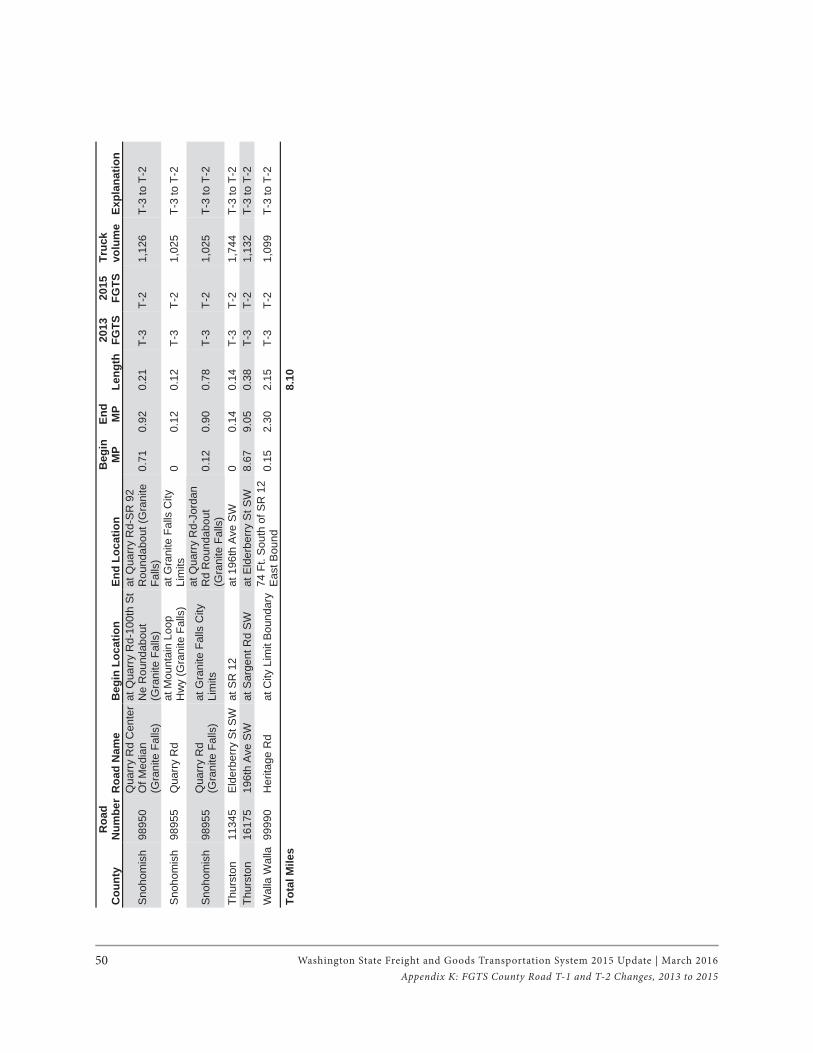
Washington State Freight and Goods Transportation System 2015 Update | March 201650Appendix K: FGTS County Road T-1 and T-2 Changes, 2013 to 2015
Cou
nty
Roa
dN
umbe
r R
oad
Nam
e B
egin
Loc
atio
n En
d Lo
catio
n B
egin
M
PEn
dM
P Le
ngth
2013
FG
TS20
15
FGTS
Tr
uck
volu
me
Expl
anat
ion
Snoh
omis
h 98
950
Qua
rry
Rd
Cen
ter
Of M
edia
n (G
rani
te F
alls
)
at Q
uarr
y R
d-10
0th
St
Ne
Rou
ndab
out
(Gra
nite
Fal
ls)
at Q
uarr
y R
d-S
R 9
2 R
ound
abou
t (G
rani
te
Falls
) 0.
71
0.92
0.
21
T-3
T-2
1,12
6 T-
3 to
T-2
Sno
hom
ish
9895
5 Q
uarr
y R
d at
Mou
ntai
n Lo
op
Hw
y (G
rani
te F
alls
) at
Gra
nite
Fal
ls C
ity
Lim
its
0 0.
12
0.12
T-
3 T-
2 1,
025
T-3
to T
-2
Snoh
omis
h 98
955
Qua
rry
Rd
(Gra
nite
Fal
ls)
at G
rani
te F
alls
City
Li
mits
at Q
uarr
y R
d-Jo
rdan
R
d R
ound
abou
t (G
rani
te F
alls
) 0.
12
0.90
0.
78
T-3
T-2
1,02
5 T-
3 to
T-2
Thur
ston
11
345
Eld
erbe
rry
St S
W a
t SR
12
at 1
96th
Ave
SW
0
0.14
0.
14
T-3
T-2
1,74
4 T-
3 to
T-2
Th
urst
on
1617
5 19
6th
Ave
SW
at
Sar
gent
Rd
SW
at
Eld
erbe
rry
St S
W
8.67
9.
05
0.38
T-
3 T-
2 1,
132
T-3
to T
-2
Wal
la W
alla
999
90
Her
itage
Rd
at C
ity L
imit
Bou
ndar
y74
Ft.
Sou
th o
f SR
12
Eas
t Bou
nd
0.15
2.
30
2.15
T-
3 T-
2 1,
099
T-3
to T
-2
Tota
l Mile
s 8.
10
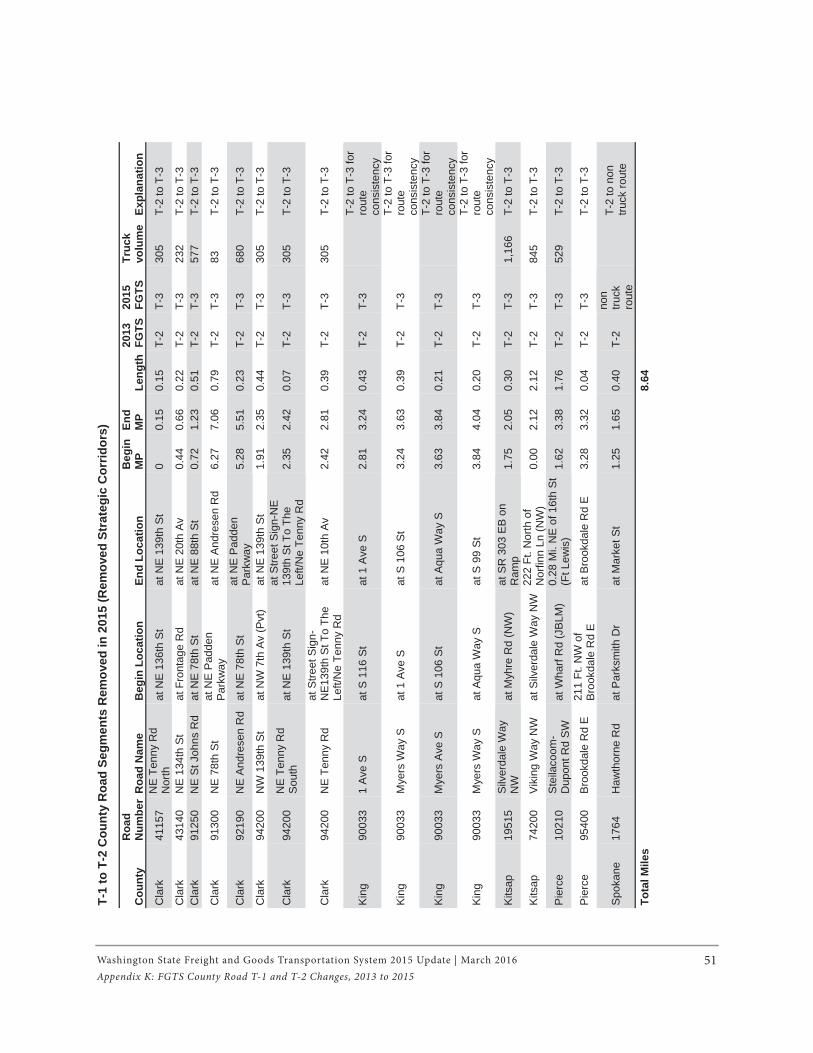
Washington State Freight and Goods Transportation System 2015 Update | March 2016 51Appendix K: FGTS County Road T-1 and T-2 Changes, 2013 to 2015
T-1
to T
-2 C
ount
y R
oad
Segm
ents
Rem
oved
in 2
015
(Rem
oved
Str
ateg
ic C
orrid
ors)
Cou
nty
Roa
dN
umbe
r R
oad
Nam
e B
egin
Loc
atio
n En
d Lo
catio
n B
egin
M
PEn
dM
P Le
ngth
2013
FG
TS20
15
FGTS
Tr
uck
volu
me
Expl
anat
ion
Cla
rk
4115
7 N
E T
enny
Rd
Nor
th
at N
E 1
36th
St
at N
E 1
39th
St
00.
15
0.15
T-
2 T-
3 30
5 T-
2 to
T-3
Cla
rk
4314
0 N
E 1
34th
St
at F
ront
age
Rd
at N
E 2
0th
Av
0.44
0.
66
0.22
T-
2 T-
3 23
2 T-
2 to
T-3
C
lark
91
250
NE
St J
ohns
Rd
at N
E 7
8th
St
at N
E 8
8th
St
0.72
1.
23
0.51
T-
2 T-
3 57
7 T-
2 to
T-3
Cla
rk
9130
0 N
E 7
8th
St
at N
E P
adde
n P
arkw
ay
at N
E A
ndre
sen
Rd
6.27
7.
06
0.79
T-
2 T-
3 83
T-
2 to
T-3
Cla
rk
9219
0 N
E An
dres
en R
d at
NE
78t
h S
t at
NE
Pad
den
Par
kway
5.
28
5.51
0.
23
T-2
T-3
680
T-2
to T
-3
Cla
rk
9420
0 N
W 1
39th
St
at N
W 7
th A
v (P
vt)
at N
E 1
39th
St
1.91
2.
35
0.44
T-
2 T-
3 30
5 T-
2 to
T-3
Cla
rk
9420
0 N
E T
enny
Rd
Sou
th
at N
E 1
39th
St
at S
treet
Sig
n-N
E
139t
h St
To
The
Left/
Ne
Tenn
y R
d
2.35
2.
42
0.07
T-
2 T-
3 30
5 T-
2 to
T-3
Cla
rk
9420
0 N
E Te
nny
Rd
at S
treet
Sig
n-N
E139
th S
t To
The
Left/
Ne
Tenn
y R
d
at N
E 1
0th
Av
2.42
2.
81
0.39
T-
2 T-
3 30
5 T-
2 to
T-3
Kin
g90
033
1 A
ve S
at
S 1
16 S
t at
1 A
ve S
2.
81
3.24
0.
43
T-2
T-3
T-2
to T
-3 fo
r ro
ute
cons
iste
ncy
Kin
g 90
033
Mye
rs W
ay S
at
1 A
ve S
at
S 1
06 S
t 3.
24
3.63
0.
39
T-2
T-3
T-2
to T
-3 fo
r ro
ute
cons
iste
ncy
Kin
g90
033
Mye
rs A
ve S
at
S 1
06 S
t at
Aqu
a W
ay S
3.
63
3.84
0.
21
T-2
T-3
T-2
to T
-3 fo
r ro
ute
cons
iste
ncy
Kin
g 90
033
Mye
rs W
ay S
at
Aqu
a W
ay S
at
S 9
9 S
t 3.
84
4.04
0.
20
T-2
T-3
T-2
to T
-3 fo
r ro
ute
cons
iste
ncy
Kits
ap19
515
Silv
erda
le W
ay
NW
at M
yhre
Rd
(NW
) at
SR
303
EB
on
Ram
p 1.
75
2.05
0.
30
T-2
T-3
1,16
6 T-
2 to
T-3
Kits
ap
7420
0 V
ikin
g W
ay N
W
at S
ilver
dale
Way
NW
222
Ft. N
orth
of
Nor
finn
Ln (N
W)
0.00
2.
12
2.12
T-
2 T-
3 84
5 T-
2 to
T-3
Pie
rce
1021
0 St
eila
coom
-D
upon
t Rd
SW
at
Wha
rf R
d (J
BLM
) 0.
28 M
i. N
E o
f 16t
h S
t (F
t Lew
is)
1.62
3.
38
1.76
T-
2 T-
3 52
9 T-
2 to
T-3
Pie
rce
9540
0 B
rook
dale
Rd
E
211
Ft. N
W o
f B
rook
dale
Rd
E
at B
rook
dale
Rd
E
3.28
3.
32
0.04
T-
2 T-
3 T-
2 to
T-3
Spo
kane
17
64
Haw
thor
ne R
d at
Par
ksm
ith D
r at
Mar
ket S
t 1.
25
1.65
0.
40
T-2
non
truck
rout
e
T-2
to n
on
truck
rout
e
Tota
l Mile
s 8.
64
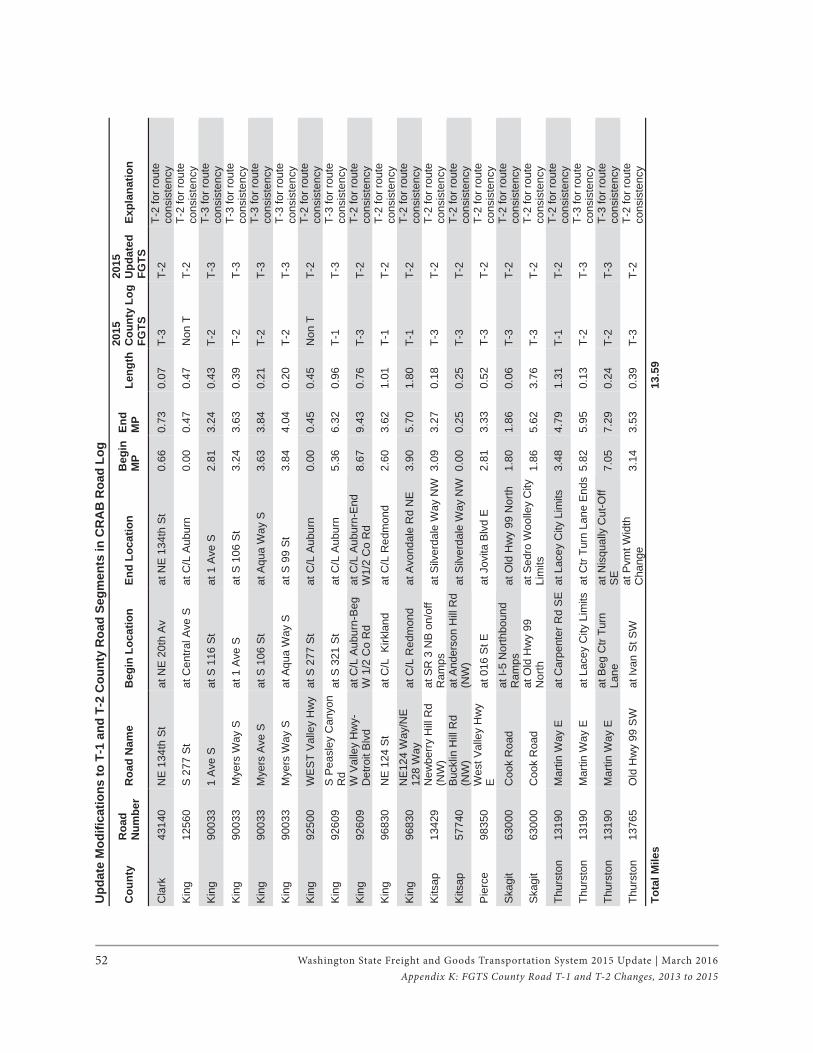
Washington State Freight and Goods Transportation System 2015 Update | March 201652Appendix K: FGTS County Road T-1 and T-2 Changes, 2013 to 2015
Upd
ate
Mod
ifica
tions
to T
-1 a
nd T
-2 C
ount
y R
oad
Segm
ents
in C
RA
B R
oad
Log
Cou
nty
Roa
dN
umbe
r R
oad
Nam
e B
egin
Loc
atio
n En
d Lo
catio
n B
egin
M
PEn
dM
PLe
ngth
2015
C
ount
y Lo
g FG
TS
2015
U
pdat
ed
FGTS
Ex
plan
atio
n
Cla
rk
4314
0 N
E 1
34th
St
at N
E 2
0th
Av
at N
E 1
34th
St
0.66
0.
73
0.07
T-
3 T-
2 T-
2 fo
r rou
te
cons
iste
ncy
Kin
g 12
560
S 2
77 S
t at
Cen
tral A
ve S
at
C/L
Aub
urn
0.00
0.
47
0.47
N
on T
T-
2 T-
2 fo
r rou
te
cons
iste
ncy
Kin
g90
033
1 A
ve S
at
S 1
16 S
t at
1 A
ve S
2.
81
3.24
0.
43
T-2
T-3
T-3
for r
oute
co
nsis
tenc
y
Kin
g 90
033
Mye
rs W
ay S
at
1 A
ve S
at
S 1
06 S
t 3.
24
3.63
0.
39
T-2
T-3
T-3
for r
oute
co
nsis
tenc
y
Kin
g90
033
Mye
rs A
ve S
at
S 1
06 S
t at
Aqu
a W
ay S
3.
63
3.84
0.
21
T-2
T-3
T-3
for r
oute
co
nsis
tenc
y
King
90
033
Mye
rs W
ay S
at
Aqu
a W
ay S
at
S 9
9 St
3.
84
4.04
0.
20
T-2
T-3
T-3
for r
oute
co
nsis
tenc
y
Kin
g92
500
WE
ST
Val
ley
Hw
y at
S 2
77 S
t at
C/L
Aub
urn
0.00
0.
45
0.45
N
on T
T-
2 T-
2 fo
r rou
te
cons
iste
ncy
King
92
609
S P
easl
ey C
anyo
n R
d at
S 3
21 S
t at
C/L
Aub
urn
5.36
6.
32
0.96
T-
1 T-
3 T-
3 fo
r rou
te
cons
iste
ncy
Kin
g92
609
W V
alle
y H
wy-
Det
roit
Blv
d at
C/L
Aub
urn-
Beg
W
1/2
Co
Rd
at C
/L A
ubur
n-E
nd
W1/
2 C
o R
d 8.
67
9.43
0.
76
T-3
T-2
T-2
for r
oute
co
nsis
tenc
y
Kin
g 96
830
NE
124
St
at C
/L K
irkla
nd
at C
/L R
edm
ond
2.60
3.
62
1.01
T-
1 T-
2 T-
2 fo
r rou
te
cons
iste
ncy
Kin
g96
830
NE1
24 W
ay/N
E
128
Way
at
C/L
Red
mon
d at
Avo
ndal
e R
d N
E
3.90
5.
70
1.80
T-
1 T-
2 T-
2 fo
r rou
te
cons
iste
ncy
Kits
ap
1342
9 N
ewbe
rry
Hill
Rd
(NW
)at
SR
3 N
B o
n/of
f R
amps
at
Silv
erda
le W
ay N
W3.
09
3.27
0.
18
T-3
T-2
T-2
for r
oute
co
nsis
tenc
y
Kits
ap57
740
Buc
klin
Hill
Rd
(NW
)at
And
erso
n H
ill R
d (N
W)
at S
ilver
dale
Way
NW
0.00
0.
25
0.25
T-
3 T-
2 T-
2 fo
r rou
te
cons
iste
ncy
Pier
ce
9835
0 W
est V
alle
y H
wy
Eat
016
St E
at
Jov
ita B
lvd
E
2.81
3.
33
0.52
T-
3 T-
2 T-
2 fo
r rou
te
cons
iste
ncy
Skag
it 63
000
Coo
k R
oad
at I-
5 N
orth
boun
d R
amps
at
Old
Hw
y 99
Nor
th
1.80
1.
86
0.06
T-
3 T-
2 T-
2 fo
r rou
te
cons
iste
ncy
Skag
it 63
000
Coo
k R
oad
at O
ld H
wy
99
Nor
th
at S
edro
Woo
lley
City
Li
mits
1.
86
5.62
3.
76
T-3
T-2
T-2
for r
oute
co
nsis
tenc
y
Thur
ston
13
190
Mar
tin W
ay E
at
Car
pent
er R
d S
Eat
Lac
ey C
ity L
imits
3.
48
4.79
1.
31
T-1
T-2
T-2
for r
oute
co
nsis
tenc
y
Thur
ston
13
190
Mar
tin W
ay E
at
Lac
ey C
ity L
imits
at C
tr Tu
rn L
ane
End
s5.
82
5.95
0.
13
T-2
T-3
T-3
for r
oute
co
nsis
tenc
y
Thur
ston
13
190
Mar
tin W
ay E
at
Beg
Ctr
Turn
La
ne
at N
isqu
ally
Cut
-Off
SE
7.05
7.
29
0.24
T-
2 T-
3 T-
3 fo
r rou
te
cons
iste
ncy
Thur
ston
13
765
Old
Hw
y 99
SW
at
Ivan
St S
W
at P
vmt W
idth
C
hang
e 3.
14
3.53
0.
39
T-3
T-2
T-2
for r
oute
co
nsis
tenc
y To
tal M
iles
13.5
9
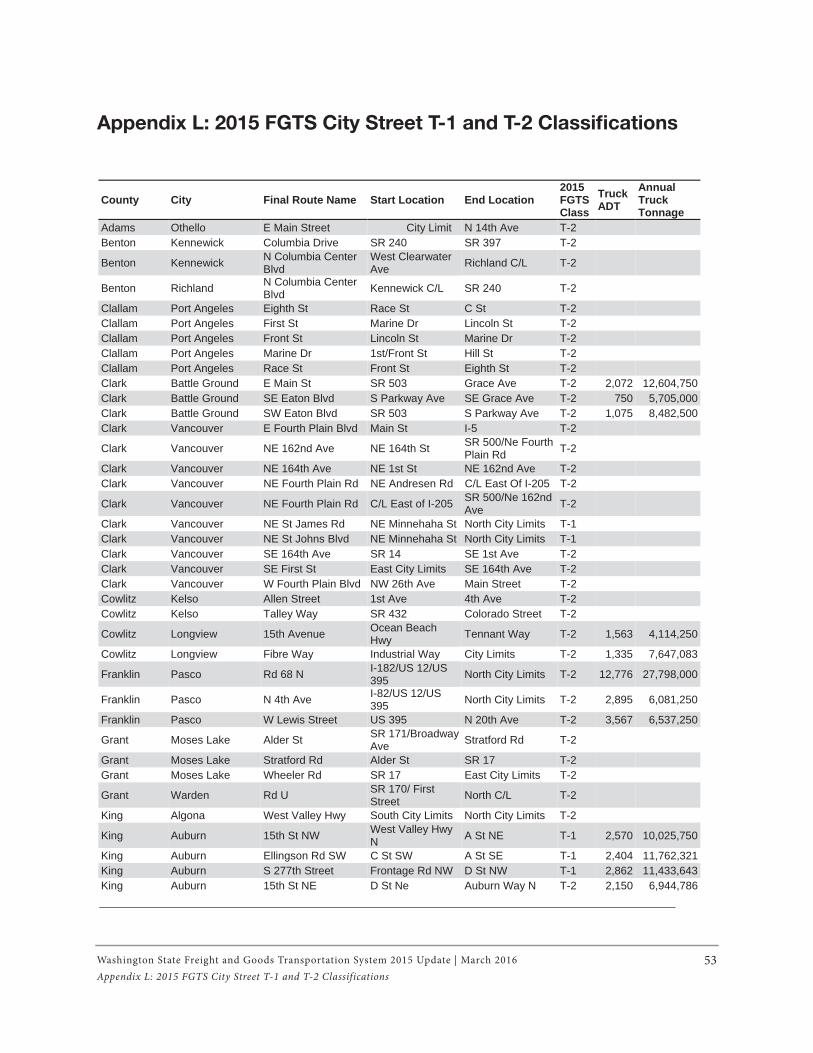
Washington State Freight and Goods Transportation System 2015 Update | March 2016 53Appendix L: 2015 FGTS City Street T-1 and T-2 Classifications
Appendix L: 2015 FGTS City Street T-1 and T-2 Classifi cations
County City Final Route Name Start Location End Location 2015 FGTSClass
Truck ADT
Annual Truck Tonnage
Adams Othello E Main Street City Limit N 14th Ave T-2 Benton Kennewick Columbia Drive SR 240 SR 397 T-2
Benton Kennewick N Columbia Center Blvd
West Clearwater Ave Richland C/L T-2
Benton Richland N Columbia Center Blvd Kennewick C/L SR 240 T-2
Clallam Port Angeles Eighth St Race St C St T-2 Clallam Port Angeles First St Marine Dr Lincoln St T-2 Clallam Port Angeles Front St Lincoln St Marine Dr T-2 Clallam Port Angeles Marine Dr 1st/Front St Hill St T-2 Clallam Port Angeles Race St Front St Eighth St T-2 Clark Battle Ground E Main St SR 503 Grace Ave T-2 2,072 12,604,750Clark Battle Ground SE Eaton Blvd S Parkway Ave SE Grace Ave T-2 750 5,705,000Clark Battle Ground SW Eaton Blvd SR 503 S Parkway Ave T-2 1,075 8,482,500Clark Vancouver E Fourth Plain Blvd Main St I-5 T-2
Clark Vancouver NE 162nd Ave NE 164th St SR 500/Ne Fourth Plain Rd T-2
Clark Vancouver NE 164th Ave NE 1st St NE 162nd Ave T-2 Clark Vancouver NE Fourth Plain Rd NE Andresen Rd C/L East Of I-205 T-2
Clark Vancouver NE Fourth Plain Rd C/L East of I-205 SR 500/Ne 162nd Ave T-2
Clark Vancouver NE St James Rd NE Minnehaha St North City Limits T-1 Clark Vancouver NE St Johns Blvd NE Minnehaha St North City Limits T-1 Clark Vancouver SE 164th Ave SR 14 SE 1st Ave T-2 Clark Vancouver SE First St East City Limits SE 164th Ave T-2 Clark Vancouver W Fourth Plain Blvd NW 26th Ave Main Street T-2 Cowlitz Kelso Allen Street 1st Ave 4th Ave T-2 Cowlitz Kelso Talley Way SR 432 Colorado Street T-2
Cowlitz Longview 15th Avenue Ocean Beach Hwy Tennant Way T-2 1,563 4,114,250
Cowlitz Longview Fibre Way Industrial Way City Limits T-2 1,335 7,647,083
Franklin Pasco Rd 68 N I-182/US 12/US 395 North City Limits T-2 12,776 27,798,000
Franklin Pasco N 4th Ave I-82/US 12/US 395 North City Limits T-2 2,895 6,081,250
Franklin Pasco W Lewis Street US 395 N 20th Ave T-2 3,567 6,537,250
Grant Moses Lake Alder St SR 171/Broadway Ave Stratford Rd T-2
Grant Moses Lake Stratford Rd Alder St SR 17 T-2 Grant Moses Lake Wheeler Rd SR 17 East City Limits T-2
Grant Warden Rd U SR 170/ First Street North C/L T-2
King Algona West Valley Hwy South City Limits North City Limits T-2
King Auburn 15th St NW West Valley Hwy N A St NE T-1 2,570 10,025,750
King Auburn Ellingson Rd SW C St SW A St SE T-1 2,404 11,762,321King Auburn S 277th Street Frontage Rd NW D St NW T-1 2,862 11,433,643King Auburn 15th St NE D St Ne Auburn Way N T-2 2,150 6,944,786
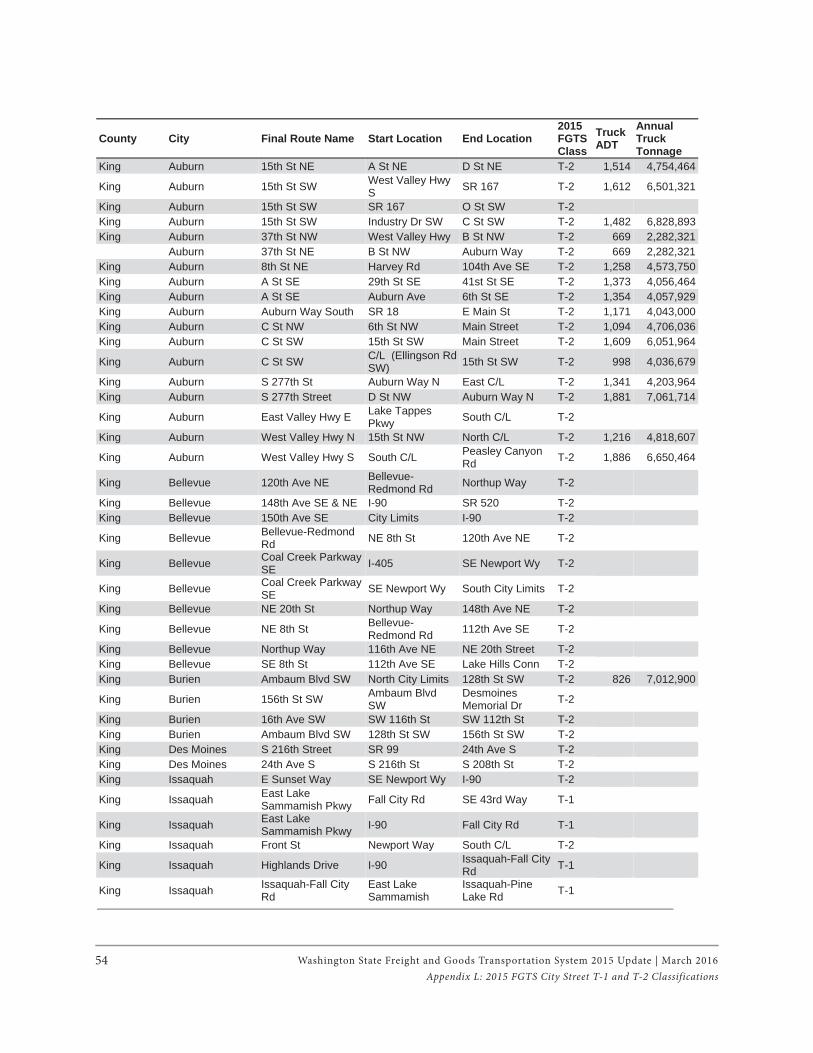
Washington State Freight and Goods Transportation System 2015 Update | March 201654Appendix L: 2015 FGTS City Street T-1 and T-2 Classifications
County City Final Route Name Start Location End Location 2015 FGTSClass
Truck ADT
Annual Truck Tonnage
King Auburn 15th St NE A St NE D St NE T-2 1,514 4,754,464
King Auburn 15th St SW West Valley Hwy S SR 167 T-2 1,612 6,501,321
King Auburn 15th St SW SR 167 O St SW T-2 King Auburn 15th St SW Industry Dr SW C St SW T-2 1,482 6,828,893King Auburn 37th St NW West Valley Hwy B St NW T-2 669 2,282,321
Auburn 37th St NE B St NW Auburn Way T-2 669 2,282,321King Auburn 8th St NE Harvey Rd 104th Ave SE T-2 1,258 4,573,750King Auburn A St SE 29th St SE 41st St SE T-2 1,373 4,056,464King Auburn A St SE Auburn Ave 6th St SE T-2 1,354 4,057,929King Auburn Auburn Way South SR 18 E Main St T-2 1,171 4,043,000King Auburn C St NW 6th St NW Main Street T-2 1,094 4,706,036King Auburn C St SW 15th St SW Main Street T-2 1,609 6,051,964
King Auburn C St SW C/L (Ellingson Rd SW) 15th St SW T-2 998 4,036,679
King Auburn S 277th St Auburn Way N East C/L T-2 1,341 4,203,964King Auburn S 277th Street D St NW Auburn Way N T-2 1,881 7,061,714
King Auburn East Valley Hwy E Lake Tappes Pkwy South C/L T-2
King Auburn West Valley Hwy N 15th St NW North C/L T-2 1,216 4,818,607
King Auburn West Valley Hwy S South C/L Peasley Canyon Rd T-2 1,886 6,650,464
King Bellevue 120th Ave NE Bellevue-Redmond Rd Northup Way T-2
King Bellevue 148th Ave SE & NE I-90 SR 520 T-2 King Bellevue 150th Ave SE City Limits I-90 T-2
King Bellevue Bellevue-Redmond Rd NE 8th St 120th Ave NE T-2
King Bellevue Coal Creek Parkway SE I-405 SE Newport Wy T-2
King Bellevue Coal Creek Parkway SE SE Newport Wy South City Limits T-2
King Bellevue NE 20th St Northup Way 148th Ave NE T-2
King Bellevue NE 8th St Bellevue-Redmond Rd 112th Ave SE T-2
King Bellevue Northup Way 116th Ave NE NE 20th Street T-2 King Bellevue SE 8th St 112th Ave SE Lake Hills Conn T-2 King Burien Ambaum Blvd SW North City Limits 128th St SW T-2 826 7,012,900
King Burien 156th St SW Ambaum Blvd SW
Desmoines Memorial Dr T-2
King Burien 16th Ave SW SW 116th St SW 112th St T-2 King Burien Ambaum Blvd SW 128th St SW 156th St SW T-2 King Des Moines S 216th Street SR 99 24th Ave S T-2 King Des Moines 24th Ave S S 216th St S 208th St T-2 King Issaquah E Sunset Way SE Newport Wy I-90 T-2
King Issaquah East Lake Sammamish Pkwy Fall City Rd SE 43rd Way T-1
King Issaquah East Lake Sammamish Pkwy I-90 Fall City Rd T-1
King Issaquah Front St Newport Way South C/L T-2
King Issaquah Highlands Drive I-90 Issaquah-Fall City Rd T-1
King Issaquah Issaquah-Fall City Rd
East Lake Sammamish
Issaquah-Pine Lake Rd T-1
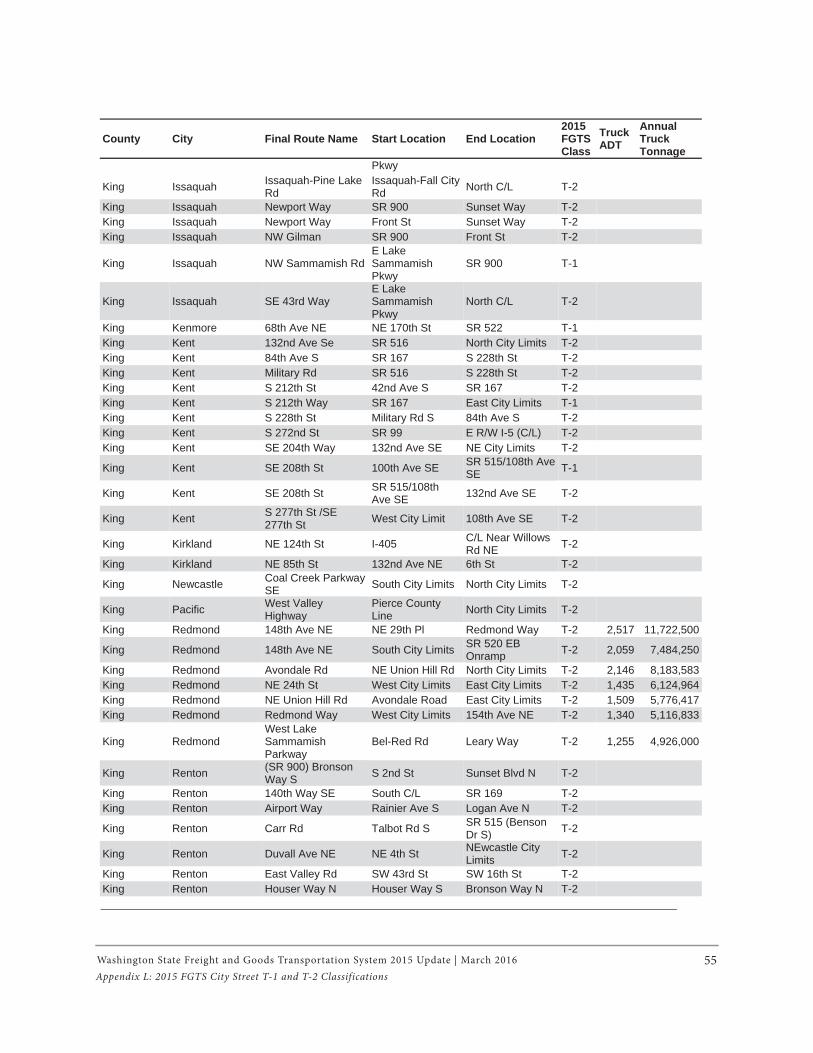
Washington State Freight and Goods Transportation System 2015 Update | March 2016 55Appendix L: 2015 FGTS City Street T-1 and T-2 Classifications
County City Final Route Name Start Location End Location 2015 FGTSClass
Truck ADT
Annual Truck Tonnage
Pkwy
King Issaquah Issaquah-Pine Lake Rd
Issaquah-Fall City Rd North C/L T-2
King Issaquah Newport Way SR 900 Sunset Way T-2 King Issaquah Newport Way Front St Sunset Way T-2 King Issaquah NW Gilman SR 900 Front St T-2
King Issaquah NW Sammamish RdE Lake SammamishPkwy
SR 900 T-1
King Issaquah SE 43rd Way E Lake SammamishPkwy
North C/L T-2
King Kenmore 68th Ave NE NE 170th St SR 522 T-1 King Kent 132nd Ave Se SR 516 North City Limits T-2 King Kent 84th Ave S SR 167 S 228th St T-2 King Kent Military Rd SR 516 S 228th St T-2 King Kent S 212th St 42nd Ave S SR 167 T-2 King Kent S 212th Way SR 167 East City Limits T-1 King Kent S 228th St Military Rd S 84th Ave S T-2 King Kent S 272nd St SR 99 E R/W I-5 (C/L) T-2 King Kent SE 204th Way 132nd Ave SE NE City Limits T-2
King Kent SE 208th St 100th Ave SE SR 515/108th Ave SE T-1
King Kent SE 208th St SR 515/108th Ave SE 132nd Ave SE T-2
King Kent S 277th St /SE 277th St West City Limit 108th Ave SE T-2
King Kirkland NE 124th St I-405 C/L Near Willows Rd NE T-2
King Kirkland NE 85th St 132nd Ave NE 6th St T-2
King Newcastle Coal Creek Parkway SE South City Limits North City Limits T-2
King Pacific West Valley Highway
Pierce County Line North City Limits T-2
King Redmond 148th Ave NE NE 29th Pl Redmond Way T-2 2,517 11,722,500
King Redmond 148th Ave NE South City Limits SR 520 EB Onramp T-2 2,059 7,484,250
King Redmond Avondale Rd NE Union Hill Rd North City Limits T-2 2,146 8,183,583King Redmond NE 24th St West City Limits East City Limits T-2 1,435 6,124,964King Redmond NE Union Hill Rd Avondale Road East City Limits T-2 1,509 5,776,417King Redmond Redmond Way West City Limits 154th Ave NE T-2 1,340 5,116,833
King Redmond West Lake SammamishParkway
Bel-Red Rd Leary Way T-2 1,255 4,926,000
King Renton (SR 900) Bronson Way S S 2nd St Sunset Blvd N T-2
King Renton 140th Way SE South C/L SR 169 T-2 King Renton Airport Way Rainier Ave S Logan Ave N T-2
King Renton Carr Rd Talbot Rd S SR 515 (Benson Dr S) T-2
King Renton Duvall Ave NE NE 4th St NEwcastle City Limits T-2
King Renton East Valley Rd SW 43rd St SW 16th St T-2 King Renton Houser Way N Houser Way S Bronson Way N T-2
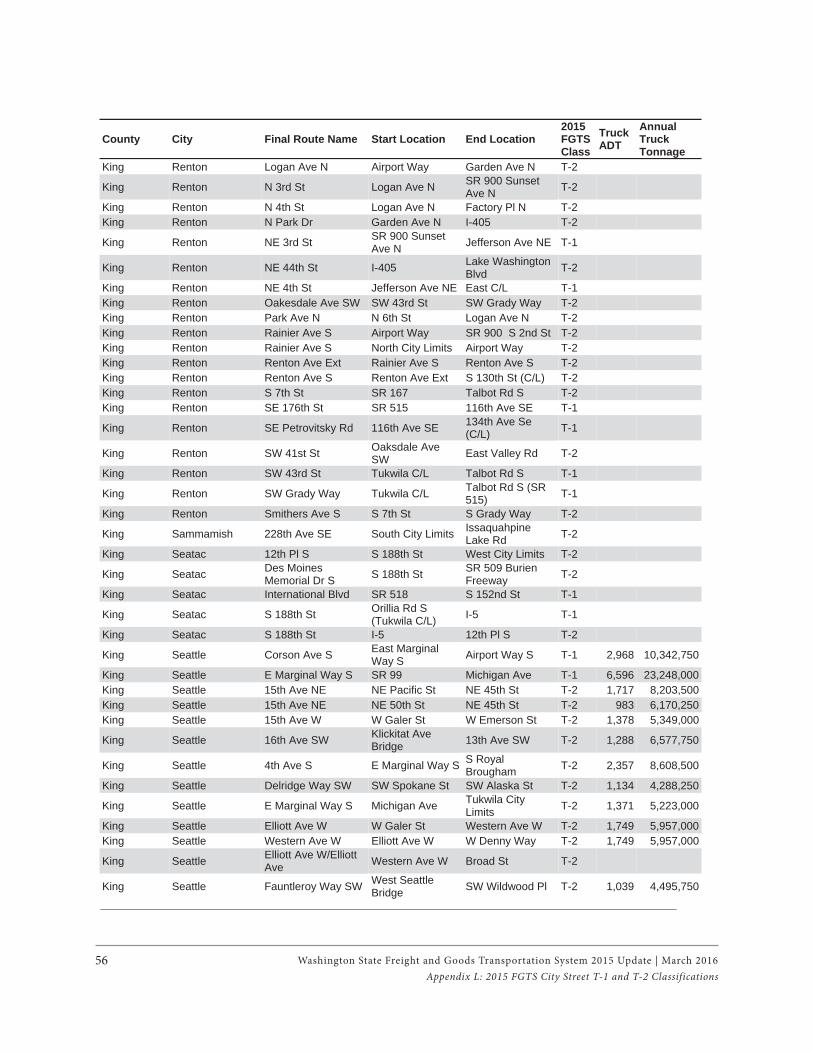
Washington State Freight and Goods Transportation System 2015 Update | March 201656Appendix L: 2015 FGTS City Street T-1 and T-2 Classifications
County City Final Route Name Start Location End Location 2015 FGTSClass
Truck ADT
Annual Truck Tonnage
King Renton Logan Ave N Airport Way Garden Ave N T-2
King Renton N 3rd St Logan Ave N SR 900 Sunset Ave N T-2
King Renton N 4th St Logan Ave N Factory Pl N T-2 King Renton N Park Dr Garden Ave N I-405 T-2
King Renton NE 3rd St SR 900 Sunset Ave N Jefferson Ave NE T-1
King Renton NE 44th St I-405 Lake Washington Blvd T-2
King Renton NE 4th St Jefferson Ave NE East C/L T-1 King Renton Oakesdale Ave SW SW 43rd St SW Grady Way T-2 King Renton Park Ave N N 6th St Logan Ave N T-2 King Renton Rainier Ave S Airport Way SR 900 S 2nd St T-2 King Renton Rainier Ave S North City Limits Airport Way T-2 King Renton Renton Ave Ext Rainier Ave S Renton Ave S T-2 King Renton Renton Ave S Renton Ave Ext S 130th St (C/L) T-2 King Renton S 7th St SR 167 Talbot Rd S T-2 King Renton SE 176th St SR 515 116th Ave SE T-1
King Renton SE Petrovitsky Rd 116th Ave SE 134th Ave Se (C/L) T-1
King Renton SW 41st St Oaksdale Ave SW East Valley Rd T-2
King Renton SW 43rd St Tukwila C/L Talbot Rd S T-1
King Renton SW Grady Way Tukwila C/L Talbot Rd S (SR 515) T-1
King Renton Smithers Ave S S 7th St S Grady Way T-2
King Sammamish 228th Ave SE South City Limits Issaquahpine Lake Rd T-2
King Seatac 12th Pl S S 188th St West City Limits T-2
King Seatac Des Moines Memorial Dr S S 188th St SR 509 Burien
Freeway T-2
King Seatac International Blvd SR 518 S 152nd St T-1
King Seatac S 188th St Orillia Rd S (Tukwila C/L) I-5 T-1
King Seatac S 188th St I-5 12th Pl S T-2
King Seattle Corson Ave S East Marginal Way S Airport Way S T-1 2,968 10,342,750
King Seattle E Marginal Way S SR 99 Michigan Ave T-1 6,596 23,248,000King Seattle 15th Ave NE NE Pacific St NE 45th St T-2 1,717 8,203,500King Seattle 15th Ave NE NE 50th St NE 45th St T-2 983 6,170,250King Seattle 15th Ave W W Galer St W Emerson St T-2 1,378 5,349,000
King Seattle 16th Ave SW Klickitat Ave Bridge 13th Ave SW T-2 1,288 6,577,750
King Seattle 4th Ave S E Marginal Way S S Royal Brougham T-2 2,357 8,608,500
King Seattle Delridge Way SW SW Spokane St SW Alaska St T-2 1,134 4,288,250
King Seattle E Marginal Way S Michigan Ave Tukwila City Limits T-2 1,371 5,223,000
King Seattle Elliott Ave W W Galer St Western Ave W T-2 1,749 5,957,000King Seattle Western Ave W Elliott Ave W W Denny Way T-2 1,749 5,957,000
King Seattle Elliott Ave W/Elliott Ave Western Ave W Broad St T-2
King Seattle Fauntleroy Way SW West Seattle Bridge SW Wildwood Pl T-2 1,039 4,495,750
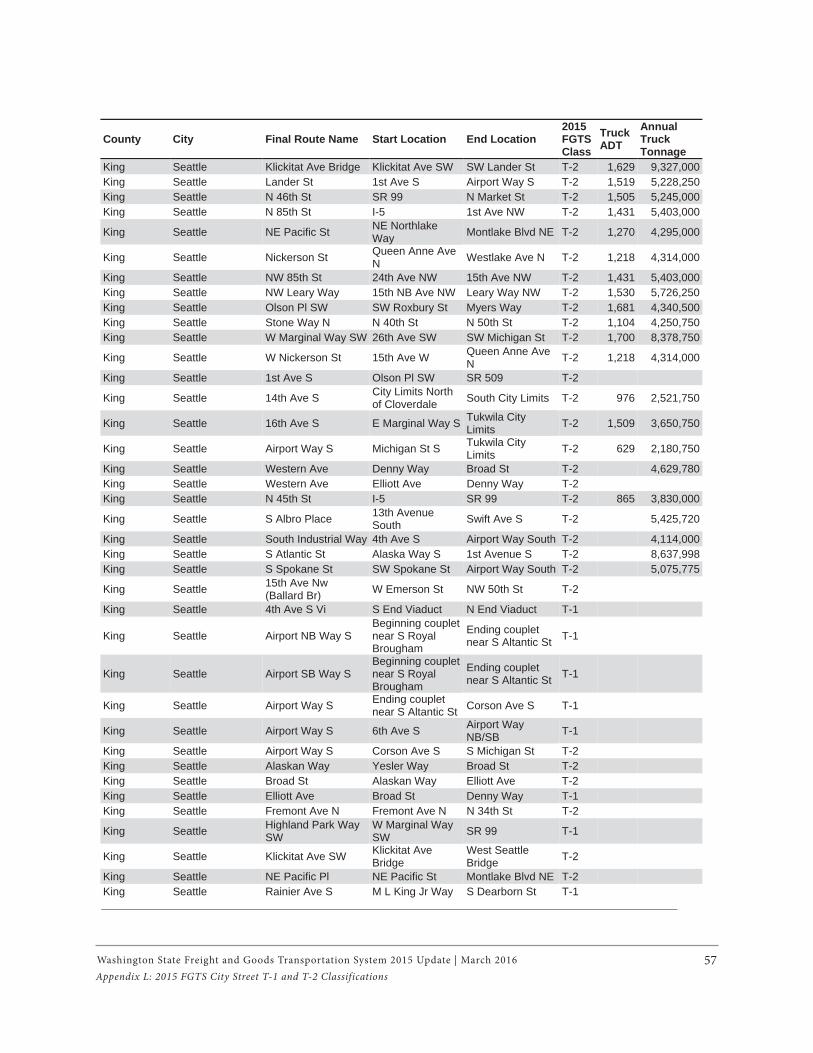
Washington State Freight and Goods Transportation System 2015 Update | March 2016 57Appendix L: 2015 FGTS City Street T-1 and T-2 Classifications
County City Final Route Name Start Location End Location 2015 FGTSClass
Truck ADT
Annual Truck Tonnage
King Seattle Klickitat Ave Bridge Klickitat Ave SW SW Lander St T-2 1,629 9,327,000King Seattle Lander St 1st Ave S Airport Way S T-2 1,519 5,228,250King Seattle N 46th St SR 99 N Market St T-2 1,505 5,245,000King Seattle N 85th St I-5 1st Ave NW T-2 1,431 5,403,000
King Seattle NE Pacific St NE Northlake Way Montlake Blvd NE T-2 1,270 4,295,000
King Seattle Nickerson St Queen Anne Ave N Westlake Ave N T-2 1,218 4,314,000
King Seattle NW 85th St 24th Ave NW 15th Ave NW T-2 1,431 5,403,000King Seattle NW Leary Way 15th NB Ave NW Leary Way NW T-2 1,530 5,726,250King Seattle Olson Pl SW SW Roxbury St Myers Way T-2 1,681 4,340,500King Seattle Stone Way N N 40th St N 50th St T-2 1,104 4,250,750King Seattle W Marginal Way SW 26th Ave SW SW Michigan St T-2 1,700 8,378,750
King Seattle W Nickerson St 15th Ave W Queen Anne Ave N T-2 1,218 4,314,000
King Seattle 1st Ave S Olson Pl SW SR 509 T-2
King Seattle 14th Ave S City Limits North of Cloverdale South City Limits T-2 976 2,521,750
King Seattle 16th Ave S E Marginal Way S Tukwila City Limits T-2 1,509 3,650,750
King Seattle Airport Way S Michigan St S Tukwila City Limits T-2 629 2,180,750
King Seattle Western Ave Denny Way Broad St T-2 4,629,780King Seattle Western Ave Elliott Ave Denny Way T-2 King Seattle N 45th St I-5 SR 99 T-2 865 3,830,000
King Seattle S Albro Place 13th Avenue South Swift Ave S T-2 5,425,720
King Seattle South Industrial Way 4th Ave S Airport Way South T-2 4,114,000King Seattle S Atlantic St Alaska Way S 1st Avenue S T-2 8,637,998King Seattle S Spokane St SW Spokane St Airport Way South T-2 5,075,775
King Seattle 15th Ave Nw (Ballard Br) W Emerson St NW 50th St T-2
King Seattle 4th Ave S Vi S End Viaduct N End Viaduct T-1
King Seattle Airport NB Way S Beginning couplet near S Royal Brougham
Ending couplet near S Altantic St T-1
King Seattle Airport SB Way S Beginning couplet near S Royal Brougham
Ending couplet near S Altantic St T-1
King Seattle Airport Way S Ending couplet near S Altantic St Corson Ave S T-1
King Seattle Airport Way S 6th Ave S Airport Way NB/SB T-1
King Seattle Airport Way S Corson Ave S S Michigan St T-2 King Seattle Alaskan Way Yesler Way Broad St T-2 King Seattle Broad St Alaskan Way Elliott Ave T-2 King Seattle Elliott Ave Broad St Denny Way T-1 King Seattle Fremont Ave N Fremont Ave N N 34th St T-2
King Seattle Highland Park Way SW
W Marginal Way SW SR 99 T-1
King Seattle Klickitat Ave SW Klickitat Ave Bridge
West Seattle Bridge T-2
King Seattle NE Pacific Pl NE Pacific St Montlake Blvd NE T-2 King Seattle Rainier Ave S M L King Jr Way S Dearborn St T-1
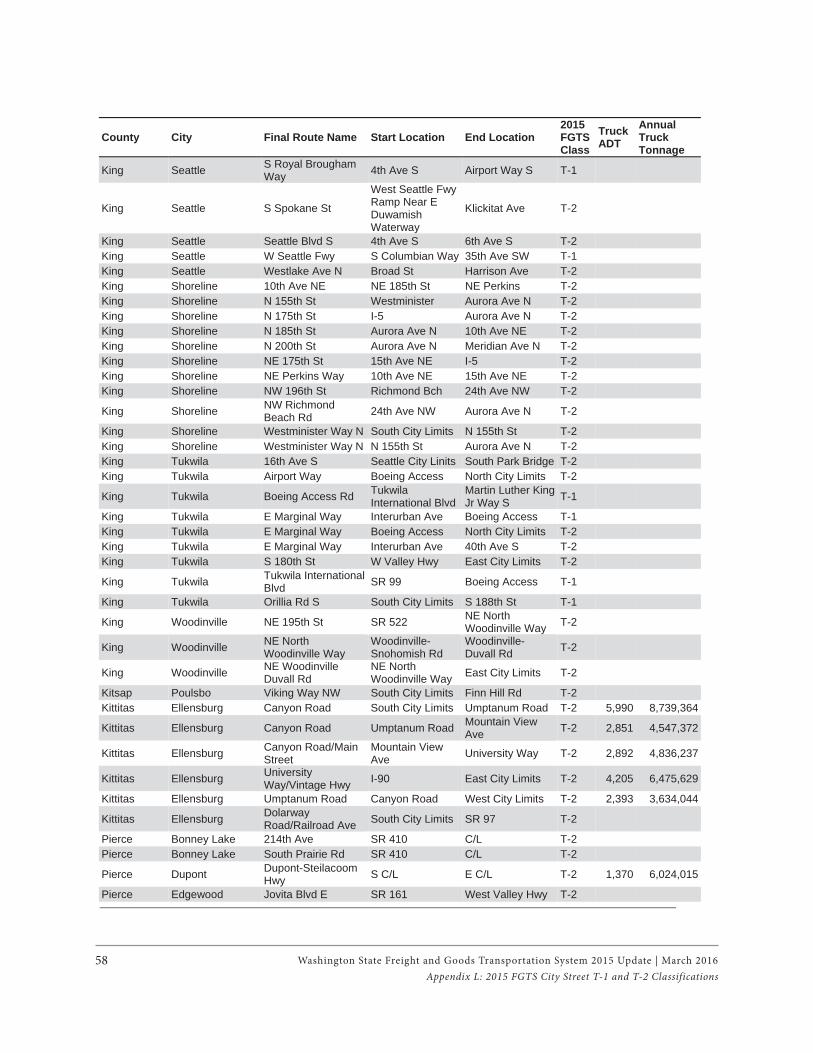
Washington State Freight and Goods Transportation System 2015 Update | March 201658Appendix L: 2015 FGTS City Street T-1 and T-2 Classifications
County City Final Route Name Start Location End Location 2015 FGTSClass
Truck ADT
Annual Truck Tonnage
King Seattle S Royal Brougham Way 4th Ave S Airport Way S T-1
King Seattle S Spokane St
West Seattle Fwy Ramp Near E Duwamish Waterway
Klickitat Ave T-2
King Seattle Seattle Blvd S 4th Ave S 6th Ave S T-2 King Seattle W Seattle Fwy S Columbian Way 35th Ave SW T-1 King Seattle Westlake Ave N Broad St Harrison Ave T-2 King Shoreline 10th Ave NE NE 185th St NE Perkins T-2 King Shoreline N 155th St Westminister Aurora Ave N T-2 King Shoreline N 175th St I-5 Aurora Ave N T-2 King Shoreline N 185th St Aurora Ave N 10th Ave NE T-2 King Shoreline N 200th St Aurora Ave N Meridian Ave N T-2 King Shoreline NE 175th St 15th Ave NE I-5 T-2 King Shoreline NE Perkins Way 10th Ave NE 15th Ave NE T-2 King Shoreline NW 196th St Richmond Bch 24th Ave NW T-2
King Shoreline NW Richmond Beach Rd 24th Ave NW Aurora Ave N T-2
King Shoreline Westminister Way N South City Limits N 155th St T-2 King Shoreline Westminister Way N N 155th St Aurora Ave N T-2 King Tukwila 16th Ave S Seattle City Linits South Park Bridge T-2 King Tukwila Airport Way Boeing Access North City Limits T-2
King Tukwila Boeing Access Rd Tukwila International Blvd
Martin Luther King Jr Way S T-1
King Tukwila E Marginal Way Interurban Ave Boeing Access T-1 King Tukwila E Marginal Way Boeing Access North City Limits T-2 King Tukwila E Marginal Way Interurban Ave 40th Ave S T-2 King Tukwila S 180th St W Valley Hwy East City Limits T-2
King Tukwila Tukwila International Blvd SR 99 Boeing Access T-1
King Tukwila Orillia Rd S South City Limits S 188th St T-1
King Woodinville NE 195th St SR 522 NE North Woodinville Way T-2
King Woodinville NE North Woodinville Way
Woodinville-Snohomish Rd
Woodinville-Duvall Rd T-2
King Woodinville NE Woodinville Duvall Rd
NE North Woodinville Way East City Limits T-2
Kitsap Poulsbo Viking Way NW South City Limits Finn Hill Rd T-2 Kittitas Ellensburg Canyon Road South City Limits Umptanum Road T-2 5,990 8,739,364
Kittitas Ellensburg Canyon Road Umptanum Road Mountain View Ave T-2 2,851 4,547,372
Kittitas Ellensburg Canyon Road/Main Street
Mountain View Ave University Way T-2 2,892 4,836,237
Kittitas Ellensburg University Way/Vintage Hwy I-90 East City Limits T-2 4,205 6,475,629
Kittitas Ellensburg Umptanum Road Canyon Road West City Limits T-2 2,393 3,634,044
Kittitas Ellensburg Dolarway Road/Railroad Ave South City Limits SR 97 T-2
Pierce Bonney Lake 214th Ave SR 410 C/L T-2 Pierce Bonney Lake South Prairie Rd SR 410 C/L T-2
Pierce Dupont Dupont-Steilacoom Hwy S C/L E C/L T-2 1,370 6,024,015
Pierce Edgewood Jovita Blvd E SR 161 West Valley Hwy T-2
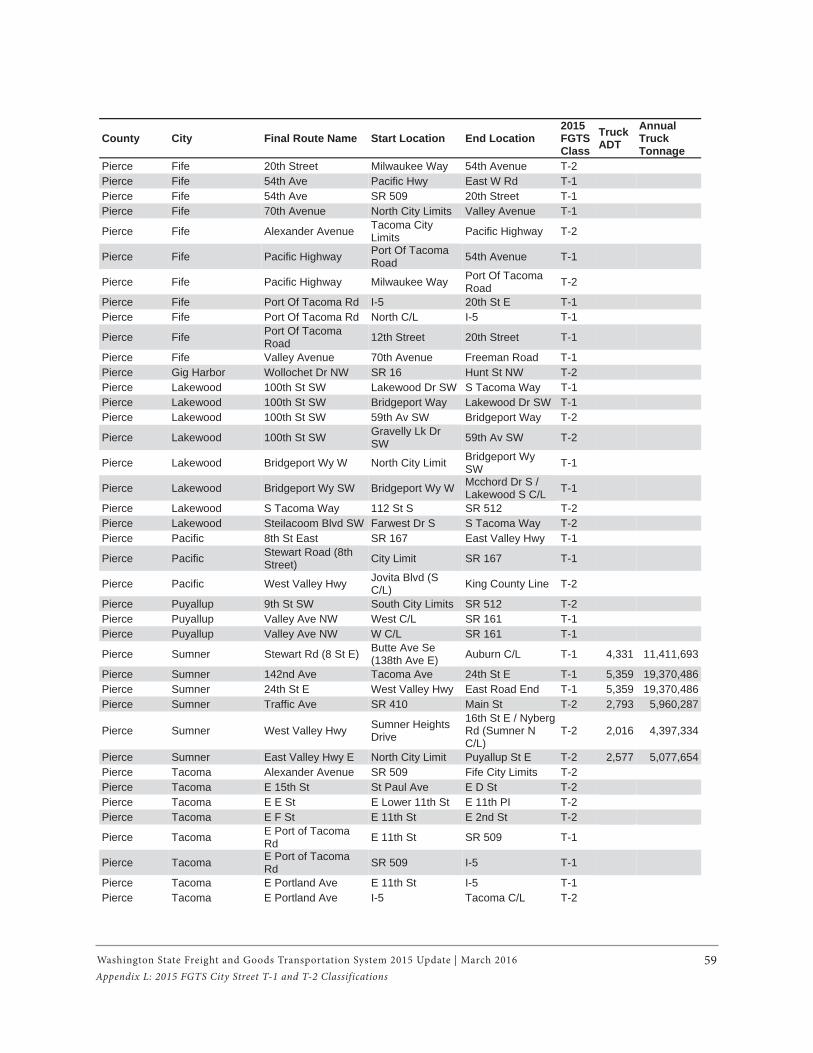
Washington State Freight and Goods Transportation System 2015 Update | March 2016 59Appendix L: 2015 FGTS City Street T-1 and T-2 Classifications
County City Final Route Name Start Location End Location 2015 FGTSClass
Truck ADT
Annual Truck Tonnage
Pierce Fife 20th Street Milwaukee Way 54th Avenue T-2 Pierce Fife 54th Ave Pacific Hwy East W Rd T-1 Pierce Fife 54th Ave SR 509 20th Street T-1 Pierce Fife 70th Avenue North City Limits Valley Avenue T-1
Pierce Fife Alexander Avenue Tacoma City Limits Pacific Highway T-2
Pierce Fife Pacific Highway Port Of Tacoma Road 54th Avenue T-1
Pierce Fife Pacific Highway Milwaukee Way Port Of Tacoma Road T-2
Pierce Fife Port Of Tacoma Rd I-5 20th St E T-1 Pierce Fife Port Of Tacoma Rd North C/L I-5 T-1
Pierce Fife Port Of Tacoma Road 12th Street 20th Street T-1
Pierce Fife Valley Avenue 70th Avenue Freeman Road T-1 Pierce Gig Harbor Wollochet Dr NW SR 16 Hunt St NW T-2 Pierce Lakewood 100th St SW Lakewood Dr SW S Tacoma Way T-1 Pierce Lakewood 100th St SW Bridgeport Way Lakewood Dr SW T-1 Pierce Lakewood 100th St SW 59th Av SW Bridgeport Way T-2
Pierce Lakewood 100th St SW Gravelly Lk Dr SW 59th Av SW T-2
Pierce Lakewood Bridgeport Wy W North City Limit Bridgeport Wy SW T-1
Pierce Lakewood Bridgeport Wy SW Bridgeport Wy W Mcchord Dr S / Lakewood S C/L T-1
Pierce Lakewood S Tacoma Way 112 St S SR 512 T-2 Pierce Lakewood Steilacoom Blvd SW Farwest Dr S S Tacoma Way T-2 Pierce Pacific 8th St East SR 167 East Valley Hwy T-1
Pierce Pacific Stewart Road (8th Street) City Limit SR 167 T-1
Pierce Pacific West Valley Hwy Jovita Blvd (S C/L) King County Line T-2
Pierce Puyallup 9th St SW South City Limits SR 512 T-2 Pierce Puyallup Valley Ave NW West C/L SR 161 T-1 Pierce Puyallup Valley Ave NW W C/L SR 161 T-1
Pierce Sumner Stewart Rd (8 St E) Butte Ave Se (138th Ave E) Auburn C/L T-1 4,331 11,411,693
Pierce Sumner 142nd Ave Tacoma Ave 24th St E T-1 5,359 19,370,486Pierce Sumner 24th St E West Valley Hwy East Road End T-1 5,359 19,370,486Pierce Sumner Traffic Ave SR 410 Main St T-2 2,793 5,960,287
Pierce Sumner West Valley Hwy Sumner Heights Drive
16th St E / Nyberg Rd (Sumner N C/L)
T-2 2,016 4,397,334
Pierce Sumner East Valley Hwy E North City Limit Puyallup St E T-2 2,577 5,077,654Pierce Tacoma Alexander Avenue SR 509 Fife City Limits T-2 Pierce Tacoma E 15th St St Paul Ave E D St T-2 Pierce Tacoma E E St E Lower 11th St E 11th PI T-2 Pierce Tacoma E F St E 11th St E 2nd St T-2
Pierce Tacoma E Port of Tacoma Rd E 11th St SR 509 T-1
Pierce Tacoma E Port of Tacoma Rd SR 509 I-5 T-1
Pierce Tacoma E Portland Ave E 11th St I-5 T-1 Pierce Tacoma E Portland Ave I-5 Tacoma C/L T-2
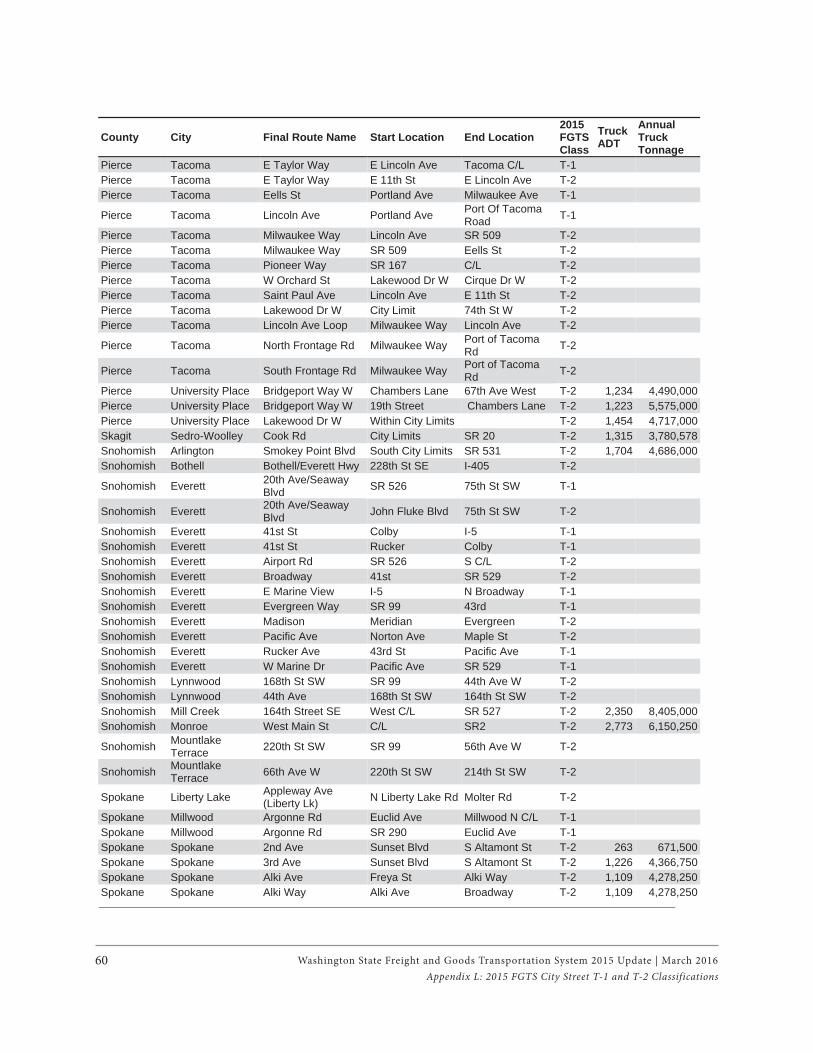
Washington State Freight and Goods Transportation System 2015 Update | March 201660Appendix L: 2015 FGTS City Street T-1 and T-2 Classifications
County City Final Route Name Start Location End Location 2015 FGTSClass
Truck ADT
Annual Truck Tonnage
Pierce Tacoma E Taylor Way E Lincoln Ave Tacoma C/L T-1 Pierce Tacoma E Taylor Way E 11th St E Lincoln Ave T-2 Pierce Tacoma Eells St Portland Ave Milwaukee Ave T-1
Pierce Tacoma Lincoln Ave Portland Ave Port Of Tacoma Road T-1
Pierce Tacoma Milwaukee Way Lincoln Ave SR 509 T-2 Pierce Tacoma Milwaukee Way SR 509 Eells St T-2 Pierce Tacoma Pioneer Way SR 167 C/L T-2 Pierce Tacoma W Orchard St Lakewood Dr W Cirque Dr W T-2 Pierce Tacoma Saint Paul Ave Lincoln Ave E 11th St T-2 Pierce Tacoma Lakewood Dr W City Limit 74th St W T-2 Pierce Tacoma Lincoln Ave Loop Milwaukee Way Lincoln Ave T-2
Pierce Tacoma North Frontage Rd Milwaukee Way Port of Tacoma Rd T-2
Pierce Tacoma South Frontage Rd Milwaukee Way Port of Tacoma Rd T-2
Pierce University Place Bridgeport Way W Chambers Lane 67th Ave West T-2 1,234 4,490,000Pierce University Place Bridgeport Way W 19th Street Chambers Lane T-2 1,223 5,575,000Pierce University Place Lakewood Dr W Within City Limits T-2 1,454 4,717,000Skagit Sedro-Woolley Cook Rd City Limits SR 20 T-2 1,315 3,780,578Snohomish Arlington Smokey Point Blvd South City Limits SR 531 T-2 1,704 4,686,000Snohomish Bothell Bothell/Everett Hwy 228th St SE I-405 T-2
Snohomish Everett 20th Ave/Seaway Blvd SR 526 75th St SW T-1
Snohomish Everett 20th Ave/Seaway Blvd John Fluke Blvd 75th St SW T-2
Snohomish Everett 41st St Colby I-5 T-1 Snohomish Everett 41st St Rucker Colby T-1 Snohomish Everett Airport Rd SR 526 S C/L T-2 Snohomish Everett Broadway 41st SR 529 T-2 Snohomish Everett E Marine View I-5 N Broadway T-1 Snohomish Everett Evergreen Way SR 99 43rd T-1 Snohomish Everett Madison Meridian Evergreen T-2 Snohomish Everett Pacific Ave Norton Ave Maple St T-2 Snohomish Everett Rucker Ave 43rd St Pacific Ave T-1 Snohomish Everett W Marine Dr Pacific Ave SR 529 T-1 Snohomish Lynnwood 168th St SW SR 99 44th Ave W T-2 Snohomish Lynnwood 44th Ave 168th St SW 164th St SW T-2 Snohomish Mill Creek 164th Street SE West C/L SR 527 T-2 2,350 8,405,000Snohomish Monroe West Main St C/L SR2 T-2 2,773 6,150,250
Snohomish Mountlake Terrace 220th St SW SR 99 56th Ave W T-2
Snohomish Mountlake Terrace 66th Ave W 220th St SW 214th St SW T-2
Spokane Liberty Lake Appleway Ave (Liberty Lk) N Liberty Lake Rd Molter Rd T-2
Spokane Millwood Argonne Rd Euclid Ave Millwood N C/L T-1 Spokane Millwood Argonne Rd SR 290 Euclid Ave T-1 Spokane Spokane 2nd Ave Sunset Blvd S Altamont St T-2 263 671,500Spokane Spokane 3rd Ave Sunset Blvd S Altamont St T-2 1,226 4,366,750Spokane Spokane Alki Ave Freya St Alki Way T-2 1,109 4,278,250Spokane Spokane Alki Way Alki Ave Broadway T-2 1,109 4,278,250
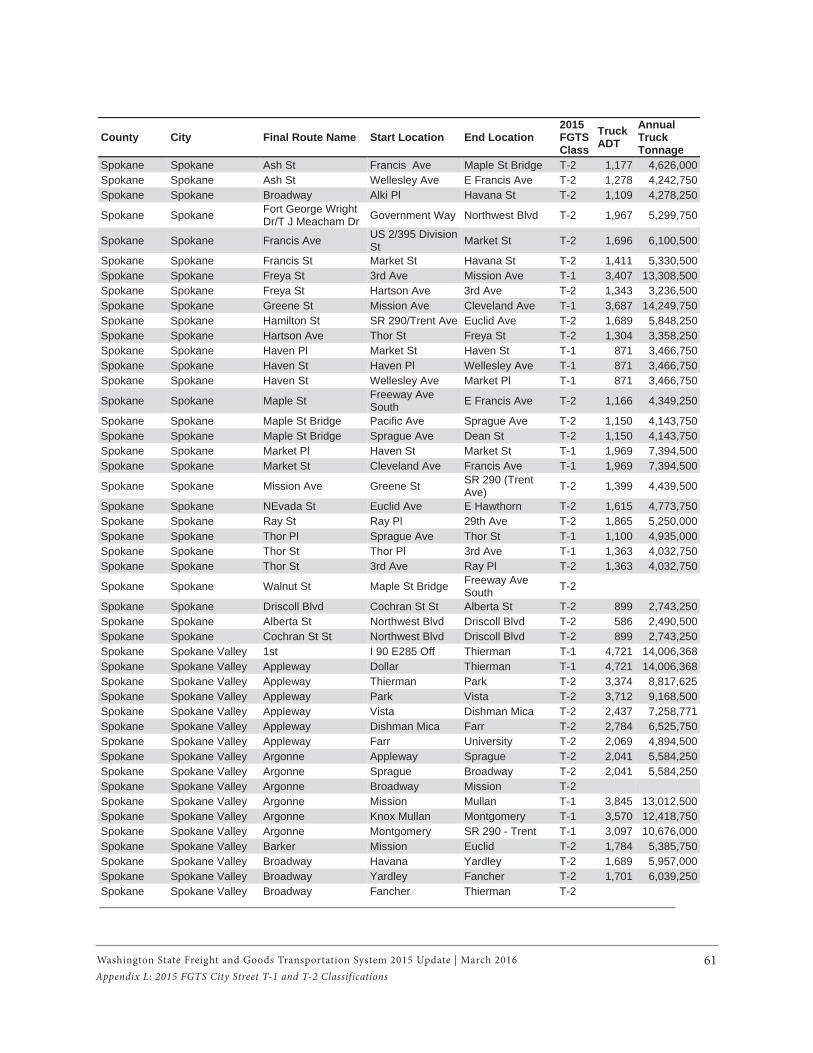
Washington State Freight and Goods Transportation System 2015 Update | March 2016 61Appendix L: 2015 FGTS City Street T-1 and T-2 Classifications
County City Final Route Name Start Location End Location 2015 FGTSClass
Truck ADT
Annual Truck Tonnage
Spokane Spokane Ash St Francis Ave Maple St Bridge T-2 1,177 4,626,000Spokane Spokane Ash St Wellesley Ave E Francis Ave T-2 1,278 4,242,750Spokane Spokane Broadway Alki Pl Havana St T-2 1,109 4,278,250
Spokane Spokane Fort George Wright Dr/T J Meacham Dr Government Way Northwest Blvd T-2 1,967 5,299,750
Spokane Spokane Francis Ave US 2/395 Division St Market St T-2 1,696 6,100,500
Spokane Spokane Francis St Market St Havana St T-2 1,411 5,330,500Spokane Spokane Freya St 3rd Ave Mission Ave T-1 3,407 13,308,500Spokane Spokane Freya St Hartson Ave 3rd Ave T-2 1,343 3,236,500Spokane Spokane Greene St Mission Ave Cleveland Ave T-1 3,687 14,249,750Spokane Spokane Hamilton St SR 290/Trent Ave Euclid Ave T-2 1,689 5,848,250Spokane Spokane Hartson Ave Thor St Freya St T-2 1,304 3,358,250Spokane Spokane Haven Pl Market St Haven St T-1 871 3,466,750Spokane Spokane Haven St Haven Pl Wellesley Ave T-1 871 3,466,750Spokane Spokane Haven St Wellesley Ave Market Pl T-1 871 3,466,750
Spokane Spokane Maple St Freeway Ave South E Francis Ave T-2 1,166 4,349,250
Spokane Spokane Maple St Bridge Pacific Ave Sprague Ave T-2 1,150 4,143,750Spokane Spokane Maple St Bridge Sprague Ave Dean St T-2 1,150 4,143,750Spokane Spokane Market Pl Haven St Market St T-1 1,969 7,394,500Spokane Spokane Market St Cleveland Ave Francis Ave T-1 1,969 7,394,500
Spokane Spokane Mission Ave Greene St SR 290 (Trent Ave) T-2 1,399 4,439,500
Spokane Spokane NEvada St Euclid Ave E Hawthorn T-2 1,615 4,773,750Spokane Spokane Ray St Ray Pl 29th Ave T-2 1,865 5,250,000Spokane Spokane Thor Pl Sprague Ave Thor St T-1 1,100 4,935,000Spokane Spokane Thor St Thor Pl 3rd Ave T-1 1,363 4,032,750Spokane Spokane Thor St 3rd Ave Ray Pl T-2 1,363 4,032,750
Spokane Spokane Walnut St Maple St Bridge Freeway Ave South T-2
Spokane Spokane Driscoll Blvd Cochran St St Alberta St T-2 899 2,743,250Spokane Spokane Alberta St Northwest Blvd Driscoll Blvd T-2 586 2,490,500Spokane Spokane Cochran St St Northwest Blvd Driscoll Blvd T-2 899 2,743,250Spokane Spokane Valley 1st I 90 E285 Off Thierman T-1 4,721 14,006,368Spokane Spokane Valley Appleway Dollar Thierman T-1 4,721 14,006,368Spokane Spokane Valley Appleway Thierman Park T-2 3,374 8,817,625Spokane Spokane Valley Appleway Park Vista T-2 3,712 9,168,500Spokane Spokane Valley Appleway Vista Dishman Mica T-2 2,437 7,258,771Spokane Spokane Valley Appleway Dishman Mica Farr T-2 2,784 6,525,750Spokane Spokane Valley Appleway Farr University T-2 2,069 4,894,500Spokane Spokane Valley Argonne Appleway Sprague T-2 2,041 5,584,250Spokane Spokane Valley Argonne Sprague Broadway T-2 2,041 5,584,250Spokane Spokane Valley Argonne Broadway Mission T-2 Spokane Spokane Valley Argonne Mission Mullan T-1 3,845 13,012,500Spokane Spokane Valley Argonne Knox Mullan Montgomery T-1 3,570 12,418,750Spokane Spokane Valley Argonne Montgomery SR 290 - Trent T-1 3,097 10,676,000Spokane Spokane Valley Barker Mission Euclid T-2 1,784 5,385,750Spokane Spokane Valley Broadway Havana Yardley T-2 1,689 5,957,000Spokane Spokane Valley Broadway Yardley Fancher T-2 1,701 6,039,250Spokane Spokane Valley Broadway Fancher Thierman T-2
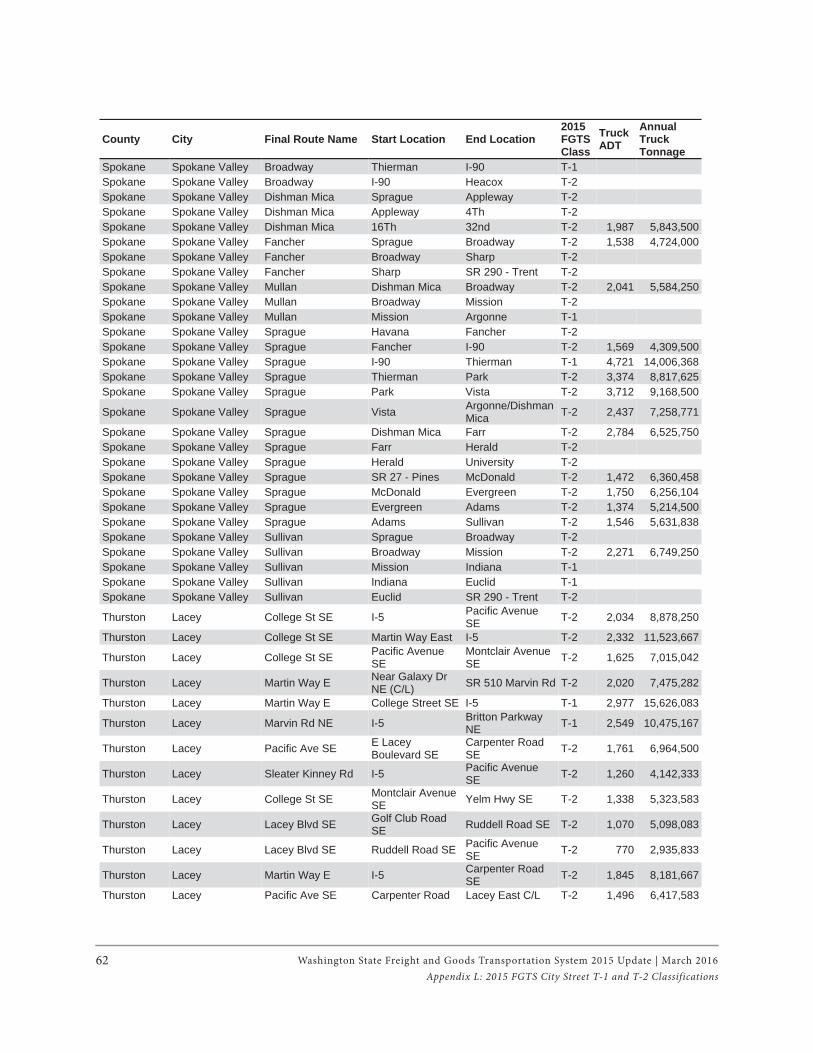
62Appendix L: 2015 FGTS City Street T-1 and T-2 Classifications
County City Final Route Name Start Location End Location 2015 FGTSClass
Truck ADT
Annual Truck Tonnage
Spokane Spokane Valley Broadway Thierman I-90 T-1 Spokane Spokane Valley Broadway I-90 Heacox T-2 Spokane Spokane Valley Dishman Mica Sprague Appleway T-2 Spokane Spokane Valley Dishman Mica Appleway 4Th T-2 Spokane Spokane Valley Dishman Mica 16Th 32nd T-2 1,987 5,843,500Spokane Spokane Valley Fancher Sprague Broadway T-2 1,538 4,724,000Spokane Spokane Valley Fancher Broadway Sharp T-2 Spokane Spokane Valley Fancher Sharp SR 290 - Trent T-2 Spokane Spokane Valley Mullan Dishman Mica Broadway T-2 2,041 5,584,250Spokane Spokane Valley Mullan Broadway Mission T-2 Spokane Spokane Valley Mullan Mission Argonne T-1 Spokane Spokane Valley Sprague Havana Fancher T-2 Spokane Spokane Valley Sprague Fancher I-90 T-2 1,569 4,309,500Spokane Spokane Valley Sprague I-90 Thierman T-1 4,721 14,006,368Spokane Spokane Valley Sprague Thierman Park T-2 3,374 8,817,625Spokane Spokane Valley Sprague Park Vista T-2 3,712 9,168,500
Spokane Spokane Valley Sprague Vista Argonne/Dishman Mica T-2 2,437 7,258,771
Spokane Spokane Valley Sprague Dishman Mica Farr T-2 2,784 6,525,750Spokane Spokane Valley Sprague Farr Herald T-2 Spokane Spokane Valley Sprague Herald University T-2 Spokane Spokane Valley Sprague SR 27 - Pines McDonald T-2 1,472 6,360,458Spokane Spokane Valley Sprague McDonald Evergreen T-2 1,750 6,256,104Spokane Spokane Valley Sprague Evergreen Adams T-2 1,374 5,214,500Spokane Spokane Valley Sprague Adams Sullivan T-2 1,546 5,631,838Spokane Spokane Valley Sullivan Sprague Broadway T-2 Spokane Spokane Valley Sullivan Broadway Mission T-2 2,271 6,749,250Spokane Spokane Valley Sullivan Mission Indiana T-1 Spokane Spokane Valley Sullivan Indiana Euclid T-1 Spokane Spokane Valley Sullivan Euclid SR 290 - Trent T-2
Thurston Lacey College St SE I-5 Pacific Avenue SE T-2 2,034 8,878,250
Thurston Lacey College St SE Martin Way East I-5 T-2 2,332 11,523,667
Thurston Lacey College St SE Pacific Avenue SE
Montclair Avenue SE T-2 1,625 7,015,042
Thurston Lacey Martin Way E Near Galaxy Dr NE (C/L) SR 510 Marvin Rd T-2 2,020 7,475,282
Thurston Lacey Martin Way E College Street SE I-5 T-1 2,977 15,626,083
Thurston Lacey Marvin Rd NE I-5 Britton Parkway NE T-1 2,549 10,475,167
Thurston Lacey Pacific Ave SE E Lacey Boulevard SE
Carpenter Road SE T-2 1,761 6,964,500
Thurston Lacey Sleater Kinney Rd I-5 Pacific Avenue SE T-2 1,260 4,142,333
Thurston Lacey College St SE Montclair Avenue SE Yelm Hwy SE T-2 1,338 5,323,583
Thurston Lacey Lacey Blvd SE Golf Club Road SE Ruddell Road SE T-2 1,070 5,098,083
Thurston Lacey Lacey Blvd SE Ruddell Road SE Pacific Avenue SE T-2 770 2,935,833
Thurston Lacey Martin Way E I-5 Carpenter Road SE T-2 1,845 8,181,667
Thurston Lacey Pacific Ave SE Carpenter Road Lacey East C/L T-2 1,496 6,417,583
Washington State Freight and Goods Transportation System 2015 Update | March 2016
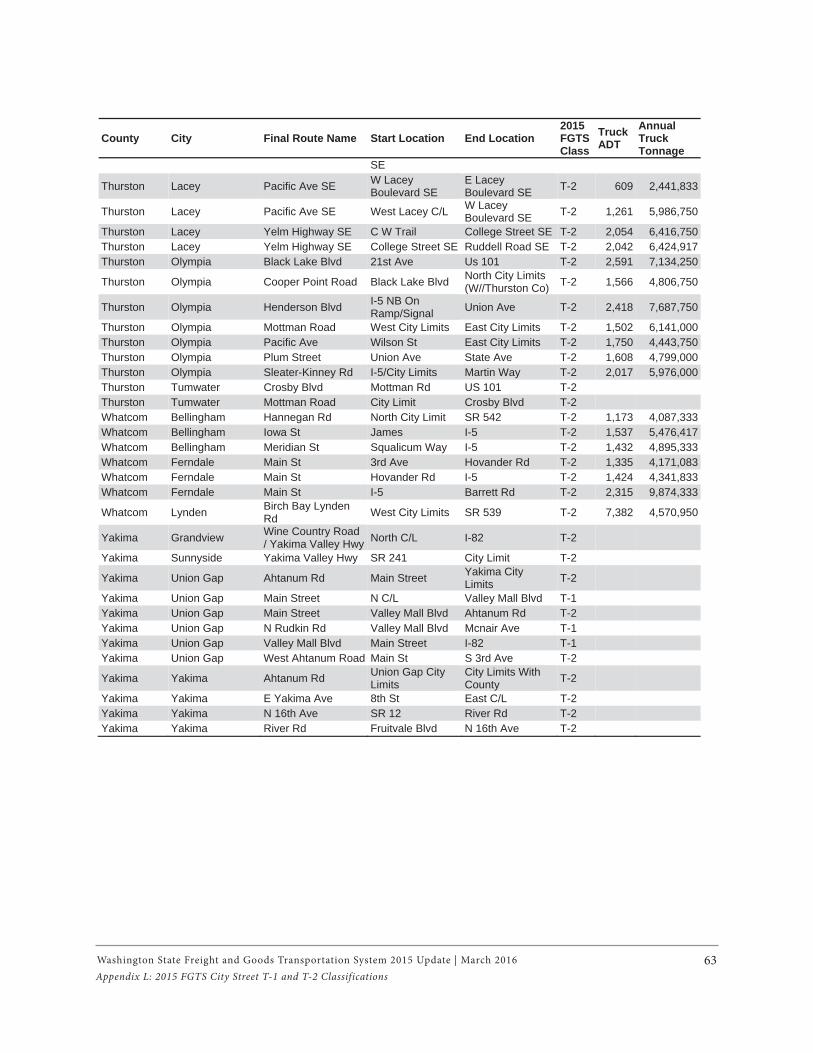
Washington State Freight and Goods Transportation System 2015 Update | March 2016 63Appendix L: 2015 FGTS City Street T-1 and T-2 Classifications
County City Final Route Name Start Location End Location 2015 FGTSClass
Truck ADT
Annual Truck Tonnage
SE
Thurston Lacey Pacific Ave SE W Lacey Boulevard SE
E Lacey Boulevard SE T-2 609 2,441,833
Thurston Lacey Pacific Ave SE West Lacey C/L W Lacey Boulevard SE T-2 1,261 5,986,750
Thurston Lacey Yelm Highway SE C W Trail College Street SE T-2 2,054 6,416,750Thurston Lacey Yelm Highway SE College Street SE Ruddell Road SE T-2 2,042 6,424,917Thurston Olympia Black Lake Blvd 21st Ave Us 101 T-2 2,591 7,134,250
Thurston Olympia Cooper Point Road Black Lake Blvd North City Limits (W//Thurston Co) T-2 1,566 4,806,750
Thurston Olympia Henderson Blvd I-5 NB On Ramp/Signal Union Ave T-2 2,418 7,687,750
Thurston Olympia Mottman Road West City Limits East City Limits T-2 1,502 6,141,000Thurston Olympia Pacific Ave Wilson St East City Limits T-2 1,750 4,443,750Thurston Olympia Plum Street Union Ave State Ave T-2 1,608 4,799,000Thurston Olympia Sleater-Kinney Rd I-5/City Limits Martin Way T-2 2,017 5,976,000Thurston Tumwater Crosby Blvd Mottman Rd US 101 T-2 Thurston Tumwater Mottman Road City Limit Crosby Blvd T-2 Whatcom Bellingham Hannegan Rd North City Limit SR 542 T-2 1,173 4,087,333Whatcom Bellingham Iowa St James I-5 T-2 1,537 5,476,417Whatcom Bellingham Meridian St Squalicum Way I-5 T-2 1,432 4,895,333Whatcom Ferndale Main St 3rd Ave Hovander Rd T-2 1,335 4,171,083Whatcom Ferndale Main St Hovander Rd I-5 T-2 1,424 4,341,833Whatcom Ferndale Main St I-5 Barrett Rd T-2 2,315 9,874,333
Whatcom Lynden Birch Bay Lynden Rd West City Limits SR 539 T-2 7,382 4,570,950
Yakima Grandview Wine Country Road / Yakima Valley Hwy North C/L I-82 T-2
Yakima Sunnyside Yakima Valley Hwy SR 241 City Limit T-2
Yakima Union Gap Ahtanum Rd Main Street Yakima City Limits T-2
Yakima Union Gap Main Street N C/L Valley Mall Blvd T-1 Yakima Union Gap Main Street Valley Mall Blvd Ahtanum Rd T-2 Yakima Union Gap N Rudkin Rd Valley Mall Blvd Mcnair Ave T-1 Yakima Union Gap Valley Mall Blvd Main Street I-82 T-1 Yakima Union Gap West Ahtanum Road Main St S 3rd Ave T-2
Yakima Yakima Ahtanum Rd Union Gap City Limits
City Limits With County T-2
Yakima Yakima E Yakima Ave 8th St East C/L T-2 Yakima Yakima N 16th Ave SR 12 River Rd T-2 Yakima Yakima River Rd Fruitvale Blvd N 16th Ave T-2
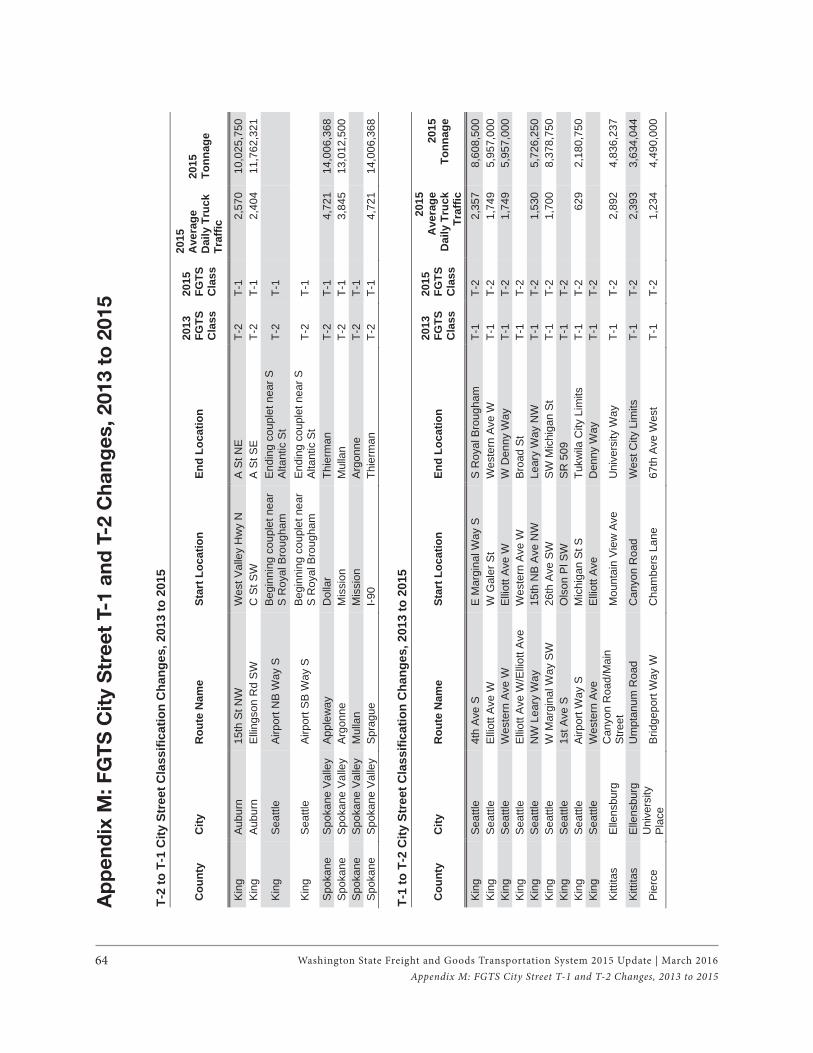
Washington State Freight and Goods Transportation System 2015 Update | March 201664
Ap
pe
nd
ix M
: F
GT
S C
ity S
tre
et
T-1
an
d T
-2 C
ha
ng
es,
2013 t
o 2
01
5
Appendix M: FGTS City Street T-1 and T-2 Changes, 2013 to 2015
T-2
to T
-1 C
ity S
tree
t Cla
ssifi
catio
n C
hang
es, 2
013
to 2
015
Cou
nty
City
R
oute
Nam
e St
art L
ocat
ion
End
Loca
tion
2013
FG
TSC
lass
2015
FG
TSC
lass
2015
A
vera
ge
Dai
ly T
ruck
Tr
affic
2015
To
nnag
e
Kin
gAu
burn
15
th S
t NW
W
est V
alle
y H
wy
N
A S
t NE
T-2
T-1
2,57
0 10
,025
,750
K
ing
Aub
urn
Ellin
gson
Rd
SW
C
St S
W
A S
t SE
T-
2 T-
1 2,
404
11,7
62,3
21
Kin
gS
eattl
eA
irpor
t NB
Way
S
Begi
nnin
g co
uple
t nea
r S
Roy
al B
roug
ham
E
ndin
g co
uple
t nea
r S
Alta
ntic
St
T-2
T-1
Kin
g S
eattl
e A
irpor
t SB
Way
S
Begi
nnin
g co
uple
t nea
r S
Roy
al B
roug
ham
E
ndin
g co
uple
t nea
r S
Alta
ntic
St
T-2
T-1
Spo
kane
Sp
okan
e Va
lley
Appl
eway
D
olla
r Th
ierm
an
T-2
T-1
4,72
1 14
,006
,368
Sp
okan
e Sp
okan
e Va
lley
Argo
nne
Mis
sion
M
ulla
n T-
2 T-
1 3,
845
13,0
12,5
00
Spo
kane
Sp
okan
e Va
lley
Mul
lan
Mis
sion
Argo
nne
T-2
T-1
Spok
ane
Spok
ane
Valle
y Sp
ragu
e I-9
0 Th
ierm
an
T-2
T-1
4,72
1 14
,006
,368
T-1
to T
-2 C
ity S
tree
t Cla
ssifi
catio
n C
hang
es, 2
013
to 2
015
Cou
nty
City
R
oute
Nam
e St
art L
ocat
ion
End
Loca
tion
2013
FG
TSC
lass
2015
FG
TSC
lass
2015
A
vera
ge
Dai
ly T
ruck
Tr
affic
2015
To
nnag
e
Kin
gS
eattl
e4t
h A
ve S
E
Mar
gina
l Way
S
S R
oyal
Bro
ugha
m
T-1
T-2
2,35
7 8,
608,
500
Kin
g S
eattl
e E
lliot
t Ave
W
W G
aler
St
Wes
tern
Ave
W
T-1
T-2
1,74
9 5,
957,
000
Kin
gS
eattl
eW
este
rn A
ve W
E
lliot
t Ave
W
W D
enny
Way
T-
1 T-
2 1,
749
5,95
7,00
0 K
ing
Sea
ttle
Ellio
tt A
ve W
/Ellio
tt A
ve
Wes
tern
Ave
W
Bro
ad S
t T-
1 T-
2 K
ing
Sea
ttle
NW
Lea
ry W
ay
15th
NB
Ave
NW
Le
ary
Way
NW
T-
1 T-
2 1,
530
5,72
6,25
0 K
ing
Sea
ttle
W M
argi
nal W
ay S
W
26th
Ave
SW
S
W M
ichi
gan
St
T-1
T-2
1,70
0 8,
378,
750
Kin
gS
eattl
e1s
t Ave
S
Ols
on P
l SW
S
R 5
09
T-1
T-2
Kin
g S
eattl
e A
irpor
t Way
S
Mic
higa
n S
t S
Tukw
ila C
ity L
imits
T-
1 T-
2 62
9 2,
180,
750
Kin
gS
eattl
eW
este
rn A
ve
Elli
ott A
ve
Den
ny W
ay
T-1
T-2
Kitt
itas
Elle
nsbu
rg
Can
yon
Roa
d/M
ain
Stre
etM
ount
ain
Vie
w A
ve
Uni
vers
ity W
ay
T-1
T-2
2,89
2 4,
836,
237
Kitt
itas
Elle
nsbu
rg
Um
ptan
um R
oad
Can
yon
Roa
d W
est C
ity L
imits
T-
1 T-
2 2,
393
3,63
4,04
4
Pie
rce
Uni
vers
ity
Pla
ceB
ridge
port
Way
W
Cha
mbe
rs L
ane
67th
Ave
Wes
t T-
1 T-
2 1,
234
4,49
0,00
0
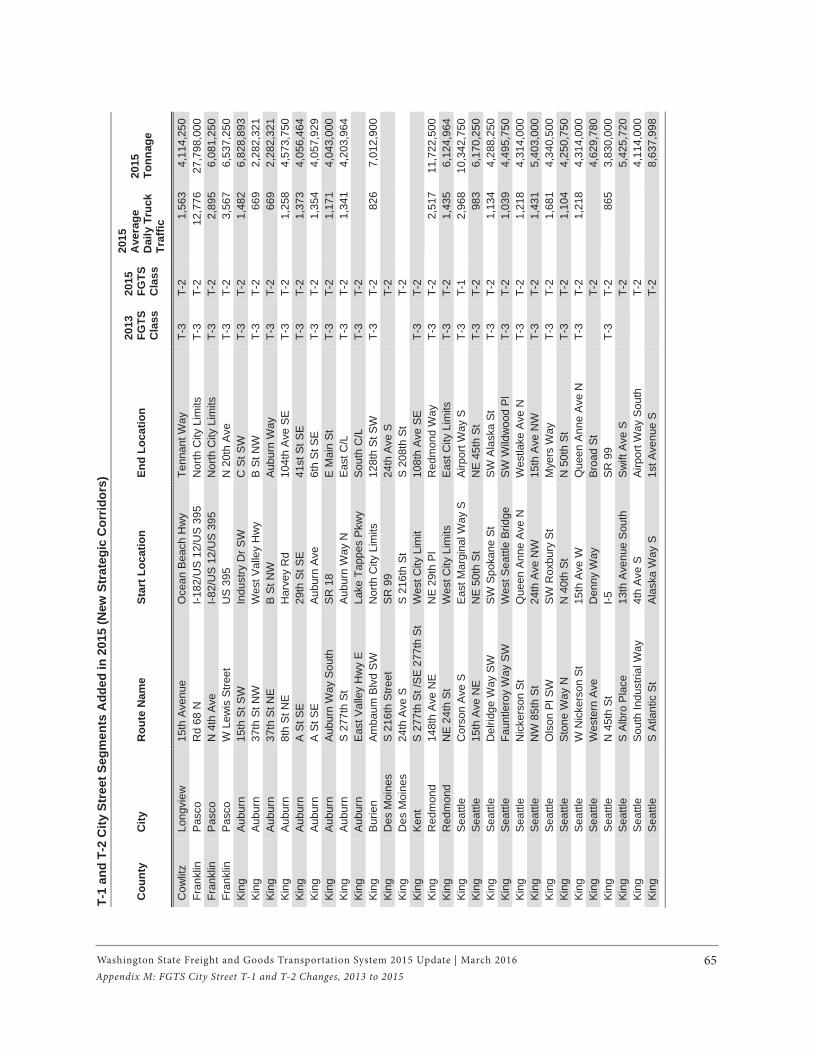
Washington State Freight and Goods Transportation System 2015 Update | March 2016 65Appendix M: FGTS City Street T-1 and T-2 Changes, 2013 to 2015
T-1
and
T-2
City
Str
eet S
egm
ents
Add
ed in
201
5 (N
ew S
trat
egic
Cor
ridor
s)
Cou
nty
City
R
oute
Nam
e St
art L
ocat
ion
End
Loca
tion
2013
FG
TSC
lass
2015
FG
TSC
lass
2015
A
vera
ge
Dai
ly T
ruck
Tr
affic
2015
To
nnag
e
Cow
litz
Long
view
15
th A
venu
e O
cean
Bea
ch H
wy
Tenn
ant W
ay
T-3
T-2
1,56
3 4,
114,
250
Fran
klin
P
asco
R
d 68
N
I-182
/US
12/
US
395
N
orth
City
Lim
its
T-3
T-2
12,7
76
27,7
98,0
00
Fran
klin
P
asco
N 4
th A
ve
I-82/
US
12/
US
395
N
orth
City
Lim
its
T-3
T-2
2,89
5 6,
081,
250
Fran
klin
P
asco
W
Lew
is S
treet
U
S 3
95
N 2
0th
Ave
T-
3 T-
2 3,
567
6,53
7,25
0 K
ing
Aubu
rn
15th
St S
W
Indu
stry
Dr S
W
C S
t SW
T-
3 T-
2 1,
482
6,82
8,89
3 K
ing
Aub
urn
37th
St N
W
Wes
t Val
ley
Hw
y B
St N
W
T-3
T-2
669
2,28
2,32
1 K
ing
Aubu
rn
37th
St N
E
B S
t NW
Au
burn
Way
T-
3 T-
2 66
9 2,
282,
321
Kin
g A
ubur
n 8t
h S
t NE
H
arve
y R
d 10
4th
Ave
SE
T-
3 T-
2 1,
258
4,57
3,75
0 K
ing
Aubu
rn
A S
t SE
29th
St S
E
41st
St S
E
T-3
T-2
1,37
3 4,
056,
464
Kin
g A
ubur
n A
St S
E
Aub
urn
Ave
6t
h S
t SE
T-
3 T-
2 1,
354
4,05
7,92
9 K
ing
Aubu
rn
Aubu
rn W
ay S
outh
S
R 1
8 E
Mai
n S
t T-
3 T-
2 1,
171
4,04
3,00
0 K
ing
Aub
urn
S 2
77th
St
Aub
urn
Way
N
Eas
t C/L
T-
3 T-
2 1,
341
4,20
3,96
4 K
ing
Aubu
rn
Eas
t Val
ley
Hw
y E
La
ke T
appe
s P
kwy
Sou
th C
/L
T-3
T-2
Kin
g B
urie
n A
mba
um B
lvd
SW
N
orth
City
Lim
its
128t
h S
t SW
T-
3 T-
2 82
6 7,
012,
900
Kin
gD
es M
oine
s S
216
th S
treet
S
R 9
9
24th
Ave
S
T-2
Kin
g D
es M
oine
s 24
th A
ve S
S
216
th S
t S
208
th S
t
T-2
Kin
gKe
nt
S 2
77th
St /
SE
277
th S
t W
est C
ity L
imit
108t
h A
ve S
E
T-3
T-2
King
R
edm
ond
148t
h Av
e N
E
NE
29th
Pl
Red
mon
d W
ay
T-3
T-2
2,51
7 11
,722
,500
K
ing
Red
mon
d N
E 2
4th
St
Wes
t City
Lim
its
Eas
t City
Lim
its
T-3
T-2
1,43
5 6,
124,
964
Kin
g S
eattl
e C
orso
n A
ve S
E
ast M
argi
nal W
ay S
A
irpor
t Way
S
T-3
T-1
2,96
8 10
,342
,750
K
ing
Sea
ttle
15th
Ave
NE
N
E 5
0th
St
NE
45t
h S
t T-
3 T-
2 98
3 6,
170,
250
Kin
g S
eattl
e D
elrid
ge W
ay S
W
SW
Spo
kane
St
SW
Ala
ska
St
T-3
T-2
1,13
4 4,
288,
250
Kin
gS
eattl
eFa
untle
roy
Way
SW
W
est S
eattl
e B
ridge
S
W W
ildw
ood
Pl
T-3
T-2
1,03
9 4,
495,
750
Kin
g S
eattl
e N
icke
rson
St
Que
en A
nne
Ave
N
Wes
tlake
Ave
N
T-3
T-2
1,21
8 4,
314,
000
Kin
gS
eattl
eN
W 8
5th
St
24th
Ave
NW
15
th A
ve N
W
T-3
T-2
1,43
1 5,
403,
000
Kin
g S
eattl
e O
lson
Pl S
W
SW
Rox
bury
St
Mye
rs W
ay
T-3
T-2
1,68
1 4,
340,
500
Kin
gS
eattl
eS
tone
Way
N
N 4
0th
St
N 5
0th
St
T-3
T-2
1,10
4 4,
250,
750
Kin
g S
eattl
e W
Nic
kers
on S
t 15
th A
ve W
Q
ueen
Ann
e A
ve N
T-
3 T-
2 1,
218
4,31
4,00
0 K
ing
Sea
ttle
Wes
tern
Ave
D
enny
Way
B
road
St
T-2
4,62
9,78
0 K
ing
Sea
ttle
N 4
5th
St
I-5
SR
99
T-3
T-2
865
3,83
0,00
0 K
ing
Sea
ttle
S A
lbro
Pla
ce
13th
Ave
nue
Sou
th
Sw
ift A
ve S
T-
2 5,
425,
720
Kin
g S
eattl
e S
outh
Indu
stria
l Way
4t
h A
ve S
A
irpor
t Way
Sou
th
T-
2
4,11
4,00
0 K
ing
Sea
ttle
S A
tlant
ic S
t A
lask
a W
ay S
1s
t Ave
nue
S
T-2
8,63
7,99
8
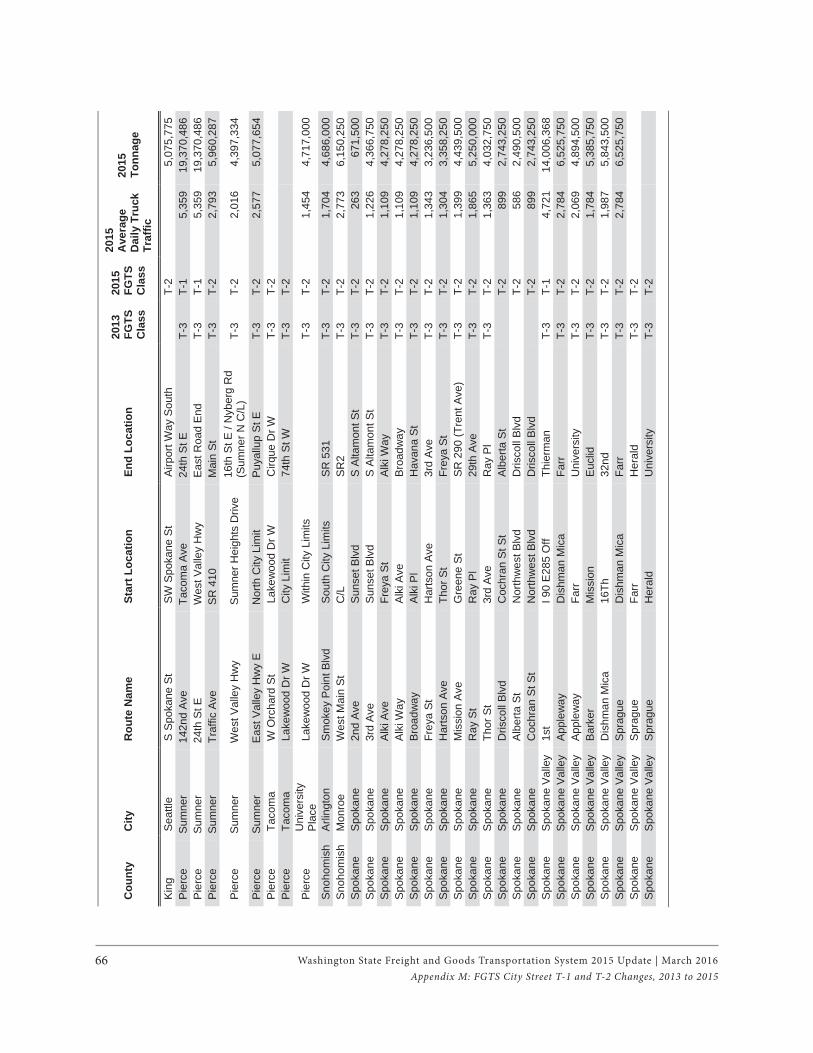
Washington State Freight and Goods Transportation System 2015 Update | March 201666
Cou
nty
City
R
oute
Nam
e St
art L
ocat
ion
End
Loca
tion
2013
FG
TSC
lass
2015
FG
TSC
lass
2015
A
vera
ge
Dai
ly T
ruck
Tr
affic
2015
To
nnag
e
Kin
g S
eattl
e S
Spo
kane
St
SW
Spo
kane
St
Airp
ort W
ay S
outh
T-2
5,
075,
775
Pie
rce
Sum
ner
142n
d Av
e Ta
com
a A
ve
24th
St E
T-
3 T-
1 5,
359
19,3
70,4
86
Pie
rce
Sum
ner
24th
St E
W
est V
alle
y H
wy
Eas
t Roa
d E
nd
T-3
T-1
5,35
9 19
,370
,486
P
ierc
eSu
mne
r Tr
affic
Ave
S
R 4
10
Mai
n S
t T-
3 T-
2 2,
793
5,96
0,28
7
Pie
rce
Sum
ner
Wes
t Val
ley
Hw
y S
umne
r Hei
ghts
Driv
e 16
th S
t E /
Nyb
erg
Rd
(Sum
ner N
C/L
) T-
3 T-
2 2,
016
4,39
7,33
4
Pie
rce
Sum
ner
Eas
t Val
ley
Hw
y E
N
orth
City
Lim
it P
uyal
lup
St E
T-
3 T-
2 2,
577
5,07
7,65
4 P
ierc
e Ta
com
a W
Orc
hard
St
Lake
woo
d D
r W
Cirq
ue D
r W
T-3
T-2
Pie
rce
Taco
ma
Lake
woo
d D
r W
City
Lim
it 74
th S
t W
T-3
T-2
Pie
rce
Uni
vers
ity
Pla
ceLa
kew
ood
Dr W
W
ithin
City
Lim
its
T-3
T-2
1,45
4 4,
717,
000
Snoh
omis
h Ar
lingt
on
Sm
okey
Poi
nt B
lvd
Sout
h C
ity L
imits
S
R 5
31
T-3
T-2
1,70
4 4,
686,
000
Sno
hom
ish
Mon
roe
Wes
t Mai
n S
t C
/L
SR2
T-3
T-2
2,77
3 6,
150,
250
Spo
kane
S
poka
ne
2nd
Ave
Sun
set B
lvd
S A
ltam
ont S
t T-
3 T-
2 26
3 67
1,50
0 S
poka
ne
Spo
kane
3r
d A
ve
Sun
set B
lvd
S A
ltam
ont S
t T-
3 T-
2 1,
226
4,36
6,75
0 S
poka
ne
Spo
kane
A
lki A
ve
Frey
a S
t A
lki W
ay
T-3
T-2
1,10
9 4,
278,
250
Spo
kane
S
poka
ne
Alk
i Way
A
lki A
ve
Bro
adw
ay
T-3
T-2
1,10
9 4,
278,
250
Spo
kane
S
poka
ne
Bro
adw
ay
Alk
i Pl
Hav
ana
St
T-3
T-2
1,10
9 4,
278,
250
Spo
kane
S
poka
ne
Frey
a S
t H
arts
on A
ve
3rd
Ave
T-
3 T-
2 1,
343
3,23
6,50
0 S
poka
ne
Spo
kane
H
arts
on A
ve
Thor
St
Frey
a S
t T-
3 T-
2 1,
304
3,35
8,25
0 S
poka
ne
Spo
kane
M
issi
on A
ve
Gre
ene
St
SR
290
(Tre
nt A
ve)
T-3
T-2
1,39
9 4,
439,
500
Spo
kane
S
poka
ne
Ray
St
Ray
Pl
29th
Ave
T-
3 T-
2 1,
865
5,25
0,00
0 Sp
okan
e S
poka
ne
Thor
St
3rd
Ave
Ray
Pl
T-3
T-2
1,36
3 4,
032,
750
Spo
kane
S
poka
ne
Dris
coll
Blv
d C
ochr
an S
t St
Alb
erta
St
T-2
899
2,74
3,25
0 S
poka
ne
Spo
kane
A
lber
ta S
t N
orth
wes
t Blv
d D
risco
ll B
lvd
T-2
586
2,49
0,50
0 S
poka
ne
Spo
kane
C
ochr
an S
t St
Nor
thw
est B
lvd
Dris
coll
Blv
d T-
2 89
9 2,
743,
250
Spo
kane
S
poka
ne V
alle
y 1s
t I 9
0 E
285
Off
Thie
rman
T-
3 T-
1 4,
721
14,0
06,3
68
Spo
kane
Sp
okan
e Va
lley
Appl
eway
D
ishm
an M
ica
Farr
T-3
T-2
2,78
4 6,
525,
750
Spo
kane
S
poka
ne V
alle
y A
pple
way
Fa
rr U
nive
rsity
T-
3 T-
2 2,
069
4,89
4,50
0 S
poka
ne
Spok
ane
Valle
y Ba
rker
M
issi
onE
uclid
T-3
T-2
1,78
4 5,
385,
750
Spok
ane
Spo
kane
Val
ley
Dis
hman
Mic
a 16
Th
32nd
T-
3 T-
2 1,
987
5,84
3,50
0 S
poka
ne
Spok
ane
Valle
y S
prag
ue
Dis
hman
Mic
a Fa
rrT-
3 T-
2 2,
784
6,52
5,75
0 S
poka
ne
Spo
kane
Val
ley
Spr
ague
Fa
rr H
eral
d T-
3 T-
2 S
poka
ne
Spok
ane
Valle
y S
prag
ue
Her
ald
Uni
vers
ity
T-3
T-2
Appendix M: FGTS City Street T-1 and T-2 Changes, 2013 to 2015
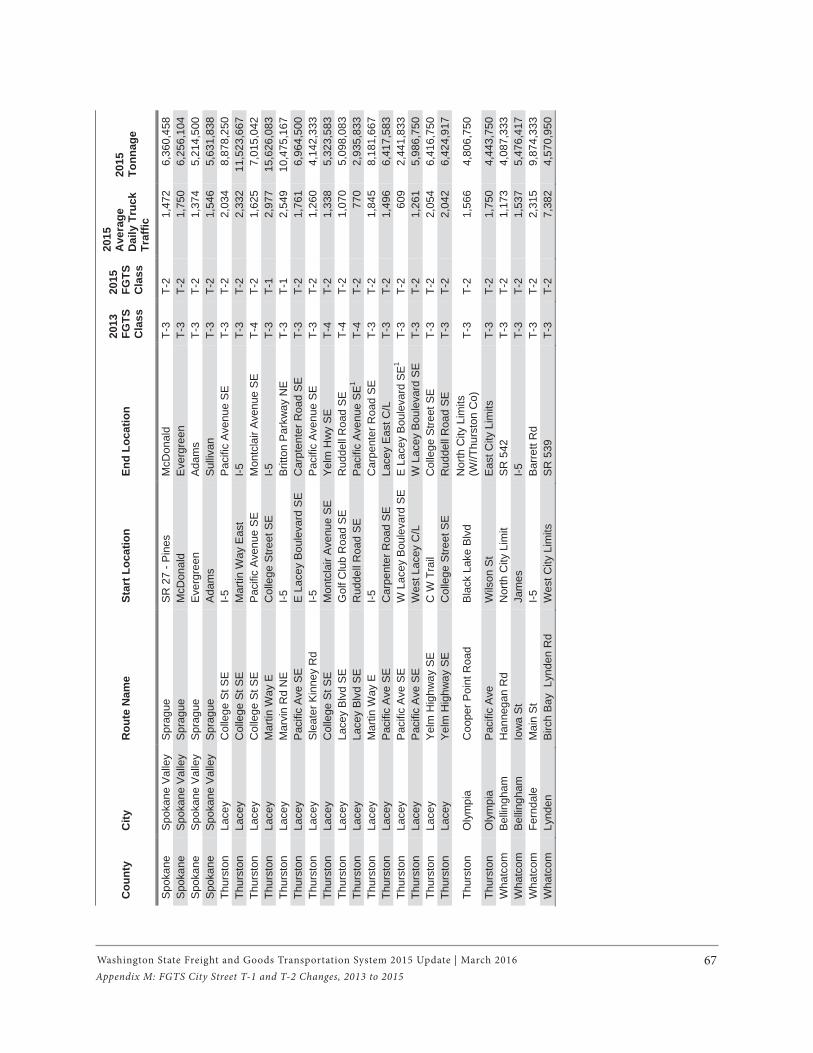
Washington State Freight and Goods Transportation System 2015 Update | March 2016 67
Cou
nty
City
R
oute
Nam
e St
art L
ocat
ion
End
Loca
tion
2013
FG
TSC
lass
2015
FG
TSC
lass
2015
A
vera
ge
Dai
ly T
ruck
Tr
affic
2015
To
nnag
e
Spok
ane
Spo
kane
Val
ley
Spra
gue
SR 2
7 - P
ines
M
cDon
ald
T-3
T-2
1,47
2 6,
360,
458
Spo
kane
Sp
okan
e Va
lley
Spr
ague
M
cDon
ald
Eve
rgre
en
T-3
T-2
1,75
0 6,
256,
104
Spok
ane
Spok
ane
Val
ley
Spr
ague
Ev
ergr
een
Adam
s T-
3 T-
2 1,
374
5,21
4,50
0 S
poka
ne
Spok
ane
Valle
y S
prag
ue
Adam
s Su
llivan
T-
3 T-
2 1,
546
5,63
1,83
8 Th
urst
on
Lace
y C
olle
ge S
t SE
I-5
P
acifi
c A
venu
e S
E
T-3
T-2
2,03
4 8,
878,
250
Thur
ston
La
cey
Col
lege
St S
E
Mar
tin W
ay E
ast
I-5T-
3 T-
2 2,
332
11,5
23,6
67
Thur
ston
La
cey
Col
lege
St S
E
Pac
ific
Ave
nue
SE
M
ontc
lair
Ave
nue
SE
T-
4 T-
2 1,
625
7,01
5,04
2 Th
urst
on
Lace
y M
artin
Way
E
Col
lege
Stre
et S
E
I-5T-
3 T-
1 2,
977
15,6
26,0
83
Thur
ston
La
cey
Mar
vin
Rd
NE
I-5
Br
itton
Par
kway
NE
T-
3 T-
1 2,
549
10,4
75,1
67
Thur
ston
La
cey
Pac
ific
Ave
SE
E
Lac
ey B
oule
vard
SE
C
arpt
ente
r Roa
d S
E
T-3
T-2
1,76
1 6,
964,
500
Thur
ston
La
cey
Sle
ater
Kin
ney
Rd
I-5
Pac
ific
Ave
nue
SE
T-
3 T-
2 1,
260
4,14
2,33
3 Th
urst
on
Lace
y C
olle
ge S
t SE
M
ontc
lair
Ave
nue
SE
Y
elm
Hw
y S
E
T-4
T-2
1,33
8 5,
323,
583
Thur
ston
La
cey
Lace
y B
lvd
SE
G
olf C
lub
Roa
d S
E
Rud
dell
Roa
d S
E
T-4
T-2
1,07
0 5,
098,
083
Thur
ston
La
cey
Lace
y B
lvd
SE
R
udde
ll R
oad
SE
Pac
ific
Ave
nue
SE
1T-
4 T-
2 77
0 2,
935,
833
Thur
ston
La
cey
Mar
tin W
ay E
I-5
C
arpe
nter
Roa
d S
E
T-3
T-2
1,84
5 8,
181,
667
Thur
ston
La
cey
Pac
ific
Ave
SE
C
arpe
nter
Roa
d S
E
Lace
y E
ast C
/L
T-3
T-2
1,49
6 6,
417,
583
Thur
ston
La
cey
Pac
ific
Ave
SE
W
Lac
ey B
oule
vard
SE
E
Lac
ey B
oule
vard
SE1
T-3
T-2
609
2,44
1,83
3 Th
urst
on
Lace
y P
acifi
c A
ve S
E
Wes
t Lac
ey C
/L
W L
acey
Bou
leva
rd S
E
T-3
T-2
1,26
1 5,
986,
750
Thur
ston
La
cey
Yel
m H
ighw
ay S
E
C W
Tra
il C
olle
ge S
treet
SE
T-
3 T-
2 2,
054
6,41
6,75
0 Th
urst
on
Lace
y Y
elm
Hig
hway
SE
C
olle
ge S
treet
SE
R
udde
ll R
oad
SE
T-3
T-2
2,04
2 6,
424,
917
Thur
ston
O
lym
pia
Coo
per P
oint
Roa
d B
lack
Lak
e B
lvd
Nor
th C
ity L
imits
(W
//Thu
rsto
n C
o)
T-3
T-2
1,56
6 4,
806,
750
Thur
ston
O
lym
pia
Pac
ific
Ave
W
ilson
St
Eas
t City
Lim
its
T-3
T-2
1,75
0 4,
443,
750
Wha
tcom
B
ellin
gham
H
anne
gan
Rd
Nor
th C
ity L
imit
SR
542
T-
3 T-
2 1,
173
4,08
7,33
3 W
hatc
om
Bellin
gham
Io
wa
St
Jam
es
I-5T-
3 T-
2 1,
537
5,47
6,41
7 W
hatc
om
Fern
dale
M
ain
St
I-5
Bar
rett
Rd
T-3
T-2
2,31
5 9,
874,
333
Wha
tcom
Ly
nden
Bi
rch
Bay
Lyn
den
Rd
Wes
t City
Lim
its
SR
539
T-
3 T-
2 7,
382
4,57
0,95
0
Appendix M: FGTS City Street T-1 and T-2 Changes, 2013 to 2015
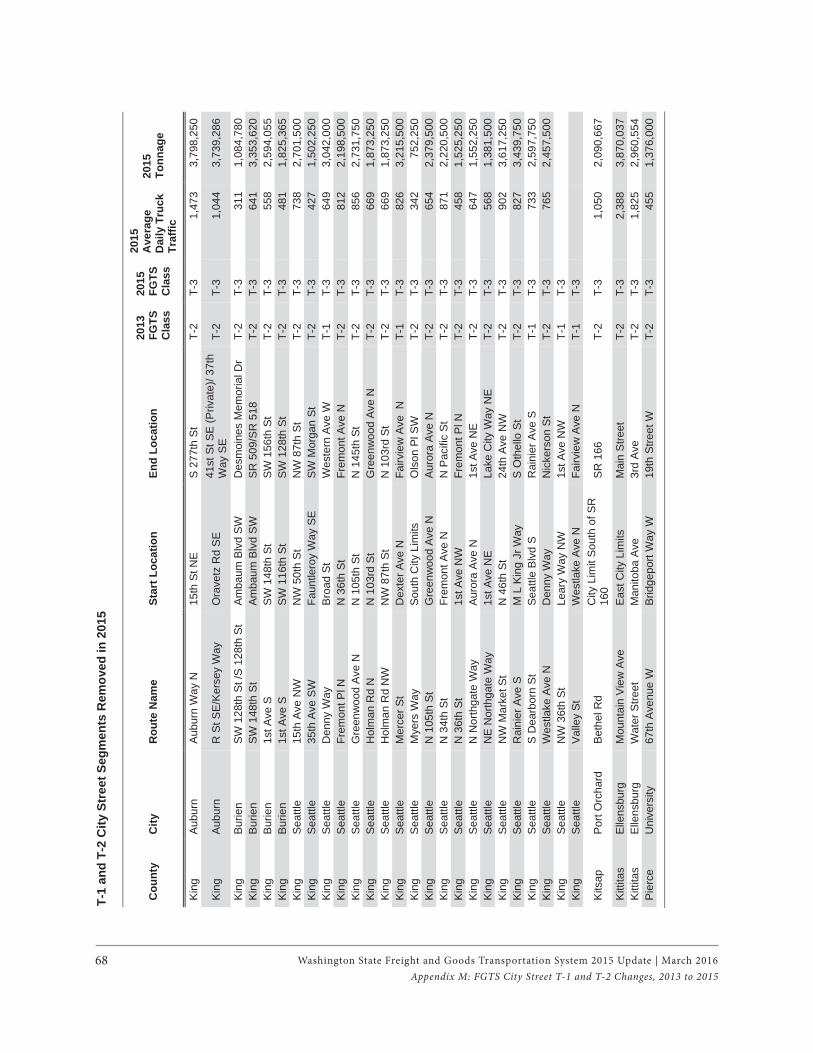
Washington State Freight and Goods Transportation System 2015 Update | March 201668
T-1
and
T-2
City
Str
eet S
egm
ents
Rem
oved
in 2
015
Cou
nty
City
R
oute
Nam
e St
art L
ocat
ion
End
Loca
tion
2013
FG
TSC
lass
2015
FG
TSC
lass
2015
A
vera
ge
Dai
ly T
ruck
Tr
affic
2015
To
nnag
e
Kin
g A
ubur
n A
ubur
n W
ay N
15
th S
t NE
S
277
th S
t T-
2 T-
3 1,
473
3,79
8,25
0
Kin
gAu
burn
R
St S
E/K
erse
y W
ay
Ora
vetz
Rd
SE
41
st S
t SE
(Priv
ate)
/ 37t
h W
ay S
E
T-2
T-3
1,04
4 3,
739,
286
Kin
g B
urie
n S
W 1
28th
St /
S 1
28th
St
Am
baum
Blv
d S
W
Des
moi
nes
Mem
oria
l Dr
T-2
T-3
311
1,08
4,78
0 K
ing
Bur
ien
SW
148
th S
t A
mba
um B
lvd
SW
S
R 5
09/S
R 5
18
T-2
T-3
641
3,35
3,62
0 K
ing
Bur
ien
1st A
ve S
S
W 1
48th
St
SW
156
th S
t T-
2 T-
3 55
8 2,
594,
055
Kin
gB
urie
n 1s
t Ave
S
SW
116
th S
t S
W 1
28th
St
T-2
T-3
481
1,82
5,36
5 K
ing
Sea
ttle
15th
Ave
NW
N
W 5
0th
St
NW
87t
h S
t T-
2 T-
3 73
8 2,
701,
500
Kin
gS
eattl
e35
th A
ve S
W
Faun
tlero
y W
ay S
E
SW
Mor
gan
St
T-2
T-3
427
1,50
2,25
0 K
ing
Sea
ttle
Den
ny W
ay
Bro
ad S
t W
este
rn A
ve W
T-
1 T-
3 64
9 3,
042,
000
Kin
gS
eattl
eFr
emon
t Pl N
N
36t
h S
t Fr
emon
t Ave
N
T-2
T-3
812
2,19
8,50
0 Ki
ng
Seat
tle
Gre
enw
ood
Ave
N
N 1
05th
St
N 1
45th
St
T-2
T-3
856
2,73
1,75
0 K
ing
Sea
ttle
Hol
man
Rd
N
N 1
03rd
St
Gre
enw
ood
Ave
N
T-2
T-3
669
1,87
3,25
0 K
ing
Sea
ttle
Hol
man
Rd
NW
N
W 8
7th
St
N 1
03rd
St
T-2
T-3
669
1,87
3,25
0 K
ing
Sea
ttle
Mer
cer S
t D
exte
r Ave
N
Fairv
iew
Ave
N
T-1
T-3
826
3,21
5,50
0 K
ing
Sea
ttle
Mye
rs W
ay
Sou
th C
ity L
imits
O
lson
Pl S
W
T-2
T-3
342
752,
250
Kin
gS
eattl
eN
105
th S
t G
reen
woo
d Av
e N
A
uror
a A
ve N
T-
2 T-
3 65
4 2,
379,
500
Kin
g S
eattl
e N
34t
h S
t Fr
emon
t Ave
N
N P
acifi
c S
t T-
2 T-
3 87
1 2,
220,
500
Kin
gS
eattl
eN
36t
h S
t 1s
t Ave
NW
Fr
emon
t Pl N
T-
2 T-
3 45
8 1,
525,
250
Kin
g S
eattl
e N
Nor
thga
te W
ay
Aur
ora
Ave
N
1st A
ve N
E
T-2
T-3
647
1,55
2,25
0 K
ing
Sea
ttle
NE
Nor
thga
te W
ay
1st A
ve N
E
Lake
City
Way
NE
T-2
T-3
568
1,38
1,50
0 K
ing
Sea
ttle
NW
Mar
ket S
t N
46t
h S
t 24
th A
ve N
W
T-2
T-3
902
3,61
7,25
0 K
ing
Sea
ttle
Rai
nier
Ave
S
M L
Kin
g Jr
Way
S
Oth
ello
St
T-2
T-3
827
3,43
9,75
0 K
ing
Sea
ttle
S D
earb
orn
St
Sea
ttle
Blv
d S
R
aini
er A
ve S
T-
1 T-
3 73
3 2,
597,
750
Kin
gS
eattl
eW
estla
ke A
ve N
D
enny
Way
N
icke
rson
St
T-2
T-3
765
2,45
7,50
0 K
ing
Sea
ttle
NW
36t
h S
t Le
ary
Way
NW
1s
t Ave
NW
T-
1 T-
3 K
ing
Sea
ttle
Val
ley
St
Wes
tlake
Ave
N
Fairv
iew
Ave
N
T-1
T-3
Kits
ap
Por
t Orc
hard
B
ethe
l Rd
City
Lim
it S
outh
of S
R
160
SR
166
T-
2 T-
3 1,
050
2,09
0,66
7
Kitt
itas
Elle
nsbu
rg
Mou
ntai
n V
iew
Ave
E
ast C
ity L
imits
M
ain
Stre
et
T-2
T-3
2,38
8 3,
870,
037
Kitt
itas
Elle
nsbu
rg
Wat
er S
treet
M
anito
ba A
ve
3rd
Ave
T-
2 T-
3 1,
825
2,96
0,55
4 P
ierc
eU
nive
rsity
67
th A
venu
e W
B
ridge
port
Way
W
19th
Stre
et W
T-
2 T-
3 45
5 1,
376,
000
Appendix M: FGTS City Street T-1 and T-2 Changes, 2013 to 2015
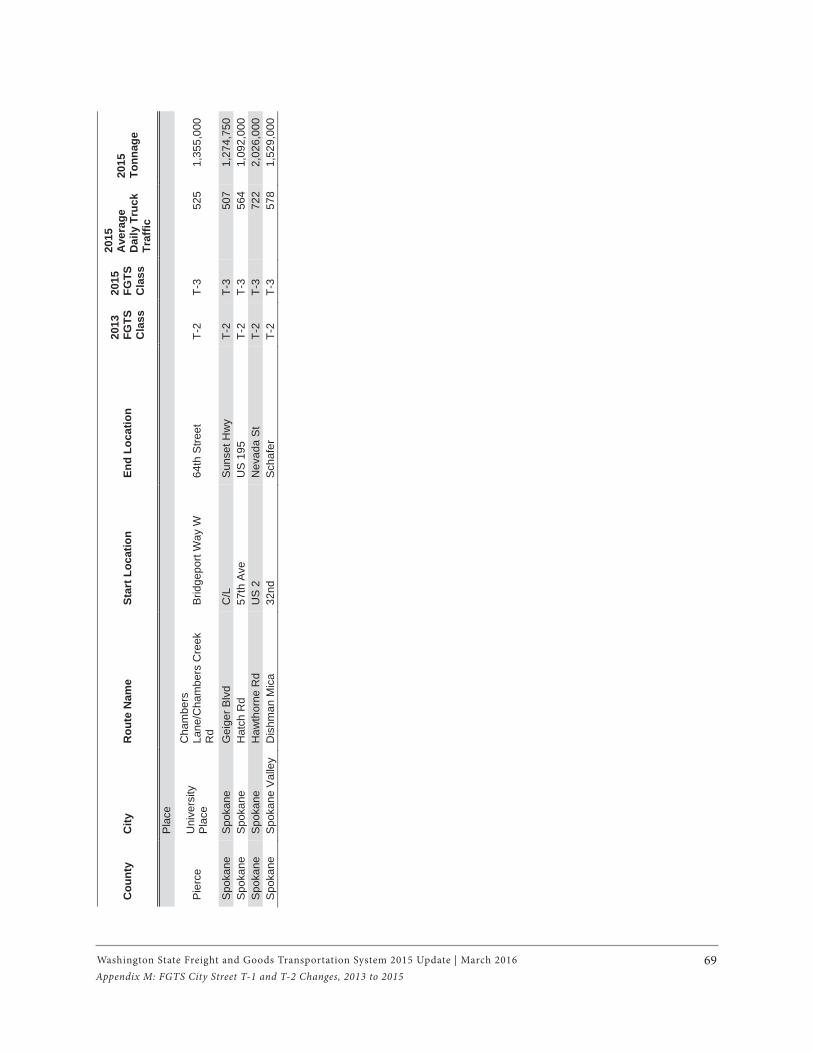
Washington State Freight and Goods Transportation System 2015 Update | March 2016 69
Cou
nty
City
R
oute
Nam
e St
art L
ocat
ion
End
Loca
tion
2013
FG
TSC
lass
2015
FG
TSC
lass
2015
A
vera
ge
Dai
ly T
ruck
Tr
affic
2015
To
nnag
e
Pla
ce
Pie
rce
Uni
vers
ity
Pla
ce
Cha
mbe
rs
Lane
/Cha
mbe
rs C
reek
R
d B
ridge
port
Way
W
64th
Stre
et
T-2
T-3
525
1,35
5,00
0
Spo
kane
S
poka
ne
Gei
ger B
lvd
C/L
Sun
set H
wy
T-2
T-3
507
1,27
4,75
0 S
poka
ne
Spo
kane
H
atch
Rd
57th
Ave
U
S 1
95
T-2
T-3
564
1,09
2,00
0 S
poka
ne
Spo
kane
H
awth
orne
Rd
US
2
Nev
ada
St
T-2
T-3
722
2,02
6,00
0 S
poka
ne
Spo
kane
Val
ley
Dis
hman
Mic
a 32
nd
Sch
afer
T-
2 T-
3 57
8 1,
529,
000
Appendix M: FGTS City Street T-1 and T-2 Changes, 2013 to 2015
Washington State Freight and Goods Transportation System 2015 Update | March 201670
Appendix N: Request to Cities for FGTS Data
Appendix N: Request to Cities for FGTS Data
June 23rd, 2015
To: Public Works Directors (and Clerks for those
without Public Works Directors)
Subject: WSDOT Request for 2015 Freight and Goods
Transportation System Data
Hello Public Works Directors
(Please forward this to the appropriate people in your
department/city. Th anks. And if you city has already
submitted 2015 FGTS data to WSDOT you may disregard
this notice.)
WSDOT has started the process of updating the Freight
and Goods Transportation System and is soliciting
freight data on city streets. FGTS is a database of the
state’s freight corridors, including highways, county
roads, and city streets. WSDOT solicits freight data
on the city streets as part of its overall eff ort to comply
with both state and federal reporting requirements.
WSDOT has been using this data to make various
decisions, including designating truck freight economic
corridors in State Freight Mobility Plan (http://
www.wsdot.wa.gov/Freight/EconCorridors.htm).
Freight Economic Corridors were used by WSDOT
as the criteria to evaluate whether local, regional and
tribal freight projects are eligible for inclusion in
State Freight Mobility Plan. In addition, Th e Freight
Mobility Strategic Investment Board has used FGTS
classifi cation as a factor in determining which freight
projects are eligible for funding.
AWC/WSDOT Request:
For the 2015 update we are seeking the following
information:
1. Th e classifi cation of freight routes,
2. Data to support freight corridor classifi cation,
including:
• Th e most current daily truck volume on the
freight routes,
• Th e truck tonnage carried by the freight routes.
Th e 2013 classifi cation table of FGTS city streets is
attached for your information. Please review 2013
FGTS classifi cation information, and update the
classifi cation of existing freight routes, add new freight
routes, or remove freight routes from your jurisdiction
(instructions below). Please note that any changes made
to the “T” classifi cation of city freight routes, or route
additions/deletions need be based on the actual truck
volume count and increase/decrease of the truck tonnage
carried by those routes.
We greatly appreciate your cooperation for the 2015
update. We request that city FGTS data submission
be returned by August 24th, 2015. If we do not receive
updates from you by this date, we will use your freight
route information as reported in the 2013 FGTS update.
Instruction for Updating your Freight Routes:
To update freight routes within your jurisdiction, you
can either submit the data through the online data
submittal application (http://fmapps.wsdot.wa.gov/fmi/
iwp/cgi?-db=FGTS&-loadframes), or by fi lling in the
requested information in the attached Excel spreadsheet
“2013 FGTS Classifi cation of City Streets & 2015 Data
Submission” and sending it to Ed Spilker at SpilkeE@
wsdot.wa.gov.
Freight routes are classifi ed according to the annual
gross freight tonnage they carry. Th e tonnage
designations for roadways are:
T-1 more than 10 million tons per year
T-2 4 million to 10 million tons per year
T-3 300,000 to 4 million tons per year
T-4 100,000 to 300,000 tons per year
T-5 at least 20,000 tons in 60 days and less than
100,000 tons per year
Washington State Freight and Goods Transportation System 2015 Update | March 2016 71Appendix N: Request to Cities for FGTS Data
In order to accurately estimate the truck tonnage on
freight routes, following procedures are recommended
for data collection and tonnage calculation:
1. Set up vehicle classifi cation counters at the roadway
segments of interest to collect traffi c volume data;
2. Aggregate FHWA 13-class traffi c counts into four
classes (single trucks – FHWA class 5 to 7, double
trucks- class 8 to 10, train trucks – class 11 to 13,
and all other – class 1 to 4) to estimate average daily
truck volume by types;
3. Use the formula provided in the “Instructions
for FGTS Truck Tonnage Estimation” document
(http://www.wsdot.wa.gov/NR/rdonlyres/344CB5F2-
AD88-4A9C-A4D8-E8C2982B00C2/0/
InstructionsforFGTSTruckTonnageEstimation.pdf) to
estimate truck tonnage based on truck volumes.
Th e 2013 FGTS update is available at WSDOT FGTS
website:
http://www.wsdot.wa.gov/Freight/FGTS/default.htm. An
interactive map released by WSDOT is also available to
you for reviewing 2013 FGTS freight corridors:
http://www.wsdot.wa.gov/data/tools/
geoportal/?confi g=freight
Questions:
If you have questions or concerns please contact Ed
Spilker at [email protected] or 360-705-7387,
or Wenjuan Zhao at [email protected] or
360-705-6990.
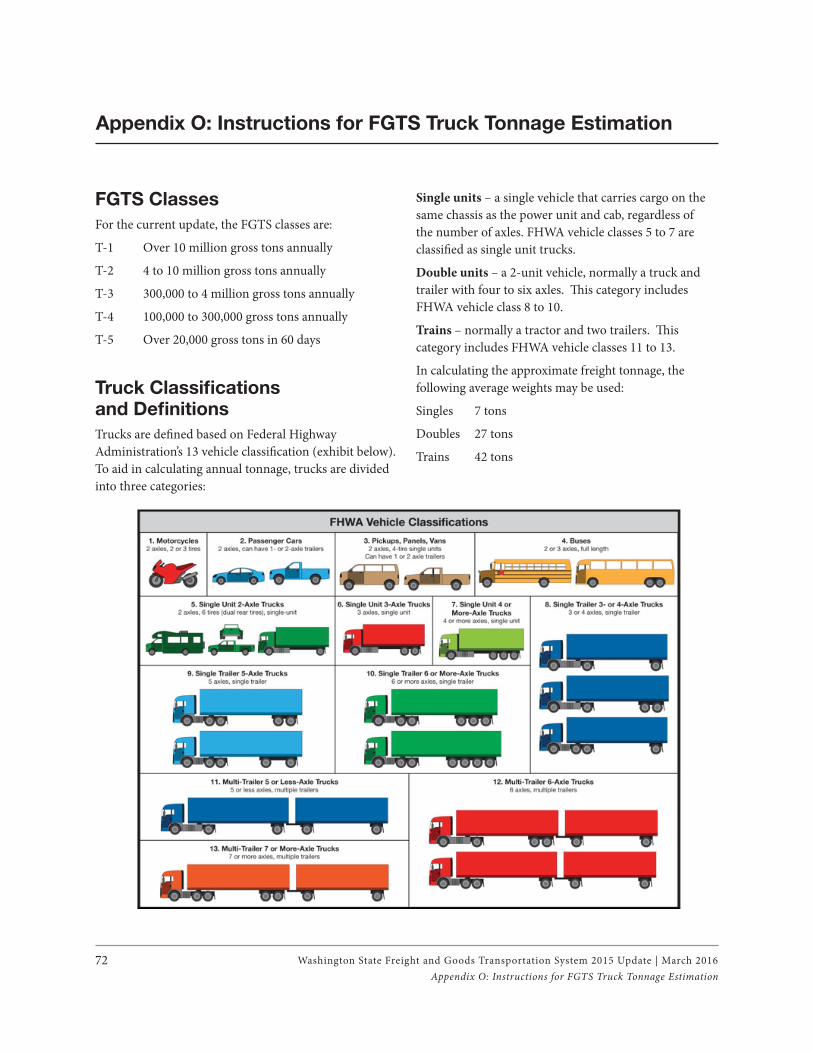
Washington State Freight and Goods Transportation System 2015 Update | March 201672
Appendix O: Instructions for FGTS Truck Tonnage Estimation
FGTS Classes
For the current update, the FGTS classes are:
T-1 Over 10 million gross tons annually
T-2 4 to 10 million gross tons annually
T-3 300,000 to 4 million gross tons annually
T-4 100,000 to 300,000 gross tons annually
T-5 Over 20,000 gross tons in 60 days
Truck Classifi cations and Defi nitions
Trucks are defi ned based on Federal Highway
Administration’s 13 vehicle classifi cation (exhibit below).
To aid in calculating annual tonnage, trucks are divided
into three categories:
Single units – a single vehicle that carries cargo on the
same chassis as the power unit and cab, regardless of
the number of axles. FHWA vehicle classes 5 to 7 are
classifi ed as single unit trucks.
Double units – a 2-unit vehicle, normally a truck and
trailer with four to six axles. Th is category includes
FHWA vehicle class 8 to 10.
Trains – normally a tractor and two trailers. Th is
category includes FHWA vehicle classes 11 to 13.
In calculating the approximate freight tonnage, the
following average weights may be used:
Singles 7 tons
Doubles 27 tons
Trains 42 tons
Appendix O: Instructions for FGTS Truck Tonnage Estimation
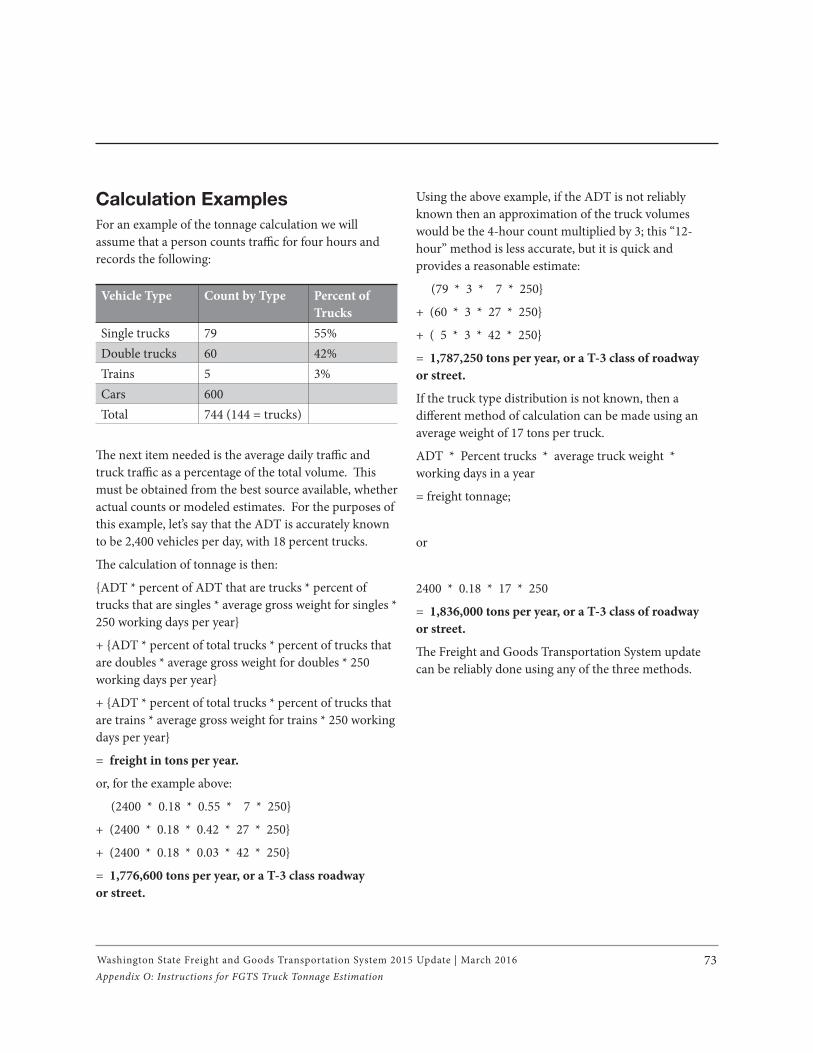
Washington State Freight and Goods Transportation System 2015 Update | March 2016 73
Calculation Examples
For an example of the tonnage calculation we will
assume that a person counts traffi c for four hours and
records the following:
Th e next item needed is the average daily traffi c and
truck traffi c as a percentage of the total volume. Th is
must be obtained from the best source available, whether
actual counts or modeled estimates. For the purposes of
this example, let’s say that the ADT is accurately known
to be 2,400 vehicles per day, with 18 percent trucks.
Th e calculation of tonnage is then:
{ADT * percent of ADT that are trucks * percent of
trucks that are singles * average gross weight for singles *
250 working days per year}
+ {ADT * percent of total trucks * percent of trucks that
are doubles * average gross weight for doubles * 250
working days per year}
+ {ADT * percent of total trucks * percent of trucks that
are trains * average gross weight for trains * 250 working
days per year}
= freight in tons per year.
or, for the example above:
(2400 * 0.18 * 0.55 * 7 * 250}
+ (2400 * 0.18 * 0.42 * 27 * 250}
+ (2400 * 0.18 * 0.03 * 42 * 250}
= 1,776,600 tons per year, or a T-3 class roadway
or street.
Vehicle Type Count by Type Percent of
Trucks
Single trucks 79 55%
Double trucks 60 42%
Trains 5 3%
Cars 600
Total 744 (144 = trucks)
Using the above example, if the ADT is not reliably
known then an approximation of the truck volumes
would be the 4-hour count multiplied by 3; this “12-
hour” method is less accurate, but it is quick and
provides a reasonable estimate:
(79 * 3 * 7 * 250}
+ (60 * 3 * 27 * 250}
+ ( 5 * 3 * 42 * 250}
= 1,787,250 tons per year, or a T-3 class of roadway
or street.
If the truck type distribution is not known, then a
diff erent method of calculation can be made using an
average weight of 17 tons per truck.
ADT * Percent trucks * average truck weight *
working days in a year
= freight tonnage;
or
2400 * 0.18 * 17 * 250
= 1,836,000 tons per year, or a T-3 class of roadway
or street.
Th e Freight and Goods Transportation System update
can be reliably done using any of the three methods.
Appendix O: Instructions for FGTS Truck Tonnage Estimation
Washington State Freight and Goods Transportation System 2015 Update | March 201674
Appendix P: Assumptions made when interpreting the data
Th e FGTS update team reviewed statewide tabular
and graphic truck tonnage data on state routes for
errors and inconsistencies. When analyzing traffi c
data, the FGTS update team relied on best professional
judgment to make assumptions and minor adjustments,
and compared 2011 data with current data to correct
anomalies, add couplets, and reconcile route continuity
issues.
Sometimes the exact location of data collection points
creates a confusing scenario, such as data indicating that
freight tonnage drops signifi cantly at a particular road
location, but there is no opportunity at that location for
the freight traffi c to exit (i.e., no off ramp or pull-out).
Where this was detected in the 2015 data, unless some
reasonable explanation was found, the freight traffi c was
assumed to continue on to the next exit opportunity.
Appendix P: Assumptions Made When Interpreting the Data