Embed Size (px)
Citation preview
RI
Planning Our Future
September 2016
Amended July 2017
STATE OF RHODE ISLAND
Freight and Goods Movement Plan
Rhode Island Department
of Administration Division of Planning
F R E I G H T F O R W A R D :
S T A T E O F R H O D E I S L A N D F R E I G H T A N D G O O D S M O V E M E N T P L A N
i | P a g e
1 About the Plan ............................................................................................................................................ 1
1.1 Approach to Plan Development ................................................................................................... 1
1.1.1 Consistency with FAST Act Requirements ........................................................................ 1
1.1.2 Plan Organization ................................................................................................................. 3
1.2 Freight Committees .......................................................................................................................... 4
1.3 Public Involvement ........................................................................................................................... 5
1.4 Communication................................................................................................................................ 6
1.4.1 Presentation Development ................................................................................................. 6
1.4.2 Project Website ..................................................................................................................... 7
1.4.3 Meeting Notifications ........................................................................................................... 7
2 Rhode Island Strategic Freight Goals ...................................................................................................... 8
2.1 National Freight Goals ..................................................................................................................... 8
2.2 Rhode Island Freight Goals ............................................................................................................. 8
2.2.1 Operational Efficiency ......................................................................................................... 9
2.2.2 Economic Growth/Competitiveness ................................................................................ 9
2.2.3 Connectivity .......................................................................................................................... 9
2.3 FAST Act Expectations for Freight Plans ...................................................................................... 11
3 Economic Context of Freight Transportation Planning ......................................................................... 12
3.1 Introduction ..................................................................................................................................... 12
3.2 Economic Development Plan and Freight ................................................................................ 12
3.3 Freight Benefits to the State of Rhode Island ............................................................................ 13
3.3.1 Connects Consumers to Suppliers ................................................................................... 13
3.3.2 Supports Jobs ...................................................................................................................... 14
3.3.3 Links to Regional Economies ............................................................................................ 18
3.3.4 Provides an International Gateway ................................................................................ 21
3.4 SWOT Analysis .................................................................................................................................. 24
3.4.1 Automobile Distribution ..................................................................................................... 25
3.4.2 Final Mile .................................................................................................................................... 26
3.4.3 Petroleum/Fuel .................................................................................................................... 26
3.4.4 High Technology Industry .................................................................................................. 28
3.4.5 Warehousing/Distribution .................................................................................................. 29
3.5 Summary of Economic Context of Freight in Rhode Island .................................................... 32
4 State Freight Transportation Assets ........................................................................................................ 33
4.1 Introduction ..................................................................................................................................... 33
4.2 Assessment Approach ................................................................................................................... 33
4.2.1 Data Collection .................................................................................................................. 33
4.2.2 Rhode Island Department of Administration, Division of Planning, Statewide
Planning Program ........................................................................................................................... 33 4.2.3 Rhode Island Department of Transportation ................................................................. 34
4.2.4 Federal Highway Administration (FHWA) .......................................................................... 34
4.2.5 Other Sources ...................................................................................................................... 34
4.3 Regional Context............................................................................................................................ 34
4.4 Highways & Roads ............................................................................................................................... 36
4.4.1 Major Highways/Corridors ................................................................................................. 36
4.4.1.1 Bridges ................................................................................................................... 37
4.4.1.2 ITS Infrastructure ................................................................................................... 41
4.4.1.3 Truck Routes and Hazardous Restricted Routes ............................................ 41
4.4.1.4 Rest Areas, Weigh Stations & Truck Parking Facilities .................................... 45
F R E I G H T F O R W A R D :
S T A T E O F R H O D E I S L A N D F R E I G H T A N D G O O D S M O V E M E N T P L A N
i | P a g e
4.5 Freight Railways .................................................................................................................................... 48
4.5.1 Regional Context ................................................................................................................ 48
4.5.2 State Rail System ................................................................................................................. 50
4.5.3 Providence & Worcester Railroad (P&W).......................................................................... 52
4.5.4 Seaview Railroad ................................................................................................................ 53
4.5.5 Port of Providence Terminals ............................................................................................ 58
4.5.5.1 ProvPort ................................................................................................................. 60
4.5.5.2 Other Ports and Terminals in the Port of Providence ...................................... 61
4.5.6 Port of Davisville .................................................................................................................. 62 4.5.7 Tiverton Marine Terminal ........................................................................................................ 63
4.5.8 Port of Galilee ..................................................................................................................... 64
4.5.9 Port of Newport ................................................................................................................... 64
4.6 Air Freight ......................................................................................................................................... 65
4.6.1 Overview .............................................................................................................................. 65
4.6.2 T.F. Green Airport ................................................................................................................ 67
4.6.3 Other Airports ...................................................................................................................... 68
4.7 Intermodal Facilities ....................................................................................................................... 70
4.8 Pipelines ............................................................................................................................................ 73
4.8.1 Natural Gas Pipelines ......................................................................................................... 73
4.8.2 Petroleum Product Pipelines ............................................................................................. 73
4.9 Rhode Island Freight Network ...................................................................................................... 75
5 Freight Policies, Strategies and Institutions ........................................................................................... 82
5.1 Coordination and Consistency with Other State and Regional Transportation Plans ....... 82
5.2 Freight Related Institutions ............................................................................................................ 84
6 Conditions and Performance of the State’s Freight Transportation System .................................. 87
6.1 Conditions of the State’s Freight Transportation System ......................................................... 87 6.1.1 Highway & Bridge Conditions ........................................................................................... 87
6.1.1.1 State of Repair.......................................................................................................... 87
Highways & Roads .................................................................................................................. 88
Bridges .................................................................................................................................. 90
6.1.1.2 Congestion & Bottlenecks ................................................................................. 94
Roadway Congestion ........................................................................................................ 94
Bottlenecks .......................................................................................................................... 94
6.1.1.3 Safety ..................................................................................................................... 97
6.1.1.4 Truck Parking ............................................................................................................. 98
6.1.1.5 Highway Weight Restrictions ........................................................................... 100
6.1.1.6 Bridge Vertical Clearances ............................................................................. 101
6.1.1.7 Port Access Issues .............................................................................................. 102
6.1.2 Railways Conditions ......................................................................................................... 104
6.1.2.1 Rail System Capacity and Access ................................................................. 104
Recent System Improvements ....................................................................................... 104
Regional Capacity Concerns ........................................................................................ 104
Ongoing NEC Plans .......................................................................................................... 105
Local Capacity and Access Concerns ........................................................................ 105
F R E I G H T F O R W A R D :
S T A T E O F R H O D E I S L A N D F R E I G H T A N D G O O D S M O V E M E N T P L A N
i | P a g e
6.1.2.2 Vertical Clearance Limitations ....................................................................... 107
6.1.2.3 Rail Bridge Weight Restrictions ........................................................................ 109
6.1.2.4 Conflicts with Passenger Service ....................................................................... 109
6.1.3 Marine Ports Conditions ................................................................................................... 112
6.1.3.1 Channel and Berth Dredging ......................................................................... 113
6.1.3.2 Climate Change and Port Resiliency ............................................................ 113
6.1.3.3 Port of Davisville ................................................................................................. 114
6.1.3.4 Port of Providence ............................................................................................ 114
6.1.4 Airports and Air Freight Conditions ................................................................................ 115
6.1.5 Intermodal Facilities Conditions ..................................................................................... 116
6.1.6 Pipeline Conditions ........................................................................................................... 117
6.2 Freight System Performance Measures .................................................................................... 117
6.2.1 Travel Time Reliability ....................................................................................................... 118
6.2.2 Congestion ........................................................................................................................ 119
6.2.3 Oversize/Overweight Permits ......................................................................................... 122
6.2.4 Truck Parking Spaces ....................................................................................................... 122
6.2.5 Truck Volumes ................................................................................................................... 123
6.2.6 Number of Bridges Meeting 286K Standard ................................................................ 124
6.2.7 Annual Rail Freight Tonnage .............................................................................................. 124
6.2.8 Annual Marine Cargo Tonnage ..................................................................................... 125
6.2.9 Annual Air Cargo Tonnage ............................................................................................. 125
7 Freight Forecast ............................................................................................................................................. 126
7.1 Introduction ................................................................................................................................... 126
7.2 Highway Freight Forecast ................................................................................................................ 126
7.2.1 Freight Flow Direction....................................................................................................... 126
7.2.2 Primary Trading Partners .................................................................................................. 127
7.2.3 Freight Trends .......................................................................................................................... 128
7.3 Rail Freight Forecast .......................................................................................................................... 129
7.3.1 Freight Flow Direction....................................................................................................... 129
7.3.2 Trading Partners ................................................................................................................ 130
7.3.3 Freight Trends .......................................................................................................................... 130
7.4 Waterborne Freight Forecast .......................................................................................................... 131
7.4.1 Freight Flow Direction....................................................................................................... 132
7.4.2 Trading Partners ................................................................................................................ 133
7.4.3 Freight Trends .......................................................................................................................... 133
7.5 Air Freight Forecast ............................................................................................................................ 133
7.5.1 Freight Flow Direction....................................................................................................... 134
7.5.2 Regional Trading Partners ............................................................................................... 135
7.5.3 Freight Trends .......................................................................................................................... 136
8 Industry Trends, Local Strengths & Needs ........................................................................................... 137
8.1 National Trends ............................................................................................................................. 137 8.1.1 Population Growth and Freight Movement ................................................................... 137
8.1.2 Labor Driver Shortage ...................................................................................................... 137
8.1.3 E-Commerce ..................................................................................................................... 137
8.1.4 Autonomous Vehicles ...................................................................................................... 138
8.1.5 Regional Distribution Strategies .......................................................................................... 138
F R E I G H T F O R W A R D :
S T A T E O F R H O D E I S L A N D F R E I G H T A N D G O O D S M O V E M E N T P L A N
i | P a g e
8.1.6 Complete Streets and Sustainable People Movement ............................................. 138
8.1.7 Increased Rail Movement ............................................................................................... 138
8.1.8 Clean Energy and Alternative Fuels .............................................................................. 139
8.1.9 International & Domestic Shipping Lanes .................................................................... 139
8.2 Strengths and Opportunities for Rhode Island’s Freight Network ........................................ 139
8.2.1 Highways ............................................................................................................................ 140
8.2.2 Railways.................................................................................................................................... 140
8.2.3 Marine and Inland Ports .................................................................................................. 140
8.2.3.1 Marine Ports ........................................................................................................ 140
8.2.3.2 Potential Inland Port ............................................................................................. 141
8.2.4 Airports and Air Freight .................................................................................................... 141
9 Freight Needs and Challenges in Rhode Island ................................................................................ 142
9.1 Addressing Local Freight Needs and Issues ............................................................................. 144
10 The State’s Decision Making Process .................................................................................................. 145
10.1 Stakeholder and Public Outreach ............................................................................................ 145
10.2 Evaluation of Project Proposals .................................................................................................. 145
10.2.1 Approach to Project Prioritization .................................................................................. 145
10.3 Economic Analysis Conducted for Key Projects ..................................................................... 147
10.3.1 Economic Impact Analysis .............................................................................................. 147
10.3.2 Benefit-Cost Analysis ........................................................................................................ 148
10.4 Interstate 95 Northbound Viaduct ............................................................................................ 150
10.5 6/10, Interstate 95 Southbound Connection ........................................................................... 151
10.6 Allens Ave, Interstate 95 Southbound Connection ................................................................ 152
10.7 Route 4, Interstate 95 Connection ............................................................................................ 153
10.8 Davisville Yard Track Improvements .......................................................................................... 154
10.8.1 Industrial Park .......................................................................................................................... 155
10.8.2 Rail Yard Expansion .......................................................................................................... 155
10.9 T.F. Green Airport Ramp Expansion ........................................................................................... 156
11 the State’s freight improvement strategy .......................................................................................... 158
11.1 Freight Investment Priorities ......................................................................................................... 158
11.2 Freight Policy Recommendations.............................................................................................. 170
12 implementation plan ............................................................................................................................. 178
12.1 Project Prioritization ...................................................................................................................... 178
12.2 Funding Sources ............................................................................................................................ 179
12.2.1 Existing Federal Funding Sources ................................................................................... 179
FAST Act .............................................................................................................................. 179
Fuel Taxes ........................................................................................................................... 180
Highway Safety Improvement Program (HSIP)............................................................ 180
Surface Transportation Program (STP) .............................................................................. 181
National Highway Performance Program (NHPP) ...................................................... 181
Congestion Mitigation and Air Quality Improvement Program (CMAQ) ............... 181
Transportation Investment Generating Economic Recovery Program (TIGER) .. 181
Airport Improvement Program (AIP) ............................................................................. 181
Other Federal Programs ...................................................................................................... 182
F R E I G H T F O R W A R D :
S T A T E O F R H O D E I S L A N D F R E I G H T A N D G O O D S M O V E M E N T P L A N
i | P a g e
12.2.2 Existing Freight Revenue Sources – State ..................................................................... 183
12.2.3 Fiscally Constrained Projects .......................................................................................... 184
12.3 Policies and Strategies ................................................................................................................. 192
12.4 Partnerships and Stakeholders ................................................................................................... 192
12.5 Future Challenges and Issues ..................................................................................................... 193
12.6 Ongoing Efforts and Implementation of Recommendations and Strategies ................... 194
12.7 Conclusion ..................................................................................................................................... 195
ii | P a g e 6 | P a g e 6 | P a g e
F R E I G H T F O R W A R D :
S T A T E O F R H O D E I S L A N D F R E I G H T A N D G O O D S M O V E M E N T P L A N
This page intentionally blank.
F R E I G H T F O R W A R D :
S T A T E O F R H O D E I S L A N D F R E I G H T A N D G O O D S M O V E M E N T P L A N
1 | P a g e
1 ABOUT THE PLAN
1.1 Approach to Plan Development
Freight Forward: State of Rhode Island Freight and Goods Movement Plan (Rhode Island
Freight Plan) is a comprehensive multi-modal transportation plan that describes the
immediate and long-range planning activities and investments associated with Rhode
Island’s freight system. This plan identifies the infrastructure used for freight and goods
movement, freight needs, state economic development goals, and the investment
strategies, policies, and data necessary to promote an efficient, reliable, and safe
freight transportation network.
The Rhode Island Freight Plan is a stand-alone document, but it builds upon previous
planning documents including the State Rail Plan, Statewide Transportation
Improvement Plan (STIP), RhodeWorks, the Rhode Island Department of Transportation’s
10 Year Plan, State Economic Development Plan, State of Rhode Island Airport System
Plan, Quonset State Airport Master Plan Update, and other planning efforts. The Freight
Plan establishes specific goals for freight transportation and addresses freight issues that
are not covered in other statewide planning documents.
The purpose of the Rhode Island Freight Plan is to inform agency representatives on the
current condition and ongoing trends related to Rhode Island’s freight network; to
identify needs, gaps and inefficiencies; to offer preliminary recommendations, and to
present an implementation plan that reflects fiscal constraints and stakeholder priorities.
1.1.1 Consistency with FAST Act Requirements
The Rhode Island Freight Plan is organized to fulfill the federal requirement to develop a
statewide freight plan that meets all the elements, national goals, and requirements of
the Fixing America’s Surface Transportation (FAST) Act, enacted in 2015.
Each freight plan must provide a comprehensive plan for the immediate and long-
range planning activities and investments of the state with respect to freight. At a
minimum, a State Freight Plan shall:
Identify significant freight system trends, needs, and issues with respect to the
state;
Describe the freight policies, strategies, and performance measures that will
guide the freight-related transportation investment decisions of the state; List critical freight facilities and corridors
Describe how the plan will improve the ability of the state to meet the national
multimodal freight policy goals and the national highway freight program goals
Describe how innovative technologies and operational strategies, including
freight intelligent transportation systems, that improve the safety and efficiency
of freight movement, were considered;
Inventory facilities with freight mobility issues, such as bottlenecks, within the
state, and for those facilities that are state owned or operated, a description of
the strategies the state is employing to address the freight mobility issues;
2 | P a g e
F R E I G H T F O R W A R D :
S T A T E O F R H O D E I S L A N D F R E I G H T A N D G O O D S M O V E M E N T P L A N
Consider any significant congestion or delay caused by freight movements and
any strategies to mitigate that congestion or delay;
Include a freight investment plan that includes a list of priority projects and
describes how funds made available the National Highway Freight Program
would be invested and matched;
Be developed in consultation with the state freight advisory committee.
Although it builds upon consistent themes and strategies presented in Rhode Island’s
Long Range Transportation Plan, the Rhode Island Freight Plan is an independent stand-
alone document that sets short-, medium-, and long-term freight investment priorities
and includes a fiscally-constrained strategic investment plan.
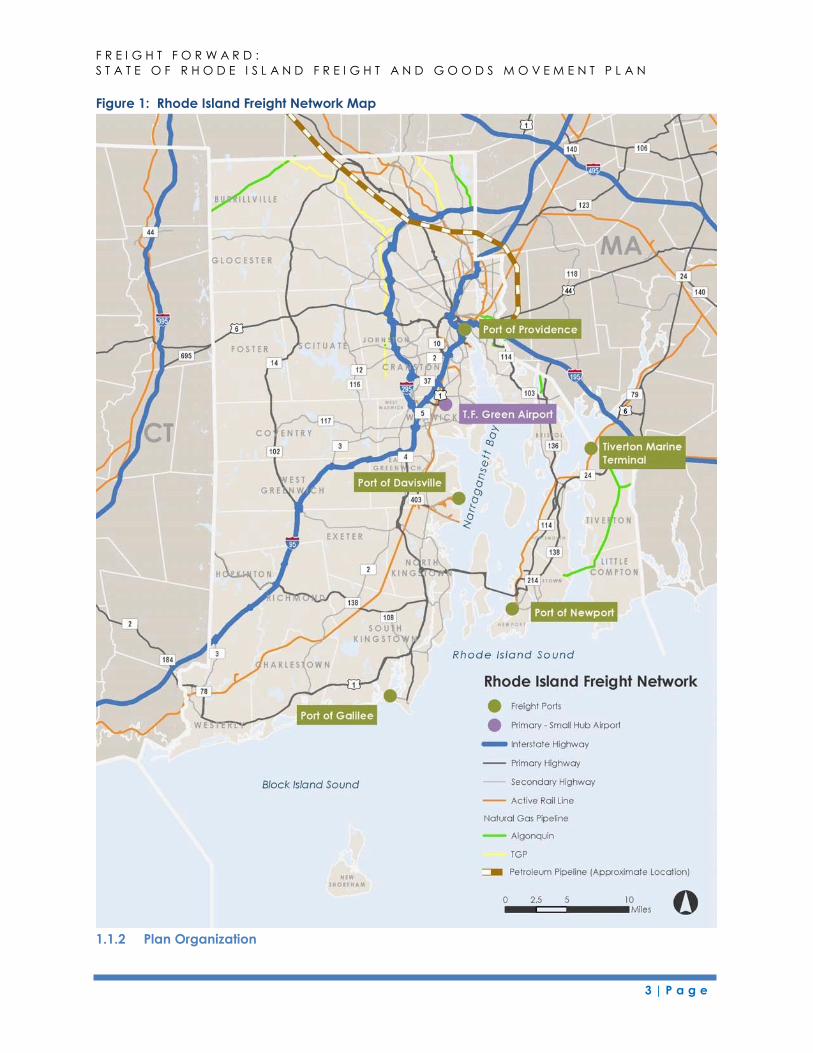
The plan focuses on Rhode Island’s freight network, which includes roadway, railroad,
airport, marine port, and pipeline infrastructure. The following map shows these freight
facilities.
3 | P a g e
F R E I G H T F O R W A R D :
S T A T E O F R H O D E I S L A N D F R E I G H T A N D G O O D S M O V E M E N T P L A N
Figure 1: Rhode Island Freight Network Map
1.1.2 Plan Organization
4 | P a g e
F R E I G H T F O R W A R D :
S T A T E O F R H O D E I S L A N D F R E I G H T A N D G O O D S M O V E M E N T P L A N
Consistent with the MAP-21 and FAST Act required elements and recommended
sections, the Rhode Island Freight Plan is organized as follows:
1. About the Plan – Summarizes plan content, stakeholder and public involvement,
and communication strategy.
2. Rhode Island Strategic Freight Goals – Identifies Rhode Island’s strategic freight
goals and describes how the Rhode Island Freight Plan meets the national
multimodal freight policy goals.
3. Economic Context of Freight Transportation Planning – Explains the role that
freight plays in Rhode Island’s economy, defines the industries that are important
to the state, and describes these industries’ supply chains.
4. State Freight Transportation Assets – Inventories the state’s current freight
transportation assets, including critical facilities and corridors (e.g., rural and
urban), and identifies facilities with freight mobility challenges.
5. Freight Policies, Strategies and Institutions – Discusses the state’s freight policies
and strategies that will guide freight-related transportation investment decisions.
6. Conditions and Performance of the State’s Freight Transportation System –
Discusses performance measures that support freight-related transportation
investment decisions and analyzes the conditions and performance of the
state’s freight transportation system.
7. Freight Forecast – Includes a 20-year freight forecast of freight demand by mode
and commodity and also shows inbound, outbound, and through flows of freight.
8. Trends, Needs & Issues – Identifies significant freight system trends, needs, and
issues and discusses how emerging trends make those needs and issues more
significant.
9. Strengths and Problems of the State’s Freight Transport System – Analyzes the
strengths of the state’s freight system and identifies the challenges that the state
wishes to address.
10. The State’s Decision Making Process – Describes the state’s process for identifying
freight transportation improvements and discusses the state’s decision-making
process regarding freight transportation improvements, coordination with the
Freight Advisory Committee, and the public outreach process.
11. The State’s Freight Improvement Strategy – Describes the state’s strategies,
projects, and policies related to freight investment and the rankings of freight
improvements and priorities. Describes how innovative technologies and
operational strategies have been considered, the strategies to be employed to
address identified bottlenecks, and how the freight plan will improve the state’s
ability to meet national multimodal freight goals.
12. Implementation Plan – Includes/summarizes a comprehensive implementation
plan showing short-term (or fiscally constrained) and long-term strategies and
funding mechanisms for projects.
1.2 Freight Committees
As encouraged by both MAP-21 and the FAST Act of 2015 (49 USC 70201) the state
organized a Freight Advisory Committee (FAC), comprised of public officials, business
representatives, and freight operators. Quarterly meetings were held throughout the
5 | P a g e
F R E I G H T F O R W A R D :
S T A T E O F R H O D E I S L A N D F R E I G H T A N D G O O D S M O V E M E N T P L A N
freight planning process to update the Committee on the plan’s progress, interim
findings, and to-date recommendations. In 2016 the state will establish the Freight
Advisory Committee formally. The Committee is presently made up of public and
private-sector stakeholders, freight operators, a municipality and other entities
supporting the local logistics and manufacturing sectors. Efforts to expand the
Committee’s membership and diversity will continue, and it will continue to serve as a
forum for discussion on freight mobility, advise the state on freight issues, needs and
priorities, and support the development of current and future State Freight Plans.
Membership of the FAC includes the following agencies and entities:
Rhode Island Department of Transportation
Rhode Island Division of Planning
Rhode Island Airport Corporation
Commerce RI
Quonset Development Corporation
Rhode Island Resource Recovery Corporation
Rhode Island Emergency Management Agency
Federal Motor Carrier Safety Administration
Federal Highway Administration
City of Providence
Rhode Island Trucking Association
Bryant University
University of Rhode Island
Providence & Worcester Railroad Company
Moran Shipping
Waterson Terminal Services/ProvPort
A subgroup of the FAC was assembled as a freight planning steering committee. The
intent of this steering committee was to consider freight goals and objectives, identify
freight investment priorities, consider performance metrics for each freight
transportation mode, solicit general input on freight transportation in the state, and
ensure that freight interests were a key part of the freight planning effort. The steering
committee held monthly meetings at which it provided technical guidance on the
plan.
1.3 Public Involvement
Over the course of the planning process, the state conducted stakeholder outreach to
learn the perspectives of different freight operators and modes, different industries,
policy makers and regulators, and the general public. This input was critical in providing
the study team with a better understanding of the demand for goods movement in
Rhode Island, as well as the challenges and opportunities related to local freight
logistics.
As part of the outreach completed during plan development, the following activities or
meetings were held:
6 | P a g e
F R E I G H T F O R W A R D :
S T A T E O F R H O D E I S L A N D F R E I G H T A N D G O O D S M O V E M E N T P L A N
Public meetings. Two public meetings were held during the freight planning
process. The purpose was three-fold: 1) to inform the public of the importance of
freight planning in the state; 2) to discuss the purpose of the freight planning effort
and its role in setting federal priorities; and, 3) to gain input on proposed priorities
for investments, policy recommendations, and other key freight mobility
strategies.
Stakeholder interviews. The study team conducted a total of 21 stakeholder
interviews between January and June 2015, either in person or by telephone. The
purpose of these interviews was to learn more about local freight logistics and the
issues and concerns facing individual stakeholders in Rhode Island.
Focus groups. A number of local industry groups and associations support and
advocate for ongoing investment in Rhode Island’s freight infrastructure and a
regulatory environment to support the efficient flow of goods. Early on in the
planning process, the team led three focus group discussions with individuals
representing key segments of the Rhode Island freight and logistics industry.
These focus groups were designed to generate broad discussion from attendees
with close knowledge of a specific topic area. A second round of focus groups
was held toward the end of the planning effort to share key findings, identified
investment priorities, and other issues of interest to these important stakeholders.
Surveys. Three online surveys were conducted to better understand the daily
operations and concerns of specific groups. Survey recipients were the Rhode
Island Trucking Association, Rhode Island Hospitality Association, and municipal
planning representatives from Rhode Island communities.
Participation at industry events. The study team attended World Trade Day at
Bryant University (May 20, 2015). This large regional exposition was attended by
more than 600 industry leaders involved in global logistics. Study team members
participated in a panel on regional freight planning strategies, and sponsored a
booth to inform attendees about Rhode Island’s freight planning initiatives.
More information on the stakeholder outreach completed during the planning process
is detailed in the Appendix of this plan in the Stakeholder Outreach Summary Report.
1.4 Communication
Communication with the public was maintained throughout the freight planning
process. Communication strategies are outlined below.
1.4.1 Presentation Development
The Project Team developed presentations for Statewide Planning to use for ad-hoc
presentations, FAC meetings, and meetings with other interested parties. Presentations
generally included:
Study introduction
Preliminary findings /analysis results
Upcoming freight planning activities
Freight issues
7 | P a g e
F R E I G H T F O R W A R D :
S T A T E O F R H O D E I S L A N D F R E I G H T A N D G O O D S M O V E M E N T P L A N
1.4.2 Project Website
A Project website was established and served as the primary vehicle for overall public
outreach and education.
The website hosts all technical content, project materials, and other information
available for public review.
The Project website provides relevant news articles, an opportunity to join the mailing
list, and an online comment form. Additionally, social media share links were provided
on the Project website to share Project information with their social networks.
1.4.3 Meeting Notifications
The following outreach methods were used to notify the public of Project updates and
public outreach meetings:
Email Invitation
Posting on Rhode Island Secretary of state’s open meeting portal
Social Media
Project Website
Press Release/Media Advisory
8 | P a g e
F R E I G H T F O R W A R D :
S T A T E O F R H O D E I S L A N D F R E I G H T A N D G O O D S M O V E M E N T P L A N
2 RHODE ISLAND STRATEGIC FREIGHT GOALS
The Rhode Island Division of Planning and the Rhode Island Department of
Transportation have led the development of Freight Forward: State of Rhode Island
Freight and Goods Movement Plan to ensure that the freight transportation system in
Rhode Island supports and enhances trade and economic growth, while maintaining
operational efficiency, safety, and connectivity for the state’s residents and businesses.
As described in the previous chapter, this plan is organized to fulfill the federal
requirements to develop a statewide freight plan that meets all of the elements,
national goals, and requirements of the Moving Ahead for Progress in the 21st Century
Act (MAP-21), enacted in 2012. This plan also supports the freight goals identified by
state during the development of this plan, and it meets the expectations of state freight
planning in the Fixing America’s Surface Transportation (FAST) Act, enacted in 2015. This
chapter outlines the national freight goals, the State of Rhode Island’s freight goals, and
how the federal and state goals align.
2.1 National Freight Goals
As set forth in Section 167 of Title 23 of the United States Code, the goals of the national
freight policy are:
1. To identify infrastructure improvements, policies, and operational innovations that:
strengthen the contribution of the national freight network to the economic competitiveness
of the United States; reduce congestion and eliminate bottlenecks on the National
Multimodal Freight Network; and increase productivity, particularly for domestic industries
and businesses that create high value jobs;
2. To improve the safety, security, and resilience of freight transportation;
3. To achieve and maintain a state of good repair on the National Multimodal Freight Network;
4. To use innovation and advanced technology to improve the safety, efficiency, and reliability
of the National Multimodal Freight Network;
5. To improve the economic efficiency and productivity of the National Multimodal Freight
Network;
6. To improve the reliability of freight transportation
7. To improve the short- and long-distance movement of goods that: travel across rural areas
between population centers, travel between rural areas and population centers, and travel
from the Nation’s ports, airports and gateways to the National Multimodal Freight Network
8. To improve the flexibility of States to support multi-State corridor planning and the creation of
multi-State organizations to increase the ability of States to address multimodal freight
connectivity
9. To reduce the adverse environmental impacts of freight movement on the National
Multimodal Freight Network; and
10. To pursue the goals described I this subsection in a manner that is not burdensome to State
and local governments.
9 | P a g e
F R E I G H T F O R W A R D :
S T A T E O F R H O D E I S L A N D F R E I G H T A N D G O O D S M O V E M E N T P L A N
2.2 Rhode Island Freight Goals
Establishing the freight plan’s goals and objectives was a collaborative effort involving
Rhode Island Statewide Planning and the Freight Plan Steering Committee. Based on
the Division of Planning’s previous transportation studies, freight plans of other states,
and other studies and information of relevance, goals and objectives were developed
based on freight transportation needs. In addition to meeting the needs of the
statewide freight network, the goals needed to align with other statewide transportation
goals and with the national freight goals identified in FAST-Act as listed in Section 2.1.
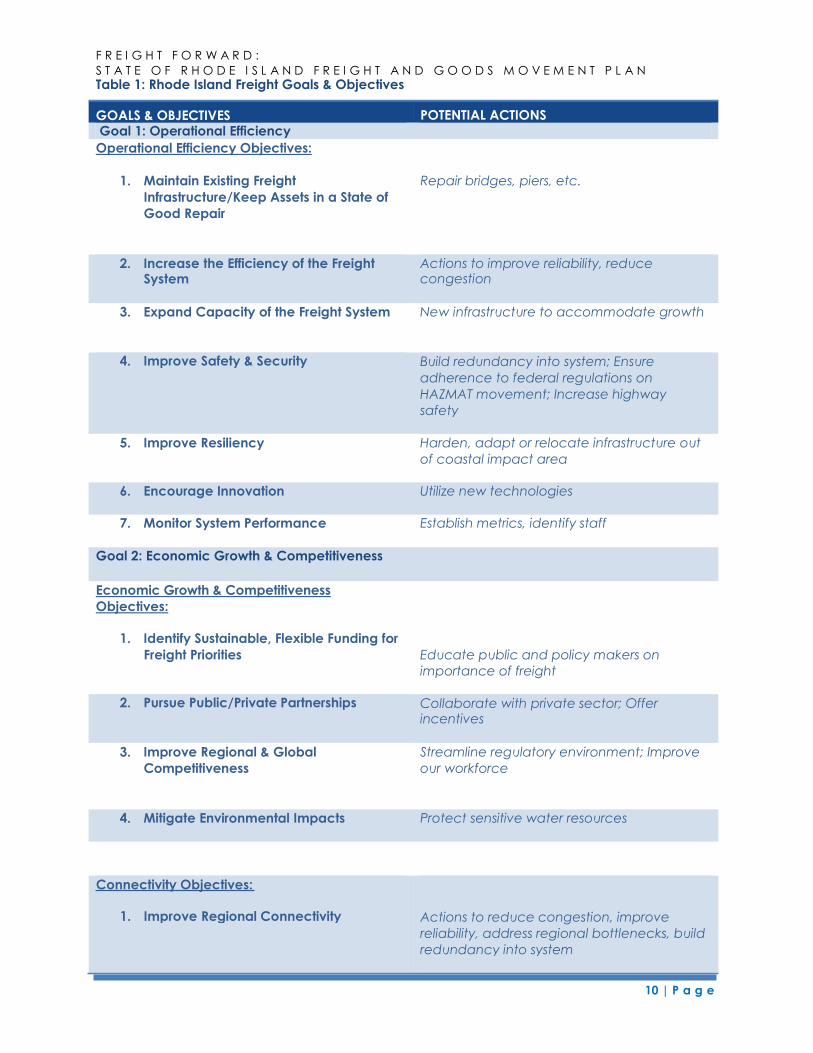
Three overarching goals have been established for Freight Forward: State of Rhode
Island Freight and Goods Movement Plan. Within each goal, a number of objectives
have been identified. For each objective, a set of potential actions is also provided.
Table 1 presents the goals, objectives and associated actions.
2.2.1 Operational Efficiency
Improvements in operational efficiency will ensure that sufficient freight transportation
capacity exists to support economic growth and the safe and secure flow of traffic
throughout the state. Better operational efficiency also enhances reliability for all users
of the Rhode Island’s transportation system, including freight carriers. Operational
efficiency also mitigates potential environmental impacts by reducing emissions
produced by idling traffic on the state’s roadways. This Rhode Island goal supports a
number of national freight goals, including state of good repair, preservation and
enhancement of safety and security.
2.2.2 Economic Growth/Competitiveness
The plan seeks to support economic growth/competitiveness in Rhode Island through
strategic improvements to the freight system that are supported by predictable and
flexible funding, partnerships with the private sector, and a streamlined regulatory
environment. An adequately funded freight transportation system can provide
enhanced efficiency and reliability, potentially reducing transportation costs for
businesses that move freight. Additionally, policies that support preservation of industrial
land may encourage expansion of existing businesses and attract new businesses to the
state.
2.2.3 Connectivity
The plan seeks to improve connectivity through policies and strategic investments that
reduce congestion and increase reliability on the state’s roadways and its rail, marine,
air, and intermodal systems. Improved connectivity for each of these modes, as well as
between these modes, supports the more efficient movement of freight in Rhode
Island.
The following table presents the goals of Operational Efficiency, Economic
Growth/Competitiveness, and Connectivity. For each goal, specific objectives are
provided. Example action items intended to support the achievement of each goal are
also presented.
10 | P a g e
F R E I G H T F O R W A R D :
S T A T E O F R H O D E I S L A N D F R E I G H T A N D G O O D S M O V E M E N T P L A N
Table 1: Rhode Island Freight Goals & Objectives
Operational Efficiency Objectives:
1. Maintain Existing Freight
Infrastructure/Keep Assets in a State of
Good Repair
Repair bridges, piers, etc.
3. Expand Capacity of the Freight System New infrastructure to accommodate growth
5. Improve Resiliency Harden, adapt or relocate infrastructure out
of coastal impact area
7. Monitor System Performance Establish metrics, identify staff
Economic Growth & Competitiveness
Objectives:
1. Identify Sustainable, Flexible Funding for
Freight Priorities Educate public and policy makers on
importance of freight
3. Improve Regional & Global
Competitiveness
Streamline regulatory environment; Improve
our workforce
GOALS & OBJECTIVES Goal 1: Operational Efficiency
POTENTIAL ACTIONS
2. Increase the Efficiency of the Freight System
Actions to improve reliability, reduce congestion
4. Improve Safety & Security Build redundancy into system; Ensure
adherence to federal regulations on
HAZMAT movement; Increase highway
safety
6. Encourage Innovation Utilize new technologies
Goal 2: Economic Growth & Competitiveness
2. Pursue Public/Private Partnerships Collaborate with private sector; Offer incentives
4. Mitigate Environmental Impacts Protect sensitive water resources
Connectivity Objectives:
1. Improve Regional Connectivity Actions to reduce congestion, improve
reliability, address regional bottlenecks, build
redundancy into system
11 | P a g e
F R E I G H T F O R W A R D :
S T A T E O F R H O D E I S L A N D F R E I G H T A N D G O O D S M O V E M E N T P L A N
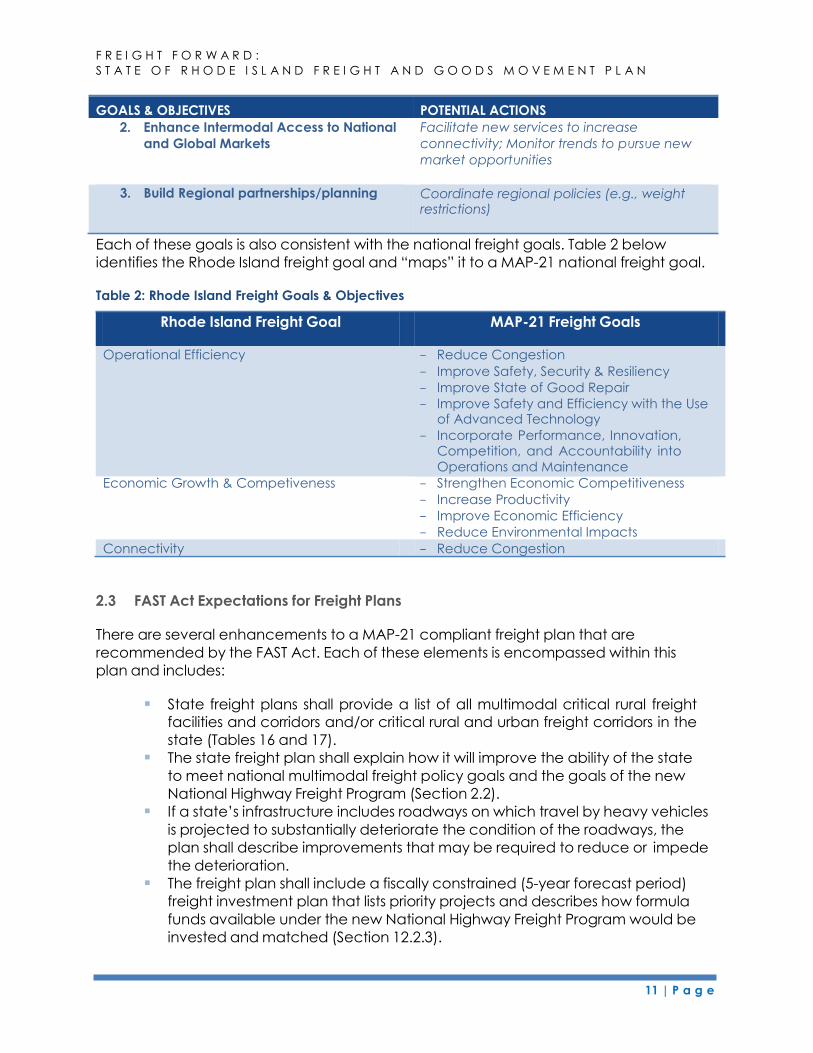
2. Enhance Intermodal Access to National
and Global Markets
Facilitate new services to increase
connectivity; Monitor trends to pursue new
market opportunities
Each of these goals is also consistent with the national freight goals. Table 2 below
identifies the Rhode Island freight goal and “maps” it to a MAP-21 national freight goal.
Table 2: Rhode Island Freight Goals & Objectives
Rhode Island Freight Goal MAP-21 Freight Goals
Operational Efficiency - Reduce Congestion
- Improve Safety, Security & Resiliency
- Improve State of Good Repair
- Improve Safety and Efficiency with the Use of Advanced Technology
- Incorporate Performance, Innovation, Competition, and Accountability into Operations and Maintenance
Economic Growth & Competiveness - Strengthen Economic Competitiveness
- Increase Productivity
- Improve Economic Efficiency
- Reduce Environmental Impacts
Connectivity - Reduce Congestion
2.3 FAST Act Expectations for Freight Plans
There are several enhancements to a MAP-21 compliant freight plan that are
recommended by the FAST Act. Each of these elements is encompassed within this
plan and includes:
State freight plans shall provide a list of all multimodal critical rural freight
facilities and corridors and/or critical rural and urban freight corridors in the
state (Tables 16 and 17).
The state freight plan shall explain how it will improve the ability of the state
to meet national multimodal freight policy goals and the goals of the new
National Highway Freight Program (Section 2.2).
If a state’s infrastructure includes roadways on which travel by heavy vehicles
is projected to substantially deteriorate the condition of the roadways, the
plan shall describe improvements that may be required to reduce or impede
the deterioration.
The freight plan shall include a fiscally constrained (5-year forecast period)
freight investment plan that lists priority projects and describes how formula
funds available under the new National Highway Freight Program would be
invested and matched (Section 12.2.3).
GOALS & OBJECTIVES POTENTIAL ACTIONS
3. Build Regional partnerships/planning Coordinate regional policies (e.g., weight restrictions)
12 | P a g e
F R E I G H T F O R W A R D :
S T A T E O F R H O D E I S L A N D F R E I G H T A N D G O O D S M O V E M E N T P L A N
3 ECONOMIC CONTEXT OF FREIGHT TRANSPORTATION PLANNING
3.1 Introduction
This chapter discusses the economic context of freight in the state, and it articulates the
importance of the freight transportation system to the well being of Rhode Island, a fact
not always well-understood by the public.
Rhode Island’s roads, railroads, ports, airports, pipeline, and other intermodal facilities
underlie the freight transportation system, helping to move goods into, out of, within,
and through the state each day. From an economic context, the freight transportation
system:
Supports the delivery of necessities of life to Rhode Island residents every day,
connecting consumers to suppliers of goods and services; Provides thousands of jobs in Rhode Island;
Provides links to regional economies; and
Connects the state to a larger global network.
This chapter provides a context for freight’s contribution to the state’s economy by
reviewing the overall Rhode Island economy and freight’s share of it, based on a
variety of data sources. It also describes some of the key commodities moved to, from,
and through the state.
3.2 Economic Development Plan and Freight
In the fall of 2015, the Metropolitan Policy Program at Brookings developed a new
competitive strategy for the State of Rhode Island. The study findings suggest that
Rhode Island should embark on a three-part strategy to strengthen its advanced
industries and improve its statewide platform for growth. It highlighted Transportation,
Logistics and Distribution as a potential growth opportunity for the state, focusing on
niche import/export and distribution specialties at Ports of Providence and Quonset. A
strong freight transportation network is necessary to support this growth opportunity.
Without it, freight can be delayed, reliability may be uncertain, and companies that
ship freight into, out of, through and within Rhode Island are likely to have higher
transportation costs. Higher costs to ship goods may affect Rhode Island’s
competitiveness and lead to higher end-user costs.
As this freight plan highlights, Rhode Island has improved its freight transportation system
over the past decade. In 2016, the state enacted RhodeWorks, a plan to boost state
revenues emphasizing road and bridge maintenance that will allow the state to bring its
bridges to 90 percent sufficiency within ten years. It has also, in recent years, expanded
freight rail capacity along the Northeast Corridor (NEC) line to improve the movement of
goods, and has made significant land and water-side investments at the Port of
Davisville. The plan recommends activities that could support freight transportation,
including workforce training, a major issue for the trucking industry, which is experiencing
a national shortage of truck drivers for longer haul routes. The plan also discusses
the importance of marine infrastructure and the state’s ports, all of which are
13 | P a g e
F R E I G H T F O R W A R D :
S T A T E O F R H O D E I S L A N D F R E I G H T A N D G O O D S M O V E M E N T P L A N
part of the overall freight transportation system and are assets that can be leveraged
for future growth.
3.3 Freight Benefits to the State of Rhode Island
An efficient, safe freight transportation network provides specific benefits to residents
and businesses in Rhode Island. The following section discusses four of the primary
benefits.
3.3.1 Connects Consumers to Suppliers
Rhode Island’s freight distribution system is fundamentally important to Rhode Island
residents and businesses. It facilitates the movement of all types of commodities,
including home heating oil, food, clothing, production inputs, and nearly everything
else businesses and consumers use on a daily basis. Most of these products are not
made locally; they must be transported into the state either from elsewhere in the
United States or from outside the country. In 2014, Rhode Island imports totaled $8.35
billion, and exports were $2.4 billion; exports included waste and scrap, chemicals,
primary metal, and other products. 1 Ensuring that the freight transportation system in
Rhode Island is sufficient to support the movement of these and other goods is critical
to the state’s economy. For Rhode Island to be economically competitive, businesses
must be able to receive and ship their products and materials efficiently and cost
effectively.
If roadways and other freight facilities are not maintained in a state of good repair and
improved to accommodate growing traffic, businesses will find it more expensive to ship
their goods into and out of the state. Congested roads mean longer travel times for
truckers. Inefficient marine and aviation facilities force shippers to use other ports and
airports, potentially adding to the time needed for businesses to receive supplies and
residents to obtain goods. Added transportation time for goods and materials increases
the cost to move freight from point A to point B. An inadequate freight network can
increase the cost of doing business in Rhode Island. It also has implications for Rhode
Island residents in need of basic necessities; increased transportation costs to companies
doing business in the state may translate into higher prices for Rhode Island residents.
Congestion may be an indicator of a vibrant economy with businesses shipping and
people traveling to their jobs, but studies suggest that congestion affects the economy
1 International Trade Administration, Rhode Island Exports, Jobs, and Foreign Investment, 2013,
http://www.trade.gov/mas/ian/statereports/states/ri.pdf and https://www.census.gov/foreign-
trade/statistics/state/data/ri.html

14 | P a g e
F R E I G H T F O R W A R D :
S T A T E O F R H O D E I S L A N D F R E I G H T A N D G O O D S M O V E M E N T P L A N
by slowing job growth after a certain level is reached. The Texas Transportation Institute
estimates that, in 2011, congestion in 498 metropolitan areas resulted in urban
Americans traveling 5.5 billion additional hours and purchasing an extra 2.9 billion
gallons of fuel for a congestion cost of $121 billion. On average, Providence area
commuters were delayed 30 hours in 2011. The national average for large cities is 37
hours.2
Roadway congestion is expected to increase, particularly in the heavily traveled
Northeast Region, and nationally, the volume of highway freight movement alone is
forecast to nearly double by 2020.3 Although congestion is typically considered a
problem in bigger cities such as Providence, delays are becoming increasingly
common in small cities and some rural areas as well. A strong freight transportation
network can help mitigate some of these congestion costs for Rhode Island residents
and businesses.
3.3.2 Supports Jobs
Rhode Island’s freight network supports thousands of jobs in the state, either directly
through jobs in trucking and warehousing or indirectly through the support it provides for
the healthcare, tourism, and other service sectors of the economy. According to the
Rhode Island Department of Labor and Training, there were 494,130 employees in the
state in 2012. Freight-dependent industries, which are traditionally defined as
Transportation and Warehousing, Wholesale and Retail Trade, Manufacturing,
Construction, Mining, and Agriculture/Timber and Wood Products, represented more
than 130,000 employees, or 26 percent of total Rhode Island employment.4 Table 3
presents employment by industry today and forecast employment for 2022. Industries
bolded in the table are traditionally considered “freight dependent.”
Although 71.76 percent of freight in Rhode Island was moved by truck in 2013,5 the
Transportation and Warehousing industry, which includes trucking, accounts for fewer
than 10,000 employees. Despite trucking’s small share of the overall employment
picture, the industry is made up of many small, independent businesses, which are
critically important to the Rhode Island’s economy. As of May 2013, there were 2,780
trucking companies in the state, many of which were small- to medium-sized
businesses.6 The trucking industry represents an opportunity for growth; currently there is
2 “2012 Urban Mobility Report,” Texas Transportation Institute. 3 Federal Highway Administration, Focus on Congestion Relief, http://www.fhwa.dot.gov/congestion/. 4 Rhode Island Department of Labor and Training, http://www.dlt.ri.gov/lmi/proj/majorindproj.htm 5 IHS Report, Rhode Island: Truck Commodity Flows and Forecasts 6 American Transportation Research Institute (ATRI) and the Rhode Island Trucking Association “Fast Facts.”
15 | P a g e
F R E I G H T F O R W A R D :
S T A T E O F R H O D E I S L A N D F R E I G H T A N D G O O D S M O V E M E N T P L A N
a truck driver shortage, particularly for longer haul routes. As freight transport continues
to grow, the demand for drivers is likely to increase as well.
Manufacturing, once a mainstay of Rhode Island’s economy, and an important freight-
dependent sector has declined significantly. Hurt by the shifts in the US economy and
the Great Recession, Rhode Island’s manufacturing sector lost more than 21,000 jobs in
the past decade.7 In 2012, the industry accounted for eight percent of employment or
39,623 jobs in the state. Despite the losses, the trend toward re-shoring for some
manufacturers offers an opportunity for the state to recapture a share of this important
industry.
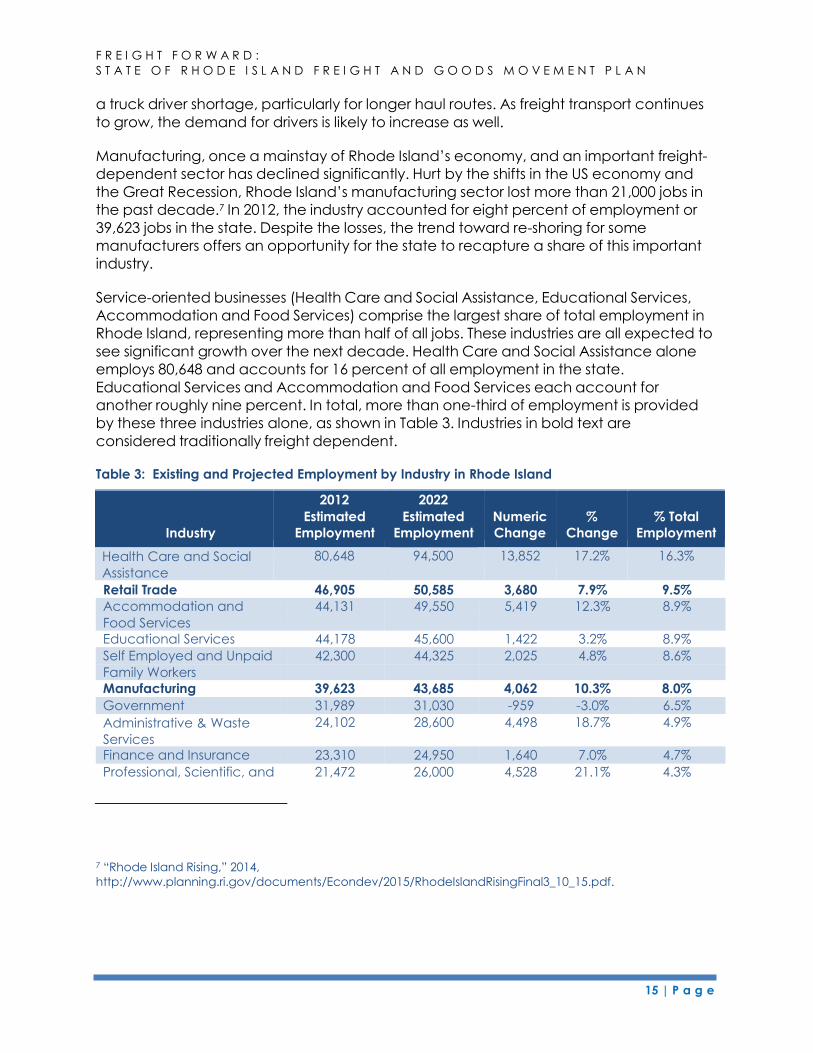
Service-oriented businesses (Health Care and Social Assistance, Educational Services,
Accommodation and Food Services) comprise the largest share of total employment in
Rhode Island, representing more than half of all jobs. These industries are all expected to
see significant growth over the next decade. Health Care and Social Assistance alone
employs 80,648 and accounts for 16 percent of all employment in the state.
Educational Services and Accommodation and Food Services each account for
another roughly nine percent. In total, more than one-third of employment is provided
by these three industries alone, as shown in Table 3. Industries in bold text are
considered traditionally freight dependent.
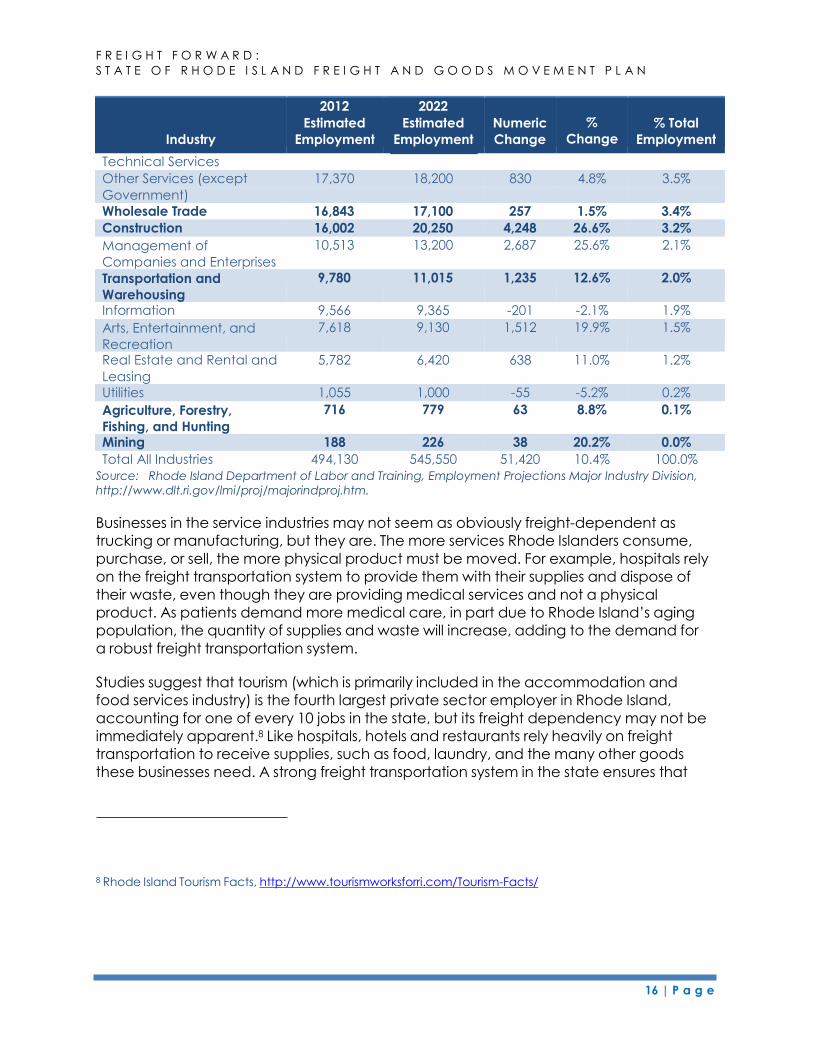
Table 3: Existing and Projected Employment by Industry in Rhode Island
Retail Trade 46,905 50,585 3,680 7.9% 9.5%
Accommodation and 44,131 49,550 5,419 12.3% 8.9%
Food Services Educational Services 44,178 45,600 1,422 3.2% 8.9%
Self Employed and Unpaid 42,300 44,325 2,025 4.8% 8.6%
Family Workers Manufacturing 39,623 43,685 4,062 10.3% 8.0%
Government 31,989 31,030 -959 -3.0% 6.5%
Administrative & Waste
Services
24,102 28,600 4,498 18.7% 4.9%
Finance and Insurance 23,310 24,950 1,640 7.0% 4.7%
Professional, Scientific, and 21,472 26,000 4,528 21.1% 4.3%
7 “Rhode Island Rising,” 2014,
http://www.planning.ri.gov/documents/Econdev/2015/RhodeIslandRisingFinal3_10_15.pdf.
Industry
2012
Estimated
Employment
2022
Estimated
Employment
Numeric
Change
%
Change
% Total
Employment
Health Care and Social
Assistance
80,648 94,500 13,852 17.2% 16.3%
16 | P a g e
F R E I G H T F O R W A R D :
S T A T E O F R H O D E I S L A N D F R E I G H T A N D G O O D S M O V E M E N T P L A N
Industry
2012
Estimated
Employment
2022
Estimated
Employment
Numeric
Change
%
Change
% Total
Employment
Technical Services Other Services (except 17,370 18,200 830 4.8% 3.5%
Government) Wholesale Trade 16,843 17,100 257 1.5% 3.4%
Construction 16,002 20,250 4,248 26.6% 3.2%
Management of
Companies and Enterprises
10,513 13,200 2,687 25.6% 2.1%
Transportation and
Warehousing
9,780 11,015 1,235 12.6% 2.0%
Information 9,566 9,365 -201 -2.1% 1.9%
Arts, Entertainment, and
Recreation
7,618 9,130 1,512 19.9% 1.5%
Real Estate and Rental and 5,782 6,420 638 11.0% 1.2%
Leasing Utilities 1,055 1,000 -55 -5.2% 0.2%
Agriculture, Forestry,
Fishing, and Hunting
716 779 63 8.8% 0.1%
Mining 188 226 38 20.2% 0.0%
Total All Industries 494,130 545,550 51,420 10.4% 100.0%
Source: Rhode Island Department of Labor and Training, Employment Projections Major Industry Division,
http://www.dlt.ri.gov/lmi/proj/majorindproj.htm.
Businesses in the service industries may not seem as obviously freight-dependent as
trucking or manufacturing, but they are. The more services Rhode Islanders consume,
purchase, or sell, the more physical product must be moved. For example, hospitals rely
on the freight transportation system to provide them with their supplies and dispose of
their waste, even though they are providing medical services and not a physical
product. As patients demand more medical care, in part due to Rhode Island’s aging
population, the quantity of supplies and waste will increase, adding to the demand for
a robust freight transportation system.
Studies suggest that tourism (which is primarily included in the accommodation and
food services industry) is the fourth largest private sector employer in Rhode Island,
accounting for one of every 10 jobs in the state, but its freight dependency may not be
immediately apparent.8 Like hospitals, hotels and restaurants rely heavily on freight
transportation to receive supplies, such as food, laundry, and the many other goods
these businesses need. A strong freight transportation system in the state ensures that
8 Rhode Island Tourism Facts, http://www.tourismworksforri.com/Tourism-Facts/
17 | P a g e
F R E I G H T F O R W A R D :
S T A T E O F R H O D E I S L A N D F R E I G H T A N D G O O D S M O V E M E N T P L A N
businesses in the tourism industry receive deliveries in a timely manner, which helps
support and grow this vital economic driver.
As Rhode Island has moved towards a service economy, the nature of freight
movement has also changed. Traditionally, manufacturing was characterized by fairly
regular freight flows of raw materials, part-finished, and finished materials from factories
and industrial areas, moving by rail or on large trucks. Although these types of freight
flows remain important, the trend is toward more frequent, smaller shipments. In the
past, retailers and other service industry businesses typically maintained an inventory of
stock or supplies, but that is no longer the case with a shift toward “just-in-time”
shipments. Now, businesses order supplies or goods today for delivery tomorrow, and
changes in consumer shopping habits are strengthening that trend, as more people
shop online with expectations of next- or even same-day delivery. To meet customer
demands, companies are making more frequent, smaller volume, and less efficient
deliveries in residential and other areas not typically served by trucks.
Based on Rhode Island Department of Labor and Training data, Rhode Island
employment is expected to increase across all industries, by more than 51,000 jobs
during the 2012-2022 projection period, as the state’s economy continues to recover
from recessionary losses. Employment in 2022 is projected to reach 545,550, an increase
of 10.4 percent from the 2012 employment level. Much of this growth is attributed to the
increased demand for the products and services provided by the Health Care and
Social Assistance; Accommodation and Food Services; Professional, Scientific, and
Technical Services; Administrative and Waste Services; Construction; and Manufacturing
sectors. Nationally, employment is projected to increase by 10.8 percent,9
similar to Rhode Island’s anticipated growth rate. Making sure that the freight
transportation system can accommodate this anticipated growth in the state will be
important to ensure that employment in these industries grows as the projections
suggest they will.
The unemployment rate in Rhode Island increased significantly between 2007 and 2010,
based on US Bureau of Labor Statistics, but the state’s economy appears to be
recovering with the unemployment rate dropping over the past few years from a high
of 11.3 percent in 2009 to 5.4 percent in 2015. In the United States, the unemployment
rate is presently 4.9 percent.10 As unemployment continues to decrease nationally and
in the state, it should be expected that the demands on the state’s freight
transportation system will increase, as currently unemployed individuals are able to
9 Rhode Island Department of Labor and Training, “Labor Market Information, 2022 Industry Outlook,”
http://www.dlt.ri.gov/lmi/pdf/indoutlook.pdf 10 US Bureau of Labor Statistics, June 2016. http://www.bls.gov/news.release/pdf/empsit.pdf
18 | P a g e
F R E I G H T F O R W A R D :
S T A T E O F R H O D E I S L A N D F R E I G H T A N D G O O D S M O V E M E N T P L A N
purchase more goods and services, and businesses continue to expand to
accommodate the increased economic activity in the state.
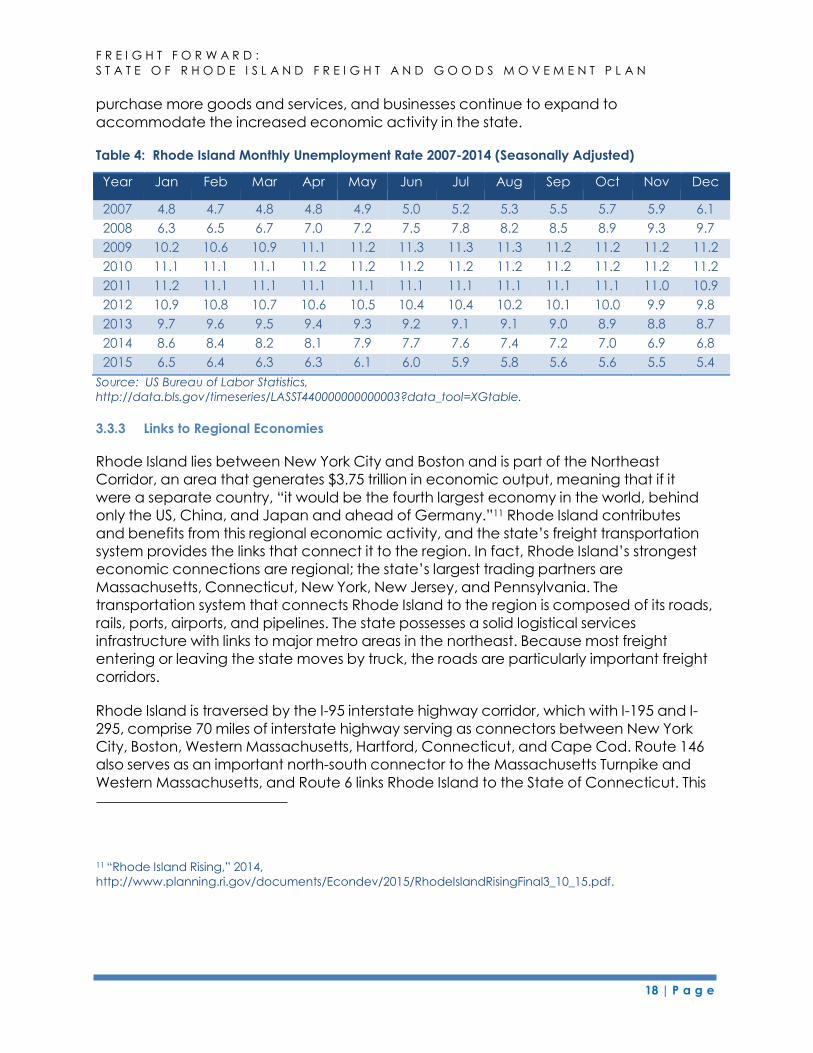
Table 4: Rhode Island Monthly Unemployment Rate 2007-2014 (Seasonally Adjusted)
Year Jan Feb Mar Apr May Jun Jul Aug Sep Oct Nov Dec
2007 4.8 4.7 4.8 4.8 4.9 5.0 5.2 5.3 5.5 5.7 5.9 6.1
2008 6.3 6.5 6.7 7.0 7.2 7.5 7.8 8.2 8.5 8.9 9.3 9.7
2009 10.2 10.6 10.9 11.1 11.2 11.3 11.3 11.3 11.2 11.2 11.2 11.2
2010 11.1 11.1 11.1 11.2 11.2 11.2 11.2 11.2 11.2 11.2 11.2 11.2
2011 11.2 11.1 11.1 11.1 11.1 11.1 11.1 11.1 11.1 11.1 11.0 10.9
2012 10.9 10.8 10.7 10.6 10.5 10.4 10.4 10.2 10.1 10.0 9.9 9.8
2013 9.7 9.6 9.5 9.4 9.3 9.2 9.1 9.1 9.0 8.9 8.8 8.7
2014 8.6 8.4 8.2 8.1 7.9 7.7 7.6 7.4 7.2 7.0 6.9 6.8
2015 6.5 6.4 6.3 6.3 6.1 6.0 5.9 5.8 5.6 5.6 5.5 5.4
Source: US Bureau of Labor Statistics,
http://data.bls.gov/timeseries/LASST440000000000003?data_tool=XGtable.
3.3.3 Links to Regional Economies
Rhode Island lies between New York City and Boston and is part of the Northeast
Corridor, an area that generates $3.75 trillion in economic output, meaning that if it
were a separate country, “it would be the fourth largest economy in the world, behind
only the US, China, and Japan and ahead of Germany.”11 Rhode Island contributes
and benefits from this regional economic activity, and the state’s freight transportation
system provides the links that connect it to the region. In fact, Rhode Island’s strongest
economic connections are regional; the state’s largest trading partners are
Massachusetts, Connecticut, New York, New Jersey, and Pennsylvania. The
transportation system that connects Rhode Island to the region is composed of its roads,
rails, ports, airports, and pipelines. The state possesses a solid logistical services
infrastructure with links to major metro areas in the northeast. Because most freight
entering or leaving the state moves by truck, the roads are particularly important freight
corridors.
Rhode Island is traversed by the I-95 interstate highway corridor, which with I-195 and I-
295, comprise 70 miles of interstate highway serving as connectors between New York
City, Boston, Western Massachusetts, Hartford, Connecticut, and Cape Cod. Route 146
also serves as an important north-south connector to the Massachusetts Turnpike and
Western Massachusetts, and Route 6 links Rhode Island to the State of Connecticut. This
11 “Rhode Island Rising,” 2014,
http://www.planning.ri.gov/documents/Econdev/2015/RhodeIslandRisingFinal3_10_15.pdf.
19 | P a g e
F R E I G H T F O R W A R D :
S T A T E O F R H O D E I S L A N D F R E I G H T A N D G O O D S M O V E M E N T P L A N
roadway system helps ensure that goods traveling throughout the region do so safely,
cost-effectively, and efficiently.
Massachusetts is by far the largest trading partner with Rhode Island for freight moved
by truck. In 2013, nearly six million tons of freight was exported to Massachusetts via
truck, representing over $6.6 billion in value. The primary commodities shipped to
Massachusetts were petroleum refining products, gravel or sand, and broken stone or
riprap. In 2013, over 4.5 million tons of freight was imported from Massachusetts via truck,
representing over $5 billion in value. The primary commodities entering Rhode Island
from Massachusetts were warehouse and distribution center,12 petroleum refining
products, and gravel or sand. In general, outbound truck freight from Rhode Island
travelled to regional destinations, and inbound freight, arrived from points across the
country. Greater detail related to these flows is provided in Chapter 7 of this plan.
A large amount of truck freight also moves through Rhode Island. These trucks use the
infrastructure in the state, but do not have an origin or destination within the state.
Although the largest share of truck traffic stays regional, trucks use the state’s
infrastructure to move freight through the entire country. The largest share of through
movements stays in the New England and Mid-Atlantic regions, with commodities
primarily moving between Connecticut and Massachusetts. Goods moving between
these two states include broken stone or riprap and petroleum refining products.
Additional detail related to these movements is provided in Chapter 7.
In 2013, all local freight and nearly all through freight in Rhode Island was transported via
truck. In that year, more than 71 percent of outbound freight weight was moved by
truck, representing over 94 percent of total freight value, and over half of inbound
freight weight was moved by truck, representing nearly 73 percent of total freight value.
Although trucking dominates freight in Rhode Island, other modes play an important role
in the regional network. The Providence & Worcester Railroad, a Class II railroad, is
the primary freight railroad in Rhode Island. It connects to all four Class 1 railroads in
New England, providing rail shipping options for Rhode Island businesses outside of the
state with a focus on bulk commodities and other heavy, non-perishable freight that can
be moved slowly.
Rhode Island has rebuilt all overhead bridges along the Providence & Worcester rail
line, allowing for future double stacking of rail containers and additional freight activity
in the state. The state’s ability to accommodate double stack containers on trains
serving major port terminals is a major competitive advantage that not all neighboring
12 Shipments by truck that originate in a warehouse, distribution center, or some type of storage facility, as
opposed to originating at the manufacturing facility. These shipments are shown as terminating at the end
user location, although they may move through additional storage facilities en route.
F R E I G H T F O R W A R D :
S T A T E O F R H O D E I S L A N D F R E I G H T A N D G O O D S M O V E M E N T P L A N
20 | P a g e
states offer. The ability to leverage this advantage fully, however, may be limited by
infrastructure in neighboring states. For example, vertical clearance on a number of
bridges in Massachusetts limits the movement of double stack rail cars to and from
Rhode Island.
In the United States, freight rail often plays a critical role in moving bulk goods long
distances. Additionally, many of the raw materials required to produce energy, supply
food, and construct buildings and infrastructure depend on rail infrastructure. Rail is often
cost prohibitive at a regional level, with more freight moving by rail to cover
longer distances where it is more cost-efficient. This holds true in Rhode Island, with rail
freight typically going to Midwest or West Coast states and coming from Midwest states.
More information related to freight rail and Rhode Island is provided in Chapter 7.
An effective way to quickly move small package mail/shipments and high value goods
that are time sensitive is through air freight shipments. Air freight is transported at T.F.
Green Airport via both FedEx and UPS air cargo operations. These companies connect
Rhode Island to the integrator’s wider domestic and global networks. The data analysis
conducted for this plan shows the shipment of specialty and heavy duty equipment, as
well as chemicals and drugs, through the airport. T.F. Green Airport also provides
important regional links to Block Island, Martha’s Vineyard, and Nantucket.
The exact origins and destinations of air cargo at a less than regional level are difficult
to track due to the hub-and-spoke operations of airlines. Hubs for Rhode Island freight
include Memphis, Fort Wayne, Indianapolis, New York, and Hartford.
Regionally, the largest share of Rhode Island outbound or inbound air freight moves
through Connecticut via Bradley International Airport. Though it may be redistributed
elsewhere, 1,101 tons worth more than $91 million in value were shipped out of Rhode
Island via Connecticut in 2013. Additionally, 2,637 tons of freight was imported from
Connecticut via air, representing $347 million in value during this same period. On a
more national level, primary trading partners include Indiana, California, Tennessee and
Florida, among others. Key commodities include mail and small packaged freight,
electric equipment, pharmaceuticals, transportation equipment, and industrial
chemicals. Detail related to air shipments is provided in Chapter 7.
The last components of freight infrastructure are marine terminals and pipelines. Rhode
Island and the Port of Providence specifically are important in the regional energy
distribution network. Statewide, two million tons are moved by pipeline into the state.
Most of what is shipped by pipeline comes from Texas, Wyoming, Oklahoma, New
Mexico, Louisiana, and Colorado.13 Rhode Island’s ports serviced more than 4.7 million
13 Federal Highway Administration Freight Analysis Framework-3, 2012 data.
F R E I G H T F O R W A R D :
S T A T E O F R H O D E I S L A N D F R E I G H T A N D G O O D S M O V E M E N T P L A N
21 | P a g e
tons of freight in 2013. Regionally, Rhode Island ships freight to Massachusetts, New York,
and Connecticut and receives large volumes from New Jersey and Delaware. Other
trading partners include South Carolina, Texas, Florida, and several Canadian provinces.
Rhode Island’s largest outbound trading partner via water is Massachusetts,
accounting for 216 thousand tons of freight valued at $235 million. The primary outbound
waterborne commodity is miscellaneous organic chemicals (e.g., ethanol or inputs
to chemical manufacturing). Rhode Island’s largest inbound trading partner for
freight moved by water is New Jersey, accounting for more than two million tons of
freight that represented over $2.2 billion in value. The largest inbound commodity to
Rhode Island is petroleum refining products, accounting for nearly 90 percent of all
inbound tonnage in 2013.
Interviews with Rhode Island businesses have revealed that the state is not the primary
point of entry for international freight coming into the state. Instead, goods are often
shipped into marine ports and airports in Boston and New York and then moved by truck
to final destinations in Rhode Island and to other areas within the northeast region.
This is an example of truck transport providing the “first” or “final” mile, whereby another
mode is the principal means of transport but nearly all commodities move via truck at
some point. Nevertheless, Rhode Island is a significant piece of the overall regional
transportation picture. For example, the Port of Providence is an important regional hub,
particularly for the state’s leading export commodity, scrap metal. This commodity
arrives from Massachusetts and Connecticut, as well as other nearby states. It is then
shipped to Canada, Turkey, China and other countries, providing regional connectivity
to the rest of the world.
3.3.4 Provides an International Gateway
Rhode Island’s freight transportation system also supports international economic
activity and provides a growing global gateway into and out of the region. For
example, companies such as Porsche, Honda, and Irving Energy, use the state’s freight
transportation facilities to import their products from outside the US. In total, Rhode
Island’s international imports and exports were $8.3 billion14 and $2.4 billion,15
respectively in 2014. The state’s largest international trading partners were Canada,
Mexico, Germany, Turkey, and China for exports.16 For imports, Germany, China,
Mexico, United Kingdom, and Canada were the top five trading partners.17
14 US Bureau of the Census, https://www.census.gov/foreign-trade/statistics/state/data/imports/ri.html 15 International Trade Administration, http://www.trade.gov/mas/ian/statereports/states/ri.pdf 16 US Bureau of the Census, https://www.census.gov/foreign-trade/statistics/state/data/imports/ri.html 17 International Trade Administration, http://www.trade.gov/mas/ian/statereports/states/ri.pdf
F R E I G H T F O R W A R D :
S T A T E O F R H O D E I S L A N D F R E I G H T A N D G O O D S M O V E M E N T P L A N
22 | P a g e
The Port of Davisville/Quonset and the Port of Providence are active, international
gateways on the state’s freight transportation network. At the Port of Davisville, no
Harbor Maintenance Tax is charged, giving the port a competitive advantage for some
freight, including automobiles. The Port of Davisville is ranked among the top ten
nationally in automobile imports, and in 2014, it imported 178,215 vehicles, up from
91,183 vehicles in 2009 (95 percent growth).18 Automobiles arrive from Japan, Germany,
and Mexico and are transported via railroad or highway to final destinations throughout
the northeast region and across North America. This global connectivity is not expected
to decline; auto imports have been steadily increasing over time and the trend is
expected to continue. In 2014, automobile import value for commercial ports in Rhode
Island reached $5.8 billion.19
Other Rhode Island international imports and exports include, chemical products, which
account for a significant share of import value, $2.5 billion in 2014 a 22 percent growth
from 2010; processed fish, project cargo, and break bulk. 20 Project cargo refers to “the
materials and equipment to assemble a special project overseas, such as a factory or
highway.” Break bulk cargo is “non-containerized general cargo stored in boxes, bales,
pallets or other units to be loaded onto or discharged from ships or other forms of
transportation.” Examples include iron, steel, machinery, linerboard and woodpulp.21
Additionally, six terminals in the state handle fuel imports of refined products. ProvPort in
Providence is connected to the rail network and ExxonMobil in East Providence
distributes fuel by pipeline to Springfield, Massachusetts. On the export side, Rhode
Island Resource Recovery ships recycled materials to Canada, China, India, and parts of
the US to re-enter the manufacturing stream.
The import-export activity at Rhode Island’s ports generates significant economic
activity for the state. Terminal services at the Port of Providence alone have resulted in
economic output of approximately $164 million for the city and $211 million for the state
since 1994. The indirect impact of this port has generated approximately $2.8 billion in
economic output for the state since 1994, with $1 billion of that occurring within the City
of Providence itself.22
In terms of import value to Rhode Island’s ports, automotive and chemical products
represent the largest share. Total value of automotive cargo has steadily increased
since 2010. Top port imports are presented in Table 5 below.
18 Quonset Development Corporation. 19 US Census Bureau’s Foreign Trade Division, USA Trade Online. 20 US Census Bureau’s Foreign Trade Division, USA Trade Online. 21 Alliance of the Ports of Canada, the Caribbean, Latin America, and the United States (AAPA),
http://www.aapa-ports.org/Industry/content.cfm?ItemNumber=1077 22 Rhode Island Freight Working Group Presentation provided by Waterson Terminal Services, March 18,
2015.
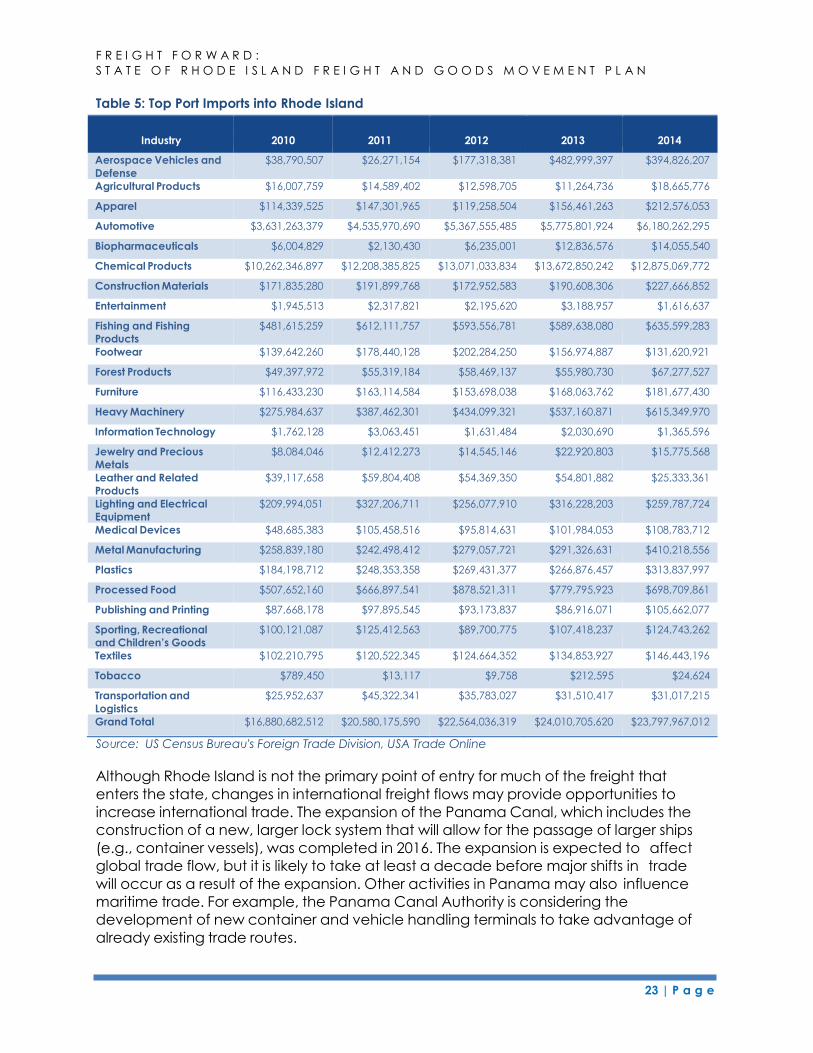
F R E I G H T F O R W A R D :
S T A T E O F R H O D E I S L A N D F R E I G H T A N D G O O D S M O V E M E N T P L A N
23 | P a g e
Table 5: Top Port Imports into Rhode Island
Industry
2010
2011
2012
2013
2014
Aerospace Vehicles and
Defense
$38,790,507 $26,271,154 $177,318,381 $482,999,397 $394,826,207
Agricultural Products $16,007,759 $14,589,402 $12,598,705 $11,264,736 $18,665,776
Apparel $114,339,525 $147,301,965 $119,258,504 $156,461,263 $212,576,053
Automotive $3,631,263,379 $4,535,970,690 $5,367,555,485 $5,775,801,924 $6,180,262,295
Biopharmaceuticals $6,004,829 $2,130,430 $6,235,001 $12,836,576 $14,055,540
Chemical Products $10,262,346,897 $12,208,385,825 $13,071,033,834 $13,672,850,242 $12,875,069,772
Construction Materials $171,835,280 $191,899,768 $172,952,583 $190,608,306 $227,666,852
Entertainment $1,945,513 $2,317,821 $2,195,620 $3,188,957 $1,616,637
Fishing and Fishing
Products
$481,615,259 $612,111,757 $593,556,781 $589,638,080 $635,599,283
Footwear $139,642,260 $178,440,128 $202,284,250 $156,974,887 $131,620,921
Forest Products $49,397,972 $55,319,184 $58,469,137 $55,980,730 $67,277,527
Furniture $116,433,230 $163,114,584 $153,698,038 $168,063,762 $181,677,430
Heavy Machinery $275,984,637 $387,462,301 $434,099,321 $537,160,871 $615,349,970
Information Technology $1,762,128 $3,063,451 $1,631,484 $2,030,690 $1,365,596
Jewelry and Precious
Metals
$8,084,046 $12,412,273 $14,545,146 $22,920,803 $15,775,568
Leather and Related
Products
$39,117,658 $59,804,408 $54,369,350 $54,801,882 $25,333,361
Lighting and Electrical
Equipment
$209,994,051 $327,206,711 $256,077,910 $316,228,203 $259,787,724
Medical Devices $48,685,383 $105,458,516 $95,814,631 $101,984,053 $108,783,712
Metal Manufacturing $258,839,180 $242,498,412 $279,057,721 $291,326,631 $410,218,556
Plastics $184,198,712 $248,353,358 $269,431,377 $266,876,457 $313,837,997
Processed Food $507,652,160 $666,897,541 $878,521,311 $779,795,923 $698,709,861
Publishing and Printing $87,668,178 $97,895,545 $93,173,837 $86,916,071 $105,662,077
Sporting, Recreational
and Children’s Goods
$100,121,087 $125,412,563 $89,700,775 $107,418,237 $124,743,262
Textiles $102,210,795 $120,522,345 $124,664,352 $134,853,927 $146,443,196
Tobacco $789,450 $13,117 $9,758 $212,595 $24,624
Transportation and
Logistics
$25,952,637 $45,322,341 $35,783,027 $31,510,417 $31,017,215
Grand Total $16,880,682,512 $20,580,175,590 $22,564,036,319 $24,010,705,620 $23,797,967,012
Source: US Census Bureau's Foreign Trade Division, USA Trade Online
Although Rhode Island is not the primary point of entry for much of the freight that
enters the state, changes in international freight flows may provide opportunities to
increase international trade. The expansion of the Panama Canal, which includes the
construction of a new, larger lock system that will allow for the passage of larger ships
(e.g., container vessels), was completed in 2016. The expansion is expected to affect
global trade flow, but it is likely to take at least a decade before major shifts in trade
will occur as a result of the expansion. Other activities in Panama may also influence
maritime trade. For example, the Panama Canal Authority is considering the
development of new container and vehicle handling terminals to take advantage of
already existing trade routes.
F R E I G H T F O R W A R D :
S T A T E O F R H O D E I S L A N D F R E I G H T A N D G O O D S M O V E M E N T P L A N
24 | P a g e
As larger ships are able to transit the Panama Canal, existing ships may be redeployed
to regional markets. In addition, large megaship building is being matched by major
ocean carriers that are building small- and mid-sized vessels to serve smaller ports and
markets. Smaller ships will most likely be deployed to a decreasing number of container
hubs. Those ships in the US will call on major seaports on both coasts and in the Gulf of
Mexico. This will be the basis for the hub and spoke system with megaships transferring
to ultra-size ships, then in turn to small feeder ships and barge feeder services.
For Rhode Island to be part of this system, Rhode Island ports will need to connect to
frequent, diverse and cost effective feeder services. The ports will also have to
compete with truck and rail. Both ports have adequate land and equipment to handle
containers, as well as adequate land to meet storage and warehousing requirements.
The key factor for the development of the container trade, in particular, for Rhode Island
ports will depend on the price and transit time offered to shippers on an all-water route.
In the near term, it is unlikely that Rhode Island will see an opportunity to develop regular
container service on small feeder ships or barges, but both ports have successful niches
that should continue to be exploited. That said, neither port should discount the
potential for services in the future. As Boston continues to grow and the NY/NJ area
experiences increased roadway traffic congestion, the potential for the development of
container cargo carried on feeders remains probable. It is not expected that this will
come to fruition, however, until a shift in the deployment of the larger containerships
takes place.
An issue that is recurring at ports, particularly on the West Coast, is labor unrest. West
Coast strikes have caused extensive delays and, in some cases, shifting of carrier
services to other ports on the US East Coast and in Canada. This is not anticipated to
have a marked impact on Rhode Island ports. However, labor unrest in one part of the
country can affect the overall transportation system, and may lead to the shifting of
cargo paths once current agreements with ocean carriers expire.
Port growth in Rhode Island has and will continue to have impacts on other freight
modes. For example, automobiles are now being moved via rail from the Port of
Davisville to Worcester and then points beyond. In addition to this new traffic, rail
infrastructure improvements provide the potential for increased intermodal connectivity
to global gateways, in Rhode Island and across the country. Roadways and airports also
provide links that extend outside of the region.
3.4 SWOT Analysis
As part of the freight plan’s economic assessment, a Strengths, Weaknesses,
Opportunities and Threats (SWOT) analysis was conducted for five different industries:
Automobile Distribution, Final Mile, Fuels, High Tech Manufacturing, and Warehousing.
The purpose of the SWOT analysis was to better understand the strengths and
weaknesses of Rhode Island’s logistics and shipping industry. The analysis also identifies
opportunities to improve logistics and shipping in Rhode Island and provides insight on
potential threats to the supply chain that could impede the ability for businesses to ship
and receive goods and services. The SWOT analysis was based on available data and
F R E I G H T F O R W A R D :
S T A T E O F R H O D E I S L A N D F R E I G H T A N D G O O D S M O V E M E N T P L A N
25 | P a g e
interviews with key stakeholders. The findings are provided below, and the complete
analysis is provided in the Appendix of this freight plan.
3.4.1 Automobile Distribution
Rhode Island’s freight infrastructure and facilities currently support four different
automobile distribution operations: international imports, regional domestic distribution,
international exports, and final mile distribution to dealerships in Rhode Island.
Rhode Island receives automobiles through the Port of Davisville, including
Volkswagens, Audis, Porsches, Bentleys, Subarus, and Hondas manufactured in
Europe, Mexico, and Japan. The Port of Davisville handles approximately 11
percent of the automobiles imported into the United States. The majority of these
international imports from large automobile manufacturers are distributed
regionally within the United States.
Also located at the Port of Davisville, North Atlantic Distribution (NORAD) acts as
the regional distribution and processing hub for domestic automobiles. From
2011-2014, approximately 25,000 cars and trucks were brought annually to
Davisville by rail from Ford and Subaru’s US manufacturing facilities and then
distributed by truck to dealerships within the Northeast.
Used automobiles are exported through ProvPort. In 2014,19,264 units were
shipped on 24 vessels, largely to the West African ports of Lome, Togo; Cotonou,
Benin; and Lagos, Nigeria.
New vehicles are shipped within Rhode Island from regional distribution locations
to individual dealerships. These new automobiles are transported via trucks and
frequency of deliveries is dependent upon car sales.
The key Strengths or Opportunities of Rhode Island’s Automobile Distribution industry are:
National market for car sales
No harbor maintenance tax for Davisville and uncongested portside-landside
interface Opportunity to attract market share from other nearby facilities
Potential to reload empty returning rail wagons
Truck Driver shortage – more long haul distribution by rail may be possible
The key Weaknesses or Threats include:
Competing ports in the region (e.g., Baltimore)
Rhode Island’s location does not favor exports of new vehicles
Changes in car production dynamics, regulation/taxation abroad
Sizes of pure car carriers (PCC)and tri-level auto racks are increasing and there
may be draught issues at Davisville
The complete SWOT analysis for Automobile Distribution is provided in the Appendix.
F R E I G H T F O R W A R D :
S T A T E O F R H O D E I S L A N D F R E I G H T A N D G O O D S M O V E M E N T P L A N
26 | P a g e
3.4.2 Final Mile
The term “Final Mile” is often used to describe the final phase of the movement of
freight to a receiver or consumer. Examples of final mile deliveries include:
A home delivery package from Amazon for example, to a Rhode Island resident
Medical supplies and consumables to a hospital
Food and alcohol to a restaurant
Retail goods to a shop
Components to a manufacturer
Cash to a bank
Heating oil to a home
The final mile is a critical part of the overall supply chain, as it is where title and
ownership of goods typically changes hands from the shipper to the receiver. Other
dynamics also influence the final mile delivery including delivery timing (which could be
imposed by the shipper or receiver or decided by the freight company), size of delivery
truck and special handling requirements such as product temperature control and
hazardous materials. Many deliveries to consumers are undertaken on a multi-drop
basis, where the delivery vehicle makes between 20 and 50 deliveries a day. For some
package delivery companies, this is much higher. The Council of Supply Chain
Management Professionals estimates that as much as 28 percent of all transportation
costs occur in the last mile.
The key Strengths or Opportunities of Rhode Island’s Final Mile Distribution industry are:
Proximity to Boston/NY and major port-of-call for fuels
Good highway network
Access to wide range of freight transportation modes
Opportunity to increase alternative fuel delivery vehicles
Alternative Delivery solutions (e.g., lock boxes, consolidation)
The key Weaknesses or Threats include:
Loading capacity in some locations (e.g., Newport)
Access constraints for larger vehicles and bridge weight
Existing and future congestion
Limited warehousing space in Rhode Island
The complete SWOT analysis for Final Mile Distribution is provided in the Appendix.
3.4.3 Petroleum/Fuel
Rhode Island plays a prominent role in the distribution of refined petroleum and fuel
products to residents and consumers in New England. Fuel products include gasoline,
fuel oil, diesel and propane, also known as Liquid Petroleum Gas (LPG).
Rhode Island’s fuel supply chain relies on water transportation to bring refined
petroleum products into the region from refineries located in New Jersey and
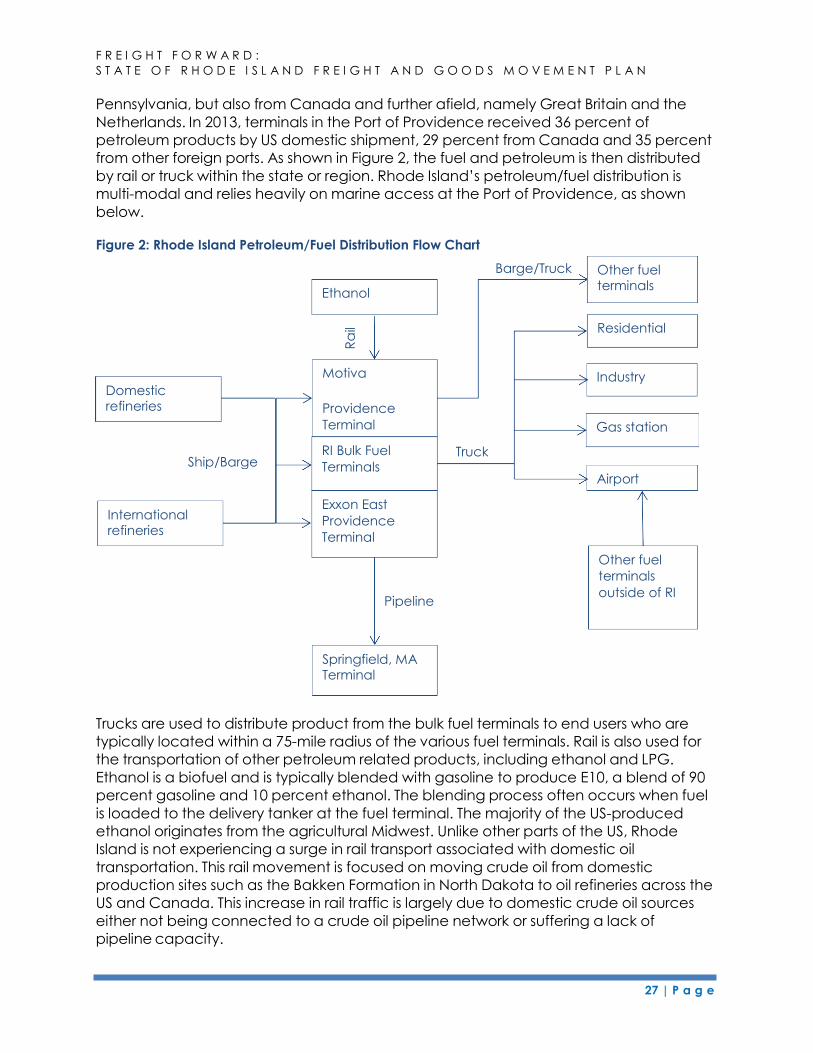
F R E I G H T F O R W A R D :
S T A T E O F R H O D E I S L A N D F R E I G H T A N D G O O D S M O V E M E N T P L A N
27 | P a g e
Pennsylvania, but also from Canada and further afield, namely Great Britain and the
Netherlands. In 2013, terminals in the Port of Providence received 36 percent of
petroleum products by US domestic shipment, 29 percent from Canada and 35 percent
from other foreign ports. As shown in Figure 2, the fuel and petroleum is then distributed
by rail or truck within the state or region. Rhode Island’s petroleum/fuel distribution is
multi-modal and relies heavily on marine access at the Port of Providence, as shown
below.
Figure 2: Rhode Island Petroleum/Fuel Distribution Flow Chart
Trucks are used to distribute product from the bulk fuel terminals to end users who are
typically located within a 75-mile radius of the various fuel terminals. Rail is also used for
the transportation of other petroleum related products, including ethanol and LPG.
Ethanol is a biofuel and is typically blended with gasoline to produce E10, a blend of 90
percent gasoline and 10 percent ethanol. The blending process often occurs when fuel
is loaded to the delivery tanker at the fuel terminal. The majority of the US-produced
ethanol originates from the agricultural Midwest. Unlike other parts of the US, Rhode
Island is not experiencing a surge in rail transport associated with domestic oil
transportation. This rail movement is focused on moving crude oil from domestic
production sites such as the Bakken Formation in North Dakota to oil refineries across the
US and Canada. This increase in rail traffic is largely due to domestic crude oil sources
either not being connected to a crude oil pipeline network or suffering a lack of
pipeline capacity.
Barge/Truck
Ethanol
Other fuel terminals
Residential
Motiva Industry Domestic refineries Providence
Terminal
RI Bulk Fuel
Terminals
Gas station
Ship/Barge Truck
Airport
International refineries
Exxon East
Providence
Terminal
Pipeline
Other fuel
terminals
outside of RI
Springfield, MA Terminal
Ra
il
F R E I G H T F O R W A R D :
S T A T E O F R H O D E I S L A N D F R E I G H T A N D G O O D S M O V E M E N T P L A N
28 | P a g e
In 2013, Rhode Island terminals had a 40 percent market share of the distillate fuel oil
imported through facilities in the Port of Boston, New Bedford, Fall River, Providence,
New London, and the Thames River. This excludes the Tiverton terminal, as this location
is included in Fall River for US Army Corps of Engineers cargo reporting purposes. Rhode
Island terminals also handled 31.5 percent of gasoline and 21 percent of residual fuel
oil, a classification describing heavier fuel oils used for ship fuel, production of electric
power and other industrial purposes.
The key Strengths or Opportunities of Rhode Island’s Petroleum/Fuels industry are:
Multi modal fuel terminals – recent reinvestment
32.4 million people within a four-hour drive
Home heating oil
Transportation-related consumption
The key Weaknesses or Threats include:
Queuing and wait times at terminals
Hazmat restrictions at Providence rail station
Home heating alternatives becoming increasingly available
Lower transportation fuel demand in future
Weather impacts on fuel supply chain
The complete SWOT analysis for the Petroleum/Fuels industry is provided in the
Appendix to the freight plan.
3.4.4 High Technology Industry
A number of definitions exist to describe high technology manufacturing. For the
purposes of this analysis, the plan used the industries identified by the Bureau of Labor
Statistics (BLS) in 1999, which are based on SIC codes and were updated to reflect the
NAICs codes in 2003. The BLS definition: “An industry is considered high tech if
employment in technology-oriented occupations accounted for a proportion of that
industry’s total employment that was at least twice the 4.9-percent average for all
industries.” According to an analysis of the Commerce Rhode Island’s Manufacturers’
database, there are approximately 199 companies within Rhode Island that can be
classified as High Tech Manufacturers.
High technology manufacturing relies upon freight transportation to support the
inbound flow of raw materials and components that are processed to form
manufactured articles and the outbound movement of those articles to customers
worldwide.
Characteristics associated with inbound flows include:
Chemicals arriving in bulk form are likely to be transported by road and rail
from domestic sources. Some chemicals such as Sodium Hydroxide arrive by
ship from foreign sources and are processed through the Port of Providence.
F R E I G H T F O R W A R D :
S T A T E O F R H O D E I S L A N D F R E I G H T A N D G O O D S M O V E M E N T P L A N
29 | P a g e
Small, high value components tend to be shipped using packaged services
such as FedEx and UPS.
Trucking is the mode that will be used to deliver the majority of inbound
products to Rhode Island’s manufacturing facilities.
Outbound freight transportation attributes include:
The movement of consignments to international destinations will typically be
in intermodal containers and use the ports of Boston and New York/New
Jersey.
The movement of consignments to domestic destinations will use trucking
services, including less than full truck load and full truck load services.
Small, high value shipments will often travel using package services and
FedEx and UPS services from T.F. Green and Boston Logan for both
international and domestic locations.
The key Strength or Opportunities of Rhode Island’s High Technology industry are:
Access to a wide range of freight transportation modes
Proximity to Boston, NY/NJ for exports and imports
Northeast inbound is greater than outbound freight
- Very cost competitive outbound transport market
- High inbound trucking cost
- Driver shortage, which increases costs and may impact reliability of trucking services
Re-shoring could bring additional manufacturing operations to Rhode Island
The key Weaknesses or Threats include:
Many high tech companies are legacy based in Rhode Island. Increased fuel
and transportation costs could influence where those companies undertake
their manufacturing operations.
The complete SWOT analysis for the High Technology industry is provided in the
Appendix.
3.4.5 Warehousing/Distribution
Warehousing and distribution facilities essentially provide two functions: the safe and
secure receipt and storage of goods, and a ready inventory to dispatch goods and
fulfill customer orders. There are significant warehousing and distribution operations in
Rhode Island, including Ocean State Job Lot, CVS, Dean Warehousing, Mancini Liquor
and Greencore. Key factors affecting business decisions about warehousing operations
include facility location, cost, size and interior configuration.
Facility location is influenced by a variety of factors, including access to a plentiful
supply of labor, access and proximity to customers and suppliers, utilities (e.g., high
F R E I G H T F O R W A R D :
S T A T E O F R H O D E I S L A N D F R E I G H T A N D G O O D S M O V E M E N T P L A N
30 | P a g e
pressure gas line), energy costs, and the local business and regulatory environment. The
supply and suitability of existing warehouse facilities at market prices to accommodate
a company’s storage and processing requirements will influence whether a company
leases or acquires space. If supply is not adequate, the availability of suitable land and
the cost of new construction will also influence locational decisions. Figure 3 shows the
location of freight companies in Rhode Island, many of which are warehousing and
distribution facilities.
Facility size is typically determined by the amount of goods a warehouse is expected to
store and the dimensions necessary to accommodate related processes such as the
picking, packing and dispatching of products. Further requirements include adjacent
hardtop for truck and trailer deliveries, as well as employee parking. Big box warehouses
(a term often used to describe warehouses over one million square feet),
are typically used within the consumer goods/retail and food and beverage sectors, to
support regional and national distribution functions for these companies. The majority of
warehouses are much smaller than that, however. Feedback from Rhode Island-based
commercial real estate companies, including representatives of Hayes & Sherry and
CBRE-New England, suggests that most companies looking for warehousing space in the
Rhode Island or southeastern New England market are seeking smaller buildings, in the
80,000 -100,000 square foot range or smaller.
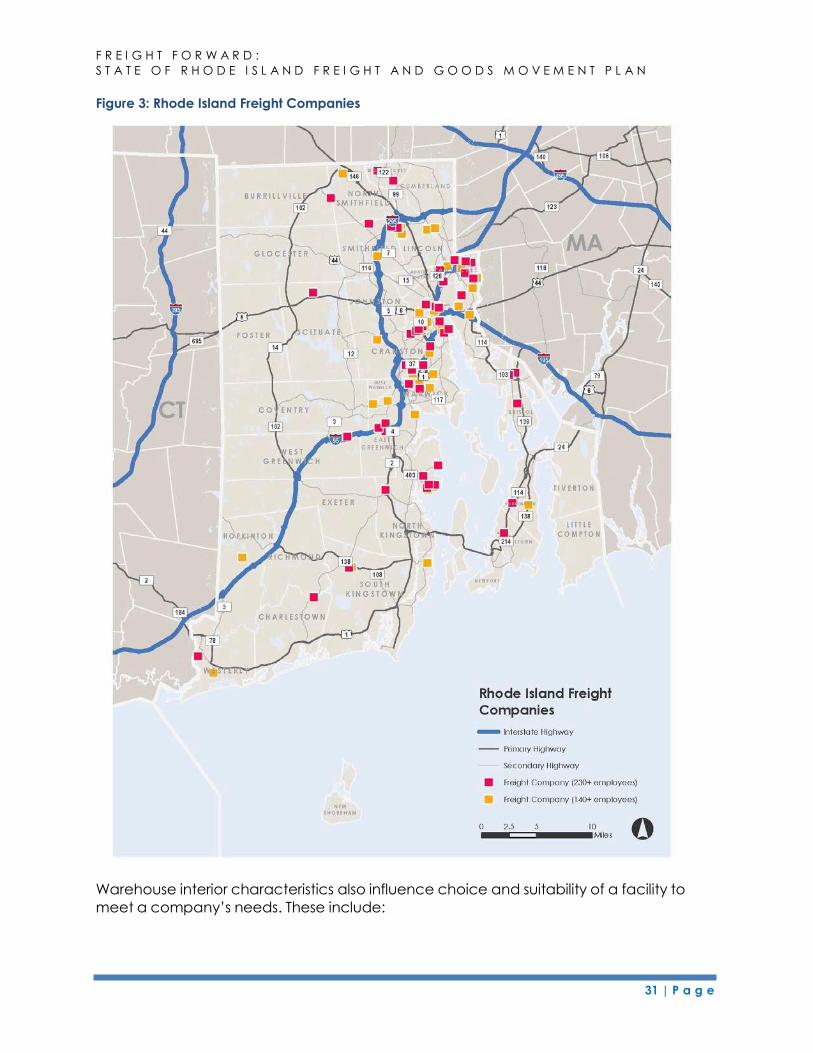
F R E I G H T F O R W A R D :
S T A T E O F R H O D E I S L A N D F R E I G H T A N D G O O D S M O V E M E N T P L A N
31 | P a g e
Figure 3: Rhode Island Freight Companies
Warehouse interior characteristics also influence choice and suitability of a facility to
meet a company’s needs. These include:
F R E I G H T F O R W A R D :
S T A T E O F R H O D E I S L A N D F R E I G H T A N D G O O D S M O V E M E N T P L A N
32 | P a g e
Internal height. Warehouses need to be high enough to accommodate racking
that allows for the vertical storage of goods on pallets. Other more advanced
processes including automation and conveyer systems, and order fulfillment may
require mezzanine floors resulting in a need for higher warehouses. Typically the
interior height needs to be 20-30 feet.
Space between internal supporting columns. Greater distance between
columns allows the space to be used flexibly and makes for more efficient
warehouse layouts and the ability to accommodate materials handling
equipment, such as automation.
Number of loading docks. Having more than one loading dock allows goods to
be simultaneously received and dispatched. Warehouses dispatching high
volumes of goods will often need multiple docks.
The key Strengths or Opportunities of Rhode Island’s Warehousing/Distribution industry
are:
Proximity to larger consumer market, good transportation access
Land availability, pre-permitting at Quonset Business Park
Opportunity to initiate statewide e-permitting initiative
Identify/preserve land for future industrial and warehousing growth
The key Weaknesses or Threats include:
Lack of warehouse supply
Real or perceived time delays in permitting
High construction costs
Differences between states (e.g., regulations, taxes, incentives)
Other locations offer similar access to metro areas
The complete SWOT analysis for the Warehousing/Distribution industry is provided in the
Appendix to this freight plan.
3.5 Summary of Economic Context of Freight in Rhode Island
Ensuring that Rhode Island’s ports, railroads, roadways, and pipelines can move freight
effectively and efficiently is critical to maintaining and expanding the state’s place in
the larger regional, national and global freight transportation network. A strong freight
system connects consumers and suppliers, supports thousands of jobs, and links Rhode
Island to regional and global economies.
Maintenance and careful investment in Rhode Island’s freight system will enhance the
state’s and region’s ability to access global markets and increase trade. Strategic
investments in transportation will position the state to take advantage of changes in the
economy that play well to Rhode Island’s strengths.
The quality of the freight system is also an important factor in businesses’ decisions to
locate or expand operations in a state as nearly all businesses rely on dependable
freight shipments. Improved freight efficiencies can be a spur to growth, further
enhancing the economic opportunities available to Rhode Island residents.

F R E I G H T F O R W A R D :
S T A T E O F R H O D E I S L A N D F R E I G H T A N D G O O D S M O V E M E N T P L A N
33 | P a g e
4 STATE FREIGHT TRANSPORTATION ASSETS
4.1 Introduction
This chapter was prepared to provide an assessment of the freight transportation
infrastructure in Rhode Island. The preparation of this freight assessment inventory is a
key requirement of MAP-21 and reflects the FAST Act, providing a comprehensive
inventory of the state’s major freight transportation infrastructure assets, including the
state’s highways, railways, marine, aviation, and pipeline assets as well as the
distribution and multi-modal facilities.
The purpose of the infrastructure assessment is two-fold: to define the state’s freight
network and identify issues, constraints, and opportunities that will affect the efficiency
of freight movement, such as physical infrastructure limitations leading to capacity
constraints or otherwise sub-optimal transportation. This chapter also identifies the
externalities and issues that affect other infrastructure users and Rhode Island residents.
Information and data used to prepare this assessment was gathered during stakeholder
outreach and data collection. Data sources are provided throughout the chapter.
4.2 Assessment Approach
4.2.1 Data Collection
Several existing reports, maps, and studies were used in the preparation of this
document, including the following documents and data sources:
4.2.2 Rhode Island Department of Administration, Division of Planning, Statewide Planning
Program
Freight Planning Needs Assessment (FNA), 2006,
http://www.planning.ri.gov/documents/trans/FreightNeedsAssessment.pdf
Rhode Island State Rail Plan (State Rail Plan), March 13, 2014,
http://www.planning.ri.gov/documents/trans/Rail/RI_State_Rail_Plan_2014.pd
f
State of Rhode Island Long Range Transportation Plan (LRTP) Transportation
2035, December 13, 2012, http://www.planning.ri.gov/documents/trans/LRTP%202035%20-%20Final.pdf
State of Rhode Island Highway Functional Classification 2014, July 2014,
http://www.planning.ri.gov/documents/trans/2015/TP_165.pdf
Rhode Island Airport System Plan (RI ASP), September 15, 2011,
http://www.planning.ri.gov/documents/guide_plan/ASP_report_114.pdf
Rhode Island State Energy Plan (State Energy Plan), Preliminary Draft, June
2015
34 | P a g e
F R E I G H T F O R W A R D :
S T A T E O F R H O D E I S L A N D F R E I G H T A N D G O O D S M O V E M E N T P L A N
4.2.3 Rhode Island Department of Transportation
Rhode Island State Freight Map (Draft), July 14, 2015,
http://freightforwardri.com/home/wp-
content/uploads/2015/02/FreightPlanUpgrade36x48.pdf
Rhode Island Strategic Highway Safety Plan, October 2012,
http://www.dot.ri.gov/documents/community/safety/Strategic_HIGHWAY_SA
FETY_PLAN.pdf#page=6
Bridge Inventory Data Sheet, February 10, 2015,
http://www.dot.ri.gov/documents/travel/bridgeinfo/Bridge_Inventory_Sheet.
4.2.4 Federal Highway Administration (FHWA)
National Highway System: Rhode Island Map, March 25, 2015,
http://www.fhwa.dot.gov/planning/national_highway_system/nhs_maps/rho
de_island/ri_RhodeIsland.pdf
Draft Primary Freight Network: Rhode Island Map,
http://www.ops.fhwa.dot.gov/freight/infrastructure/pfn/state_maps/ri_rhodei
sland.pdf
Freight Analysis Framework (FAF),
http://ops.fhwa.dot.gov/Freight/freight_analysis/faf/index.htm
4.2.5 Other Sources
Federal Motor Carrier Safety Administration (FMCSA), National Hazardous
Materials Route Registry, July 14, 2014 - http://www.gpo.gov/fdsys/pkg/FR-2014-
07-14/pdf/2014-15861.pdf
The Rhode Island Bays, Rivers, and Watersheds Coordination Team, Rhode Island
Ports: Opportunities for Growth, April 2011
http://www.dem.ri.gov/bayteam/documents/riports.pdf
Rhode Island Airports Corporation (RIAC), Passenger Number Summaries,
http://www.pvdairport.com/corporate/ri-airport-corporation/passenger-
numbers
US Bureau of the Census, USA Trade Online, Export and Import Data,
https://usatrade.census.gov
Rhode Island Airport Commission (RIAC), T.F. Green Airport Air Cargo Assessment,
May 29, 2015 Rhode Island Office of Energy Resources, Energy Assurance Plan, June 29, 2012
4.3 Regional Context
Rhode Island is a small state within a densely populated region and its freight network is
intrinsically linked to the adjoining states in New England. The state’s roadways and
railways provide key linkages between Rhode Island’s major ports and airports and the
surrounding states and region. See Figure 4 for the regional freight network context.
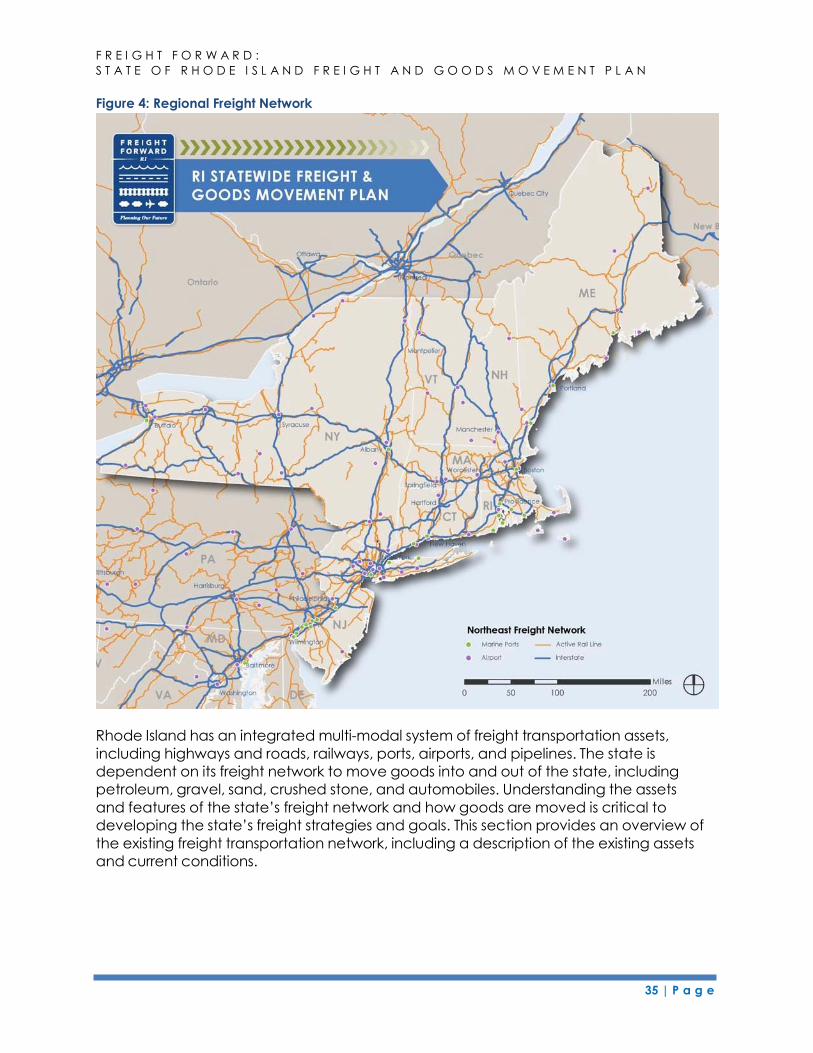
35 | P a g e
F R E I G H T F O R W A R D :
S T A T E O F R H O D E I S L A N D F R E I G H T A N D G O O D S M O V E M E N T P L A N
Figure 4: Regional Freight Network
Rhode Island has an integrated multi-modal system of freight transportation assets,
including highways and roads, railways, ports, airports, and pipelines. The state is
dependent on its freight network to move goods into and out of the state, including
petroleum, gravel, sand, crushed stone, and automobiles. Understanding the assets
and features of the state’s freight network and how goods are moved is critical to
developing the state’s freight strategies and goals. This section provides an overview of
the existing freight transportation network, including a description of the existing assets
and current conditions.
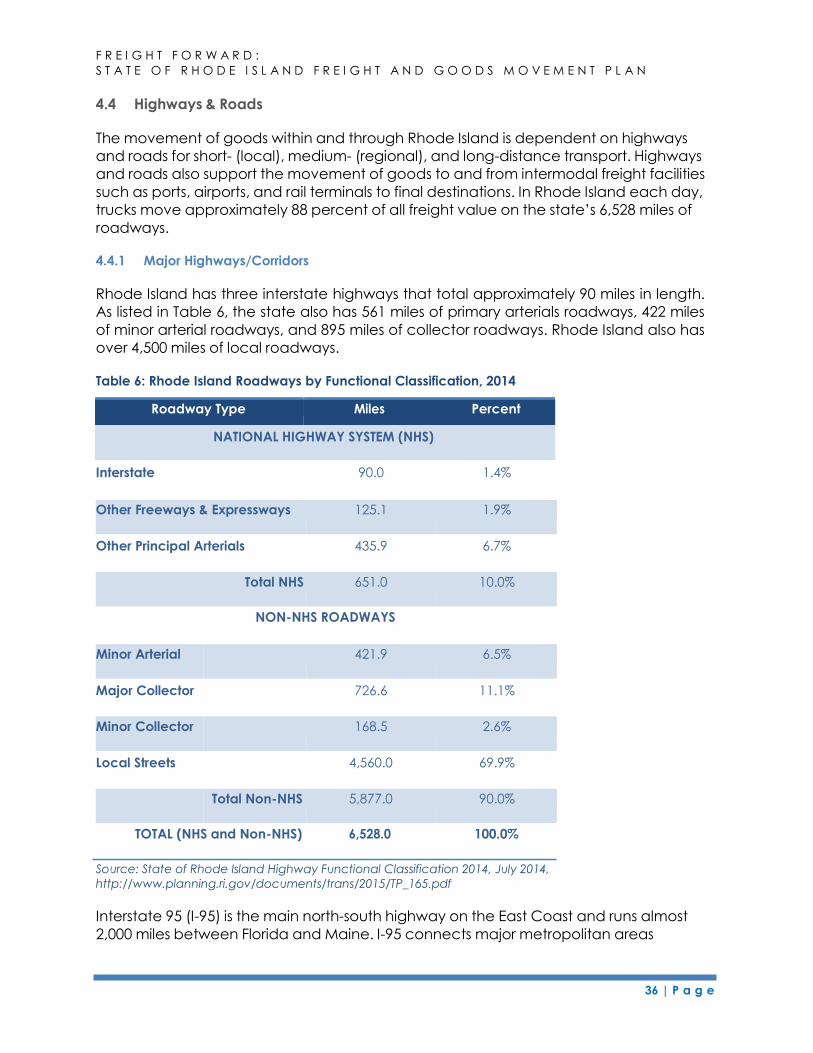
36 | P a g e
F R E I G H T F O R W A R D :
S T A T E O F R H O D E I S L A N D F R E I G H T A N D G O O D S M O V E M E N T P L A N
4.4 Highways & Roads
The movement of goods within and through Rhode Island is dependent on highways
and roads for short- (local), medium- (regional), and long-distance transport. Highways
and roads also support the movement of goods to and from intermodal freight facilities
such as ports, airports, and rail terminals to final destinations. In Rhode Island each day,
trucks move approximately 88 percent of all freight value on the state’s 6,528 miles of
roadways.
4.4.1 Major Highways/Corridors
Rhode Island has three interstate highways that total approximately 90 miles in length.
As listed in Table 6, the state also has 561 miles of primary arterials roadways, 422 miles
of minor arterial roadways, and 895 miles of collector roadways. Rhode Island also has
over 4,500 miles of local roadways.
Table 6: Rhode Island Roadways by Functional Classification, 2014
Interstate 90.0 1.4%
Other Freeways & Expressways 125.1 1.9%
Other Principal Arterials 435.9 6.7%
Total NHS 651.0 10.0%
NON-NHS ROADWAYS
Minor Arterial 421.9 6.5%
Major Collector 726.6 11.1%
Minor Collector 168.5 2.6%
Local Streets 4,560.0 69.9%
Total Non-NHS 5,877.0 90.0%
TOTAL (NHS and Non-NHS) 6,528.0 100.0%
Source: State of Rhode Island Highway Functional Classification 2014, July 2014,
http://www.planning.ri.gov/documents/trans/2015/TP_165.pdf
Interstate 95 (I-95) is the main north-south highway on the East Coast and runs almost
2,000 miles between Florida and Maine. I-95 connects major metropolitan areas
Roadway Type Miles Percent
NATIONAL HIGHWAY SYSTEM (NHS)
37 | P a g e
F R E I G H T F O R W A R D :
S T A T E O F R H O D E I S L A N D F R E I G H T A N D G O O D S M O V E M E N T P L A N
including Boston, Providence, New York, Philadelphia, Baltimore, Washington, D.C.,
Richmond, Savannah, Jacksonville, and Miami. I-95 provides an important regional and
national connection for Rhode Island. As a designated High Priority Corridor of the
National Highway System (NHS), I-95 supports Rhode Island’s regional, national, and
international trade by linking the state to Massachusetts and Connecticut, the national
highway system, important marine, air cargo, and intermodal facilities, and major
population centers.
As shown in Figure 5, I-95 runs 45.7 miles from Hopkinton in the southwest corner of the
state, near the Connecticut border northeasterly towards Providence. South of
Providence, I-95 connects to I-295, a western bypass highway that reconnects to I-95
north of Providence in Massachusetts. In Providence, I-95 also connects to I-195, which
provides access to southeastern Massachusetts. The corridor connects to Massachusetts
and the Boston metropolitan area in the northeastern corner of the state.
Also shown in Figure 5 are the other important roadways in Rhode Island that provide
east-west connections and links to other regional destinations. US Route 1 and US Route
6 provide connections to Connecticut, Rhode Island Route 146 provides access to
Worcester, Massachusetts, and Rhode Island Route 102 provides an alternative route
around Providence. The functional classification of all roadways is provided in Figure 6.
4.4.1.1 Bridges
According to the February 2015 Bridge Inventory Data Sheet, the State of Rhode Island
owns 611 bridges, while cities and towns own 153 bridges listed on the National Bridge
Inventory (bridge span over 20 feet).23 As shown in Table 7, 178 bridges were classified
as structurally deficient. The state has an additional 416 bridges with bridge spans less
than 20 feet not classified on the National Bridge Inventory. The Rhode Island Turnpike
and Bridge Authority operate four of the state’s largest bridges: the Mount Hope Bridge
(Route 114) between Bristol and Portsmouth; the Claiborne Pell/Newport Bridge (Route
138) between Newport and Jamestown; the Jamestown Verrazano (Route 138)
between Jamestown and North Kingstown; and the Sakonnet River Bridge (Route 24
and Route 138) between Portsmouth and Tiverton. The Mount Hope Bridge and the Pell
Bridge have weight restrictions and require over-the-road permits. Figure 5 presents the
major roadways in the state.
23 RIDOT, Bridge Inventory Data Sheet, February 10, 2015.
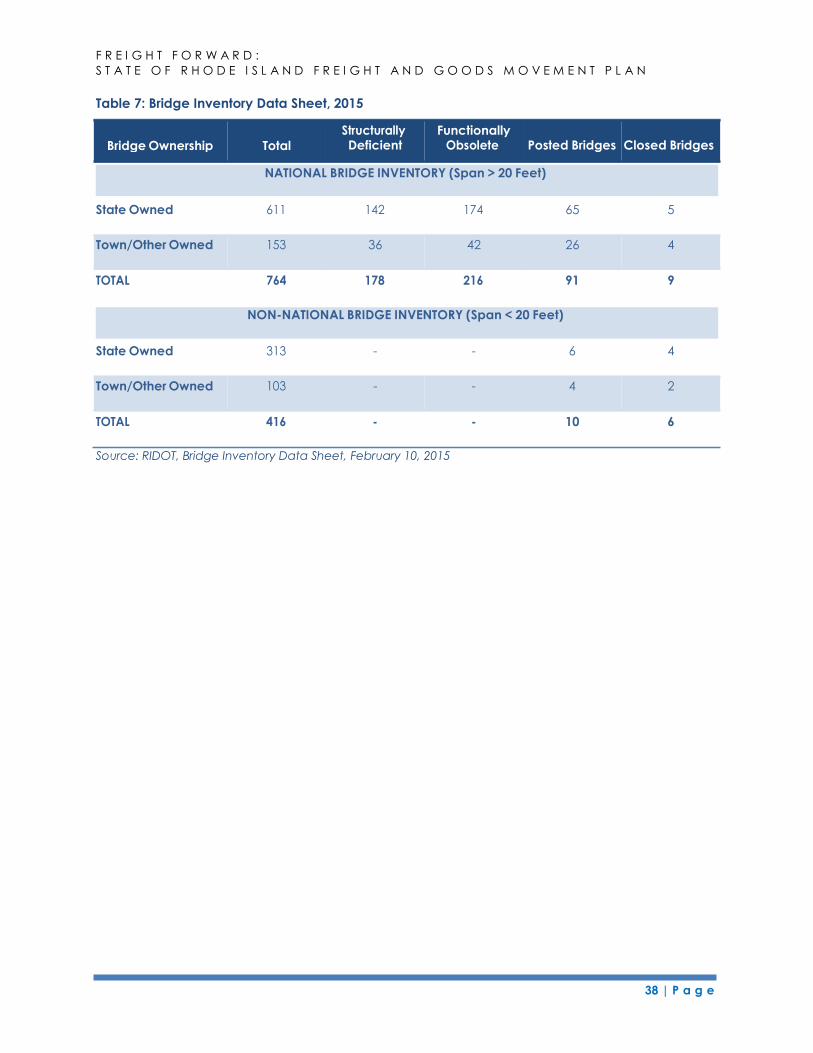
38 | P a g e
F R E I G H T F O R W A R D :
S T A T E O F R H O D E I S L A N D F R E I G H T A N D G O O D S M O V E M E N T P L A N
Table 7: Bridge Inventory Data Sheet, 2015
State Owned 611 142 174 65 5
TOTAL 764 178 216 91 9
State Owned 313 - - 6 4
TOTAL 416 - - 10 6
Source: RIDOT, Bridge Inventory Data Sheet, February 10, 2015
Bridge Ownership Total
Deficient
Functionally Posted Bridges Closed Bridges
NATIONAL BRIDGE INVENTORY (Span > 20 Feet)
Town/Other Owned 36 42 26 4
NON-NATIONAL BRIDGE INVENTORY (Span < 20 Feet)
Town/Other Owned - 4 2
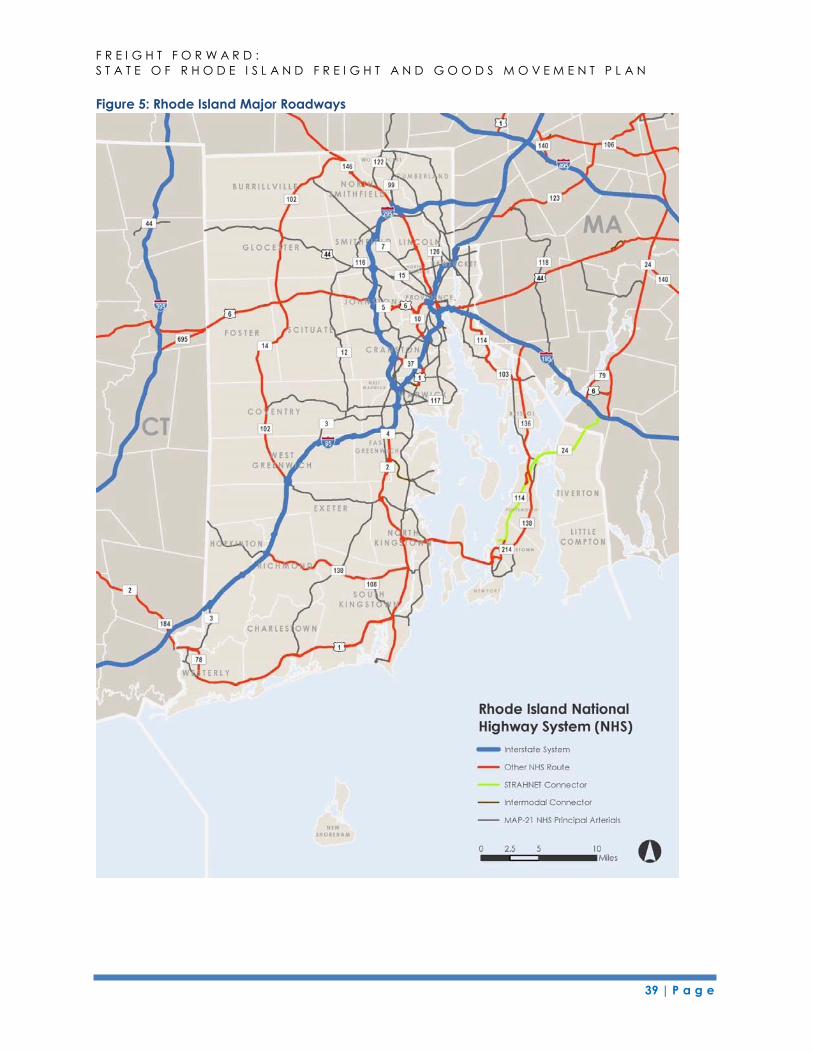
39 | P a g e
F R E I G H T F O R W A R D :
S T A T E O F R H O D E I S L A N D F R E I G H T A N D G O O D S M O V E M E N T P L A N
Figure 5: Rhode Island Major Roadways
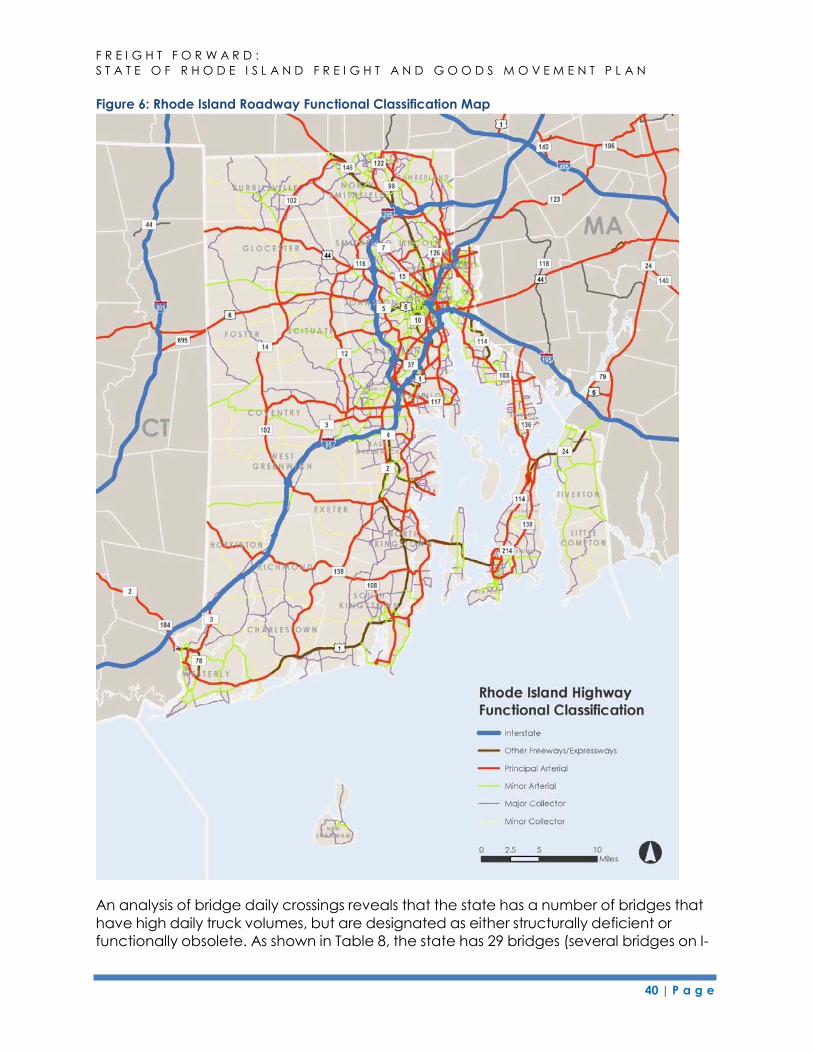
F R E I G H T F O R W A R D :
S T A T E O F R H O D E I S L A N D F R E I G H T A N D G O O D S M O V E M E N T P L A N
Figure 6: Rhode Island Roadway Functional Classification Map
40 | P a g e
An analysis of bridge daily crossings reveals that the state has a number of bridges that
have high daily truck volumes, but are designated as either structurally deficient or
functionally obsolete. As shown in Table 8, the state has 29 bridges (several bridges on I-
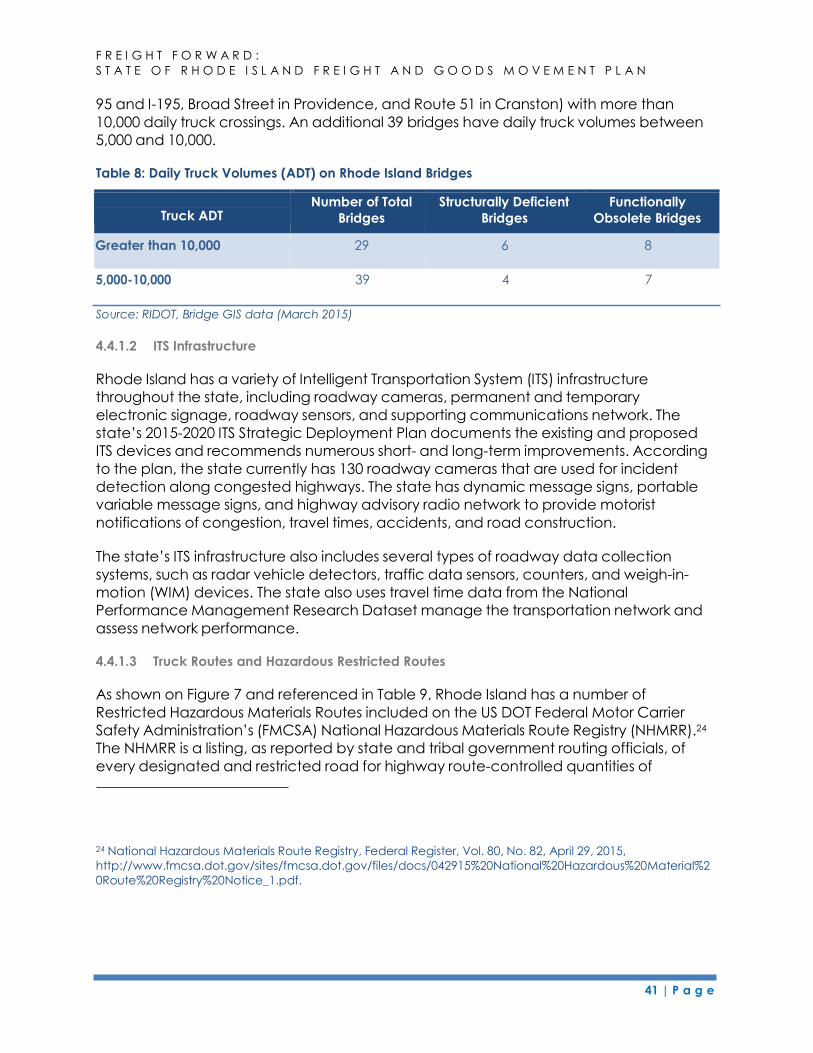
41 | P a g e
F R E I G H T F O R W A R D :
S T A T E O F R H O D E I S L A N D F R E I G H T A N D G O O D S M O V E M E N T P L A N
95 and I-195, Broad Street in Providence, and Route 51 in Cranston) with more than
10,000 daily truck crossings. An additional 39 bridges have daily truck volumes between
5,000 and 10,000.
Table 8: Daily Truck Volumes (ADT) on Rhode Island Bridges
Number of Total
Bridges
Structurally Deficient
Bridges
Functionally
Obsolete Bridges Truck ADT
Greater than 10,000 29 6 8
5,000-10,000 39 4 7
Source: RIDOT, Bridge GIS data (March 2015)
4.4.1.2 ITS Infrastructure
Rhode Island has a variety of Intelligent Transportation System (ITS) infrastructure
throughout the state, including roadway cameras, permanent and temporary
electronic signage, roadway sensors, and supporting communications network. The
state’s 2015-2020 ITS Strategic Deployment Plan documents the existing and proposed
ITS devices and recommends numerous short- and long-term improvements. According
to the plan, the state currently has 130 roadway cameras that are used for incident
detection along congested highways. The state has dynamic message signs, portable
variable message signs, and highway advisory radio network to provide motorist
notifications of congestion, travel times, accidents, and road construction.
The state’s ITS infrastructure also includes several types of roadway data collection
systems, such as radar vehicle detectors, traffic data sensors, counters, and weigh-in-
motion (WIM) devices. The state also uses travel time data from the National
Performance Management Research Dataset manage the transportation network and
assess network performance.
4.4.1.3 Truck Routes and Hazardous Restricted Routes
As shown on Figure 7 and referenced in Table 9, Rhode Island has a number of
Restricted Hazardous Materials Routes included on the US DOT Federal Motor Carrier
Safety Administration’s (FMCSA) National Hazardous Materials Route Registry (NHMRR).24
The NHMRR is a listing, as reported by state and tribal government routing officials, of
every designated and restricted road for highway route-controlled quantities of
24 National Hazardous Materials Route Registry, Federal Register, Vol. 80, No. 82, April 29, 2015,
http://www.fmcsa.dot.gov/sites/fmcsa.dot.gov/files/docs/042915%20National%20Hazardous%20Material%2
0Route%20Registry%20Notice_1.pdf.
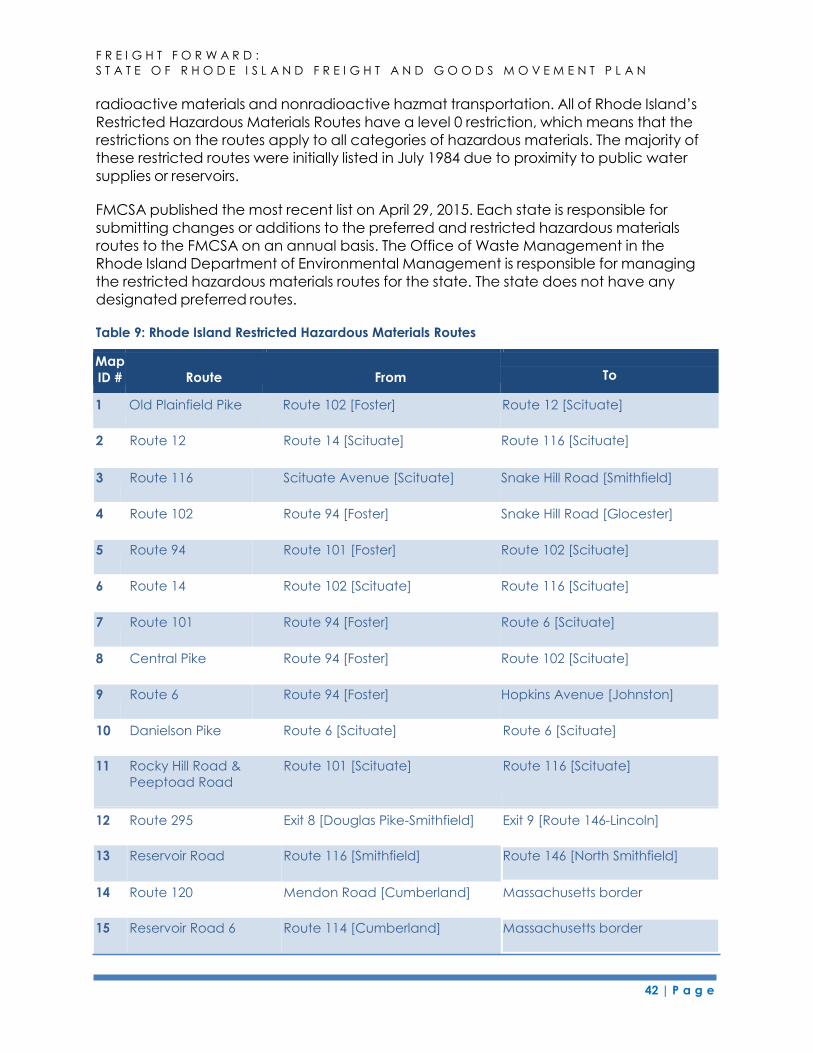
42 | P a g e
F R E I G H T F O R W A R D :
S T A T E O F R H O D E I S L A N D F R E I G H T A N D G O O D S M O V E M E N T P L A N
radioactive materials and nonradioactive hazmat transportation. All of Rhode Island’s
Restricted Hazardous Materials Routes have a level 0 restriction, which means that the
restrictions on the routes apply to all categories of hazardous materials. The majority of
these restricted routes were initially listed in July 1984 due to proximity to public water
supplies or reservoirs.
FMCSA published the most recent list on April 29, 2015. Each state is responsible for
submitting changes or additions to the preferred and restricted hazardous materials
routes to the FMCSA on an annual basis. The Office of Waste Management in the
Rhode Island Department of Environmental Management is responsible for managing
the restricted hazardous materials routes for the state. The state does not have any
designated preferred routes.
Table 9: Rhode Island Restricted Hazardous Materials Routes
2 Route 12 Route 14 [Scituate] Route 116 [Scituate]
3 Route 116 Scituate Avenue [Scituate] Snake Hill Road [Smithfield]
4 Route 102 Route 94 [Foster] Snake Hill Road [Glocester]
5 Route 94 Route 101 [Foster] Route 102 [Scituate]
6 Route 14 Route 102 [Scituate] Route 116 [Scituate]
7 Route 101 Route 94 [Foster] Route 6 [Scituate]
8 Central Pike Route 94 [Foster] Route 102 [Scituate]
9 Route 6 Route 94 [Foster] Hopkins Avenue [Johnston]
10 Danielson Pike Route 6 [Scituate] Route 6 [Scituate]
11 Rocky Hill Road & Route 101 [Scituate]
Peeptoad Road
Route 116 [Scituate]
12 Route 295 Exit 8 [Douglas Pike-Smithfield] Exit 9 [Route 146-Lincoln]
14 Route 120 Mendon Road [Cumberland] Massachusetts border
Reservoir Road Route 116 [Smithfield] Route 146 [North Smithfield]
Reservoir Road 6 Route 114 [Cumberland] Massachusetts border
Map
ID #
Route
From
To
1 Old Plainfield Pike Route 102 [Foster] Route 12 [Scituate]
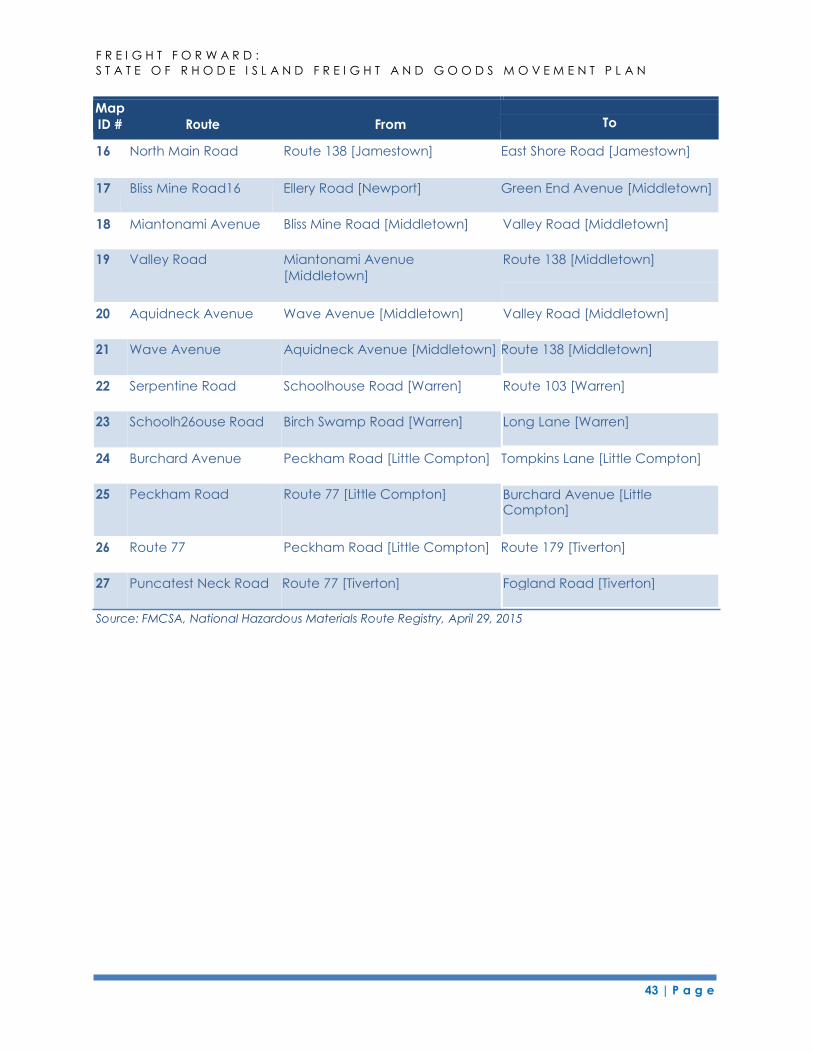
43 | P a g e
F R E I G H T F O R W A R D :
S T A T E O F R H O D E I S L A N D F R E I G H T A N D G O O D S M O V E M E N T P L A N
16 North Main Road Route 138 [Jamestown] East Shore Road [Jamestown]
17 Bliss Mine Road16 Ellery Road [Newport] Green End Avenue [Middletown]
18 Miantonami Avenue Bliss Mine Road [Middletown] Valley Road [Middletown]
19 Valley Road Miantonami Avenue
[Middletown]
Route 138 [Middletown]
20 Aquidneck Avenue Wave Avenue [Middletown] Valley Road [Middletown]
22 Serpentine Road Schoolhouse Road [Warren] Route 103 [Warren]
24 Burchard Avenue Peckham Road [Little Compton] Tompkins Lane [Little Compton]
26 Route 77 Peckham Road [Little Compton] Route 179 [Tiverton]
Source: FMCSA, National Hazardous Materials Route Registry, April 29, 2015
Wave Avenue Aquidneck Avenue [Middletown] Route 138 [Middletown]
Schoolh26ouse Road Birch Swamp Road [Warren] Long Lane [Warren]
Peckham Road Route 77 [Little Compton] Burchard Avenue [Little Compton]
Puncatest Neck Road Route 77 [Tiverton] Fogland Road [Tiverton]
Map
ID # Route From
To
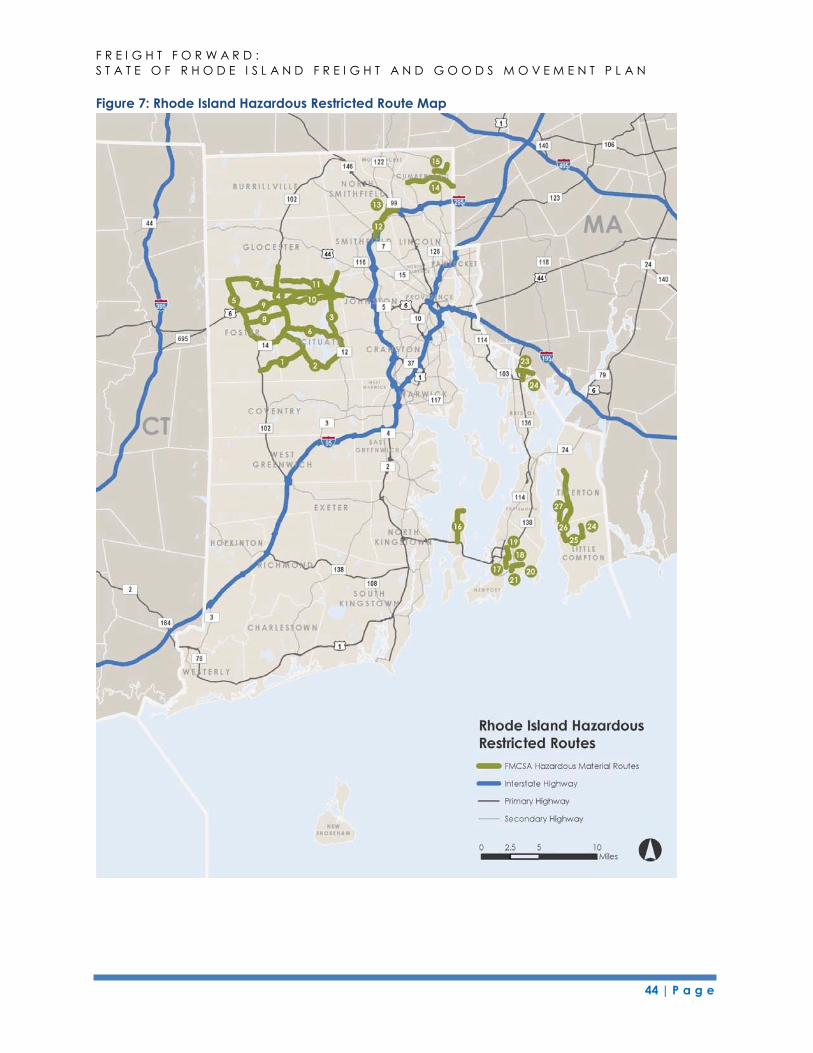
44 | P a g e
F R E I G H T F O R W A R D :
S T A T E O F R H O D E I S L A N D F R E I G H T A N D G O O D S M O V E M E N T P L A N
Figure 7: Rhode Island Hazardous Restricted Route Map
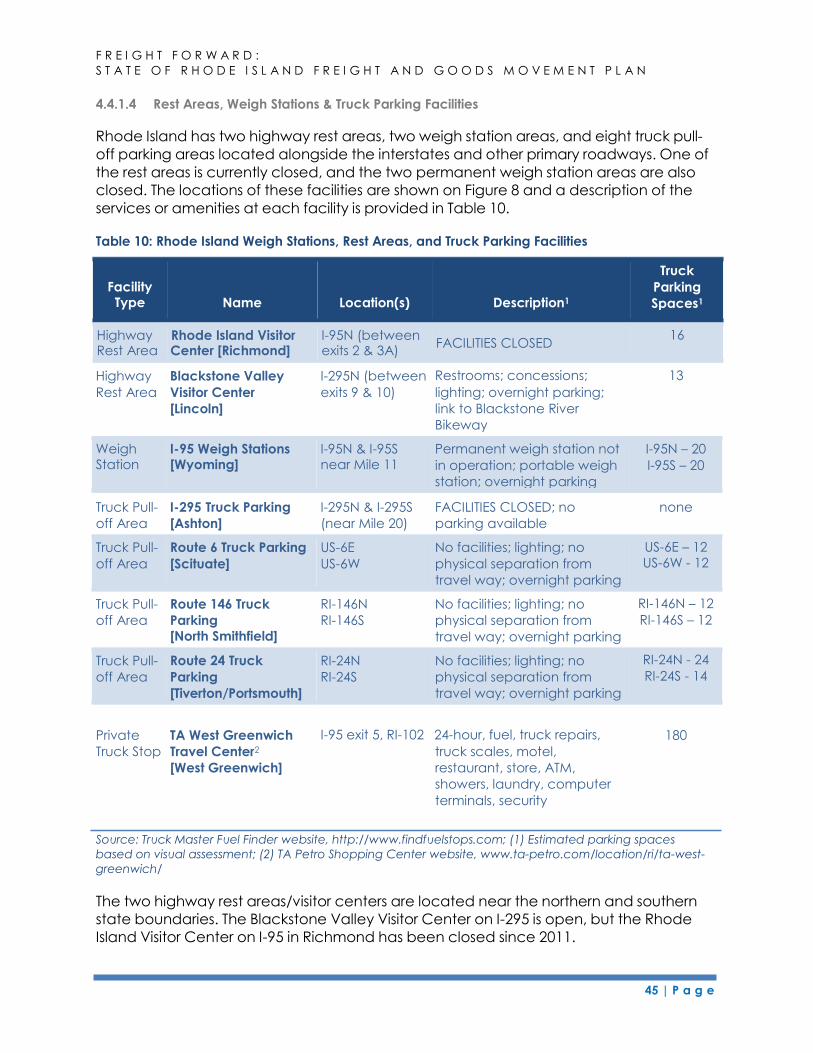
45 | P a g e
F R E I G H T F O R W A R D :
S T A T E O F R H O D E I S L A N D F R E I G H T A N D G O O D S M O V E M E N T P L A N
4.4.1.4 Rest Areas, Weigh Stations & Truck Parking Facilities
Weigh Station
I-95 Weigh Stations [Wyoming]
I-95N & I-95S near Mile 11
Permanent weigh station not I-95N – 20
in operation; portable weigh I-95S – 20
station; overnight parking
Rhode Island has two highway rest areas, two weigh station areas, and eight truck pull-
off parking areas located alongside the interstates and other primary roadways. One of
the rest areas is currently closed, and the two permanent weigh station areas are also
closed. The locations of these facilities are shown on Figure 8 and a description of the
services or amenities at each facility is provided in Table 10.
Table 10: Rhode Island Weigh Stations, Rest Areas, and Truck Parking Facilities
Highway
Rest Area
Blackstone Valley
Visitor Center
[Lincoln]
I-295N (between
exits 9 & 10)
Restrooms; concessions; 13
lighting; overnight parking;
link to Blackstone River
Bikeway
Truck Pull-
off Area
Truck Pull-
off Area
Truck Pull-
off Area
Truck Pull-
off Area
I-295 Truck Parking
[Ashton]
Route 6 Truck Parking
[Scituate]
Route 146 Truck
Parking [North Smithfield]
Route 24 Truck
Parking
[Tiverton/Portsmouth]
I-295N & I-295S
(near Mile 20)
US-6E
US-6W
RI-146N
RI-146S
RI-24N
RI-24S
FACILITIES CLOSED; no
parking available
No facilities; lighting; no
physical separation from
travel way; overnight parking
No facilities; lighting; no
physical separation from
travel way; overnight parking
No facilities; lighting; no
physical separation from
travel way; overnight parking
none
US-6E – 12 US-6W - 12
RI-146N – 12
RI-146S – 12
RI-24N - 24
RI-24S - 14
Private
Truck Stop
TA West Greenwich
Travel Center2
[West Greenwich]
I-95 exit 5, RI-102 24-hour, fuel, truck repairs,
truck scales, motel,
restaurant, store, ATM,
showers, laundry, computer
terminals, security
180
Source: Truck Master Fuel Finder website, http://www.findfuelstops.com; (1) Estimated parking spaces
based on visual assessment; (2) TA Petro Shopping Center website, www.ta-petro.com/location/ri/ta-west-
greenwich/
The two highway rest areas/visitor centers are located near the northern and southern
state boundaries. The Blackstone Valley Visitor Center on I-295 is open, but the Rhode
Island Visitor Center on I-95 in Richmond has been closed since 2011.
Facility Type Name Location(s) Description1
Truck
Parking
Spaces1
Highway Rhode Island Visitor Rest Area Center [Richmond]
I-95N (between exits 2 & 3A)
FACILITIES CLOSED 16
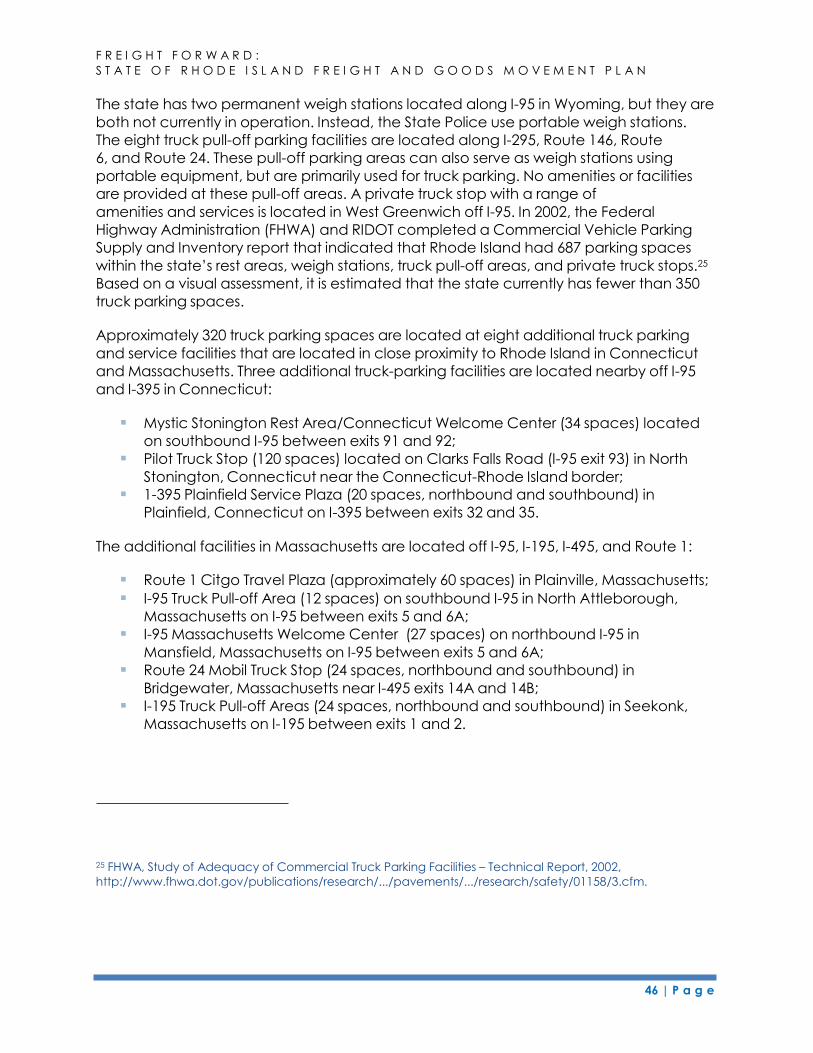
46 | P a g e
F R E I G H T F O R W A R D :
S T A T E O F R H O D E I S L A N D F R E I G H T A N D G O O D S M O V E M E N T P L A N
The state has two permanent weigh stations located along I-95 in Wyoming, but they are
both not currently in operation. Instead, the State Police use portable weigh stations.
The eight truck pull-off parking facilities are located along I-295, Route 146, Route
6, and Route 24. These pull-off parking areas can also serve as weigh stations using
portable equipment, but are primarily used for truck parking. No amenities or facilities
are provided at these pull-off areas. A private truck stop with a range of
amenities and services is located in West Greenwich off I-95. In 2002, the Federal
Highway Administration (FHWA) and RIDOT completed a Commercial Vehicle Parking
Supply and Inventory report that indicated that Rhode Island had 687 parking spaces
within the state’s rest areas, weigh stations, truck pull-off areas, and private truck stops.25
Based on a visual assessment, it is estimated that the state currently has fewer than 350
truck parking spaces.
Approximately 320 truck parking spaces are located at eight additional truck parking
and service facilities that are located in close proximity to Rhode Island in Connecticut
and Massachusetts. Three additional truck-parking facilities are located nearby off I-95
and I-395 in Connecticut:
Mystic Stonington Rest Area/Connecticut Welcome Center (34 spaces) located
on southbound I-95 between exits 91 and 92;
Pilot Truck Stop (120 spaces) located on Clarks Falls Road (I-95 exit 93) in North
Stonington, Connecticut near the Connecticut-Rhode Island border;
1-395 Plainfield Service Plaza (20 spaces, northbound and southbound) in
Plainfield, Connecticut on I-395 between exits 32 and 35.
The additional facilities in Massachusetts are located off I-95, I-195, I-495, and Route 1:
Route 1 Citgo Travel Plaza (approximately 60 spaces) in Plainville, Massachusetts;
I-95 Truck Pull-off Area (12 spaces) on southbound I-95 in North Attleborough,
Massachusetts on I-95 between exits 5 and 6A;
I-95 Massachusetts Welcome Center (27 spaces) on northbound I-95 in
Mansfield, Massachusetts on I-95 between exits 5 and 6A;
Route 24 Mobil Truck Stop (24 spaces, northbound and southbound) in
Bridgewater, Massachusetts near I-495 exits 14A and 14B;
I-195 Truck Pull-off Areas (24 spaces, northbound and southbound) in Seekonk,
Massachusetts on I-195 between exits 1 and 2.
25 FHWA, Study of Adequacy of Commercial Truck Parking Facilities – Technical Report, 2002,
http://www.fhwa.dot.gov/publications/research/.../pavements/.../research/safety/01158/3.cfm.
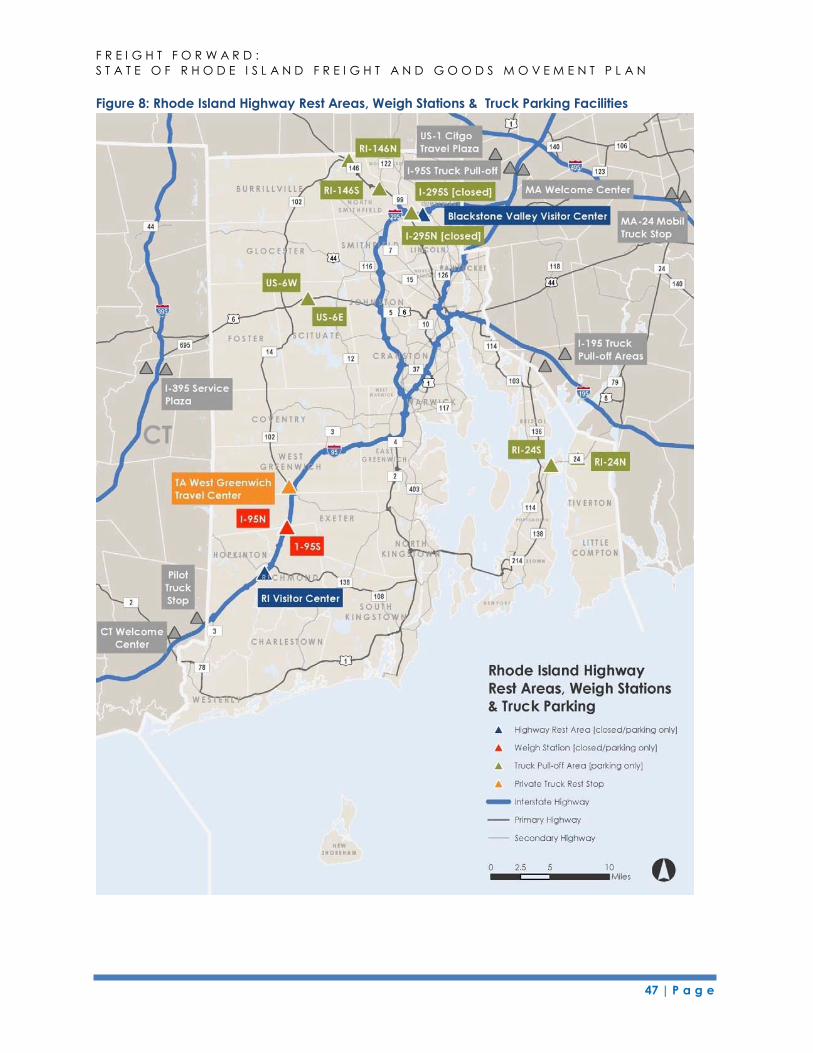
47 | P a g e
F R E I G H T F O R W A R D :
S T A T E O F R H O D E I S L A N D F R E I G H T A N D G O O D S M O V E M E N T P L A N
Figure 8: Rhode Island Highway Rest Areas, Weigh Stations & Truck Parking Facilities
48 | P a g e
F R E I G H T F O R W A R D :
S T A T E O F R H O D E I S L A N D F R E I G H T A N D G O O D S M O V E M E N T P L A N
4.5 Freight Railways
4.5.1 Regional Context
While Rhode Island does not have any Class I railroads, the regional connections to
other railroads is an important factor in Rhode Island’s freight railroad system (see Figure
9). The Providence and Worcester Railroad Company, a Class II railroad, provides
connections with four other Class I railroads in New England, including CSX at
Worcester, Massachusetts and Pan Am Southern Railroad (PAS) in Gardner,
Massachusetts. P&W also connects to the Canadian National (CN) and Canadian
Pacific (CP) railroad system through haulage agreements and connections to the New
England Central Railroad (NECR) and the Vermont Railway System (VRS) in Connecticut
and Vermont. By connecting with these four Class I railroads, P&W freight rail customers
can route shipments across North America including robust connections to the Mid-
Atlantic and eastern Gulf of Mexico ports.
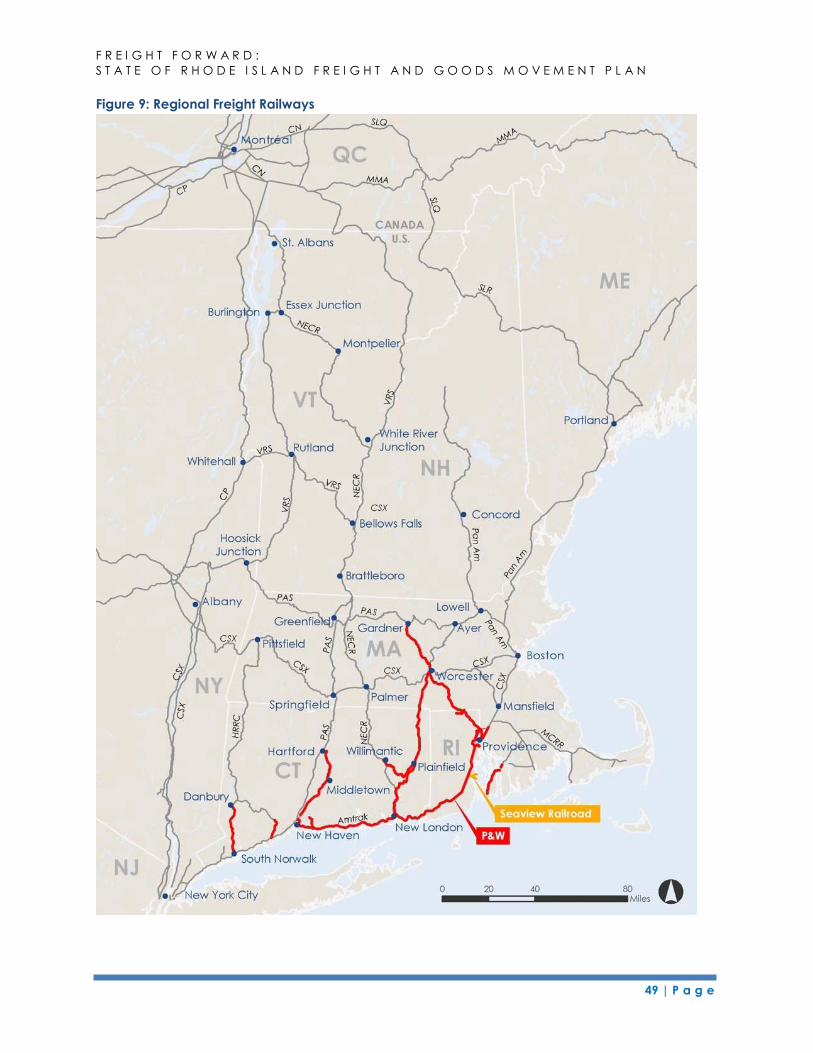
49 | P a g e
F R E I G H T F O R W A R D :
S T A T E O F R H O D E I S L A N D F R E I G H T A N D G O O D S M O V E M E N T P L A N
Figure 9: Regional Freight Railways
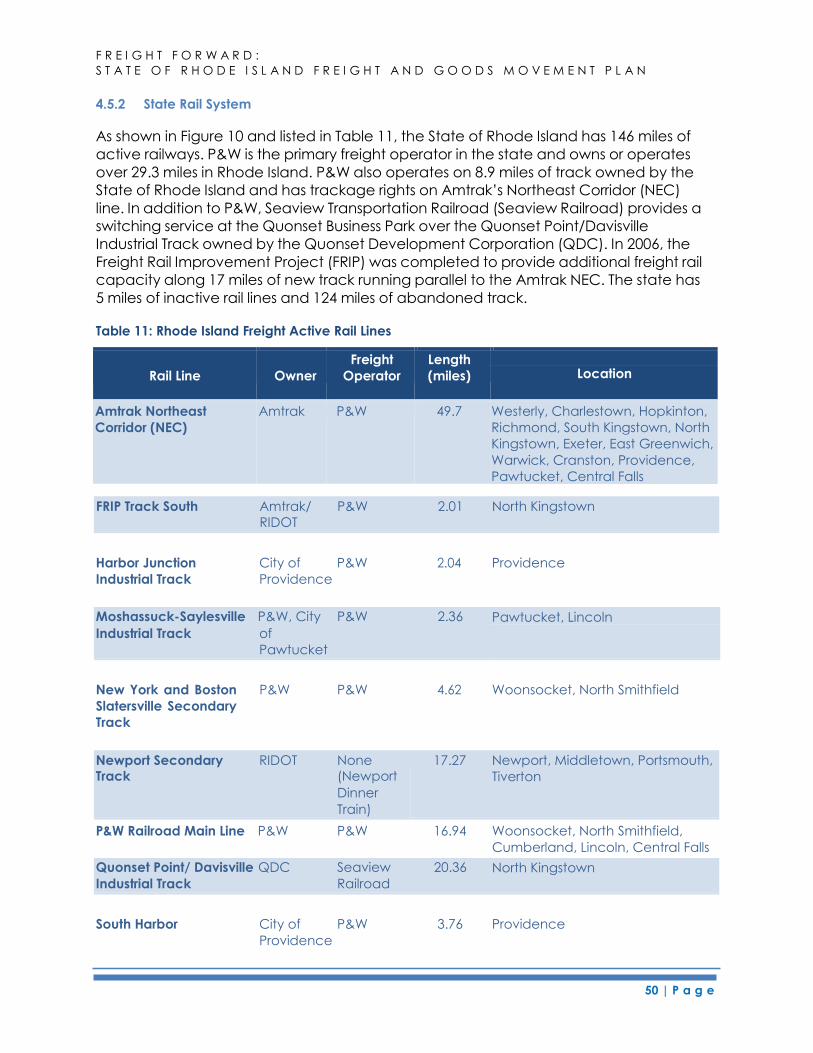
F R E I G H T F O R W A R D :
S T A T E O F R H O D E I S L A N D F R E I G H T A N D G O O D S M O V E M E N T P L A N
4.5.2 State Rail System
50 | P a g e
As shown in Figure 10 and listed in Table 11, the State of Rhode Island has 146 miles of
active railways. P&W is the primary freight operator in the state and owns or operates
over 29.3 miles in Rhode Island. P&W also operates on 8.9 miles of track owned by the
State of Rhode Island and has trackage rights on Amtrak’s Northeast Corridor (NEC)
line. In addition to P&W, Seaview Transportation Railroad (Seaview Railroad) provides a
switching service at the Quonset Business Park over the Quonset Point/Davisville
Industrial Track owned by the Quonset Development Corporation (QDC). In 2006, the
Freight Rail Improvement Project (FRIP) was completed to provide additional freight rail
capacity along 17 miles of new track running parallel to the Amtrak NEC. The state has
5 miles of inactive rail lines and 124 miles of abandoned track.
Table 11: Rhode Island Freight Active Rail Lines
Rail Line
Owner
Freight
Operator
Length
(miles)
Location
Amtrak Northeast
Corridor (NEC)
Amtrak P&W 49.7 Westerly, Charlestown, Hopkinton,
Richmond, South Kingstown, North
Kingstown, Exeter, East Greenwich,
Warwick, Cranston, Providence,
Pawtucket, Central Falls
FRIP Track South Amtrak/ P&W 2.01
RIDOT
North Kingstown
Harbor Junction
Industrial Track
City of
Providence
P&W 2.04 Providence
Moshassuck-Saylesville P&W, City P&W 2.36
Industrial Track of
Pawtucket
Pawtucket, Lincoln
New York and Boston
Slatersville Secondary
Track
P&W P&W 4.62 Woonsocket, North Smithfield
Newport Secondary RIDOT None Track (Newport
Dinner
Train)
17.27 Newport, Middletown, Portsmouth,
Tiverton
P&W Railroad Main Line P&W P&W 16.94 Woonsocket, North Smithfield,
Cumberland, Lincoln, Central Falls
Quonset Point/ Davisville QDC Seaview 20.36
Industrial Track Railroad
North Kingstown
South Harbor City of
Providence
P&W 3.76 Providence
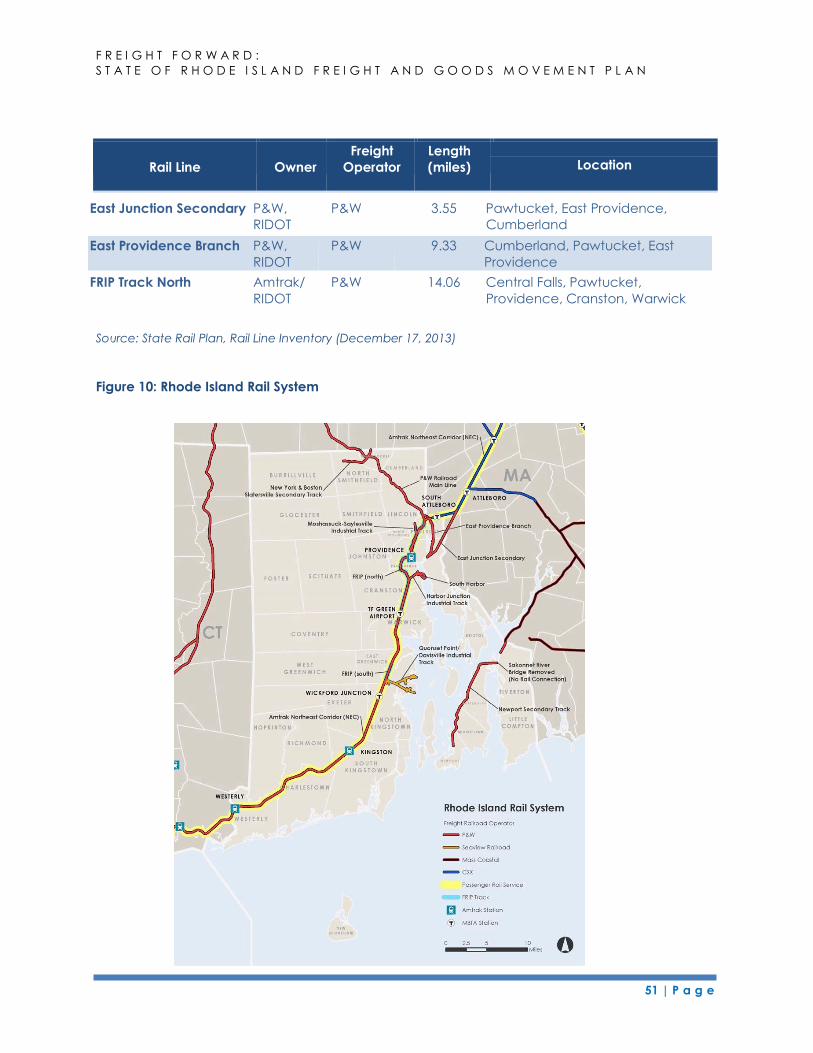
51 | P a g e
F R E I G H T F O R W A R D :
S T A T E O F R H O D E I S L A N D F R E I G H T A N D G O O D S M O V E M E N T P L A N
Rail Line
Owner
Freight
Operator
Length
(miles)
Location
Source: State Rail Plan, Rail Line Inventory (December 17, 2013)
Figure 10: Rhode Island Rail System
East Junction Secondary P&W,
RIDOT
P&W 3.55 Pawtucket, East Providence,
Cumberland
East Providence Branch P&W,
RIDOT
P&W 9.33 Cumberland, Pawtucket, East
Providence
FRIP Track North Amtrak/
RIDOT
P&W 14.06 Central Falls, Pawtucket,
Providence, Cranston, Warwick
52 | P a g e
F R E I G H T F O R W A R D :
S T A T E O F R H O D E I S L A N D F R E I G H T A N D G O O D S M O V E M E N T P L A N
In 2013, 1.6 percent of the state’s freight tonnage, or 684,000 tons, was moved by rail.26
These industries depend on the freight rail as a cost effective transportation option.
Industries include plastic manufacturing, lumber distribution, seafood, automobile
distribution operations, and metal recycling. At 93 percent, the vast majority of the
state’s rail freight is inbound traffic. Six percent is outbound traffic and only one percent
is through-traffic. Freight rail tonnage is projected to grow by 2.9 percent between 2013
and 2030. The value of the cargo is expected to grow even more, with an increase of 3.4 percent over the same period.
In 2012, the Association of American Railroads reported that 12,700 railcars were
shipped to or from Rhode Island locations.27 The majority of the shipments were inbound
carloads, with 12,200 carloads terminating in Rhode Island. The inbound carloads
include automobiles to the Port of Davisville, cement and ethanol to ProvPort, forest
products to Pawtucket, and plastic to Quonset Business Park, Woonsocket, and
Pawtucket. Outbound carloads include coal, limestone, aluminum oxide from ProvPort,
and scrap metal from Pawtucket and Providence.28
Because the state does not have a Class I railway, Rhode Island sees limited through-rail
traffic. The primary freight that moves through the state is destined for a steel
manufacturer in Massachusetts. Most regional rail traffic runs through Connecticut or
Massachusetts, in areas with less congestion and less competition with passenger rail
service.
4.5.3 Providence & Worcester Railroad (P&W)
The Providence and Worcester Railroad Company is a Class II railroad that operates in
Massachusetts, Rhode Island, Connecticut, and New York. System-wide, P&W owns or
operates on 516 miles of track. In Rhode Island, P&W owns and operates on over 29.3
miles of tracks. P&W operates on an additional 8.9 miles owned by the State of Rhode
Island. They also have trackage rights over Amtrak’s Northeast Corridor line from
Providence to New York City.
P&W connects with the national rail network through interchanges with Class I and
other railroads at various locations in New England and New York, including:
CSX at Worcester, Massachusetts and New Haven, Connecticut;
Pan Am Railways at Worcester;
26 IHS Inc., Rhode Island: Trends in the Rail Industry, June 22, 2015. 27 Association of American Railroads, Freight Railroads in Rhode Island Fact Sheet, July 2014.
https://www.aar.org/Style%20Library/railroads_and_states/dist/data/pdf/Rhode-Island%202012.pdf. 28 State Rail Plan, 2014.
53 | P a g e
F R E I G H T F O R W A R D :
S T A T E O F R H O D E I S L A N D F R E I G H T A N D G O O D S M O V E M E N T P L A N
Pan Am Southern and Norfolk Southern at Gardner, Massachusetts;
New England Central Railroad (NECR) at New London, Connecticut and
Willimantic, Connecticut; and New York and Atlantic Railroad at Fresh Pond Junction on Long Island, New York.
The major commodities carried by the P&W are automobiles, construction aggregates,
iron and steel products, chemicals and plastics, lumber, scrap materials, plastic resins,
cement, coal, construction and demolition debris, and processed foods.29
As previously shown on Figure 10, the following rail lines are owned and/or operated
over by P&W: the P&W Railroad Main Line, the East Providence Branch, the Harbor
Junction Industrial Track, the Moshassuck–Saylesville Industrial Track, Amtrak’s NEC, the
Newport Secondary Track, the New York and Boston-Slatersville Secondary Track, and
the South Harbor Track.
4.5.4 Seaview Railroad
The Seaview Railroad is a Class III Railroad and operates over the Quonset
Point/Davisville Industrial Track within the Quonset Business Park in North Kingstown,
Rhode Island. The Railroad operates over 20.36 miles of track within the park, including
on-dock rail service to the Port of Davisville. The Quonset Point/Davisville Industrial Track
interchanges with P&W at the West Davisville Switch on Amtrak’s NEC, near old Baptist
Road and Devil’s Foot Road in North Kingstown. Seaview Railroad’s connection to the
P&W provides access to several national Class I and II railroads. The location of the
railroad and the districts within the Quonset Business Park are shown in Figure 11.
29 State Rail Plan, 2014.
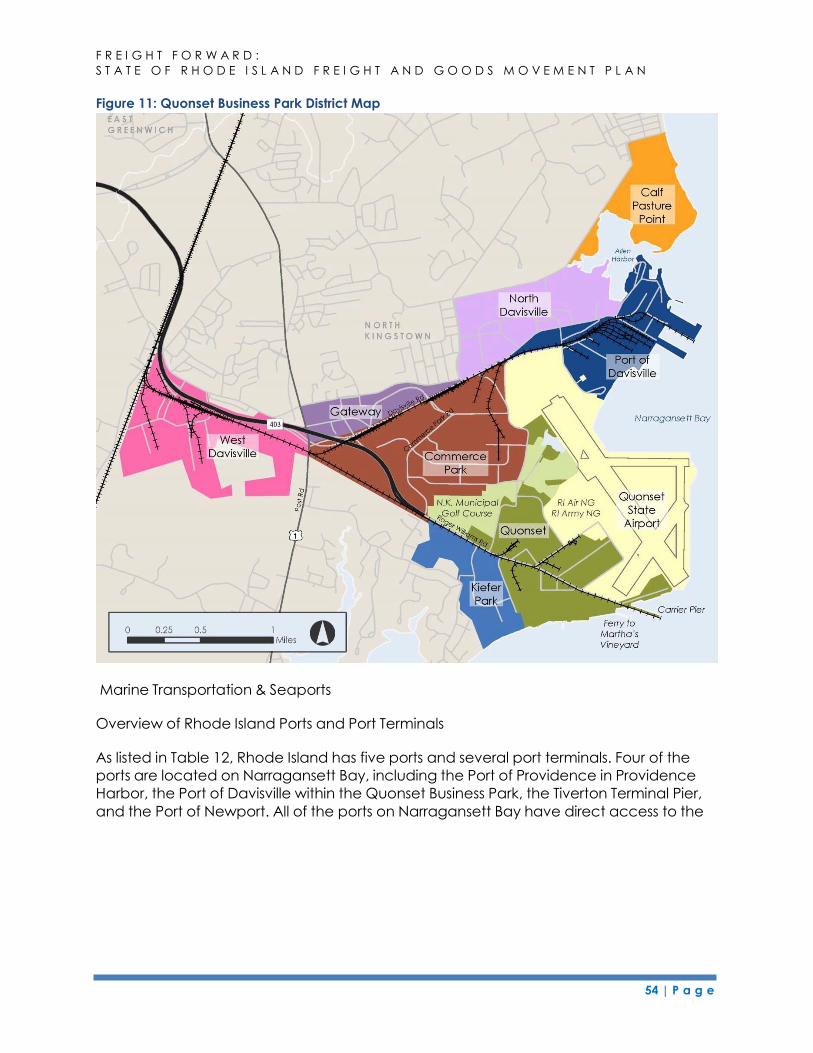
54 | P a g e
F R E I G H T F O R W A R D :
S T A T E O F R H O D E I S L A N D F R E I G H T A N D G O O D S M O V E M E N T P L A N
Figure 11: Quonset Business Park District Map
Marine Transportation & Seaports
Overview of Rhode Island Ports and Port Terminals
As listed in Table 12, Rhode Island has five ports and several port terminals. Four of the
ports are located on Narragansett Bay, including the Port of Providence in Providence
Harbor, the Port of Davisville within the Quonset Business Park, the Tiverton Terminal Pier,
and the Port of Newport. All of the ports on Narragansett Bay have direct access to the
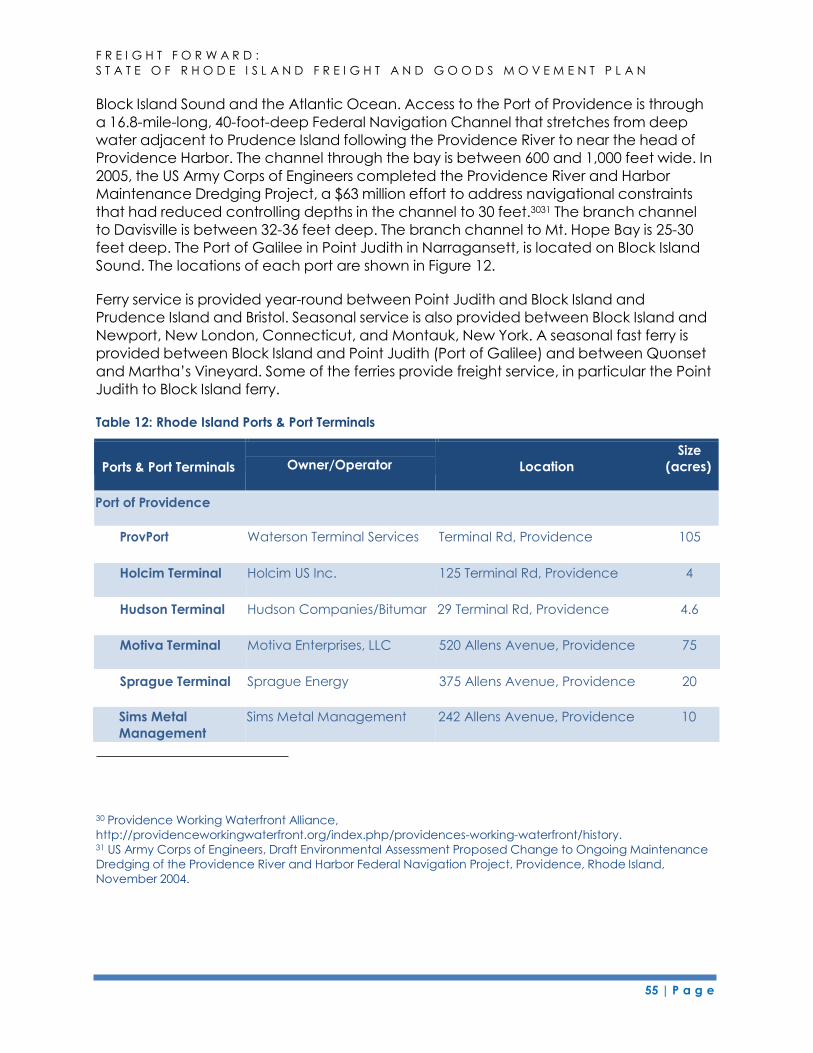
55 | P a g e
F R E I G H T F O R W A R D :
S T A T E O F R H O D E I S L A N D F R E I G H T A N D G O O D S M O V E M E N T P L A N
Block Island Sound and the Atlantic Ocean. Access to the Port of Providence is through
a 16.8-mile-long, 40-foot-deep Federal Navigation Channel that stretches from deep
water adjacent to Prudence Island following the Providence River to near the head of
Providence Harbor. The channel through the bay is between 600 and 1,000 feet wide. In
2005, the US Army Corps of Engineers completed the Providence River and Harbor
Maintenance Dredging Project, a $63 million effort to address navigational constraints
that had reduced controlling depths in the channel to 30 feet.3031 The branch channel
to Davisville is between 32-36 feet deep. The branch channel to Mt. Hope Bay is 25-30
feet deep. The Port of Galilee in Point Judith in Narragansett, is located on Block Island
Sound. The locations of each port are shown in Figure 12.
Ferry service is provided year-round between Point Judith and Block Island and
Prudence Island and Bristol. Seasonal service is also provided between Block Island and
Newport, New London, Connecticut, and Montauk, New York. A seasonal fast ferry is
provided between Block Island and Point Judith (Port of Galilee) and between Quonset
and Martha’s Vineyard. Some of the ferries provide freight service, in particular the Point
Judith to Block Island ferry.
Table 12: Rhode Island Ports & Port Terminals
Ports & Port Terminals
Size
Location (acres) Owner/Operator
Port of Providence
ProvPort Waterson Terminal Services Terminal Rd, Providence 105
Hudson Terminal Hudson Companies/Bitumar 29 Terminal Rd, Providence 4.6
Sprague Terminal Sprague Energy 375 Allens Avenue, Providence 20
Sims Metal
Management
Sims Metal Management 242 Allens Avenue, Providence 10
30 Providence Working Waterfront Alliance,
http://providenceworkingwaterfront.org/index.php/providences-working-waterfront/history. 31 US Army Corps of Engineers, Draft Environmental Assessment Proposed Change to Ongoing Maintenance
Dredging of the Providence River and Harbor Federal Navigation Project, Providence, Rhode Island,
November 2004.
Holcim Terminal Holcim US Inc. 125 Terminal Rd, Providence 4
Motiva Terminal Motiva Enterprises, LLC 520 Allens Avenue, Providence 75
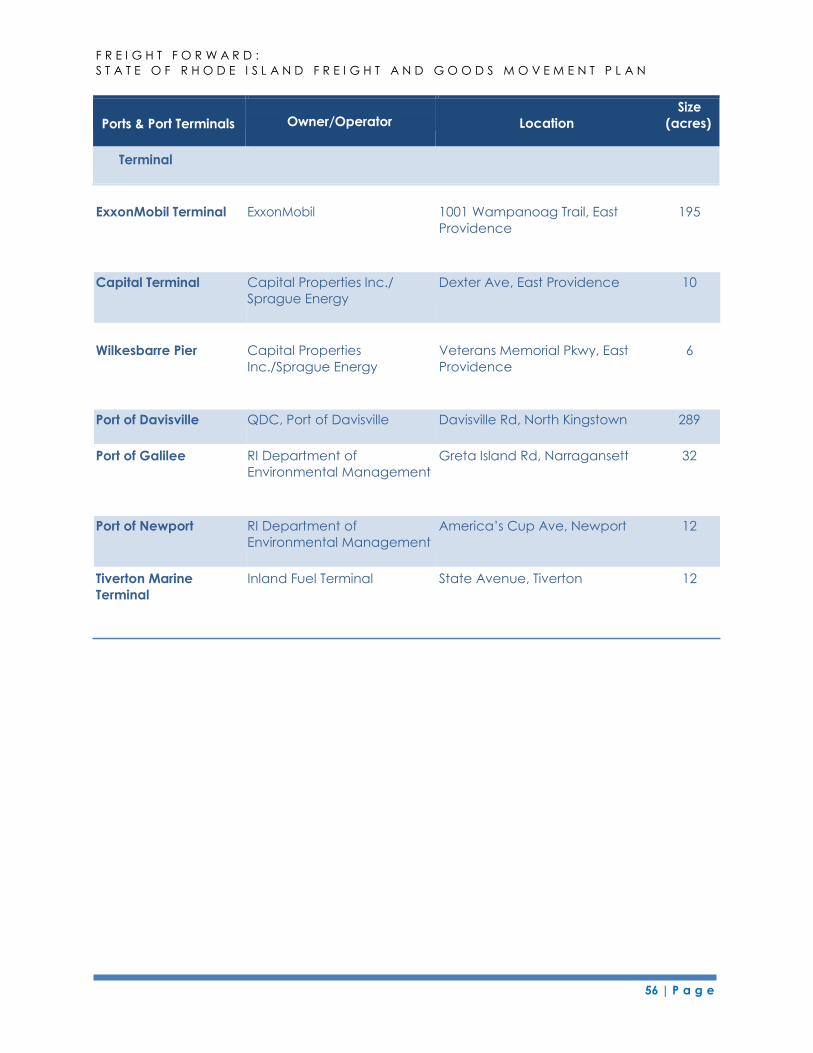
56 | P a g e
F R E I G H T F O R W A R D :
S T A T E O F R H O D E I S L A N D F R E I G H T A N D G O O D S M O V E M E N T P L A N
Ports & Port Terminals
Size
Location (acres) Owner/Operator
Terminal
ExxonMobil Terminal ExxonMobil 1001 Wampanoag Trail, East
Providence
195
Capital Terminal Capital Properties Inc./
Sprague Energy
Dexter Ave, East Providence 10
Wilkesbarre Pier Capital Properties
Inc./Sprague Energy
Veterans Memorial Pkwy, East 6
Providence
Port of Galilee RI Department of
Environmental Management
Greta Island Rd, Narragansett 32
Tiverton Marine
Terminal
Inland Fuel Terminal State Avenue, Tiverton 12
Port of Davisville QDC, Port of Davisville Davisville Rd, North Kingstown 289
Port of Newport RI Department of
Environmental Management
America’s Cup Ave, Newport 12
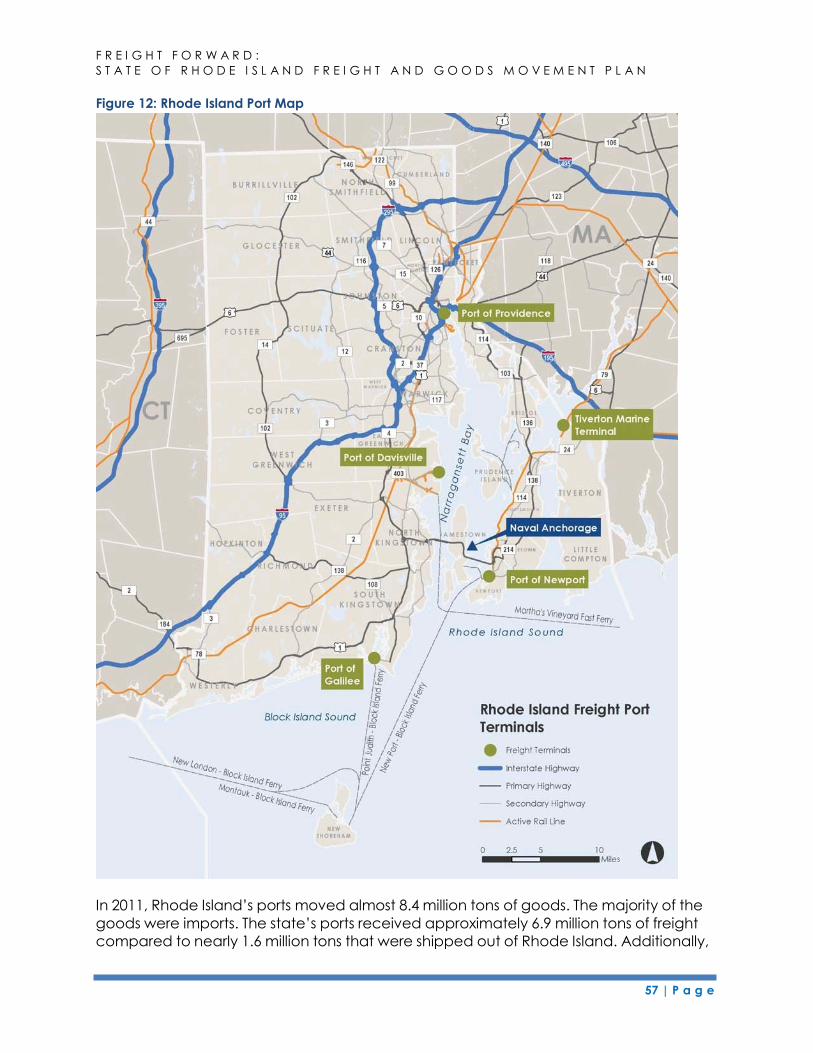
57 | P a g e
F R E I G H T F O R W A R D :
S T A T E O F R H O D E I S L A N D F R E I G H T A N D G O O D S M O V E M E N T P L A N
Figure 12: Rhode Island Port Map
In 2011, Rhode Island’s ports moved almost 8.4 million tons of goods. The majority of the
goods were imports. The state’s ports received approximately 6.9 million tons of freight
compared to nearly 1.6 million tons that were shipped out of Rhode Island. Additionally,
58 | P a g e
F R E I G H T F O R W A R D :
S T A T E O F R H O D E I S L A N D F R E I G H T A N D G O O D S M O V E M E N T P L A N
the majority of the goods shipped into Rhode Island originate in foreign ports. In 2014,
the top three originating ports by the number of vessels that arrived in Rhode Island ports
were Veracruz, Mexico; Emden, Germany; and Kawasaki, Japan. A number of
vessels also arrived from St. John, Canada; Amsterdam, Netherlands; and Fawley and
Milford Haven in the United Kingdom. The majority of products or goods that originate in
Rhode Island are destined for foreign ports (31 percent) or New Jersey (29 percent).32
4.5.5 Port of Providence Terminals
The Port of Providence includes several port terminals located adjacent to Providence
Harbor, the Providence River, and the Seekonk River in Providence and East Providence.
As shown in Figure 13, the northern limits of the Port of Providence include
the area between the Providence River hurricane barrier near the I-195 bridge in
Providence and Fields Point near the Providence-Cranston city line. To the east, the Port
of Providence also includes the area along the eastern banks of the Seekonk River
between Walker Point and Bold Point in East Providence. The Port of Providence also
includes the Exxon Mobil facility near Ponham Rocks in East Providence.
As shown in Figure 13, the Port of Providence includes numerous terminals, the largest of
which is ProvPort. The other marine terminals, including ExxonMobil, Sprague, Motiva,
and Capital are located along Allens Avenue, near ProvPort, or across the water in East
Providence. The Allens Avenue Area is located just north of ProvPort between Thurbers
Avenue and the hurricane barrier. This area includes several terminals including Sprague
and Sims Metal Management. In East Providence, Capital terminal is located along
the Seekonk River and ExxonMobil is located near Ponham Rocks.
ProvPort has rail access via the Harbor Junction Industrial Track and South Harbor rail
lines. The port terminals along Allens Avenue are no longer served by rail. The East
Providence terminals also previously had rail access. All of the terminals in the Port of
Providence are in close proximity to I-95 or I-195. Roadway access to and from some of
the terminals is challenging in some cases due to narrow local roadways and routing
required to access interstate ramps.
The protection of the working waterfront for maritime and industrial uses in Providence
Harbor is an important issue for the future of the port terminals. Recognizing the
importance of these area’s impact on the economy and the need to ensure the ability
of the ports to continue and expand operations as needed, the City of Providence
enacted working waterfront zoning regulations in 2014. The Port of Providence is an
important economic asset and the protection of these maritime uses is part of the City
32 US Army Corps of Engineers, Navigation Data Center, CY 2011 Waterborne Tonnage by State,
http://www.navigationcenter.us/wcsc/statetnm11.htm.
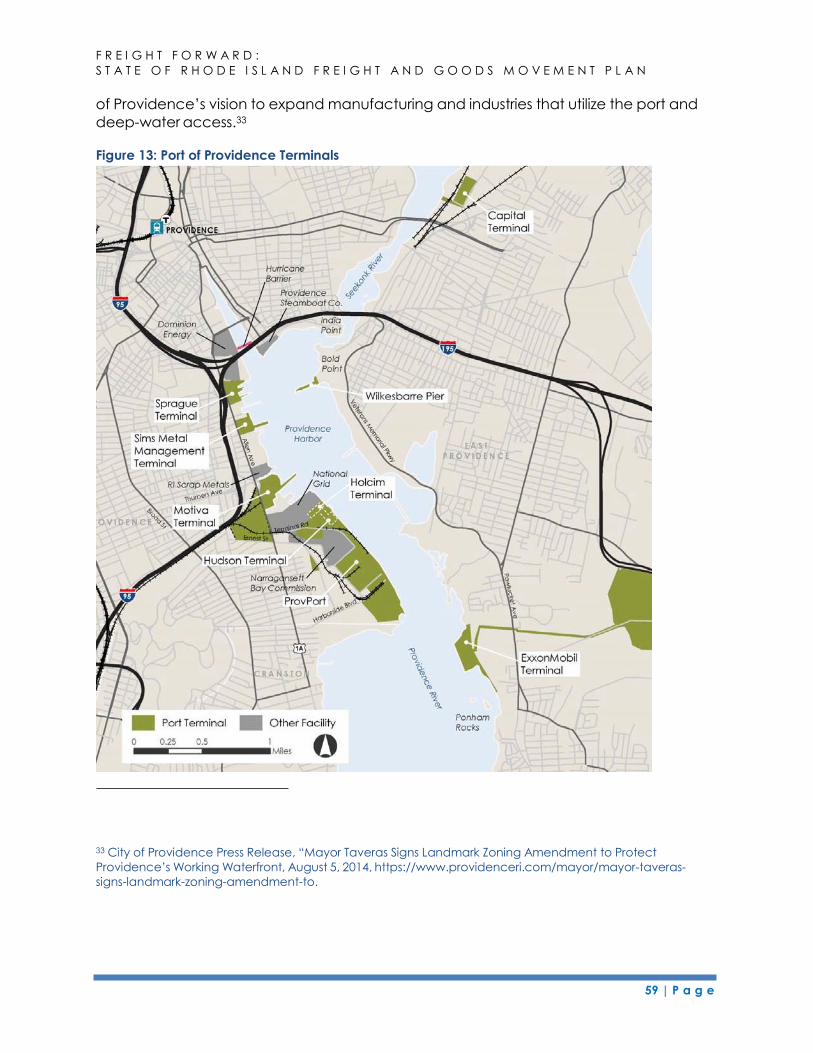
59 | P a g e
F R E I G H T F O R W A R D :
S T A T E O F R H O D E I S L A N D F R E I G H T A N D G O O D S M O V E M E N T P L A N
of Providence’s vision to expand manufacturing and industries that utilize the port and
deep-water access.33
Figure 13: Port of Providence Terminals
33 City of Providence Press Release, “Mayor Taveras Signs Landmark Zoning Amendment to Protect
Providence’s Working Waterfront, August 5, 2014, https://www.providenceri.com/mayor/mayor-taveras-
signs-landmark-zoning-amendment-to.
F R E I G H T F O R W A R D :
S T A T E O F R H O D E I S L A N D F R E I G H T A N D G O O D S M O V E M E N T P L A N
60 | P a g e
4.5.5.1 ProvPort
The largest terminal in Providence Harbor is ProvPort, a 105-acre site located on the
west side of the Narragansett Bay. Waterson Terminal Services is the exclusive terminal
management operation at ProvPort. With six berths, ranging in length from 450 to 688
feet, ProvPort has 3,500 lineal feet berthing space. All the berths have a maximum
depth of 40 feet at mean low water (MLW).
Landside, ProvPort has 300,000 square feet of warehouse space, a petroleum tank farm,
a fuel depot station, a secured scale house and operation center, and two on-dock
cement storage facilities. ProvPort can handle dry, liquid, and break bulk commodities
for both imports and exports. The port handles cement, chemicals, coal, cobblestone,
heavy machinery, liquid petroleum products, lumber, pearlite, salt, scrap metal, project
cargo, and steel products.
The port was awarded a $10.5 million US DOT Transportation Investment Generating
Economic Recovery (TIGER) discretionary grant in 2010 to fund the purchase and
installation of two high performance mobile harbor cranes. The $21 million project was
completed in 2013. The cranes enhanced the port’s ability to continue its existing bulk
material operations while expanding its capabilities to accommodate container
operations.34
Tenants at ProvPort include:35
Univar USA is a packager and distributor for specialty chemicals. Their
administrative headquarters, processing plant, and distribution facility are
located within and adjacent to ProvPort.
Enterprise Products and Terminals is a subsidiary of Duke Energy. Their ProvPort
facility is a major propane distribution terminal in TEPPCO’s New England market.
Glens Falls-Lehigh Cement operates a cement distribution facility with a 35,000-
ton capacity.
Schnitzer Steel Industries is a scrap metal processing facility that exports scrap
metal by barge and vessel.
International Salt operates a salt and chemical company that distributes road
salt throughout southern New England.
EUKOR Auto Carriers exports used cars, primarily to West Africa.
34 ProvPort, Senator Jack Reed Press Announcement, October 15, 2010.
http://www.provport.com/10152010release.html. 35 ProvPort, Tenants List, http://www.provport.com/overview.html.
F R E I G H T F O R W A R D :
S T A T E O F R H O D E I S L A N D F R E I G H T A N D G O O D S M O V E M E N T P L A N
61 | P a g e
New England Petroleum. New England Petroleum is a partnership between
Hudson and Global Partners LP. New England Petroleum has a 55.8 million gallon
annual throughput. A new 16.5 million gallon tank farm is under construction.
Washington Mills imports aluminum oxide for manufacture of sandpaper and
grinding gears.
4.5.5.2 Other Ports and Terminals in the Port of Providence
In addition to ProvPort, several other marine terminals are located in the Providence
Harbor, Providence River, and Seekonk River area.36 These terminals are shown in Figure
13.
ExxonMobil Terminal. Located in East Providence near the Ponham Rocks
lighthouse, the ExxonMobil terminal handles bulk liquid product including refined
fuels and chemicals. The terminal has a one million barrel storage capacity. The
terminal handles approximately 125 barges and 50-60 tankers each year. The
terminal serves as a sea-to-shore link for the petroleum pipeline that connects to
facilities in Springfield, Massachusetts.
Sprague Energy Terminal. The Sprague terminal is located at the northern end of
the Allens Avenue near the I-95 and I-195 interchange. Sprague’s 20-acre facility
has a 36-foot deep berth and handles dry bulk cargo (primarily road salt) and
liquid bulk cargo.37 The terminal has a 100,000-ton dry bulk capacity and 700,000-
barrel liquid bulk cargo capacity. Sprague can handle #2 fuel, #6 oil, diesel fuel,
and liquid asphalt. The facility has a natural gas transfer pipeline to Dominion
Energy’s Manchester Street Power Station, which is located north of I-95. This
power plant supplies power to the Rhode Island Hospital and residential users in
Providence. The terminal handled approximately 80 inbound vessels in 2014.
Capital Terminal. Owned by the Capital Properties Inc. through its subsidiary
Dunellen, LLC, the 10-acre Capital Terminal is located in East Providence north of
I-195 along the eastern banks of the Seekonk River. The company also owns the
Wilkesbarre pier near Bold Point in East Providence. The two facilities were
previously leased by Global Companies, LLC, but the lease expired in 2013.38
Neither area has rail access, but both terminals are located in close proximity to
I-195. Currently operated by Sprague Operating Resources LLC, the Capital
Terminal is a petroleum off loading point for diesel and home heating fuel. In
2014, the terminal handled 25 inbound vessels.
36 Moran Shipping Agencies, Inc., Rhode Island Ports, http://ri.ports.moranshipping.com/default.aspx. 37 Sprague Energy, Providence, Rhode Island terminal,
https://www.spragueenergy.com/refinedproducts/terminals/providence-ri. 38Capital Properties Inc., 2014 Annual Report, http://capitalpropertiesinc.com/files/annual-
reports/2014/10K_Annual_Report_Year_End_12-31-2014.pdf.
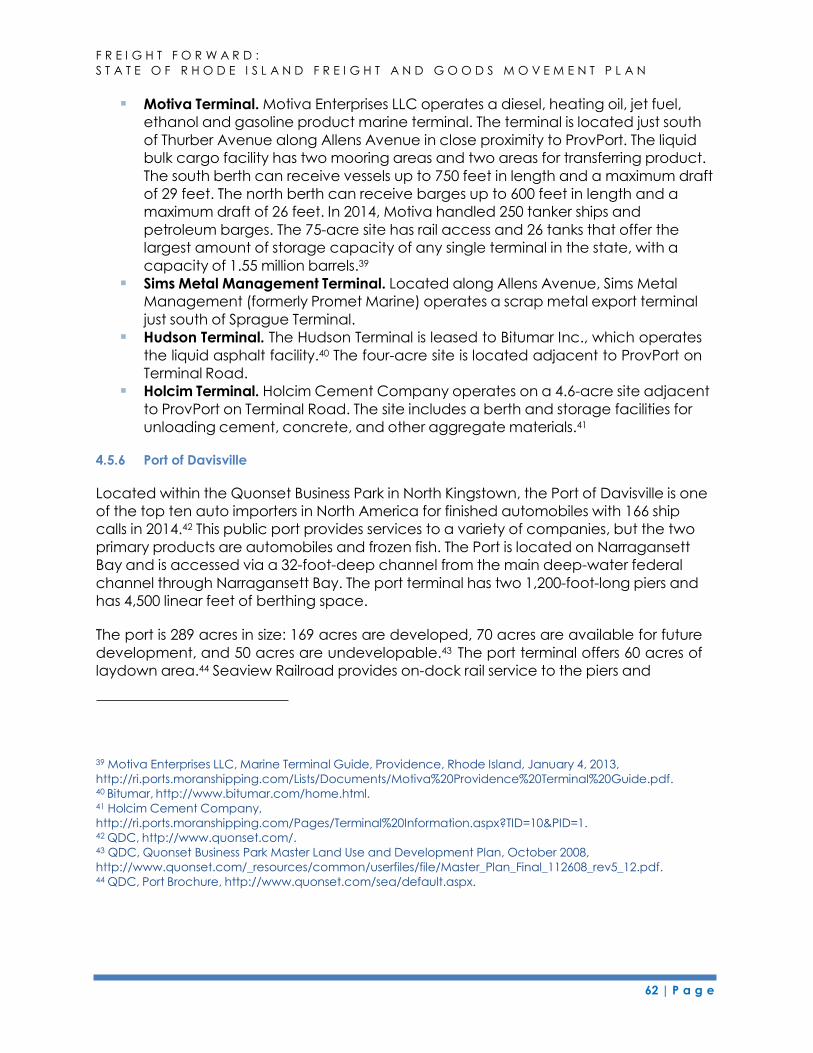
F R E I G H T F O R W A R D :
S T A T E O F R H O D E I S L A N D F R E I G H T A N D G O O D S M O V E M E N T P L A N
62 | P a g e
Motiva Terminal. Motiva Enterprises LLC operates a diesel, heating oil, jet fuel,
ethanol and gasoline product marine terminal. The terminal is located just south
of Thurber Avenue along Allens Avenue in close proximity to ProvPort. The liquid
bulk cargo facility has two mooring areas and two areas for transferring product.
The south berth can receive vessels up to 750 feet in length and a maximum draft
of 29 feet. The north berth can receive barges up to 600 feet in length and a
maximum draft of 26 feet. In 2014, Motiva handled 250 tanker ships and
petroleum barges. The 75-acre site has rail access and 26 tanks that offer the
largest amount of storage capacity of any single terminal in the state, with a
capacity of 1.55 million barrels.39
Sims Metal Management Terminal. Located along Allens Avenue, Sims Metal
Management (formerly Promet Marine) operates a scrap metal export terminal
just south of Sprague Terminal.
Hudson Terminal. The Hudson Terminal is leased to Bitumar Inc., which operates
the liquid asphalt facility.40 The four-acre site is located adjacent to ProvPort on
Terminal Road.
Holcim Terminal. Holcim Cement Company operates on a 4.6-acre site adjacent
to ProvPort on Terminal Road. The site includes a berth and storage facilities for
unloading cement, concrete, and other aggregate materials.41
4.5.6 Port of Davisville
Located within the Quonset Business Park in North Kingstown, the Port of Davisville is one
of the top ten auto importers in North America for finished automobiles with 166 ship
calls in 2014.42 This public port provides services to a variety of companies, but the two
primary products are automobiles and frozen fish. The Port is located on Narragansett
Bay and is accessed via a 32-foot-deep channel from the main deep-water federal
channel through Narragansett Bay. The port terminal has two 1,200-foot-long piers and
has 4,500 linear feet of berthing space.
The port is 289 acres in size: 169 acres are developed, 70 acres are available for future
development, and 50 acres are undevelopable.43 The port terminal offers 60 acres of
laydown area.44 Seaview Railroad provides on-dock rail service to the piers and
39 Motiva Enterprises LLC, Marine Terminal Guide, Providence, Rhode Island, January 4, 2013,
http://ri.ports.moranshipping.com/Lists/Documents/Motiva%20Providence%20Terminal%20Guide.pdf. 40 Bitumar, http://www.bitumar.com/home.html. 41 Holcim Cement Company,
http://ri.ports.moranshipping.com/Pages/Terminal%20Information.aspx?TID=10&PID=1. 42 QDC, http://www.quonset.com/. 43 QDC, Quonset Business Park Master Land Use and Development Plan, October 2008,
http://www.quonset.com/_resources/common/userfiles/file/Master_Plan_Final_112608_rev5_12.pdf. 44 QDC, Port Brochure, http://www.quonset.com/sea/default.aspx.
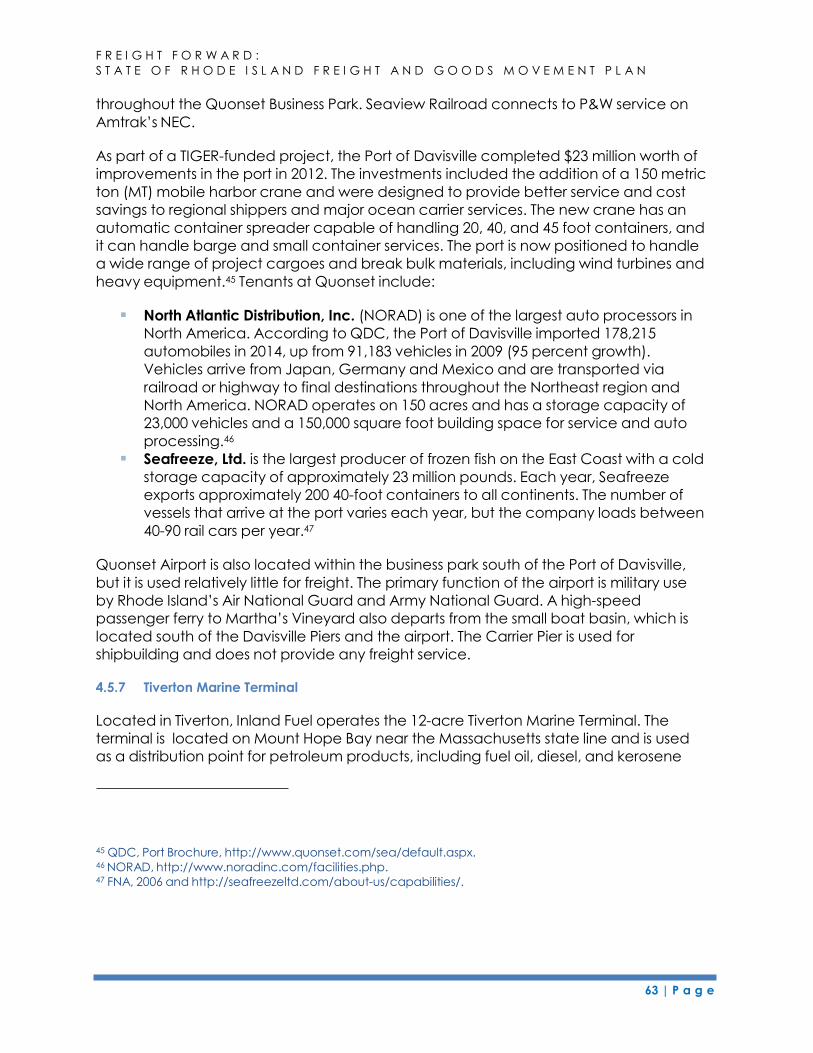
F R E I G H T F O R W A R D :
S T A T E O F R H O D E I S L A N D F R E I G H T A N D G O O D S M O V E M E N T P L A N
63 | P a g e
throughout the Quonset Business Park. Seaview Railroad connects to P&W service on
Amtrak’s NEC.
As part of a TIGER-funded project, the Port of Davisville completed $23 million worth of
improvements in the port in 2012. The investments included the addition of a 150 metric
ton (MT) mobile harbor crane and were designed to provide better service and cost
savings to regional shippers and major ocean carrier services. The new crane has an
automatic container spreader capable of handling 20, 40, and 45 foot containers, and
it can handle barge and small container services. The port is now positioned to handle
a wide range of project cargoes and break bulk materials, including wind turbines and
heavy equipment.45 Tenants at Quonset include:
North Atlantic Distribution, Inc. (NORAD) is one of the largest auto processors in
North America. According to QDC, the Port of Davisville imported 178,215
automobiles in 2014, up from 91,183 vehicles in 2009 (95 percent growth).
Vehicles arrive from Japan, Germany and Mexico and are transported via
railroad or highway to final destinations throughout the Northeast region and
North America. NORAD operates on 150 acres and has a storage capacity of
23,000 vehicles and a 150,000 square foot building space for service and auto
processing.46
Seafreeze, Ltd. is the largest producer of frozen fish on the East Coast with a cold
storage capacity of approximately 23 million pounds. Each year, Seafreeze
exports approximately 200 40-foot containers to all continents. The number of
vessels that arrive at the port varies each year, but the company loads between
40-90 rail cars per year.47
Quonset Airport is also located within the business park south of the Port of Davisville,
but it is used relatively little for freight. The primary function of the airport is military use
by Rhode Island’s Air National Guard and Army National Guard. A high-speed
passenger ferry to Martha’s Vineyard also departs from the small boat basin, which is
located south of the Davisville Piers and the airport. The Carrier Pier is used for
shipbuilding and does not provide any freight service.
4.5.7 Tiverton Marine Terminal
Located in Tiverton, Inland Fuel operates the 12-acre Tiverton Marine Terminal. The
terminal is located on Mount Hope Bay near the Massachusetts state line and is used
as a distribution point for petroleum products, including fuel oil, diesel, and kerosene
45 QDC, Port Brochure, http://www.quonset.com/sea/default.aspx. 46 NORAD, http://www.noradinc.com/facilities.php. 47 FNA, 2006 and http://seafreezeltd.com/about-us/capabilities/.
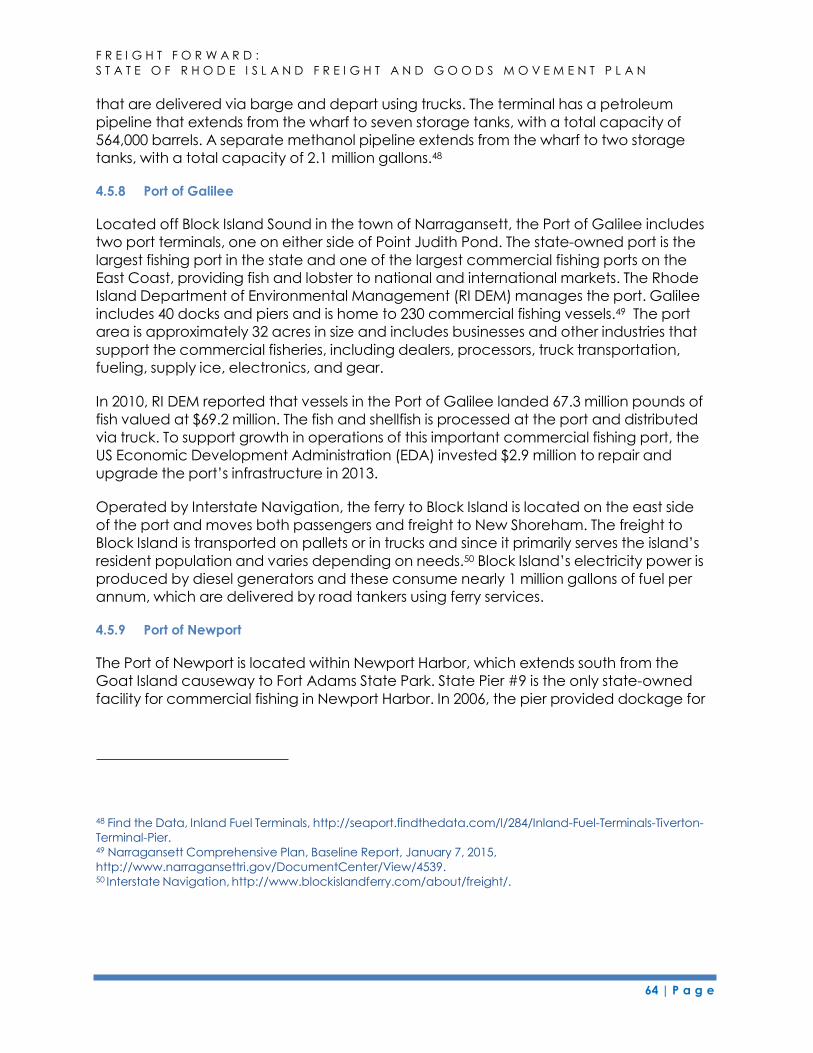
F R E I G H T F O R W A R D :
S T A T E O F R H O D E I S L A N D F R E I G H T A N D G O O D S M O V E M E N T P L A N
64 | P a g e
that are delivered via barge and depart using trucks. The terminal has a petroleum
pipeline that extends from the wharf to seven storage tanks, with a total capacity of
564,000 barrels. A separate methanol pipeline extends from the wharf to two storage
tanks, with a total capacity of 2.1 million gallons.48
4.5.8 Port of Galilee
Located off Block Island Sound in the town of Narragansett, the Port of Galilee includes
two port terminals, one on either side of Point Judith Pond. The state-owned port is the
largest fishing port in the state and one of the largest commercial fishing ports on the
East Coast, providing fish and lobster to national and international markets. The Rhode
Island Department of Environmental Management (RI DEM) manages the port. Galilee
includes 40 docks and piers and is home to 230 commercial fishing vessels.49 The port
area is approximately 32 acres in size and includes businesses and other industries that
support the commercial fisheries, including dealers, processors, truck transportation,
fueling, supply ice, electronics, and gear.
In 2010, RI DEM reported that vessels in the Port of Galilee landed 67.3 million pounds of
fish valued at $69.2 million. The fish and shellfish is processed at the port and distributed
via truck. To support growth in operations of this important commercial fishing port, the
US Economic Development Administration (EDA) invested $2.9 million to repair and
upgrade the port’s infrastructure in 2013.
Operated by Interstate Navigation, the ferry to Block Island is located on the east side
of the port and moves both passengers and freight to New Shoreham. The freight to
Block Island is transported on pallets or in trucks and since it primarily serves the island’s
resident population and varies depending on needs.50 Block Island’s electricity power is
produced by diesel generators and these consume nearly 1 million gallons of fuel per
annum, which are delivered by road tankers using ferry services.
4.5.9 Port of Newport
The Port of Newport is located within Newport Harbor, which extends south from the
Goat Island causeway to Fort Adams State Park. State Pier #9 is the only state-owned
facility for commercial fishing in Newport Harbor. In 2006, the pier provided dockage for
48 Find the Data, Inland Fuel Terminals, http://seaport.findthedata.com/l/284/Inland-Fuel-Terminals-Tiverton-
Terminal-Pier. 49 Narragansett Comprehensive Plan, Baseline Report, January 7, 2015,
http://www.narragansettri.gov/DocumentCenter/View/4539. 50 Interstate Navigation, http://www.blockislandferry.com/about/freight/.
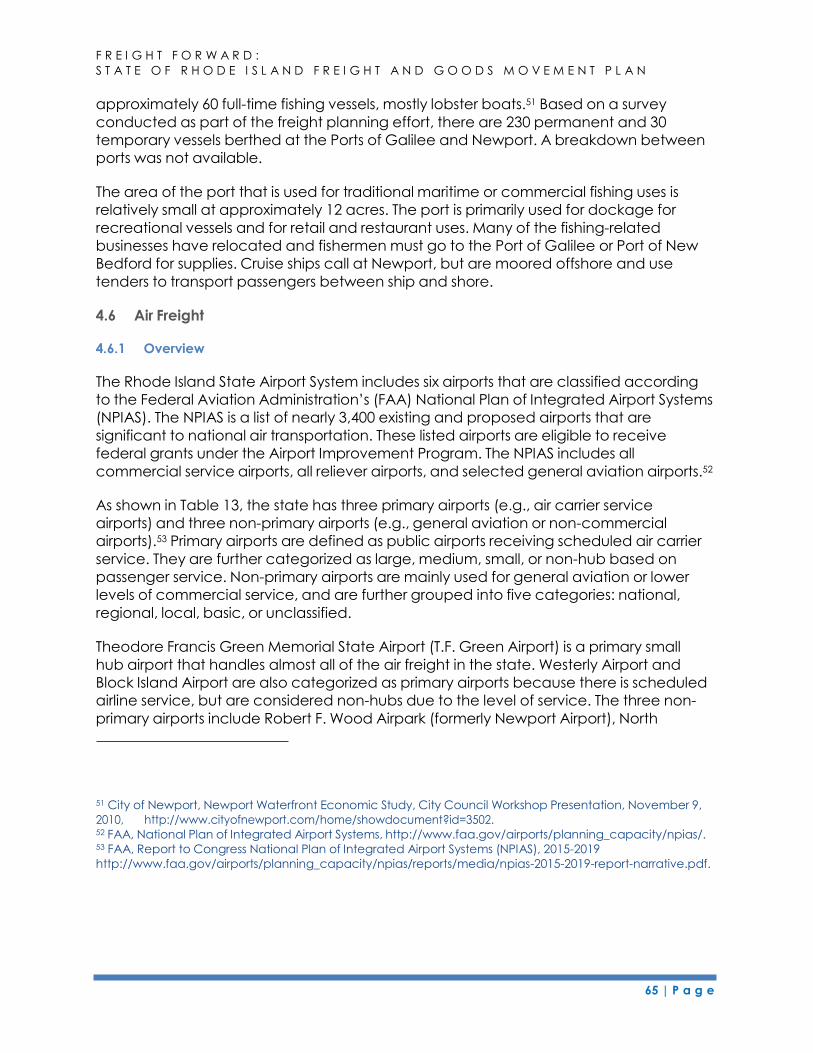
F R E I G H T F O R W A R D :
S T A T E O F R H O D E I S L A N D F R E I G H T A N D G O O D S M O V E M E N T P L A N
65 | P a g e
approximately 60 full-time fishing vessels, mostly lobster boats.51 Based on a survey
conducted as part of the freight planning effort, there are 230 permanent and 30
temporary vessels berthed at the Ports of Galilee and Newport. A breakdown between
ports was not available.
The area of the port that is used for traditional maritime or commercial fishing uses is
relatively small at approximately 12 acres. The port is primarily used for dockage for
recreational vessels and for retail and restaurant uses. Many of the fishing-related
businesses have relocated and fishermen must go to the Port of Galilee or Port of New
Bedford for supplies. Cruise ships call at Newport, but are moored offshore and use
tenders to transport passengers between ship and shore.
4.6 Air Freight
4.6.1 Overview
The Rhode Island State Airport System includes six airports that are classified according
to the Federal Aviation Administration’s (FAA) National Plan of Integrated Airport Systems
(NPIAS). The NPIAS is a list of nearly 3,400 existing and proposed airports that are
significant to national air transportation. These listed airports are eligible to receive
federal grants under the Airport Improvement Program. The NPIAS includes all
commercial service airports, all reliever airports, and selected general aviation airports.52
As shown in Table 13, the state has three primary airports (e.g., air carrier service
airports) and three non-primary airports (e.g., general aviation or non-commercial
airports).53 Primary airports are defined as public airports receiving scheduled air carrier
service. They are further categorized as large, medium, small, or non-hub based on
passenger service. Non-primary airports are mainly used for general aviation or lower
levels of commercial service, and are further grouped into five categories: national,
regional, local, basic, or unclassified.
Theodore Francis Green Memorial State Airport (T.F. Green Airport) is a primary small
hub airport that handles almost all of the air freight in the state. Westerly Airport and
Block Island Airport are also categorized as primary airports because there is scheduled
airline service, but are considered non-hubs due to the level of service. The three non-
primary airports include Robert F. Wood Airpark (formerly Newport Airport), North
51 City of Newport, Newport Waterfront Economic Study, City Council Workshop Presentation, November 9,
2010, http://www.cityofnewport.com/home/showdocument?id=3502. 52 FAA, National Plan of Integrated Airport Systems, http://www.faa.gov/airports/planning_capacity/npias/. 53 FAA, Report to Congress National Plan of Integrated Airport Systems (NPIAS), 2015-2019
http://www.faa.gov/airports/planning_capacity/npias/reports/media/npias-2015-2019-report-narrative.pdf.
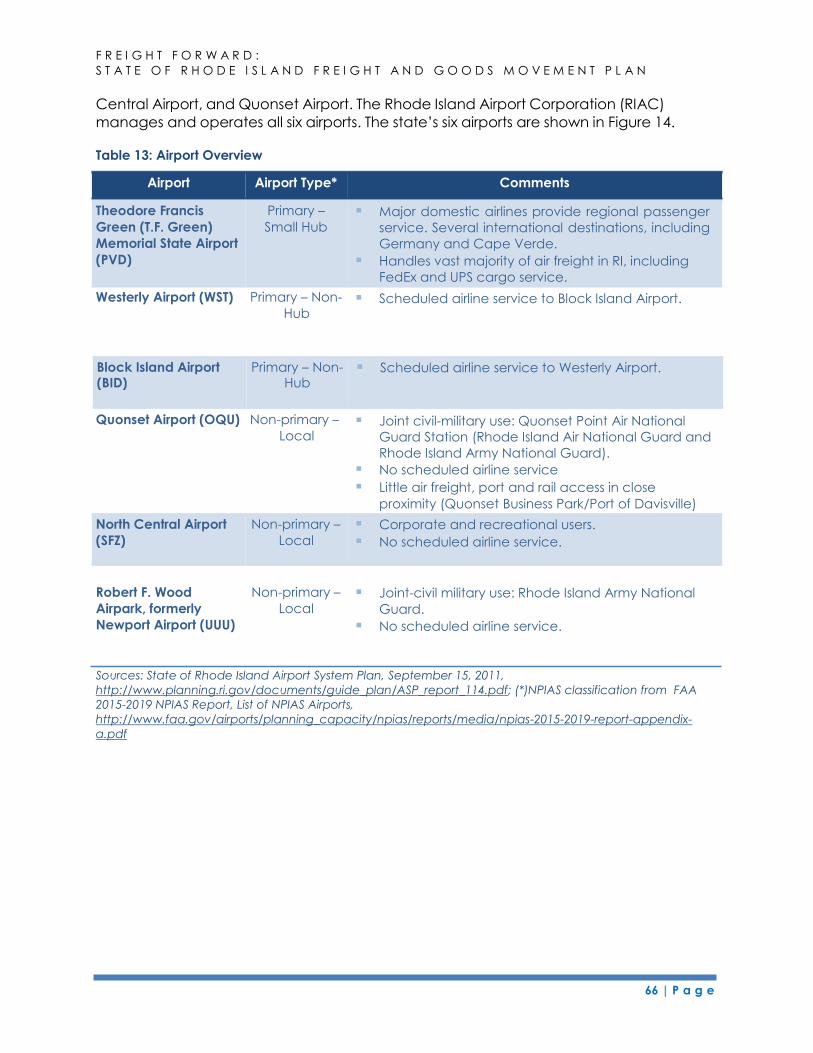
F R E I G H T F O R W A R D :
S T A T E O F R H O D E I S L A N D F R E I G H T A N D G O O D S M O V E M E N T P L A N
66 | P a g e
Central Airport, and Quonset Airport. The Rhode Island Airport Corporation (RIAC)
manages and operates all six airports. The state’s six airports are shown in Figure 14.
Table 13: Airport Overview
Airport Airport Type* Comments
Theodore Francis
Green (T.F. Green)
Memorial State Airport
(PVD)
Primary –
Small Hub Major domestic airlines provide regional passenger
service. Several international destinations, including
Germany and Cape Verde.
Handles vast majority of air freight in RI, including
FedEx and UPS cargo service.
Westerly Airport (WST) Primary – Non-
Hub Scheduled airline service to Block Island Airport.
Quonset Airport (OQU) Non-primary –
Local Joint civil-military use: Quonset Point Air National
Guard Station (Rhode Island Air National Guard and
Rhode Island Army National Guard).
No scheduled airline service
Little air freight, port and rail access in close
proximity (Quonset Business Park/Port of Davisville)
North Central Airport
(SFZ)
Non-primary –
Local
Corporate and recreational users.
No scheduled airline service.
Robert F. Wood
Airpark, formerly
Newport Airport (UUU)
Non-primary –
Local Joint-civil military use: Rhode Island Army National
Guard.
No scheduled airline service.
Sources: State of Rhode Island Airport System Plan, September 15, 2011,
http://www.planning.ri.gov/documents/guide_plan/ASP_report_114.pdf; (*)NPIAS classification from FAA
2015-2019 NPIAS Report, List of NPIAS Airports,
http://www.faa.gov/airports/planning_capacity/npias/reports/media/npias-2015-2019-report-appendix-
a.pdf
Block Island Airport (BID)
Primary – Non- Hub
Scheduled airline service to Westerly Airport.
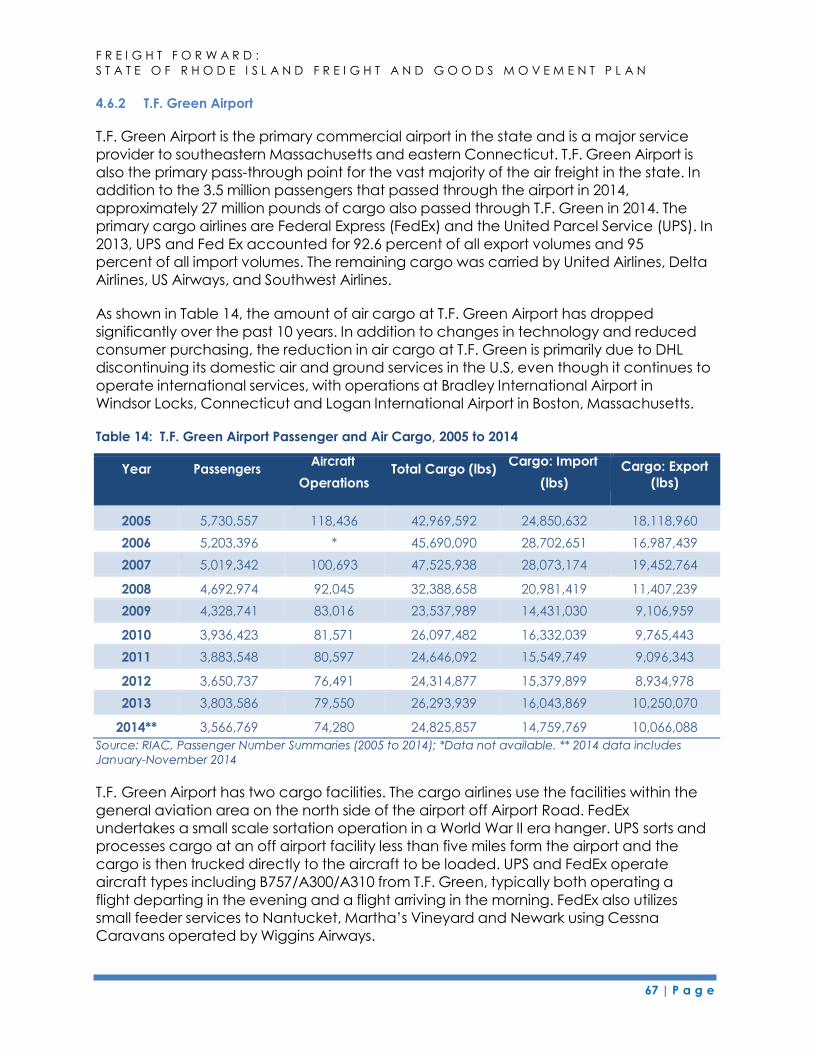
F R E I G H T F O R W A R D :
S T A T E O F R H O D E I S L A N D F R E I G H T A N D G O O D S M O V E M E N T P L A N
67 | P a g e
4.6.2 T.F. Green Airport
T.F. Green Airport is the primary commercial airport in the state and is a major service
provider to southeastern Massachusetts and eastern Connecticut. T.F. Green Airport is
also the primary pass-through point for the vast majority of the air freight in the state. In
addition to the 3.5 million passengers that passed through the airport in 2014,
approximately 27 million pounds of cargo also passed through T.F. Green in 2014. The
primary cargo airlines are Federal Express (FedEx) and the United Parcel Service (UPS). In
2013, UPS and Fed Ex accounted for 92.6 percent of all export volumes and 95
percent of all import volumes. The remaining cargo was carried by United Airlines, Delta
Airlines, US Airways, and Southwest Airlines.
As shown in Table 14, the amount of air cargo at T.F. Green Airport has dropped
significantly over the past 10 years. In addition to changes in technology and reduced
consumer purchasing, the reduction in air cargo at T.F. Green is primarily due to DHL
discontinuing its domestic air and ground services in the U.S, even though it continues to
operate international services, with operations at Bradley International Airport in
Windsor Locks, Connecticut and Logan International Airport in Boston, Massachusetts.
Table 14: T.F. Green Airport Passenger and Air Cargo, 2005 to 2014
Year Passengers Aircraft
Total Cargo (lbs) Cargo: Import
Operations (lbs)
Cargo: Export
(lbs)
2005 5,730,557 118,436 42,969,592 24,850,632 18,118,960
2006 5,203,396 * 45,690,090 28,702,651 16,987,439
2007 5,019,342 100,693 47,525,938 28,073,174 19,452,764
2008 4,692,974 92,045 32,388,658 20,981,419 11,407,239
2009 4,328,741 83,016 23,537,989 14,431,030 9,106,959
2010 3,936,423 81,571 26,097,482 16,332,039 9,765,443
2011 3,883,548 80,597 24,646,092 15,549,749 9,096,343
2012 3,650,737 76,491 24,314,877 15,379,899 8,934,978
2013 3,803,586 79,550 26,293,939 16,043,869 10,250,070
2014** 3,566,769 74,280 24,825,857 14,759,769 10,066,088
Source: RIAC, Passenger Number Summaries (2005 to 2014); *Data not available. ** 2014 data includes
January-November 2014
T.F. Green Airport has two cargo facilities. The cargo airlines use the facilities within the
general aviation area on the north side of the airport off Airport Road. FedEx
undertakes a small scale sortation operation in a World War II era hanger. UPS sorts and
processes cargo at an off airport facility less than five miles form the airport and the
cargo is then trucked directly to the aircraft to be loaded. UPS and FedEx operate
aircraft types including B757/A300/A310 from T.F. Green, typically both operating a
flight departing in the evening and a flight arriving in the morning. FedEx also utilizes
small feeder services to Nantucket, Martha’s Vineyard and Newark using Cessna
Caravans operated by Wiggins Airways.
F R E I G H T F O R W A R D :
S T A T E O F R H O D E I S L A N D F R E I G H T A N D G O O D S M O V E M E N T P L A N
68 | P a g e
Passenger airlines carrying cargo use the facility on the west side of the airport adjacent
to the passenger terminal. The airport has direct access to I-95 via the T.F. Green Airport
Connector Road. The airport is also in close proximity to I-295.
4.6.3 Other Airports
The five other Rhode Island Airport System airports provide little to no air freight service.
Block Island Airport and Westerly Airport both provide passenger service. North Central
Airport, Robert F. Wood Airpark, and Quonset Airport are used for general aviation or
military use. Freight services at North Central Airport consist of limited emergency
delivers for local industries and only a few packages a week. The other four airports
provide periodic freight deliveries, but have no consistent operations.
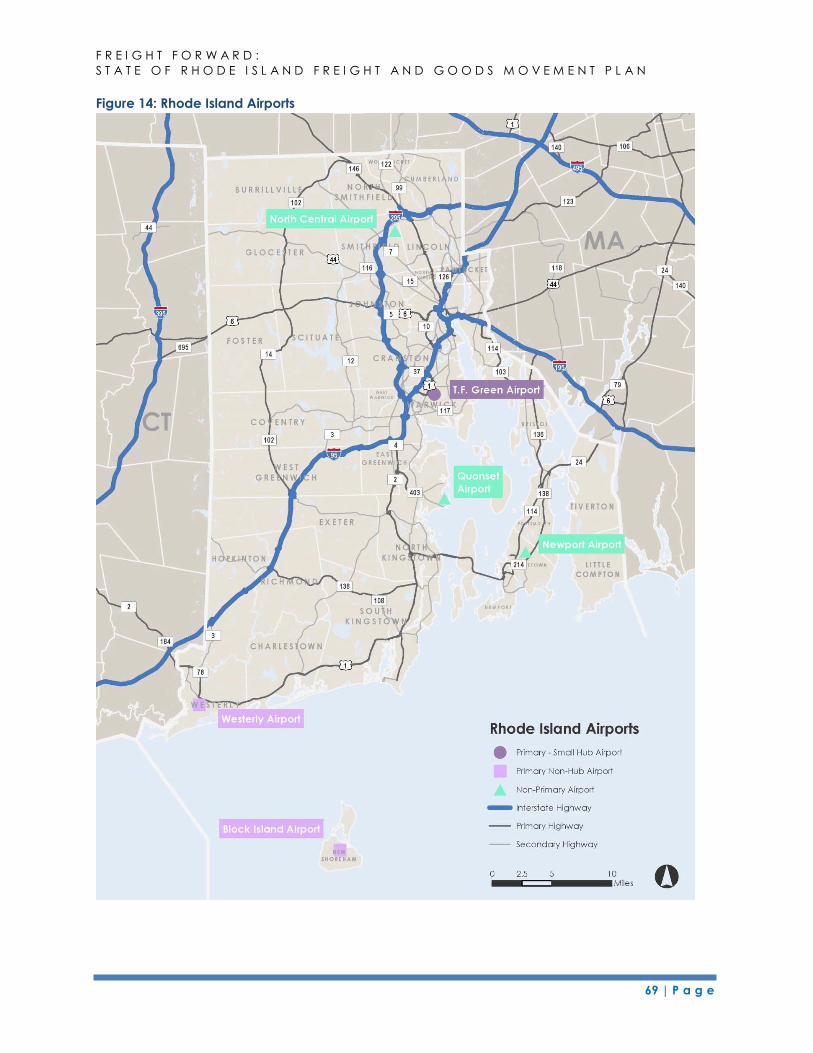
F R E I G H T F O R W A R D :
S T A T E O F R H O D E I S L A N D F R E I G H T A N D G O O D S M O V E M E N T P L A N
69 | P a g e
Figure 14: Rhode Island Airports
F R E I G H T F O R W A R D :
S T A T E O F R H O D E I S L A N D F R E I G H T A N D G O O D S M O V E M E N T P L A N
4.7 Intermodal Facilities
70 | P a g e
From origin to final destination, freight is typically moved on more than one mode. A
robust intermodal freight system that allows connectivity between rail, highway, port,
airport, or pipeline is vital to the efficient movement of freight. Whether it’s moving
goods from ship to rail, ship to truck, rail to truck, airplane to truck, or any other
combination of modes, intermodal facilities are key components of the freight system.
Developing and enhancing facilities, such as ports, airports, or railroad yards that
enable the efficient movement of freight and goods between modes is essential.
As described in the State Rail Plan (2014), the majority of rail intermodal traffic in Rhode
Island is the transload of bulk commodities and automobiles between rail and either
truck or water-served rail users at the Ports of Providence and Davisville. The state also
has other intermodal facilities that allow connections between other modes, such as
the air to truck intermodal traffic at T.F. Green Airport or the ship to pipeline traffic at
ExxonMobil terminal in the Port of Providence. The intermodal facilities described below
are shown in Figure 15.
At the Port of Providence, commodities such as coal, salt and cement are off-
loaded from ships and transported to locations outside of Rhode Island via rail.
This occurs at ProvPort and most of the other port terminals in the Port of
Providence. At the ExxonMobil terminal, petroleum products are offloaded from
ships and transferred to a storage facility and then transferred to a pipeline to
Springfield, Massachusetts. Petroleum products, including fuel oil, diesel, and kerosene are delivered to the
Tiverton Marine Terminal via barge and depart using trucks.
At the Port of Davisville, NORAD processes, finishes, and distributes automobiles
across the Northeast. Automobiles arrive at the port via ship and then are loaded
onto trucks and rail for distribution. Automobiles also arrive at Quonset Business
Park by rail and then are distributed by truck within New England.
T.F. Green Airport is the only airport intermodal facility. Air cargo arrives via FedEx,
UPS, or an air carrier and departs via truck. Conversely, cargo arrives at the
airport by truck and departs via air.
Commercial fishing vessels arrive at the Port of Galilee and Port of Newport,
where the seafood is then loaded onto trucks for distribution.
Figure 15 and Table 15 identify the NHS Intermodal Connectors in Rhode Island. These
designated roadways provide access between major intermodal facilities and the
other four roadway types that make up the NHS.
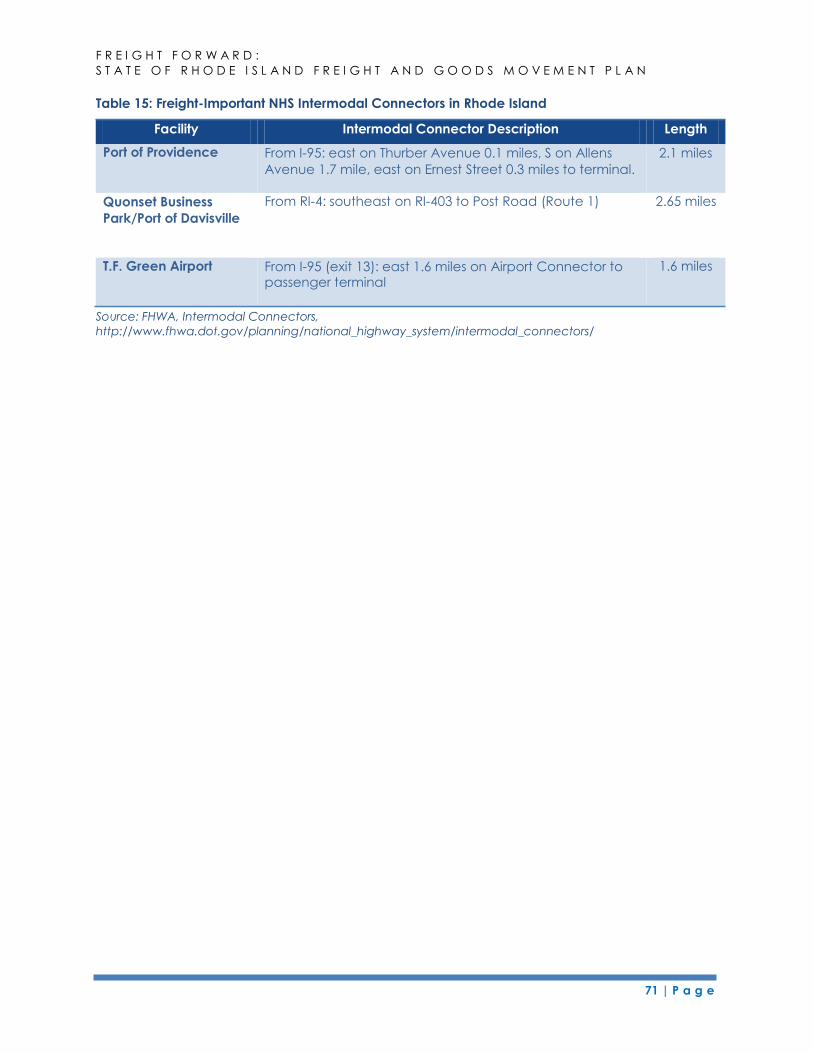
71 | P a g e
F R E I G H T F O R W A R D :
S T A T E O F R H O D E I S L A N D F R E I G H T A N D G O O D S M O V E M E N T P L A N
Table 15: Freight-Important NHS Intermodal Connectors in Rhode Island
Quonset Business
Park/Port of Davisville
From RI-4: southeast on RI-403 to Post Road (Route 1) 2.65 miles
Source: FHWA, Intermodal Connectors,
http://www.fhwa.dot.gov/planning/national_highway_system/intermodal_connectors/
Facility
Port of Providence
Intermodal Connector Description Length
From I-95: east on Thurber Avenue 0.1 miles, S on Allens 2.1 miles
Avenue 1.7 mile, east on Ernest Street 0.3 miles to terminal.
T.F. Green Airport From I-95 (exit 13): east 1.6 miles on Airport Connector to passenger terminal
1.6 miles
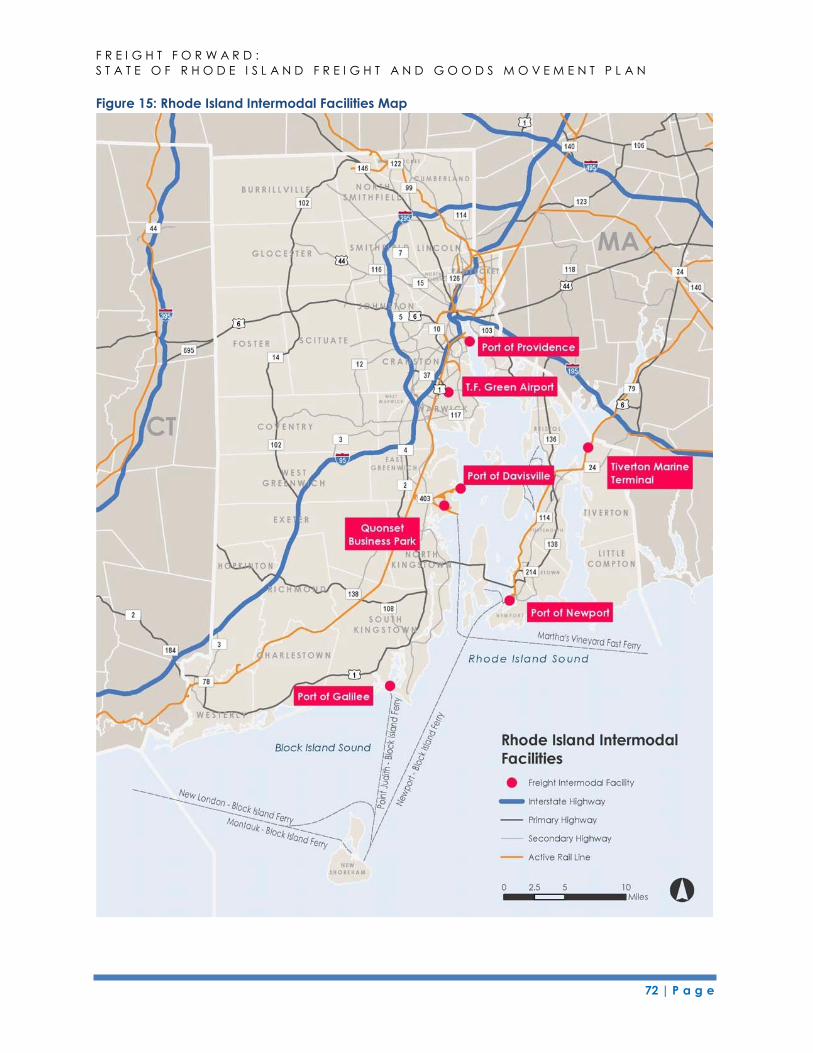
72 | P a g e
F R E I G H T F O R W A R D :
S T A T E O F R H O D E I S L A N D F R E I G H T A N D G O O D S M O V E M E N T P L A N
Figure 15: Rhode Island Intermodal Facilities Map
73 | P a g e
F R E I G H T F O R W A R D :
S T A T E O F R H O D E I S L A N D F R E I G H T A N D G O O D S M O V E M E N T P L A N
4.8 Pipelines
In addition to the small gas and water lines that provide utility services to homes and
businesses, Rhode Island has a number of larger pipelines that distribute water, natural
gas, and petroleum products throughout the state.
4.8.1 Natural Gas Pipelines
According to the Rhode Island State Energy Plan (State Energy Plan), natural gas
supplies more than 50 percent of state’s energy needs. Nearly all power generated
within the state is produced from natural gas and half of Rhode Island’s households use
natural gas for home heating.54 The vast majority of natural gas consumed in the state
arrives via pipelines owned and operated by the Tennessee Gas Pipeline Company
(TGP) and the Duke Energy’s Algonquin Gas Transmission Company (Algonquin). The
Algonquin pipeline is an interstate pipeline that transports natural gas from New Jersey
throughout New England. The TGP pipeline is a major pipeline that runs from Texas to
eastern Massachusetts.55
As shown in Figure 16, the main natural gas pipelines enter the Rhode Island at several
locations along the southwest, northern, and eastern borders and terminate at natural
gas gate stations within the state. National Grid provides local natural gas service to
individual customers. The natural gas system includes 3,200 miles of main lines and
serves 257,000 residential, commercial, and industrial customers.56
4.8.2 Petroleum Product Pipelines
Rhode Island receives shipments of refined petroleum products via six marine import
terminals located in East Providence, Providence, and Tiverton. Although most of the
product is trucked to end users in Rhode Island, Connecticut, and Massachusetts, the
East Providence ExxonMobil terminal owns and operates a small-diameter pipeline that
transports petroleum products to Springfield, Massachusetts.57 The petroleum product
pipeline location is shown in Figure 17.
Products are delivered from barges or tankers to the pipeline at the ExxonMobil facility
in East Providence. This six-inch-diameter pipeline, originally constructed in 1931,
transports in excess of 20,000 barrels (840,000 gallons) per day of products to a terminal
in Springfield, Massachusetts. The ExxonMobil facility has a storage capacity of 1 million
54 US Energy Information Administration, Rhode Island State Profile and Energy Estimates, June 2015. 55 State Energy Plan, Preliminary Draft, June 2015. 56 State Energy Plan, Preliminary Draft, June 2015. 57 State Energy Plan, Preliminary Draft, June 2015.
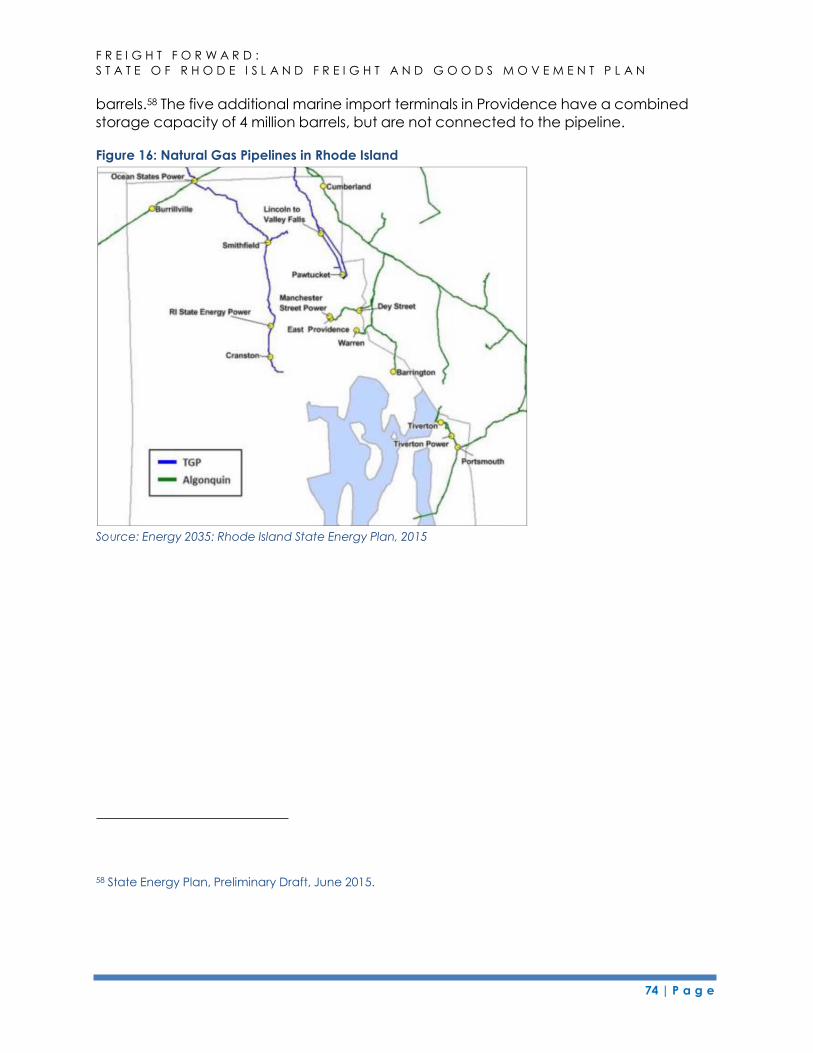
74 | P a g e
F R E I G H T F O R W A R D :
S T A T E O F R H O D E I S L A N D F R E I G H T A N D G O O D S M O V E M E N T P L A N
barrels.58 The five additional marine import terminals in Providence have a combined
storage capacity of 4 million barrels, but are not connected to the pipeline.
Figure 16: Natural Gas Pipelines in Rhode Island
Source: Energy 2035: Rhode Island State Energy Plan, 2015
58 State Energy Plan, Preliminary Draft, June 2015.
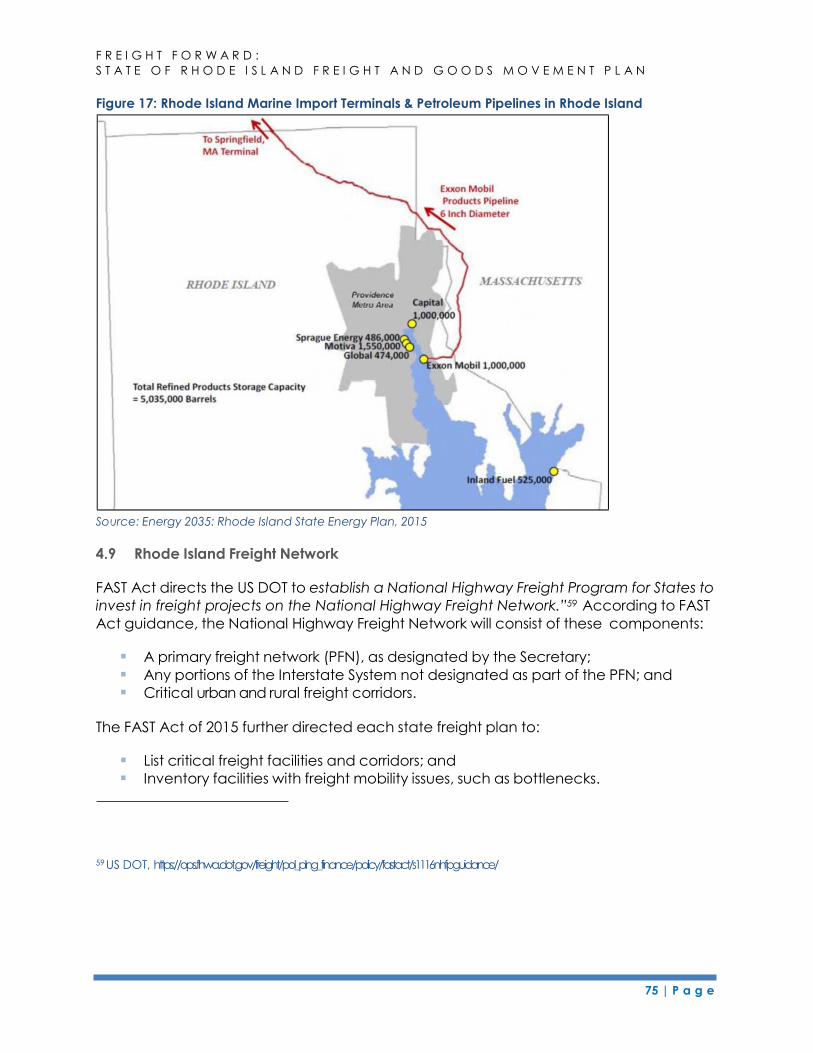
75 | P a g e
F R E I G H T F O R W A R D :
S T A T E O F R H O D E I S L A N D F R E I G H T A N D G O O D S M O V E M E N T P L A N
Figure 17: Rhode Island Marine Import Terminals & Petroleum Pipelines in Rhode Island
Source: Energy 2035: Rhode Island State Energy Plan, 2015
4.9 Rhode Island Freight Network
FAST Act directs the US DOT to establish a National Highway Freight Program for States to
invest in freight projects on the National Highway Freight Network.”59 According to FAST
Act guidance, the National Highway Freight Network will consist of these components:
A primary freight network (PFN), as designated by the Secretary;
Any portions of the Interstate System not designated as part of the PFN; and
Critical urban and rural freight corridors.
The FAST Act of 2015 further directed each state freight plan to:
List critical freight facilities and corridors; and
Inventory facilities with freight mobility issues, such as bottlenecks.
59 US DOT, https://ops.fhwa.dot.gov/freight/pol_plng_finance/policy/fastact/s1116nhfpguidance/
76 | P a g e
F R E I G H T F O R W A R D :
S T A T E O F R H O D E I S L A N D F R E I G H T A N D G O O D S M O V E M E N T P L A N
Nationwide, the designated PFN was limited to a maximum of 27,000 centerline miles of
existing roadways that are most critical to the movement of freight. An additional
14,000 additional centerline miles of roads critical to future efficient movement of goods
on the PFN were also designated as part of the Comprehensive PFN. The Rhode Island
portion of the federal primary freight network is shown in Figure 18.
In Rhode Island, the PFN includes I-95, a portion of I-195 in Providence, and a segment of
Route 4 between I-95 and Route 403. The Comprehensive PFN includes Route 403
between Route 4 and Quonset Business Park and the Airport Connector Road between
I-95 and T.F. Green Airport.
In addition to the federal freight network, the State of Rhode Island has identified a
number of additional facilities that are important to the state and region. These
facilities, including the state’s ports, airports, highways, and railways described in
previous sections, are shown on Figure 19.
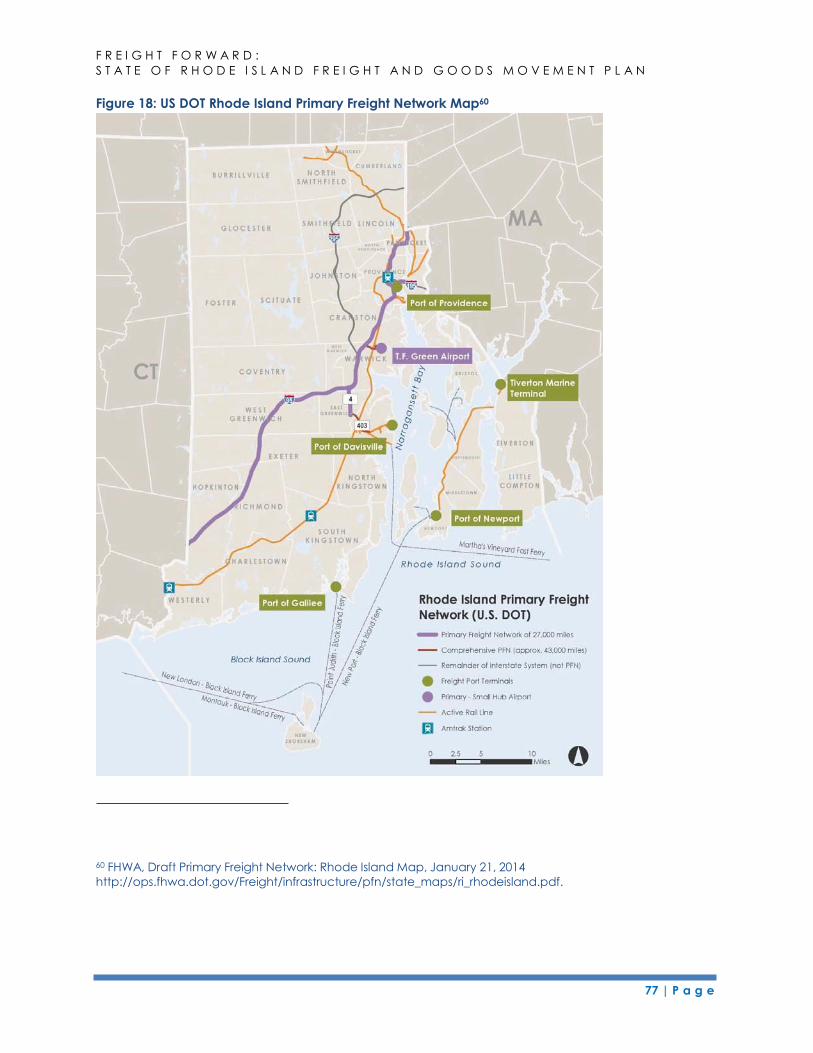
77 | P a g e
F R E I G H T F O R W A R D :
S T A T E O F R H O D E I S L A N D F R E I G H T A N D G O O D S M O V E M E N T P L A N
Figure 18: US DOT Rhode Island Primary Freight Network Map60
60 FHWA, Draft Primary Freight Network: Rhode Island Map, January 21, 2014
http://ops.fhwa.dot.gov/Freight/infrastructure/pfn/state_maps/ri_rhodeisland.pdf.
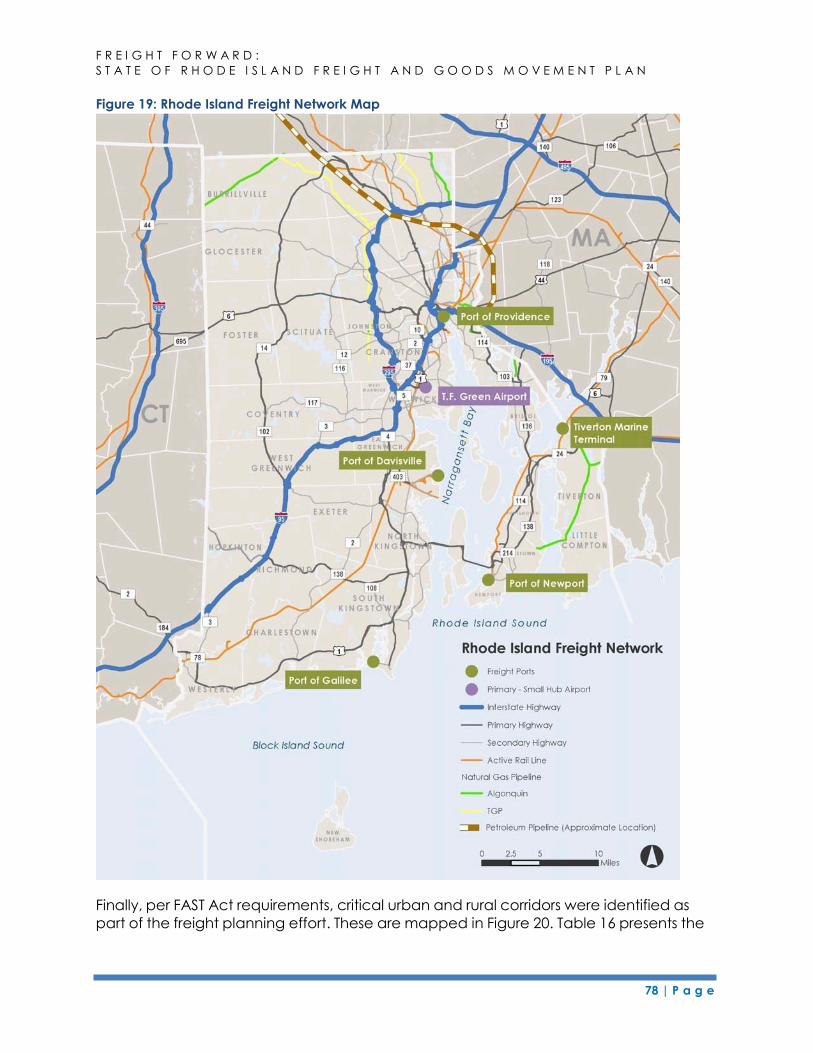
78 | P a g e
F R E I G H T F O R W A R D :
S T A T E O F R H O D E I S L A N D F R E I G H T A N D G O O D S M O V E M E N T P L A N
Figure 19: Rhode Island Freight Network Map
Finally, per FAST Act requirements, critical urban and rural corridors were identified as
part of the freight planning effort. These are mapped in Figure 20. Table 16 presents the
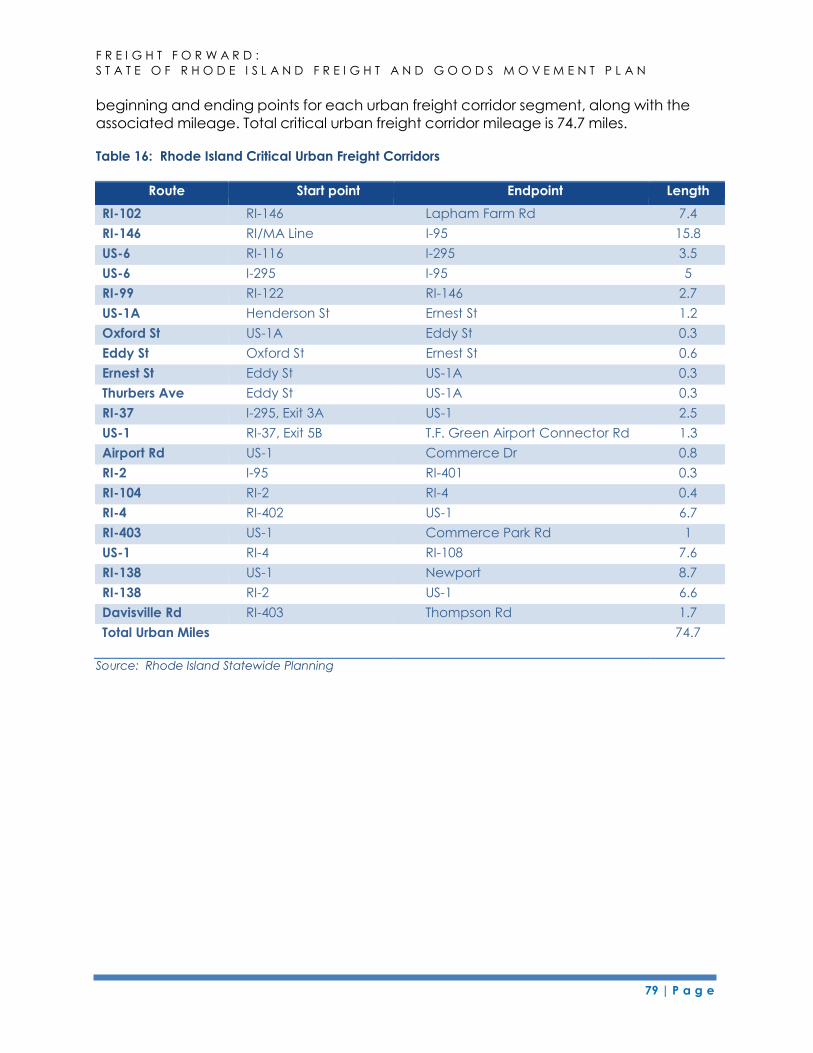
79 | P a g e
F R E I G H T F O R W A R D :
S T A T E O F R H O D E I S L A N D F R E I G H T A N D G O O D S M O V E M E N T P L A N
beginning and ending points for each urban freight corridor segment, along with the
associated mileage. Total critical urban freight corridor mileage is 74.7 miles.
Table 16: Rhode Island Critical Urban Freight Corridors
Route Start point Endpoint Length
RI-102 RI-146 Lapham Farm Rd 7.4
RI-146 RI/MA Line I-95 15.8
US-6 RI-116 I-295 3.5
US-6 I-295 I-95 5
RI-99 RI-122 RI-146 2.7
US-1A Henderson St Ernest St 1.2
Oxford St US-1A Eddy St 0.3
Eddy St Oxford St Ernest St 0.6
Ernest St Eddy St US-1A 0.3
Thurbers Ave Eddy St US-1A 0.3
RI-37 I-295, Exit 3A US-1 2.5
US-1 RI-37, Exit 5B T.F. Green Airport Connector Rd 1.3
Airport Rd US-1 Commerce Dr 0.8
RI-2 I-95 RI-401 0.3
RI-104 RI-2 RI-4 0.4
RI-4 RI-402 US-1 6.7
RI-403 US-1 Commerce Park Rd 1
US-1 RI-4 RI-108 7.6
RI-138 US-1 Newport 8.7
RI-138 RI-2 US-1 6.6
Davisville Rd RI-403 Thompson Rd 1.7
Total Urban Miles 74.7
Source: Rhode Island Statewide Planning
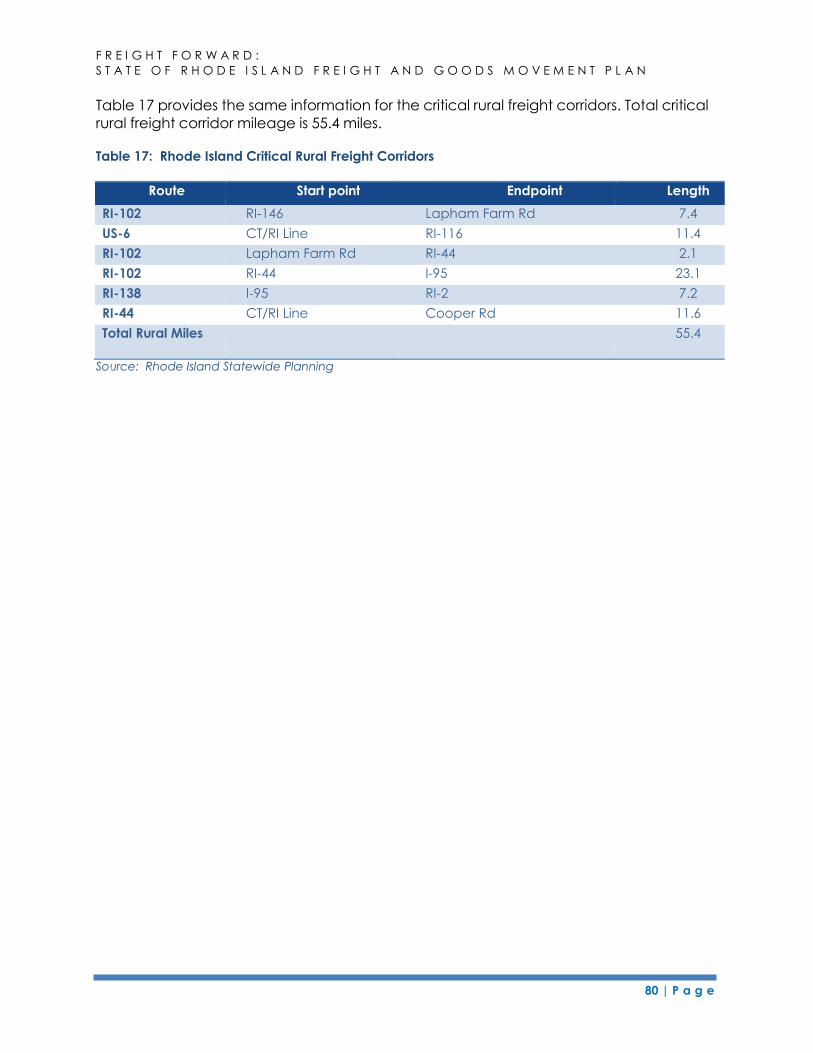
F R E I G H T F O R W A R D :
S T A T E O F R H O D E I S L A N D F R E I G H T A N D G O O D S M O V E M E N T P L A N
Table 17 provides the same information for the critical rural freight corridors. Total critical
80 | P a g e
rural freight corridor mileage is 55.4 miles.
Table 17: Rhode Island Critical Rural Freight Corridors
Route Start point Endpoint Length
RI-102 RI-146 Lapham Farm Rd 7.4
US-6 CT/RI Line RI-116 11.4
RI-102 Lapham Farm Rd RI-44 2.1
RI-102 RI-44 I-95 23.1
RI-138 I-95 RI-2 7.2
RI-44 CT/RI Line Cooper Rd 11.6
Total Rural Miles 55.4
Source: Rhode Island Statewide Planning
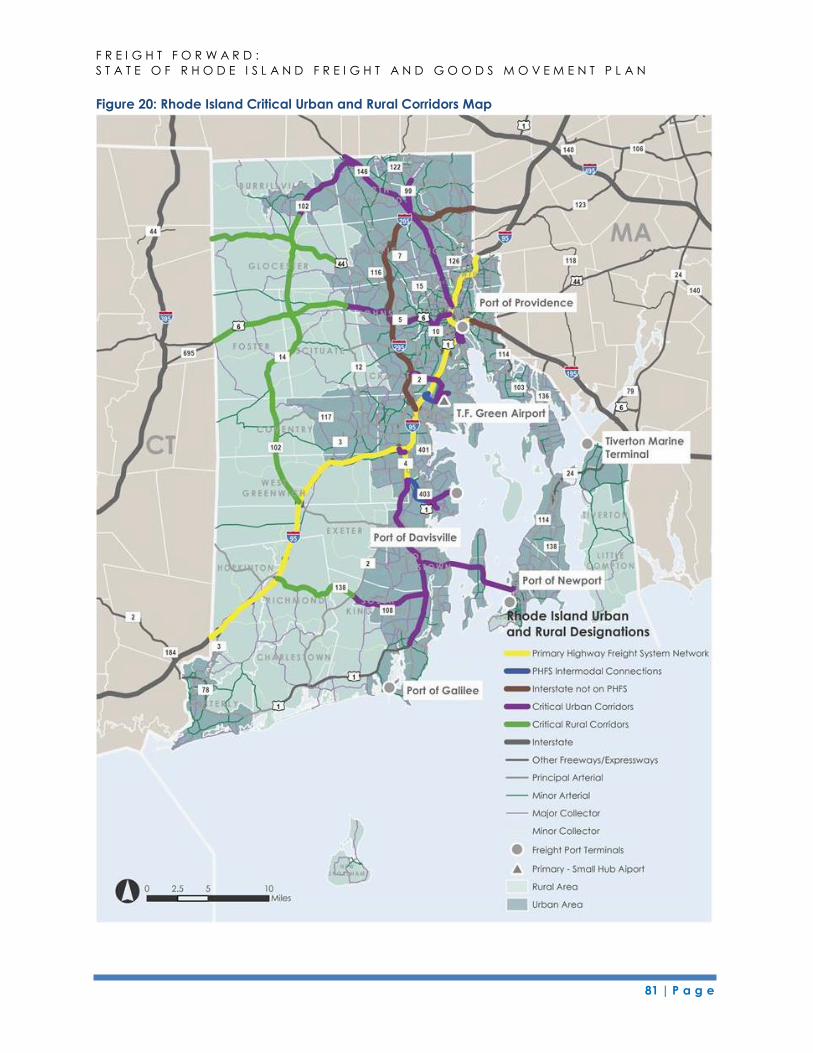
81 | P a g e
F R E I G H T F O R W A R D :
S T A T E O F R H O D E I S L A N D F R E I G H T A N D G O O D S M O V E M E N T P L A N
Figure 20: Rhode Island Critical Urban and Rural Corridors Map
82 | P a g e
F R E I G H T F O R W A R D :
S T A T E O F R H O D E I S L A N D F R E I G H T A N D G O O D S M O V E M E N T P L A N
5 FREIGHT POLICIES, STRATEGIES AND INSTITUTIONS
5.1 Coordination and Consistency with Other State and Regional Transportation Plans
Although the goals developed for this plan are specific to freight, many are consistent
with other statewide plans (and are intended to address similar issues or concerns).
Throughout the freight planning effort, existing and ongoing planning efforts were
researched and reflected in the freight plan.
Staff from the Division of Planning and RIDOT meets regularly with Connecticut and
Massachusetts to share data and discuss each state’s freight planning activities. This
coordination is reflected in the freight plan. RIDOT is also an active member of the I-95
Corridor Coalition, which has a strong freight focus. Additionally, the goals in this plan
have been constructed to reflect the stated goals of related federal initiatives,
specifically MAP-21 and the FAST Act of 2015, as discussed in Chapter 2.
Rhode Island’s Long Range Transportation Plan Goals
This RI Freight Plan aligns with many of the goals and objectives in Transportation 2035,
Rhode Island’s Long Range Transportation Plan, and a key element of the State Guide
Plan. Transportation 2035 recognizes that freight movement plays an important role in
Rhode Island’s economy, and that the efficiency, safety, competiveness and
environmental sustainability of the freight network have broad implications on the
overall economic health and well-being of the state.
The RI Freight Plan is consistent with, and will help fulfill, Transportation 2035 goals related
to the state’s highway and intermodal networks, and as well as economic development,
safety, land use and the environment. The alignment of specific goals and
objectives is shown in the table below.
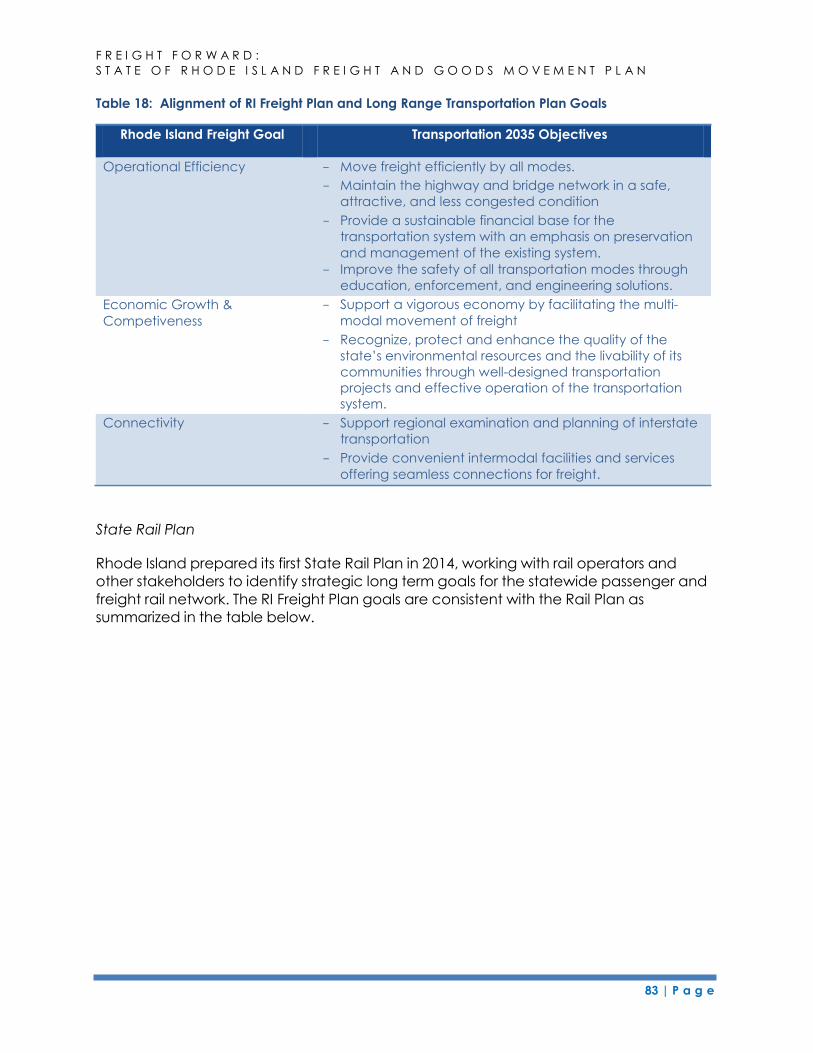
83 | P a g e
F R E I G H T F O R W A R D :
S T A T E O F R H O D E I S L A N D F R E I G H T A N D G O O D S M O V E M E N T P L A N
Table 18: Alignment of RI Freight Plan and Long Range Transportation Plan Goals
Rhode Island Freight Goal Transportation 2035 Objectives
Operational Efficiency - Move freight efficiently by all modes.
- Maintain the highway and bridge network in a safe,
attractive, and less congested condition
- Provide a sustainable financial base for the
transportation system with an emphasis on preservation
and management of the existing system.
- Improve the safety of all transportation modes through
education, enforcement, and engineering solutions.
Economic Growth &
Competiveness
- Support a vigorous economy by facilitating the multi-
modal movement of freight
- Recognize, protect and enhance the quality of the
state’s environmental resources and the livability of its
communities through well-designed transportation
projects and effective operation of the transportation
system.
Connectivity - Support regional examination and planning of interstate
transportation
- Provide convenient intermodal facilities and services
offering seamless connections for freight.
State Rail Plan
Rhode Island prepared its first State Rail Plan in 2014, working with rail operators and
other stakeholders to identify strategic long term goals for the statewide passenger and
freight rail network. The RI Freight Plan goals are consistent with the Rail Plan as
summarized in the table below.
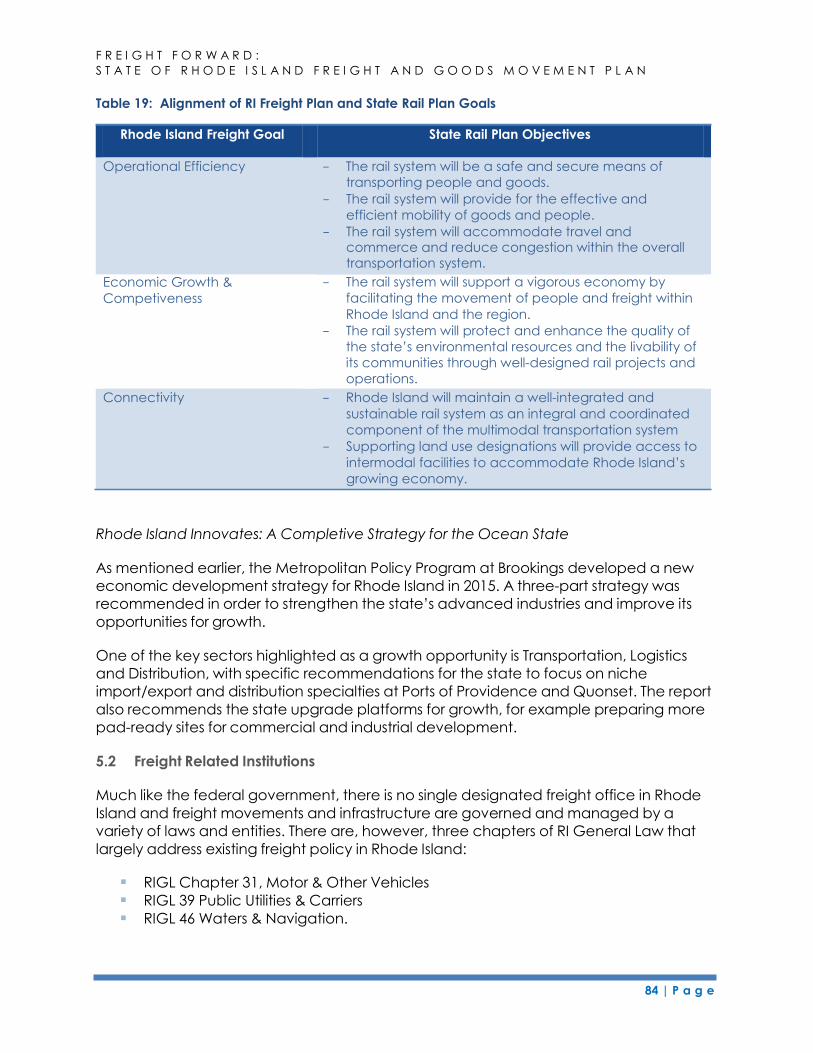
84 | P a g e
F R E I G H T F O R W A R D :
S T A T E O F R H O D E I S L A N D F R E I G H T A N D G O O D S M O V E M E N T P L A N
Table 19: Alignment of RI Freight Plan and State Rail Plan Goals
Rhode Island Freight Goal State Rail Plan Objectives
Operational Efficiency - The rail system will be a safe and secure means of
transporting people and goods.
- The rail system will provide for the effective and
efficient mobility of goods and people.
- The rail system will accommodate travel and commerce and reduce congestion within the overall transportation system.
Economic Growth &
Competiveness
- The rail system will support a vigorous economy by
facilitating the movement of people and freight within
Rhode Island and the region.
- The rail system will protect and enhance the quality of
the state’s environmental resources and the livability of
its communities through well-designed rail projects and
operations.
Connectivity - Rhode Island will maintain a well-integrated and
sustainable rail system as an integral and coordinated
component of the multimodal transportation system
- Supporting land use designations will provide access to
intermodal facilities to accommodate Rhode Island’s
growing economy.
Rhode Island Innovates: A Completive Strategy for the Ocean State
As mentioned earlier, the Metropolitan Policy Program at Brookings developed a new
economic development strategy for Rhode Island in 2015. A three-part strategy was
recommended in order to strengthen the state’s advanced industries and improve its
opportunities for growth.
One of the key sectors highlighted as a growth opportunity is Transportation, Logistics
and Distribution, with specific recommendations for the state to focus on niche
import/export and distribution specialties at Ports of Providence and Quonset. The report
also recommends the state upgrade platforms for growth, for example preparing more
pad-ready sites for commercial and industrial development.
5.2 Freight Related Institutions
Much like the federal government, there is no single designated freight office in Rhode
Island and freight movements and infrastructure are governed and managed by a
variety of laws and entities. There are, however, three chapters of RI General Law that
largely address existing freight policy in Rhode Island:
RIGL Chapter 31, Motor & Other Vehicles
RIGL 39 Public Utilities & Carriers
RIGL 46 Waters & Navigation.
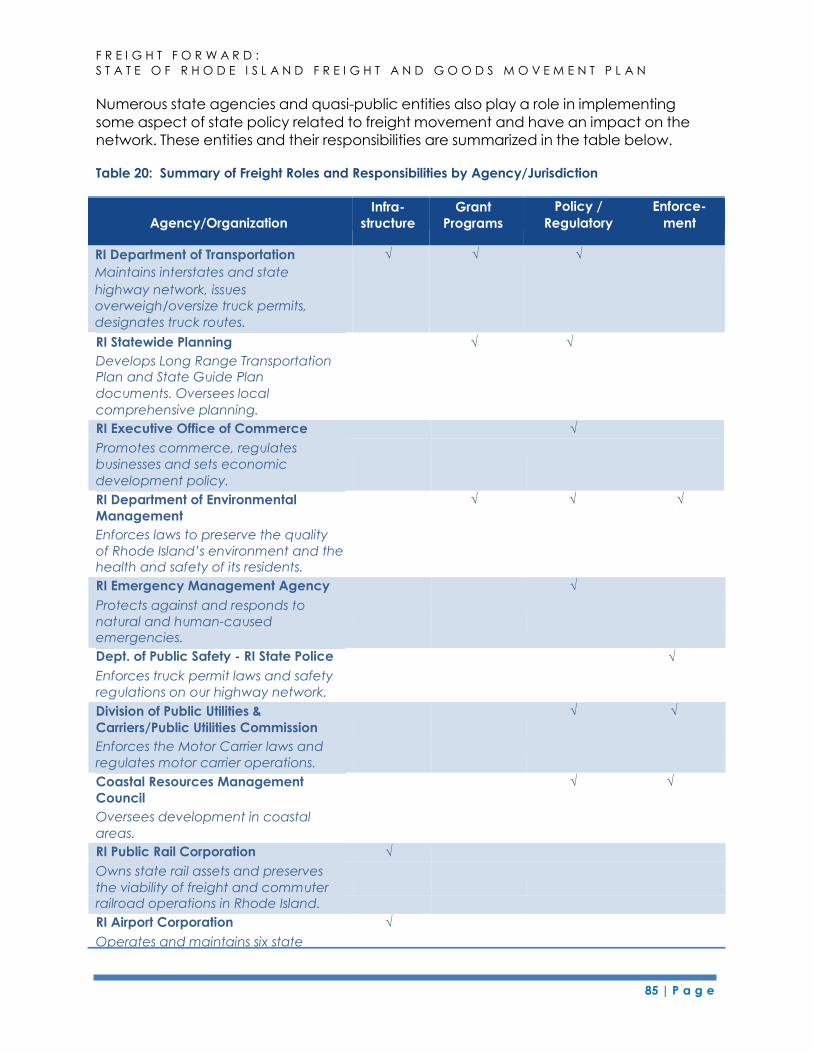
85 | P a g e
F R E I G H T F O R W A R D :
S T A T E O F R H O D E I S L A N D F R E I G H T A N D G O O D S M O V E M E N T P L A N
Numerous state agencies and quasi-public entities also play a role in implementing
some aspect of state policy related to freight movement and have an impact on the
network. These entities and their responsibilities are summarized in the table below.
Table 20: Summary of Freight Roles and Responsibilities by Agency/Jurisdiction
RI Statewide Planning
Develops Long Range Transportation
√ √
Plan and State Guide Plan documents. Oversees local
comprehensive planning.
RI Executive Office of Commerce √
Promotes commerce, regulates
businesses and sets economic
development policy.
RI Department of Environmental
Management
√ √ √ √
Enforces laws to preserve the quality
of Rhode Island’s environment and the
health and safety of its residents. RI Emergency Management Agency √
Protects against and responds to
natural and human-caused
emergencies. Dept. of Public Safety - RI State Police √ √
Enforces truck permit laws and safety
regulations on our highway network.
Division of Public Utilities &
Carriers/Public Utilities Commission
√ √ √
Enforces the Motor Carrier laws and
regulates motor carrier operations.
Coastal Resources Management
Council
√ √ √
Oversees development in coastal
areas.
RI Public Rail Corporation √
Owns state rail assets and preserves
the viability of freight and commuter
railroad operations in Rhode Island. RI Airport Corporation √
Operates and maintains six state
Agency/Organization
Infra-
structure
Grant
Programs
Policy / Enforce-
Regulatory ment
RI Department of Transportation
Maintains interstates and state
highway network, issues
overweigh/oversize truck permits,
designates truck routes.
√ √ √
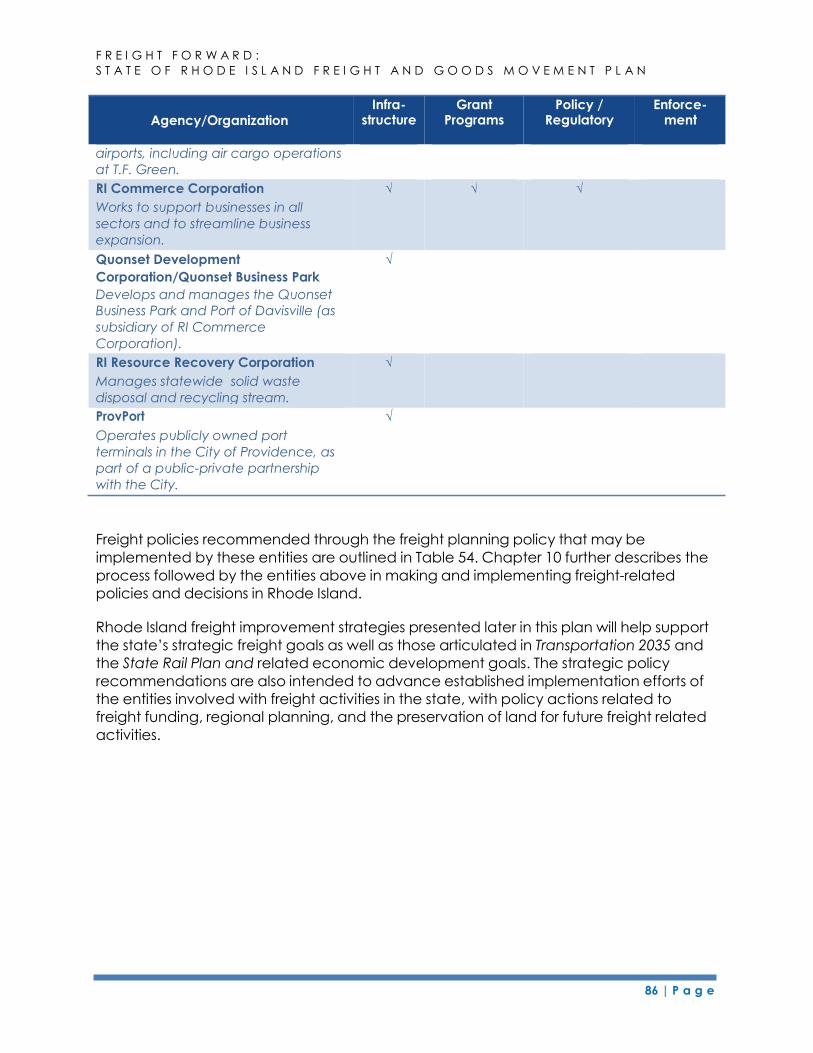
86 | P a g e
F R E I G H T F O R W A R D :
S T A T E O F R H O D E I S L A N D F R E I G H T A N D G O O D S M O V E M E N T P L A N
airports, including air cargo operations
at T.F. Green.
Quonset Development √
Corporation/Quonset Business Park
Develops and manages the Quonset
Business Park and Port of Davisville (as
subsidiary of RI Commerce
Corporation).
ProvPort √
Operates publicly owned port
terminals in the City of Providence, as
part of a public-private partnership
with the City.
Freight policies recommended through the freight planning policy that may be
implemented by these entities are outlined in Table 54. Chapter 10 further describes the
process followed by the entities above in making and implementing freight-related
policies and decisions in Rhode Island.
Rhode Island freight improvement strategies presented later in this plan will help support
the state’s strategic freight goals as well as those articulated in Transportation 2035 and
the State Rail Plan and related economic development goals. The strategic policy
recommendations are also intended to advance established implementation efforts of
the entities involved with freight activities in the state, with policy actions related to
freight funding, regional planning, and the preservation of land for future freight related
activities.
Agency/Organization Infra-
structure Grant
Programs Policy /
Regulatory Enforce-
ment
RI Commerce Corporation
Works to support businesses in all
sectors and to streamline business
expansion.
√ √ √
RI Resource Recovery Corporation
Manages statewide solid waste
disposal and recycling stream.
√
87 | P a g e
F R E I G H T F O R W A R D :
S T A T E O F R H O D E I S L A N D F R E I G H T A N D G O O D S M O V E M E N T P L A N
6 CONDITIONS AND PERFORMANCE OF THE STATE’S FREIGHT
TRANSPORTATION SYSTEM
MAP-21 requires the development of freight transportation system performance
measures, but developing measures can be difficult due to variables in data
measurement criteria, inconsistent data availability, unreliable or incomplete data
resources, cost and accessibility issues. With these limitations in mind, performance
measures for the freight plan are focused, specific, and measurable.
The performance measures were specifically designed to support a determination of
whether the goals of the freight plan are achieved over time (i.e., economic growth
and competitiveness, operational efficiency, connectivity), infrastructure condition is
improved, and safety is enhanced. The condition of the state’s freight transportation
system is described in this chapter, bottlenecks and chokepoints are identified, as well
as other important indicators of performance. The performance measures that the
State of Rhode Island intends to use to determine whether improvements to the system
are achieving the intended goals are also presented.
6.1 Conditions of the State’s Freight Transportation System
The conditions assessment of Rhode Island’s freight transportation assets includes
highways, bridges, railroads, ports, airports, pipelines, and intermodal facilities.
6.1.1 Highway & Bridge Conditions
For highways and bridges in the state, issues and constraints have been identified as
they related to:
Highway and bridge state of good repair;
Congestion and bottlenecks;
Safety;
Truck parking;
Weight restrictions;
Bridge vertical clearance; and
Access to ports.
6.1.1.1 State of Repair
Finding sufficient funding to complete all the needed highway improvement projects is
a concern in Rhode Island. A Governor’s Blue Ribbon Panel concluded in 2008 that
RIDOT would need to increase its annual funding by approximately $300 million for the
88 | P a g e
F R E I G H T F O R W A R D :
S T A T E O F R H O D E I S L A N D F R E I G H T A N D G O O D S M O V E M E N T P L A N
next 10 years to bring the current roadway and bridge network to a state of good
repair.61 This would translate to the replacement of 26 structurally deficient bridges,
completion of 20 major bridge and highway projects, reconstruction of 20 lane miles of
roadway, and resurfacing of 120 lane miles of roadway every year for a decade.
Although Rhode Island’s transportation funding levels are not sufficient to meet
transportation infrastructure needs, the state has recently taken some key steps to
provide sustainable transportation funding and broaden available resources. These
steps include:
The passage of RhodeWorks, a plan to boost state revenues focusing on road
and bridge maintenance through user fees assessed on large tractor trailers.
RhodeWorks will allow Rhode Island to bring our bridges to 90 percent sufficiency
within ten years Redirection of the gas tax to focus on transportation needs;
Replacement of biennial bond borrowing with an increase in registration and
license fees, along with Rhode Island Capital Plan (RICAP) funds to provide the
state match for the annual federal transportation program;
Refinance of existing general obligation bonds to soften the anticipated sharp
peak in debt service payments;
Creation of the Rhode Island Highway Maintenance Account and a shift of
future funding from transportation-related sources, such as registrations, title fees,
gas tax indexing, and other accounts to establish a state-funded pool for critical
transportation infrastructure projects;
Highways & Roads
The state’s roadway network includes interstate highways, arterial and collector roads,
and local streets. The state is responsible for 3,300 lane miles of roadway and 611
bridges.62 Local governments are responsible for the maintenance of the remaining
5,573 lane miles of roadways and 149 bridges. The state’s roadways are one of the
busiest in the country. The weighted average daily traffic per lane was over 7,200 in
2013, placing the state in the top ten for the nation.63
Pavement maintenance becomes an important factor due the large amount of traffic
on the state-owned roadways. The FY 2013-2016 TIP included funding for pavement
management; however, pavement condition data shows that the program has not
61 Rhode Island Blue Ribbon Panel, Rhode Island’s Transportation Future, December 23, 2008,
http://www.gcpvd.org/images/reports/2008-12-ri-transportation-future-blue-ribbon-panel-report.pdf. 62 RIDOT website, http://www.dot.ri.gov/about/index.php; RIDOT, Bridge Inventory Data Sheet, February 10,
2015, http://www.dot.ri.gov/documents/travel/bridgeinfo/Bridge_Inventory_Sheet.pdf. 63 Bureau of Transportation Statistics, Highway Report 2013.
89 | P a g e
F R E I G H T F O R W A R D :
S T A T E O F R H O D E I S L A N D F R E I G H T A N D G O O D S M O V E M E N T P L A N
been sufficient to maintain roadway condition. Table 21 compares the pavement
conditions of the state’s interstates and non-interstates in 2012, 2013, and 2014. For
each year, RIDOT assessed pavement conditions using the Highway Pavement
Management System rating system.
As shown in the table, pavement conditions on the state’s interstate highways are much
better than non-interstates. While more than 80 percent of interstates are in good
condition, pavement conditions along the state’s roadways have declined in recent
years. Over this three-year period, the percent of non-interstates in good condition has
increased, but the percent of interstates has experienced a modest decrease.
The FY 2013-2016 TIP included plans to resurface 120 lane-miles of roadway. The
Pavement Management Program includes crack sealing, to prevent water from seeping
into the pavement, which reduces strength and durability. The TIP also included
funds to help maintain the locally maintained roadways. The FY 2013-2016 TIP included
$4.3 million as part of the local roads program.
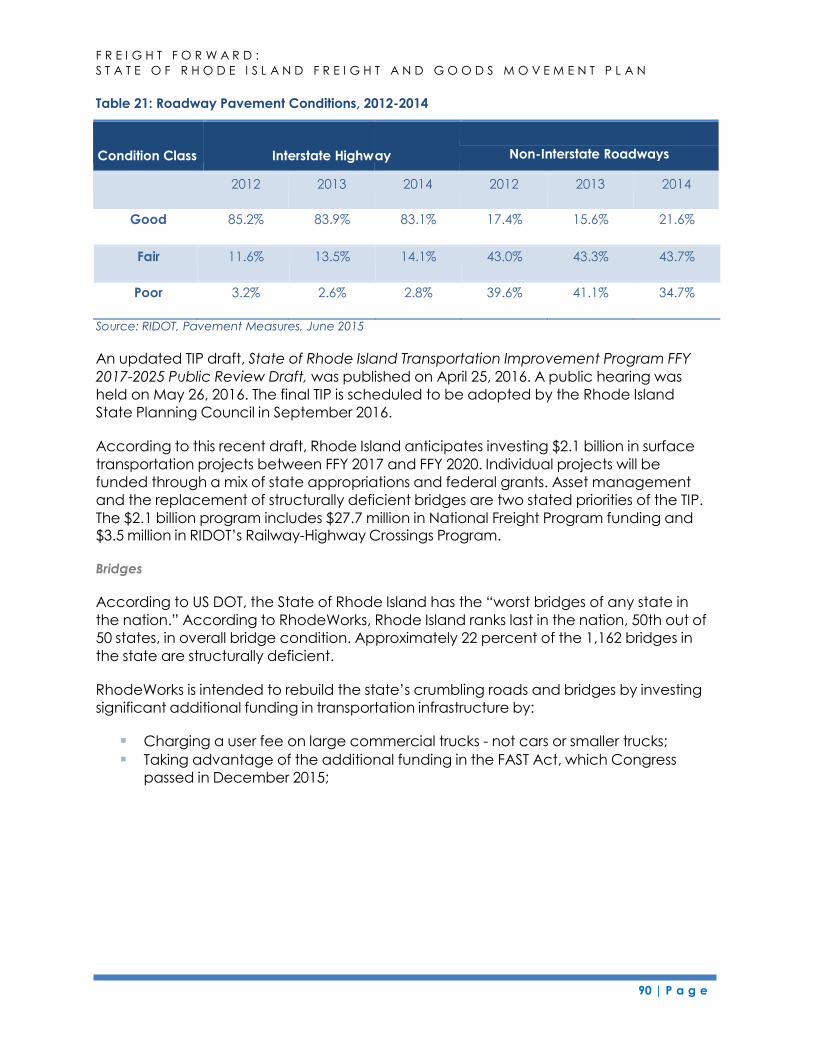
F R E I G H T F O R W A R D :
S T A T E O F R H O D E I S L A N D F R E I G H T A N D G O O D S M O V E M E N T P L A N
90 | P a g e
Table 21: Roadway Pavement Conditions, 2012-2014
Good 85.2% 83.9% 83.1% 17.4% 15.6% 21.6%
Fair 11.6% 13.5% 14.1% 43.0% 43.3% 43.7%
Poor 3.2% 2.6% 2.8% 39.6% 41.1% 34.7%
Source: RIDOT, Pavement Measures, June 2015
An updated TIP draft, State of Rhode Island Transportation Improvement Program FFY
2017-2025 Public Review Draft, was published on April 25, 2016. A public hearing was
held on May 26, 2016. The final TIP is scheduled to be adopted by the Rhode Island
State Planning Council in September 2016.
According to this recent draft, Rhode Island anticipates investing $2.1 billion in surface
transportation projects between FFY 2017 and FFY 2020. Individual projects will be
funded through a mix of state appropriations and federal grants. Asset management
and the replacement of structurally deficient bridges are two stated priorities of the TIP.
The $2.1 billion program includes $27.7 million in National Freight Program funding and $3.5 million in RIDOT’s Railway-Highway Crossings Program.
Bridges
According to US DOT, the State of Rhode Island has the “worst bridges of any state in
the nation.” According to RhodeWorks, Rhode Island ranks last in the nation, 50th out of
50 states, in overall bridge condition. Approximately 22 percent of the 1,162 bridges in
the state are structurally deficient.
RhodeWorks is intended to rebuild the state’s crumbling roads and bridges by investing
significant additional funding in transportation infrastructure by:
Charging a user fee on large commercial trucks - not cars or smaller trucks;
Taking advantage of the additional funding in the FAST Act, which Congress
passed in December 2015;
Condition Class
Interstate Highw
ay
Non-Interstate Roadways
2012 2013 2014 2012 2013 2014
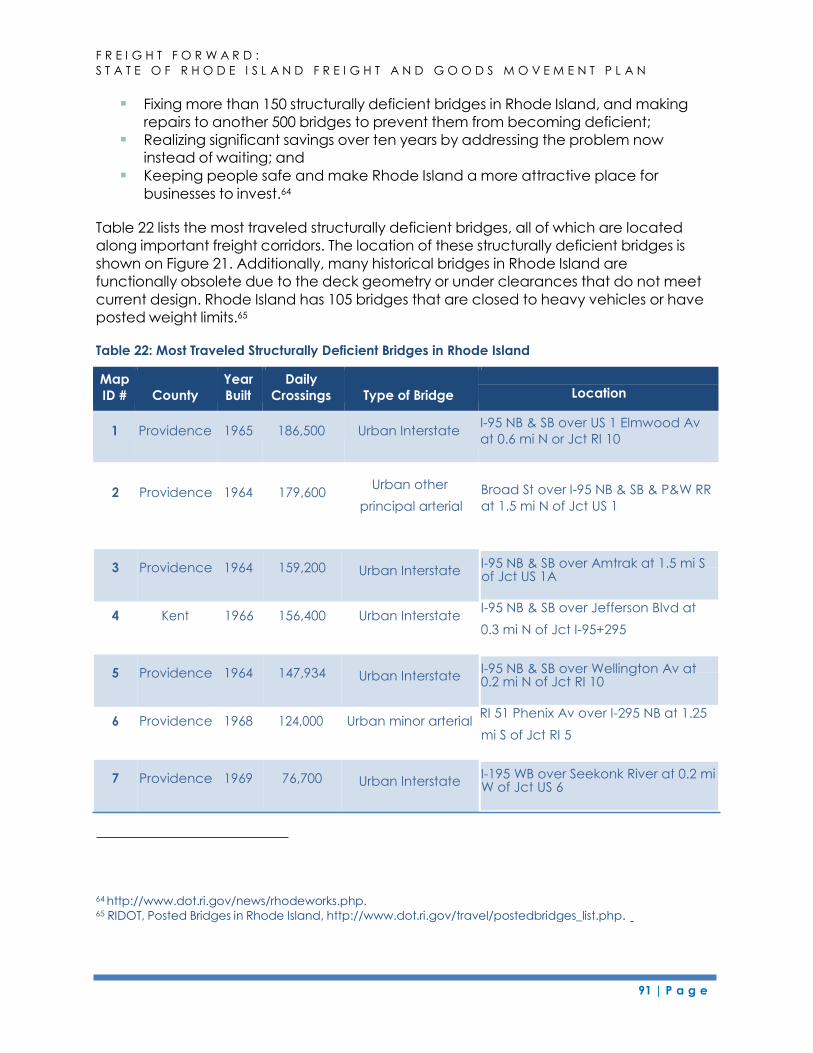
F R E I G H T F O R W A R D :
S T A T E O F R H O D E I S L A N D F R E I G H T A N D G O O D S M O V E M E N T P L A N
91 | P a g e
Fixing more than 150 structurally deficient bridges in Rhode Island, and making
repairs to another 500 bridges to prevent them from becoming deficient;
Realizing significant savings over ten years by addressing the problem now
instead of waiting; and
Keeping people safe and make Rhode Island a more attractive place for
businesses to invest.64
Table 22 lists the most traveled structurally deficient bridges, all of which are located
along important freight corridors. The location of these structurally deficient bridges is
shown on Figure 21. Additionally, many historical bridges in Rhode Island are
functionally obsolete due to the deck geometry or under clearances that do not meet
current design. Rhode Island has 105 bridges that are closed to heavy vehicles or have
posted weight limits.65
Table 22: Most Traveled Structurally Deficient Bridges in Rhode Island
Map
ID #
County
Year
Built
Daily
Crossings
Type of Bridge
Location
1 Providence 1965 186,500 Urban Interstate I-95 NB & SB over US 1 Elmwood Av
at 0.6 mi N or Jct RI 10
2 Providence 1964 179,600 Urban other
principal arterial
Broad St over I-95 NB & SB & P&W RR
at 1.5 mi N of Jct US 1
4 Kent 1966 156,400 Urban Interstate I-95 NB & SB over Jefferson Blvd at
0.3 mi N of Jct I-95+295
6 Providence 1968 124,000 Urban minor arterial RI 51 Phenix Av over I-295 NB at 1.25
mi S of Jct RI 5
64 http://www.dot.ri.gov/news/rhodeworks.php. 65 RIDOT, Posted Bridges in Rhode Island, http://www.dot.ri.gov/travel/postedbridges_list.php.
Providence 1964 159,200 Urban Interstate I-95 NB & SB over Amtrak at 1.5 mi S of Jct US 1A
Providence 1964 147,934 Urban Interstate I-95 NB & SB over Wellington Av at 0.2 mi N of Jct RI 10
Providence 1969 76,700 Urban Interstate I-195 WB over Seekonk River at 0.2 mi W of Jct US 6
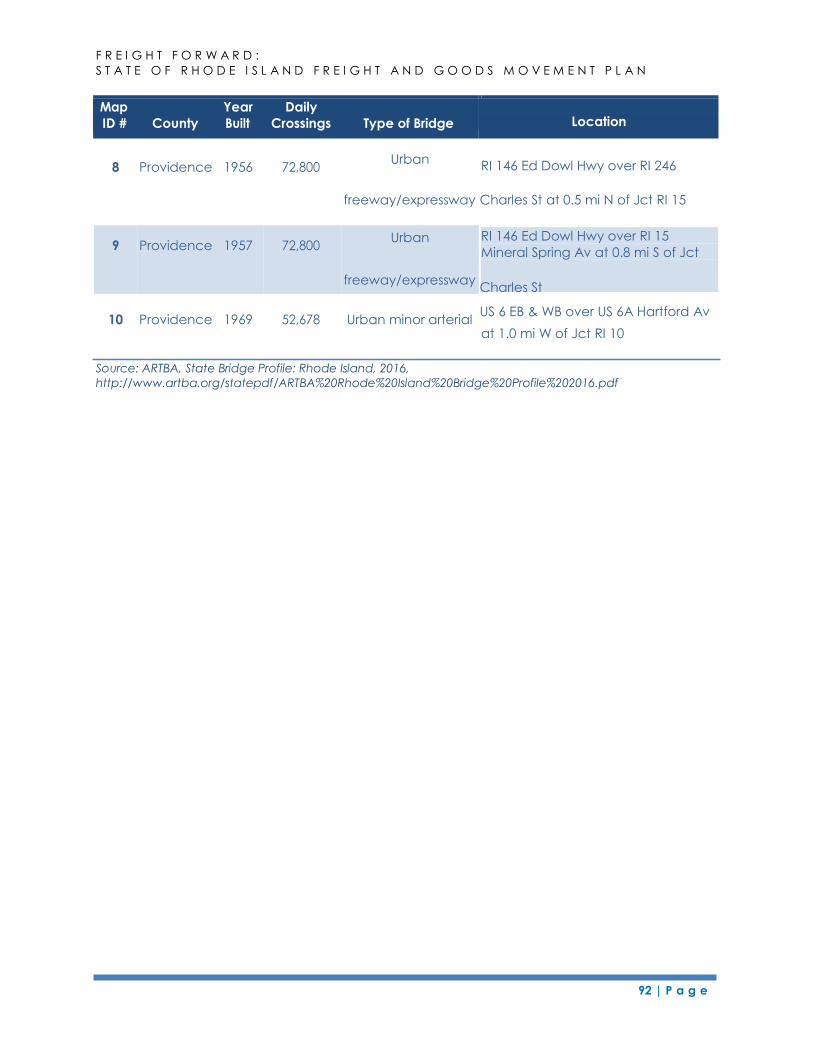
F R E I G H T F O R W A R D :
S T A T E O F R H O D E I S L A N D F R E I G H T A N D G O O D S M O V E M E N T P L A N
92 | P a g e
Map Year Daily
ID # County Built Crossings Type of Bridge
Location
8 Providence 1956 72,800 Urban
RI 146 Ed Dowl Hwy over RI 246
freeway/expressway Charles St at 0.5 mi N of Jct RI 15
9 Providence 1957 72,800 Urban
RI 146 Ed Dowl Hwy over RI 15
Mineral Spring Av at 0.8 mi S of Jct
freeway/expressway Charles St
10 Providence 1969 52,678 Urban minor arterial US 6 EB & WB over US 6A Hartford Av
at 1.0 mi W of Jct RI 10
Source: ARTBA, State Bridge Profile: Rhode Island, 2016,
http://www.artba.org/statepdf/ARTBA%20Rhode%20Island%20Bridge%20Profile%202016.pdf
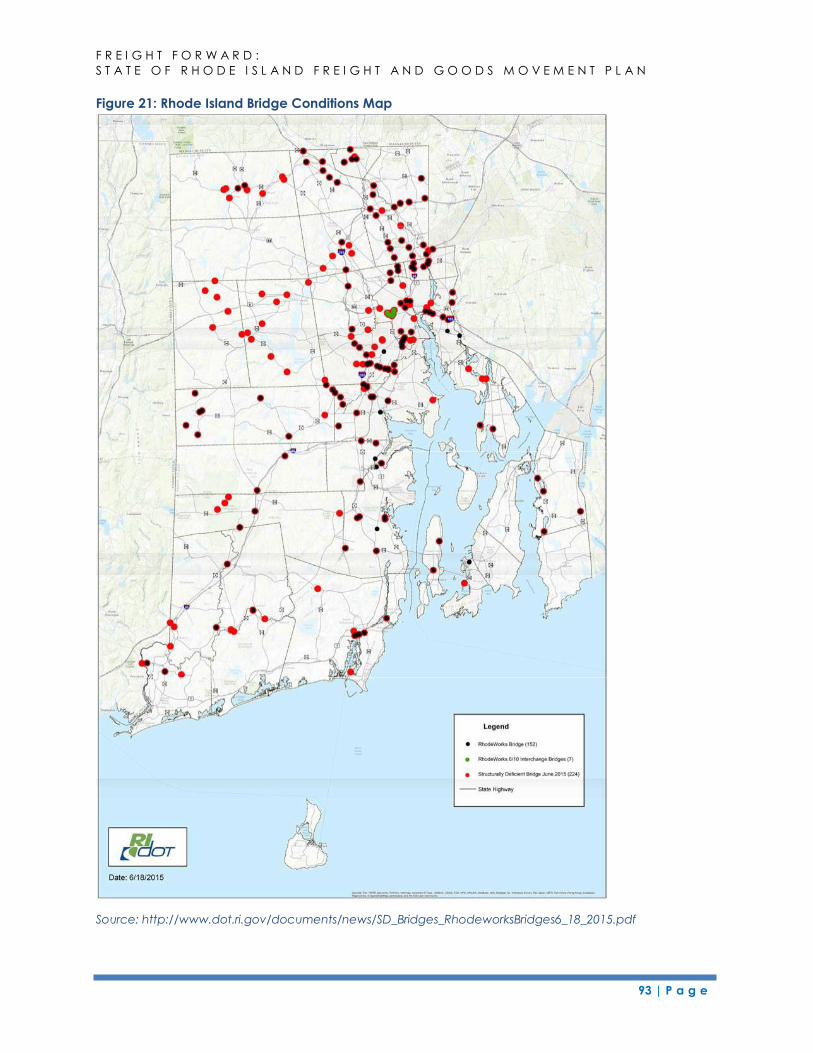
F R E I G H T F O R W A R D :
S T A T E O F R H O D E I S L A N D F R E I G H T A N D G O O D S M O V E M E N T P L A N
93 | P a g e
Figure 21: Rhode Island Bridge Conditions Map
Source: http://www.dot.ri.gov/documents/news/SD_Bridges_RhodeworksBridges6_18_2015.pdf
94 | P a g e
F R E I G H T F O R W A R D :
S T A T E O F R H O D E I S L A N D F R E I G H T A N D G O O D S M O V E M E N T P L A N
6.1.1.2 Congestion & Bottlenecks
Roadway Congestion
According to the Transportation 2035 plan, travel times on the state’s roadways have
worsened in the last decade and congestion on a number of roadways is increasing.
Conditions assessments in the Transportation 2035 plan showed that most of the
interstate and major arterials around Providence are experiencing congestion. Route 1,
Route 4, and Route 114 are also seeing increasing congestion. Vehicular traffic forecasts
for 2035 indicate that congestion is expected to continue to worsen. As shown
in Figure 22, the state’s congested roadways include limited access highways like I-95
and I-295 and non-limited access highways such as Route 246 and Route 4.
Bottlenecks
Bottlenecks are points on a highway where traffic flow is restricted, from roadway
geometry, lane drops, weaving, or interchange-related merging maneuvers. These
bottlenecks create a significant problem for freight movement by creating delays for
freight operations.
Using INRIX and the Vehicle Probe Project (VPP) Suite from the University Maryland,
RIDOT developed a list of bottleneck locations with recurring congestion in November
2012.66 A bottleneck was identified if the speed on a highway segment stays below 60
percent of the posted speed limit for at least five minutes.” As shown in Table 23, in 2013
the state had 16 locations where bottlenecks occurred more than 22 times in the month
with an average duration of more than 45 minutes and an average queue length of
more than 1,000 feet.
66 TrafInfo Communications, Inc., Memorandum to RIDOT, Bottleneck Analysis for Rhode Island, November
2012.
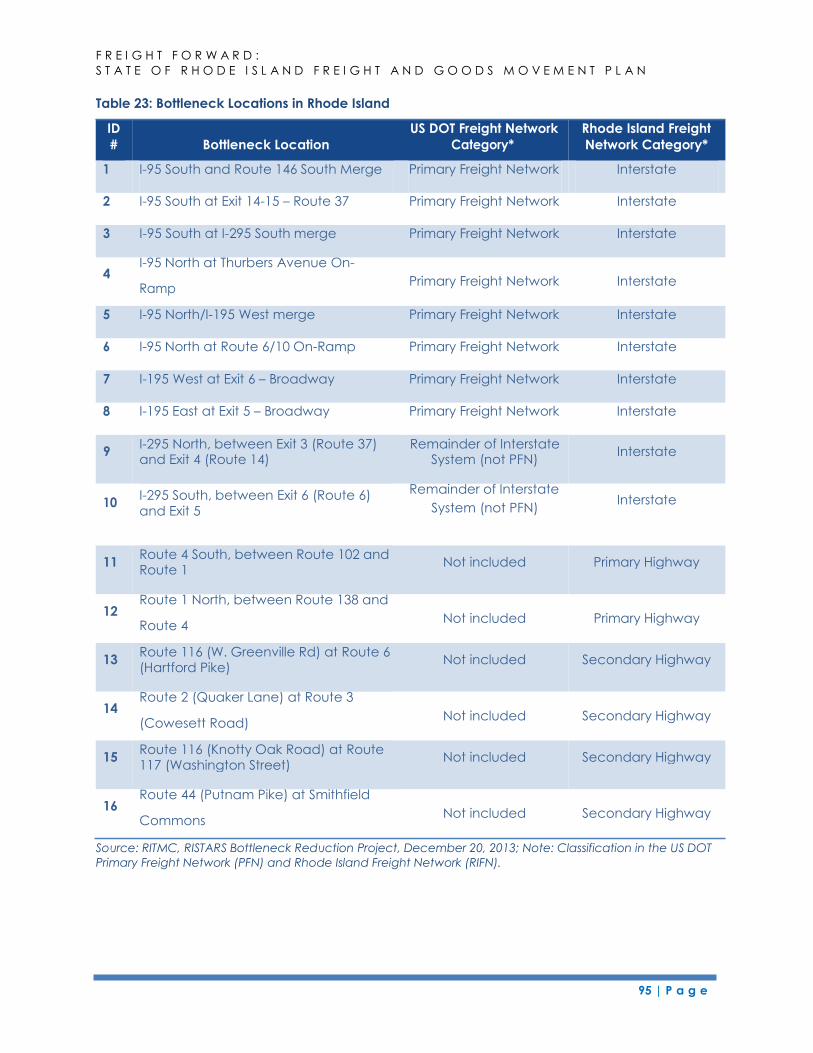
95 | P a g e
F R E I G H T F O R W A R D :
S T A T E O F R H O D E I S L A N D F R E I G H T A N D G O O D S M O V E M E N T P L A N
Table 23: Bottleneck Locations in Rhode Island
2 I-95 South at Exit 14-15 – Route 37 Primary Freight Network Interstate
I-95 North at Thurbers Avenue On-
Ramp Primary Freight Network Interstate
6 I-95 North at Route 6/10 On-Ramp Primary Freight Network Interstate
8 I-195 East at Exit 5 – Broadway Primary Freight Network Interstate
10 I-295 South, between Exit 6 (Route 6) and Exit 5
Remainder of Interstate
System (not PFN) Interstate
Route 1 North, between Route 138 and
Route 4 Not included Primary Highway
Route 2 (Quaker Lane) at Route 3
(Cowesett Road) Not included Secondary Highway
Route 44 (Putnam Pike) at Smithfield
Commons Not included Secondary Highway
Source: RITMC, RISTARS Bottleneck Reduction Project, December 20, 2013; Note: Classification in the US DOT
Primary Freight Network (PFN) and Rhode Island Freight Network (RIFN).
ID US DOT Freight Network Rhode Island Freight
# Bottleneck Location Network Category*
I-95 South and Route 146 South Merge Primary Freight Network Interstate
3 I-95 South at I-295 South merge Primary Freight Network Interstate
5 I-95 North/I-195 West merge Primary Freight Network Interstate
7 I-195 West at Exit 6 – Broadway Primary Freight Network Interstate
9 I-295 North, between Exit 3 (Route 37) and Exit 4 (Route 14)
Remainder of Interstate System (not PFN)
Interstate
11 Route 4 South, between Route 102 and Route 1
Not included Primary Highway
13 Route 116 (W. Greenville Rd) at Route 6 (Hartford Pike)
Not included Secondary Highway
15 Route 116 (Knotty Oak Road) at Route 117 (Washington Street)
Not included Secondary Highway
4
12
14
16
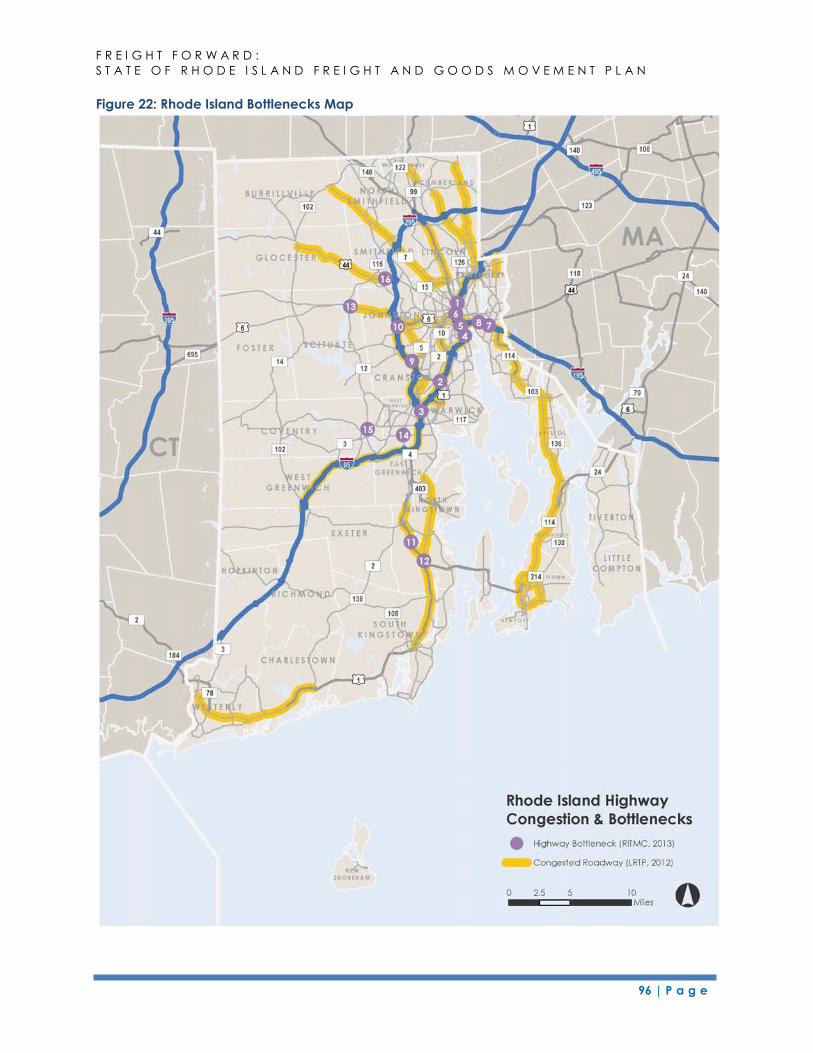
96 | P a g e
F R E I G H T F O R W A R D :
S T A T E O F R H O D E I S L A N D F R E I G H T A N D G O O D S M O V E M E N T P L A N
Figure 22: Rhode Island Bottlenecks Map
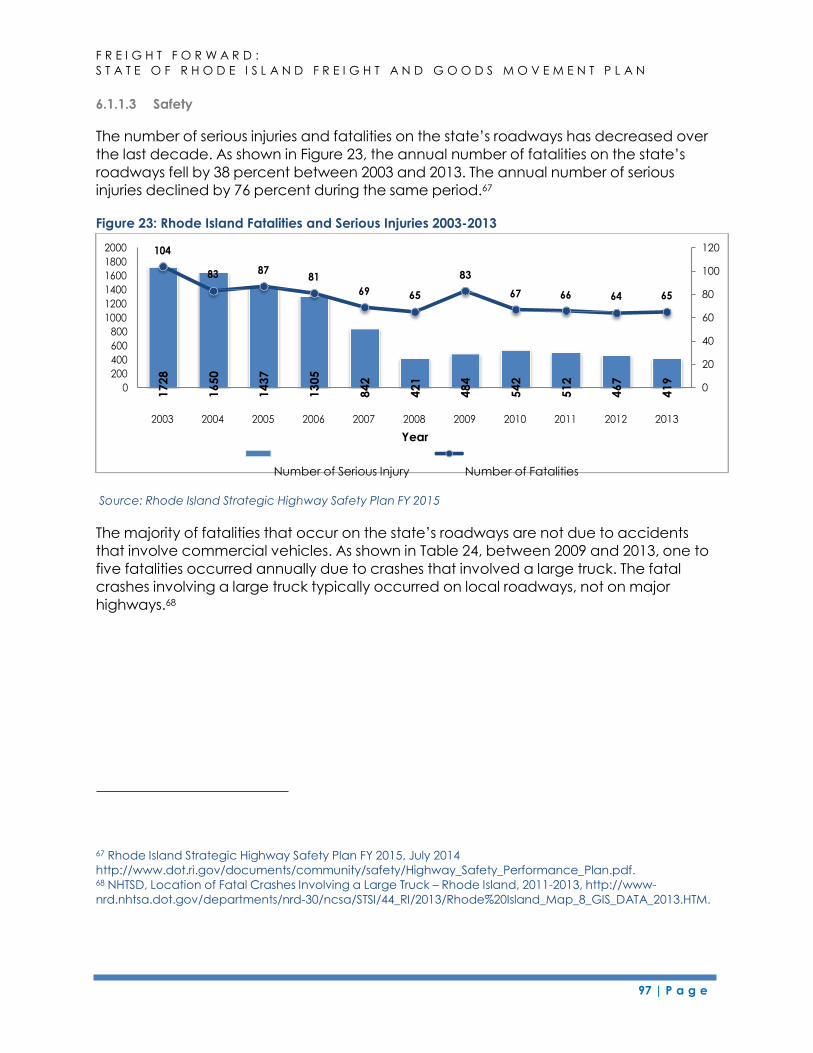
97 | P a g e
F R E I G H T F O R W A R D :
S T A T E O F R H O D E I S L A N D F R E I G H T A N D G O O D S M O V E M E N T P L A N
6.1.1.3 Safety
The number of serious injuries and fatalities on the state’s roadways has decreased over
the last decade. As shown in Figure 23, the annual number of fatalities on the state’s
roadways fell by 38 percent between 2003 and 2013. The annual number of serious
injuries declined by 76 percent during the same period.67
Figure 23: Rhode Island Fatalities and Serious Injuries 2003-2013
2000
1800
1600
1400
1200
1000
800
600
400
200
0
104
83 87 81
69 65
83
67 66 64 65
120
100
80
60
40
20
0
2003 2004 2005 2006 2007 2008 2009 2010 2011 2012 2013
Year
Number of Serious Injury Number of Fatalities
Source: Rhode Island Strategic Highway Safety Plan FY 2015
The majority of fatalities that occur on the state’s roadways are not due to accidents
that involve commercial vehicles. As shown in Table 24, between 2009 and 2013, one to
five fatalities occurred annually due to crashes that involved a large truck. The fatal
crashes involving a large truck typically occurred on local roadways, not on major
highways.68
67 Rhode Island Strategic Highway Safety Plan FY 2015, July 2014
http://www.dot.ri.gov/documents/community/safety/Highway_Safety_Performance_Plan.pdf. 68 NHTSD, Location of Fatal Crashes Involving a Large Truck – Rhode Island, 2011-2013, http://www-
nrd.nhtsa.dot.gov/departments/nrd-30/ncsa/STSI/44_RI/2013/Rhode%20Island_Map_8_GIS_DATA_2013.HTM.
17
28
16
50
14
37
13
05
84
2
42
1
48
4
54
2
51
2
46
7
41
9
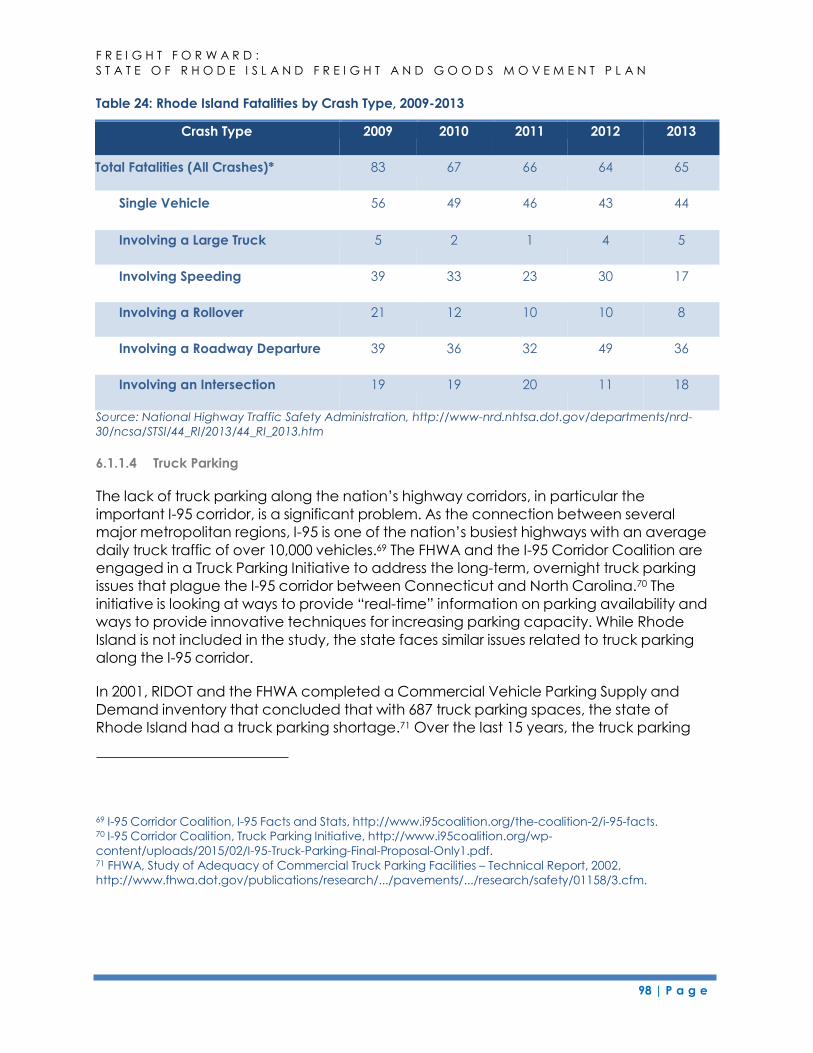
98 | P a g e
F R E I G H T F O R W A R D :
S T A T E O F R H O D E I S L A N D F R E I G H T A N D G O O D S M O V E M E N T P L A N
Table 24: Rhode Island Fatalities by Crash Type, 2009-2013
Single Vehicle 56 49 46 43 44
Involving a Large Truck 5 2 1 4 5
Involving Speeding 39 33 23 30 17
Involving a Rollover 21 12 10 10 8
Involving a Roadway Departure 39 36 32 49 36
Involving an Intersection 19 19 20 11 18
Source: National Highway Traffic Safety Administration, http://www-nrd.nhtsa.dot.gov/departments/nrd-
30/ncsa/STSI/44_RI/2013/44_RI_2013.htm
6.1.1.4 Truck Parking
The lack of truck parking along the nation’s highway corridors, in particular the
important I-95 corridor, is a significant problem. As the connection between several
major metropolitan regions, I-95 is one of the nation’s busiest highways with an average
daily truck traffic of over 10,000 vehicles.69 The FHWA and the I-95 Corridor Coalition are
engaged in a Truck Parking Initiative to address the long-term, overnight truck parking
issues that plague the I-95 corridor between Connecticut and North Carolina.70 The
initiative is looking at ways to provide “real-time” information on parking availability and
ways to provide innovative techniques for increasing parking capacity. While Rhode
Island is not included in the study, the state faces similar issues related to truck parking
along the I-95 corridor.
In 2001, RIDOT and the FHWA completed a Commercial Vehicle Parking Supply and
Demand inventory that concluded that with 687 truck parking spaces, the state of
Rhode Island had a truck parking shortage.71 Over the last 15 years, the truck parking
69 I-95 Corridor Coalition, I-95 Facts and Stats, http://www.i95coalition.org/the-coalition-2/i-95-facts. 70 I-95 Corridor Coalition, Truck Parking Initiative, http://www.i95coalition.org/wp-
content/uploads/2015/02/I-95-Truck-Parking-Final-Proposal-Only1.pdf. 71 FHWA, Study of Adequacy of Commercial Truck Parking Facilities – Technical Report, 2002,
http://www.fhwa.dot.gov/publications/research/.../pavements/.../research/safety/01158/3.cfm.
Crash Type 2009 2010 2011 2012 2013
Total Fatalities (All Crashes)* 83 67 66 64 65
99 | P a g e
F R E I G H T F O R W A R D :
S T A T E O F R H O D E I S L A N D F R E I G H T A N D G O O D S M O V E M E N T P L A N
supply has further declined. Today, with just under 350 total truck parking spaces in the
state’s rest areas, weigh stations, private truck stops, and truck pull-off areas, Rhode
Island has a deficiency of truck parking.72
Truck parking shortages create safety concerns for two primary reasons. The FMCSA
regulates the number of hours a driver can operate a commercial motor vehicle and
the length of rest required between hours of service. A lack of readily available parking
can cause truck drivers to continue to drive while tired or cause drivers to park in unsafe
locations, such as roadway shoulders, exit ramps, or facilities that allow parking for less
than the required 10-hour rest period.73 Jason’s Law74requires states to survey and assess
the adequacy of truck parking. This law also makes truck parking and stops eligible for
federal funding.
Additionally, it is important that drivers have sufficient truck parking facilities that provide
not only a sufficient number of parking spaces, but provide security and amenities
to support adequate rest. Most of the state’s overnight truck parking does not have
sufficient security or other amenities or services to support long-haul drivers. One of
the state’s two highway rest areas, the Rhode Island Visitor Center on I-95 near Exit 3 has
been closed since 2011. The facility cost $400,000 annual to operate, and it was
closed due to lack of funding.75 The cost to maintain the facilities for truck parking is
$150,000 just for electricity for lighting.
The state’s truck-pull-off areas do not offer any security or amenities. The state’s
permanent weigh stations have been closed and now serve as additional parking
locations, also lacking security or services. The truck rest stop in West Greenwich off exit
5 on I-95 provides needed services, such as truck maintenance and tire service, but as
noted in the stakeholder interviews frequently experiences an overflow at night. Some
concern about lack of directional signage and access to this facility was also noted
during the stakeholder interviews.
The location of truck parking in the state is also an issue. The only truck rest stop with
facilities is located south of Providence in West Greenwich. From a regional
perspective, however, truck parking facilities are provided in Connecticut near the
state line and along I-495, I-195, and I-95 in Massachusetts though. The adequacy of
these facilities in terms of providing sufficient truck parking spaces and the needed
amenities is a concern.
72 http://www.findfuelstops.com/truck-stop-in-RI. 73 FHWA, Commercial Motor Vehicle Parking Shortage, May 2012,
http://www.ops.fhwa.dot.gov/freight/documents/cmvrptcgr/cmvrptcgr052012.pdf. 74 126 STAT. 406 PUBLIC LAW 112–141, Section 1401 —JULY 6, 2012 75 Providence Business News, “Rhode Island closes I-95 North welcome center.” September 29, 2011,
http://pbn.com/Rhode-Island-closes-I-95-North-welcome-center,61526.
100 | P a g e
F R E I G H T F O R W A R D :
S T A T E O F R H O D E I S L A N D F R E I G H T A N D G O O D S M O V E M E N T P L A N
6.1.1.5 Highway Weight Restrictions
Another issue identified during the stakeholder interviews was the impact of road
weight restrictions on freight movements in the state and region. Highway weight
restrictions can make freight movements less efficient, as shippers cannot fully fill
containers due to heavy weight restrictions for trucks.
Rhode Island and federal regulations currently limit the combination of vehicles
coupled together to no more than three units (i.e., a truck tractor, a semitrailer, and a
trailer).76 The maximum overall gross weight on a group of two or more consecutive
axles of a vehicle or combination of vehicles is determined by a gross weight formula
that incorporates the number of axles and axle spacing. The gross weight of any
vehicle or combination of vehicles may not exceed 40 tons (80,000 pounds). Vehicles
that exceed this maximum are required to apply for an “over-the-road” permit from the
State of Rhode Island. According to RIDOT, Rhode Island currently issues between 5,200
and 5,500 reducible load permits per year, typically issued to the construction,
demolition, waste and bulk liquid industries and 11,000 trip permits issued to non-
reducible oversize and overweight loads.
The state has a number of authorized routes with no weight restrictions, including I-295,
Route 6, Route 4, and Route 1.77 Many other roadways have time-of-day restrictions.
Several bridges require separate permits for vehicles that exceed the 40 ton posted
weight limit, including the:
Mt. Hope Bridge between Bristol and Portsmouth (max. 40 tons no exceptions);
Jamestown Verrazano Bridge between Jamestown and North Kingstown,
Sakonnet River Bridge between Portsmouth and Tiverton; and
Pell Bridge between Newport and Jamestown (max. 160,000 pounds with
permit).78
The two adjoining states also have weight restrictions on roadways and bridges. The
Connecticut Department of Transportation issues permits for oversize and overweight
vehicles and loads. For non-divisible loads, permits are required for vehicles weighing
between 80,000 and 122,000 pounds on five axles.79 The maximum weight issued
without special consideration is 130,000 pounds on six axles. In Massachusetts, the
76 Rhode Island General Law 31-25, http://webserver.rilin.state.ri.us/Statutes/title31/31-25/index.htm. 77 Rhode Island State Freight Map (Draft), http://freightforwardri.com/home/wp-
content/uploads/2015/02/FreightPlanUpgrade36x48.pdf. 78 Rhode Island Turnpike and Bridge Authority, Overweight and Overwide Restrictions,
http://www.ritba.org/overweight-and-overwide-restrictions. 79 Connecticut Department of Transportation, Oversize/Overweight Permit,
http://www.ct.gov/dot/cwp/view.asp?A=1394&Q=259546%20.
101 | P a g e
F R E I G H T F O R W A R D :
S T A T E O F R H O D E I S L A N D F R E I G H T A N D G O O D S M O V E M E N T P L A N
maximum gross weight permitted for non-reducible loads is 130,000 pounds for vehicles
with five to eight axles.80 Because New England is a small region, weight restrictions in
one state may have implications on what will be shipped in other states that adjoin it
and how that freight moves throughout the region.
6.1.1.6 Bridge Vertical Clearances
The State of Rhode Island requires a minimum clearance of 14 feet, 3 inches on most
roadways. The major interstate truck routes require a minimum of 16 feet, 3 inches
vertical clearance.81 According to RIDOT, vehicles above 13 feet, 6 inches must obtain
a permit. A number of bridges in Rhode Island have low vertical clearances and some
larger trucks are unable to pass under them. Table 25 lists the bridge locations over
roadways where the vertical clearance is less than the minimum 13 feet 6 inches. The
majority of these bridges are railroad bridges located in older developed areas,
including downtown Woonsocket and other similar locations.
80 MassDOT, Mass Highway Truck Permitting,
http://www.mhd.state.ma.us/default.asp?pgid=content/permLL&sid=about. 81 RIDOT, Rhode Island LRFD Bridge Design Manual, 2007,
http://www.dot.ri.gov/documents/doingbusiness/RILRFDBridgeManual.pdf.
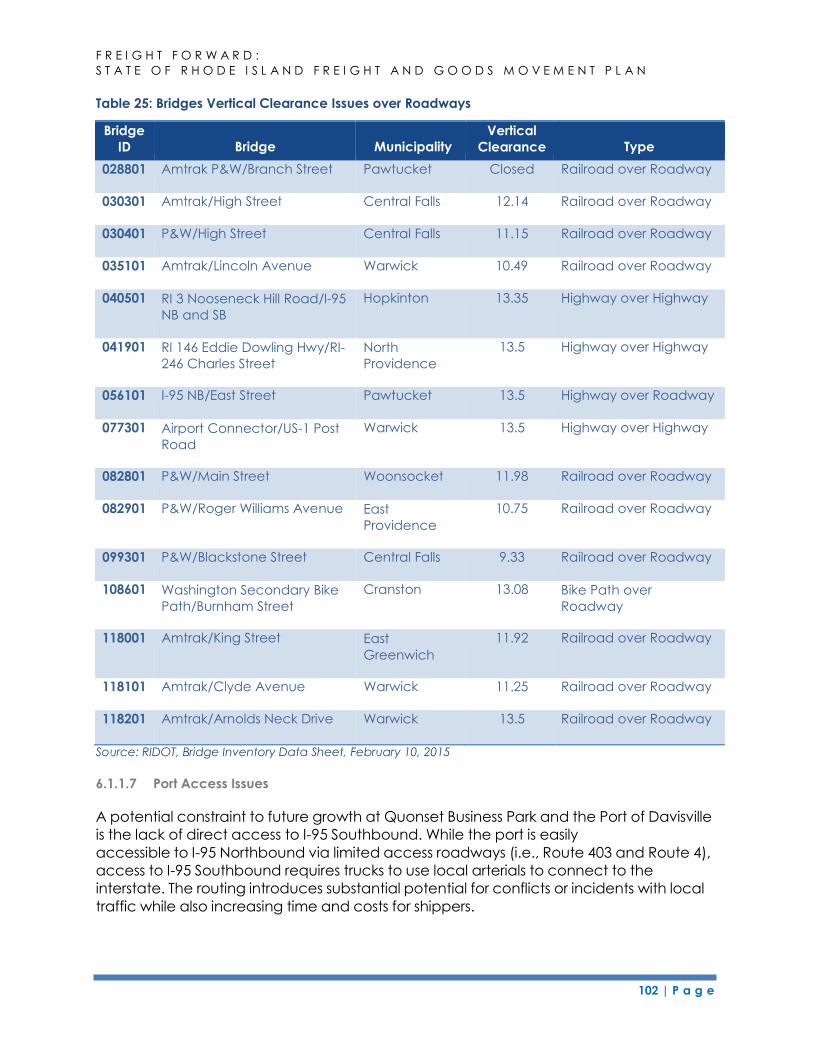
102 | P a g e
F R E I G H T F O R W A R D :
S T A T E O F R H O D E I S L A N D F R E I G H T A N D G O O D S M O V E M E N T P L A N
Table 25: Bridges Vertical Clearance Issues over Roadways
Bridge
ID
Bridge
Municipality
Vertical
Clearance
Type
028801 Amtrak P&W/Branch Street Pawtucket Closed Railroad over Roadway
030301 Amtrak/High Street Central Falls 12.14 Railroad over Roadway
030401 P&W/High Street Central Falls 11.15 Railroad over Roadway
035101 Amtrak/Lincoln Avenue Warwick 10.49 Railroad over Roadway
040501 RI 3 Nooseneck Hill Road/I-95
NB and SB
Hopkinton 13.35 Highway over Highway
041901 RI 146 Eddie Dowling Hwy/RI-
246 Charles Street
North
Providence
13.5 Highway over Highway
056101 I-95 NB/East Street Pawtucket 13.5 Highway over Roadway
077301 Airport Connector/US-1 Post
Road
Warwick 13.5 Highway over Highway
082801 P&W/Main Street Woonsocket 11.98 Railroad over Roadway
082901 P&W/Roger Williams Avenue East
Providence
10.75 Railroad over Roadway
099301 P&W/Blackstone Street Central Falls 9.33 Railroad over Roadway
108601 Washington Secondary Bike
Path/Burnham Street
Cranston 13.08 Bike Path over
Roadway
118001 Amtrak/King Street East
Greenwich
11.92 Railroad over Roadway
118101 Amtrak/Clyde Avenue Warwick 11.25 Railroad over Roadway
118201 Amtrak/Arnolds Neck Drive Warwick 13.5 Railroad over Roadway
Source: RIDOT, Bridge Inventory Data Sheet, February 10, 2015
6.1.1.7 Port Access Issues
A potential constraint to future growth at Quonset Business Park and the Port of Davisville
is the lack of direct access to I-95 Southbound. While the port is easily
accessible to I-95 Northbound via limited access roadways (i.e., Route 403 and Route 4),
access to I-95 Southbound requires trucks to use local arterials to connect to the
interstate. The routing introduces substantial potential for conflicts or incidents with local
traffic while also increasing time and costs for shippers.
103 | P a g e
F R E I G H T F O R W A R D :
S T A T E O F R H O D E I S L A N D F R E I G H T A N D G O O D S M O V E M E N T P L A N
According to traffic counted in summer 2015, the annual average daily traffic (AADT)
volumes of all vehicles entering and exiting Quonset was over 19,600.82 Approximately
11 percent of the AADT volume, or 2,171 vehicles, were larger vehicles or trucks. All of
these trucks destined for I-95 Southbound are moving off arterials onto local roadways
that may not be fully equipped to deal with this volume of truck traffic.
ProvPort also faces interstate access issues. While the port has excellent proximity to I-
95, trucks trying to access I-95 Southbound from the port must utilize local streets that
are not designed to deal with significant truck traffic. More than 214 trucks per day
travel into and out of ProvPort.83 Trucks do not have difficulty entering the port, as it is
directly accessible from I-95 Northbound and Southbound exits via Allens Avenue.
However, trucks departing ProvPort for I-95 Southbound need to use narrow, local
streets to access the highway or take a two-mile longer route north to use the Point
Street on-ramp.
Improving access to and from ProvPort supports existing freight movements but also
potential freight movements. For example, Rhode Island Resource Recovery
Corporation (RIRRC) is anticipating reaching its solid waste landfill capacity by 2038. This
may mean exporting RI solid waste out of the state. One option would be to truck the
solid waste to Port of Providence and then transport the waste to other regional landfills
via rail.
In November 2016, Rhode Island voters approved a ballot question that will allow the
state to issue $70 million in general obligation bonds to fund improvements at the Port
of Davisville and Port of Providence. Twenty million dollars of the total will be used to
purchase land (to be owned by the state) and fund infrastructure improvements to
increase terminal capacity at the Port of Providence. The state expects the purchase
of land and associated infrastructure improvements to begin in 2017 and be
completed in or about 2022.84 These funds could potentially be used to mitigate some
of the issues, and leverage the opportunities, described above.
82 Pare Corporation, QDC – Vehicle and Classification Counts Memorandum, August 7, 2015. 83 Information provided by Waterson Terminal Services, Providence, Rhode Island. 84 http://pbn.com/ProvPort-looks-for-20M-bond-to-expand-footprint-along-Allens-Ave,114604.
104 | P a g e
F R E I G H T F O R W A R D :
S T A T E O F R H O D E I S L A N D F R E I G H T A N D G O O D S M O V E M E N T P L A N
6.1.2 Railways Conditions
There are a number of issues and constraints that have been identified for Rhode
Island’s railroads. They include:
Rail system capacity and access;
Vertical clearance limitations;
Rail bridge weight restrictions; and
Conflicts with passenger service/expansion.
6.1.2.1 Rail System Capacity and Access
Recent System Improvements
The $210 million Freight Rail Improvement Project (FRIP), which included construction of
a third track parallel to Amtrak’s NEC, was completed in 2006 to improve the state’s rail
system capacity. The FRIP project included 22 miles of rail improvements along
segments of the NEC between the connection to the Seaview Railroad and the
Quonset Business Park in North Kingstown and the East Providence Secondary Track in
Central Falls. To relieve conflicts between passenger and freight rail service, 12 miles of
new track was built south of Providence and 5 miles of track was upgraded north of
Providence. The goal of the FRIP was to increase track capacity, address restrictions on
existing lines due to increased Amtrak passenger operations, and to provide 21 feet 6
inch vertical clearance to accommodate double-stack containers and tri-level auto
rack rail cars. The project allows up to ten freight trains per day to operate on the
corridor.85
Regional Capacity Concerns
The work completed as part of the FRIP and upgrades from P&W and Seaview Railroad
have improved operations and capacity of the railroads in Rhode Island; however, the
railroads still face challenges that affect efficient freight operations. Freight trains
continue to operate during time-restricted daytime windows along a five-mile-long
segment of the NEC between Warwick and North Kingstown. This segment was not
upgraded as part of the FRIP and only has two tracks. If freight and passenger volumes
continue to increase, passenger train delays or the need for extended maintenance on
Amtrak’s line will shrink or eliminate these operating windows.
Freight rail system capacity in Rhode Island is a concern due to the state’s dependency
on the NEC. While the state offers good regional connections to Class I railroads in
85 State Rail Plan, 2014.
105 | P a g e
F R E I G H T F O R W A R D :
S T A T E O F R H O D E I S L A N D F R E I G H T A N D G O O D S M O V E M E N T P L A N
Massachusetts and beyond, freight rail service in the state is constrained to a single rail
line that has ever increasing demands. Amtrak, commuter rail, and freight rail service to
the state’s primary ports and industrial areas utilize this single railroad corridor. With
passenger rail expansions likely and ongoing hazardous materials restrictions through
Providence Station, freight rail operations will continue to face capacity issues and
increased delays.
Ongoing NEC Plans
The NEC FUTURE effort is a comprehensive planning effort to identify investments along
the Northeast Corridor between Washington, D.C. and Boston.86 Initiated in 2012, the
effort is currently working to develop a long-term vision and investment program for the
NEC. The effort includes the development of a Tier 1 Environmental Impact Statement
(EIS) and Service Development Plan that supports that vision. As part of the EIS, three
alternatives to expand capacity, accommodate growth, upgrade infrastructure,
improve service, and increase connectivity were prepared. Along the Rhode Island
portion of the corridor, the alternatives offer two alignment options: a new bypass
corridor between Old Saybrook, Connecticut, and Richmond, Rhode Island, to avoid
movable bridge constraints and a supplemental route between New Haven, Hartford,
and Providence to improve capacity and performance and serve new markets. The
study is also looking at adding additional tracks along the existing corridor.
Local Capacity and Access Concerns
The largest concentrations of freight rail traffic in Rhode Island are at the Quonset
Business Park and ProvPort where rail traffic has grown in both locations over the past
decade. To accommodate this growth and further expand freight rail usage in the
state, a number of projects have been planned or completed at these facilities to
address operational constraints, security and safety issues, or access concerns.
As noted in the State Rail Plan, rail traffic levels at Quonset Business Park have increased
significantly in recent years, largely due to the delivery of automobiles by rail. In 2015,
there were 227,021 automobiles imported at the port, surpassing last year’s record by
48,806 vehicles. An additional 42,150 vehicles arrived by rail and truck for a total of
269,171 autos arriving at the port in 201587. Other commodities handled at the port
include chemicals, lumber, and food products. According to QDC, the number of rail
86 NEC FUTURE: A Rail Investment Plan for the Northeast Corridor, http://www.necfuture.com. 87 http://www.quonset.com/news/quonset-news/port-of-davisville-achieves-6th-consecutive-record-
breaking-year-for-auto-imports/.
106 | P a g e
F R E I G H T F O R W A R D :
S T A T E O F R H O D E I S L A N D F R E I G H T A N D G O O D S M O V E M E N T P L A N
carloads has grown even higher in last few years, to more than 5,000 carloads88
annually.
To address the growing rail traffic and support plans for expansion, QDC has identified
or completed a range of projects to ensure that rail system is capable of meeting
demands. Using general obligation bond fund proceeds and the TIGER discretionary
grant program, QDC made rail system upgrades to improve safety, allow for heavier
car weights, and reestablish on-dock rail on Davisville Pier 2. As part of the TIGER grant,
QDC purchased a new mobile harbor crane for use on Davisville Pier 2. This crane, with
lift capacity of 140 metric tons, will allow the port to handle container and project
cargoes and position it to bring Marine Highway traffic (short-sea shipping) to Davisville,
should the market support this service.
The State Rail Plan identified two additional projects at Quonset Business Park to address
capacity issues. The first project would be to construct a three-track rail yard within
Quonset for the storage of rail cars. This yard facility would increase storage capacity
within the complex so as not to interfere with existing running tracks. The estimated cost
of this project is $2.7 million. The second project would relocate the Business Park’s
turnout track with Amtrak’s NEC line, thereby freeing up property that could then be
used for additional development. The estimated cost of the turnout project is $4.5 million.
Both of these projects were determined to be priority projects as part of the
freight plan as well. A complete listing of priority projects is available in Tables 52 and 53
of this plan.
According to the State Rail Plan, rail carloadings generated at ProvPort have also
increased significantly in recent years. Current annual rail volume is approximately 6,000
carloads, and the leading commodities carried include ethanol, chemicals, oxides, and
various break bulk commodities such as cement, and recycled materials. Rail traffic
generated by ProvPort, however, can be subject to economic factors and changes in
freight logistics so commodities may vary slightly year to year. In addition to the two
new mobile harbor cranes installed in 2013, ProvPort recently invested $3.5 million to
replace 1,700 feet of rail along the port’s outer pier, construction of covered rail facilities
and indoor rail service to warehouse facilitates, which should accommodate
anticipated needs for rail service. The construction of these facilities allows for direct
transfer of commodities between ships and rail cars. This loading operation and
capability may be useful for entities such as RIRRC. As mentioned previously, RIRRC may
be interested in utilizing the rail facilities at ProvPort to transport the state’s solid waste to
regional landfills, once RIRR’s facilities reach their maximum capacity.
88 http://www.quonset.com/rail/.
107 | P a g e
F R E I G H T F O R W A R D :
S T A T E O F R H O D E I S L A N D F R E I G H T A N D G O O D S M O V E M E N T P L A N
Finally, the State Rail Plan proposes a study to evaluate service restoration over the
Sakonnet River rail bridge to the Newport Secondary Track on Aquidneck Island. The rail
was bridge closed in 1980 following damage to the bridge, effectively removing the rail
connection between Aquidneck Island (Newport, Middletown and Portsmouth) and
southeastern Massachusetts.
6.1.2.2 Vertical Clearance Limitations
One important trend as railroads move towards capacity and efficiency improvements
is the use of double-height, or double-stack, rail cars. The primary factor that limits the
ability of railroads to utilize double-stack rail cars and increase capacity is vertical
clearance, or height limitations. In the older, more developed portions of the country,
such as Rhode Island and the Northeast, ensuring that rail corridors have adequate
vertical clearance is a challenge. Containerized rail movements require varying
minimum vertical clearances depending on the type of containers or cars carried.
Throughout the country’s older rail corridors, the height between the top of rail cars and
overhead structures, including bridges, tunnels, or electric catenary wires, creates
challenges for the use of double-stack container rail cars and tri-level automobile
carrier rail cars without significant investments.
The minimum clearance on bridges erected over tracks is twenty-two feet, six inches
(22’6”) in Rhode Island.89 The minimum height needed to accommodate double-stack
container rail cars and tri-level automobile carrier cars is twenty-one feet, six inches
(21’6”). Several segments of the rail lines in Rhode Island, including segments on the
important NEC, are less than or equal to the 22’6”minimum. This includes segments in
Central Falls, Pawtucket, Providence, Warwick, and North Kingstown. This lack of
adequate vertical clearance along the entire length of the rail corridor affects the
ability to maximize the potential for intermodal movements on rail. As described in the
State Rail Plan, and again in the priority projects identified through the freight planning
effort, increasing the vertical clearance to accommodate double stack could provide
additional economic opportunities for the state and should be studied further. Figure 24
shows the required clearances for different double-stacking configurations.
89 RI Gen L § 39-7-1 (2014), http://law.justia.com/codes/rhode-island/2014/title-39/chapter-39-7/section-39-
7-1.
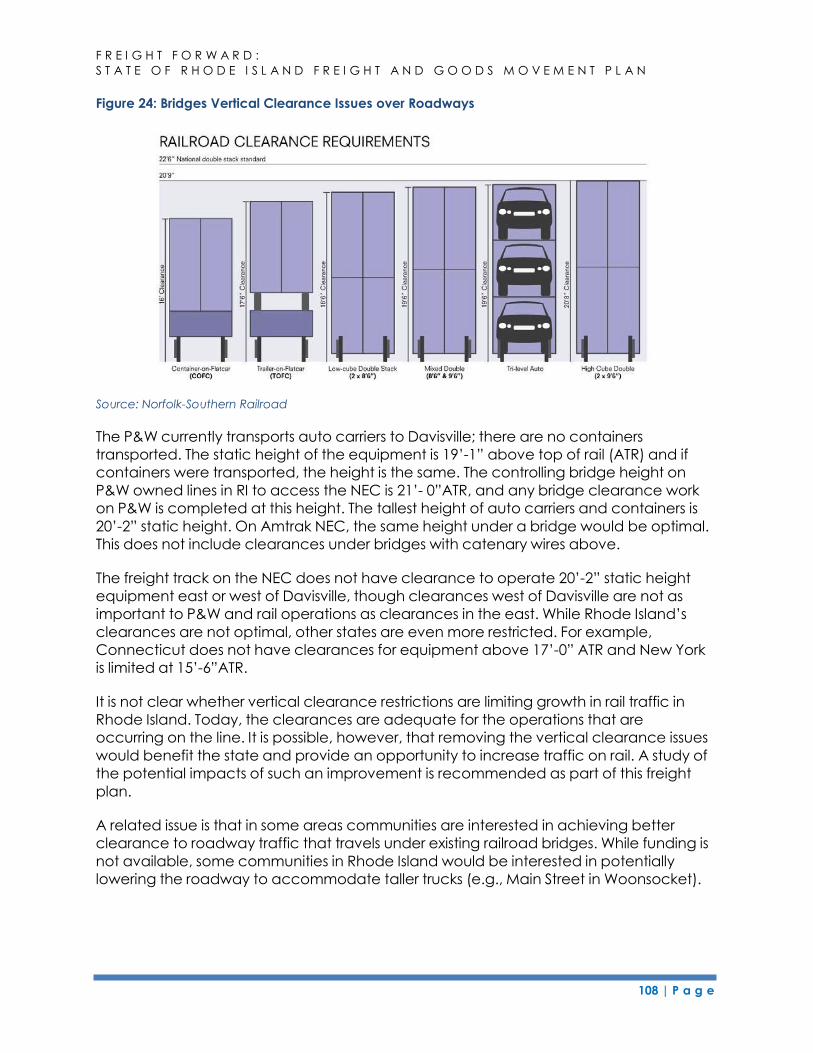
108 | P a g e
F R E I G H T F O R W A R D :
S T A T E O F R H O D E I S L A N D F R E I G H T A N D G O O D S M O V E M E N T P L A N
Figure 24: Bridges Vertical Clearance Issues over Roadways
Source: Norfolk-Southern Railroad
The P&W currently transports auto carriers to Davisville; there are no containers
transported. The static height of the equipment is 19’-1” above top of rail (ATR) and if
containers were transported, the height is the same. The controlling bridge height on
P&W owned lines in RI to access the NEC is 21’- 0”ATR, and any bridge clearance work
on P&W is completed at this height. The tallest height of auto carriers and containers is
20’-2” static height. On Amtrak NEC, the same height under a bridge would be optimal.
This does not include clearances under bridges with catenary wires above.
The freight track on the NEC does not have clearance to operate 20’-2” static height
equipment east or west of Davisville, though clearances west of Davisville are not as
important to P&W and rail operations as clearances in the east. While Rhode Island’s
clearances are not optimal, other states are even more restricted. For example,
Connecticut does not have clearances for equipment above 17’-0” ATR and New York
is limited at 15’-6”ATR.
It is not clear whether vertical clearance restrictions are limiting growth in rail traffic in
Rhode Island. Today, the clearances are adequate for the operations that are
occurring on the line. It is possible, however, that removing the vertical clearance issues
would benefit the state and provide an opportunity to increase traffic on rail. A study of
the potential impacts of such an improvement is recommended as part of this freight
plan.
A related issue is that in some areas communities are interested in achieving better
clearance to roadway traffic that travels under existing railroad bridges. While funding is
not available, some communities in Rhode Island would be interested in potentially
lowering the roadway to accommodate taller trucks (e.g., Main Street in Woonsocket).
109 | P a g e
F R E I G H T F O R W A R D :
S T A T E O F R H O D E I S L A N D F R E I G H T A N D G O O D S M O V E M E N T P L A N
6.1.2.3 Rail Bridge Weight Restrictions
The railroad system that connects to Rhode Island is not fully equipped to
accommodate industry standard 286-ton rail cars. Five rail bridges along the P&W line in
Massachusetts between Providence and Worcester have weight limitations that restrict
rail cars to a maximum of 263 tons. This limits operators from filling rail cars to capacity
and results in the need for more rail cars and reduced efficiency. As indicated by its
inclusion in the State Rail Plan, this is an important improvement project for the state.
However, P&W initiated the upgrade of these bridges in 2015 and anticipates
completion of the work in 2016.
The future of freight railroad operations in Rhode Island is dependent on working with
regional partners, including the Commonwealth of Massachusetts to eliminate the
constraints to efficient freight rail operations. Additionally, several rail lines in Vermont
have weight restrictions, which limit rail shipments to Canada.
6.1.2.4 Conflicts with Passenger Service
Although the FRIP provided additional capacity and adequate clearances for the tri-
level auto rack cars on most of the NEC, this corridor still has a number of constraints that
will likely be further exacerbated in the future. As described in the State Rail Plan, an
approximately five mile segment between Main Avenue in Warwick and Post Road in
North Kingstown was not upgraded with a third track and freight trains with hazardous
materials are restricted to daytime windows between Amtrak and commuter passenger
trains. Future increases in freight and passenger rail volumes, passenger train delays,
or the need for extended maintenance on Amtrak’s line will shrink or eliminate these
operating windows. This will in turn decrease the capacity and reliability of freight
service to Quonset and other shippers accessed via the NEC. Any increase of intercity or
commuter rail volume on this segment may further limit P&W operating availability in the
future.
The Providence Amtrak Station has hazardous cargo restrictions that prevent the use of
the tunnel by freight trains when passengers are waiting on the station platforms or in
the tunnel. Freight trains must wait for windows to pass through the station when no
passenger trains are in the tunnel or passengers are on the station platform. Each
weekday, over 70 passenger trains pass through Providence Station. Windows when
trains are not in the station are limited to the late evening and early morning hours
(11:30 pm to 1:00 am and 1:15 am to 4:45 am). During the day, trains pass through the
station consistently and there are only two 30-minute windows in the afternoon when no
trains are in the station.
If freight rail traffic to the ports continues to increase, this restriction will become a
bigger issue. Almost all of the two to three trains that pass through this corridor each
day carry some type of restricted material, primarily ethanol. Even trains with empty
loads are restricted because they carry residual materials. This creates bottlenecks on
the corridor as these trains wait to get through station. As passenger service increases,
110 | P a g e
F R E I G H T F O R W A R D :
S T A T E O F R H O D E I S L A N D F R E I G H T A N D G O O D S M O V E M E N T P L A N
freight service operations will likely be reduced unless the two segments are separated
and the restriction can be eliminated.
The need to accommodate freight rail movements, including hazardous rail cargo
movements through Providence Station has been identified as a high priority project in
the State Rail Plan. RIDOT has studied and is assessing options to address this situation as
part of ongoing efforts to make improvements at Providence Station.
A study completed in 2015 by RIDOT evaluated six alternatives that maintain existing rail
shipments, including a no action alternative that maintains the existing tunnel protocol
and five that eliminate the protocol or partially or fully avoid the tunnel when
transporting hazardous cargo:
1. No action
2. Concurrent operations without structural changes to tunnel (i.e., change in
protocol)
3. Concurrent operations with structural changes to tunnel (i.e. fire-rated wall to
separate freight operations)
4. Reroute ethanol unit trains via the Northeast Corridor (NEC) from Groton to
Cranston
5. Reroute all hazardous cargo via the NEC through Groton
6. Reroute all hazardous cargo via a reconstructed Hartford, Providence, & Fishkill
line from Plainfield to Cranston90
In the short term, the study recommends no action. In the long-term, there are two
scenarios that will likely impact decision-making. If growth in passenger rail and/or
higher frequency of hazardous cargo freight traffic through the tunnel results in
significantly longer delays for freight trains, alternative 3 is the lowest cost solution that
allows concurrent freight movement in the Providence Station tunnel that would meet
Amtrak’s approval. If there is significant development in the station area, alternative 5
(routing all hazardous cargo via Groton, CT) is recommended for consideration. It
would be more easily implementable than alternative 6, because there would be
relatively minor infrastructure improvements necessary.
Another important rail consideration includes the construction of high-level platforms
along freight corridors at Amtrak and commuter rail stations. These platforms restrict the
ability for freight rail to carry wide loads and require construction of special track work.
Currently, these high-level platforms have been constructed at T.F. Green and Wickford
90 Providence Station Tunnel Freight Operations Study, prepared by RIDOT, September 21, 2015.
111 | P a g e
F R E I G H T F O R W A R D :
S T A T E O F R H O D E I S L A N D F R E I G H T A N D G O O D S M O V E M E N T P L A N
Junction. The platform at Kingston Station will be upgraded as part of a FRA project by
2017.91
This and other rail constraints and issues are presented in Figure 25 below.
91 Amtrak, Great American Stations, Kingston, Rhode Island,
http://www.greatamericanstations.com/Stations/KIN.
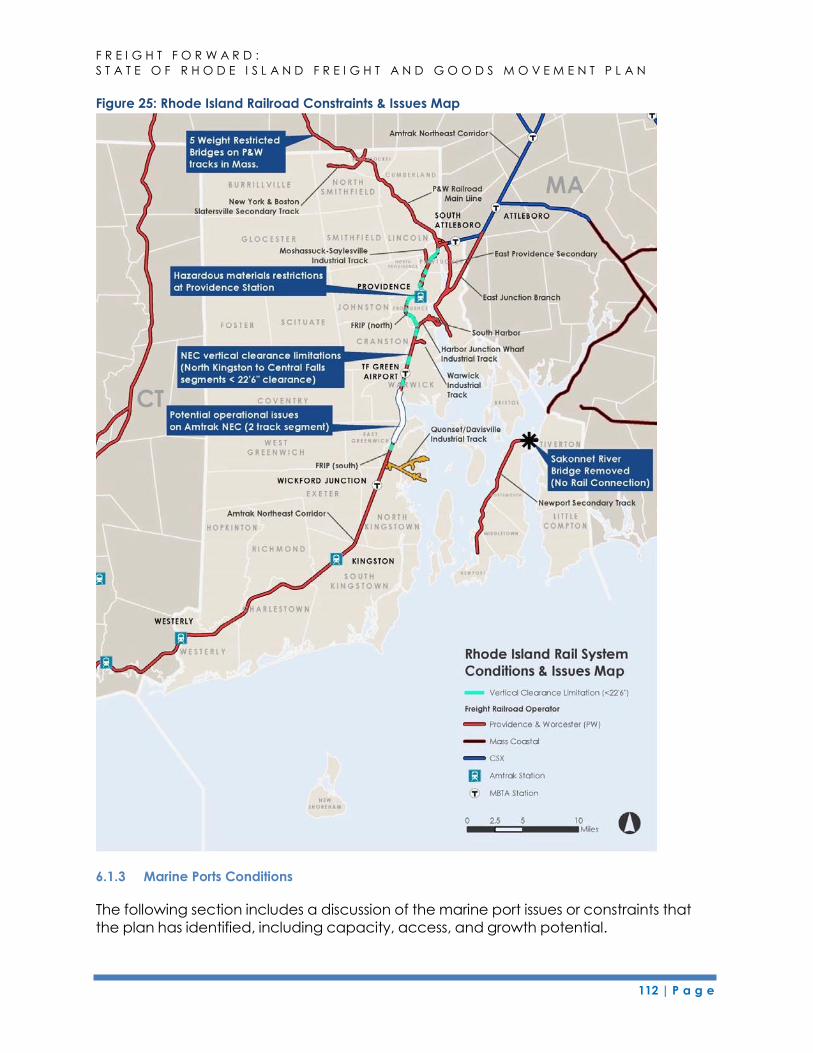
112 | P a g e
F R E I G H T F O R W A R D :
S T A T E O F R H O D E I S L A N D F R E I G H T A N D G O O D S M O V E M E N T P L A N
Figure 25: Rhode Island Railroad Constraints & Issues Map
6.1.3 Marine Ports Conditions
The following section includes a discussion of the marine port issues or constraints that
the plan has identified, including capacity, access, and growth potential.
113 | P a g e
F R E I G H T F O R W A R D :
S T A T E O F R H O D E I S L A N D F R E I G H T A N D G O O D S M O V E M E N T P L A N
6.1.3.1 Channel and Berth Dredging
In addition to the $63 million Providence River and Harbor Maintenance Dredging
Project that was completed in 2005, the Port of Davisville undertook a $7.5 million
maintenance dredging project in 2012 to maintain channel and berth depths to 32
feet. This was the first dredging project since its original construction in the 1940s.92 These
dredging projects are expected to meet the needs of existing ship draughts for the
near future.
6.1.3.2 Climate Change and Port Resiliency
The significant investments made at the state’s ports are threatened by sea level rise
and higher storm surges caused by hurricanes and other significant storms. The state’s
marine infrastructure is subject to significant damage caused by these storms that have
the potential to result in significant economic losses, environmental impacts, and quality
of life issues for Rhode Island’s population. Making smart investments to ensure that the
state’s ports and maritime facilities are resilient and less vulnerable to future storms is a
key concern.
The University of Rhode Island’s Department of Marine Affairs, in conjunction with the
RIDOT, URI Transportation Center, and other state and federal partners, conducted a
study in 2014 to assessment the Port of Providence’s maritime infrastructure and
develop strategies to address the identified vulnerabilities.93 The University is continuing
to study this issue at the Port of Providence. In the future, the methodology used to
complete this research can be replicated for other critical ports and marine facilities in
Rhode Island.
92 Quonset Business Park Newsletter, July 13, 2012, http://www.quonset.com/news/quonset-news/dredging-
project-positions-quonset-for-more-growth. 93 University of Rhode Island Department of Marine Affairs, Port of Providence Resilience Project,
http://www.portofprovidenceresilience.org/.
114 | P a g e
F R E I G H T F O R W A R D :
S T A T E O F R H O D E I S L A N D F R E I G H T A N D G O O D S M O V E M E N T P L A N
6.1.3.3 Port of Davisville
The Port of Davisville and the surrounding Quonset Business Park has considerable
capacity for growth. According to QDC, the business park could handle about 10,000
intermodal containers per year using the port’s 600-foot berths and an additional 100
acres could be designated for autos or other freight. However, the port’s two berths are
used only for automobiles, and significant growth would require the addition of another
berth and investments to maintain the existing two piers.
Rhode Island voters approved the issuance of $50 million in general obligation bonds in
November 2016. This funding would modernize Pier 2 and extend it to the north, thereby
gaining an additional car ship berth. Dredging to support the new berth would also be
conducted.
Port operators and customers identified other improvements that could increase
capacity or improve efficiency at the port. These include additional yard handling
equipment, such as a top end loader, large forklift, Mafi trailers or other materials
handling equipment, and a 20-ton mobile crane, and landside improvements, such as
increased overhead wire clearance or terminal tractors.
A potential constraint to growth at Port of Davisville and the Quonset Business Park is
the lack of direct access to I-95 Southbound. According to QDC, the auto distribution
business at Quonset generates over 27,000 truck trips every year and Ocean State Job
Lot generates 60,000 truck trips per year. Most of these trucks are headed southbound
on I-95. Resolving this access issue is included in the list of priority projects identified
through the freight planning effort.
6.1.3.4 Port of Providence
The lack of direct access from the Port of Providence terminals along Allens Avenue and
Terminal Road (e.g., ProvPort, Sprague Terminal) to I-95 Southbound is another issue that
affects the capacity of the port. As mentioned above, the port has excellent
proximity to I-95, but trucks trying to access I-95 Southbound must utilize local streets that
are not designed to deal with significant truck traffic. There are more than 78,000 trucks
traveling into or out of ProvPort annually, which represents 214 trucks per day entering
or exiting the facility.94 In general, the roadways around ProvPort need improvements to
support local truck movements, including signal coordination and wider turning radii.
Terminal Road is in poor condition and needs upgrades.
94 Information provided by Waterson Terminal Services, Providence, Rhode Island.
115 | P a g e
F R E I G H T F O R W A R D :
S T A T E O F R H O D E I S L A N D F R E I G H T A N D G O O D S M O V E M E N T P L A N
In addition to supporting its own current demands, ProvPort is well-positioned to
accommodate overflow or excess demand from other ports in the region. However,
while ProvPort sees demand for growth, expansion would require additional land and
storage space. In May 2015, the port operator secured a land lease from the City of
Providence for the 14-acre adjoining parcel to the south.95 Further expansion is
currently constrained by existing development on adjacent properties.
The 2014 Rail Plan also identified the need for improvements to off-loading capabilities
at ProvPort. These improvements would help speed bulk transfers between the port and
rail system.
6.1.4 Airports and Air Freight Conditions
In 2015, RIAC commissioned a study to examine demand for air cargo services at T.F.
Green Airport. The study evaluated the demand in relation to T.F. Green Airport’s
existing cargo facilities and identified a series of recommendations based on the
findings. The study identified that some air cargo carried by FedEx and UPS was being
trucked to Boston Logan International airport, even though T.F. Green Airport was a
closer airport. Industry feedback identified that ramp capacity for freighter aircraft
parking and cargo unloading as a key barrier to FedEx and UPS increasing the
frequency of flights and potentially the size of aircraft. Additionally, sorting and cargo
handling facilities on the airport are housed in out-dated buildings. These buildings are
typically unable to accommodate the high speed and efficient sortation equipment
and processing those integrators rely on to handle high volumes of cargo.
For much of the past few decades, all general aviation and air cargo development has
occurred in the northern half of the airport, located north of Runways 5-23 and 16-34.
Over time, as demand has grown, this area is approaching the point to where it can no
longer meet the future needs of general aviation and air cargo. Both FedEx and UPS
operate larger aircraft, and in 2014, Hangar 1 (used to store general aviation aircraft)
was demolished as part of a runway safety requirements project.
Over the past several years, RIAC has been acquiring non-compatible residential
parcels on Field View Drive and Murray Street, south of Strawberry Field Road on the
southwest quadrant of the airport. The location of this land, combined with currently
isolated airfield land such as the former Runway 5L Runway Protection Zone, along with
unused portions of long-term parking lot E, present an opportunity to explore growth
potential for future general aviation and air cargo needs.
95 GoLocalProv.com, “ProvPort Expands – Leases 14 Acres of City Land,” May 15, 2015,
http://www.golocalprov.com/business/provport-expands-leases-14-acres-of-city-land.
116 | P a g e
F R E I G H T F O R W A R D :
S T A T E O F R H O D E I S L A N D F R E I G H T A N D G O O D S M O V E M E N T P L A N
The T.F. Green Air Cargo Assessment identified limited area for the necessary support
facility growth for air cargo at Boston-Logan, as a potential opportunity for the airport.
Within this study it advises that, “recent incumbent carrier (i.e., FedEx and UPS)
interviews, as well as PVD’s successes in attracting new international service, suggest
that the airport has adequate justification to explore the land resources and
investments required to support cargo facilities improvements and/or expansion. While
nothing irreversible has likely already occurred, some limited operations likely have
occurred elsewhere in the past due to the inadequacy of PVD’s cargo facilities.” To this
end, details of the specific needs will be better qualified and quantified in the upcoming
T.F. Green Master Plan (slated for completion in late 2017). However, to get a quick
‘snapshot’ of this potential, RIAC’s on-call planning consultant was tasked to assist with
an initial ‘high level’ planning effort. This effort included exploring potential users,
developing high-level concepts and associated cost. The associated order-of-
magnitude cost is approximately $6 million. This estimated cost includes all infrastructure
(i.e., “pad ready”) related to just the air cargo facility. Private investment will be
required for actual hangar development and associated utility tie-ins.
Accommodating growth in air cargo at T.F. Green is identified as a priority project in the
freight plan.
6.1.5 Intermodal Facilities Conditions
Since the various freight modes do not work in isolation, ensuring that the state’s
intermodal connections and facilities are working is essential to creating a strong freight
network for Rhode Island. It is important to understand the effectiveness of the state’s
intermodal facilities (i.e., marine ports, airports) and how the intermodal connections
between rail, air, ship, highway, and pipeline are made.
At Quonset Business Park, railroad cars containing automobiles arrive from elsewhere in
North America for distribution within the Northeast. Currently, Seaview Railroad does not
have the capacity to accommodate additional short-term storage of railcars that have
been unloaded and are waiting for their return trips. The State Rail Plan recommended
the expansion of railroad sidings within the Quonset Business Park to improve access and
efficiency for freight railcars.
As previously mentioned, other intermodal facilities also have capacity or access issues:
The expansion of freight services at T.F. Green Airport is dependent on
modernization of cargo facilities and apron space.
ProvPort and the other port terminals in the Port of Providence along Allens
Avenue and Terminal Road have highway access issues. In Providence, trucks
departing the port terminals must use narrow, local streets and make tight turns
or make a two-mile-long detour to the north to access I-95 Southbound.
The Port of Davisville also has highway access issues. To access I-95 Southbound
from Route 4 Northbound, trucks must use local arterials to connect to the I-95
Southbound, which creates conflicts with local traffic and increases costs for
shippers.
117 | P a g e
F R E I G H T F O R W A R D :
S T A T E O F R H O D E I S L A N D F R E I G H T A N D G O O D S M O V E M E N T P L A N
The Port of Providence terminals along Allens Avenue do not currently have rail
access. A one-mile segment extending north from Thurbers Avenue along Allens
Avenue is currently inactive.
6.1.6 Pipeline Conditions
As detailed in the Rhode Island State Energy Plan, the state’s dependence on natural
gas exposes the state to a substantial amount of price, and potentially a supply, risk. In
recent years, growing demand for natural gas in the power generation and thermal
sectors have placed increasing pressures on the region’s limited interstate gas pipeline
infrastructure. Both Rhode Island’s and the larger region’s natural gas pipeline
infrastructure are aging and the several leak-prone pipelines contribute to greenhouse
gas emissions and rising costs due to natural gas leaks.
Given the reliance on natural gas to meet the state’s energy needs and the growing
regional competition on this energy source, addressing the capacity concerns is a key
strategy outlined in the State Energy Plan. To address these issues, regional coordination
on pipeline infrastructure is needed. According to America’s Natural Gas Alliance, New
England is overly reliant on inadequately piped natural gas and pipeline expansion
would remedy these infrastructure constraints and allow the region to take advantage
of economically stable natural gas supplies located only a few hundred miles away.96
Unlike the natural gas distribution system, Rhode Island is at the start of the regional
petroleum distribution system. The only significant petroleum pipeline in the state is used
for out-of-state distribution.
6.2 Freight System Performance Measures
Chapter 10 of this plan provides the approach used to prioritize investments intended to
mitigate some of the issues identified above. Chapter 11 provides a listing of potential
investments to improve the overall freight system. Understanding the impact of these
investments over time is important to the state. As a result, determining performance
measures that will help to quantify the success (or failure) of investment in freight
transportation is an element of the freight planning effort.
The list in Table 26 below provides information related to the mode-specific measures
selected to reflect performance of the freight transportation system. The choice of
these particular measures was determined by the availability of data, input of the FAC
96 America’s Natural Gas Alliance, Letter to New England Governors, September 25, 2014,
http://www.nescoe.com/uploads/ANGA_LettertoNEGovs_11Sep2014.pdf.
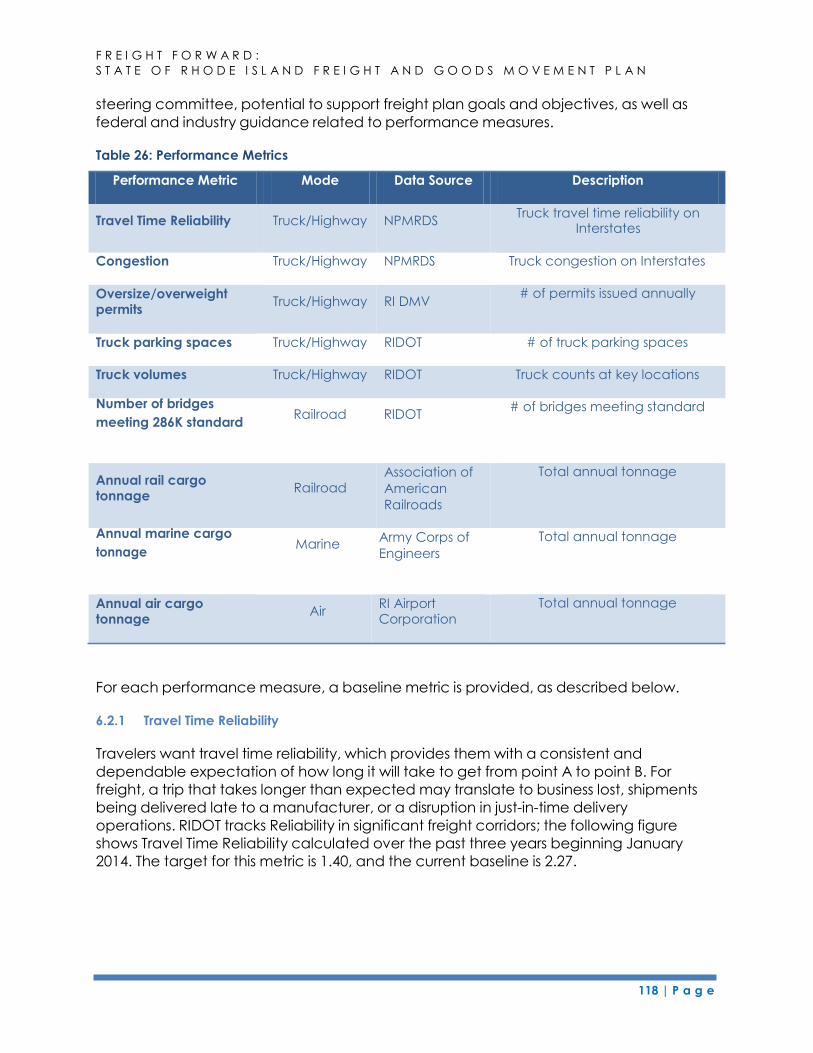
118 | P a g e
F R E I G H T F O R W A R D :
S T A T E O F R H O D E I S L A N D F R E I G H T A N D G O O D S M O V E M E N T P L A N
steering committee, potential to support freight plan goals and objectives, as well as
federal and industry guidance related to performance measures.
Table 26: Performance Metrics
Congestion Truck/Highway NPMRDS Truck congestion on Interstates
Truck parking spaces Truck/Highway RIDOT # of truck parking spaces
Number of bridges
meeting 286K standard Railroad RIDOT
# of bridges meeting standard
Annual marine cargo
tonnage Marine
Army Corps of
Engineers
Total annual tonnage
For each performance measure, a baseline metric is provided, as described below.
6.2.1 Travel Time Reliability
Travelers want travel time reliability, which provides them with a consistent and
dependable expectation of how long it will take to get from point A to point B. For
freight, a trip that takes longer than expected may translate to business lost, shipments
being delivered late to a manufacturer, or a disruption in just-in-time delivery
operations. RIDOT tracks Reliability in significant freight corridors; the following figure
shows Travel Time Reliability calculated over the past three years beginning January
2014. The target for this metric is 1.40, and the current baseline is 2.27.
Performance Metric Mode Data Source Description
Travel Time Reliability Truck/Highway NPMRDS Truck travel time reliability on
Interstates
Oversize/overweight permits
Truck/Highway RI DMV # of permits issued annually
Truck volumes Truck/Highway RIDOT Truck counts at key locations
Annual rail cargo tonnage
Railroad Association of
American
Railroads
Total annual tonnage
Annual air cargo tonnage
Air RI Airport Corporation
Total annual tonnage
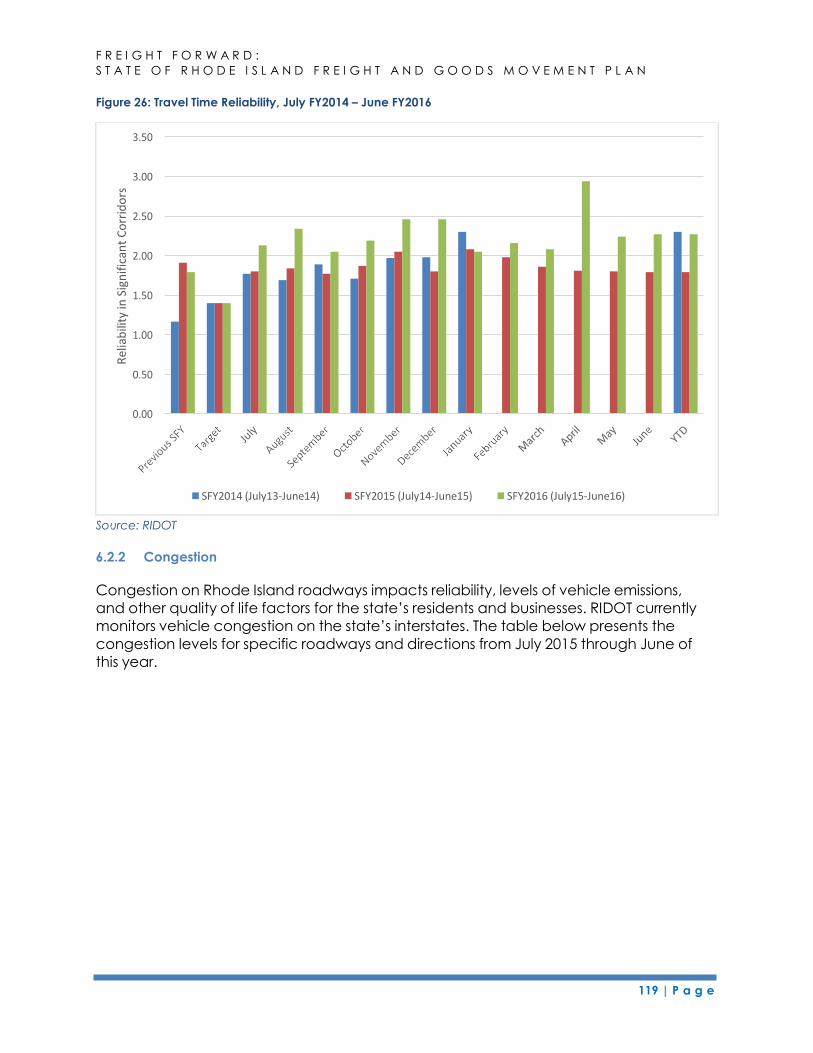
119 | P a g e
F R E I G H T F O R W A R D :
S T A T E O F R H O D E I S L A N D F R E I G H T A N D G O O D S M O V E M E N T P L A N
Figure 26: Travel Time Reliability, July FY2014 – June FY2016
Source: RIDOT
6.2.2 Congestion
Congestion on Rhode Island roadways impacts reliability, levels of vehicle emissions,
and other quality of life factors for the state’s residents and businesses. RIDOT currently
monitors vehicle congestion on the state’s interstates. The table below presents the
congestion levels for specific roadways and directions from July 2015 through June of
this year.
SFY2014 (July13‐June14) SFY2015 (July14‐June15) SFY2016 (July15‐June16)
Rel
iab
ility
in S
ign
ific
ant
Co
rrid
ors
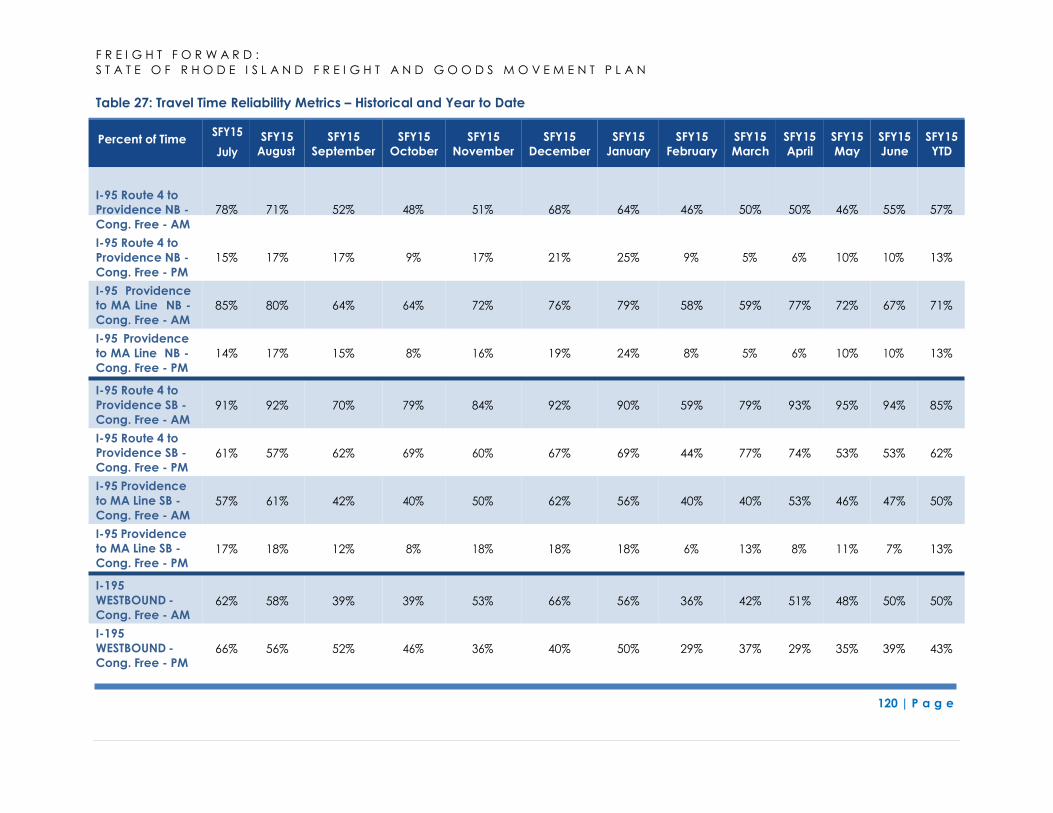
F R E I G H T F O R W A R D :
S T A T E O F R H O D E I S L A N D F R E I G H T A N D G O O D S M O V E M E N T P L A N
120 | P a g e
Table 27: Travel Time Reliability Metrics – Historical and Year to Date
Percent of Time SFY15
July
SFY15
August
SFY15
September
SFY15
October
SFY15
November
SFY15
December
SFY15
January
SFY15
February
SFY15
March
SFY15
April
SFY15
May
SFY15
June
SFY15
YTD
I-95 Route 4 to
Providence NB -
Cong. Free - AM
I-95 Route 4 to
Providence NB -
Cong. Free - PM
I-95 Providence
to MA Line NB -
Cong. Free - AM
I-95 Providence
to MA Line NB -
Cong. Free - PM
I-95 Route 4 to
Providence SB -
Cong. Free - AM
I-95 Route 4 to
Providence SB -
Cong. Free - PM
I-95 Providence
to MA Line SB -
Cong. Free - AM
I-95 Providence
to MA Line SB -
Cong. Free - PM
I-195
WESTBOUND -
Cong. Free - AM
I-195
WESTBOUND -
Cong. Free - PM
78% 71% 52% 48% 51% 68% 64% 46% 50% 50% 46% 55% 57%
15% 17% 17% 9% 17% 21% 25% 9% 5% 6% 10% 10% 13%
85% 80% 64% 64% 72% 76% 79% 58% 59% 77% 72% 67% 71%
14% 17% 15% 8% 16% 19% 24% 8% 5% 6% 10% 10% 13%
91% 92% 70% 79% 84% 92% 90% 59% 79% 93% 95% 94% 85%
61% 57% 62% 69% 60% 67% 69% 44% 77% 74% 53% 53% 62%
57% 61% 42% 40% 50% 62% 56% 40% 40% 53% 46% 47% 50%
17% 18% 12% 8% 18% 18% 18% 6% 13% 8% 11% 7% 13%
62% 58% 39% 39% 53% 66% 56% 36% 42% 51% 48% 50% 50%
66% 56% 52% 46% 36% 40% 50% 29% 37% 29% 35% 39% 43%
F R E I G H T F O R W A R D :
S T A T E O F R H O D E I S L A N D F R E I G H T A N D G O O D S M O V E M E N T P L A N
121 | P a g e
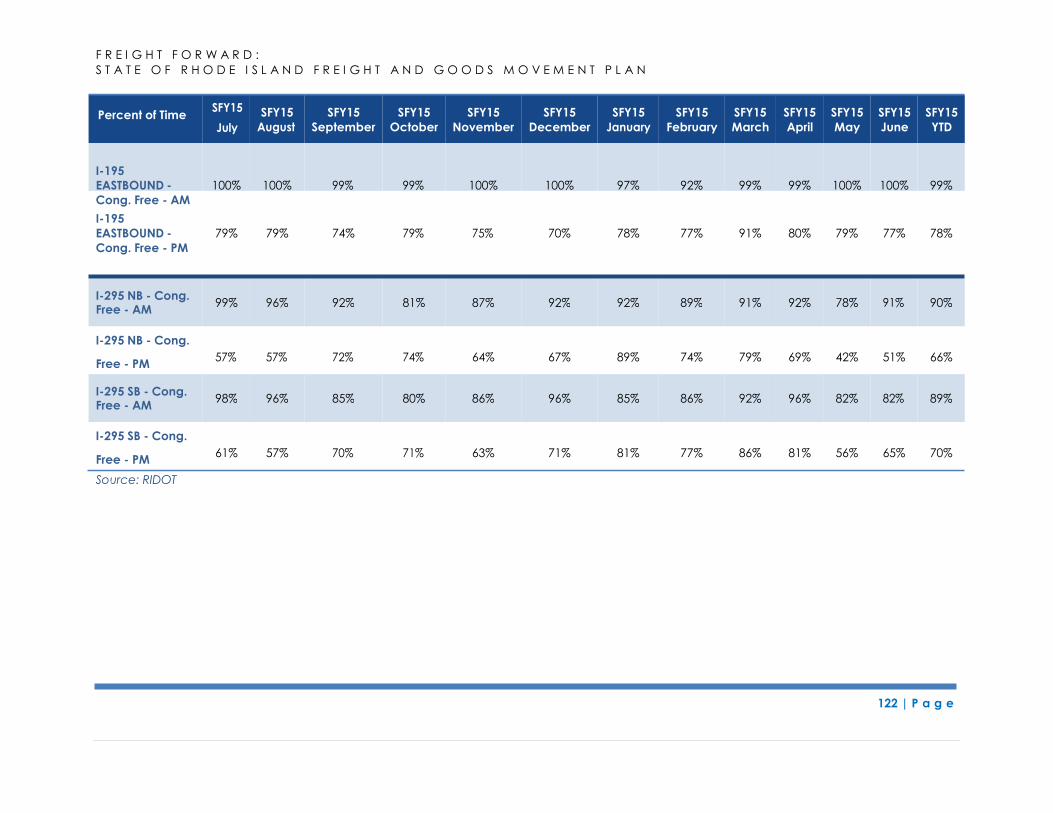
F R E I G H T F O R W A R D :
S T A T E O F R H O D E I S L A N D F R E I G H T A N D G O O D S M O V E M E N T P L A N
122 | P a g e
Percent of Time SFY15
July
SFY15
August
SFY15
September
SFY15
October
SFY15
November
SFY15
December
SFY15
January
SFY15
February
SFY15
March
SFY15
April
SFY15
May
SFY15
June
SFY15
YTD
I-195
EASTBOUND -
Cong. Free - AM
I-195
EASTBOUND -
Cong. Free - PM
100% 100% 99% 99% 100% 100% 97% 92% 99% 99% 100% 100% 99%
79% 79% 74% 79% 75% 70% 78% 77% 91% 80% 79% 77% 78%
I-295 NB - Cong.
Free - PM 57% 57% 72% 74% 64% 67% 89% 74% 79% 69% 42% 51% 66%
I-295 SB - Cong.
Free - PM 61% 57% 70% 71% 63% 71% 81% 77% 86% 81% 56% 65% 70%
Source: RIDOT
I-295 NB - Cong. Free - AM
99% 96% 92% 81% 87% 92% 92% 89% 91% 92% 78% 90%
I-295 SB - Cong. Free - AM
98% 96% 85% 80% 86% 96% 85% 86% 92% 96% 82% 89%
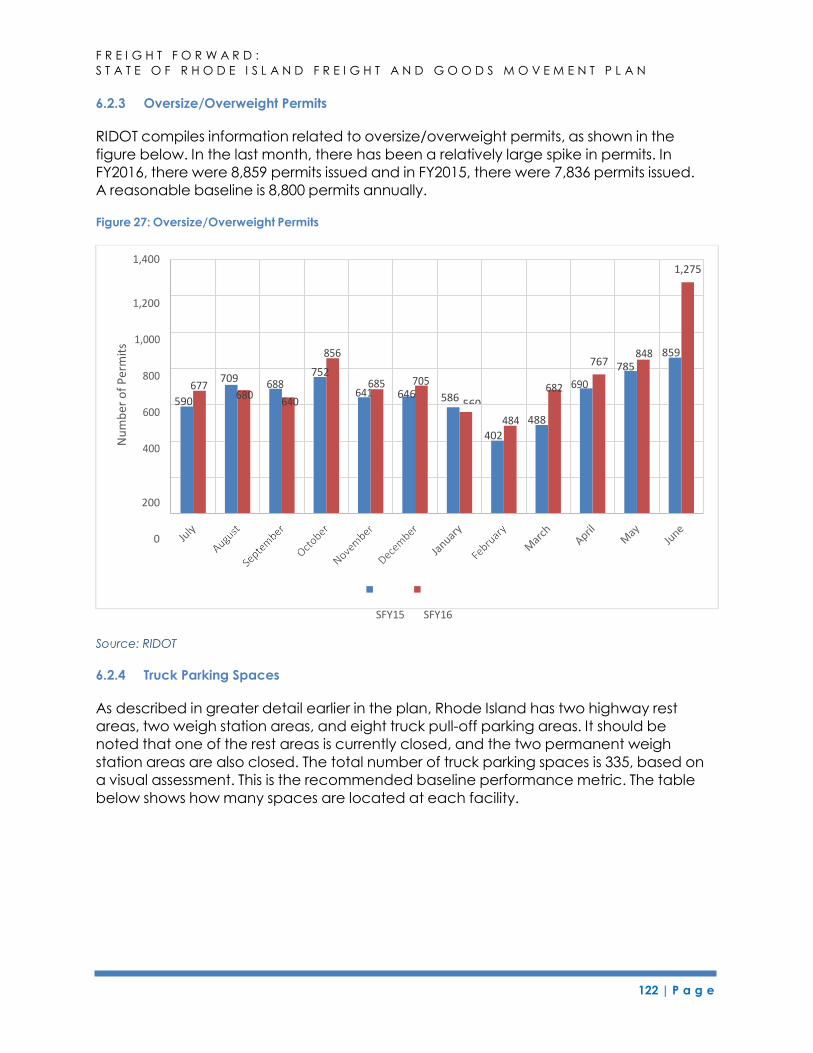
F R E I G H T F O R W A R D :
S T A T E O F R H O D E I S L A N D F R E I G H T A N D G O O D S M O V E M E N T P L A N
122 | P a g e
767
586 560
688
6.2.3 Oversize/Overweight Permits
RIDOT compiles information related to oversize/overweight permits, as shown in the
figure below. In the last month, there has been a relatively large spike in permits. In
FY2016, there were 8,859 permits issued and in FY2015, there were 7,836 permits issued.
A reasonable baseline is 8,800 permits annually.
Figure 27: Oversize/Overweight Permits
1,400
1,275
1,200
1,000
800
600
400
677
590
709
680 640
856
752
685 705 641 646
484
402
682
488
690
848
785
859
200
0
SFY15 SFY16
Source: RIDOT
6.2.4 Truck Parking Spaces
As described in greater detail earlier in the plan, Rhode Island has two highway rest
areas, two weigh station areas, and eight truck pull-off parking areas. It should be
noted that one of the rest areas is currently closed, and the two permanent weigh
station areas are also closed. The total number of truck parking spaces is 335, based on
a visual assessment. This is the recommended baseline performance metric. The table
below shows how many spaces are located at each facility.
Nu
mb
er o
f P
erm
its
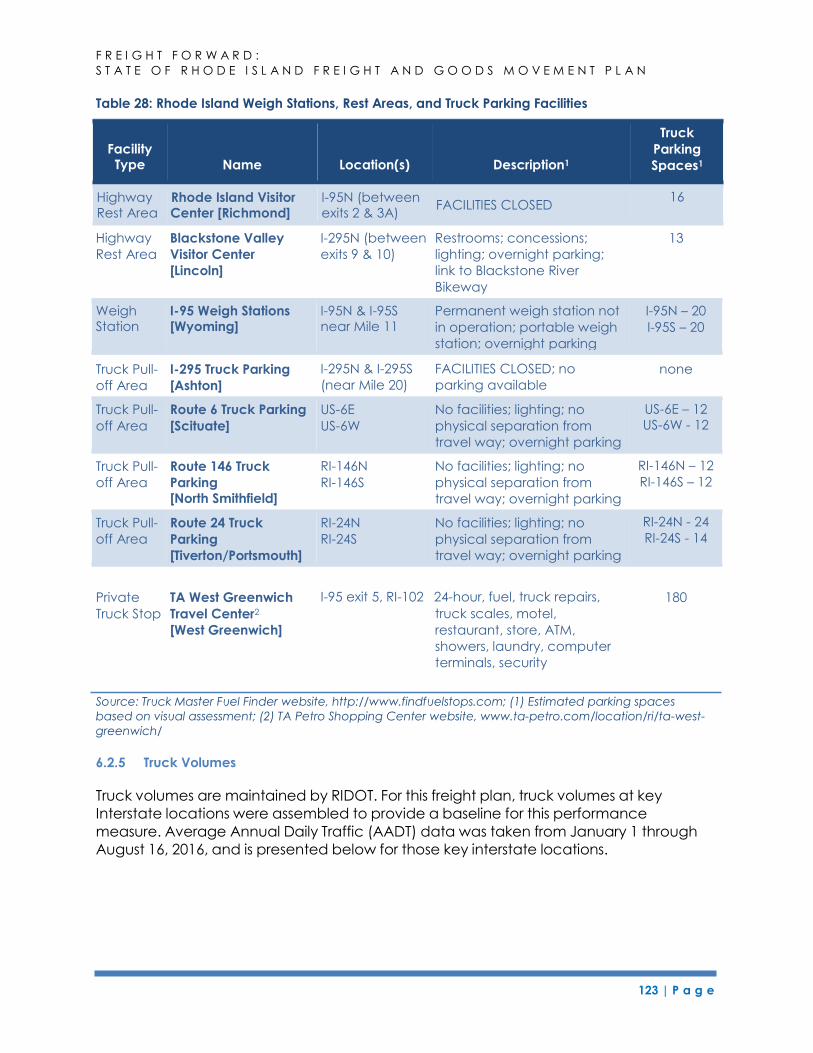
123 | P a g e
F R E I G H T F O R W A R D :
S T A T E O F R H O D E I S L A N D F R E I G H T A N D G O O D S M O V E M E N T P L A N
Weigh Station
I-95 Weigh Stations [Wyoming]
I-95N & I-95S near Mile 11
Permanent weigh station not I-95N – 20
in operation; portable weigh I-95S – 20
station; overnight parking
Table 28: Rhode Island Weigh Stations, Rest Areas, and Truck Parking Facilities
Highway
Rest Area
Blackstone Valley
Visitor Center
[Lincoln]
I-295N (between
exits 9 & 10)
Restrooms; concessions; 13
lighting; overnight parking;
link to Blackstone River
Bikeway
Truck Pull-
off Area
Truck Pull-
off Area
Truck Pull-
off Area
Truck Pull-
off Area
I-295 Truck Parking
[Ashton]
Route 6 Truck Parking
[Scituate]
Route 146 Truck
Parking [North Smithfield]
Route 24 Truck
Parking
[Tiverton/Portsmouth]
I-295N & I-295S
(near Mile 20)
US-6E
US-6W
RI-146N
RI-146S
RI-24N
RI-24S
FACILITIES CLOSED; no
parking available
No facilities; lighting; no
physical separation from
travel way; overnight parking
No facilities; lighting; no
physical separation from
travel way; overnight parking
No facilities; lighting; no
physical separation from
travel way; overnight parking
none
US-6E – 12 US-6W - 12
RI-146N – 12
RI-146S – 12
RI-24N - 24
RI-24S - 14
Private
Truck Stop
TA West Greenwich
Travel Center2
[West Greenwich]
I-95 exit 5, RI-102 24-hour, fuel, truck repairs,
truck scales, motel,
restaurant, store, ATM,
showers, laundry, computer
terminals, security
180
Source: Truck Master Fuel Finder website, http://www.findfuelstops.com; (1) Estimated parking spaces
based on visual assessment; (2) TA Petro Shopping Center website, www.ta-petro.com/location/ri/ta-west-
greenwich/
6.2.5 Truck Volumes
Truck volumes are maintained by RIDOT. For this freight plan, truck volumes at key
Interstate locations were assembled to provide a baseline for this performance
measure. Average Annual Daily Traffic (AADT) data was taken from January 1 through
August 16, 2016, and is presented below for those key interstate locations.
Facility Type Name Location(s) Description1
Truck
Parking
Spaces1
Highway Rhode Island Visitor Rest Area Center [Richmond]
I-95N (between exits 2 & 3A)
FACILITIES CLOSED 16
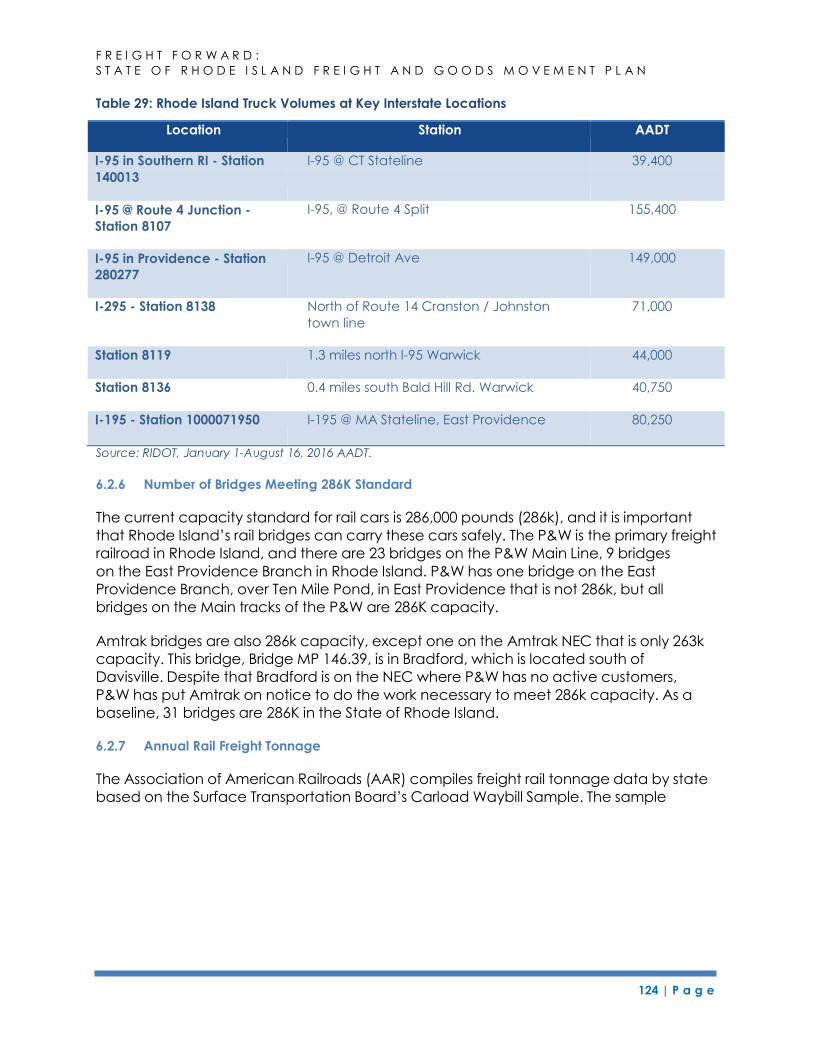
124 | P a g e
F R E I G H T F O R W A R D :
S T A T E O F R H O D E I S L A N D F R E I G H T A N D G O O D S M O V E M E N T P L A N
Table 29: Rhode Island Truck Volumes at Key Interstate Locations
Location Station AADT
I-95 in Southern RI - Station I-95 @ CT Stateline 39,400
140013
I-95 @ Route 4 Junction -
Station 8107
I-95, @ Route 4 Split 155,400
I-95 in Providence - Station
280277
I-95 @ Detroit Ave 149,000
I-295 - Station 8138 North of Route 14 Cranston / Johnston 71,000
town line
Station 8119 1.3 miles north I-95 Warwick 44,000
Station 8136 0.4 miles south Bald Hill Rd. Warwick 40,750
I-195 - Station 1000071950 I-195 @ MA Stateline, East Providence 80,250
Source: RIDOT, January 1-August 16, 2016 AADT.
6.2.6 Number of Bridges Meeting 286K Standard
The current capacity standard for rail cars is 286,000 pounds (286k), and it is important
that Rhode Island’s rail bridges can carry these cars safely. The P&W is the primary freight
railroad in Rhode Island, and there are 23 bridges on the P&W Main Line, 9 bridges
on the East Providence Branch in Rhode Island. P&W has one bridge on the East
Providence Branch, over Ten Mile Pond, in East Providence that is not 286k, but all
bridges on the Main tracks of the P&W are 286K capacity.
Amtrak bridges are also 286k capacity, except one on the Amtrak NEC that is only 263k
capacity. This bridge, Bridge MP 146.39, is in Bradford, which is located south of
Davisville. Despite that Bradford is on the NEC where P&W has no active customers,
P&W has put Amtrak on notice to do the work necessary to meet 286k capacity. As a
baseline, 31 bridges are 286K in the State of Rhode Island.
6.2.7 Annual Rail Freight Tonnage
The Association of American Railroads (AAR) compiles freight rail tonnage data by state
based on the Surface Transportation Board’s Carload Waybill Sample. The sample
125 | P a g e
F R E I G H T F O R W A R D :
S T A T E O F R H O D E I S L A N D F R E I G H T A N D G O O D S M O V E M E N T P L A N
contains detailed information on the origination and termination of carloads by
commodity and carrier for most railroads in the country. In Rhode Island, 49,000 tons
originated in the state and 835,000 tons terminated in the state, based on 2012 data.97
These are the baseline performance measures assumed for this plan.
6.2.8 Annual Marine Cargo Tonnage
The US Army Corps of Engineers collects data for ports in the United States, including
commodity tonnage summaries (total tons, domestic, foreign, imports and exports).
According to the Army Corps, the Port of Providence moved 8,069,532 tons in 2014. As
a result, a reasonable baseline would be eight million tons per year.
6.2.9 Annual Air Cargo Tonnage
TF Green Airport provides air cargo services for Rhode Island businesses. A historical
description of tonnage shipped into and out of the airport is provided earlier in this plan.
In 2015, TF Green moved 27,040,498 pounds (more than 13,520.25 tons),98 In FY2014, the
airport moved 27,334,069 pounds (13,667 pounds). A reasonable baseline metric to
reflect activity and performance at the airport, from a freight perspective, is 13,500 tons.
97 https://www.aar.org/data-center/railroads-states#state/RI 98 http://www.pvdairport.com/documents/passenger-numbers/2015/dec2015passenger.pdf.
126 | P a g e
F R E I G H T F O R W A R D :
S T A T E O F R H O D E I S L A N D F R E I G H T A N D G O O D S M O V E M E N T P L A N
7 FREIGHT FORECAST
7.1 Introduction
Rhode Island conducted a commodity flow analysis to determine how freight is
transported into, out of, within, and through the state; identify the key commodities
being moved; and forecast future freight movements. The analysis provided information
important to future transportation investments and freight transportation decision making
generally.
7.2 Highway Freight Forecast
Truck transport provides surface transportation connectivity important to serving short,
regional, and long-haul markets. It also provides intermodal connectivity allowing
international, national, and regional supply chains to operate efficiently. In many
instances, truck transport provides the “first” or “final” mile, when another mode is the
principal means of transport. The net effect is that almost all commodities eventually
move via truck, at least for part of the trip, between points of production and
consumption.
Truck transport is the mode of choice for local and regional goods movement essential
to warehousing and distribution and daily just-in-time deliveries. It also is cost-effective
for moving heavier, low value commodities, such as sand and gravel, within a region.
However, longer truck transport serving national markets tend to move more
specialized consumer commodities and/or higher value goods, such as chemicals,
apparel, automobiles, and parts. Goods transported into, out of and through Rhode
Island are no exception. Rhode Island is served by a network of interstates - I-95, I-295,
and I-195. I-95 is the principal arterial serving Rhode Island’s through, inbound and
outbound truck traffic. A number of principal arterials, (for example, Routes 1, 4, 6, 10,
24, 33, 114, 117, 138, and 146) provide additional access. They also provide important
connectivity to neighboring states and local centers of economic activity.
7.2.1 Freight Flow Direction
According to the analysis conducted for the freight plan, inbound, outbound and
through truck traffic each make up about 30 percent of truck traffic by tonnage. Local
traffic is smaller due to Rhode Island’s small geographic size. Projections call for
outbound tonnage to grow at just 0.2 percent CAGR from 2013 through 2030, with
through traffic at 2.1 percent and inbound traffic at 2.7 percent.
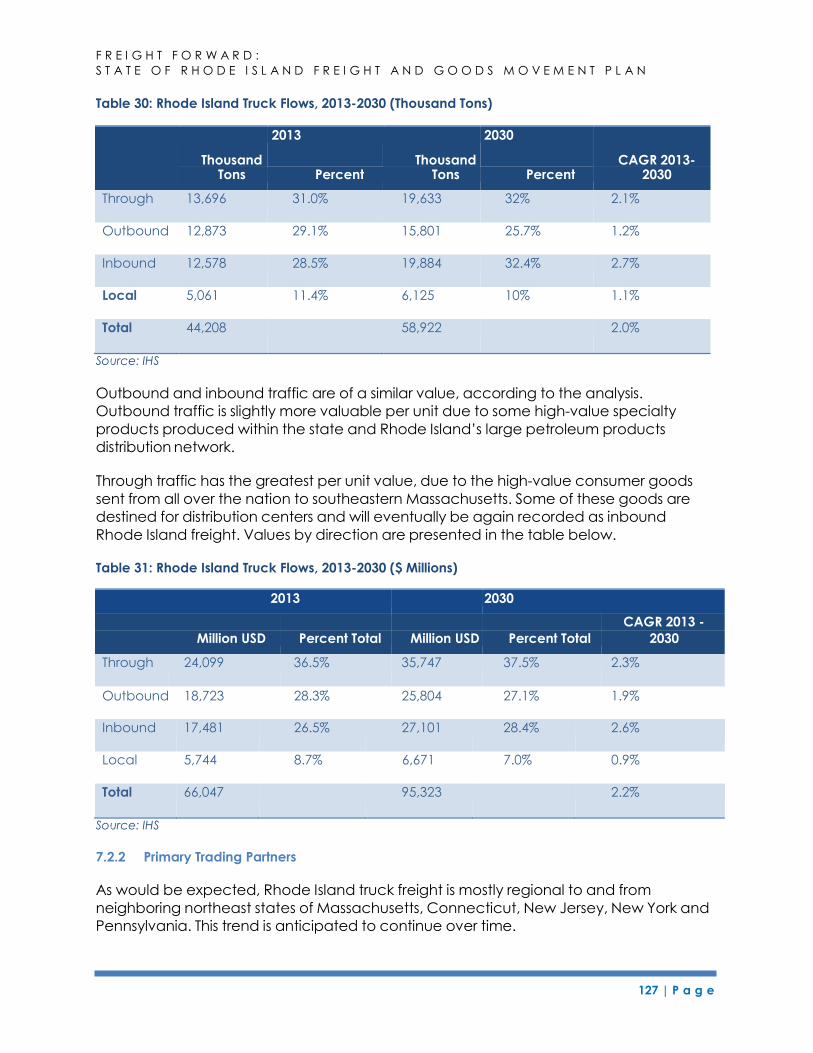
127 | P a g e
F R E I G H T F O R W A R D :
S T A T E O F R H O D E I S L A N D F R E I G H T A N D G O O D S M O V E M E N T P L A N
Table 30: Rhode Island Truck Flows, 2013-2030 (Thousand Tons)
Thousand
2013 Thousand
2030 CAGR 2013-
Tons Percent Tons Percent 2030
Through 13,696 31.0% 19,633 32% 2.1%
Outbound 12,873 29.1% 15,801 25.7% 1.2%
Inbound 12,578 28.5% 19,884 32.4% 2.7%
Local 5,061 11.4% 6,125 10% 1.1%
Total 44,208 58,922 2.0%
Source: IHS
Outbound and inbound traffic are of a similar value, according to the analysis.
Outbound traffic is slightly more valuable per unit due to some high-value specialty
products produced within the state and Rhode Island’s large petroleum products
distribution network.
Through traffic has the greatest per unit value, due to the high-value consumer goods
sent from all over the nation to southeastern Massachusetts. Some of these goods are
destined for distribution centers and will eventually be again recorded as inbound
Rhode Island freight. Values by direction are presented in the table below.
Table 31: Rhode Island Truck Flows, 2013-2030 ($ Millions)
Outbound 18,723 28.3% 25,804 27.1% 1.9%
Inbound 17,481 26.5% 27,101 28.4% 2.6%
Local 5,744 8.7% 6,671 7.0% 0.9%
Total 66,047 95,323 2.2%
Source: IHS
7.2.2 Primary Trading Partners
As would be expected, Rhode Island truck freight is mostly regional to and from
neighboring northeast states of Massachusetts, Connecticut, New Jersey, New York and
Pennsylvania. This trend is anticipated to continue over time.
2013 2030
CAGR 2013 -
Million USD Percent Total Million USD Percent Total 2030
Through 24,099 36.5% 35,747 37.5% 2.3%
128 | P a g e
F R E I G H T F O R W A R D :
S T A T E O F R H O D E I S L A N D F R E I G H T A N D G O O D S M O V E M E N T P L A N
Inbound freight is far more diverse geographically than outbound freight. Inbound
freight traffic originates across the nation, with farther journeys likely containing higher
value goods. Many of the routes from the West Coast are all-truck moves containing
high-value imports. High-value industrial products from Alabama and Louisiana are
moved by truck, and from other locations scattered across the South and Midwest.
Florida ships fruit and various consumers goods, of which some are imports, to Rhode
Island. Consumer goods include motor vehicles, clothing and electronics.
Not surprisingly, the greatest source of inbound trucking volume is from Massachusetts,
and outbound truck traffic is primarily destined for nearby states in the Northeast region.
The distribution of origins and destinations for through traffic covers the entire nation but
southeastern Massachusetts was either the origin or destination for all major pairs; New
York, New Jersey and Pennsylvania also contributed significantly.
7.2.3 Freight Trends
In terms of the types of commodities that are transported by truck, the distribution of
general consumer goods will continue to be an important source of through and
inbound freight for Rhode Island. Both traffic types are primarily determined by
consumer demand within the state, and consumer demand in southeastern
Massachusetts to a lesser extent.
Rhode Island distributes motor vehicles throughout New England and Mid-Atlantic
states, and this trend will continue to be important for outbound freight tonnage, but
less important for the overall value of shipments. This is due to the projected rapid gains
in the value and diversification of outbound freight, relative to tonnage, in 2030.
The petroleum distribution network of Rhode Island serves southeastern Massachusetts,
Rhode Island and western Connecticut. Western Massachusetts is expected to continue
to be served by pipeline, though oil is likely to arrive to the port terminals in the
Providence River for the foreseeable future. Trucks transport oil for the “final mile,” but
this traffic will be determined by overall demand in the service region. Nationwide trends
point toward less petroleum products imports due to increased domestic production
and this trend will modestly reduce truck volumes for petroleum products in Rhode
Island.
The production, consumption and distribution of construction materials will continue to
be the greatest source of trucking tonnage for Rhode Island, even through 2030.
Currently, the state produces large quantities of broken stone and riprap, sand and
gravel, but the state also distributes the production of neighboring states. The most
important flows by tonnage are sand and gravel from Connecticut and broken stone
and riprap from Massachusetts. These construction-related commodities are sent by
truck throughout New England and the Mid-Atlantic.
Specialty products like semiconductors, primary metal products and pharmaceuticals
will take an increasing share of truck volumes by value for Rhode Island. These
commodities will grow faster than overall value growth, along with lesser specialty
commodities like jewelry, fresh fish and ships and boats. The nationwide trend of
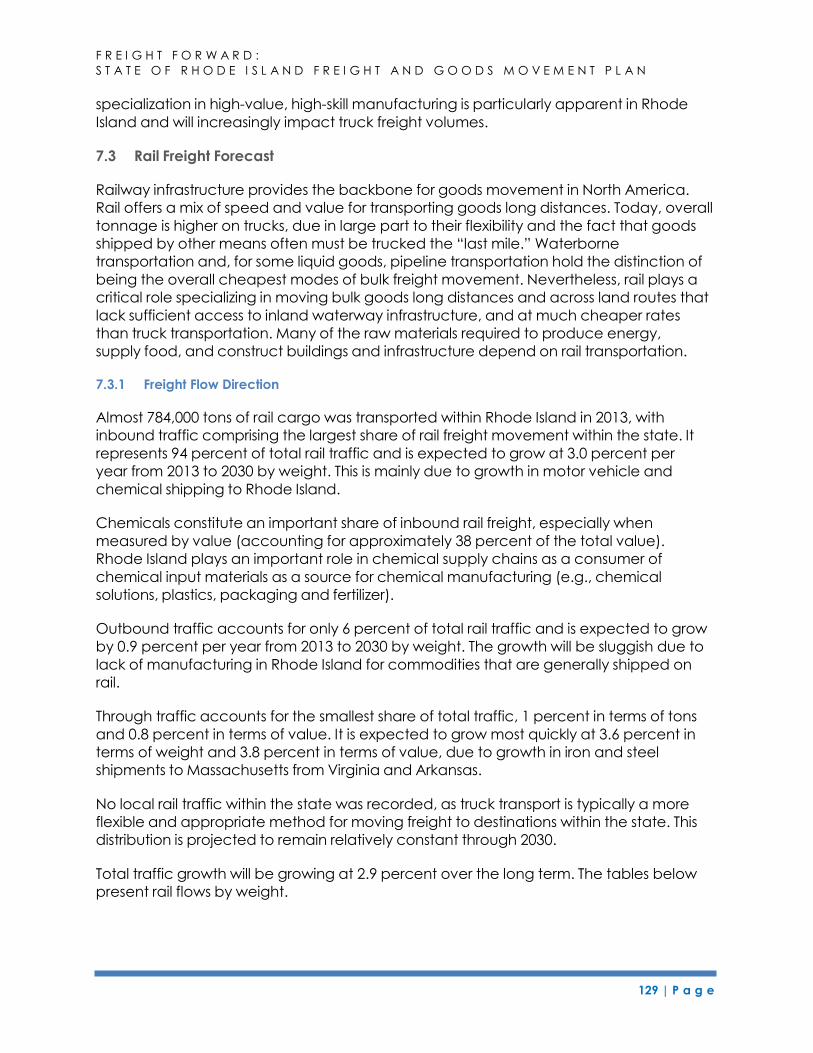
129 | P a g e
F R E I G H T F O R W A R D :
S T A T E O F R H O D E I S L A N D F R E I G H T A N D G O O D S M O V E M E N T P L A N
specialization in high-value, high-skill manufacturing is particularly apparent in Rhode
Island and will increasingly impact truck freight volumes.
7.3 Rail Freight Forecast
Railway infrastructure provides the backbone for goods movement in North America.
Rail offers a mix of speed and value for transporting goods long distances. Today, overall
tonnage is higher on trucks, due in large part to their flexibility and the fact that goods
shipped by other means often must be trucked the “last mile.” Waterborne
transportation and, for some liquid goods, pipeline transportation hold the distinction of
being the overall cheapest modes of bulk freight movement. Nevertheless, rail plays a
critical role specializing in moving bulk goods long distances and across land routes that
lack sufficient access to inland waterway infrastructure, and at much cheaper rates
than truck transportation. Many of the raw materials required to produce energy,
supply food, and construct buildings and infrastructure depend on rail transportation.
7.3.1 Freight Flow Direction
Almost 784,000 tons of rail cargo was transported within Rhode Island in 2013, with
inbound traffic comprising the largest share of rail freight movement within the state. It
represents 94 percent of total rail traffic and is expected to grow at 3.0 percent per
year from 2013 to 2030 by weight. This is mainly due to growth in motor vehicle and
chemical shipping to Rhode Island.
Chemicals constitute an important share of inbound rail freight, especially when
measured by value (accounting for approximately 38 percent of the total value).
Rhode Island plays an important role in chemical supply chains as a consumer of
chemical input materials as a source for chemical manufacturing (e.g., chemical
solutions, plastics, packaging and fertilizer).
Outbound traffic accounts for only 6 percent of total rail traffic and is expected to grow
by 0.9 percent per year from 2013 to 2030 by weight. The growth will be sluggish due to
lack of manufacturing in Rhode Island for commodities that are generally shipped on
rail.
Through traffic accounts for the smallest share of total traffic, 1 percent in terms of tons
and 0.8 percent in terms of value. It is expected to grow most quickly at 3.6 percent in
terms of weight and 3.8 percent in terms of value, due to growth in iron and steel
shipments to Massachusetts from Virginia and Arkansas.
No local rail traffic within the state was recorded, as truck transport is typically a more
flexible and appropriate method for moving freight to destinations within the state. This
distribution is projected to remain relatively constant through 2030.
Total traffic growth will be growing at 2.9 percent over the long term. The tables below
present rail flows by weight.
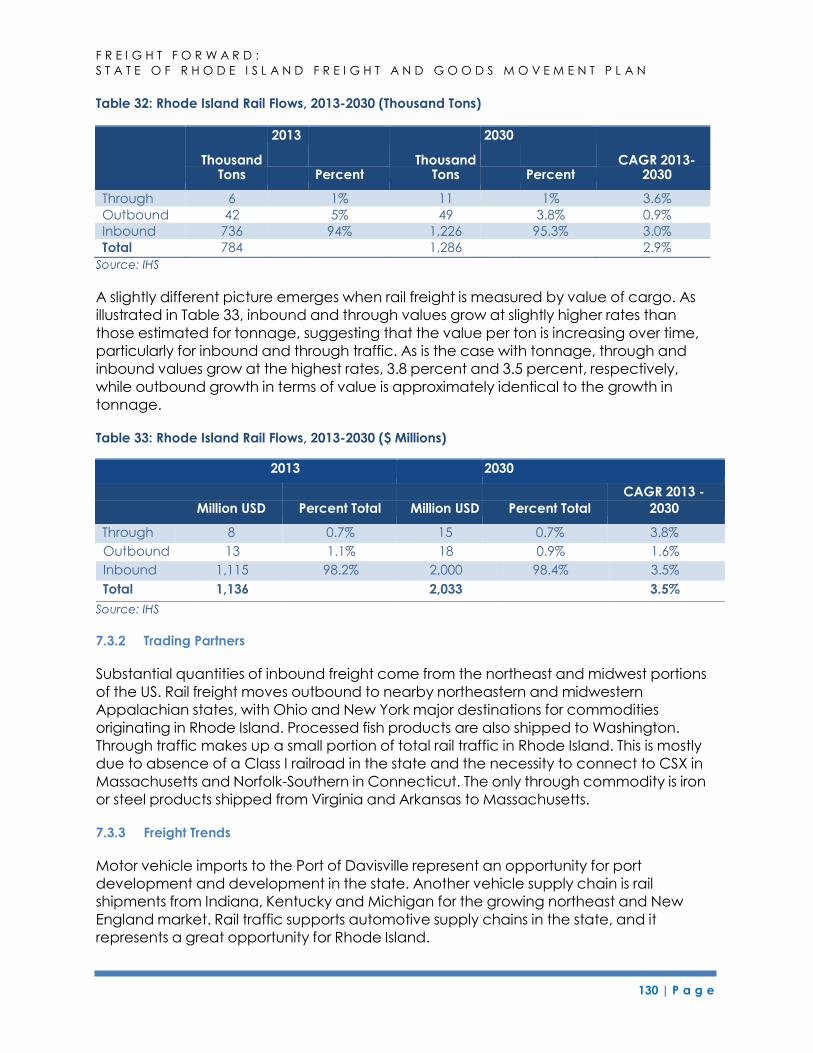
130 | P a g e
F R E I G H T F O R W A R D :
S T A T E O F R H O D E I S L A N D F R E I G H T A N D G O O D S M O V E M E N T P L A N
Table 32: Rhode Island Rail Flows, 2013-2030 (Thousand Tons)
Thousand
2013 Thousand
2030 CAGR 2013-
Tons Percent Tons Percent 2030
Through 6 1% 11 1% 3.6%
Outbound 42 5% 49 3.8% 0.9%
Inbound 736 94% 1,226 95.3% 3.0%
Total 784 1,286 2.9%
Source: IHS
A slightly different picture emerges when rail freight is measured by value of cargo. As
illustrated in Table 33, inbound and through values grow at slightly higher rates than
those estimated for tonnage, suggesting that the value per ton is increasing over time,
particularly for inbound and through traffic. As is the case with tonnage, through and
inbound values grow at the highest rates, 3.8 percent and 3.5 percent, respectively,
while outbound growth in terms of value is approximately identical to the growth in
tonnage.
Table 33: Rhode Island Rail Flows, 2013-2030 ($ Millions)
2013 2030
CAGR 2013 -
Million USD Percent Total Million USD Percent Total 2030
Through 8 0.7% 15 0.7% 3.8%
Source: IHS
7.3.2 Trading Partners
Substantial quantities of inbound freight come from the northeast and midwest portions
of the US. Rail freight moves outbound to nearby northeastern and midwestern
Appalachian states, with Ohio and New York major destinations for commodities
originating in Rhode Island. Processed fish products are also shipped to Washington.
Through traffic makes up a small portion of total rail traffic in Rhode Island. This is mostly
due to absence of a Class I railroad in the state and the necessity to connect to CSX in
Massachusetts and Norfolk-Southern in Connecticut. The only through commodity is iron
or steel products shipped from Virginia and Arkansas to Massachusetts.
7.3.3 Freight Trends
Motor vehicle imports to the Port of Davisville represent an opportunity for port
development and development in the state. Another vehicle supply chain is rail
shipments from Indiana, Kentucky and Michigan for the growing northeast and New
England market. Rail traffic supports automotive supply chains in the state, and it
represents a great opportunity for Rhode Island.
Outbound 13 1.1% 18 0.9% 1.6%
Inbound 1,115 98.2% 2,000 98.4% 3.5%
Total 1,136 2,033 3.5%
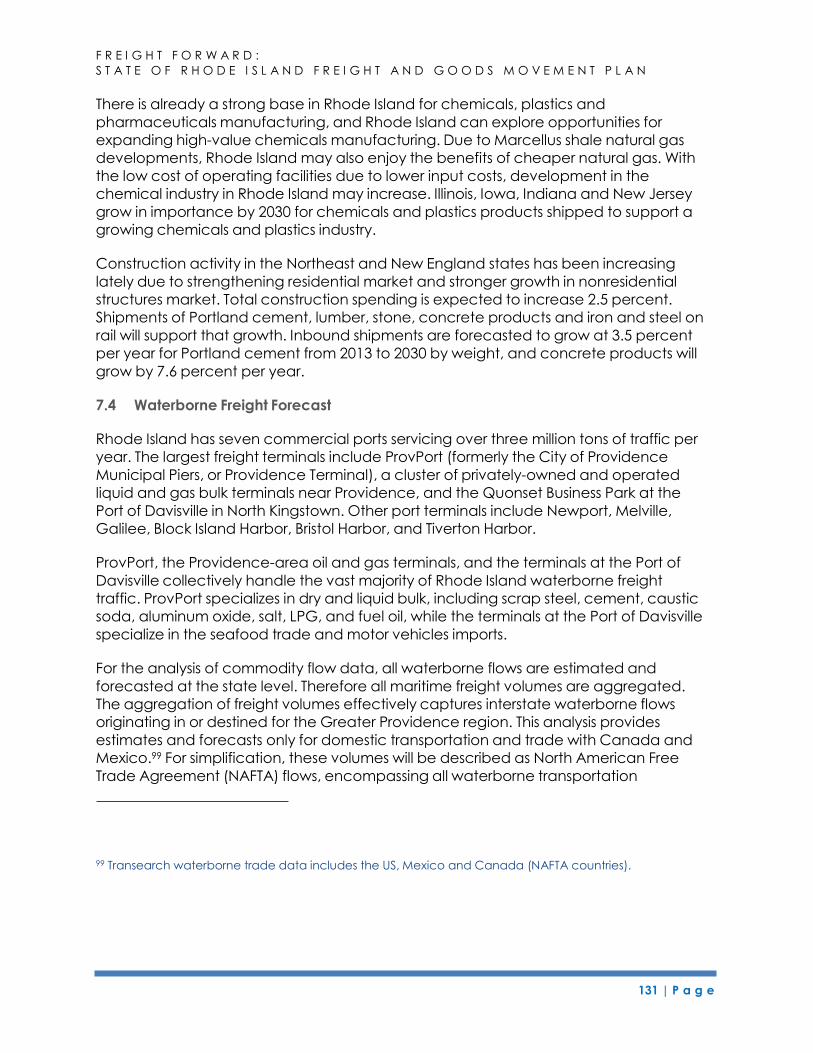
131 | P a g e
F R E I G H T F O R W A R D :
S T A T E O F R H O D E I S L A N D F R E I G H T A N D G O O D S M O V E M E N T P L A N
There is already a strong base in Rhode Island for chemicals, plastics and
pharmaceuticals manufacturing, and Rhode Island can explore opportunities for
expanding high-value chemicals manufacturing. Due to Marcellus shale natural gas
developments, Rhode Island may also enjoy the benefits of cheaper natural gas. With
the low cost of operating facilities due to lower input costs, development in the
chemical industry in Rhode Island may increase. Illinois, Iowa, Indiana and New Jersey
grow in importance by 2030 for chemicals and plastics products shipped to support a
growing chemicals and plastics industry.
Construction activity in the Northeast and New England states has been increasing
lately due to strengthening residential market and stronger growth in nonresidential
structures market. Total construction spending is expected to increase 2.5 percent.
Shipments of Portland cement, lumber, stone, concrete products and iron and steel on
rail will support that growth. Inbound shipments are forecasted to grow at 3.5 percent
per year for Portland cement from 2013 to 2030 by weight, and concrete products will
grow by 7.6 percent per year.
7.4 Waterborne Freight Forecast
Rhode Island has seven commercial ports servicing over three million tons of traffic per
year. The largest freight terminals include ProvPort (formerly the City of Providence
Municipal Piers, or Providence Terminal), a cluster of privately-owned and operated
liquid and gas bulk terminals near Providence, and the Quonset Business Park at the
Port of Davisville in North Kingstown. Other port terminals include Newport, Melville,
Galilee, Block Island Harbor, Bristol Harbor, and Tiverton Harbor.
ProvPort, the Providence-area oil and gas terminals, and the terminals at the Port of
Davisville collectively handle the vast majority of Rhode Island waterborne freight
traffic. ProvPort specializes in dry and liquid bulk, including scrap steel, cement, caustic
soda, aluminum oxide, salt, LPG, and fuel oil, while the terminals at the Port of Davisville
specialize in the seafood trade and motor vehicles imports.
For the analysis of commodity flow data, all waterborne flows are estimated and
forecasted at the state level. Therefore all maritime freight volumes are aggregated.
The aggregation of freight volumes effectively captures interstate waterborne flows
originating in or destined for the Greater Providence region. This analysis provides
estimates and forecasts only for domestic transportation and trade with Canada and
Mexico.99 For simplification, these volumes will be described as North American Free
Trade Agreement (NAFTA) flows, encompassing all waterborne transportation
99 Transearch waterborne trade data includes the US, Mexico and Canada (NAFTA countries).
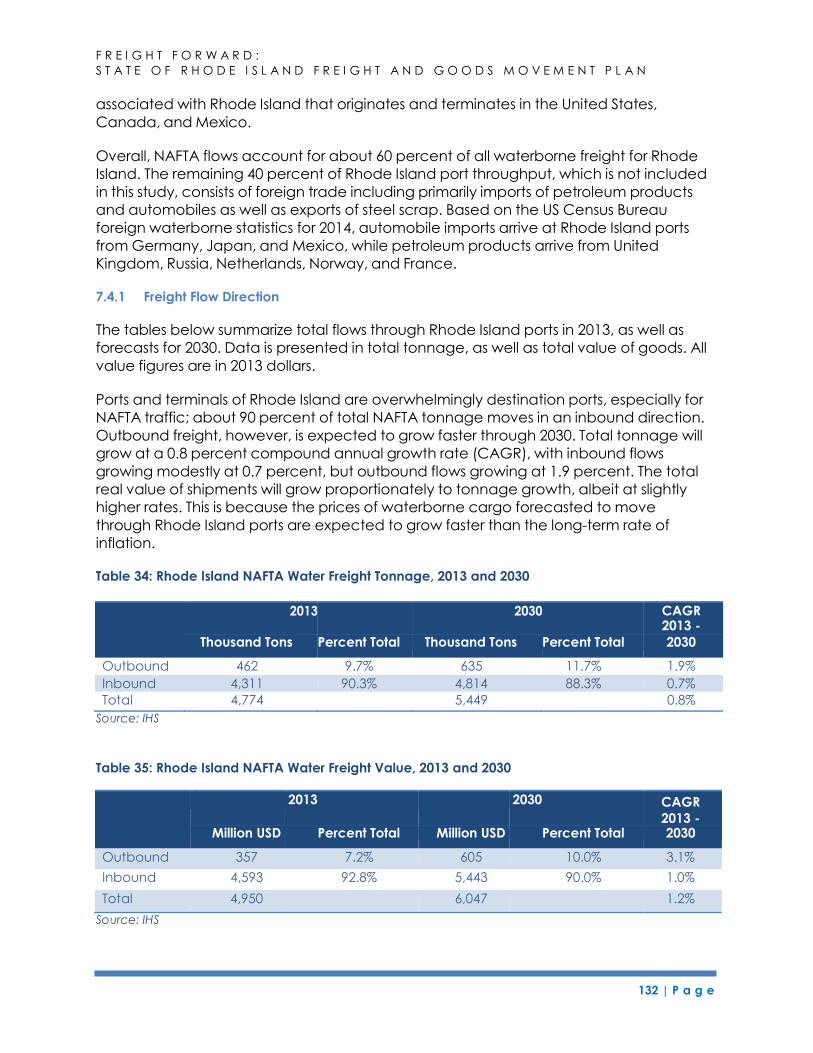
132 | P a g e
F R E I G H T F O R W A R D :
S T A T E O F R H O D E I S L A N D F R E I G H T A N D G O O D S M O V E M E N T P L A N
associated with Rhode Island that originates and terminates in the United States,
Canada, and Mexico.
Overall, NAFTA flows account for about 60 percent of all waterborne freight for Rhode
Island. The remaining 40 percent of Rhode Island port throughput, which is not included
in this study, consists of foreign trade including primarily imports of petroleum products
and automobiles as well as exports of steel scrap. Based on the US Census Bureau
foreign waterborne statistics for 2014, automobile imports arrive at Rhode Island ports
from Germany, Japan, and Mexico, while petroleum products arrive from United
Kingdom, Russia, Netherlands, Norway, and France.
7.4.1 Freight Flow Direction
The tables below summarize total flows through Rhode Island ports in 2013, as well as
forecasts for 2030. Data is presented in total tonnage, as well as total value of goods. All
value figures are in 2013 dollars.
Ports and terminals of Rhode Island are overwhelmingly destination ports, especially for
NAFTA traffic; about 90 percent of total NAFTA tonnage moves in an inbound direction.
Outbound freight, however, is expected to grow faster through 2030. Total tonnage will
grow at a 0.8 percent compound annual growth rate (CAGR), with inbound flows
growing modestly at 0.7 percent, but outbound flows growing at 1.9 percent. The total
real value of shipments will grow proportionately to tonnage growth, albeit at slightly
higher rates. This is because the prices of waterborne cargo forecasted to move
through Rhode Island ports are expected to grow faster than the long-term rate of
inflation.
Table 34: Rhode Island NAFTA Water Freight Tonnage, 2013 and 2030
2013 2030 CAGR
2013 -
Thousand Tons Percent Total Thousand Tons Percent Total 2030
Outbound 462 9.7% 635 11.7% 1.9%
Inbound 4,311 90.3% 4,814 88.3% 0.7%
Total 4,774 5,449 0.8%
Source: IHS
Table 35: Rhode Island NAFTA Water Freight Value, 2013 and 2030
2013 2030 CAGR
2013 - Million USD Percent Total Million USD Percent Total 2030
Outbound 357 7.2% 605 10.0% 3.1%
Inbound 4,593 92.8% 5,443 90.0% 1.0%
Total 4,950 6,047 1.2%
Source: IHS
133 | P a g e
F R E I G H T F O R W A R D :
S T A T E O F R H O D E I S L A N D F R E I G H T A N D G O O D S M O V E M E N T P L A N
7.4.2 Trading Partners
Rhode Island waterborne freight is dominated by inbound flows, of which petroleum
products are by far the largest commodity. The Delaware River region, especially New
Jersey and Delaware, are the most important domestic sources of inbound water
cargo tonnage to Rhode Island. Waterborne cargo originating in New Jersey, New
Brunswick, and Delaware account for more than 80 percent of the inbound total.
In terms of overall outbound traffic within NAFTA, destinations are generally nearby in
Massachusetts and New York, followed by other East Coast locations such as
Connecticut. These destinations tend to be dominated by single commodities, as
described more completely in the Appendix to this freight plan.
7.4.3 Freight Trends
Petroleum products are the most important goods moved by water into Rhode Island.
Petroleum products are received at the Rhode Island petroleum terminals primarily from
the Mid-Atlantic and Eastern Canada, as well as from Europe, the Caribbean, and the
Middle East. Petroleum products are offloaded and stored in Greater Providence,
before being distributed by truck and pipeline in Rhode Island and parts of Connecticut
and Massachusetts.
Motor vehicle imports, which primarily enter Rhode Island via the terminals at the Port of
Davisville, are an important and fast-growing waterborne inbound segment. Vehicles
are sourced from Central Mexico, as well as parts of Europe and Asia. Chemicals
transport, both inbound and outbound, will also contribute strong growth through 2030.
Construction-related inbound waterborne volume growth will vary based on the
commodity, but generally exhibits an upward trend throughout the forecast period.
Outbound shipments of scrap steel to NAFTA destinations are small but growing.
However, exports of steel scrap to non-NAFTA destinations are a major source of
regional throughput.
7.5 Air Freight Forecast
Rhode Island air freight is concentrated at T.F. Green Airport where FedEx and UPS have
cargo operations. High-value, low weight and time-sensitive goods are more likely to
move by air. These are goods with a high weight-to-value ratio or value density.
Although air freight tonnage is relatively small, it is crucial to today’s shipping industry
because of its significant value. In addition, air cargo plays a disproportionately
important role in the regional economy, supporting just-in-time supply chains, critical
business communications (e.g., overnight mail defined here as small packaged freight
shipments and document delivery), and numerous jobs.
The actual destinations and origins of Rhode Island’s air freight are difficult to track,
given the hub and spoke operations of airlines. Those hubs, which receive and
redistribute cargo with Rhode Island origins and destinations, include Memphis, Fort
Wayne, Indianapolis, New York, and Hartford. This traffic constitutes the majority of the
air freight moving to and from Rhode Island, but does not provide insight as to those
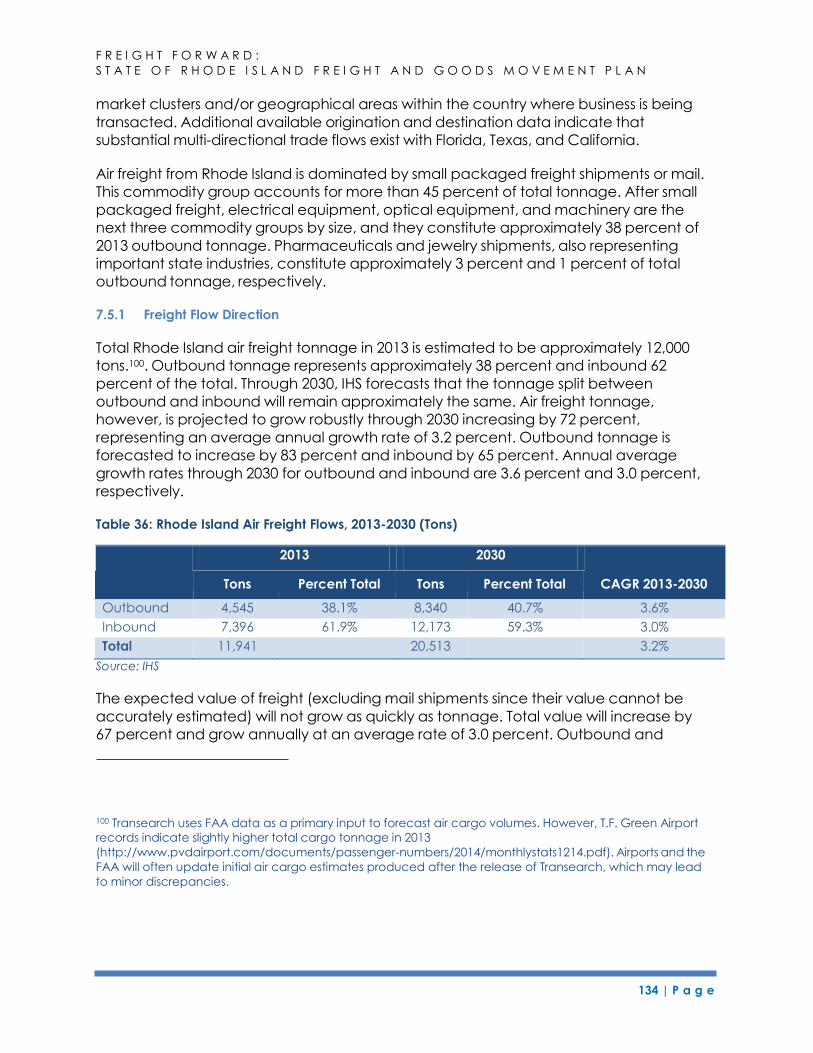
134 | P a g e
F R E I G H T F O R W A R D :
S T A T E O F R H O D E I S L A N D F R E I G H T A N D G O O D S M O V E M E N T P L A N
2013 2030
market clusters and/or geographical areas within the country where business is being
transacted. Additional available origination and destination data indicate that
substantial multi-directional trade flows exist with Florida, Texas, and California.
Air freight from Rhode Island is dominated by small packaged freight shipments or mail.
This commodity group accounts for more than 45 percent of total tonnage. After small
packaged freight, electrical equipment, optical equipment, and machinery are the
next three commodity groups by size, and they constitute approximately 38 percent of
2013 outbound tonnage. Pharmaceuticals and jewelry shipments, also representing
important state industries, constitute approximately 3 percent and 1 percent of total
outbound tonnage, respectively.
7.5.1 Freight Flow Direction
Total Rhode Island air freight tonnage in 2013 is estimated to be approximately 12,000
tons.100. Outbound tonnage represents approximately 38 percent and inbound 62
percent of the total. Through 2030, IHS forecasts that the tonnage split between
outbound and inbound will remain approximately the same. Air freight tonnage,
however, is projected to grow robustly through 2030 increasing by 72 percent,
representing an average annual growth rate of 3.2 percent. Outbound tonnage is
forecasted to increase by 83 percent and inbound by 65 percent. Annual average
growth rates through 2030 for outbound and inbound are 3.6 percent and 3.0 percent,
respectively.
Table 36: Rhode Island Air Freight Flows, 2013-2030 (Tons)
Tons Percent Total Tons Percent Total CAGR 2013-2030
Outbound 4,545 38.1% 8,340 40.7% 3.6%
Inbound 7,396 61.9% 12,173 59.3% 3.0%
Total 11,941 20,513 3.2%
Source: IHS
The expected value of freight (excluding mail shipments since their value cannot be
accurately estimated) will not grow as quickly as tonnage. Total value will increase by
67 percent and grow annually at an average rate of 3.0 percent. Outbound and
100 Transearch uses FAA data as a primary input to forecast air cargo volumes. However, T.F. Green Airport
records indicate slightly higher total cargo tonnage in 2013
(http://www.pvdairport.com/documents/passenger-numbers/2014/monthlystats1214.pdf). Airports and the
FAA will often update initial air cargo estimates produced after the release of Transearch, which may lead
to minor discrepancies.
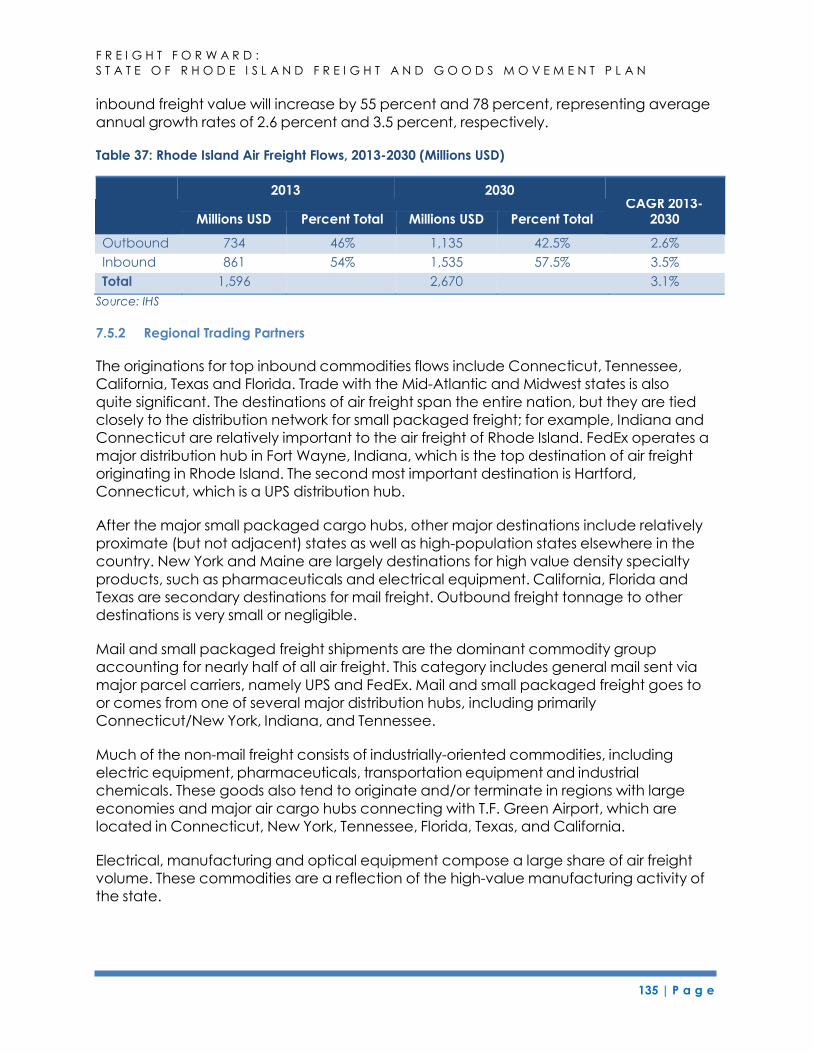
135 | P a g e
F R E I G H T F O R W A R D :
S T A T E O F R H O D E I S L A N D F R E I G H T A N D G O O D S M O V E M E N T P L A N
2013 2030
inbound freight value will increase by 55 percent and 78 percent, representing average
annual growth rates of 2.6 percent and 3.5 percent, respectively.
Table 37: Rhode Island Air Freight Flows, 2013-2030 (Millions USD)
CAGR 2013-
Millions USD Percent Total Millions USD Percent Total 2030
Outbound 734 46% 1,135 42.5% 2.6%
Inbound 861 54% 1,535 57.5% 3.5%
Total 1,596 2,670 3.1%
Source: IHS
7.5.2 Regional Trading Partners
The originations for top inbound commodities flows include Connecticut, Tennessee,
California, Texas and Florida. Trade with the Mid-Atlantic and Midwest states is also
quite significant. The destinations of air freight span the entire nation, but they are tied
closely to the distribution network for small packaged freight; for example, Indiana and
Connecticut are relatively important to the air freight of Rhode Island. FedEx operates a
major distribution hub in Fort Wayne, Indiana, which is the top destination of air freight
originating in Rhode Island. The second most important destination is Hartford,
Connecticut, which is a UPS distribution hub.
After the major small packaged cargo hubs, other major destinations include relatively
proximate (but not adjacent) states as well as high-population states elsewhere in the
country. New York and Maine are largely destinations for high value density specialty
products, such as pharmaceuticals and electrical equipment. California, Florida and
Texas are secondary destinations for mail freight. Outbound freight tonnage to other
destinations is very small or negligible.
Mail and small packaged freight shipments are the dominant commodity group
accounting for nearly half of all air freight. This category includes general mail sent via
major parcel carriers, namely UPS and FedEx. Mail and small packaged freight goes to
or comes from one of several major distribution hubs, including primarily
Connecticut/New York, Indiana, and Tennessee.
Much of the non-mail freight consists of industrially-oriented commodities, including
electric equipment, pharmaceuticals, transportation equipment and industrial
chemicals. These goods also tend to originate and/or terminate in regions with large
economies and major air cargo hubs connecting with T.F. Green Airport, which are
located in Connecticut, New York, Tennessee, Florida, Texas, and California.
Electrical, manufacturing and optical equipment compose a large share of air freight
volume. These commodities are a reflection of the high-value manufacturing activity of
the state.

136 | P a g e
F R E I G H T F O R W A R D :
S T A T E O F R H O D E I S L A N D F R E I G H T A N D G O O D S M O V E M E N T P L A N
7.5.3 Freight Trends
Total outbound tonnage through 2030 is anticipated to grow at an average annual
growth rate of 3.5 percent. Transportation equipment shipments are forecasted to grow
at an average annual rate of 6.6 percent, the highest of all the high value commodity
groups, followed by photo and optical equipment growing at about five percent, and
machinery at just under four percent. The only commodity group forecasted to decline
is jewelry, decreasing at an average annual rate of approximately four percent.
137 | P a g e
F R E I G H T F O R W A R D :
S T A T E O F R H O D E I S L A N D F R E I G H T A N D G O O D S M O V E M E N T P L A N
8 INDUSTRY TRENDS, LOCAL STRENGTHS & NEEDS
Rhode Island’s freight system comprises many different supply chains that are often
unique to local businesses. However, these local businesses are also affected by
national trends and systematic changes in the freight industry.
Both national and local supply chains are always evolving by responding to market and
customer needs; reducing costs and being ever more efficient; and addressing
competition and exploiting technologies. It is critical that freight planning efforts in
Rhode Island continually monitor and assess these trends, in order to maintain national
and local supply chains to support businesses and the residents that rely upon the goods
and services that freight movement brings.
This chapter identifies national trends, discusses how well Rhode Island’s freight network
is positioned to take advantage of various trends and opportunities, and the issues and
needs that must be overcome to do so.
8.1 National Trends
Industry trends which are likely to be relevant to Rhode Island’s freight system are
described below.
8.1.1 Population Growth and Freight Movement
As population growth and commercial activity increase over time, it is expected that
freight demand will also grow. This will lead to more trucks, trains and air cargo
movements to, from and within Rhode Island. However, changes in certain markets and
the introduction of new technologies may lead to a reduction in freight movements in
certain sectors (e.g. more efficient engines and boilers requiring less fuel, and
continued shifts from home heating oil to natural gas could reduce demand for fuel
transportation).
8.1.2 Labor Driver Shortage
Labor driver shortages within particular sectors such as long haul trucking are likely to
increase cost and reduce reliability. Trucking companies are responding by improving
driver conditions such as reducing the time a driver spends away from home to attract
more workers, but ongoing growth in trucking will continue to make this a challenge.
8.1.3 E-Commerce
The growth of home shopping and e- commerce is changing freight movements,
particularly at the regional and local levels. For example, the volume of web-based
retail has resulted in increased small package delivery trucks in residential areas. Also,
large e-commerce companies such as Amazon are transitioning to a regional model
which is increasing the number of warehouses serving regional markets, such as the one
being constructed in Fall River, Massachusetts.
138 | P a g e
F R E I G H T F O R W A R D :
S T A T E O F R H O D E I S L A N D F R E I G H T A N D G O O D S M O V E M E N T P L A N
8.1.4 Autonomous Vehicles
Autonomous truck technology is a solution that the trucking industry is investigating as a
way to increase fuel efficiency and vehicle utilization, while improving safety and driver
conditions. While this technology is still at an early stage and years of development are
needed before commercial applications become viable. Regulatory requirements are
also expected to have to adopt to oversee implementation of this new technology.
Large e-commerce companies and regional small package delivery companies are
also investigating the potential use of drone technology to replace truck deliveries, a
change that could impact the local small package delivery market. As with
autonomous trucks, this technology is still at an early stage and regulatory requirements
will evolve over the next few years.
8.1.5 Regional Distribution Strategies
More companies are adopting regionalization strategies to address congestion, travel
time, and reliability. Regionalization can also help reduce transportation costs and
address the lack of drivers in the long distance truck market.
Companies adopt a regional distribution strategy to get their distribution and logistics
centers as close as possible to their customer or consumer base. One objective is to
reduce transportation cost in their supply chain, but also ensure they are able to meet
customer needs such as consistent on time deliveries which can be influenced by
congestion and unreliable travel times. Other factors include reducing the reliance on
long distance truck drivers in an industry that is experiencing a driver shortage.
Greencore, a producer of convenience foods and the largest worldwide producer of
sandwiches recently moved its production facility to Quonset so that it can serve both
the Boston and New York City metropolitan markets from one location.
8.1.6 Complete Streets and Sustainable People Movement
National and local transportation agencies, including the Rhode Island Department of
Transportation, have adopted Compete Streets policy initiatives. Combined with local
transit initiatives, urban arterials are being revitalized to encompass dedicated bus lanes,
streetcars, bicycle lanes, and pedestrian elements, but planners need to consider freight
movement in these projects (e.g. curbside management for local deliveries and
access to freight generating locations).
8.1.7 Increased Rail Movement
Challenges with the highway system such as congestion, poor trip time reliability, and
increased labor costs are influencing more shippers to consider the use of rail as a
transportation mode within their supply chains. Lower fuel costs over the last few years
has limited any significant shifts away from the trucking sector, but shifts to rail
transportation may occur as fuel prices increase in the future.
139 | P a g e
F R E I G H T F O R W A R D :
S T A T E O F R H O D E I S L A N D F R E I G H T A N D G O O D S M O V E M E N T P L A N
8.1.8 Clean Energy and Alternative Fuels
Increased environmental awareness and the need to reduce Green House Gases and
other pollutants from organization’s supply chains and transportation activities are
directing freight operators to investigate the use of cleaner energy and alternative fuels
such as Compressed Natural Gas (CNG), Liquid Natural Gas (LNG,) and electricity. A
key issue associated with the adoption of alternative fuels is the availability of the
alternative fuels and fueling infrastructure. Large fleets, with operating cycles that bring
the truck back to a home facility at the end of the working day may justify the
investment in fuel infrastructure. Trucks passing through a region or a small fleet owner
are likely to have to rely on publically available fueling infrastructure.
8.1.9 International & Domestic Shipping Lanes
The United States is committed to further development of the Marine Highway System,
an extension of the overland road and railway intermodal network. This system can
provide relief where road and railway congestion slows cargo movement. There are a
number of successful services in the Alaska-Washington/Oregon trade, Florida-Puerto
Rico trade, and in the Gulf of Mexico. Several New York-New England services have
come and gone, mostly in the form of container feeder services.
Internationally, there are two key projects in Central America poised to have a major
impact on worldwide shipping routes. The first is the expansion of the Panama Canal
completed and operational in June 2016. It is anticipated that it will take at least a
decade before major shifts in trade will occur because of the expansion. The second
potential impact is the construction of a new canal across Nicaragua, which was
approved by the National Assembly of Nicaragua. Preliminary construction began in
December of 2014, and it was expected to be completed in 2019. Local population
issues, however, as well as funding, have delayed the project indefinitely.
8.2 Strengths and Opportunities for Rhode Island’s Freight Network
Rhode Island has a number of critical freight assets and unique strengths that provide
opportunities for continued growth in the future movement of freight into, through and
out of our state. The state’s location between the large metro areas of New York and
Boston and on Narragansett Bay, provides a strategic location for distribution facilities
serving these markets.
As described in Chapter 7, Rhode Island freight shipments are anticipated to grow over
the next 15 years. Trucks will continue to be the dominant freight mode in Rhode Island.
Both rail and marine shipments are projected to grow, but at a smaller rate and with
both modes heavily oriented toward inbound shipments. Finally, air cargo traffic into
and out of Rhode Island will continue to carry the smallest modal share, but will see
significant growth by 2030.
Key freight assets by mode and other local strengths and opportunities are summarized
below.
140 | P a g e
F R E I G H T F O R W A R D :
S T A T E O F R H O D E I S L A N D F R E I G H T A N D G O O D S M O V E M E N T P L A N
8.2.1 Highways
Three interstates and a number of supporting state highways provide excellent highway
access throughout our small state. Recent passage of the RhodeWorks program has
now provided a long term sustainable funding stream to perform much needed road
and bridge maintenance on this network.
A number of recent and planned investments have added highway capacity and
addressed regional bottlenecks; for example, the opening of Route 403, the
reconstruction of I-195 and Providence Viaduct, and planned reconstruction of Routes
6/10.
Freight forecasts suggest Rhode Island will continue to be a focal point for regional
distribution of imported autos and fuel offloaded at our ports, as well as construction
materials. Additionally, there are more than 32.4 million people living within a four-hour
drive, and local distribution of consumer goods will continue to be primarily via truck for
the foreseeable future.
8.2.2 Railways
Rhode Island has access to national and Canadian rail markets via Class 1 connections
in Worcester, Massachusetts. The existing Rhode Island rail network will be fully able to
accommodate 286-ton rail cars by the end of 2016, and sections of the Main Line can
accommodate double-stacked rail cars. Additionally, our freight rail lines provide direct
connections to the Port of Providence.
With current rail flows focused on inbound shipments, there is capacity to reload empty
returning rail cars, should the market support this activity.
Another opportunity for improving the rail system in Rhode Island may be the
elimination of vertical clearance restrictions in and around the Port of Davisville. Today,
the clearances are adequate for the operations that are occurring on the line. It is
possible, however, that resolving the vertical clearance issues would benefit the state
and provide an opportunity to increase rail traffic. This could generate public benefits
associated with congestion reduction, emissions reduction, and shipper cost savings. A
study of the potential impacts of such an improvement is recommended as part of this
freight plan. This study would consider the benefits that may be generated by the
investment, as well as update any cost estimates previously developed to resolve the
issue.
8.2.3 Marine and Inland Ports
8.2.3.1 Marine Ports
The Port of Providence is one of only 2 deep water ports in New England. Major
terminals are located almost directly off I-95, the primary interstate serving New York
and Boston.
141 | P a g e
F R E I G H T F O R W A R D :
S T A T E O F R H O D E I S L A N D F R E I G H T A N D G O O D S M O V E M E N T P L A N
Local terminals have developed to serve unique commodities markets, including fuel
and bulk materials in Providence and East Providence, auto imports in Davisville and
seafood at the Port of Galilee. Davisville benefits from the lack of a harbor
maintenance tax and an uncongested portside-landside interface.
Recent investments made in local ports include new cranes at both ProvPort and
Davisville, as well as Route 403 highway access to Davisville. Governor Raimondo’s
budget also is supporting upgrades to Pier 2 at Port of Davisville, and ProvPort is
currently completing a nine-acre expansion project.
8.2.3.2 Potential Inland Port
Based on data review, approximately 4,000 TEU’s are exported from Rhode Island and
approximately 10,000 – 12,000 TEUs are imported. This imbalance, and the challenges of
matching a returning empty import container with an export load to a port, results in a
mismatch between trucks coming in full and leaving empty or vice versa. Quonset
Development Corporation has land available to accommodate an inland port, and it
also has good roadway access.
An inland port is a site located away from traditional land, air and coastal borders with
the ability to process international trade through its multi-modal transportation assets
and by promoting value added services as goods move through the supply chain.
Quonset is located nearby potential customers, including Ocean State Job Lot,
Seafreeze, Toray, as well as others such as the Rhode Island Resources Recovery
Corporation (RIRRC). RIRRC, for example, is one of the largest exporters in the state,
moving various types of recyclables.
There may be an opportunity to integrate truck heavy haul routes with multi modal
routes to Port of New York and New Jersey and other facilities regionally. Formation of
an inland port at the Quonset Business Park would potentially benefit the state and also
PANYNJ, which is interested in maximizing inland ports to help facilitate their growth.
QDC maintains an interest in Marine Highway services when the market and economics
support it.
8.2.4 Airports and Air Freight
Rhode Island’s largest airport, T.F. Green Airport, is located in the center of the state,
close to high-density urban markets and the interstate highway network. RIAC has
recently initiated a major runway expansion project, which will provide increased
capacity for larger planes. Recent land acquisition and ongoing master planning
provide the opportunity to consider potential expansion of air cargo handling
capabilities.
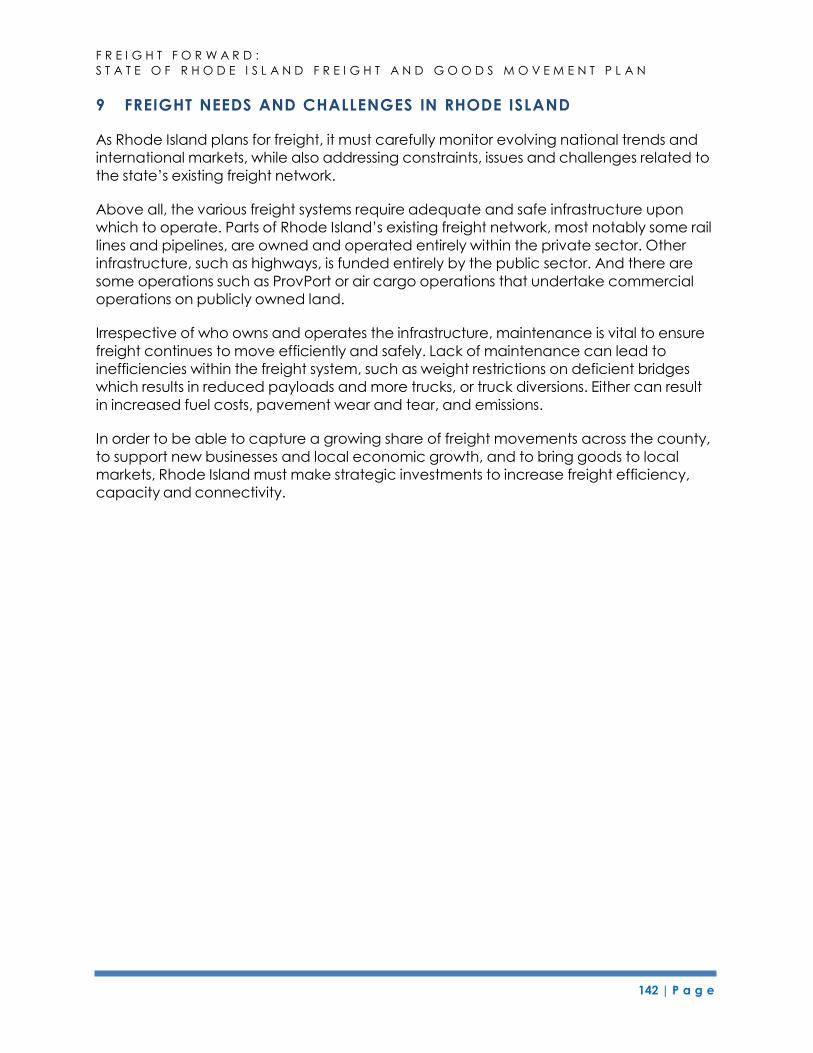
142 | P a g e
F R E I G H T F O R W A R D :
S T A T E O F R H O D E I S L A N D F R E I G H T A N D G O O D S M O V E M E N T P L A N
9 FREIGHT NEEDS AND CHALLENGES IN RHODE ISLAND
As Rhode Island plans for freight, it must carefully monitor evolving national trends and
international markets, while also addressing constraints, issues and challenges related to
the state’s existing freight network.
Above all, the various freight systems require adequate and safe infrastructure upon
which to operate. Parts of Rhode Island’s existing freight network, most notably some rail
lines and pipelines, are owned and operated entirely within the private sector. Other
infrastructure, such as highways, is funded entirely by the public sector. And there are
some operations such as ProvPort or air cargo operations that undertake commercial
operations on publicly owned land.
Irrespective of who owns and operates the infrastructure, maintenance is vital to ensure
freight continues to move efficiently and safely. Lack of maintenance can lead to
inefficiencies within the freight system, such as weight restrictions on deficient bridges
which results in reduced payloads and more trucks, or truck diversions. Either can result
in increased fuel costs, pavement wear and tear, and emissions.
In order to be able to capture a growing share of freight movements across the county,
to support new businesses and local economic growth, and to bring goods to local
markets, Rhode Island must make strategic investments to increase freight efficiency,
capacity and connectivity.
143 | P a g e
F R E I G H T F O R W A R D :
S T A T E O F R H O D E I S L A N D F R E I G H T A N D G O O D S M O V E M E N T P L A N
Table 38: RI Freight Needs and Challenges
Rhode Island Freight Goal Needs & Challenges to be Addressed
Operational Efficiency - One out of every five bridges has been rated
structurally deficient; many have weight restrictions
- TIP mandates that the Pavement Structural Health Index will be maintained at an average of 80% over the next ten years
- Davisville pier modernization required
- Bottlenecks and congestion points on I-95, I-195, I-295 and 6/10
- Rail bottlenecks at grade crossings and on single track
sections
- Congestion in and around multi-modal port terminals in
urban areas
- Geometric improvements and new policies needed to
accommodate larger trucks
- Hazardous material restrictions on rail freight movements at Providence station
- Vertical rail clearance issues along NEC
- Need for safety improvements (truck parking, etc.)
- Lack of maintenance for non-highway modes (e.g. harbor dredging)
Economic Growth &
Competiveness
- Increasing local truck traffic due to E-commerce, with warehousing and land needed to support regional distribution networks
- Need for upgraded facilities and access improvements to capitalize on opportunity to handle more cargo at Davisville and T.F. Green Airport
- Larger vessels will require dredging to increase depth at
Davisville to 34’
- Increasing passenger rail traffic on the Northeast Corridor will require eventual freight rail capacity upgrades
- Imbalanced freight flows, oriented towards inbound
shipments, create higher shipping costs.
- Effective freight planning needed to adapt policies to
evolving freight markets and technologies
- Must actively monitor trends to find niche markets and compete with other ports in the region
- Lack of dedicated state funding for expansion projects Connectivity - Need for improved local access to accommodate
growth at ports, airports and other terminals
While there is no dedicated state funding for freight projects, the state has recently
passed the RhodeWorks program focusing on bridge and highway maintenance, and
has made critical investments in freight rail through the 2006 Freight Rail Improvement
Program (FRIP) project, and through ongoing investments at the Port of Davisville.

144 | P a g e
F R E I G H T F O R W A R D :
S T A T E O F R H O D E I S L A N D F R E I G H T A N D G O O D S M O V E M E N T P L A N
9.1 Addressing Local Freight Needs and Issues
Rhode Island’s approach to addressing the needs and issues is outlined in Chapter 11
through the identification and subsequent prioritization of roadway and non-roadway
freight infrastructure projects.
145 | P a g e
F R E I G H T F O R W A R D :
S T A T E O F R H O D E I S L A N D F R E I G H T A N D G O O D S M O V E M E N T P L A N
10 THE STATE’S DECISION MAKING PROCESS
As described earlier in the plan, there is no single designated freight office in Rhode
Island and freight movements and infrastructure are governed and affected by a
variety of laws and entities. Numerous state agencies and quasi-public entities also play
a role in implementing state policy related to freight movement and have an impact
on the network. These entities are summarized in Chapter 5 of this freight plan. When the
state plans for potential transportation improvements, it involves the public in elements
of the planning process. This was the approach utilized for the development of
this freight plan.
10.1 Stakeholder and Public Outreach
The FAC steering committee and larger FAC provided input related to goals and
objectives, freight investment priorities, and potential policy recommendations related
to freight transportation. Monthly meetings were held with the steering committee and
quarterly meetings were held with the full FAC. The monthly steering committee
meetings operated as working groups where data, information, interim findings, and
recommendations were discussed.
In addition, a website was maintained throughout to ensure that the public could
remain informed about freight planning activities in the state. In addition, a series of
stakeholder interviews were held, as well as larger public meetings. Two public meetings
were held on June 15, 2015, at the Quonset Business Park and Cranston Central Library.
The purpose of these meetings was to inform the public on the status and findings of the
freight planning progress and to solicit general input related to the freight transportation
system in Rhode Island.
10.2 Evaluation of Project Proposals
The FAC steering committee helped identify priority projects by transportation mode,
finalize selection criteria for prioritization, and rank projects one-by-one during monthly
meetings. Projects were identified and then evaluated based on their potential to
address the goals and objectives identified in the planning process. The result was a
final list of investments identified for inclusion in the state freight plan.
10.2.1 Approach to Project Prioritization
The first step in the prioritization approach used to identify potential investments in the
freight transportation system was to identify projects, based on the FFY13-16 statewide
TIP, input from freight stakeholders, RIDOT, Statewide Planning, and other sources.
Projects were categorized by mode (e.g., roadway, rail, port, air). Based on the freight
plan’s goals and objectives, criteria were developed to assist in the ranking of projects.
Working with the FAC steering committee, each project was discussed and evaluated
based on the criteria identified as relevant to the prioritization process.
The following presents the roadway criteria that were used in the project evaluation. As
shown in the figure, the criteria are consistent with the freight plan goals of economic
competitiveness, operational efficiency, and connectivity. They also reflect the primary
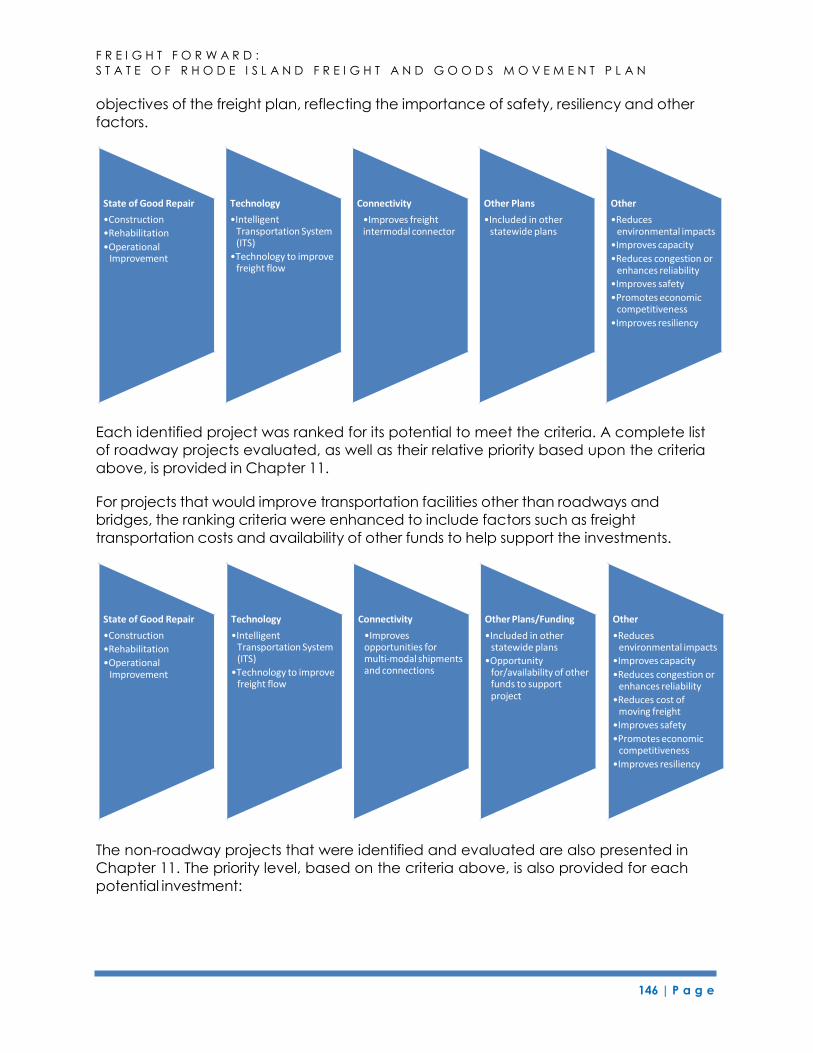
146 | P a g e
F R E I G H T F O R W A R D :
S T A T E O F R H O D E I S L A N D F R E I G H T A N D G O O D S M O V E M E N T P L A N
objectives of the freight plan, reflecting the importance of safety, resiliency and other
factors.
Each identified project was ranked for its potential to meet the criteria. A complete list
of roadway projects evaluated, as well as their relative priority based upon the criteria
above, is provided in Chapter 11.
For projects that would improve transportation facilities other than roadways and
bridges, the ranking criteria were enhanced to include factors such as freight
transportation costs and availability of other funds to help support the investments.
The non-roadway projects that were identified and evaluated are also presented in
Chapter 11. The priority level, based on the criteria above, is also provided for each
potential investment:
State of Good Repair
•Construction
•Rehabilitation
•OperationalImprovement
Technology
•IntelligentTransportation System(ITS)
•Technology to improvefreight flow
Connectivity
•Improves freightintermodal connector
Other Plans
•Included in otherstatewide plans
Other
•Reducesenvironmental impacts
•Improves capacity
•Reduces congestion orenhances reliability
•Improves safety
•Promotes economiccompetitiveness
•Improves resiliency
State of Good Repair
•Construction
•Rehabilitation
•OperationalImprovement
Technology
•IntelligentTransportation System(ITS)
•Technology to improvefreight flow
Connectivity
•Improvesopportunities formulti‐modal shipmentsand connections
Other Plans/Funding
•Included in otherstatewide plans
•Opportunityfor/availability of otherfunds to supportproject
Other
•Reducesenvironmental impacts
•Improves capacity
•Reduces congestion orenhances reliability
•Reduces cost ofmoving freight
•Improves safety
•Promotes economiccompetitiveness
•Improves resiliency
147 | P a g e
F R E I G H T F O R W A R D :
S T A T E O F R H O D E I S L A N D F R E I G H T A N D G O O D S M O V E M E N T P L A N
10.3 Economic Analysis Conducted for Key Projects
An important element of the freight plan is an understanding of what the potential
economic benefits may be for priority projects. Because data for all of the priority
projects were limited, and some projects were in the very early planning stages with no
clear solution defined, only a selection of priority projects were analyzed. To the extent
possible, a cross-section of projects was selected to ensure that at least one project for
each mode of transportation was assessed. Economic analysis was conducted for the
following priority projects and detail related to each analysis is provided in the
Appendix of this freight plan:
Interstate 95 Northbound Viaduct
6/10, Interstate 95 Southbound Connection
Allens Ave, Interstate 95 Southbound Connection
Route 4, Interstate 95 Connection
Davisville Yard Track Improvements
T.F. Green Airport Ramp Expansion
For each priority project analyzed, both an economic impact analysis (EIA) and a
benefit-cost analysis (BCA) were conducted. It should be noted that these
methodologies measure some benefits associated with a potential transportation
investment; for example, short-term jobs associated with construction and
transportation benefits, such as reduced travel time or accident reduction. There are
some benefits, however, that EIA and BCA do not reflect. For example, economic
development that may be generated when T.F. Green is able to expand their cargo
operations are not included. This section contains a general overview of the
methodology used for each type of analysis.
10.3.1 Economic Impact Analysis
Traditionally, economic impact analysis involves the estimation of three types of effects,
commonly referred to as direct effects, indirect effects and induced effects. These are
defined below:
Direct effect: Refers to the economic activity occurring as a result of direct
spending by agencies or business located in the study area (e.g., expenses
related to construction activities for RIDOT and other transportation projects);
Indirect effect: Refers to the economic activity resulting from purchases by local
firms who are suppliers to the directly affected agencies or businesses (e.g.,
spending by suppliers of the contractors responsible for construction activities);
and
Induced effect: Represents the increase/decrease in economic activity, over
and above the direct and indirect effects, associated with increased/decreased
labor income that accrues to workers (of the contractor and all suppliers, in our
example) and is spent on household goods and services purchased from
businesses within the study area.
148 | P a g e
F R E I G H T F O R W A R D :
S T A T E O F R H O D E I S L A N D F R E I G H T A N D G O O D S M O V E M E N T P L A N
The indirect and induced effects are referred to as multiplier effects because they can
make the total economic impact substantially larger than the direct effect alone. In
theory, the larger the multiplier, the larger the overall response (total economic impact)
to the initial expenditure (direct effect). The total economic impact is the sum of these
direct, indirect and induced effects for the project being evaluated.
Typically, economic impacts are measured in terms of employment, industry output,
and value added. The employment impact estimates the number of jobs created for a
full year. Our analysis presents results in terms of job-years, which is defined as one
person employed for one year, whether part-time or full time. Output refers to the total
volume of sales. In comparison, value added refers to the value a company adds to a
product or service. It is measured as the difference between the amount a company
(or State government) spends to acquire it and its value at the time it is sold to other
users. Thus, value added can be thought of as a measure of the contribution to the
gross domestic product (GDP) made by an establishment or an industry. The total value
added within a region is equivalent to the gross regional product and includes
employee compensation, proprietary income, other property type income (e.g., rents)
and indirect business taxes (e.g., excise taxes).
The IMPLAN® system is used in this study for estimating economic impacts. The event
year of the economic impact is determined by the year of construction for each
project, but all impacts are expressed in 2016 US dollars. The system is an input-output
based regional economic assessment modeling system developed and maintained by
MIG, Inc.101 The IMPLAN® system consists of a software package102 and data files that
are updated every year. The IMPLAN data files include transaction information (intra-
regional and import/export) on 440 distinct industrial sectors (corresponding to four- and
five-digit North American Industry Classification System [NAICS] codes) and data on
over 20 economic variables, including employment, output and value added.
10.3.2 Benefit-Cost Analysis
Benefit-cost analysis for transportation projects involve a comprehensive assessment of
impacts across all benefit and cost categories. Costs and benefits are measured using a
“baseline” scenario where the status quo remains and an “alternative” scenario, where
the project is completed, is compared. The difference between the two scenarios
is considered the impact of the project. The benefits are translated to equivalent
monetary levels in order to compare the public benefits of the project to the project’s
life-cycle costs. Several criteria are used by decision-makers to determine
101 For more information on the IMPLAN® system, visit http://www.implan.com/. 102 The newly released IMPLAN Version 3.0 is used for this study.
149 | P a g e
F R E I G H T F O R W A R D :
S T A T E O F R H O D E I S L A N D F R E I G H T A N D G O O D S M O V E M E N T P L A N
whether investment projects are economically reasonable to undertake. The most
widely used of these decision criteria are:
Net Present Value (NPV): The net present value is the discounted present value of
benefits minus the discounted present value of costs. The net present value is
measured over the life-cycle of the project under consideration. A net present
value greater than zero indicates that the investment returns benefits
proportionally in excess of costs.
Benefit-Cost Ratio (BCR): A benefit-cost ratio is the ratio of a project’s discounted
stream of benefits to the project’s discounted stream of costs. A benefit-cost
ratio greater than 1.0 indicates that a project generates more discounted
benefits over the analysis time frame than costs generated in undertaking a
project. A benefit-cost ratio greater than 1.0 is considered economically
worthwhile. In contrast, projects with a benefit-cost ratio less than 1.0 indicate
that the project’s costs exceed its benefits and may not be considered
economically worthwhile.
A dollar today is worth more than a dollar five years from now, even if there is no
inflation. This is because today's dollar can be used productively in the ensuing five
years, yielding a value greater than the initial dollar. Future benefits and costs are
discounted to reflect this reality, and the analyses conducted for the freight plan utilize
the USDOT-recommended discount rate of seven percent. A three percent discount
rate is also used as a sensitivity analysis.
In the BCAs conducted for the freight plan, there are several types of transportation
public benefits measured. Some of the benefits anticipated for the freight plan priority
projects analyzed include:
Travel Time Savings: The most prominent component of travel time costs is the
delay due to high levels of roadway congestion, start-and-stop traffic flows, and
in extreme cases, gridlock. These delays represent an opportunity cost of time –
time that could be spent both at work and for leisure. Travel time includes access
time, waiting time, in-vehicle time, transfer time as well as egress time.
Congestion Cost Savings: In cases where travel time savings cannot be
measured (due to lack of data on remaining highway users) congestion benefits
can be measured. Congestion benefits measure the marginal cost to congestion
that an additional vehicle will have on each roadway. A reduction in vehicles will
leave a marginal benefit of equal measure.
Vehicle Operation Cost Savings: Traffic congestion leads to higher vehicle
operating costs, primarily as a result of increased fuel use due to idling or start-
and-stop traffic flows, both of which consume more fuel than driving at steady
speeds.
State of Good Repair: Pavement receives wear and tear from frequent vehicle
use, leading to high maintenance costs. As traffic (particularly truck traffic) is
reduced, the wear and tear decreases as does the cost of maintenance.
Safety Improvements: Crashes embody major social costs. Vehicle crashes not
only impose costs on people who are involved, but also on the rest of the traffic
150 | P a g e
F R E I G H T F O R W A R D :
S T A T E O F R H O D E I S L A N D F R E I G H T A N D G O O D S M O V E M E N T P L A N
using the roadway and adjoining roadways because they too become
congested.
Reduced Emission Costs: A major impact of vehicle use is exhaust emissions – an
externality that imposes wide-ranging social costs on people and the
environment. The negative effects of pollution depend not only on the quantity
of pollution produced, but on the types of pollutants emitted and the conditions
into which pollution is released.
The values and methodology used to monetize these benefits are consistent with
USDOT guidelines using 2016 dollars. As per USDOT guidelines, seven percent and three
percent discount rates were applied to the costs and benefits. Several other
assumptions were made to determine outcomes. For example, average daily traffic
counts were used in conjunction with annual growth rates to determine annual traffic
counts for each year of analysis. The length of the corridor was estimated, along with
estimates of speed increases, based on increased capacity to determine time savings.
10.4 Interstate 95 Northbound Viaduct
The I-95 Northbound Viaduct Bridge is in critical need of replacement. Replacing the
functionally obsolete bridge will allow for better capability to handle increased traffic
volumes in a safer, more time efficient manner. Average daily traffic counts for 2016
were estimated at 332,179 with an annual growth rate of 0.5 percent bringing average
daily traffic counts to 365,198 by 2035.103 It was estimated that the trip length of 0.9284
miles would not change but that higher speeds would lead to reduced trip times. In
addition, the analysis assumes that crashes along the corridor would decrease 35
percent based on previous analyses conducted for similar projects.104
With the bridge replacement investment of $51 million,105 economic activity is
anticipated in the form of direct, indirect, and induced impacts. Construction impacts,
as well as the results of the benefit-cost analysis are provided below.
103 AADT data and growth rate were obtained from RIDOT. 104 Safety reduction factor based on previous work done by VHB on TIGER Grant Application.
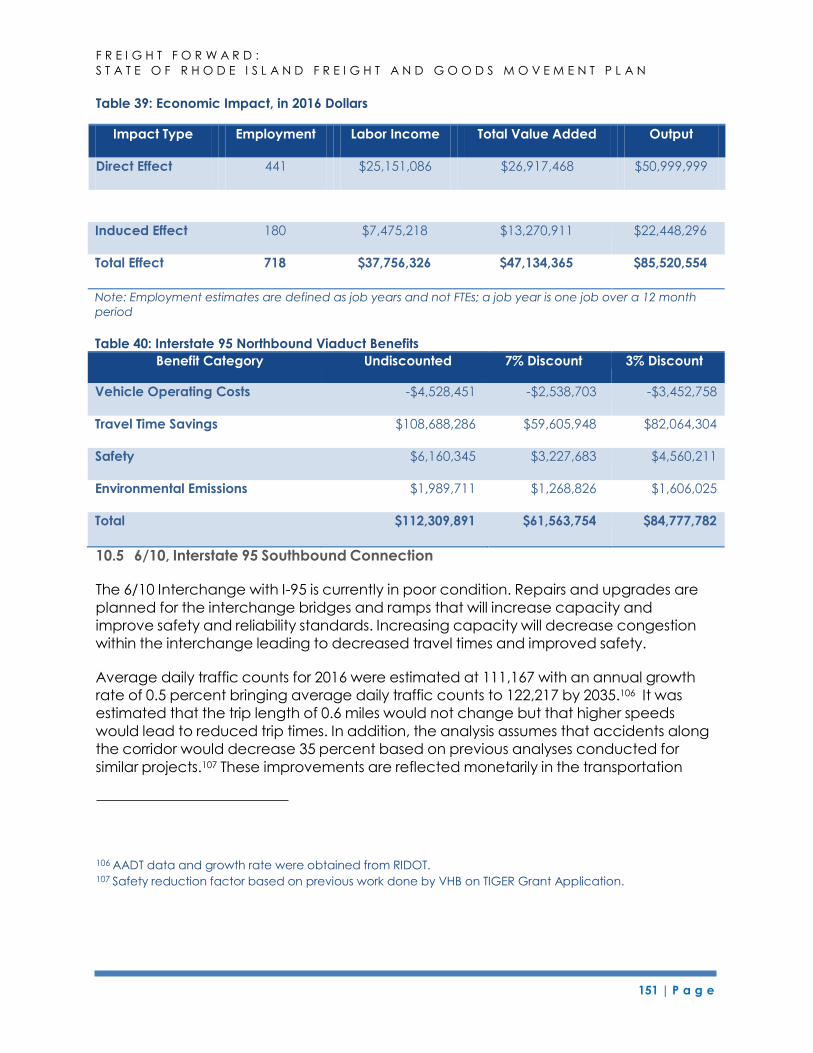
151 | P a g e
F R E I G H T F O R W A R D :
S T A T E O F R H O D E I S L A N D F R E I G H T A N D G O O D S M O V E M E N T P L A N
Table 39: Economic Impact, in 2016 Dollars
Induced Effect 180 $7,475,218 $13,270,911 $22,448,296
Total Effect 718 $37,756,326 $47,134,365 $85,520,554
Note: Employment estimates are defined as job years and not FTEs; a job year is one job over a 12 month
period
Table 40: Interstate 95 Northbound Viaduct Benefits
Benefit Category Undiscounted 7% Discount 3% Discount
Vehicle Operating Costs -$4,528,451 -$2,538,703 -$3,452,758
Travel Time Savings $108,688,286 $59,605,948 $82,064,304
Safety $6,160,345 $3,227,683 $4,560,211
Environmental Emissions $1,989,711 $1,268,826 $1,606,025
Total $112,309,891 $61,563,754 $84,777,782
10.5 6/10, Interstate 95 Southbound Connection
The 6/10 Interchange with I-95 is currently in poor condition. Repairs and upgrades are
planned for the interchange bridges and ramps that will increase capacity and
improve safety and reliability standards. Increasing capacity will decrease congestion
within the interchange leading to decreased travel times and improved safety.
Average daily traffic counts for 2016 were estimated at 111,167 with an annual growth
rate of 0.5 percent bringing average daily traffic counts to 122,217 by 2035.106 It was
estimated that the trip length of 0.6 miles would not change but that higher speeds
would lead to reduced trip times. In addition, the analysis assumes that accidents along
the corridor would decrease 35 percent based on previous analyses conducted for
similar projects.107 These improvements are reflected monetarily in the transportation
106 AADT data and growth rate were obtained from RIDOT. 107 Safety reduction factor based on previous work done by VHB on TIGER Grant Application.
Impact Type Employment Labor Income Total Value Added Output
Direct Effect 441 $25,151,086 $26,917,468 $50,999,999
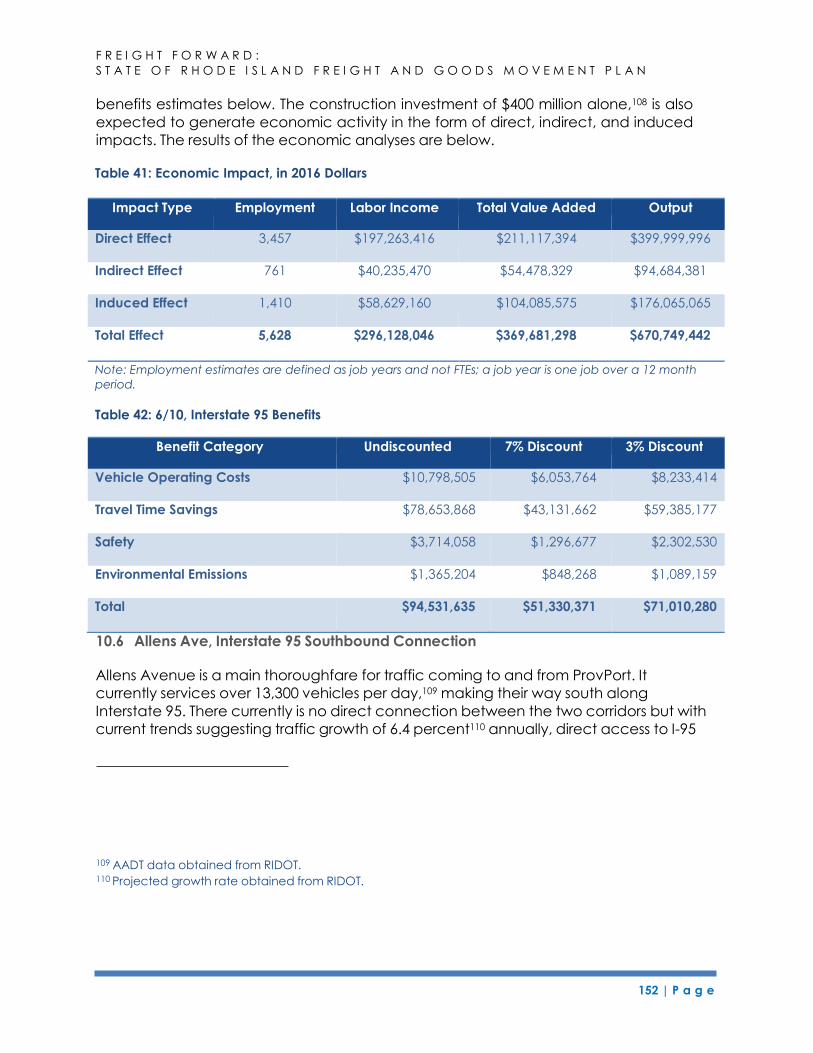
152 | P a g e
F R E I G H T F O R W A R D :
S T A T E O F R H O D E I S L A N D F R E I G H T A N D G O O D S M O V E M E N T P L A N
benefits estimates below. The construction investment of $400 million alone,108 is also
expected to generate economic activity in the form of direct, indirect, and induced
impacts. The results of the economic analyses are below.
Table 41: Economic Impact, in 2016 Dollars
Impact Type Employment Labor Income Total Value Added Output
Direct Effect 3,457 $197,263,416 $211,117,394 $399,999,996
Indirect Effect 761 $40,235,470 $54,478,329 $94,684,381
Induced Effect 1,410 $58,629,160 $104,085,575 $176,065,065
Total Effect 5,628 $296,128,046 $369,681,298 $670,749,442
Note: Employment estimates are defined as job years and not FTEs; a job year is one job over a 12 month
period.
Table 42: 6/10, Interstate 95 Benefits
Benefit Category Undiscounted 7% Discount 3% Discount
Vehicle Operating Costs $10,798,505 $6,053,764 $8,233,414
Travel Time Savings $78,653,868 $43,131,662 $59,385,177
Safety $3,714,058 $1,296,677 $2,302,530
Environmental Emissions $1,365,204 $848,268 $1,089,159
Total $94,531,635 $51,330,371 $71,010,280
10.6 Allens Ave, Interstate 95 Southbound Connection
Allens Avenue is a main thoroughfare for traffic coming to and from ProvPort. It
currently services over 13,300 vehicles per day,109 making their way south along
Interstate 95. There currently is no direct connection between the two corridors but with
current trends suggesting traffic growth of 6.4 percent110 annually, direct access to I-95
109 AADT data obtained from RIDOT. 110 Projected growth rate obtained from RIDOT.
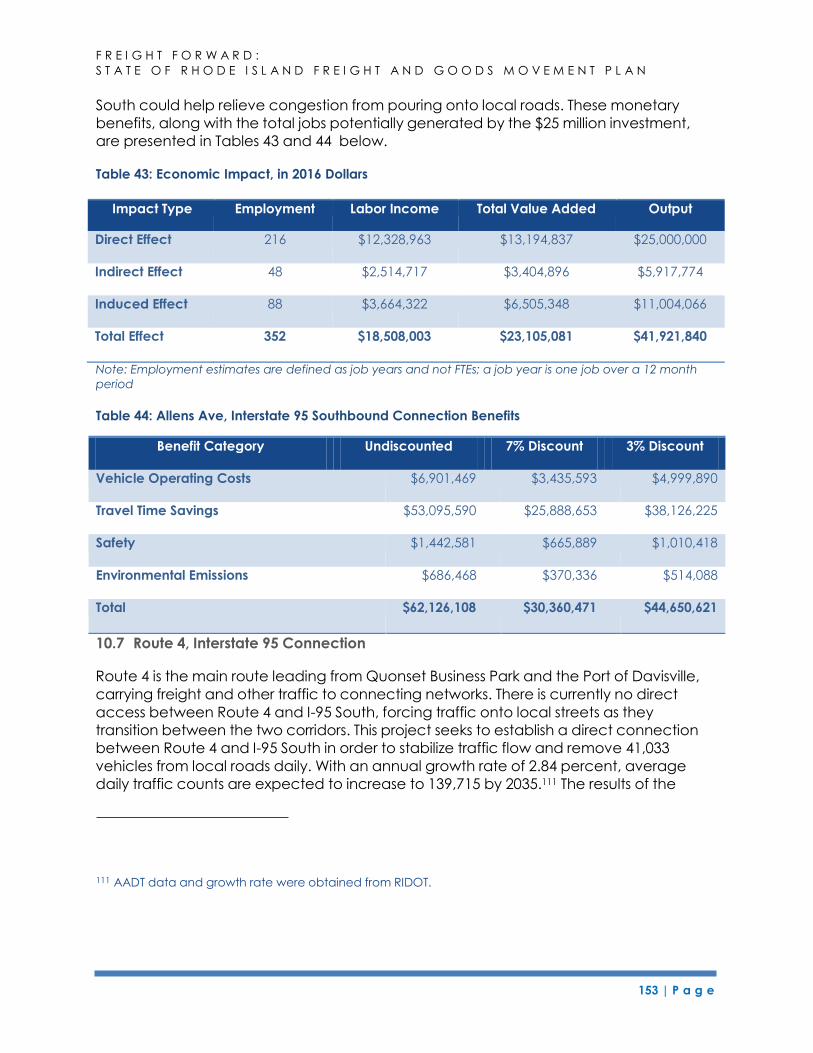
153 | P a g e
F R E I G H T F O R W A R D :
S T A T E O F R H O D E I S L A N D F R E I G H T A N D G O O D S M O V E M E N T P L A N
South could help relieve congestion from pouring onto local roads. These monetary
Benefit Category Undiscounted 7% Discount 3% Discount
benefits, along with the total jobs potentially generated by the $25 million investment,
are presented in Tables 43 and 44 below.
Table 43: Economic Impact, in 2016 Dollars
Impact Type Employment Labor Income Total Value Added Output
Direct Effect 216 $12,328,963 $13,194,837 $25,000,000
Indirect Effect 48 $2,514,717 $3,404,896 $5,917,774
Induced Effect 88 $3,664,322 $6,505,348 $11,004,066
Total Effect 352 $18,508,003 $23,105,081 $41,921,840
Note: Employment estimates are defined as job years and not FTEs; a job year is one job over a 12 month
period
Table 44: Allens Ave, Interstate 95 Southbound Connection Benefits
Vehicle Operating Costs $6,901,469 $3,435,593 $4,999,890
Travel Time Savings $53,095,590 $25,888,653 $38,126,225
Safety $1,442,581 $665,889 $1,010,418
Environmental Emissions $686,468 $370,336 $514,088
Total $62,126,108 $30,360,471 $44,650,621
10.7 Route 4, Interstate 95 Connection
Route 4 is the main route leading from Quonset Business Park and the Port of Davisville,
carrying freight and other traffic to connecting networks. There is currently no direct
access between Route 4 and I-95 South, forcing traffic onto local streets as they
transition between the two corridors. This project seeks to establish a direct connection
between Route 4 and I-95 South in order to stabilize traffic flow and remove 41,033
vehicles from local roads daily. With an annual growth rate of 2.84 percent, average
daily traffic counts are expected to increase to 139,715 by 2035.111 The results of the
111 AADT data and growth rate were obtained from RIDOT.
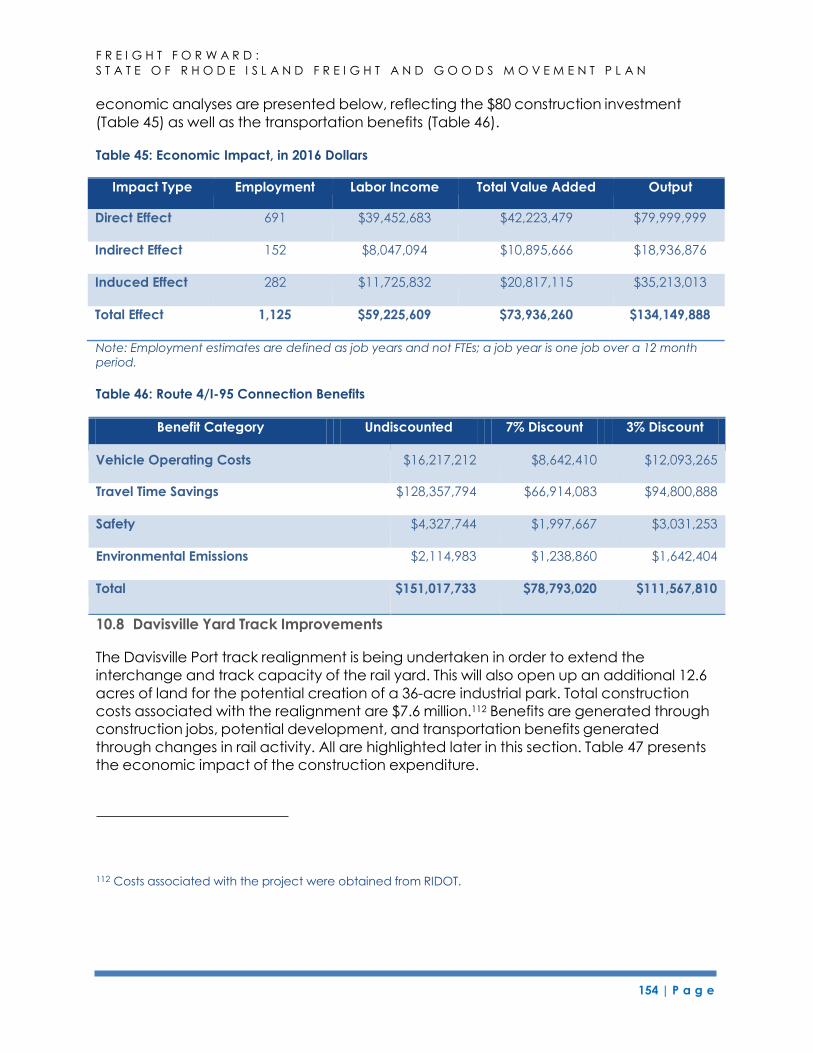
154 | P a g e
F R E I G H T F O R W A R D :
S T A T E O F R H O D E I S L A N D F R E I G H T A N D G O O D S M O V E M E N T P L A N
Benefit Category Undiscounted 7% Discount 3% Discount
economic analyses are presented below, reflecting the $80 construction investment
(Table 45) as well as the transportation benefits (Table 46).
Table 45: Economic Impact, in 2016 Dollars
Impact Type Employment Labor Income Total Value Added Output
Direct Effect 691 $39,452,683 $42,223,479 $79,999,999
Indirect Effect 152 $8,047,094 $10,895,666 $18,936,876
Induced Effect 282 $11,725,832 $20,817,115 $35,213,013
Total Effect 1,125 $59,225,609 $73,936,260 $134,149,888
Note: Employment estimates are defined as job years and not FTEs; a job year is one job over a 12 month
period.
Table 46: Route 4/I-95 Connection Benefits
Vehicle Operating Costs $16,217,212 $8,642,410 $12,093,265
Travel Time Savings $128,357,794 $66,914,083 $94,800,888
Safety $4,327,744 $1,997,667 $3,031,253
Environmental Emissions $2,114,983 $1,238,860 $1,642,404
Total $151,017,733 $78,793,020 $111,567,810
10.8 Davisville Yard Track Improvements
The Davisville Port track realignment is being undertaken in order to extend the
interchange and track capacity of the rail yard. This will also open up an additional 12.6
acres of land for the potential creation of a 36-acre industrial park. Total construction
costs associated with the realignment are $7.6 million.112 Benefits are generated through
construction jobs, potential development, and transportation benefits generated
through changes in rail activity. All are highlighted later in this section. Table 47 presents
the economic impact of the construction expenditure.
112 Costs associated with the project were obtained from RIDOT.
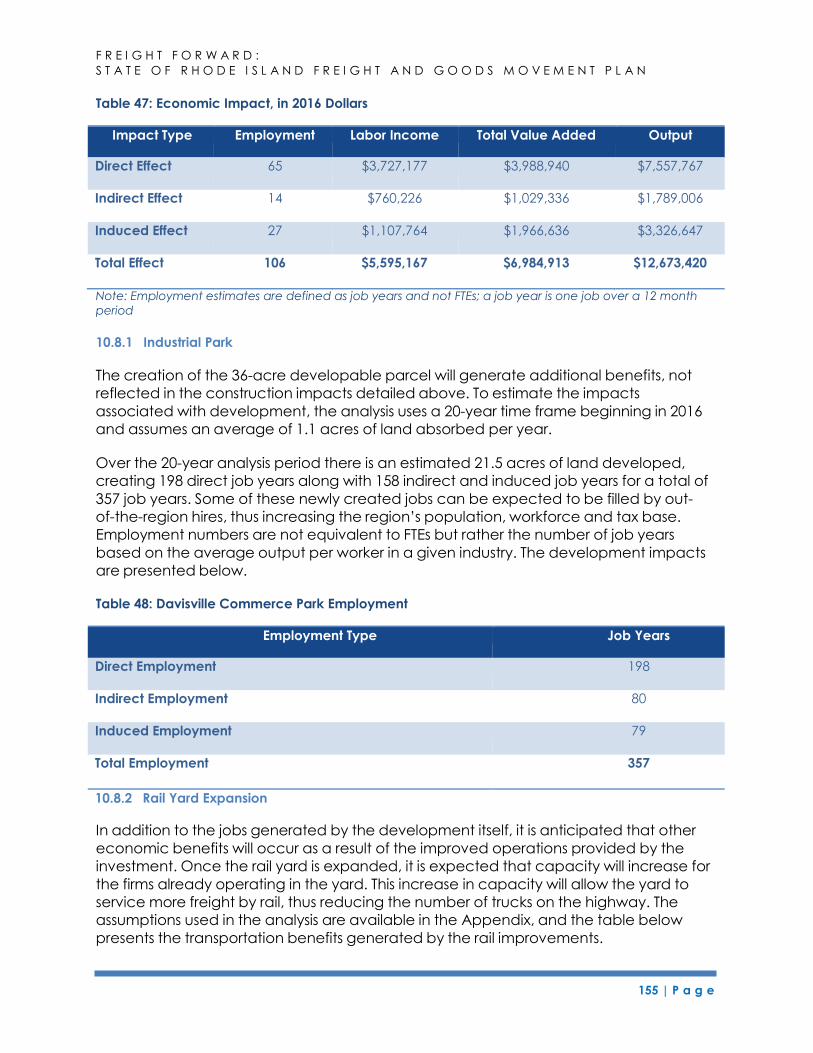
155 | P a g e
F R E I G H T F O R W A R D :
S T A T E O F R H O D E I S L A N D F R E I G H T A N D G O O D S M O V E M E N T P L A N
Table 47: Economic Impact, in 2016 Dollars
Impact Type Employment Labor Income Total Value Added Output
Direct Effect 65 $3,727,177 $3,988,940 $7,557,767
Indirect Effect 14 $760,226 $1,029,336 $1,789,006
Induced Effect 27 $1,107,764 $1,966,636 $3,326,647
Total Effect 106 $5,595,167 $6,984,913 $12,673,420
Note: Employment estimates are defined as job years and not FTEs; a job year is one job over a 12 month
period
10.8.1 Industrial Park
The creation of the 36-acre developable parcel will generate additional benefits, not
reflected in the construction impacts detailed above. To estimate the impacts
associated with development, the analysis uses a 20-year time frame beginning in 2016
and assumes an average of 1.1 acres of land absorbed per year.
Over the 20-year analysis period there is an estimated 21.5 acres of land developed,
creating 198 direct job years along with 158 indirect and induced job years for a total of
357 job years. Some of these newly created jobs can be expected to be filled by out-
of-the-region hires, thus increasing the region’s population, workforce and tax base.
Employment numbers are not equivalent to FTEs but rather the number of job years
based on the average output per worker in a given industry. The development impacts
are presented below.
Table 48: Davisville Commerce Park Employment
Employment Type Job Years
Direct Employment 198
Indirect Employment 80
Induced Employment 79
Total Employment 357
10.8.2 Rail Yard Expansion
In addition to the jobs generated by the development itself, it is anticipated that other
economic benefits will occur as a result of the improved operations provided by the
investment. Once the rail yard is expanded, it is expected that capacity will increase for
the firms already operating in the yard. This increase in capacity will allow the yard to
service more freight by rail, thus reducing the number of trucks on the highway. The
assumptions used in the analysis are available in the Appendix, and the table below
presents the transportation benefits generated by the rail improvements.
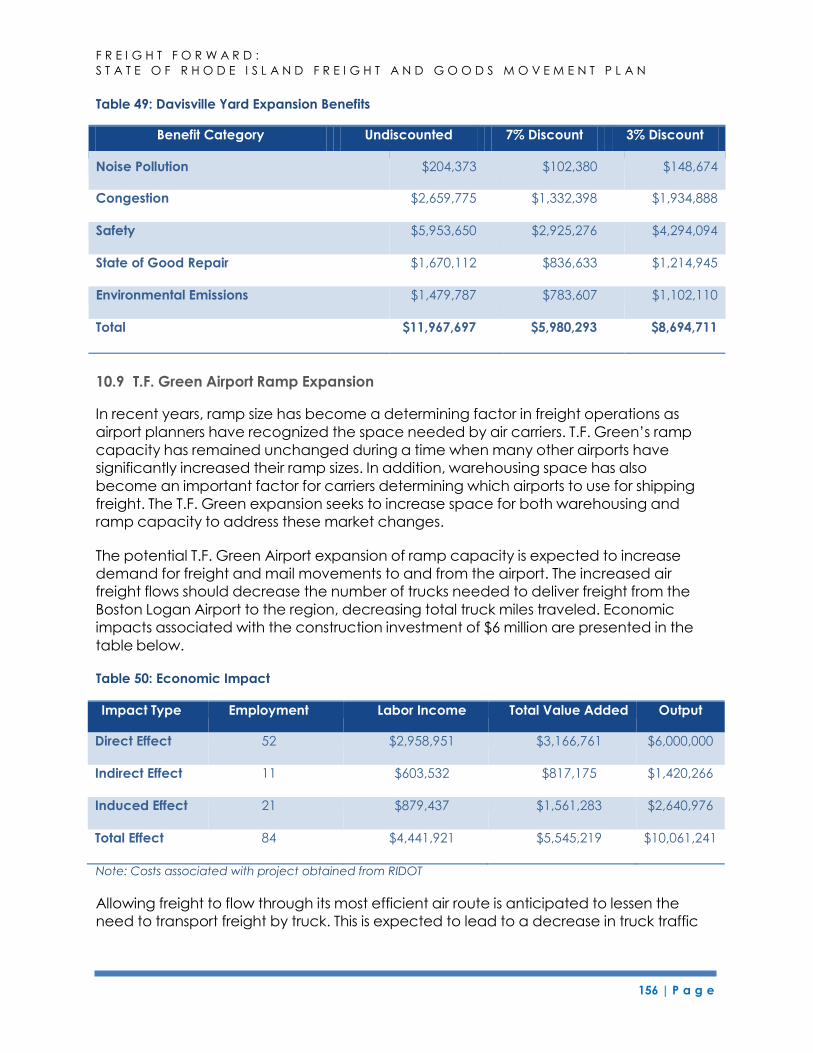
156 | P a g e
F R E I G H T F O R W A R D :
S T A T E O F R H O D E I S L A N D F R E I G H T A N D G O O D S M O V E M E N T P L A N
Table 49: Davisville Yard Expansion Benefits
Benefit Category Undiscounted 7% Discount 3% Discount
Noise Pollution $204,373 $102,380 $148,674
Congestion $2,659,775 $1,332,398 $1,934,888
Safety $5,953,650 $2,925,276 $4,294,094
State of Good Repair $1,670,112 $836,633 $1,214,945
Environmental Emissions $1,479,787 $783,607 $1,102,110
Total $11,967,697 $5,980,293 $8,694,711
10.9 T.F. Green Airport Ramp Expansion
In recent years, ramp size has become a determining factor in freight operations as
airport planners have recognized the space needed by air carriers. T.F. Green’s ramp
capacity has remained unchanged during a time when many other airports have
significantly increased their ramp sizes. In addition, warehousing space has also
become an important factor for carriers determining which airports to use for shipping
freight. The T.F. Green expansion seeks to increase space for both warehousing and
ramp capacity to address these market changes.
The potential T.F. Green Airport expansion of ramp capacity is expected to increase
demand for freight and mail movements to and from the airport. The increased air
freight flows should decrease the number of trucks needed to deliver freight from the
Boston Logan Airport to the region, decreasing total truck miles traveled. Economic
impacts associated with the construction investment of $6 million are presented in the
table below.
Table 50: Economic Impact
Impact Type Employment Labor Income Total Value Added Output
Direct Effect 52 $2,958,951 $3,166,761 $6,000,000
Indirect Effect 11 $603,532 $817,175 $1,420,266
Induced Effect 21 $879,437 $1,561,283 $2,640,976
Total Effect 84 $4,441,921 $5,545,219 $10,061,241
Note: Costs associated with project obtained from RIDOT
Allowing freight to flow through its most efficient air route is anticipated to lessen the
need to transport freight by truck. This is expected to lead to a decrease in truck traffic
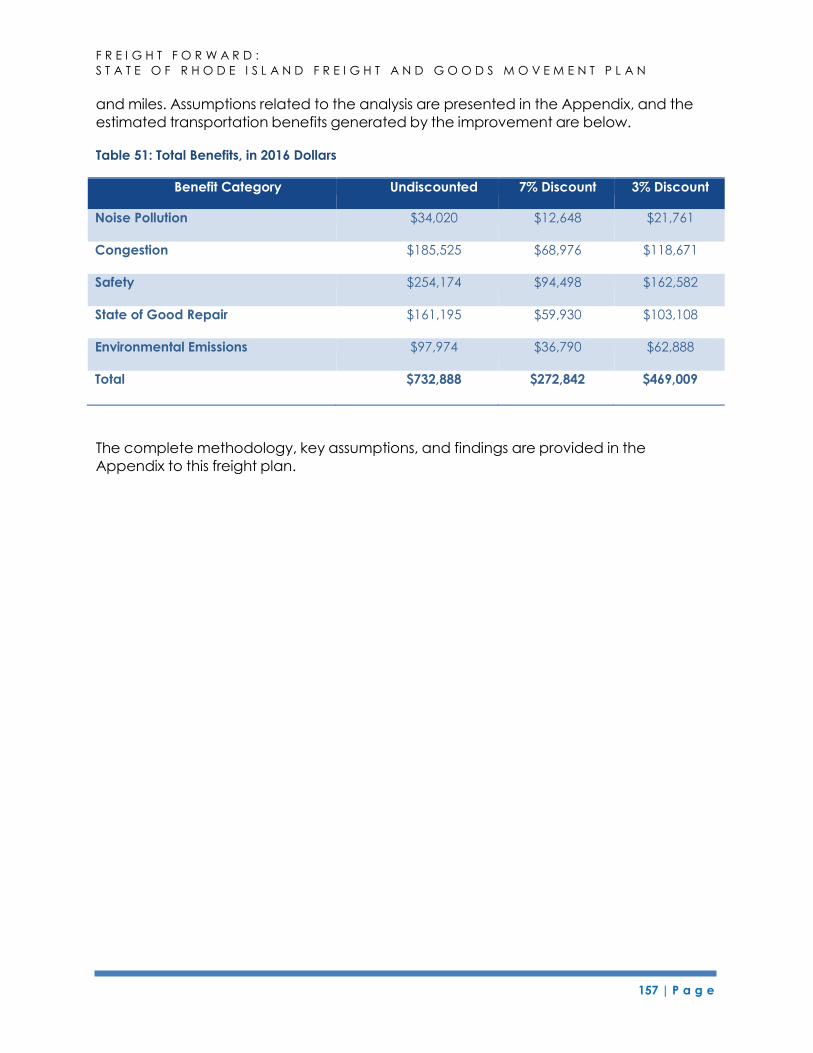
157 | P a g e
F R E I G H T F O R W A R D :
S T A T E O F R H O D E I S L A N D F R E I G H T A N D G O O D S M O V E M E N T P L A N
and miles. Assumptions related to the analysis are presented in the Appendix, and the
estimated transportation benefits generated by the improvement are below.
Table 51: Total Benefits, in 2016 Dollars
Benefit Category Undiscounted 7% Discount 3% Discount
Noise Pollution $34,020 $12,648 $21,761
Congestion $185,525 $68,976 $118,671
Safety $254,174 $94,498 $162,582
State of Good Repair $161,195 $59,930 $103,108
Environmental Emissions $97,974 $36,790 $62,888
Total $732,888 $272,842 $469,009
The complete methodology, key assumptions, and findings are provided in the
Appendix to this freight plan.
158 | P a g e
F R E I G H T F O R W A R D :
S T A T E O F R H O D E I S L A N D F R E I G H T A N D G O O D S M O V E M E N T P L A N
11 THE STATE’S FREIGHT IMPROVEMENT STRATEGY
11.1 Freight Investment Priorities
Based on the prioritization process described in the previous chapter, priority freight
investments for roadways and other freight transportation facilities were identified. The
table below provides the project, a brief description along with location, the priority
level, and other information related to the individual investment.
The table below presents the Project Recommendations that were identified through
the project prioritization process with the input of the Freight Advisory Committee. In
total, there are 25 priority roadway investments.
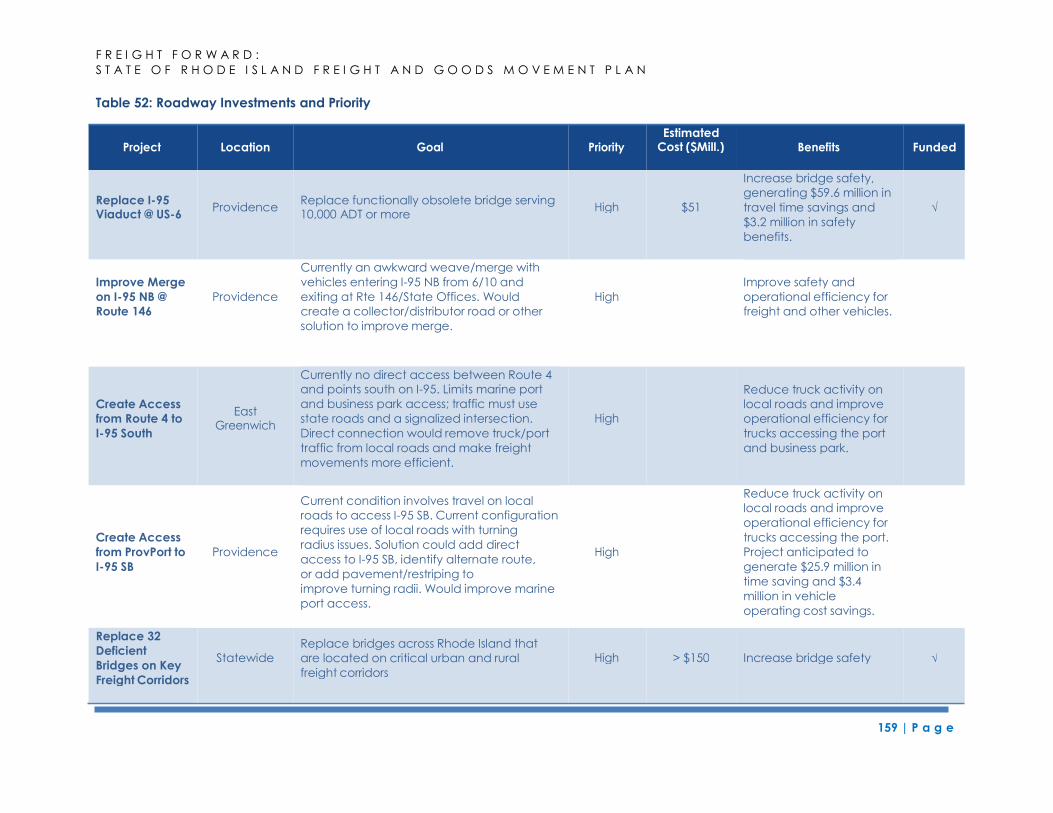
F R E I G H T F O R W A R D :
S T A T E O F R H O D E I S L A N D F R E I G H T A N D G O O D S M O V E M E N T P L A N
159 | P a g e
Table 52: Roadway Investments and Priority
Improve Merge
on I-95 NB @
Route 146
Providence
Currently an awkward weave/merge with
vehicles entering I-95 NB from 6/10 and
exiting at Rte 146/State Offices. Would
create a collector/distributor road or other
solution to improve merge.
High
Improve safety and
operational efficiency for
freight and other vehicles.
Create Access
from ProvPort to
I-95 SB
Providence
Current condition involves travel on local
roads to access I-95 SB. Current configuration
requires use of local roads with turning
radius issues. Solution could add direct
access to I-95 SB, identify alternate route,
or add pavement/restriping to
improve turning radii. Would improve marine
port access.
High
Reduce truck activity on
local roads and improve
operational efficiency for
trucks accessing the port.
Project anticipated to
generate $25.9 million in
time saving and $3.4
million in vehicle
operating cost savings.
Location
Estimated Cost ($Mill.) Funded
Replace I-95 Viaduct @ US-6
Providence Replace functionally obsolete bridge serving 10,000 ADT or more
$51
Increase bridge safety,
generating $59.6 million in
travel time savings and
$3.2 million in safety
benefits.
√
Create Access
from Route 4 to
I-95 South
East
Currently no direct access between Route 4
and points south on I-95. Limits marine port
and business park access; traffic must use
state roads and a signalized intersection.
Direct connection would remove truck/port
traffic from local roads and make freight
movements more efficient.
Reduce truck activity on
local roads and improve
operational efficiency for
trucks accessing the port
and business park.
Replace 32
Deficient
Bridges on Key
Freight Corridors
Statewide
Replace bridges across Rhode Island that
are located on critical urban and rural
freight corridors
> $150 Increase bridge safety √
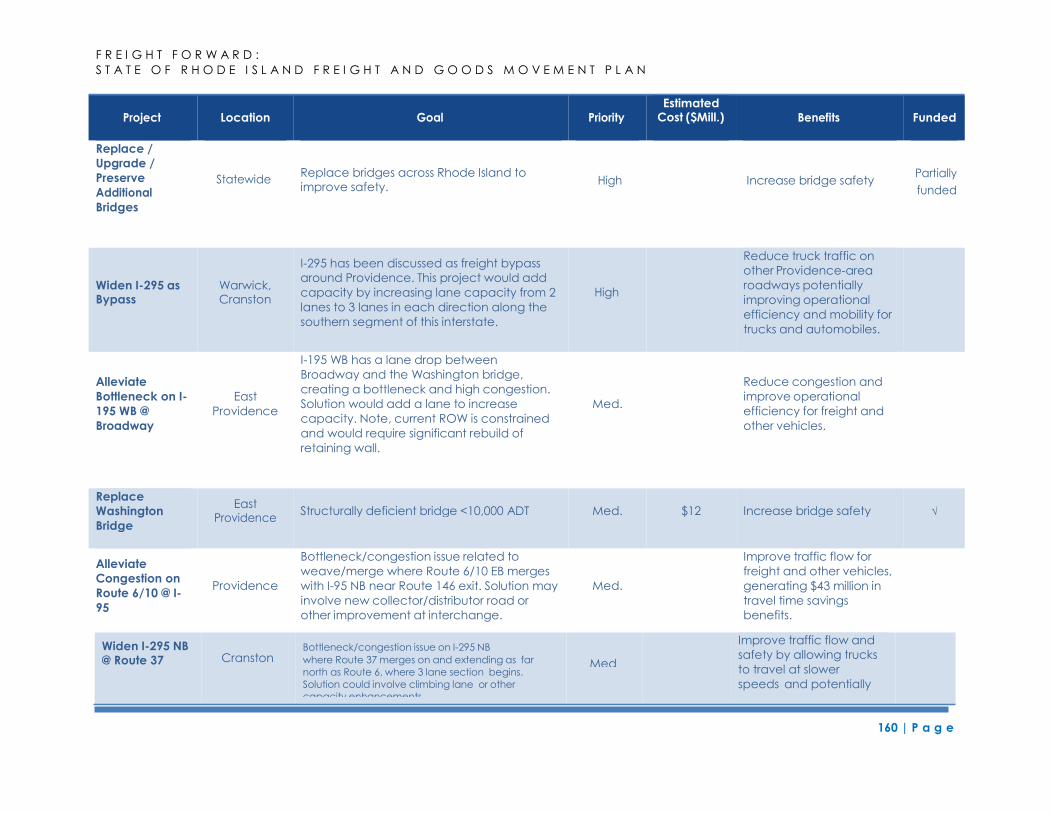
F R E I G H T F O R W A R D :
S T A T E O F R H O D E I S L A N D F R E I G H T A N D G O O D S M O V E M E N T P L A N
160 | P a g e
Replace /
Upgrade /
Preserve
Additional
Bridges
Statewide Replace bridges across Rhode Island to
improve safety.
High Increase bridge safety Partially
funded
Alleviate
Bottleneck on I-
195 WB @
Broadway
East
Providence
I-195 WB has a lane drop between
Broadway and the Washington bridge,
creating a bottleneck and high congestion.
Solution would add a lane to increase
capacity. Note, current ROW is constrained
and would require significant rebuild of
retaining wall.
Med.
Reduce congestion and
improve operational
efficiency for freight and
other vehicles.
Alleviate
Congestion on
Route 6/10 @ I-
95
Providence
Bottleneck/congestion issue related to
weave/merge where Route 6/10 EB merges
with I-95 NB near Route 146 exit. Solution may
involve new collector/distributor road or
other improvement at interchange.
Med.
Improve traffic flow for
freight and other vehicles,
generating $43 million in
travel time savings
benefits.
Location
Estimated Cost ($Mill.) Funded
Widen I-295 as Bypass
Warwick, Cranston
I-295 has been discussed as freight bypass
around Providence. This project would add
capacity by increasing lane capacity from 2
lanes to 3 lanes in each direction along the
southern segment of this interstate.
Reduce truck traffic on
other Providence-area
roadways potentially
improving operational
efficiency and mobility for
trucks and automobiles.
Replace
Washington
Bridge
East
Structurally deficient bridge <10,000 ADT Med. $12 Increase bridge safety √
Widen I-295 NB @ Route 37 Cranston
, Johnston
Bottleneck/congestion issue on I-295 NB
where Route 37 merges on and extending as far
north as Route 6, where 3 lane section begins.
Solution could involve climbing lane or other capacity enhancements.
Med.
Improve traffic flow and
safety by allowing trucks
to travel at slower
speeds and potentially
in separate lanes.
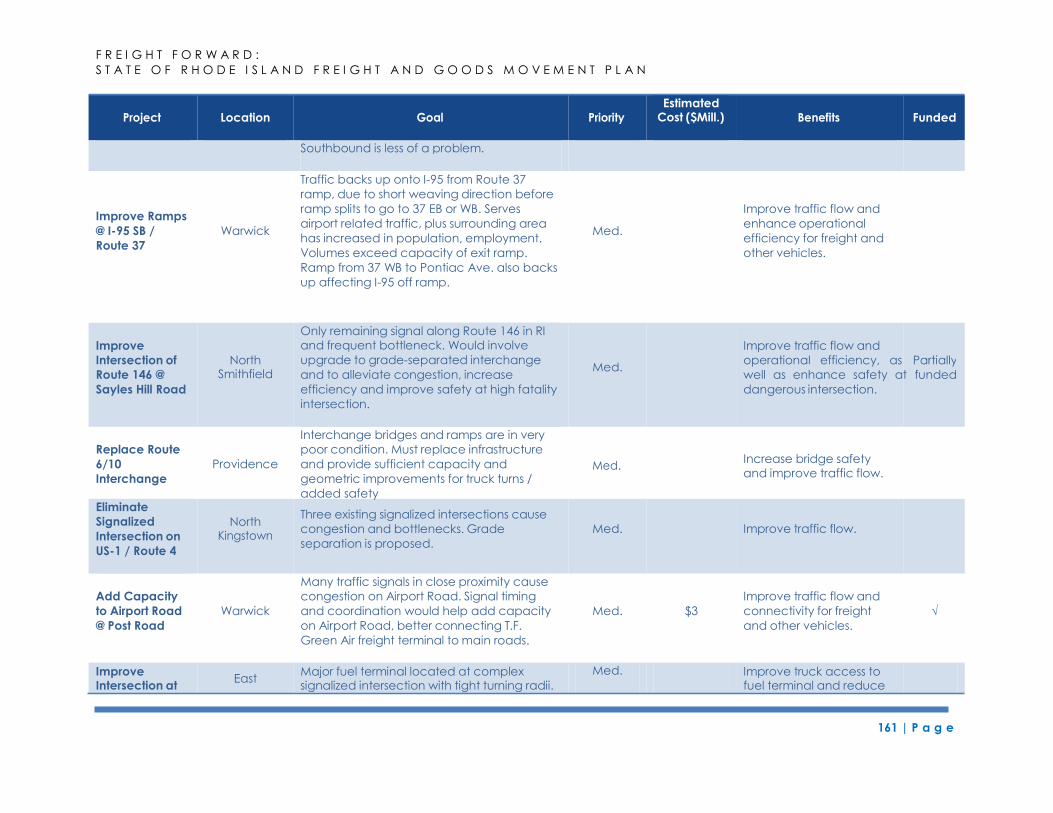
F R E I G H T F O R W A R D :
S T A T E O F R H O D E I S L A N D F R E I G H T A N D G O O D S M O V E M E N T P L A N
161 | P a g e
Eliminate
Signalized
Intersection on
US-1 / Route 4
North
Three existing signalized intersections cause
congestion and bottlenecks. Grade
separation is proposed.
Med. Improve traffic flow.
Improve Ramps
@ I-95 SB /
Route 37
Warwick
Traffic backs up onto I-95 from Route 37
ramp, due to short weaving direction before
ramp splits to go to 37 EB or WB. Serves
airport related traffic, plus surrounding area
has increased in population, employment.
Volumes exceed capacity of exit ramp.
Ramp from 37 WB to Pontiac Ave. also backs
up affecting I-95 off ramp.
Med.
Improve traffic flow and
enhance operational
efficiency for freight and
other vehicles.
Replace Route
6/10
Interchange
Providence
Interchange bridges and ramps are in very
poor condition. Must replace infrastructure
and provide sufficient capacity and
geometric improvements for truck turns /
added safety
Med. Increase bridge safety
and improve traffic flow.
Many traffic signals in close proximity cause
Add Capacity congestion on Airport Road. Signal timing Improve traffic flow and to Airport Road Warwick and coordination would help add capacity Med. $3 connectivity for freight √
@ Post Road on Airport Road, better connecting T.F. and other vehicles. Green Air freight terminal to main roads.
Location
Estimated Cost ($Mill.) Funded
Southbound is less of a problem.
Improve
Intersection of
Route 146 @
Sayles Hill Road
North Smithfield
Only remaining signal along Route 146 in RI
and frequent bottleneck. Would involve
upgrade to grade-separated interchange
and to alleviate congestion, increase
efficiency and improve safety at high fatality
intersection.
Med.
Improve traffic flow and
operational efficiency, as Partially
well as enhance safety at funded
dangerous intersection.
Improve Intersection at
East Major fuel terminal located at complex signalized intersection with tight turning radii.
Med. Improve truck access to fuel terminal and reduce
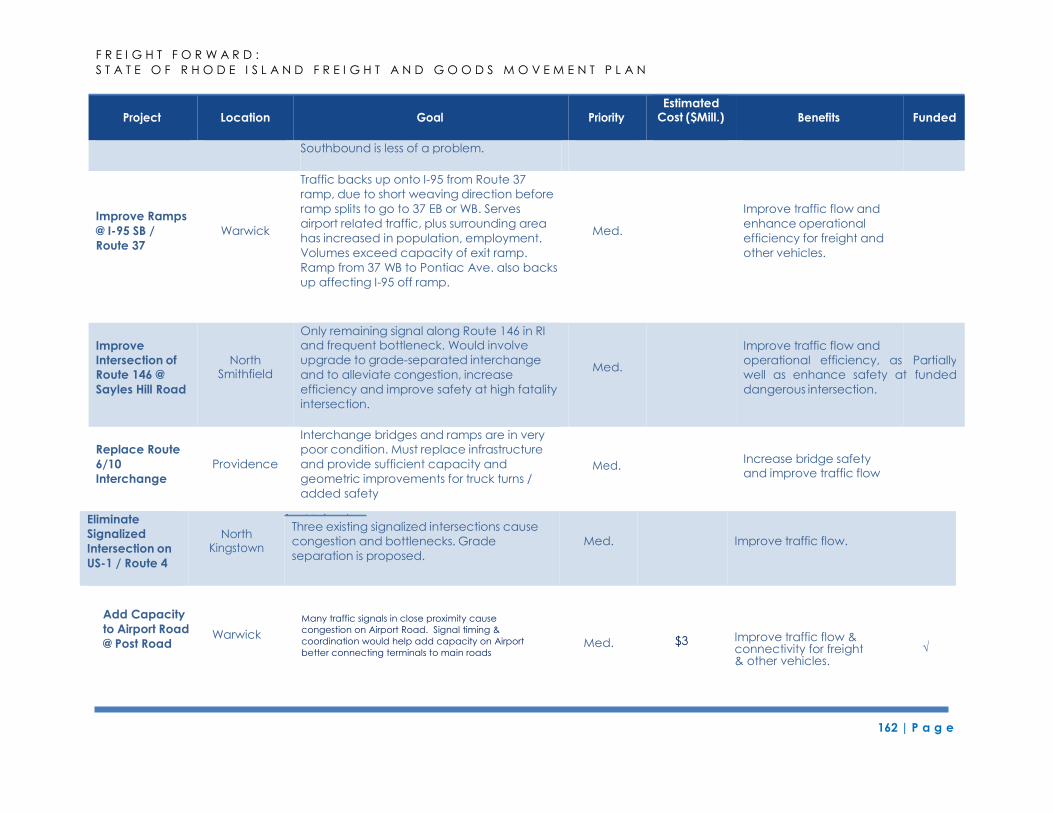
F R E I G H T F O R W A R D :
S T A T E O F R H O D E I S L A N D F R E I G H T A N D G O O D S M O V E M E N T P L A N
162 | P a g e
Eliminate
Signalized
Intersection on
US-1 / Route 4
North
Three existing signalized intersections cause
congestion and bottlenecks. Grade
separation is proposed.
Med. Improve traffic flow.
Many traffic signals in close proximity cause
congestion on Airport Road. Signal timing &
coordination would help add capacity on Airport
better connecting terminals to main roads $3
√
Add Capacity
to Airport Road
@ Post Road
Warwick Med.
Improve traffic flow & connectivity for freight & other vehicles.
Improve Ramps
@ I-95 SB /
Route 37
Warwick
Traffic backs up onto I-95 from Route 37
ramp, due to short weaving direction before
ramp splits to go to 37 EB or WB. Serves
airport related traffic, plus surrounding area
has increased in population, employment.
Volumes exceed capacity of exit ramp.
Ramp from 37 WB to Pontiac Ave. also backs
up affecting I-95 off ramp.
Med.
Improve traffic flow and
enhance operational
efficiency for freight and
other vehicles.
Replace Route
6/10
Interchange
Providence
Interchange bridges and ramps are in very
poor condition. Must replace infrastructure
and provide sufficient capacity and
geometric improvements for truck turns /
added safety
Med. Increase bridge safety
and improve traffic flow
Location
Estimated Cost ($Mill.) Funded
Southbound is less of a problem.
Improve
Intersection of
Route 146 @
Sayles Hill Road
North Smithfield
Only remaining signal along Route 146 in RI
and frequent bottleneck. Would involve
upgrade to grade-separated interchange
and to alleviate congestion, increase
efficiency and improve safety at high fatality
intersection.
Med.
Improve traffic flow and
operational efficiency, as Partially
well as enhance safety at funded
dangerous intersection.
I EMaj M I
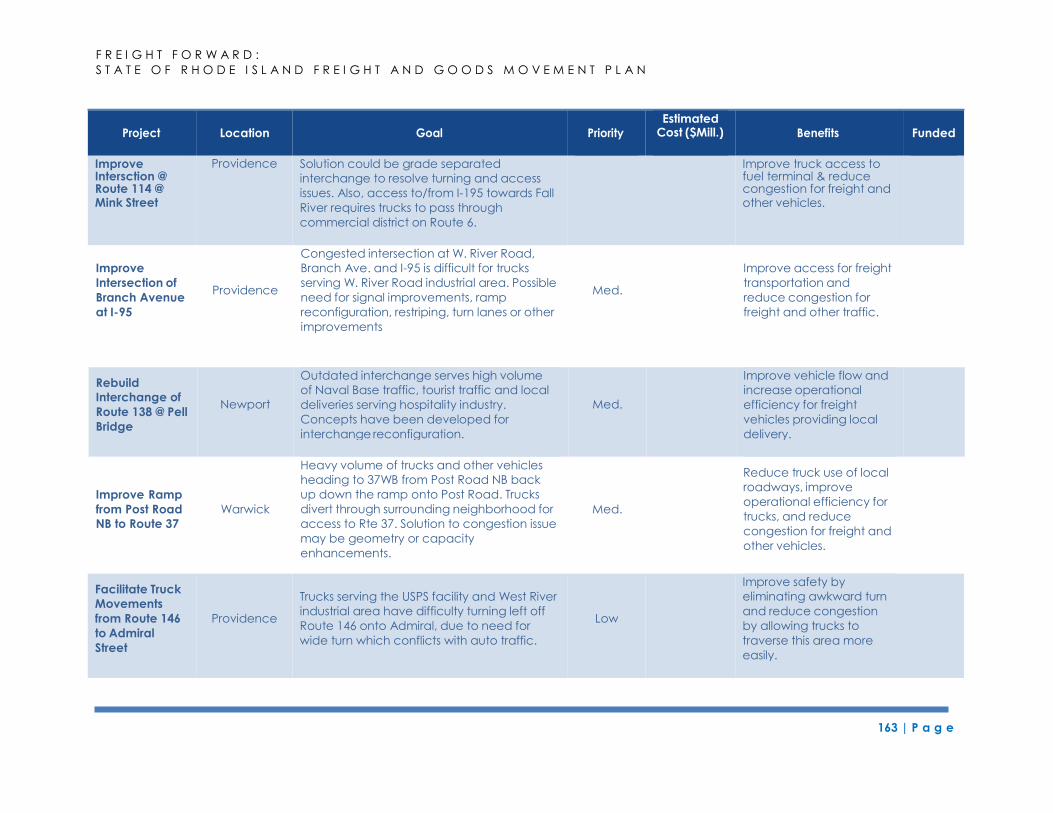
F R E I G H T F O R W A R D :
S T A T E O F R H O D E I S L A N D F R E I G H T A N D G O O D S M O V E M E N T P L A N
163 | P a g e
Improve
Intersection of
Branch Avenue
at I-95
Providence
Congested intersection at W. River Road,
Branch Ave. and I-95 is difficult for trucks
serving W. River Road industrial area. Possible
need for signal improvements, ramp
reconfiguration, restriping, turn lanes or other
improvements
Med.
Improve access for freight
transportation and
reduce congestion for
freight and other traffic.
Improve Ramp
from Post Road
NB to Route 37
Warwick
Heavy volume of trucks and other vehicles
heading to 37WB from Post Road NB back
up down the ramp onto Post Road. Trucks
divert through surrounding neighborhood for
access to Rte 37. Solution to congestion issue
may be geometry or capacity
enhancements.
Med.
Reduce truck use of local
roadways, improve
operational efficiency for
trucks, and reduce
congestion for freight and
other vehicles.
Location
Estimated Cost ($Mill.) Funded
Improve Intersction @ Route 114 @ Mink Street
Providence Solution could be grade separated
interchange to resolve turning and access
issues. Also, access to/from I-195 towards Fall
River requires trucks to pass through
commercial district on Route 6.
Improve truck access to fuel terminal & reduce congestion for freight and other vehicles.
Rebuild
Interchange of
Route 138 @ Pell
Bridge
Newport
Outdated interchange serves high volume
of Naval Base traffic, tourist traffic and local
deliveries serving hospitality industry.
Concepts have been developed for
interchange reconfiguration.
Med.
Improve vehicle flow and
increase operational
efficiency for freight
vehicles providing local
delivery.
Facilitate Truck
Movements
from Route 146
to Admiral
Street
Providence
Trucks serving the USPS facility and West River
industrial area have difficulty turning left off
Route 146 onto Admiral, due to need for
wide turn which conflicts with auto traffic.
Low
Improve safety by
eliminating awkward turn
and reduce congestion
by allowing trucks to
traverse this area more
easily.
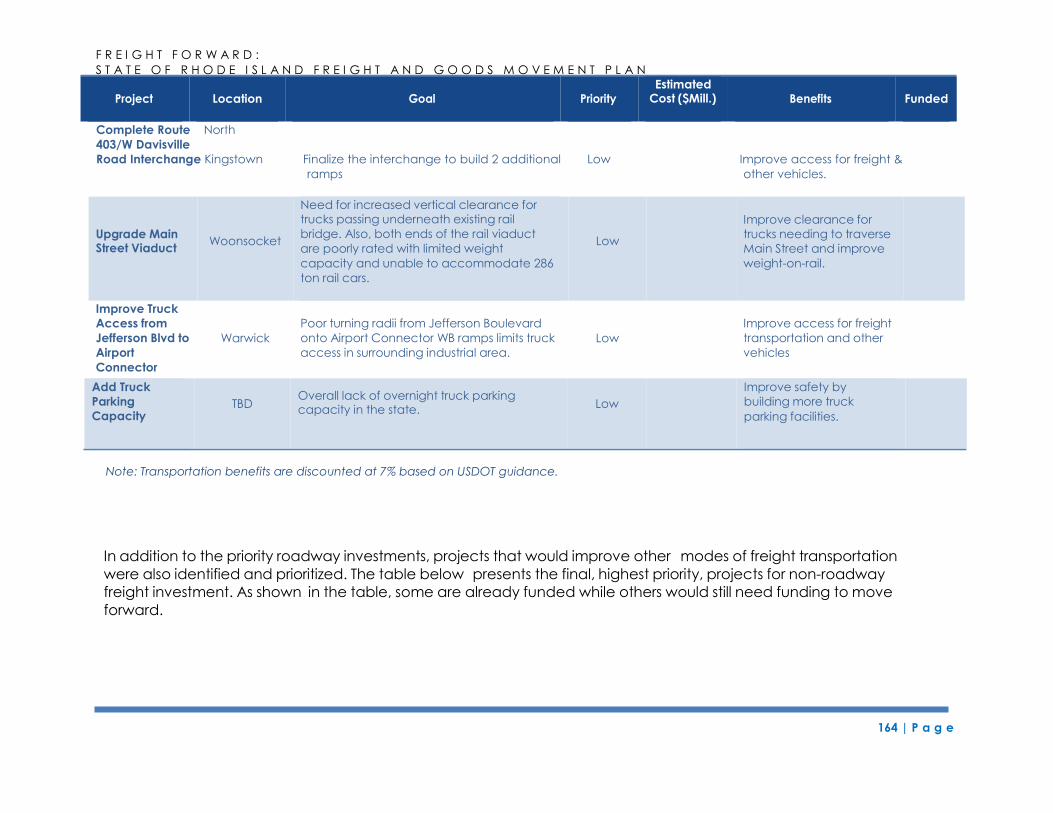
F R E I G H T F O R W A R D :
S T A T E O F R H O D E I S L A N D F R E I G H T A N D G O O D S M O V E M E N T P L A N
164 | P a g e
Complete Route North
403/W Davisville
Road Interchange Kingstown Finalize the interchange to build 2 additional Low Improve access for freight &
ramps other vehicles.
Improve Truck
Access from
Jefferson Blvd to
Airport
Connector
Warwick
Poor turning radii from Jefferson Boulevard
onto Airport Connector WB ramps limits truck
access in surrounding industrial area.
Low
Improve access for freight
transportation and other
vehicles
Location
Estimated Cost ($Mill.) Funded
Upgrade Main Street Viaduct
Woonsocket
Need for increased vertical clearance for
trucks passing underneath existing rail
bridge. Also, both ends of the rail viaduct
are poorly rated with limited weight
capacity and unable to accommodate 286
ton rail cars.
Low
Improve clearance for
trucks needing to traverse
Main Street and improve
weight-on-rail.
Note: Transportation benefits are discounted at 7% based on USDOT guidance.
In addition to the priority roadway investments, projects that would improve other modes of freight transportation
were also identified and prioritized. The table below presents the final, highest priority, projects for non-roadway
freight investment. As shown in the table, some are already funded while others would still need funding to move
forward.
Add Truck
Parking
Capacity TBD
Overall lack of overnight truck parking capacity in the state.
Low
Improve safety by
building more truck
parking facilities.
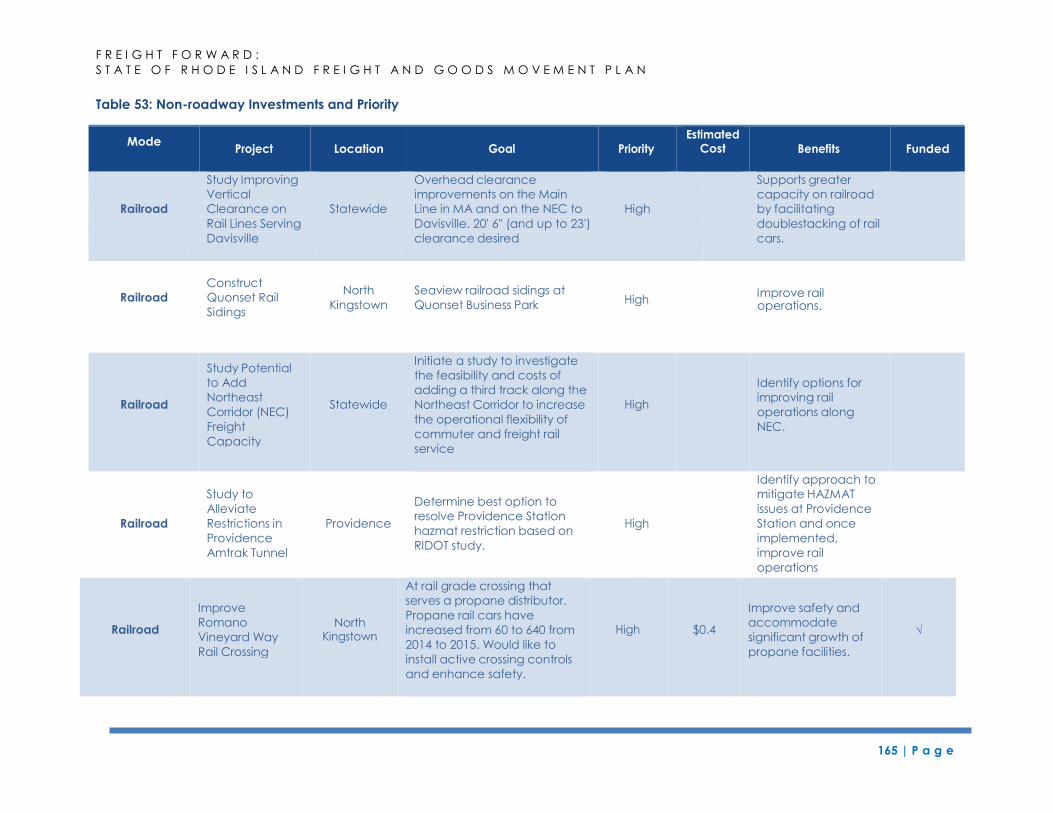
F R E I G H T F O R W A R D :
S T A T E O F R H O D E I S L A N D F R E I G H T A N D G O O D S M O V E M E N T P L A N
165 | P a g e
Mode Location
Cost Funded
Table 53: Non-roadway Investments and Priority
Study Improving Overhead clearance Supports greater
Vertical improvements on the Main capacity on railroad
Railroad Clearance on Statewide Line in MA and on the NEC to High by facilitating
Rail Lines Serving Davisville. 20' 6" (and up to 23') doublestacking of rail
Davisville clearance desired cars.
Railroad
Construct
Quonset Rail
Sidings
North
Kingstown
Seaview railroad sidings at
Quonset Business Park High Improve rail operations.
Railroad
Study to
Alleviate
Restrictions in
Providence
Amtrak Tunnel
Providence
Determine best option to
resolve Providence Station
hazmat restriction based on
RIDOT study.
High
Identify approach to
mitigate HAZMAT
issues at Providence
Station and once
implemented,
improve rail
operations
Upgrade North Modernization of Pier 2 in
Davisville to extend life and
High State of good repair Bond
Railroad
Study Potential
to Add
Northeast
Corridor (NEC)
Freight
Capacity
Statewide
Initiate a study to investigate
the feasibility and costs of
adding a third track along the
Northeast Corridor to increase
the operational flexibility of
commuter and freight rail
service
Identify options for
improving rail
operations along
NEC.
Railroad
Improve
Romano
Vineyard Way
Rail Crossing
North
At rail grade crossing that
serves a propane distributor.
Propane rail cars have
increased from 60 to 640 from
2014 to 2015. Would like to
install active crossing controls
and enhance safety.
$0.4
Improve safety and
accommodate
significant growth of
propane facilities.
√
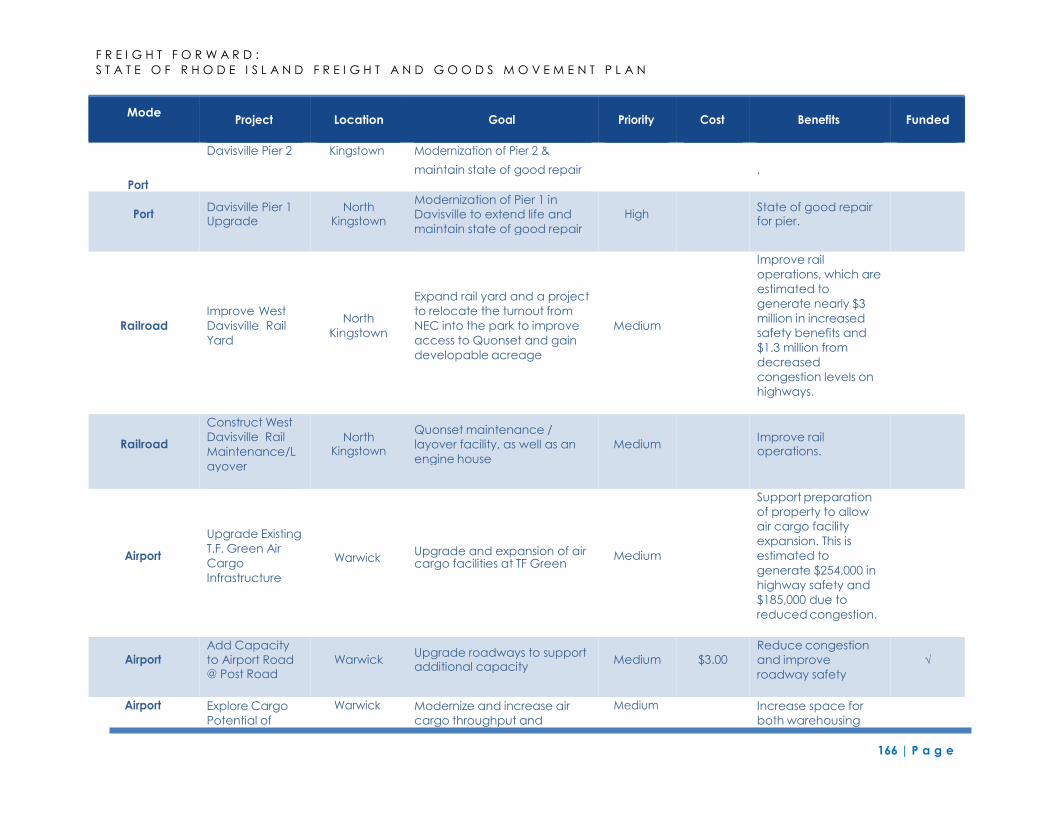
166 | P a g e
F R E I G H T F O R W A R D :
S T A T E O F R H O D E I S L A N D F R E I G H T A N D G O O D S M O V E M E N T P L A N
Estimated
Mode Location Funded
Davisville Pier 2 Kingstown Modernization of Pier 2 &
maintain state of good repair .
Port
Railroad
Improve West
Davisville Rail
Yard
North
Kingstown
Expand rail yard and a project
to relocate the turnout from
NEC into the park to improve
access to Quonset and gain
developable acreage
Medium
Improve rail
operations, which are
estimated to
generate nearly $3
million in increased
safety benefits and
$1.3 million from
decreased
congestion levels on
highways.
Airport
Upgrade Existing
T.F. Green Air
Cargo
Infrastructure
Warwick
Upgrade and expansion of air cargo facilities at TF Green
Support preparation
of property to allow
air cargo facility
expansion. This is
estimated to
generate $254,000 in
highway safety and
$185,000 due to
reduced congestion.
Airport Explore Cargo
Potential of
Warwick Modernize and increase air
cargo throughput and
Medium Increase space for
both warehousing
Davisville Pier 1 Upgrade
North
Modernization of Pier 1 in
Davisville to extend life and
maintain state of good repair
State of good repair for pier.
Railroad
Construct West
Davisville Rail
Maintenance/L
ayover
North
Quonset maintenance /
layover facility, as well as an
engine house
Medium Improve rail operations.
Add Capacity
to Airport Road @ Post Road
Warwick Upgrade roadways to support additional capacity
Medium $3.00
Reduce congestion
and improve
roadway safety
√
Medium
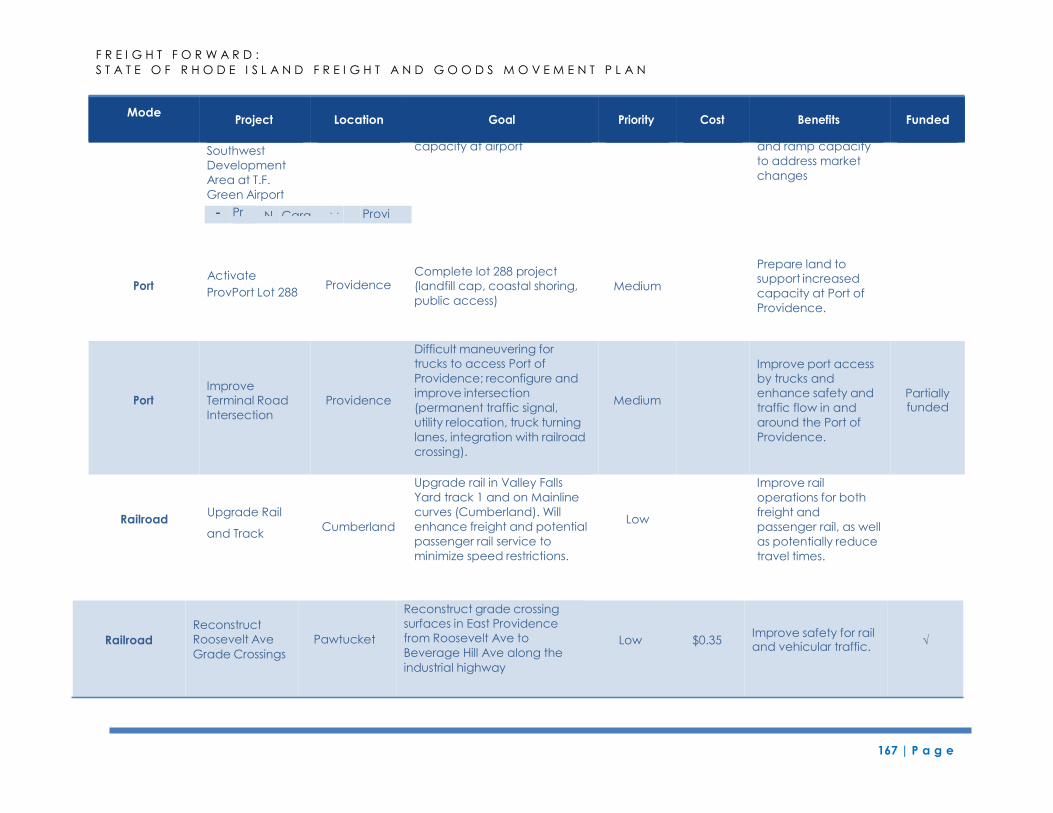
167 | P a g e
F R E I G H T F O R W A R D :
S T A T E O F R H O D E I S L A N D F R E I G H T A N D G O O D S M O V E M E N T P L A N
Estimated
Southwest
Development
Area at T.F.
Green Airport
capacity at airport and ramp capacity
to address market
changes
Activate
ProvPort Lot 288 Providence
Complete lot 288 project
(landfill cap, coastal shoring,
public access)
Medium
Prepare land to
support increased
capacity at Port of
Providence.
Upgrade Rail
and Track Cumberland
Upgrade rail in Valley Falls
Yard track 1 and on Mainline
curves (Cumberland). Will
enhance freight and potential
passenger rail service to
minimize speed restrictions.
Low
Improve rail
operations for both
freight and
passenger rail, as well
as potentially reduce
travel times.
Pro
N Carg M Provide
Improve
Terminal Road
Intersection
Providence
Difficult maneuvering for
trucks to access Port of
Providence; reconfigure and
improve intersection
(permanent traffic signal,
utility relocation, truck turning
lanes, integration with railroad
crossing).
Medium
Improve port access
by trucks and
enhance safety and
traffic flow in and
around the Port of
Providence.
Partially funded
Mode Location Funded
Port
Railroad
Railroad
Reconstruct
Roosevelt Ave Pawtucket
Grade Crossings
Reconstruct grade crossing
surfaces in East Providence
from Roosevelt Ave to
Beverage Hill Ave along the
industrial highway
Low $0.35 Improve safety for rail and vehicular traffic.
√
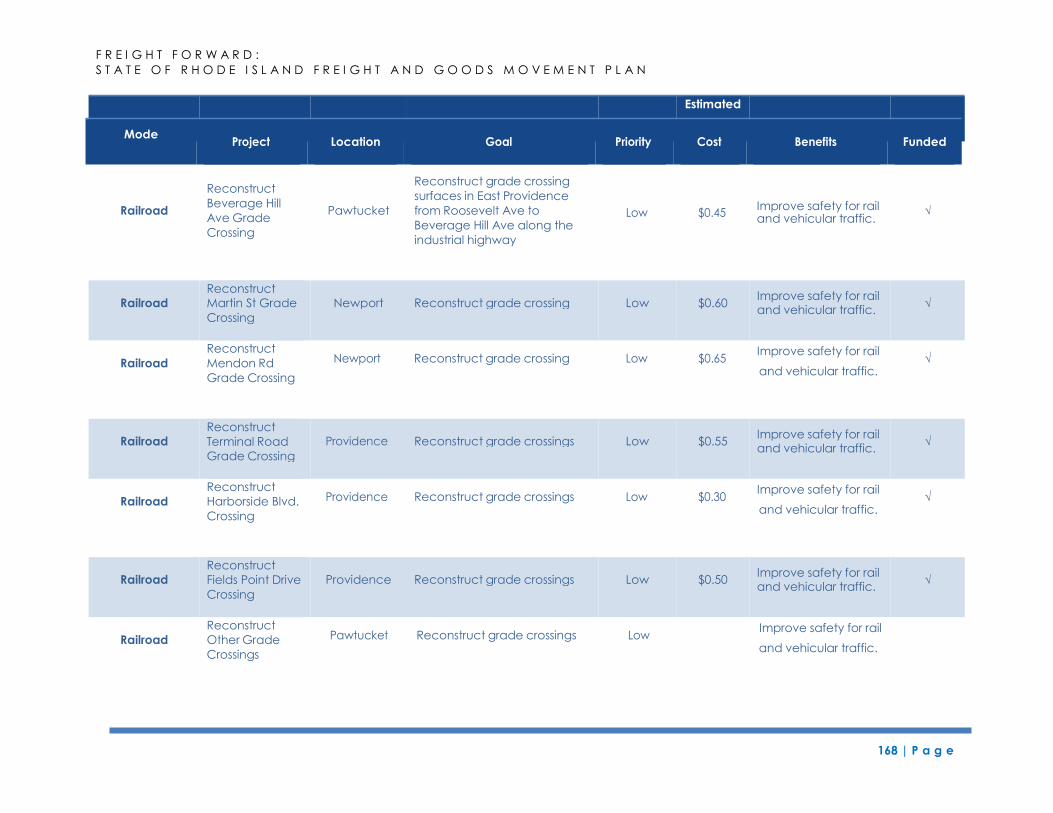
168 | P a g e
F R E I G H T F O R W A R D :
S T A T E O F R H O D E I S L A N D F R E I G H T A N D G O O D S M O V E M E N T P L A N
Estimated
Railroad
Reconstruct
Beverage Hill
Ave Grade
Crossing
Pawtucket
Reconstruct grade crossing
surfaces in East Providence
from Roosevelt Ave to
Beverage Hill Ave along the
industrial highway
Low $0.45 Improve safety for rail and vehicular traffic.
Railroad
Reconstruct
Mendon Rd
Grade Crossing
Newport Reconstruct grade crossing Low $0.65 Improve safety for rail
√ and vehicular traffic.
Railroad
Reconstruct
Harborside Blvd.
Crossing
Providence Reconstruct grade crossings Low $0.30 Improve safety for rail
√ and vehicular traffic.
Railroad
Reconstruct
Other Grade
Crossings
Pawtucket Reconstruct grade crossings Low Improve safety for rail
and vehicular traffic.
Railroad
Reconstruct
Martin St Grade
Crossing
Newport Reconstruct grade crossing Low $0.60 Improve safety for rail and vehicular traffic.
√
Railroad Reconstruct
Terminal Road
Grade Crossing
Reconstruct grade crossings Low $0.55 Improve safety for rail and vehicular traffic.
√
Railroad
Reconstruct
Fields Point Drive
Crossing
Providence Reconstruct grade crossings Low $0.50 Improve safety for rail and vehicular traffic.
√
√
Mode Location Funded
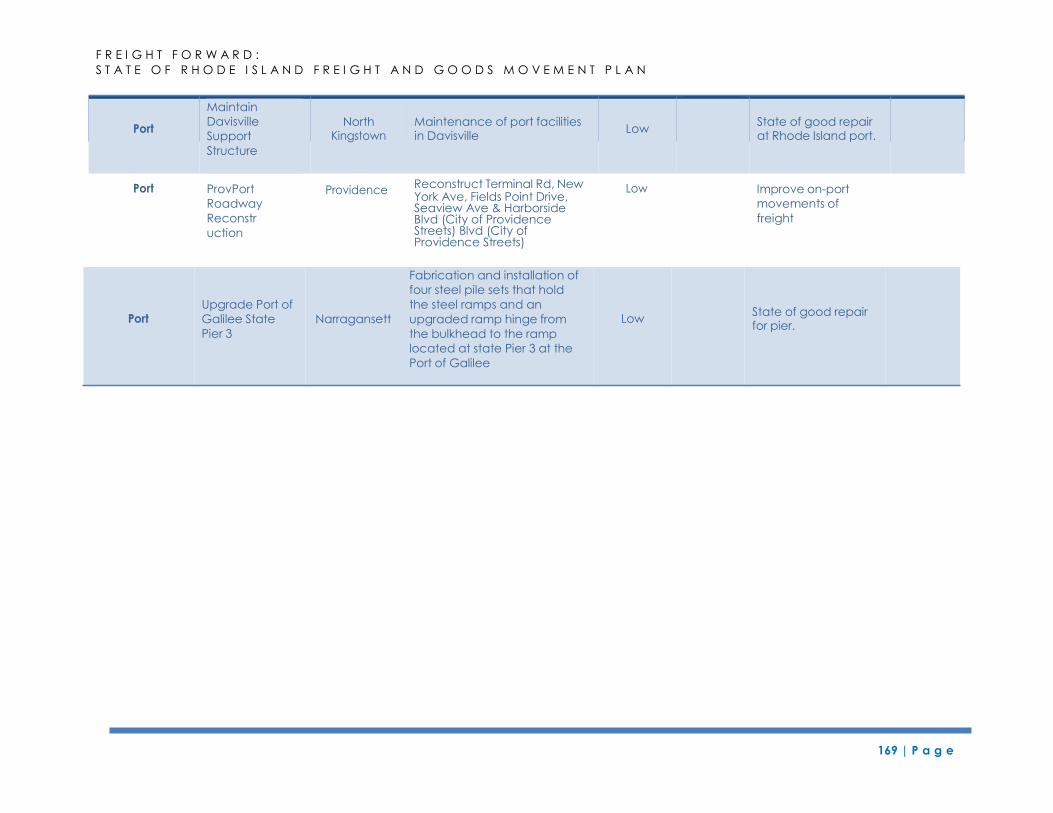
169 | P a g e
F R E I G H T F O R W A R D :
S T A T E O F R H O D E I S L A N D F R E I G H T A N D G O O D S M O V E M E N T P L A N
Estimated
Port ProvPort
Roadway
Reconstr
uction
Providence Reconstruct Terminal Rd, New York Ave, Fields Point Drive, Seaview Ave & Harborside Blvd (City of Providence Streets) Blvd (City of Providence Streets)
Low Improve on-port
movements of
freight
Maintain
Davisville
Support
Structure
North
Maintenance of port facilities in Davisville
Low State of good repair at Rhode Island port.
Upgrade Port of
Galilee State Narragansett
Pier 3
Fabrication and installation of
four steel pile sets that hold
the steel ramps and an
upgraded ramp hinge from
the bulkhead to the ramp
located at state Pier 3 at the
Port of Galilee
Low State of good repair for pier.
F R E I G H T F O R W A R D :
S T A T E O F R H O D E I S L A N D F R E I G H T A N D G O O D S M O V E M E N T P L A N
170 | P a g e
11.2 Freight Policy Recommendations
As part of the freight planning effort, freight policy recommendations were identified
through stakeholder input, best practices of other states, and the review of existing
policies related to freight transportation.
The first step in developing the primary policy recommendations for the freight plan was
to discuss with the FAC steering committee freight considerations of importance to the
state. These ranged from broad issues, such as the acknowledgement that freight and
logistics markets are dynamic, to very specific considerations, such as the importance of
safety at rail grade crossings. These considerations were then categorized into eight
primary policy issues:
1. State Roles & Responsibilities/State of Rhode Island Organization
No single entity in RI has clear responsibility for freight-related activities within
state government today. Leadership and coordination is needed to monitor a
dynamic and global freight market and to partner with the private sector to
adapt our freight network to new opportunities.
2. Limited Freight Transportation Funding
The RhodeWorks program provides much needed funding to maintain highways
and bridges throughout Rhode Island and to support critical freight movements.
However, additional funding is needed to support operations, and to maintain
and reinvest in other modal facilities, and to support growth and expansion of
our freight network. A commitment to identifying critical funding for our network
is needed, whether investment is targeted towards assets in the public, quasi-
public or private domain.
3. Workforce Development
Securing a ready and able workforce to support freight movements is a growing
national and local concern. Increased labor pools are needed to keep pace
with retirements and future growth; particularly in the trucking and longshoremen
industries. Programs to reduce barriers and cost of entry into these careers are
needed.
4. Land Use and Development
Freight-network-accessible development opportunities should be preserved for
future freight related activities, while limiting impacts on existing businesses and
residential areas.
F R E I G H T F O R W A R D :
S T A T E O F R H O D E I S L A N D F R E I G H T A N D G O O D S M O V E M E N T P L A N
171 | P a g e
5. Safety and Enforcement
Safety for Rhode Island’s residents, businesses and visitors is of the highest priority.
Increased freight activity may generate delays and increase conflicts where
modes intersect (e.g. rail crossings). Regulatory policies and enforcement efforts
must adapt to growing traffic, changing vehicles and logistic patterns using new
technology and other techniques.
6. Environment
Many parts of Rhode Island’s freight network pass through or are located in
densely developed urban areas. Additionally, the state takes pride in its open
space, Narragansett Bay and other natural resources. Efforts to reduce the
impacts of freight movement on Rhode Island’s air quality, waterways and
overall environment are critical.
7. Regional Coordination
New England states are affected by freight policy and infrastructure decisions in
neighboring states. Coordination to address problems of shared interest (regional
bottlenecks) and understand the implication of freight policies should be
pursued.
8. Resilience
The uninterrupted movement of goods is important to our economy and quality
of life. Planning is needed to protect freight assets from flooding, storm surges,
sea level rise and cold weather events, and to develop action plans for power
losses or other unforeseen events.
To ensure that the policies are action-oriented, recommendation or actions are
identified for each policy category in the table.
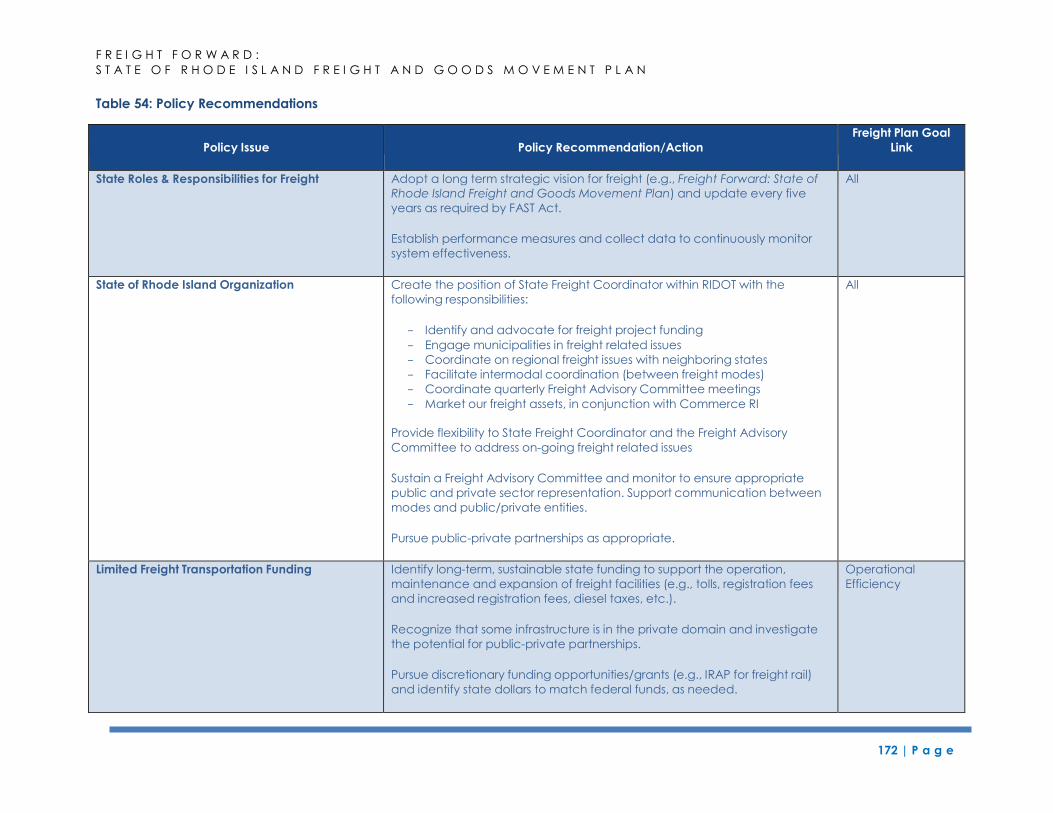
F R E I G H T F O R W A R D :
S T A T E O F R H O D E I S L A N D F R E I G H T A N D G O O D S M O V E M E N T P L A N
Table 54: Policy Recommendations
172 | P a g e
Policy Issue
Policy Recommendation/Action
Freight Plan Goal
Link
State Roles & Responsibilities for Freight Adopt a long term strategic vision for freight (e.g., Freight Forward: State of
Rhode Island Freight and Goods Movement Plan) and update every five
years as required by FAST Act.
Establish performance measures and collect data to continuously monitor
system effectiveness.
All
State of Rhode Island Organization Create the position of State Freight Coordinator within RIDOT with the
following responsibilities:
- Identify and advocate for freight project funding
- Engage municipalities in freight related issues
- Coordinate on regional freight issues with neighboring states
- Facilitate intermodal coordination (between freight modes)
- Coordinate quarterly Freight Advisory Committee meetings
- Market our freight assets, in conjunction with Commerce RI
Provide flexibility to State Freight Coordinator and the Freight Advisory
Committee to address on-going freight related issues
Sustain a Freight Advisory Committee and monitor to ensure appropriate
public and private sector representation. Support communication between
modes and public/private entities.
Pursue public-private partnerships as appropriate.
All
Limited Freight Transportation Funding Identify long-term, sustainable state funding to support the operation,
maintenance and expansion of freight facilities (e.g., tolls, registration fees
and increased registration fees, diesel taxes, etc.).
Recognize that some infrastructure is in the private domain and investigate
the potential for public-private partnerships.
Pursue discretionary funding opportunities/grants (e.g., IRAP for freight rail)
and identify state dollars to match federal funds, as needed.
Operational
Efficiency
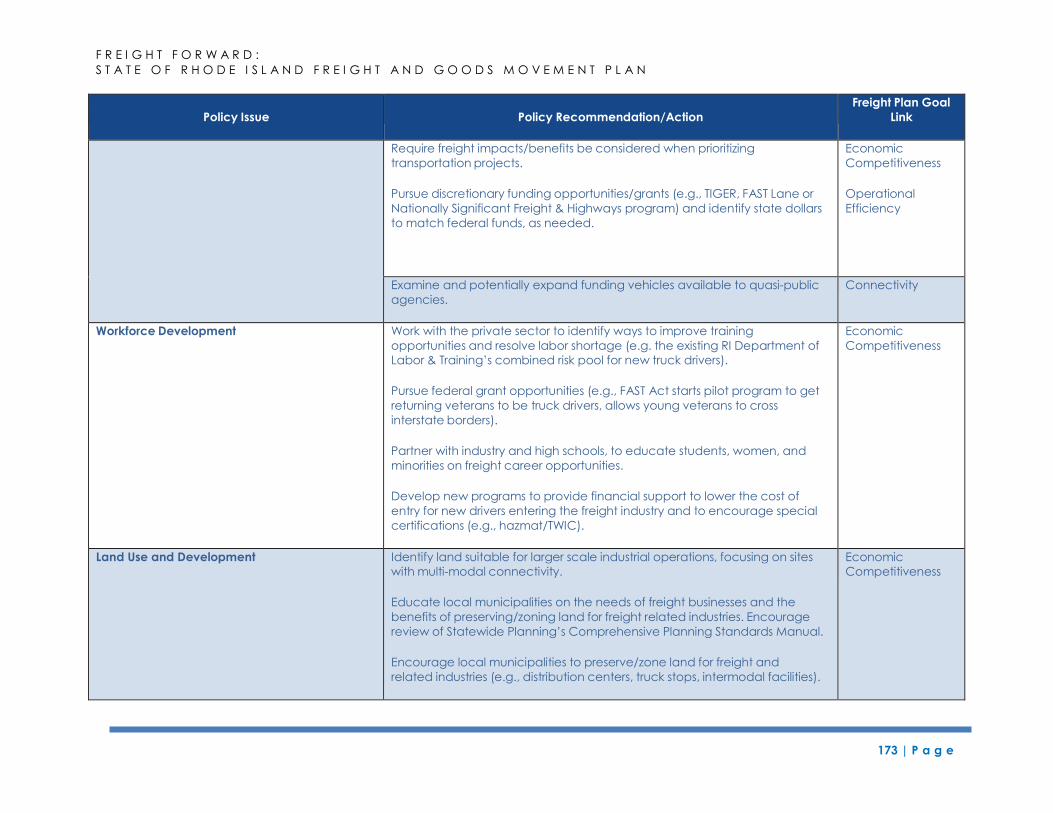
173 | P a g e
F R E I G H T F O R W A R D :
S T A T E O F R H O D E I S L A N D F R E I G H T A N D G O O D S M O V E M E N T P L A N
Policy Issue
Policy Recommendation/Action
Freight Plan Goal
Link
Require freight impacts/benefits be considered when prioritizing
transportation projects.
Pursue discretionary funding opportunities/grants (e.g., TIGER, FAST Lane or
Nationally Significant Freight & Highways program) and identify state dollars
to match federal funds, as needed.
Economic
Competitiveness
Operational
Efficiency
Examine and potentially expand funding vehicles available to quasi-public
agencies.
Connectivity
Workforce Development Work with the private sector to identify ways to improve training
opportunities and resolve labor shortage (e.g. the existing RI Department of
Labor & Training’s combined risk pool for new truck drivers).
Pursue federal grant opportunities (e.g., FAST Act starts pilot program to get
returning veterans to be truck drivers, allows young veterans to cross
interstate borders).
Partner with industry and high schools, to educate students, women, and
minorities on freight career opportunities.
Develop new programs to provide financial support to lower the cost of
entry for new drivers entering the freight industry and to encourage special
certifications (e.g., hazmat/TWIC).
Economic
Competitiveness
Land Use and Development Identify land suitable for larger scale industrial operations, focusing on sites
with multi-modal connectivity.
Educate local municipalities on the needs of freight businesses and the
benefits of preserving/zoning land for freight related industries. Encourage
review of Statewide Planning’s Comprehensive Planning Standards Manual.
Encourage local municipalities to preserve/zone land for freight and
related industries (e.g., distribution centers, truck stops, intermodal facilities).
Economic
Competitiveness
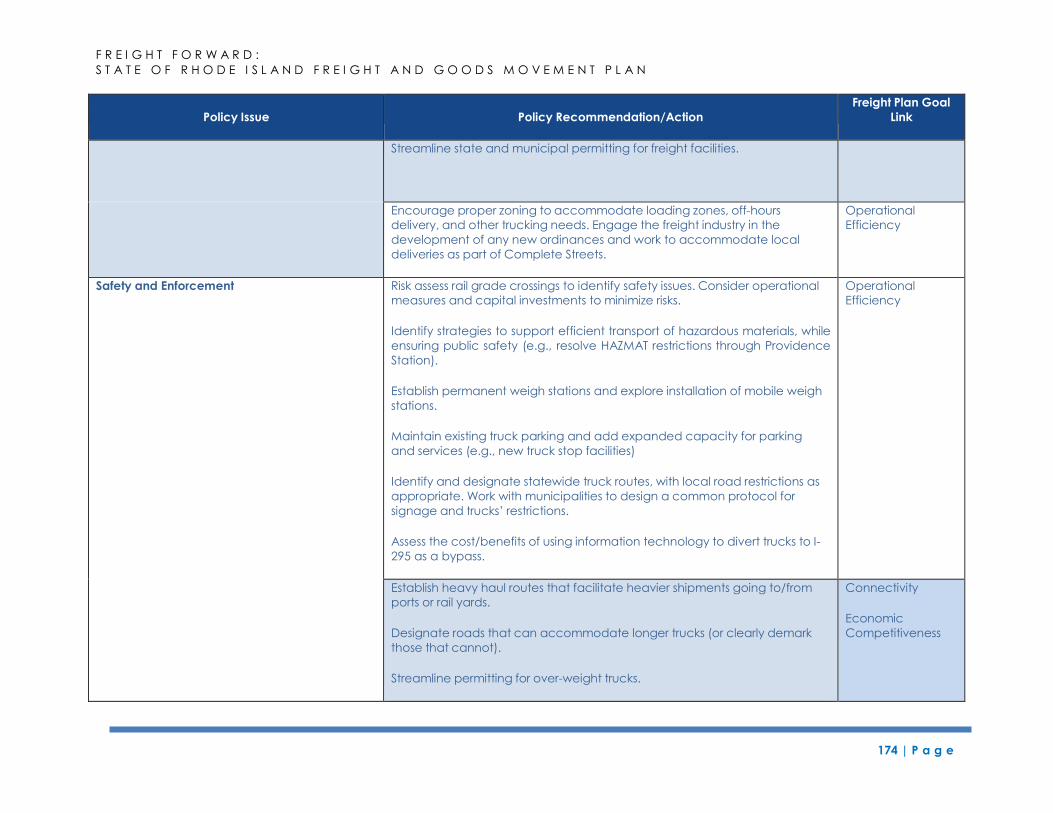
174 | P a g e
F R E I G H T F O R W A R D :
S T A T E O F R H O D E I S L A N D F R E I G H T A N D G O O D S M O V E M E N T P L A N
Policy Issue
Policy Recommendation/Action
Freight Plan Goal
Link
Streamline state and municipal permitting for freight facilities.
Encourage proper zoning to accommodate loading zones, off-hours
delivery, and other trucking needs. Engage the freight industry in the
development of any new ordinances and work to accommodate local
deliveries as part of Complete Streets.
Operational
Efficiency
Safety and Enforcement Risk assess rail grade crossings to identify safety issues. Consider operational
measures and capital investments to minimize risks.
Identify strategies to support efficient transport of hazardous materials, while
ensuring public safety (e.g., resolve HAZMAT restrictions through Providence
Station).
Establish permanent weigh stations and explore installation of mobile weigh
stations.
Maintain existing truck parking and add expanded capacity for parking
and services (e.g., new truck stop facilities)
Identify and designate statewide truck routes, with local road restrictions as
appropriate. Work with municipalities to design a common protocol for
signage and trucks’ restrictions.
Assess the cost/benefits of using information technology to divert trucks to I-
295 as a bypass.
Operational
Efficiency
Establish heavy haul routes that facilitate heavier shipments going to/from
ports or rail yards.
Designate roads that can accommodate longer trucks (or clearly demark
those that cannot).
Streamline permitting for over-weight trucks.
Connectivity
Economic
Competitiveness
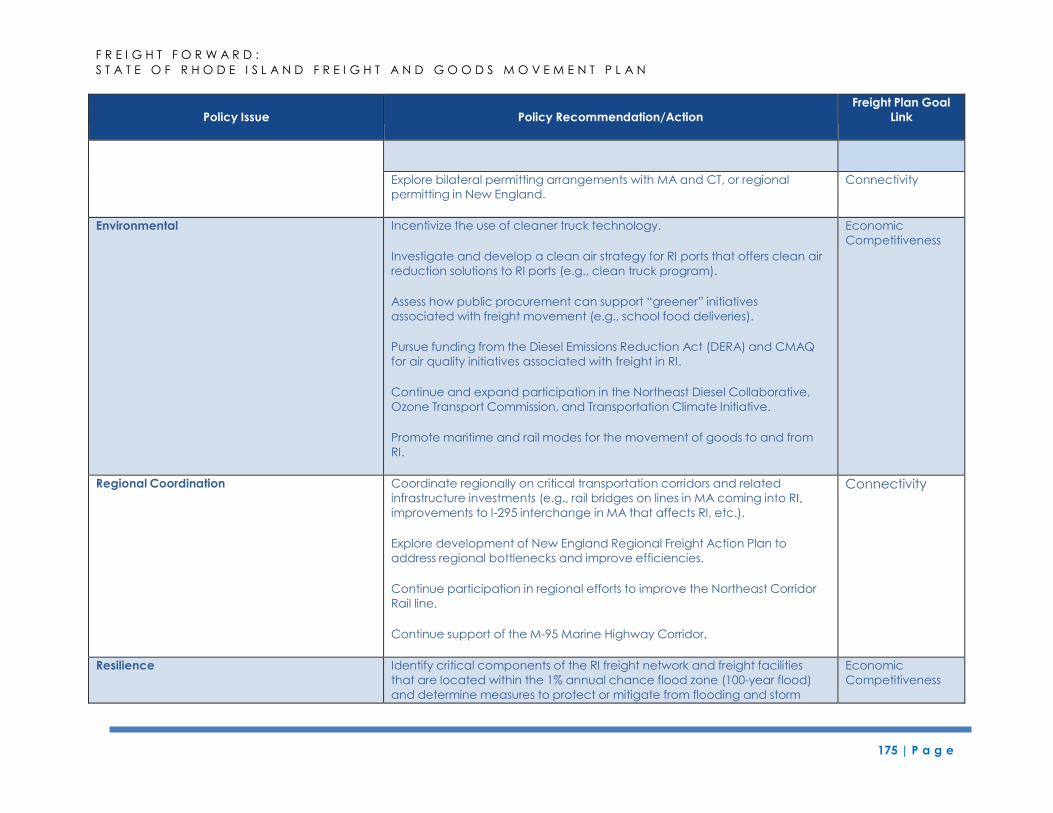
175 | P a g e
F R E I G H T F O R W A R D :
S T A T E O F R H O D E I S L A N D F R E I G H T A N D G O O D S M O V E M E N T P L A N
Policy Issue
Policy Recommendation/Action
Freight Plan Goal
Link
Explore bilateral permitting arrangements with MA and CT, or regional
permitting in New England.
Connectivity
Environmental Incentivize the use of cleaner truck technology.
Investigate and develop a clean air strategy for RI ports that offers clean air
reduction solutions to RI ports (e.g., clean truck program).
Assess how public procurement can support “greener” initiatives
associated with freight movement (e.g., school food deliveries).
Pursue funding from the Diesel Emissions Reduction Act (DERA) and CMAQ
for air quality initiatives associated with freight in RI.
Continue and expand participation in the Northeast Diesel Collaborative,
Ozone Transport Commission, and Transportation Climate Initiative.
Promote maritime and rail modes for the movement of goods to and from
RI.
Economic
Competitiveness
Regional Coordination Coordinate regionally on critical transportation corridors and related
infrastructure investments (e.g., rail bridges on lines in MA coming into RI,
improvements to I-295 interchange in MA that affects RI, etc.).
Explore development of New England Regional Freight Action Plan to
address regional bottlenecks and improve efficiencies.
Continue participation in regional efforts to improve the Northeast Corridor
Rail line.
Continue support of the M-95 Marine Highway Corridor.
Connectivity
Resilience Identify critical components of the RI freight network and freight facilities
that are located within the 1% annual chance flood zone (100-year flood)
and determine measures to protect or mitigate from flooding and storm
Economic
Competitiveness
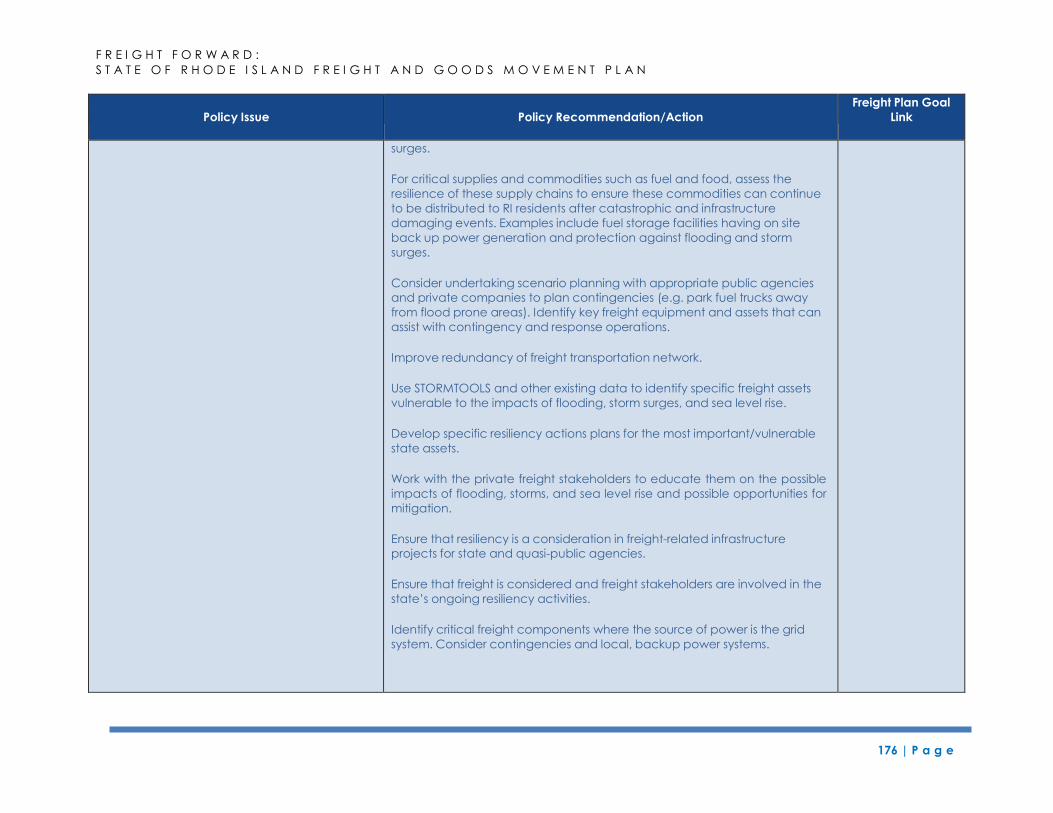
176 | P a g e
F R E I G H T F O R W A R D :
S T A T E O F R H O D E I S L A N D F R E I G H T A N D G O O D S M O V E M E N T P L A N
Policy Issue
Policy Recommendation/Action
Freight Plan Goal
Link
surges.
For critical supplies and commodities such as fuel and food, assess the
resilience of these supply chains to ensure these commodities can continue
to be distributed to RI residents after catastrophic and infrastructure
damaging events. Examples include fuel storage facilities having on site
back up power generation and protection against flooding and storm
surges.
Consider undertaking scenario planning with appropriate public agencies
and private companies to plan contingencies (e.g. park fuel trucks away
from flood prone areas). Identify key freight equipment and assets that can
assist with contingency and response operations.
Improve redundancy of freight transportation network.
Use STORMTOOLS and other existing data to identify specific freight assets
vulnerable to the impacts of flooding, storm surges, and sea level rise.
Develop specific resiliency actions plans for the most important/vulnerable
state assets.
Work with the private freight stakeholders to educate them on the possible
impacts of flooding, storms, and sea level rise and possible opportunities for
mitigation.
Ensure that resiliency is a consideration in freight-related infrastructure
projects for state and quasi-public agencies.
Ensure that freight is considered and freight stakeholders are involved in the
state’s ongoing resiliency activities.
Identify critical freight components where the source of power is the grid
system. Consider contingencies and local, backup power systems.
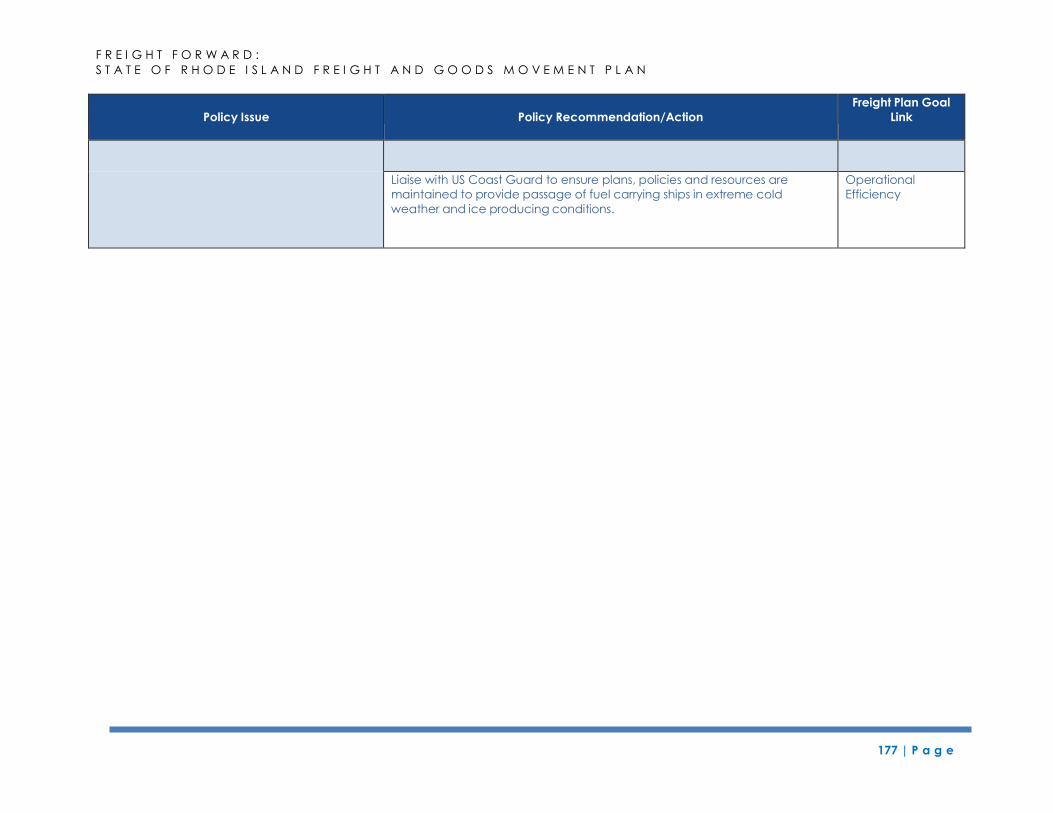
177 | P a g e
F R E I G H T F O R W A R D :
S T A T E O F R H O D E I S L A N D F R E I G H T A N D G O O D S M O V E M E N T P L A N
Policy Issue
Policy Recommendation/Action
Freight Plan Goal
Link
Liaise with US Coast Guard to ensure plans, policies and resources are
maintained to provide passage of fuel carrying ships in extreme cold
weather and ice producing conditions.
Operational
Efficiency
F R E I G H T F O R W A R D :
S T A T E O F R H O D E I S L A N D F R E I G H T A N D G O O D S M O V E M E N T P L A N
178 | P a g e
12 IMPLEMENTATION PLAN
Rhode Island’s economy depends upon the efficient movement of freight to support
industries traditionally reliant on the movement of goods, but also the state’s growing
service economy. Hospitals, educational facilities, and other service-oriented businesses
rely on the freight transportation system to deliver their supplies. Maintaining, improving,
and investing in critical freight infrastructure is necessary to ensure that Rhode Island’s
freight system can: accommodate future growth; improve connectivity and operational
efficiency while becoming safer; and perform with sufficient reliability to meet
the demands and expectations of freight transportation system users.
The ability to meet these goals and objectives is contingent upon the commitment of
the state to develop and implement policies that support the freight transportation
system, as well as adequate funding to support freight transportation facilities. Funding
influences what investments are made and when. Some investments rely strictly on
public funding, while others (e.g., railroads and pipelines) are supported through the
private sector in general. This chapter focuses on the public funding that is available to
support investment in the freight transportation system.
12.1 Project Prioritization
For the freight plan, a project prioritization methodology was designed to support input
from a variety of sources, including Rhode Island Statewide Planning, RIDOT, and the
FAC. At the June public meetings, the identified freight priorities were presented to the
public at large to ensure that no obvious projects were missed during the prioritization
process.
A first step in developing the freight priorities was to identify the freight-related
infrastructure issues throughout the state. Working internally, as well as with the FAC, the
key qualities of each project were discussed as they relate to the state’s freight
planning goals and objectives. Projects were ranked based on their likelihood of
achieving these specific goals and objectives. Projects from all modes of transportation
were discussed to develop the final list of potential investments.
The next step in this process is to determine which projects will be moved forward first
and then conduct additional planning and environmental studies that may be needed
before they can be included in the Statewide Transportation Improvement Plan, if they
are not already included. This will be done through close coordination with the FAC,
RIDOT, and Rhode Island Statewide Planning.
179 | P a g e
F R E I G H T F O R W A R D :
S T A T E O F R H O D E I S L A N D F R E I G H T A N D G O O D S M O V E M E N T P L A N
12.2 Funding Sources
To implement the potential freight investments, identifying funding is critical. Projects
ranking “high” on the priority list are estimated to total hundreds of millions of dollars.
These projects include replacement or repair of deficient ridges, pier upgrades at the
Port of Davisville, the resolution of vertical clearance issues west of Davisville, grade
crossing improvements, roadway access improvements near the Port of Providence,
improvements at T.F. Green to support expanded cargo operations, and other
important, freight-supportive projects.
Each of these projects is important to the movement of freight and to Rhode Island’s
economic competitiveness. The projects identified through the freight planning process
also support operational efficiency, connectivity, and safety for the state’s residents,
businesses, and visitors. Unfortunately, existing state resources are insufficient to support
all of these important freight projects. Rhode Island is working hard to resolve its funding
issues through efforts, such as RhodeWorks. Additional federal resources, increased state
investment and other financing strategies will be required to fully fund these needed
investments.
To maintain momentum in the freight planning process, initial funding for additional
planning and preliminary engineering should be identified. This will position priority
projects to be ready for implementation once funding is identified. In the meantime,
the state has included a fiscally constrained list of projects in this freight plan.
12.2.1 Existing Federal Funding Sources
At the federal level, the main source of funding for transportation projects is the federal
gasoline tax. Other sources include the federal diesel fuel tax, vehicle taxes, air
passenger excise taxes, aviation fuel taxes, and appropriations from the federal
government’s General Fund.
Freight needs are funded primarily through the Highway Account of the federal
Highway Trust Fund. In the last several years, Congress has also authorized transfers from
the General Fund to the Highway Trust Fund to fund public transportation as well as to
help the Highway Trust Fund remain solvent.
FAST Act
The Fixing American’s Surface Transportation Act (FAST Act) is a multi-year surface
transportation program signed by President Obama in December 2015. A key
component of FAST is the establishment of a National Multimodal Freight Policy that
includes national goals to guide decision-making.
The FAST Act creates a new discretionary freight-focused grant program (FASTLANE)
that will invest $4.5 billion over 5 years. The program allows states, Metropolitan Planning
Organizations (MPOs), local governments, tribal governments, special purpose districts
and public authorities (including port authorities), and other parties to apply for funding
to complete projects that improve safety, eliminate freight bottlenecks, and improve
critical freight movements.
180 | P a g e
F R E I G H T F O R W A R D :
S T A T E O F R H O D E I S L A N D F R E I G H T A N D G O O D S M O V E M E N T P L A N
The FAST Act also establishes a National Highway Freight Program, providing $6.3 billion
in formula funds over five years for states to invest in freight projects on the National
Highway Freight Network. Up to 10 percent of these funds may be used for intermodal
projects. From FY2016 through FY20, Rhode Island is expected to receive $34.8 million.
Fuel Taxes
Fuel taxes are the most significant revenue source used to fund transportation at the
federal level. Fuel taxes are collected from all states in the form of federal fuel taxes
and other truck-related taxes. Revenue from these taxes goes to the federal Highway
Trust Fund.
These federal tax rates are flat and are not indexed to inflation; they remain constant
unless the US Congress changes them. The current tax rates on fuel are too low to meet
the long-term needs for service improvements and congestion relief on the federal-aid
highway system. As vehicles become more fuel efficient and drivers are able to go
farther using less fuel, less fuel tax revenues are collected from states, thereby further
putting the Highway Trust Fund at risk of insolvency.
Taxes on tires, truck and trailer sales, and heavy vehicles are levied on oil companies,
tire manufacturers, truck and trailer retailers, and the owners of heavy vehicles.
Highway users, including operators of freight vehicles, generally pay these types of
taxes indirectly because the taxes become part of the purchase price of the taxed
items.
Highway Safety Improvement Program (HSIP)
The HSIP provides funding to strategies, activities, and projects that are intended to
support a reduction in traffic fatalities on all public roads, including non-state-owned
public roads. To obtain HSIP funding, the strategy, activity, or project must address a
hazardous road location or highway safety problem and be consistent with a State
Strategic Highway Safety Plan. Truck parking facilities are also eligible for funding in this
program under section 1401 of MAP-21.
The Section 130 program provides federal support to minimize the incidence of
accidents, injuries, and fatalities at public rail/highway crossings. States can use the
funds to improve rail crossings. Investments may include the installation or upgrade of
warning devices or surface improvements, elimination of at-grade crossings through
grade separation, or consolidation/closing of existing crossings. The federal share is 90
percent for these funds, and states, railroads, or municipalities provide the remaining 10
percent as match. MAP-21 sets aside $220 million annually from the Highway Safety
181 | P a g e
F R E I G H T F O R W A R D :
S T A T E O F R H O D E I S L A N D F R E I G H T A N D G O O D S M O V E M E N T P L A N
Improvement Program (HSIP) to fund this program. The FAST Act newly authorizes an
annual set-aside (prior to apportionment) of $3.5 million in HSIP funds to carry out
specified safety-related activities and operate specified safety-related
clearinghouses113.
Surface Transportation Block Grant Program (STBGP)
The STBGP provides funding to projects that preserve and improve the conditions and
performance on any federal-aid highway, bridge, or tunnel or any public road. Many
types of projects can be funded under this program. They include: truck parking
facilities; infrastructure based Intelligent Transportation System capital investments;
development and establishment of management systems; replacement, rehabilitation,
preservation, protection and anti-icing/de-icing for bridges and tunnels or any public
road, including construction or reconstruction necessary to accommodate other
modes.
National Highway Performance Program (NHPP)
The NHPP provides funding for projects that help to maintain or improve the condition
and performance of the National Highway System. Only projects that directly impact
the National Highway System are eligible to receive funding from this program.
Congestion Mitigation and Air Quality Improvement Program (CMAQ)
CMAQ was implemented to support projects that contributed to air quality
improvements and congestion relief. MAP-21 included support of projects that are
associated with electric vehicle charging stations and natural gas fueling stations.
Transportation Investment Generating Economic Recovery Program (TIGER)
The federal TIGER program was initiated in 2009 and has been providing funding each
year since. TIGER funding supports surface transportation investment, including freight
projects. TIGER is highly competitive and there are many more applications than there
are projects that are funded.
Airport Improvement Program (AIP)
The Airport Improvement Program (AIP) provides grants to public agencies and,
occasionally to private owners and entities, for planning and developing public use
airports that are included in the National Plan of Integrated Airport Systems (NPIAS).
Eligible projects include improvements related to enhancing airport safety, capacity,
113 https://www.fhwa.dot.gov/fastact/factsheets/hsipfs.pdf.
182 | P a g e
F R E I G H T F O R W A R D :
S T A T E O F R H O D E I S L A N D F R E I G H T A N D G O O D S M O V E M E N T P L A N
security, and environmental concerns. Sponsors can generally use AIP funds on most
airfield capital improvements or repairs and in some specific situations for terminals,
hangars, and non-aviation development. Projects related to airport operations and
revenue-generating improvements are typically not eligible for funding (FAA 2015).
Other Federal Programs
There are a number of programs that may also support transportation investments. They
are included below.
US Department of Commerce, Economic Development Administration: The US
Department of Commerce provides Economic Development Administration
(EDA) grants for projects that promote job retention or creation in economically
distressed industrial areas. Eligible projects must be located within EDA-
designated redevelopment areas or economic development centers. Eligible rail
projects include construction of rail sidings and industrial spurs as well as disaster
recovery grants. Grant assistance is generally available for up to 50 percent of
the project cost, although EDA can provide up to 80 percent for projects in
severely depressed areas.
US Department of Agriculture Programs: This agency provides grant or loan
funding mechanisms to fund construction, extension, enlargement, or
improvement of community facilities providing essential services in rural areas
and towns. Grant assistance is available for up to 75 percent of the project cost.
Eligible rail-related facilities include community transportation infrastructure for
municipal docks and industrial parks.
US Environmental Protection Agency: Funding is available for environmental
remediation at Brownfield and other industrial sites where contaminants and
other pollutants might be present, including properties once owned by railroads.
Community Development Block Grant Program (CDBG) Program: Operated
through the US Department of Housing and Urban Development (HUD).
Other federal programs exist and may be available to fund freight transportation
projects in Rhode Island. They include Projects of National or Regional Significance
(PNRS) and programs under the Transportation Infrastructure, Finance, and Innovation
Act (TIFIA).
PNRS: Surface transportation projects that qualify for US Code Title 23 funds and
are of national or regional importance are eligible for funding under the PNRS.
This program seeks to improve economic productivity, facilitate international
trade, relieve congestion, and enhance movement of passengers and freight.
Similar to the TIGER Program, PNRS funding levels, cycle frequency, and criteria
are not reliable for long-term fiscal planning
TIFIA Program: This program provides credit assistance for nationally or regionally
significant surface transportation projects. This assistance includes loans, loan
guarantees, and lines of credit.
Some port oriented funding programs include:
183 | P a g e
F R E I G H T F O R W A R D :
S T A T E O F R H O D E I S L A N D F R E I G H T A N D G O O D S M O V E M E N T P L A N
Port Security Grant Program (PSG): This program supports maritime transportation
infrastructure security activities and is one option available to strengthen the
nation’s critical infrastructure against risks associated with potential terrorist
attacks. Most US maritime critical infrastructure is owned and/or operated by
state, local, and private sector maritime industry partners. PSGP funds are
available to these entities and are intended to improve port-wide maritime
security risk management; enhance maritime domain awareness; support
maritime security training and exercises; and to maintain or reestablish maritime
security mitigation protocols that support port recovery and resiliency
capabilities. PSGP investments must address Coast Guard identified
vulnerabilities in port security and support the prevention, detection, response,
and/or recovery from attacks involving improvised explosive devices (IED) and
other non-conventional weapons.
Diesel Emissions Reduction Act Grants (DERA): The US Environmental Protection
Agency solicits proposals that achieve significant reductions in diesel emissions in
terms of tons of pollution produced by diesel engines and diesel emissions
exposure, from fleets operating at marine and inland water ports, called DERA
grants. Eligible diesel emission reduction solutions include verified emission control
technologies such as exhaust controls and engine upgrades, verified idle
reduction technologies, certified engine repowers, and/or certified vehicle or
equipment replacement. Eligible diesel vehicles, engines and equipment may
include drayage trucks, marine engines, locomotives and non-road engines,
equipment or vehicles used in handling of cargo at a marine or inland water port.
This program is for public port authorities with jurisdiction over transportation or
air quality at a marine or inland water port, and only they are eligible to apply.
12.2.2 Existing Freight Revenue Sources – State
RhodeWorks is a comprehensive transportation funding plan paired with RIDOT’s 10-
year investment plan. On element of the plan relates to truck tolling, which will improve
the state’s deteriorating bridges and roads. The plan levies tolls on large, commercial
trucks and will provide funding to repair more than 150 structurally deficient bridges. The
funding will also support repair of another 500 bridges to prevent them from becoming
deficient. These efforts will bring 90 percent of the state’s bridges into structural
sufficiency by 2024.114
114 http://www.dot.ri.gov/news/rhodeworks.php.
184 | P a g e
F R E I G H T F O R W A R D :
S T A T E O F R H O D E I S L A N D F R E I G H T A N D G O O D S M O V E M E N T P L A N
12.2.3 Fiscally Constrained Projects
Per FAST Act guidance, a freight plan should include a fiscally constrained list of
projects and describe how formula funds available under the new National Highway
Freight Program would be invested and matched.
Rhode Island will invest the National Highway Freight Program formula funds primarily in
the reconstruction and rehabilitation of key bridges on Interstates 95 and 295, Route
146, and over rail lines. A small portion of the funds will be invested in traffic safety
improvements in the state. The table below presents the complete list of fiscally
constrained freight projects identified through the freight planning process. It was
developed based on the current draft FY2017-FY2025 TIP, input from the Freight
Advisory Committee, and the RhodeWorks effort. If partial funding is available, it is also
indicated in the below.
The match for the freight formula funds will come from the Rhode Island Capital Plan,
Rhode Island Highway Maintenance Account, proceeds from the IWay land sales, and
funds set aside for project closeouts.
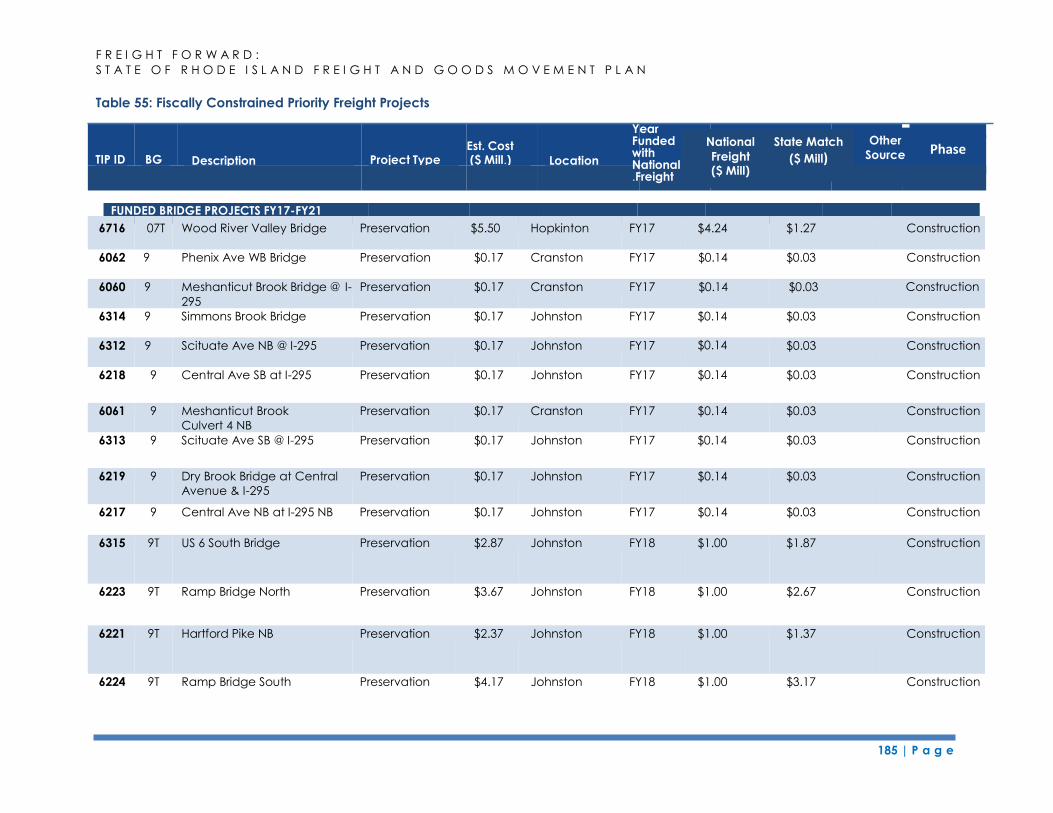
F R E I G H T F O R W A R D :
S T A T E O F R H O D E I S L A N D F R E I G H T A N D G O O D S M O V E M E N T P L A N
185 | P a g e
FUNDED BRIDGE PROJECTS FY17-FY21
Table 55: Fiscally Constrained Priority Freight Projects
6716 07T Wood River Valley Bridge Preservation $5.50 Hopkinton FY17 $4.24 $1.27 Construction
6062 9 Phenix Ave WB Bridge Preservation $0.17 Cranston FY17 $0.14 $0.03 Construction
6060 9 Meshanticut Brook Bridge @ I-
295
Preservation $0.17 Cranston FY17 $0.14 $0.03 Toll
credits
$0.03
Construction
6314 9 Simmons Brook Bridge Preservation $0.17 Johnston FY17 $0.14 $0.03 Construction
6312 9 Scituate Ave NB @ I-295 Preservation $0.17 Johnston FY17 $0.14 $0.03 Construction
6218 9 Central Ave SB at I-295 Preservation $0.17 Johnston FY17 $0.14 $0.03 Construction
6061 9 Meshanticut Brook
Culvert 4 NB
Preservation $0.17 Cranston FY17 $0.14 $0.03 Construction
6313 9 Scituate Ave SB @ I-295 Preservation $0.17 Johnston FY17 $0.14 $0.03 Construction
6219 9 Dry Brook Bridge at Central
Avenue & I-295
Preservation $0.17 Johnston FY17 $0.14 $0.03 Construction
6217 9 Central Ave NB at I-295 NB Preservation $0.17 Johnston FY17 $0.14 $0.03 Construction
6315 9T US 6 South Bridge Preservation $2.87 Johnston FY18 $1.00 $1.87 Construction
6223 9T Ramp Bridge North Preservation $3.67 Johnston FY18 $1.00 $2.67 Construction
6221 9T Hartford Pike NB Preservation $2.37 Johnston FY18 $1.00 $1.37 Construction
6224 9T Ramp Bridge South Preservation $4.17 Johnston FY18 $1.00 $3.17 Construction
Phase Other
Source National
Freight ($ Mill)
State Match
($ Mill) TIP ID BG Description
Est. Cost Project Type ($ Mill.) Location
Year Funded with National.Freight
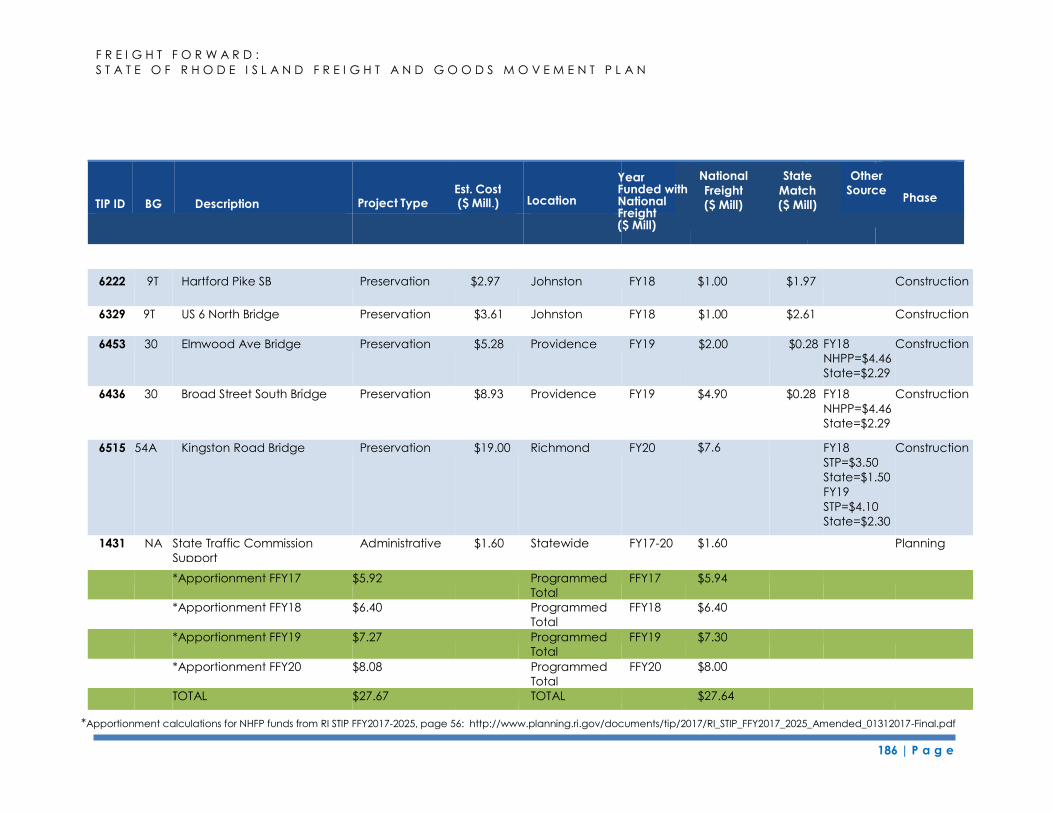
186 | P a g e
F R E I G H T F O R W A R D :
S T A T E O F R H O D E I S L A N D F R E I G H T A N D G O O D S M O V E M E N T P L A N
Primary
Road Est. Cost Primary
6222 9T Hartford Pike SB Preservation $2.97 Johnston FY18 $1.00 $1.97 Construction
6329 9T US 6 North Bridge Preservation $3.61 Johnston FY18 $1.00 $2.61 Construction
6453 30 Elmwood Ave Bridge Preservation $5.28 Providence FY19 $2.00 $0.03 Toll
credits
$0.28 $0.03 Toll
credits
FY18
NHPP=$4.46
State=$2.29
Construction
6436 30 Broad Street South Bridge Preservation $8.93 Providence FY19 $4.90 $0.28 FY18
NHPP=$4.46
State=$2.29
Construction
6515 54A Kingston Road Bridge Preservation $19.00 Richmond FY20 $7.6 FY18
STP=$3.50
State=$1.50
FY19
STP=$4.10
State=$2.30
Construction
1431 NA State Traffic Commission
Support
Administrative $1.60 Statewide FY17-20 $1.60 Planning
*Apportionment FFY17 $5.92 Programmed
Total
FFY17 $5.94
*Apportionment FFY18 $6.40 Programmed
Total
FFY18 $6.40
*Apportionment FFY19 $7.27 Programmed
Total
FFY19 $7.30
*Apportionment FFY20 $8.08 Programmed
Total
FFY20 $8.00
TOTAL $27.67 TOTAL $27.64
*Apportionment calculations for NHFP funds from RI STIP FFY2017-2025, page 56: http://www.planning.ri.gov/documents/tip/2017/RI_STIP_FFY2017_2025_Amended_01312017-Final.pdf
Phase
Other
Source
National
Freight
($ Mill)
State
Match
($ Mill) TIP ID BG Description
Est. Cost Project Type ($ Mill.) Location
Year Funded with National Freight ($ Mill)
F R E I G H T F O R W A R D :
S T A T E O F R H O D E I S L A N D F R E I G H T A N D G O O D S M O V E M E N T P L A N
192 | P a g e
12.3 Policies and Strategies
To continue to address the freight transportation system in the state, a number of
policies and strategies should progress. First and foremost, and building on this freight
plan, the state should continue to work toward enhancing and updating its long term
strategic vision for freight. Creating the position of State Freight Coordinator within
RIDOT is an important first step. Continued engagement with the existing Freight
Advisory Committee will also ensure that freight is kept in the forefront with respect to
state policies. Close coordination between this individual and the FAC will also ensure
that freight needs and potential investments are well understood and efforts continue
to be made to address both.
Close communication between the Coordinator and FAC will also help identify any
potential public-private partnerships or opportunities to obtain funding from the federal
government to support freight transportation in the state. In addition, it remains critical
that long-term, sustainable state funding to support the operation and maintenance of
freight facilities must be identified.
To ensure that the state’s investment in freight is resulting in improved operational
efficiency, connectivity, and safety, performance measures should continue to be
updated between freight plans. The state will also make efforts to encourage industrial
development to support freight by encouraging local municipalities to preserve/zone
land for freight and related industries (e.g., distribution centers, truck stops, intermodal
facilities). As needed, streamlining the state and municipal permitting process for freight
facilities will also be encouraged, along with proper zoning to accommodate off-ours
delivery or other trucking needs as required.
Maintaining existing truck parking and adding expanded capacity for parking and
services (e.g., new truck stop facilities) will continue to be important to ensure safe and
efficient truck transport. The state may also consider establishing heavy haul routes that
facilitate heavier shipments going to/from ports or rail yards and/or designating roads
that can accommodate longer trucks (or clearly demark those that cannot).
Permanent weigh stations are also being considered.
Because Rhode Island is one state in a relatively small region, exploring regional freight
policies to improve freight flow through New England should be continued and
expanded. This may involve permitting or coordination with respect to freight rail
improvements or continued support of the marine highway. These, and other, regional
efforts should continue to be identified and progressed.
12.4 Partnerships and Stakeholders
The State of Rhode Island has a long history of involving its residents, businesses, and
other stakeholders in projects and policies related to the state’s transportation system.
Public meetings are expected for major decisions affecting the state and provide an
opportunity to solicit important input from the public at large.
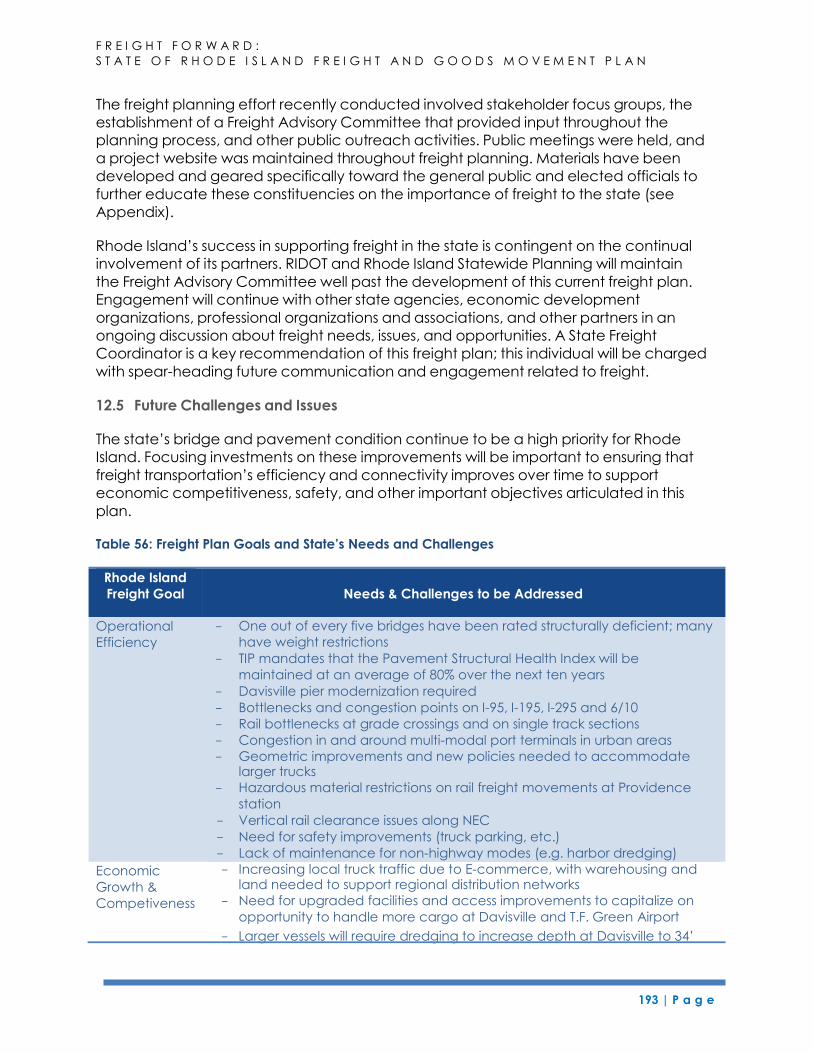
F R E I G H T F O R W A R D :
S T A T E O F R H O D E I S L A N D F R E I G H T A N D G O O D S M O V E M E N T P L A N
193 | P a g e
The freight planning effort recently conducted involved stakeholder focus groups, the
establishment of a Freight Advisory Committee that provided input throughout the
planning process, and other public outreach activities. Public meetings were held, and
a project website was maintained throughout freight planning. Materials have been
developed and geared specifically toward the general public and elected officials to
further educate these constituencies on the importance of freight to the state (see
Appendix).
Rhode Island’s success in supporting freight in the state is contingent on the continual
involvement of its partners. RIDOT and Rhode Island Statewide Planning will maintain
the Freight Advisory Committee well past the development of this current freight plan.
Engagement will continue with other state agencies, economic development
organizations, professional organizations and associations, and other partners in an
ongoing discussion about freight needs, issues, and opportunities. A State Freight
Coordinator is a key recommendation of this freight plan; this individual will be charged
with spear-heading future communication and engagement related to freight.
12.5 Future Challenges and Issues
The state’s bridge and pavement condition continue to be a high priority for Rhode
Island. Focusing investments on these improvements will be important to ensuring that
freight transportation’s efficiency and connectivity improves over time to support
economic competitiveness, safety, and other important objectives articulated in this
plan.
Table 56: Freight Plan Goals and State’s Needs and Challenges
Rhode Island
Freight Goal Needs & Challenges to be Addressed
Operational
Efficiency
Economic
Growth &
Competiveness
- One out of every five bridges have been rated structurally deficient; many
have weight restrictions
- TIP mandates that the Pavement Structural Health Index will be
maintained at an average of 80% over the next ten years
- Davisville pier modernization required
- Bottlenecks and congestion points on I-95, I-195, I-295 and 6/10
- Rail bottlenecks at grade crossings and on single track sections
- Congestion in and around multi-modal port terminals in urban areas
- Geometric improvements and new policies needed to accommodate larger trucks
- Hazardous material restrictions on rail freight movements at Providence
station
- Vertical rail clearance issues along NEC
- Need for safety improvements (truck parking, etc.)
- Lack of maintenance for non-highway modes (e.g. harbor dredging)
- Increasing local truck traffic due to E-commerce, with warehousing and land needed to support regional distribution networks
- Need for upgraded facilities and access improvements to capitalize on
opportunity to handle more cargo at Davisville and T.F. Green Airport
- Larger vessels will require dredging to increase depth at Davisville to 34’
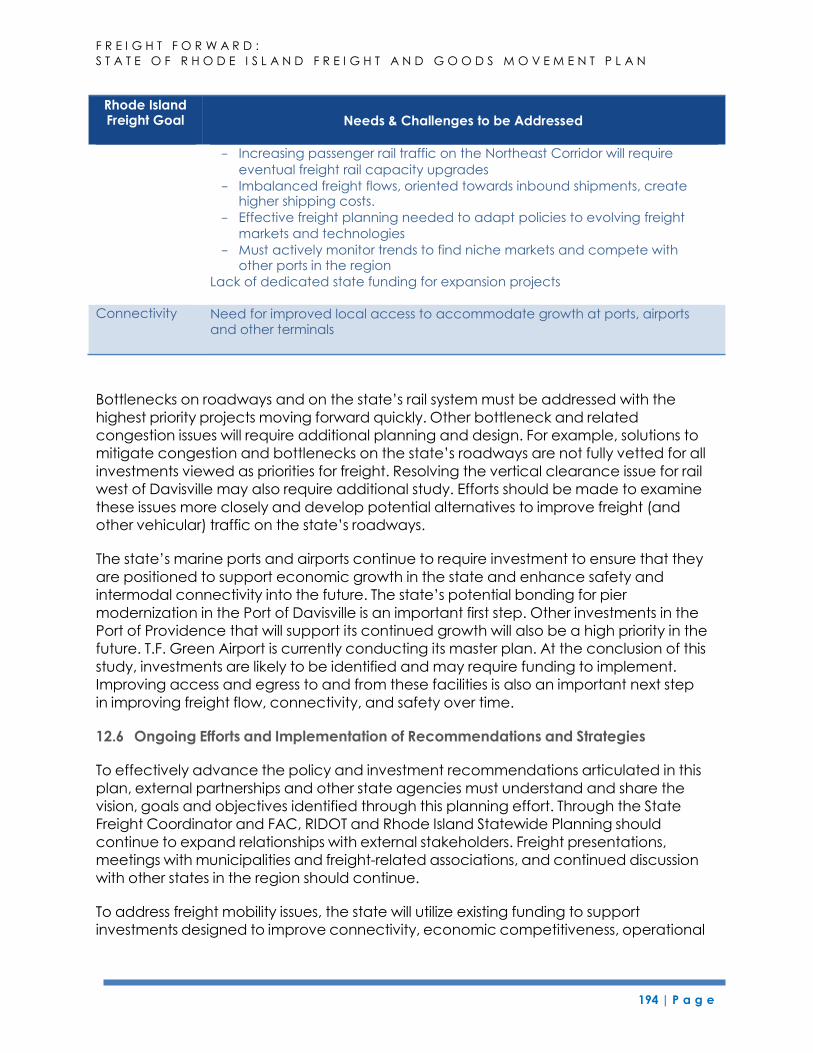
F R E I G H T F O R W A R D :
S T A T E O F R H O D E I S L A N D F R E I G H T A N D G O O D S M O V E M E N T P L A N
194 | P a g e
- Increasing passenger rail traffic on the Northeast Corridor will require
eventual freight rail capacity upgrades
- Imbalanced freight flows, oriented towards inbound shipments, create higher shipping costs.
- Effective freight planning needed to adapt policies to evolving freight
markets and technologies
- Must actively monitor trends to find niche markets and compete with other ports in the region
Lack of dedicated state funding for expansion projects
Bottlenecks on roadways and on the state’s rail system must be addressed with the
highest priority projects moving forward quickly. Other bottleneck and related
congestion issues will require additional planning and design. For example, solutions to
mitigate congestion and bottlenecks on the state’s roadways are not fully vetted for all
investments viewed as priorities for freight. Resolving the vertical clearance issue for rail
west of Davisville may also require additional study. Efforts should be made to examine
these issues more closely and develop potential alternatives to improve freight (and
other vehicular) traffic on the state’s roadways.
The state’s marine ports and airports continue to require investment to ensure that they
are positioned to support economic growth in the state and enhance safety and
intermodal connectivity into the future. The state’s potential bonding for pier
modernization in the Port of Davisville is an important first step. Other investments in the
Port of Providence that will support its continued growth will also be a high priority in the
future. T.F. Green Airport is currently conducting its master plan. At the conclusion of this
study, investments are likely to be identified and may require funding to implement.
Improving access and egress to and from these facilities is also an important next step
in improving freight flow, connectivity, and safety over time.
12.6 Ongoing Efforts and Implementation of Recommendations and Strategies
To effectively advance the policy and investment recommendations articulated in this
plan, external partnerships and other state agencies must understand and share the
vision, goals and objectives identified through this planning effort. Through the State
Freight Coordinator and FAC, RIDOT and Rhode Island Statewide Planning should
continue to expand relationships with external stakeholders. Freight presentations,
meetings with municipalities and freight-related associations, and continued discussion
with other states in the region should continue.
To address freight mobility issues, the state will utilize existing funding to support
investments designed to improve connectivity, economic competitiveness, operational
Rhode Island Freight Goal Needs & Challenges to be Addressed
Connectivity Need for improved local access to accommodate growth at ports, airports and other terminals
F R E I G H T F O R W A R D :
S T A T E O F R H O D E I S L A N D F R E I G H T A N D G O O D S M O V E M E N T P L A N
195 | P a g e
efficiency and related objectives, such as safety improvement. The state’s strong focus
on transportation through its RhodeWorks and recent related efforts will continue. This
will help freight remain in the public domain as an important issue to the State of Rhode
Island. These efforts will also identify future sustainable funding for important freight
investments, as well as support the continued maintenance of transportation assets in
Rhode Island. Along with RhodeWorks, federal discretionary grant programs will be
pursued to augment formula-based funding. Opportunities for public-private
partnerships will also be identified and pursued.
The state plans to further support its freight transportation system by:
Continuing to engage its Freight Advisory Committee after the freight plan is
complete;
Updating the freight plan every five years, consistent with the FAST Act
expectations related to freight planning;
Establishing a dedicated State Freight Coordinator within RIDOT who would be
responsible for updating the freight plan, coordinating the FAC, and generally
serving as the liaison between the public, stakeholders, and the State of Rhode
Island regarding freight transportation issues;
Monitoring freight performance measures to determine whether investments are
impacting freight transportation performance; and
Continuing efforts toward implementing RhodeWorks to ensure that the state is
funding its infrastructure adequately, and efficiency, connectivity, safety,
economic competitiveness, and other important objectives continue to be
supported.
12.7 Conclusion
The Rhode Island Statewide Freight Plan identifies infrastructure projects and policies
that will improve freight movement in the state and support the state’s overall
economy. It also raises the profile of freight in the state, educating the public, elected
officials, and others who are not part of the freight industry, about freight’s importance
in moving goods into, out of and within Rhode Island. Finally, the plan satisfies federal
requirements and positions the state for additional financial resources to support Rhode
Island’s freight infrastructure.
The plan is based on data for all modes of freight transportation, as well as information
related to the economy and population of Rhode Island. The data are enhanced with
information obtained through a rigorous stakeholder-input process that included
monthly Freight Advisory Committee meetings, interviews with public and private
officials interested in Rhode Island’s freight system, and other public outreach efforts.
This plan is the first freight plan developed by the State of Rhode Island and represents
one step in a longer journey to improve the state’s freight system. Federal requirements
call for an updated freight plan within five years, and the state will continue to work
with the FAC and other stakeholders to identify projects of importance to the freight
infrastructure, policies that support freight movement, and other issues that are critical
to Rhode Island and its freight transportation system.