Embed Size (px)
Citation preview
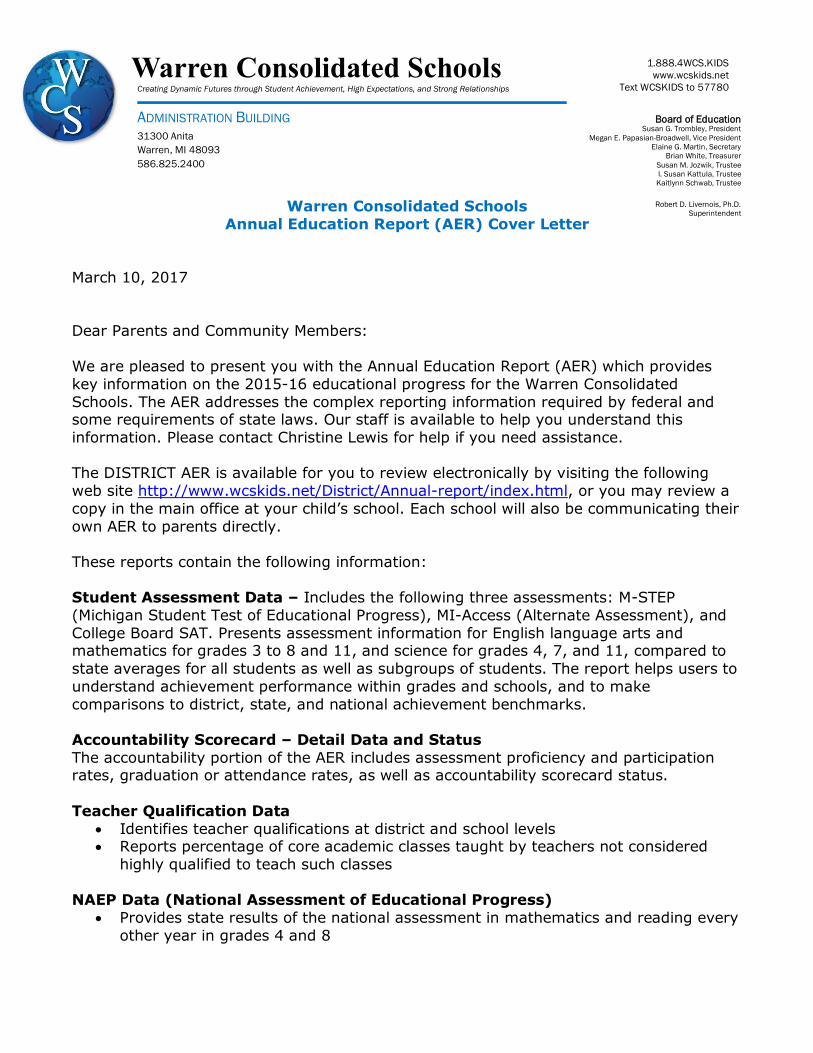
Warren Consolidated Schools
Annual Education Report (AER) Cover Letter
March 10, 2017
Dear Parents and Community Members:
We are pleased to present you with the Annual Education Report (AER) which provides
key information on the 2015-16 educational progress for the Warren Consolidated
Schools. The AER addresses the complex reporting information required by federal and some requirements of state laws. Our staff is available to help you understand this
information. Please contact Christine Lewis for help if you need assistance.
The DISTRICT AER is available for you to review electronically by visiting the following
web site http://www.wcskids.net/District/Annual-report/index.html, or you may review a
copy in the main office at your child’s school. Each school will also be communicating their
own AER to parents directly.
These reports contain the following information:
Student Assessment Data – Includes the following three assessments: M-STEP
(Michigan Student Test of Educational Progress), MI-Access (Alternate Assessment), and
College Board SAT. Presents assessment information for English language arts and mathematics for grades 3 to 8 and 11, and science for grades 4, 7, and 11, compared to
state averages for all students as well as subgroups of students. The report helps users to
understand achievement performance within grades and schools, and to make
comparisons to district, state, and national achievement benchmarks.
Accountability Scorecard – Detail Data and Status
The accountability portion of the AER includes assessment proficiency and participation rates, graduation or attendance rates, as well as accountability scorecard status.
Teacher Qualification Data
Identifies teacher qualifications at district and school levels Reports percentage of core academic classes taught by teachers not considered
highly qualified to teach such classes
NAEP Data (National Assessment of Educational Progress)
Provides state results of the national assessment in mathematics and reading every
other year in grades 4 and 8
Board of Education Susan G. Trombley, President
Megan E. Papasian-Broadwell, Vice President Elaine G. Martin, Secretary
Brian White, Treasurer
Susan M. Jozwik, Trustee I. Susan Kattula, Trustee Kaitlynn Schwab, Trustee
Robert D. Livernois, Ph.D.
Superintendent
ADMINISTRATION BUILDING 31300 Anita
Warren, MI 48093
586.825.2400
Warren Consolidated Schools Creating Dynamic Futures through Student Achievement, High Expectations, and Strong Relationships
1.888.4WCS.KIDS
www.wcskids.net
Text WCSKIDS to 57780
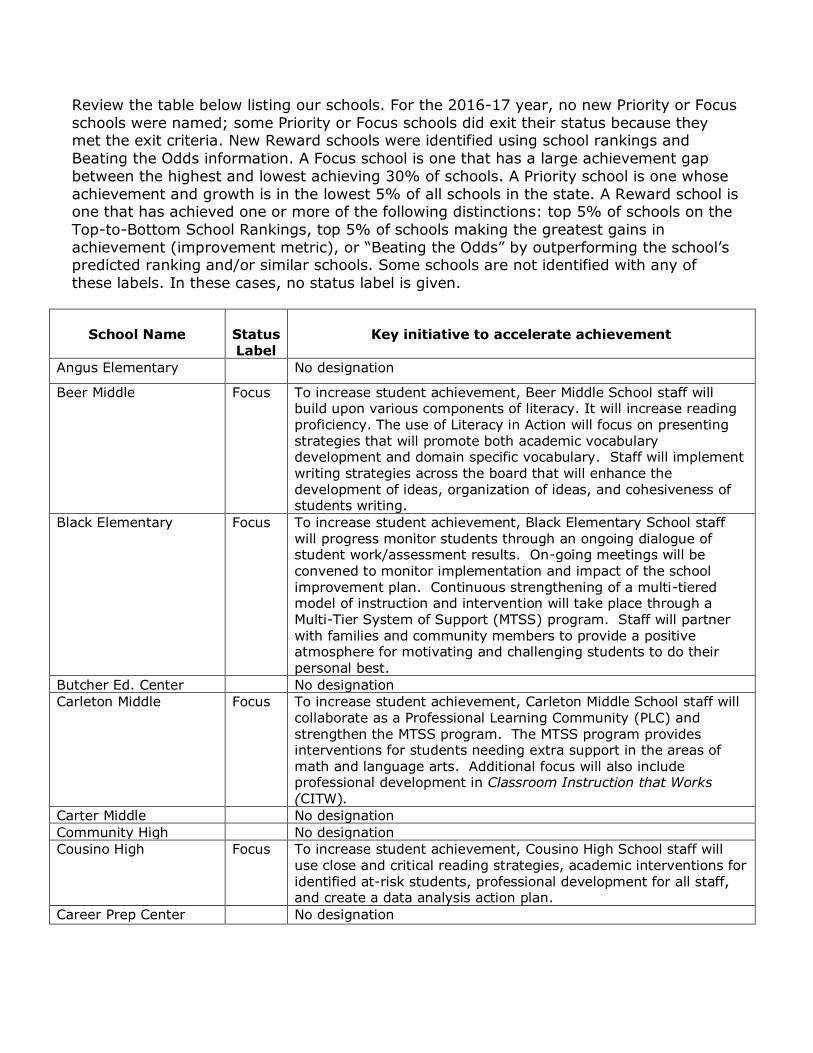
Review the table below listing our schools. For the 2016-17 year, no new Priority or Focus
schools were named; some Priority or Focus schools did exit their status because they met the exit criteria. New Reward schools were identified using school rankings and
Beating the Odds information. A Focus school is one that has a large achievement gap
between the highest and lowest achieving 30% of schools. A Priority school is one whose
achievement and growth is in the lowest 5% of all schools in the state. A Reward school is one that has achieved one or more of the following distinctions: top 5% of schools on the
Top-to-Bottom School Rankings, top 5% of schools making the greatest gains in
achievement (improvement metric), or “Beating the Odds” by outperforming the school’s predicted ranking and/or similar schools. Some schools are not identified with any of
these labels. In these cases, no status label is given.
School Name
Status Label
Key initiative to accelerate achievement
Angus Elementary No designation
Beer Middle Focus To increase student achievement, Beer Middle School staff will build upon various components of literacy. It will increase reading proficiency. The use of Literacy in Action will focus on presenting strategies that will promote both academic vocabulary development and domain specific vocabulary. Staff will implement writing strategies across the board that will enhance the development of ideas, organization of ideas, and cohesiveness of students writing.
Black Elementary Focus To increase student achievement, Black Elementary School staff will progress monitor students through an ongoing dialogue of student work/assessment results. On-going meetings will be
convened to monitor implementation and impact of the school improvement plan. Continuous strengthening of a multi-tiered model of instruction and intervention will take place through a Multi-Tier System of Support (MTSS) program. Staff will partner with families and community members to provide a positive atmosphere for motivating and challenging students to do their
personal best.
Butcher Ed. Center No designation
Carleton Middle Focus To increase student achievement, Carleton Middle School staff will collaborate as a Professional Learning Community (PLC) and strengthen the MTSS program. The MTSS program provides interventions for students needing extra support in the areas of
math and language arts. Additional focus will also include professional development in Classroom Instruction that Works (CITW).
Carter Middle No designation
Community High No designation
Cousino High Focus To increase student achievement, Cousino High School staff will use close and critical reading strategies, academic interventions for
identified at-risk students, professional development for all staff, and create a data analysis action plan.
Career Prep Center No designation
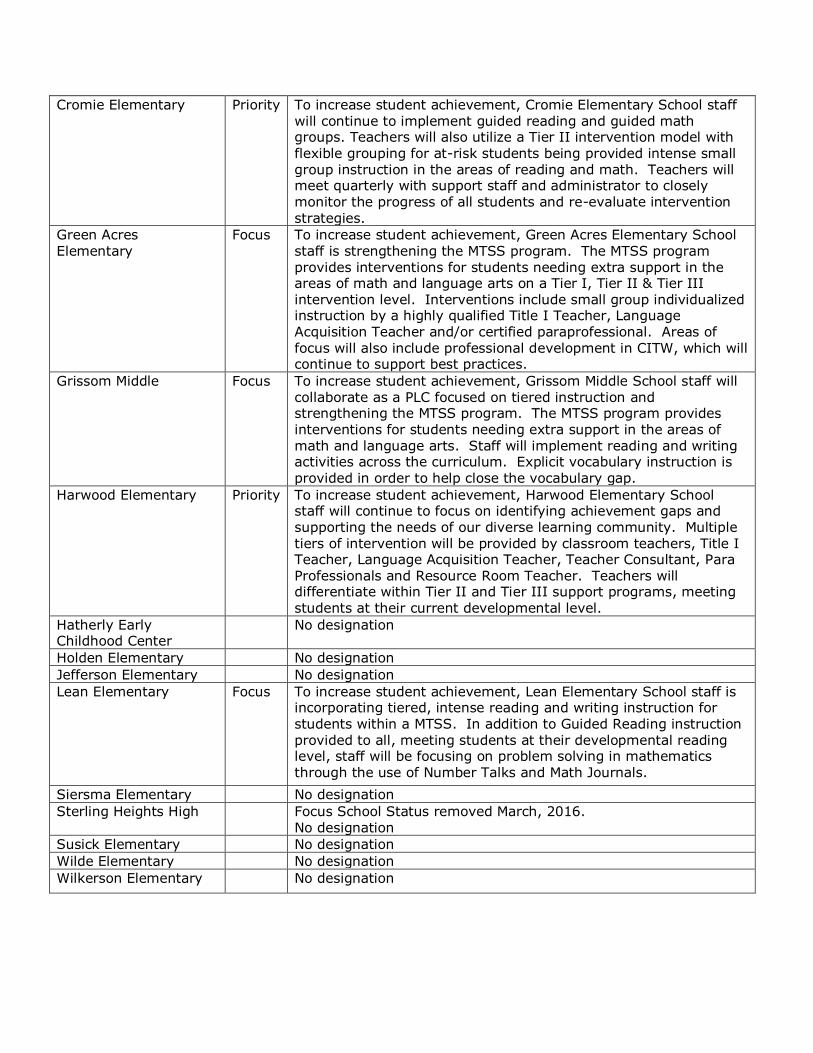
Cromie Elementary Priority To increase student achievement, Cromie Elementary School staff will continue to implement guided reading and guided math groups. Teachers will also utilize a Tier II intervention model with
flexible grouping for at-risk students being provided intense small group instruction in the areas of reading and math. Teachers will meet quarterly with support staff and administrator to closely monitor the progress of all students and re-evaluate intervention strategies.
Green Acres Elementary
Focus To increase student achievement, Green Acres Elementary School staff is strengthening the MTSS program. The MTSS program
provides interventions for students needing extra support in the areas of math and language arts on a Tier I, Tier II & Tier III intervention level. Interventions include small group individualized instruction by a highly qualified Title I Teacher, Language Acquisition Teacher and/or certified paraprofessional. Areas of focus will also include professional development in CITW, which will continue to support best practices.
Grissom Middle Focus To increase student achievement, Grissom Middle School staff will collaborate as a PLC focused on tiered instruction and strengthening the MTSS program. The MTSS program provides interventions for students needing extra support in the areas of math and language arts. Staff will implement reading and writing activities across the curriculum. Explicit vocabulary instruction is provided in order to help close the vocabulary gap.
Harwood Elementary Priority To increase student achievement, Harwood Elementary School staff will continue to focus on identifying achievement gaps and supporting the needs of our diverse learning community. Multiple tiers of intervention will be provided by classroom teachers, Title I Teacher, Language Acquisition Teacher, Teacher Consultant, Para Professionals and Resource Room Teacher. Teachers will differentiate within Tier II and Tier III support programs, meeting students at their current developmental level.
Hatherly Early Childhood Center
No designation
Holden Elementary No designation
Jefferson Elementary No designation
Lean Elementary Focus To increase student achievement, Lean Elementary School staff is incorporating tiered, intense reading and writing instruction for students within a MTSS. In addition to Guided Reading instruction provided to all, meeting students at their developmental reading level, staff will be focusing on problem solving in mathematics
through the use of Number Talks and Math Journals.
Siersma Elementary No designation
Sterling Heights High Focus School Status removed March, 2016. No designation
Susick Elementary No designation
Wilde Elementary No designation
Wilkerson Elementary No designation
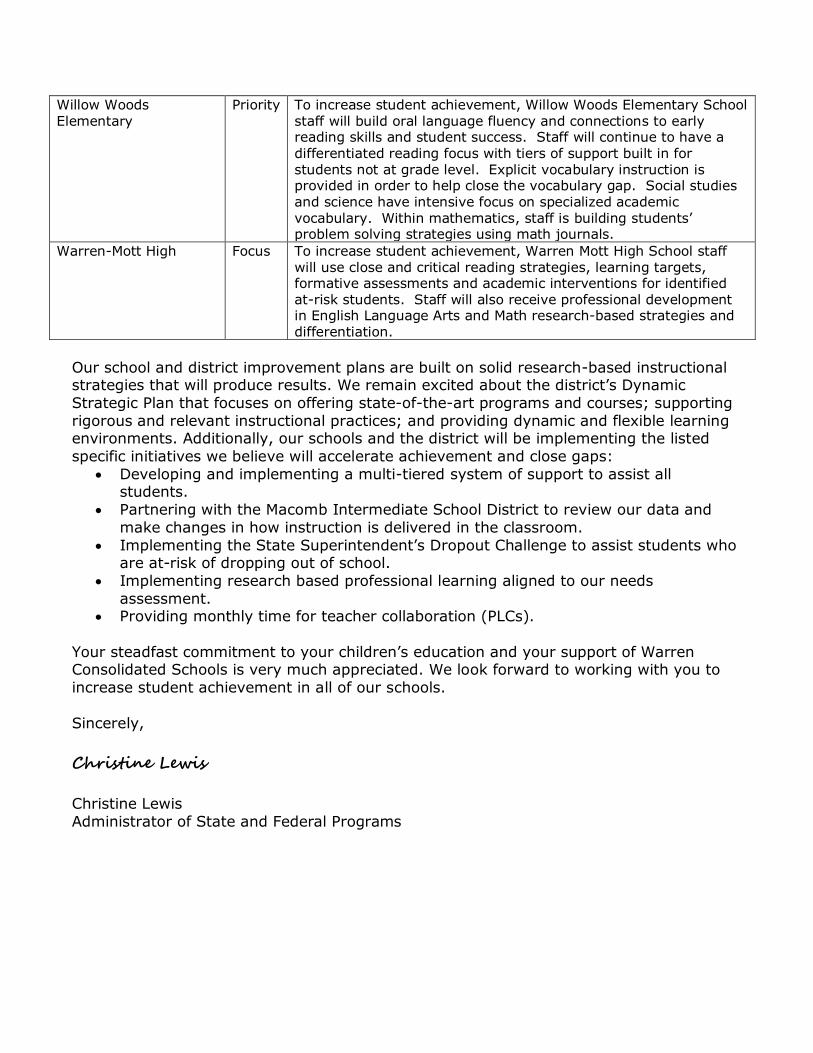
Willow Woods Elementary
Priority To increase student achievement, Willow Woods Elementary School staff will build oral language fluency and connections to early reading skills and student success. Staff will continue to have a
differentiated reading focus with tiers of support built in for students not at grade level. Explicit vocabulary instruction is provided in order to help close the vocabulary gap. Social studies and science have intensive focus on specialized academic vocabulary. Within mathematics, staff is building students’ problem solving strategies using math journals.
Warren-Mott High Focus To increase student achievement, Warren Mott High School staff
will use close and critical reading strategies, learning targets, formative assessments and academic interventions for identified at-risk students. Staff will also receive professional development in English Language Arts and Math research-based strategies and differentiation.
Our school and district improvement plans are built on solid research-based instructional strategies that will produce results. We remain excited about the district’s Dynamic
Strategic Plan that focuses on offering state-of-the-art programs and courses; supporting
rigorous and relevant instructional practices; and providing dynamic and flexible learning environments. Additionally, our schools and the district will be implementing the listed
specific initiatives we believe will accelerate achievement and close gaps:
Developing and implementing a multi-tiered system of support to assist all students.
Partnering with the Macomb Intermediate School District to review our data and
make changes in how instruction is delivered in the classroom.
Implementing the State Superintendent’s Dropout Challenge to assist students who are at-risk of dropping out of school.
Implementing research based professional learning aligned to our needs
assessment. Providing monthly time for teacher collaboration (PLCs).
Your steadfast commitment to your children’s education and your support of Warren Consolidated Schools is very much appreciated. We look forward to working with you to
increase student achievement in all of our schools.
Sincerely,
Christine Lewis
Christine Lewis
Administrator of State and Federal Programs
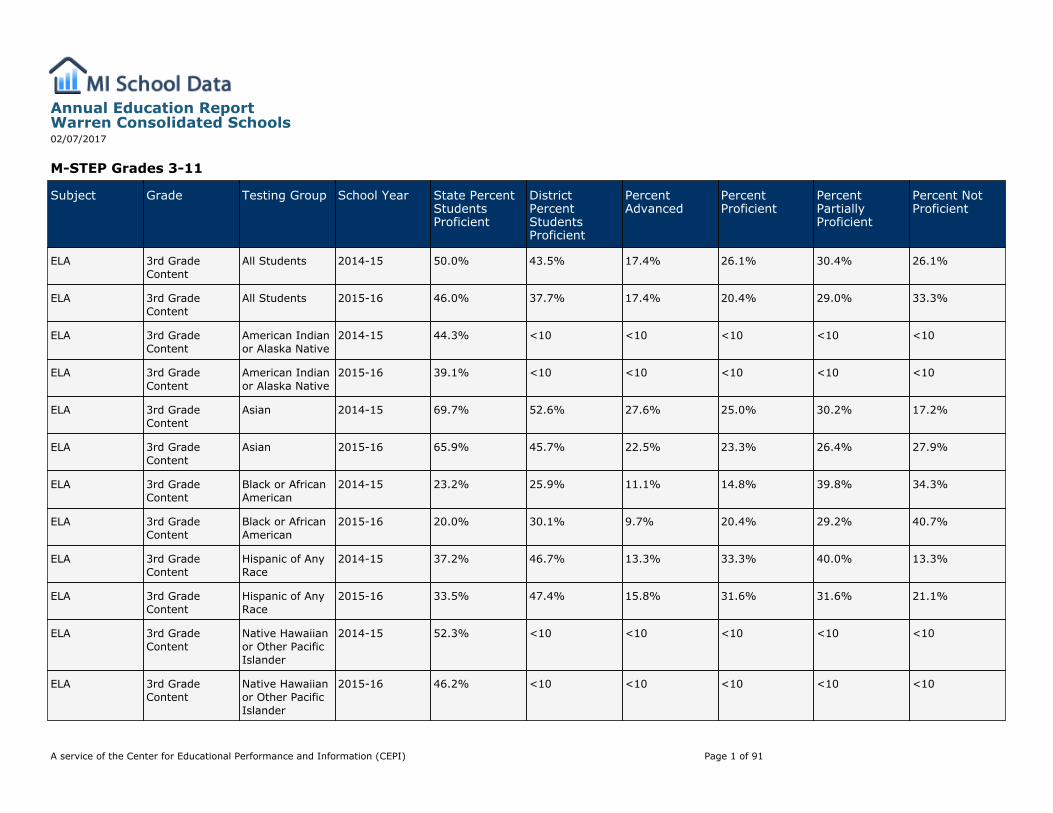
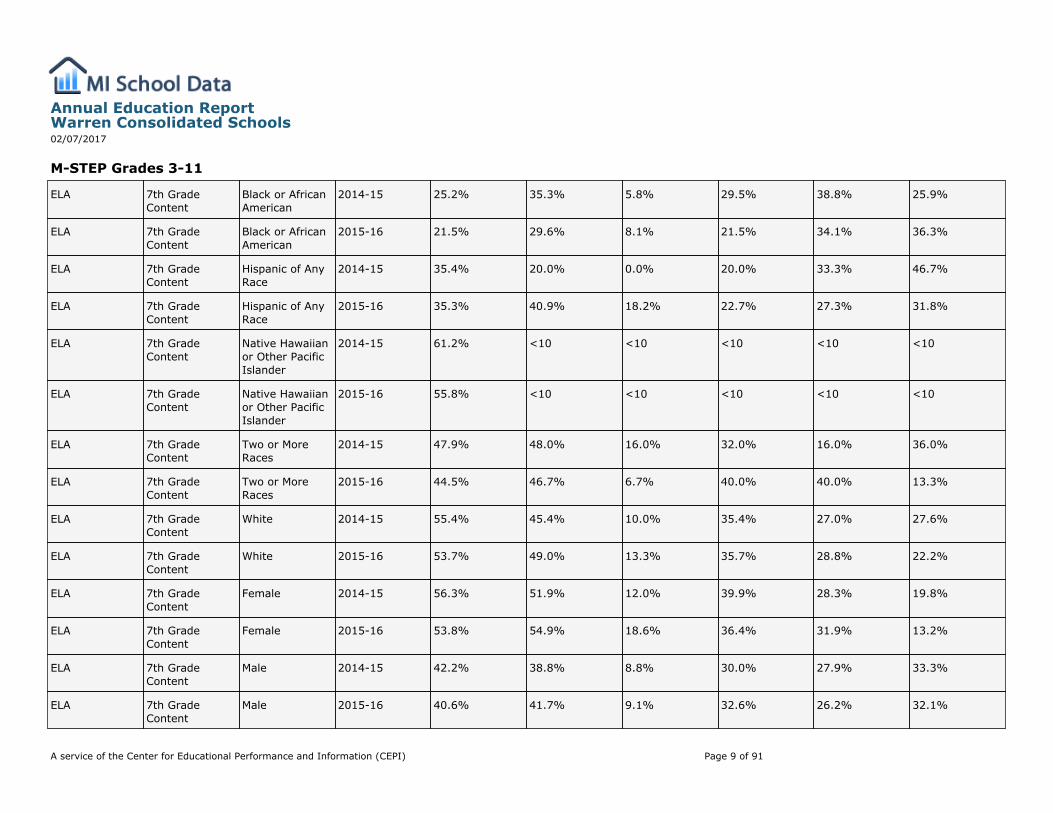
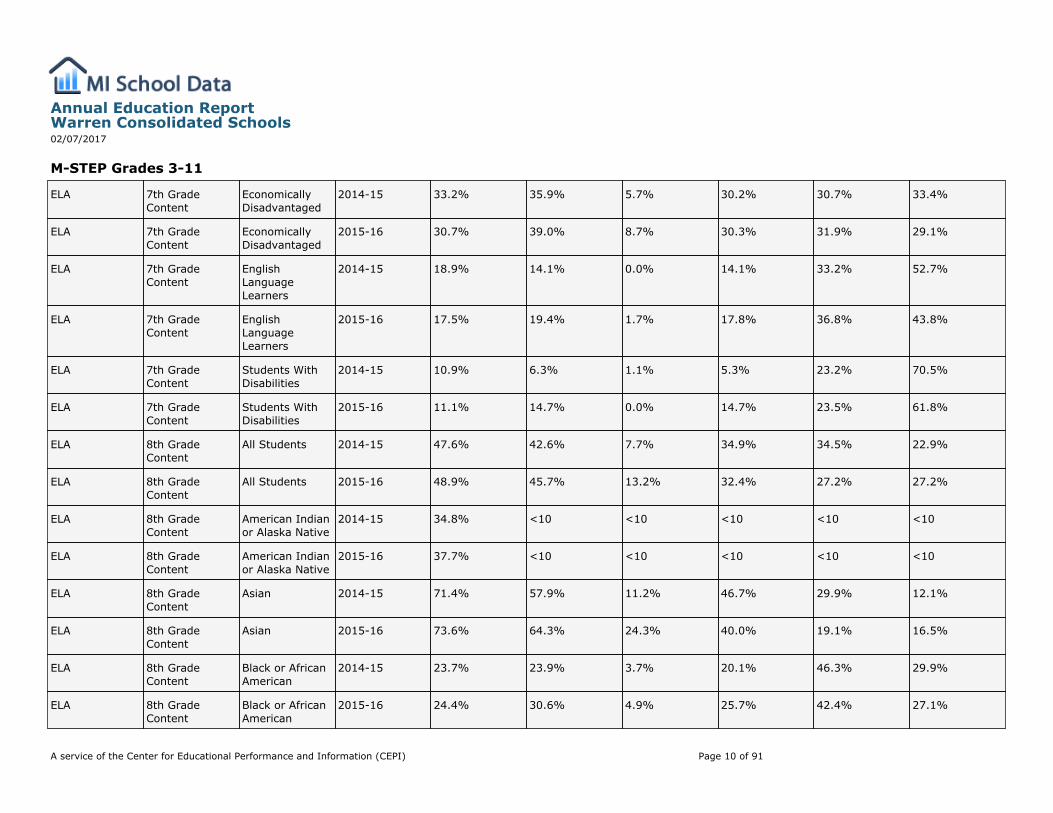
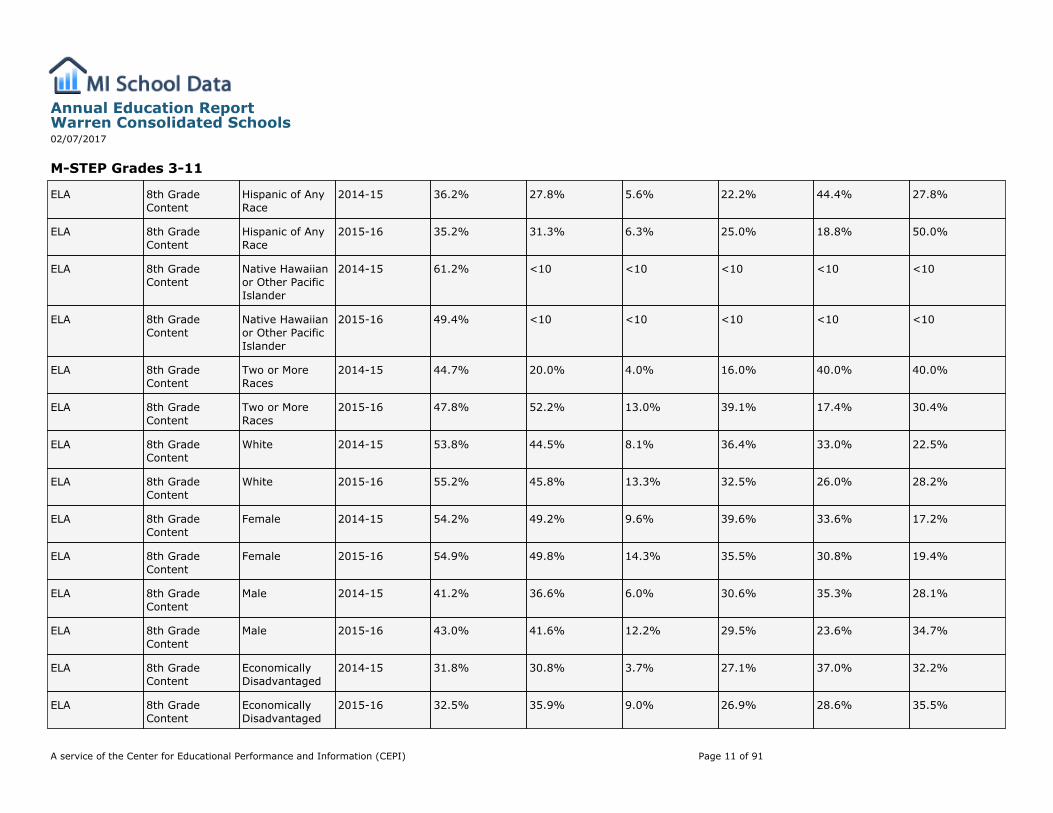
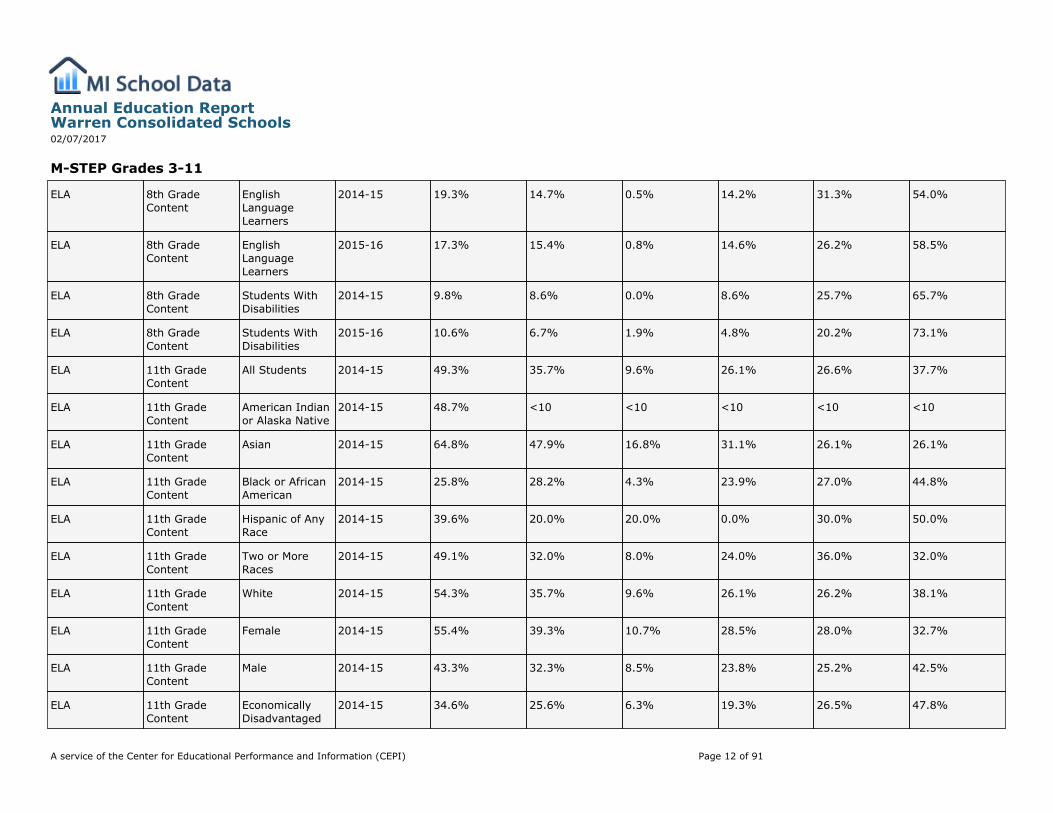
M-STEP Grades 3-11
Subject Grade Testing Group School Year State PercentStudentsProficient
DistrictPercentStudentsProficient
PercentAdvanced
PercentProficient
PercentPartiallyProficient
Percent NotProficient
ELA 3rd GradeContent
All Students 2014-15 50.0% 43.5% 17.4% 26.1% 30.4% 26.1%
ELA 3rd GradeContent
All Students 2015-16 46.0% 37.7% 17.4% 20.4% 29.0% 33.3%
ELA 3rd GradeContent
American Indianor Alaska Native
2014-15 44.3% <10 <10 <10 <10 <10
ELA 3rd GradeContent
American Indianor Alaska Native
2015-16 39.1% <10 <10 <10 <10 <10
ELA 3rd GradeContent
Asian 2014-15 69.7% 52.6% 27.6% 25.0% 30.2% 17.2%
ELA 3rd GradeContent
Asian 2015-16 65.9% 45.7% 22.5% 23.3% 26.4% 27.9%
ELA 3rd GradeContent
Black or AfricanAmerican
2014-15 23.2% 25.9% 11.1% 14.8% 39.8% 34.3%
ELA 3rd GradeContent
Black or AfricanAmerican
2015-16 20.0% 30.1% 9.7% 20.4% 29.2% 40.7%
ELA 3rd GradeContent
Hispanic of AnyRace
2014-15 37.2% 46.7% 13.3% 33.3% 40.0% 13.3%
ELA 3rd GradeContent
Hispanic of AnyRace
2015-16 33.5% 47.4% 15.8% 31.6% 31.6% 21.1%
ELA 3rd GradeContent
Native Hawaiianor Other PacificIslander
2014-15 52.3% <10 <10 <10 <10 <10
ELA 3rd GradeContent
Native Hawaiianor Other PacificIslander
2015-16 46.2% <10 <10 <10 <10 <10
Annual Education ReportWarren Consolidated Schools02/07/2017
A service of the Center for Educational Performance and Information (CEPI) Page 1 of 91
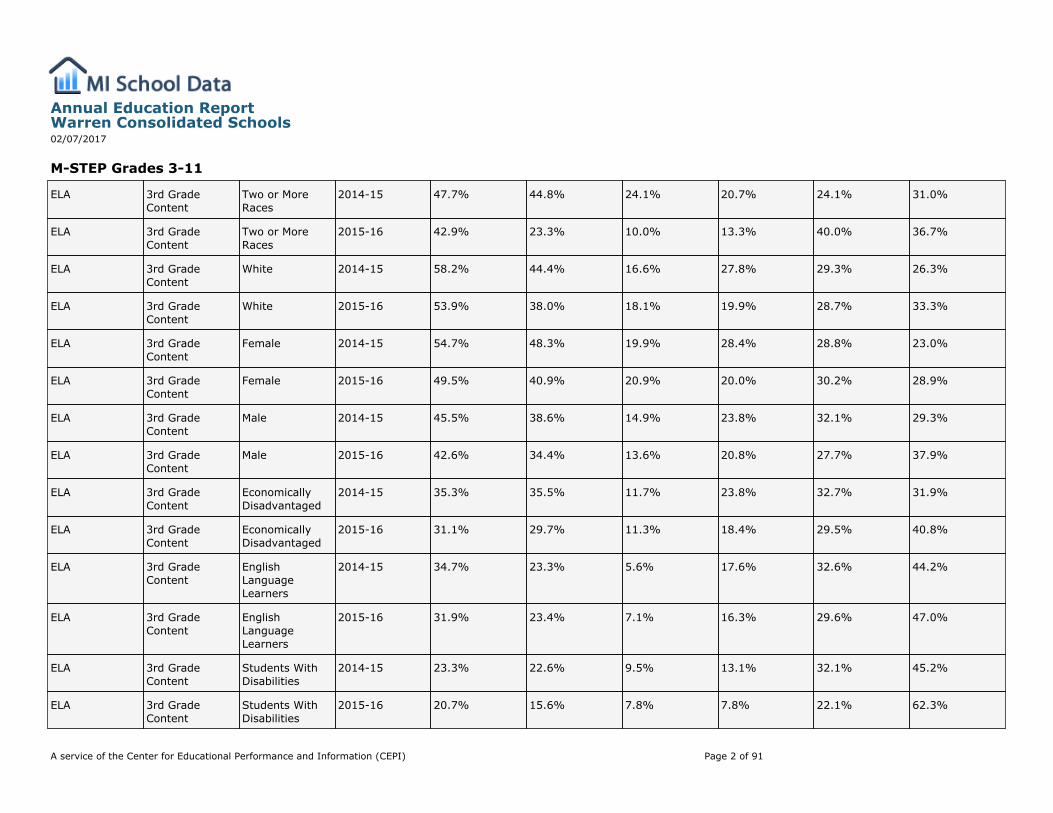
M-STEP Grades 3-11
ELA 3rd GradeContent
Two or MoreRaces
2014-15 47.7% 44.8% 24.1% 20.7% 24.1% 31.0%
ELA 3rd GradeContent
Two or MoreRaces
2015-16 42.9% 23.3% 10.0% 13.3% 40.0% 36.7%
ELA 3rd GradeContent
White 2014-15 58.2% 44.4% 16.6% 27.8% 29.3% 26.3%
ELA 3rd GradeContent
White 2015-16 53.9% 38.0% 18.1% 19.9% 28.7% 33.3%
ELA 3rd GradeContent
Female 2014-15 54.7% 48.3% 19.9% 28.4% 28.8% 23.0%
ELA 3rd GradeContent
Female 2015-16 49.5% 40.9% 20.9% 20.0% 30.2% 28.9%
ELA 3rd GradeContent
Male 2014-15 45.5% 38.6% 14.9% 23.8% 32.1% 29.3%
ELA 3rd GradeContent
Male 2015-16 42.6% 34.4% 13.6% 20.8% 27.7% 37.9%
ELA 3rd GradeContent
EconomicallyDisadvantaged
2014-15 35.3% 35.5% 11.7% 23.8% 32.7% 31.9%
ELA 3rd GradeContent
EconomicallyDisadvantaged
2015-16 31.1% 29.7% 11.3% 18.4% 29.5% 40.8%
ELA 3rd GradeContent
EnglishLanguageLearners
2014-15 34.7% 23.3% 5.6% 17.6% 32.6% 44.2%
ELA 3rd GradeContent
EnglishLanguageLearners
2015-16 31.9% 23.4% 7.1% 16.3% 29.6% 47.0%
ELA 3rd GradeContent
Students WithDisabilities
2014-15 23.3% 22.6% 9.5% 13.1% 32.1% 45.2%
ELA 3rd GradeContent
Students WithDisabilities
2015-16 20.7% 15.6% 7.8% 7.8% 22.1% 62.3%
Annual Education ReportWarren Consolidated Schools02/07/2017
A service of the Center for Educational Performance and Information (CEPI) Page 2 of 91

M-STEP Grades 3-11
ELA 4th GradeContent
All Students 2014-15 46.6% 40.3% 16.2% 24.1% 25.0% 34.7%
ELA 4th GradeContent
All Students 2015-16 46.3% 41.8% 20.2% 21.6% 24.4% 33.8%
ELA 4th GradeContent
American Indianor Alaska Native
2014-15 36.9% <10 <10 <10 <10 <10
ELA 4th GradeContent
American Indianor Alaska Native
2015-16 40.2% <10 <10 <10 <10 <10
ELA 4th GradeContent
Asian 2014-15 70.5% 56.2% 27.3% 28.9% 30.6% 13.2%
ELA 4th GradeContent
Asian 2015-16 67.8% 52.5% 33.3% 19.2% 18.3% 29.2%
ELA 4th GradeContent
Black or AfricanAmerican
2014-15 21.2% 28.7% 9.3% 19.4% 25.9% 45.4%
ELA 4th GradeContent
Black or AfricanAmerican
2015-16 20.4% 31.1% 10.4% 20.8% 31.1% 37.7%
ELA 4th GradeContent
Hispanic of AnyRace
2014-15 33.2% 37.5% 12.5% 25.0% 25.0% 37.5%
ELA 4th GradeContent
Hispanic of AnyRace
2015-16 34.4% 60.0% 40.0% 20.0% 20.0% 20.0%
ELA 4th GradeContent
Native Hawaiianor Other PacificIslander
2014-15 52.1% <10 <10 <10 <10 <10
ELA 4th GradeContent
Native Hawaiianor Other PacificIslander
2015-16 51.7% <10 <10 <10 <10 <10
ELA 4th GradeContent
Two or MoreRaces
2014-15 45.5% 28.1% 12.5% 15.6% 31.3% 40.6%
ELA 4th GradeContent
Two or MoreRaces
2015-16 43.6% 37.9% 20.7% 17.2% 34.5% 27.6%
Annual Education ReportWarren Consolidated Schools02/07/2017
A service of the Center for Educational Performance and Information (CEPI) Page 3 of 91
M-STEP Grades 3-11
ELA 4th GradeContent
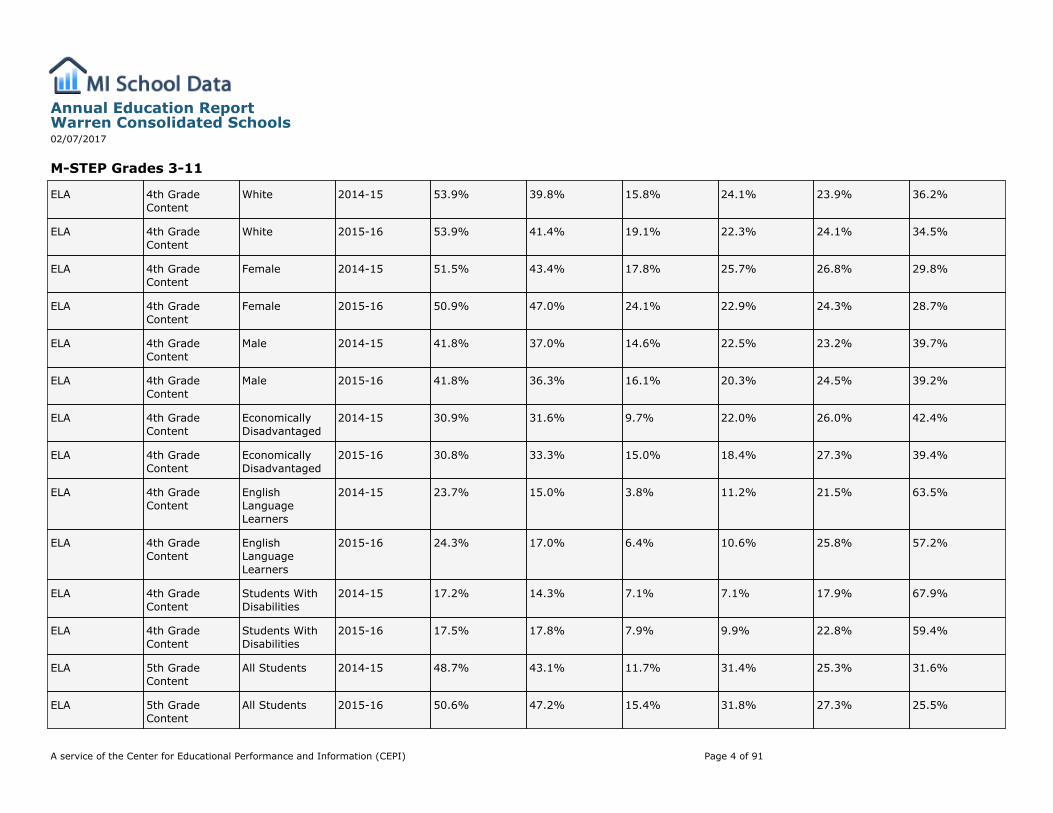
White 2014-15 53.9% 39.8% 15.8% 24.1% 23.9% 36.2%
ELA 4th GradeContent
White 2015-16 53.9% 41.4% 19.1% 22.3% 24.1% 34.5%
ELA 4th GradeContent
Female 2014-15 51.5% 43.4% 17.8% 25.7% 26.8% 29.8%
ELA 4th GradeContent
Female 2015-16 50.9% 47.0% 24.1% 22.9% 24.3% 28.7%
ELA 4th GradeContent
Male 2014-15 41.8% 37.0% 14.6% 22.5% 23.2% 39.7%
ELA 4th GradeContent
Male 2015-16 41.8% 36.3% 16.1% 20.3% 24.5% 39.2%
ELA 4th GradeContent
EconomicallyDisadvantaged
2014-15 30.9% 31.6% 9.7% 22.0% 26.0% 42.4%
ELA 4th GradeContent
EconomicallyDisadvantaged
2015-16 30.8% 33.3% 15.0% 18.4% 27.3% 39.4%
ELA 4th GradeContent
EnglishLanguageLearners
2014-15 23.7% 15.0% 3.8% 11.2% 21.5% 63.5%
ELA 4th GradeContent
EnglishLanguageLearners
2015-16 24.3% 17.0% 6.4% 10.6% 25.8% 57.2%
ELA 4th GradeContent
Students WithDisabilities
2014-15 17.2% 14.3% 7.1% 7.1% 17.9% 67.9%
ELA 4th GradeContent
Students WithDisabilities
2015-16 17.5% 17.8% 7.9% 9.9% 22.8% 59.4%
ELA 5th GradeContent
All Students 2014-15 48.7% 43.1% 11.7% 31.4% 25.3% 31.6%
ELA 5th GradeContent
All Students 2015-16 50.6% 47.2% 15.4% 31.8% 27.3% 25.5%
Annual Education ReportWarren Consolidated Schools02/07/2017
A service of the Center for Educational Performance and Information (CEPI) Page 4 of 91
M-STEP Grades 3-11
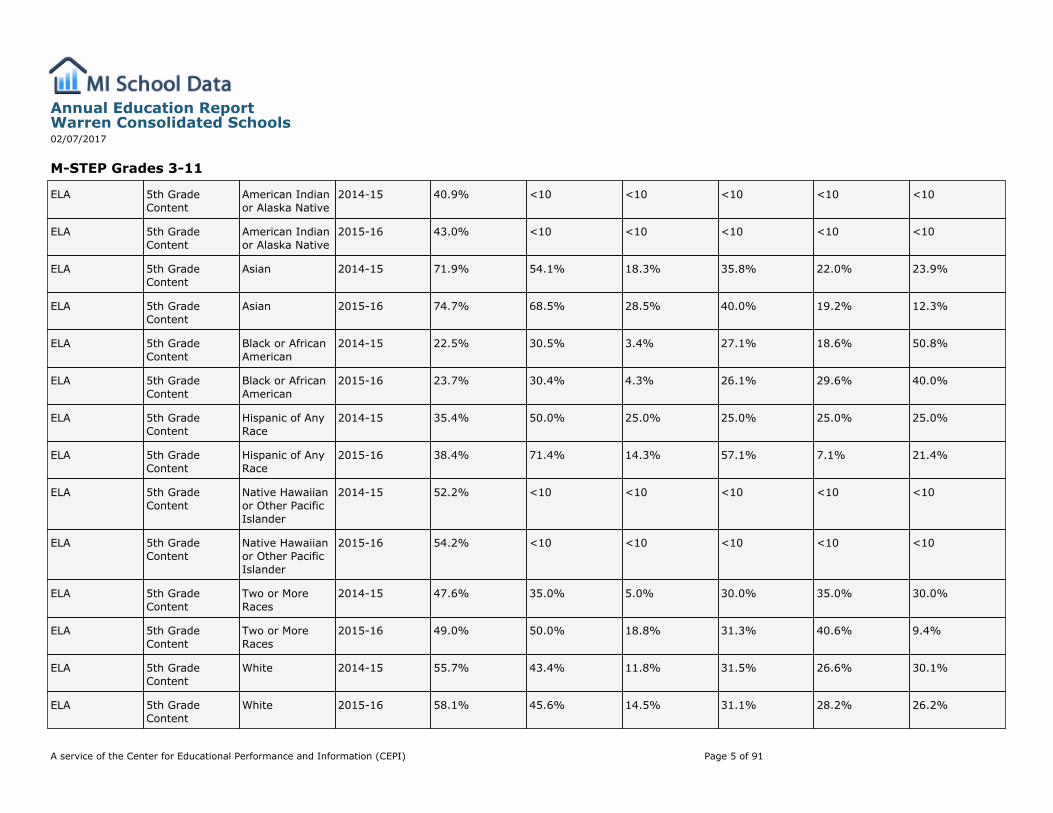
ELA 5th GradeContent
American Indianor Alaska Native
2014-15 40.9% <10 <10 <10 <10 <10
ELA 5th GradeContent
American Indianor Alaska Native
2015-16 43.0% <10 <10 <10 <10 <10
ELA 5th GradeContent
Asian 2014-15 71.9% 54.1% 18.3% 35.8% 22.0% 23.9%
ELA 5th GradeContent
Asian 2015-16 74.7% 68.5% 28.5% 40.0% 19.2% 12.3%
ELA 5th GradeContent
Black or AfricanAmerican
2014-15 22.5% 30.5% 3.4% 27.1% 18.6% 50.8%
ELA 5th GradeContent
Black or AfricanAmerican
2015-16 23.7% 30.4% 4.3% 26.1% 29.6% 40.0%
ELA 5th GradeContent
Hispanic of AnyRace
2014-15 35.4% 50.0% 25.0% 25.0% 25.0% 25.0%
ELA 5th GradeContent
Hispanic of AnyRace
2015-16 38.4% 71.4% 14.3% 57.1% 7.1% 21.4%
ELA 5th GradeContent
Native Hawaiianor Other PacificIslander
2014-15 52.2% <10 <10 <10 <10 <10
ELA 5th GradeContent
Native Hawaiianor Other PacificIslander
2015-16 54.2% <10 <10 <10 <10 <10
ELA 5th GradeContent
Two or MoreRaces
2014-15 47.6% 35.0% 5.0% 30.0% 35.0% 30.0%
ELA 5th GradeContent
Two or MoreRaces
2015-16 49.0% 50.0% 18.8% 31.3% 40.6% 9.4%
ELA 5th GradeContent
White 2014-15 55.7% 43.4% 11.8% 31.5% 26.6% 30.1%
ELA 5th GradeContent
White 2015-16 58.1% 45.6% 14.5% 31.1% 28.2% 26.2%
Annual Education ReportWarren Consolidated Schools02/07/2017
A service of the Center for Educational Performance and Information (CEPI) Page 5 of 91

M-STEP Grades 3-11
ELA 5th GradeContent
Female 2014-15 54.3% 50.4% 16.3% 34.0% 25.5% 24.1%
ELA 5th GradeContent
Female 2015-16 55.8% 49.8% 17.2% 32.6% 27.0% 23.2%
ELA 5th GradeContent
Male 2014-15 43.3% 36.5% 7.5% 29.0% 25.1% 38.4%
ELA 5th GradeContent
Male 2015-16 45.5% 44.6% 13.5% 31.0% 27.6% 27.8%
ELA 5th GradeContent
EconomicallyDisadvantaged
2014-15 32.6% 33.7% 7.4% 26.3% 26.5% 39.8%
ELA 5th GradeContent
EconomicallyDisadvantaged
2015-16 34.4% 39.2% 10.4% 28.9% 28.1% 32.7%
ELA 5th GradeContent
EnglishLanguageLearners
2014-15 22.7% 17.0% 0.7% 16.3% 29.3% 53.7%
ELA 5th GradeContent
EnglishLanguageLearners
2015-16 23.1% 17.8% 2.8% 15.0% 29.1% 53.0%
ELA 5th GradeContent
Students WithDisabilities
2014-15 14.6% 12.5% 3.1% 9.4% 17.7% 69.8%
ELA 5th GradeContent
Students WithDisabilities
2015-16 16.1% 13.6% 6.8% 6.8% 22.7% 63.6%
ELA 6th GradeContent
All Students 2014-15 44.7% 42.4% 8.4% 33.9% 27.8% 29.9%
ELA 6th GradeContent
All Students 2015-16 45.0% 42.5% 12.5% 30.1% 25.4% 32.0%
ELA 6th GradeContent
American Indianor Alaska Native
2014-15 39.4% <10 <10 <10 <10 <10
ELA 6th GradeContent
American Indianor Alaska Native
2015-16 34.1% <10 <10 <10 <10 <10
Annual Education ReportWarren Consolidated Schools02/07/2017
A service of the Center for Educational Performance and Information (CEPI) Page 6 of 91
M-STEP Grades 3-11
ELA 6th GradeContent
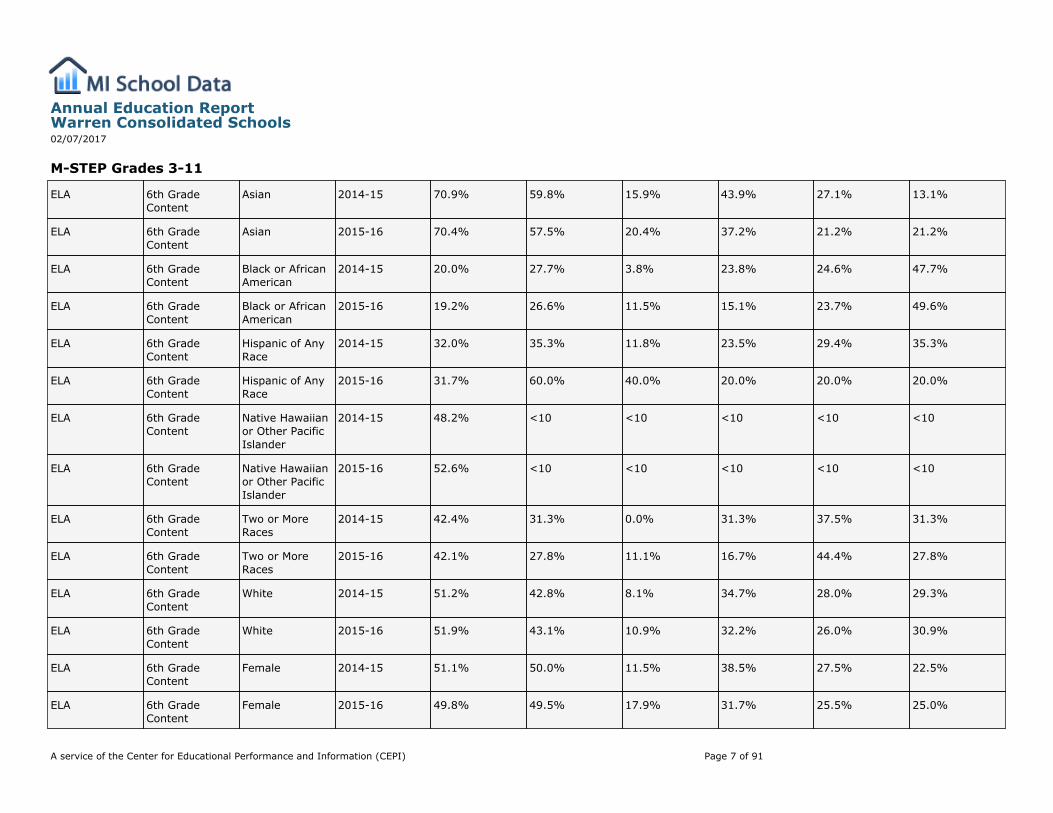
Asian 2014-15 70.9% 59.8% 15.9% 43.9% 27.1% 13.1%
ELA 6th GradeContent
Asian 2015-16 70.4% 57.5% 20.4% 37.2% 21.2% 21.2%
ELA 6th GradeContent
Black or AfricanAmerican
2014-15 20.0% 27.7% 3.8% 23.8% 24.6% 47.7%
ELA 6th GradeContent
Black or AfricanAmerican
2015-16 19.2% 26.6% 11.5% 15.1% 23.7% 49.6%
ELA 6th GradeContent
Hispanic of AnyRace
2014-15 32.0% 35.3% 11.8% 23.5% 29.4% 35.3%
ELA 6th GradeContent
Hispanic of AnyRace
2015-16 31.7% 60.0% 40.0% 20.0% 20.0% 20.0%
ELA 6th GradeContent
Native Hawaiianor Other PacificIslander
2014-15 48.2% <10 <10 <10 <10 <10
ELA 6th GradeContent
Native Hawaiianor Other PacificIslander
2015-16 52.6% <10 <10 <10 <10 <10
ELA 6th GradeContent
Two or MoreRaces
2014-15 42.4% 31.3% 0.0% 31.3% 37.5% 31.3%
ELA 6th GradeContent
Two or MoreRaces
2015-16 42.1% 27.8% 11.1% 16.7% 44.4% 27.8%
ELA 6th GradeContent
White 2014-15 51.2% 42.8% 8.1% 34.7% 28.0% 29.3%
ELA 6th GradeContent
White 2015-16 51.9% 43.1% 10.9% 32.2% 26.0% 30.9%
ELA 6th GradeContent
Female 2014-15 51.1% 50.0% 11.5% 38.5% 27.5% 22.5%
ELA 6th GradeContent
Female 2015-16 49.8% 49.5% 17.9% 31.7% 25.5% 25.0%
Annual Education ReportWarren Consolidated Schools02/07/2017
A service of the Center for Educational Performance and Information (CEPI) Page 7 of 91
M-STEP Grades 3-11
ELA 6th GradeContent
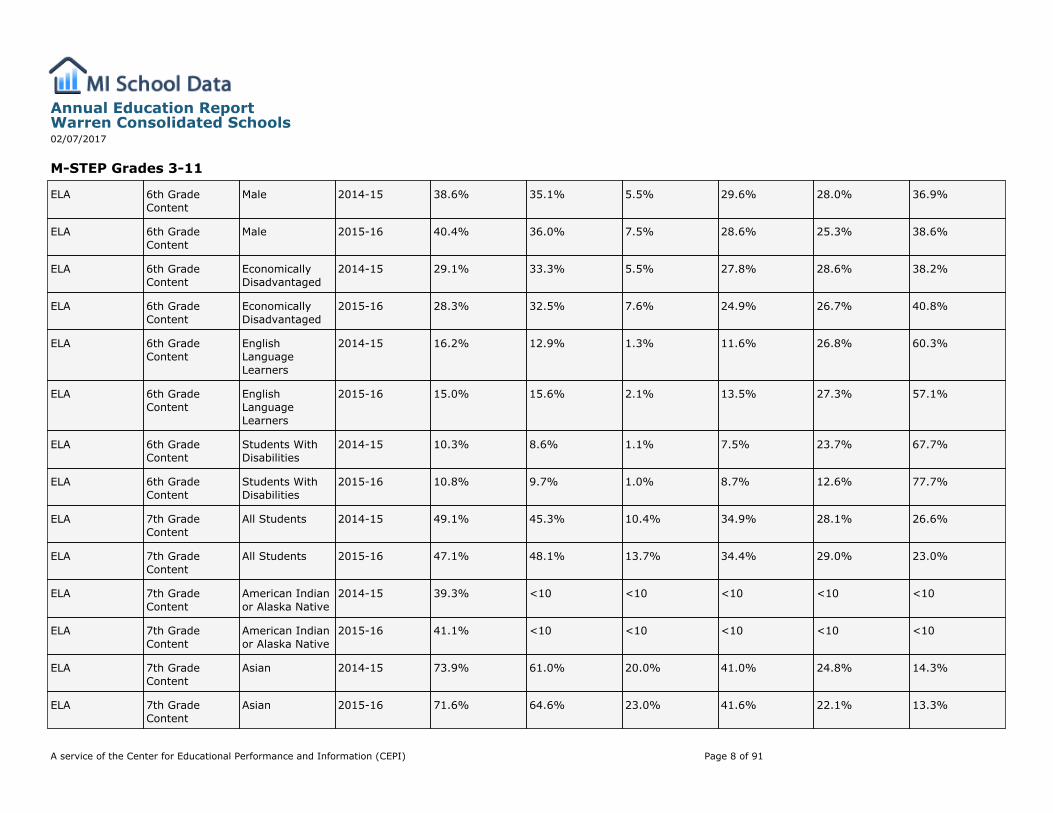
Male 2014-15 38.6% 35.1% 5.5% 29.6% 28.0% 36.9%
ELA 6th GradeContent
Male 2015-16 40.4% 36.0% 7.5% 28.6% 25.3% 38.6%
ELA 6th GradeContent
EconomicallyDisadvantaged
2014-15 29.1% 33.3% 5.5% 27.8% 28.6% 38.2%
ELA 6th GradeContent
EconomicallyDisadvantaged
2015-16 28.3% 32.5% 7.6% 24.9% 26.7% 40.8%
ELA 6th GradeContent
EnglishLanguageLearners
2014-15 16.2% 12.9% 1.3% 11.6% 26.8% 60.3%
ELA 6th GradeContent
EnglishLanguageLearners
2015-16 15.0% 15.6% 2.1% 13.5% 27.3% 57.1%
ELA 6th GradeContent
Students WithDisabilities
2014-15 10.3% 8.6% 1.1% 7.5% 23.7% 67.7%
ELA 6th GradeContent
Students WithDisabilities
2015-16 10.8% 9.7% 1.0% 8.7% 12.6% 77.7%
ELA 7th GradeContent
All Students 2014-15 49.1% 45.3% 10.4% 34.9% 28.1% 26.6%
ELA 7th GradeContent
All Students 2015-16 47.1% 48.1% 13.7% 34.4% 29.0% 23.0%
ELA 7th GradeContent
American Indianor Alaska Native
2014-15 39.3% <10 <10 <10 <10 <10
ELA 7th GradeContent
American Indianor Alaska Native
2015-16 41.1% <10 <10 <10 <10 <10
ELA 7th GradeContent
Asian 2014-15 73.9% 61.0% 20.0% 41.0% 24.8% 14.3%
ELA 7th GradeContent
Asian 2015-16 71.6% 64.6% 23.0% 41.6% 22.1% 13.3%
Annual Education ReportWarren Consolidated Schools02/07/2017
A service of the Center for Educational Performance and Information (CEPI) Page 8 of 91
M-STEP Grades 3-11
ELA 7th GradeContent
Black or AfricanAmerican
2014-15 25.2% 35.3% 5.8% 29.5% 38.8% 25.9%
ELA 7th GradeContent
Black or AfricanAmerican
2015-16 21.5% 29.6% 8.1% 21.5% 34.1% 36.3%
ELA 7th GradeContent
Hispanic of AnyRace
2014-15 35.4% 20.0% 0.0% 20.0% 33.3% 46.7%
ELA 7th GradeContent
Hispanic of AnyRace
2015-16 35.3% 40.9% 18.2% 22.7% 27.3% 31.8%
ELA 7th GradeContent
Native Hawaiianor Other PacificIslander
2014-15 61.2% <10 <10 <10 <10 <10
ELA 7th GradeContent
Native Hawaiianor Other PacificIslander
2015-16 55.8% <10 <10 <10 <10 <10
ELA 7th GradeContent
Two or MoreRaces
2014-15 47.9% 48.0% 16.0% 32.0% 16.0% 36.0%
ELA 7th GradeContent
Two or MoreRaces
2015-16 44.5% 46.7% 6.7% 40.0% 40.0% 13.3%
ELA 7th GradeContent
White 2014-15 55.4% 45.4% 10.0% 35.4% 27.0% 27.6%
ELA 7th GradeContent
White 2015-16 53.7% 49.0% 13.3% 35.7% 28.8% 22.2%
ELA 7th GradeContent
Female 2014-15 56.3% 51.9% 12.0% 39.9% 28.3% 19.8%
ELA 7th GradeContent
Female 2015-16 53.8% 54.9% 18.6% 36.4% 31.9% 13.2%
ELA 7th GradeContent
Male 2014-15 42.2% 38.8% 8.8% 30.0% 27.9% 33.3%
ELA 7th GradeContent
Male 2015-16 40.6% 41.7% 9.1% 32.6% 26.2% 32.1%
Annual Education ReportWarren Consolidated Schools02/07/2017
A service of the Center for Educational Performance and Information (CEPI) Page 9 of 91
M-STEP Grades 3-11
ELA 7th GradeContent
EconomicallyDisadvantaged
2014-15 33.2% 35.9% 5.7% 30.2% 30.7% 33.4%
ELA 7th GradeContent
EconomicallyDisadvantaged
2015-16 30.7% 39.0% 8.7% 30.3% 31.9% 29.1%
ELA 7th GradeContent
EnglishLanguageLearners
2014-15 18.9% 14.1% 0.0% 14.1% 33.2% 52.7%
ELA 7th GradeContent
EnglishLanguageLearners
2015-16 17.5% 19.4% 1.7% 17.8% 36.8% 43.8%
ELA 7th GradeContent
Students WithDisabilities
2014-15 10.9% 6.3% 1.1% 5.3% 23.2% 70.5%
ELA 7th GradeContent
Students WithDisabilities
2015-16 11.1% 14.7% 0.0% 14.7% 23.5% 61.8%
ELA 8th GradeContent
All Students 2014-15 47.6% 42.6% 7.7% 34.9% 34.5% 22.9%
ELA 8th GradeContent
All Students 2015-16 48.9% 45.7% 13.2% 32.4% 27.2% 27.2%
ELA 8th GradeContent
American Indianor Alaska Native
2014-15 34.8% <10 <10 <10 <10 <10
ELA 8th GradeContent
American Indianor Alaska Native
2015-16 37.7% <10 <10 <10 <10 <10
ELA 8th GradeContent
Asian 2014-15 71.4% 57.9% 11.2% 46.7% 29.9% 12.1%
ELA 8th GradeContent
Asian 2015-16 73.6% 64.3% 24.3% 40.0% 19.1% 16.5%
ELA 8th GradeContent
Black or AfricanAmerican
2014-15 23.7% 23.9% 3.7% 20.1% 46.3% 29.9%
ELA 8th GradeContent
Black or AfricanAmerican
2015-16 24.4% 30.6% 4.9% 25.7% 42.4% 27.1%
Annual Education ReportWarren Consolidated Schools02/07/2017
A service of the Center for Educational Performance and Information (CEPI) Page 10 of 91
M-STEP Grades 3-11
ELA 8th GradeContent
Hispanic of AnyRace
2014-15 36.2% 27.8% 5.6% 22.2% 44.4% 27.8%
ELA 8th GradeContent
Hispanic of AnyRace
2015-16 35.2% 31.3% 6.3% 25.0% 18.8% 50.0%
ELA 8th GradeContent
Native Hawaiianor Other PacificIslander
2014-15 61.2% <10 <10 <10 <10 <10
ELA 8th GradeContent
Native Hawaiianor Other PacificIslander
2015-16 49.4% <10 <10 <10 <10 <10
ELA 8th GradeContent
Two or MoreRaces
2014-15 44.7% 20.0% 4.0% 16.0% 40.0% 40.0%
ELA 8th GradeContent
Two or MoreRaces
2015-16 47.8% 52.2% 13.0% 39.1% 17.4% 30.4%
ELA 8th GradeContent
White 2014-15 53.8% 44.5% 8.1% 36.4% 33.0% 22.5%
ELA 8th GradeContent
White 2015-16 55.2% 45.8% 13.3% 32.5% 26.0% 28.2%
ELA 8th GradeContent
Female 2014-15 54.2% 49.2% 9.6% 39.6% 33.6% 17.2%
ELA 8th GradeContent
Female 2015-16 54.9% 49.8% 14.3% 35.5% 30.8% 19.4%
ELA 8th GradeContent
Male 2014-15 41.2% 36.6% 6.0% 30.6% 35.3% 28.1%
ELA 8th GradeContent
Male 2015-16 43.0% 41.6% 12.2% 29.5% 23.6% 34.7%
ELA 8th GradeContent
EconomicallyDisadvantaged
2014-15 31.8% 30.8% 3.7% 27.1% 37.0% 32.2%
ELA 8th GradeContent
EconomicallyDisadvantaged
2015-16 32.5% 35.9% 9.0% 26.9% 28.6% 35.5%
Annual Education ReportWarren Consolidated Schools02/07/2017
A service of the Center for Educational Performance and Information (CEPI) Page 11 of 91
M-STEP Grades 3-11
ELA 8th GradeContent
EnglishLanguageLearners
2014-15 19.3% 14.7% 0.5% 14.2% 31.3% 54.0%
ELA 8th GradeContent
EnglishLanguageLearners
2015-16 17.3% 15.4% 0.8% 14.6% 26.2% 58.5%
ELA 8th GradeContent
Students WithDisabilities
2014-15 9.8% 8.6% 0.0% 8.6% 25.7% 65.7%
ELA 8th GradeContent
Students WithDisabilities
2015-16 10.6% 6.7% 1.9% 4.8% 20.2% 73.1%
ELA 11th GradeContent
All Students 2014-15 49.3% 35.7% 9.6% 26.1% 26.6% 37.7%
ELA 11th GradeContent
American Indianor Alaska Native
2014-15 48.7% <10 <10 <10 <10 <10
ELA 11th GradeContent
Asian 2014-15 64.8% 47.9% 16.8% 31.1% 26.1% 26.1%
ELA 11th GradeContent
Black or AfricanAmerican
2014-15 25.8% 28.2% 4.3% 23.9% 27.0% 44.8%
ELA 11th GradeContent
Hispanic of AnyRace
2014-15 39.6% 20.0% 20.0% 0.0% 30.0% 50.0%
ELA 11th GradeContent
Two or MoreRaces
2014-15 49.1% 32.0% 8.0% 24.0% 36.0% 32.0%
ELA 11th GradeContent
White 2014-15 54.3% 35.7% 9.6% 26.1% 26.2% 38.1%
ELA 11th GradeContent
Female 2014-15 55.4% 39.3% 10.7% 28.5% 28.0% 32.7%
ELA 11th GradeContent
Male 2014-15 43.3% 32.3% 8.5% 23.8% 25.2% 42.5%
ELA 11th GradeContent
EconomicallyDisadvantaged
2014-15 34.6% 25.6% 6.3% 19.3% 26.5% 47.8%
Annual Education ReportWarren Consolidated Schools02/07/2017
A service of the Center for Educational Performance and Information (CEPI) Page 12 of 91

M-STEP Grades 3-11
ELA 11th GradeContent
EnglishLanguageLearners
2014-15 15.2% 3.1% 0.0% 3.1% 14.9% 82.0%
ELA 11th GradeContent
Students WithDisabilities
2014-15 12.6% 8.8% 1.3% 7.5% 18.8% 72.5%
Mathematics 3rd GradeContent
All Students 2014-15 48.8% 42.2% 11.7% 30.6% 30.4% 27.4%
Mathematics 3rd GradeContent
All Students 2015-16 45.2% 38.6% 11.4% 27.2% 29.8% 31.6%
Mathematics 3rd GradeContent
American Indianor Alaska Native
2014-15 44.4% <10 <10 <10 <10 <10
Mathematics 3rd GradeContent
American Indianor Alaska Native
2015-16 39.3% <10 <10 <10 <10 <10
Mathematics 3rd GradeContent
Asian 2014-15 73.6% 54.8% 19.1% 35.7% 23.5% 21.7%
Mathematics 3rd GradeContent
Asian 2015-16 73.1% 45.7% 17.1% 28.7% 27.9% 26.4%
Mathematics 3rd GradeContent
Black or AfricanAmerican
2014-15 20.3% 24.1% 1.9% 22.2% 29.6% 46.3%
Mathematics 3rd GradeContent
Black or AfricanAmerican
2015-16 17.9% 21.2% 5.3% 15.9% 31.0% 47.8%
Mathematics 3rd GradeContent
Hispanic of AnyRace
2014-15 35.7% 53.3% 13.3% 40.0% 33.3% 13.3%
Mathematics 3rd GradeContent
Hispanic of AnyRace
2015-16 31.6% 42.1% 5.3% 36.8% 26.3% 31.6%
Mathematics 3rd GradeContent
Native Hawaiianor Other PacificIslander
2014-15 51.1% <10 <10 <10 <10 <10
Mathematics 3rd GradeContent
Native Hawaiianor Other PacificIslander
2015-16 46.2% <10 <10 <10 <10 <10
Annual Education ReportWarren Consolidated Schools02/07/2017
A service of the Center for Educational Performance and Information (CEPI) Page 13 of 91
M-STEP Grades 3-11
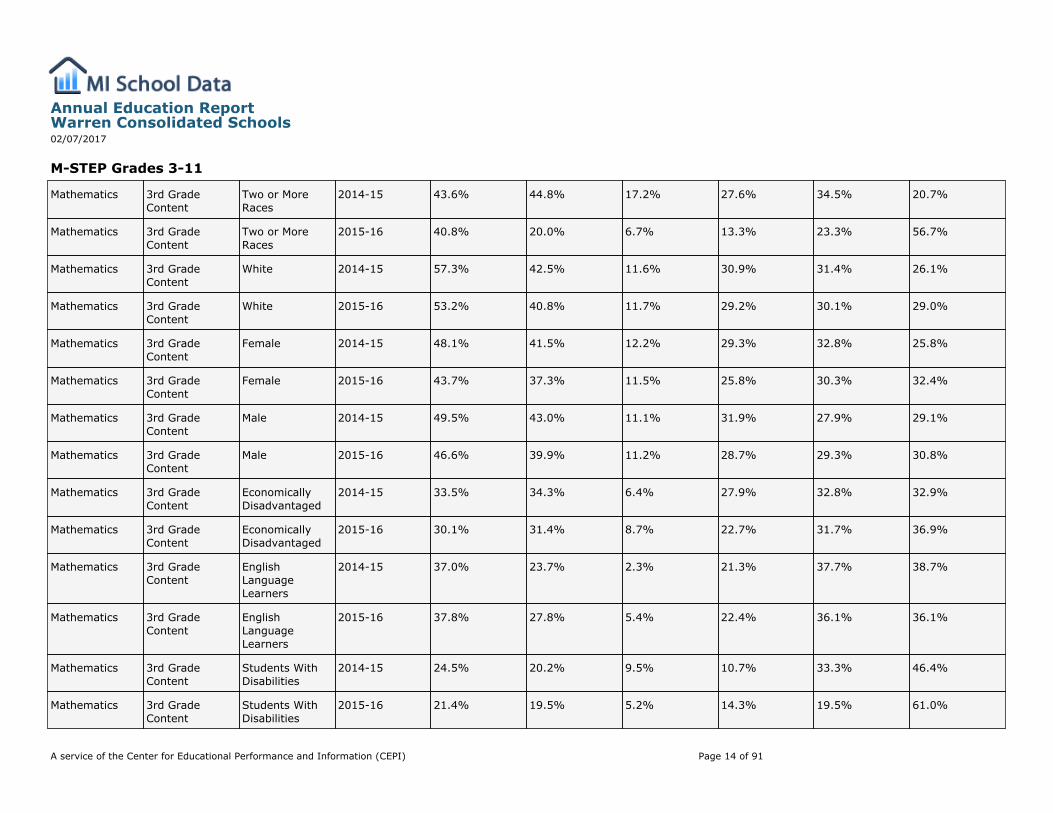
Mathematics 3rd GradeContent
Two or MoreRaces
2014-15 43.6% 44.8% 17.2% 27.6% 34.5% 20.7%
Mathematics 3rd GradeContent
Two or MoreRaces
2015-16 40.8% 20.0% 6.7% 13.3% 23.3% 56.7%
Mathematics 3rd GradeContent
White 2014-15 57.3% 42.5% 11.6% 30.9% 31.4% 26.1%
Mathematics 3rd GradeContent
White 2015-16 53.2% 40.8% 11.7% 29.2% 30.1% 29.0%
Mathematics 3rd GradeContent
Female 2014-15 48.1% 41.5% 12.2% 29.3% 32.8% 25.8%
Mathematics 3rd GradeContent
Female 2015-16 43.7% 37.3% 11.5% 25.8% 30.3% 32.4%
Mathematics 3rd GradeContent
Male 2014-15 49.5% 43.0% 11.1% 31.9% 27.9% 29.1%
Mathematics 3rd GradeContent
Male 2015-16 46.6% 39.9% 11.2% 28.7% 29.3% 30.8%
Mathematics 3rd GradeContent
EconomicallyDisadvantaged
2014-15 33.5% 34.3% 6.4% 27.9% 32.8% 32.9%
Mathematics 3rd GradeContent
EconomicallyDisadvantaged
2015-16 30.1% 31.4% 8.7% 22.7% 31.7% 36.9%
Mathematics 3rd GradeContent
EnglishLanguageLearners
2014-15 37.0% 23.7% 2.3% 21.3% 37.7% 38.7%
Mathematics 3rd GradeContent
EnglishLanguageLearners
2015-16 37.8% 27.8% 5.4% 22.4% 36.1% 36.1%
Mathematics 3rd GradeContent
Students WithDisabilities
2014-15 24.5% 20.2% 9.5% 10.7% 33.3% 46.4%
Mathematics 3rd GradeContent
Students WithDisabilities
2015-16 21.4% 19.5% 5.2% 14.3% 19.5% 61.0%
Annual Education ReportWarren Consolidated Schools02/07/2017
A service of the Center for Educational Performance and Information (CEPI) Page 14 of 91

M-STEP Grades 3-11
Mathematics 4th GradeContent
All Students 2014-15 41.4% 33.4% 10.2% 23.2% 42.3% 24.3%
Mathematics 4th GradeContent
All Students 2015-16 44.0% 40.4% 12.0% 28.5% 37.5% 22.1%
Mathematics 4th GradeContent
American Indianor Alaska Native
2014-15 31.9% <10 <10 <10 <10 <10
Mathematics 4th GradeContent
American Indianor Alaska Native
2015-16 39.1% <10 <10 <10 <10 <10
Mathematics 4th GradeContent
Asian 2014-15 69.7% 44.6% 16.5% 28.1% 40.5% 14.9%
Mathematics 4th GradeContent
Asian 2015-16 71.7% 49.2% 15.0% 34.2% 40.0% 10.8%
Mathematics 4th GradeContent
Black or AfricanAmerican
2014-15 13.2% 15.9% 5.6% 10.3% 44.9% 39.3%
Mathematics 4th GradeContent
Black or AfricanAmerican
2015-16 15.1% 23.4% 5.6% 17.8% 37.4% 39.3%
Mathematics 4th GradeContent
Hispanic of AnyRace
2014-15 27.1% 43.8% 6.3% 37.5% 31.3% 25.0%
Mathematics 4th GradeContent
Hispanic of AnyRace
2015-16 30.6% 40.0% 6.7% 33.3% 53.3% 6.7%
Mathematics 4th GradeContent
Native Hawaiianor Other PacificIslander
2014-15 42.3% <10 <10 <10 <10 <10
Mathematics 4th GradeContent
Native Hawaiianor Other PacificIslander
2015-16 52.9% <10 <10 <10 <10 <10
Mathematics 4th GradeContent
Two or MoreRaces
2014-15 38.2% 40.6% 9.4% 31.3% 43.8% 15.6%
Mathematics 4th GradeContent
Two or MoreRaces
2015-16 39.1% 41.4% 6.9% 34.5% 34.5% 24.1%
Annual Education ReportWarren Consolidated Schools02/07/2017
A service of the Center for Educational Performance and Information (CEPI) Page 15 of 91
M-STEP Grades 3-11
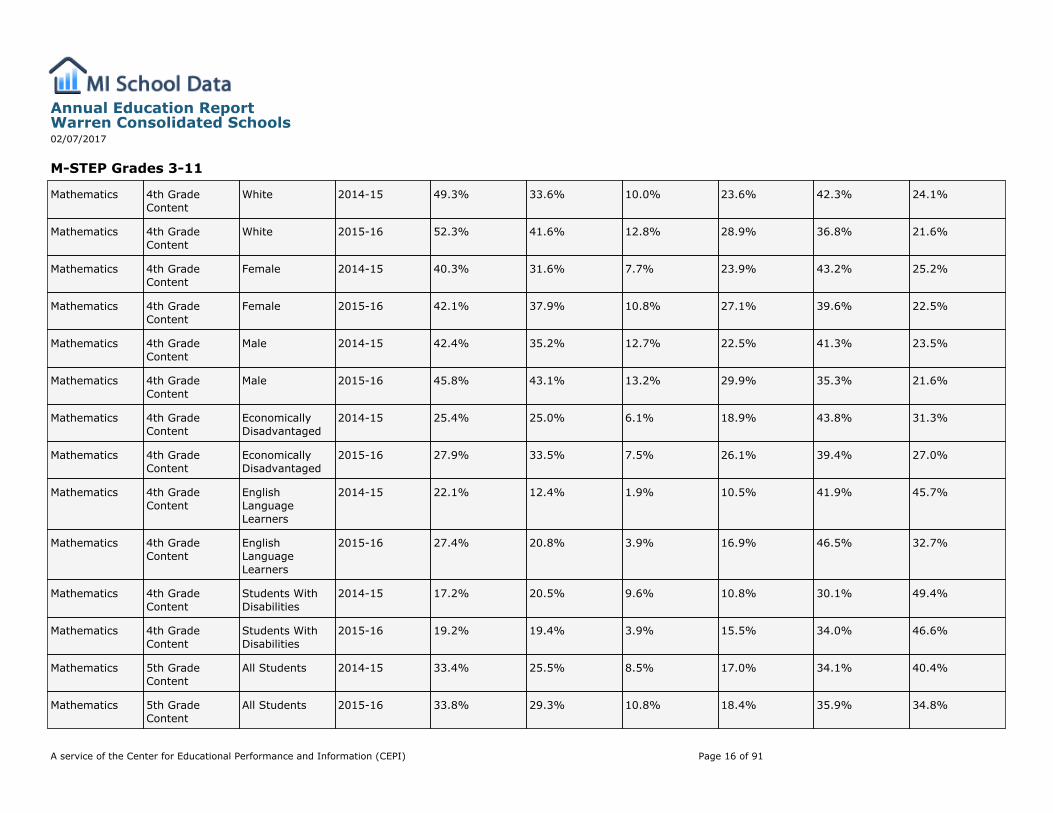
Mathematics 4th GradeContent
White 2014-15 49.3% 33.6% 10.0% 23.6% 42.3% 24.1%
Mathematics 4th GradeContent
White 2015-16 52.3% 41.6% 12.8% 28.9% 36.8% 21.6%
Mathematics 4th GradeContent
Female 2014-15 40.3% 31.6% 7.7% 23.9% 43.2% 25.2%
Mathematics 4th GradeContent
Female 2015-16 42.1% 37.9% 10.8% 27.1% 39.6% 22.5%
Mathematics 4th GradeContent
Male 2014-15 42.4% 35.2% 12.7% 22.5% 41.3% 23.5%
Mathematics 4th GradeContent
Male 2015-16 45.8% 43.1% 13.2% 29.9% 35.3% 21.6%
Mathematics 4th GradeContent
EconomicallyDisadvantaged
2014-15 25.4% 25.0% 6.1% 18.9% 43.8% 31.3%
Mathematics 4th GradeContent
EconomicallyDisadvantaged
2015-16 27.9% 33.5% 7.5% 26.1% 39.4% 27.0%
Mathematics 4th GradeContent
EnglishLanguageLearners
2014-15 22.1% 12.4% 1.9% 10.5% 41.9% 45.7%
Mathematics 4th GradeContent
EnglishLanguageLearners
2015-16 27.4% 20.8% 3.9% 16.9% 46.5% 32.7%
Mathematics 4th GradeContent
Students WithDisabilities
2014-15 17.2% 20.5% 9.6% 10.8% 30.1% 49.4%
Mathematics 4th GradeContent
Students WithDisabilities
2015-16 19.2% 19.4% 3.9% 15.5% 34.0% 46.6%
Mathematics 5th GradeContent
All Students 2014-15 33.4% 25.5% 8.5% 17.0% 34.1% 40.4%
Mathematics 5th GradeContent
All Students 2015-16 33.8% 29.3% 10.8% 18.4% 35.9% 34.8%
Annual Education ReportWarren Consolidated Schools02/07/2017
A service of the Center for Educational Performance and Information (CEPI) Page 16 of 91
M-STEP Grades 3-11
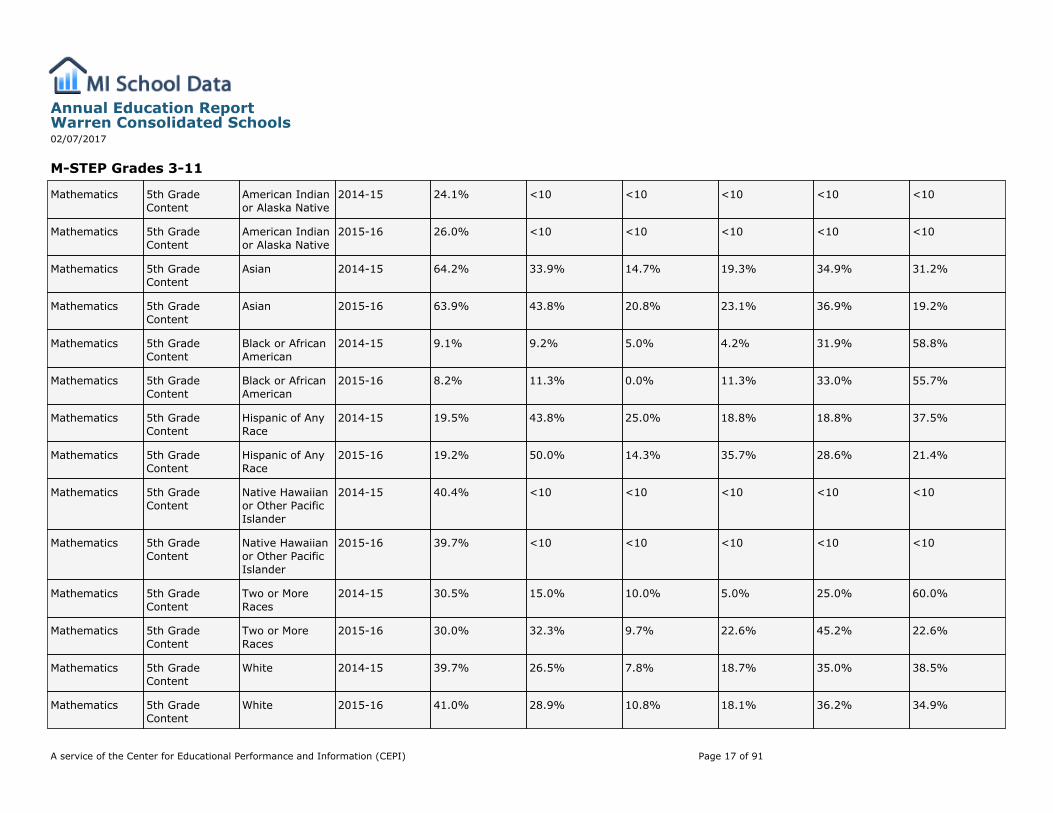
Mathematics 5th GradeContent
American Indianor Alaska Native
2014-15 24.1% <10 <10 <10 <10 <10
Mathematics 5th GradeContent
American Indianor Alaska Native
2015-16 26.0% <10 <10 <10 <10 <10
Mathematics 5th GradeContent
Asian 2014-15 64.2% 33.9% 14.7% 19.3% 34.9% 31.2%
Mathematics 5th GradeContent
Asian 2015-16 63.9% 43.8% 20.8% 23.1% 36.9% 19.2%
Mathematics 5th GradeContent
Black or AfricanAmerican
2014-15 9.1% 9.2% 5.0% 4.2% 31.9% 58.8%
Mathematics 5th GradeContent
Black or AfricanAmerican
2015-16 8.2% 11.3% 0.0% 11.3% 33.0% 55.7%
Mathematics 5th GradeContent
Hispanic of AnyRace
2014-15 19.5% 43.8% 25.0% 18.8% 18.8% 37.5%
Mathematics 5th GradeContent
Hispanic of AnyRace
2015-16 19.2% 50.0% 14.3% 35.7% 28.6% 21.4%
Mathematics 5th GradeContent
Native Hawaiianor Other PacificIslander
2014-15 40.4% <10 <10 <10 <10 <10
Mathematics 5th GradeContent
Native Hawaiianor Other PacificIslander
2015-16 39.7% <10 <10 <10 <10 <10
Mathematics 5th GradeContent
Two or MoreRaces
2014-15 30.5% 15.0% 10.0% 5.0% 25.0% 60.0%
Mathematics 5th GradeContent
Two or MoreRaces
2015-16 30.0% 32.3% 9.7% 22.6% 45.2% 22.6%
Mathematics 5th GradeContent
White 2014-15 39.7% 26.5% 7.8% 18.7% 35.0% 38.5%
Mathematics 5th GradeContent
White 2015-16 41.0% 28.9% 10.8% 18.1% 36.2% 34.9%
Annual Education ReportWarren Consolidated Schools02/07/2017
A service of the Center for Educational Performance and Information (CEPI) Page 17 of 91
M-STEP Grades 3-11
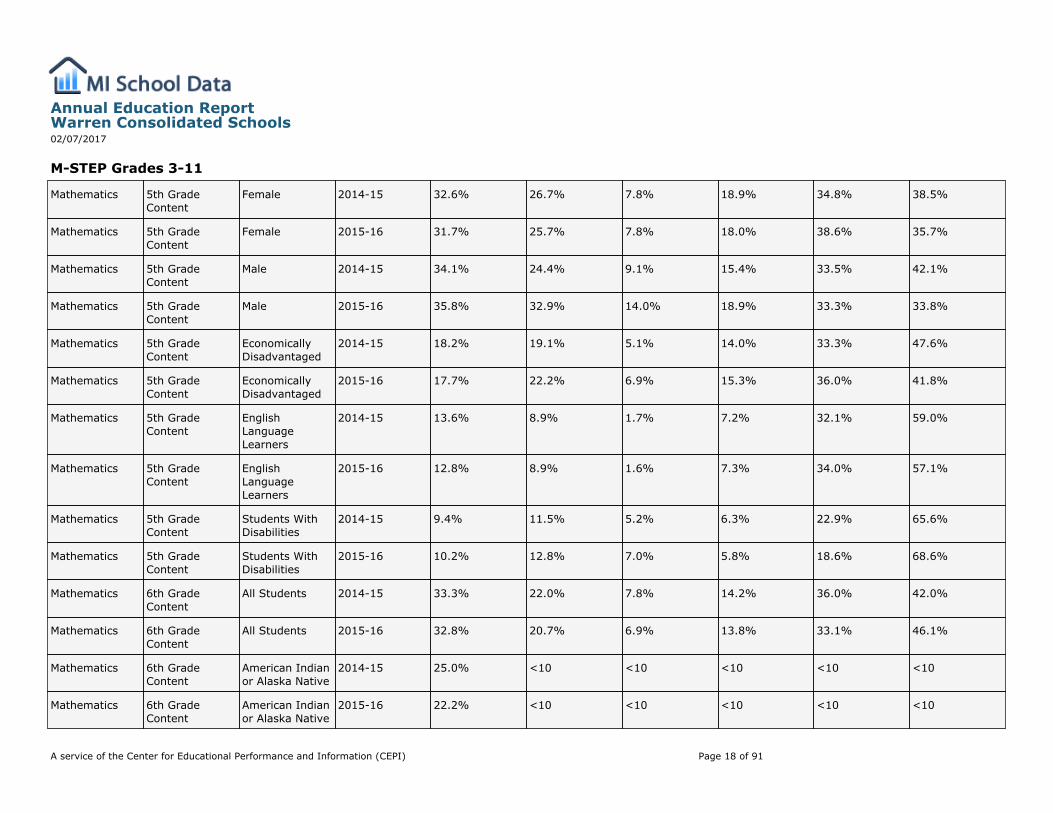
Mathematics 5th GradeContent
Female 2014-15 32.6% 26.7% 7.8% 18.9% 34.8% 38.5%
Mathematics 5th GradeContent
Female 2015-16 31.7% 25.7% 7.8% 18.0% 38.6% 35.7%
Mathematics 5th GradeContent
Male 2014-15 34.1% 24.4% 9.1% 15.4% 33.5% 42.1%
Mathematics 5th GradeContent
Male 2015-16 35.8% 32.9% 14.0% 18.9% 33.3% 33.8%
Mathematics 5th GradeContent
EconomicallyDisadvantaged
2014-15 18.2% 19.1% 5.1% 14.0% 33.3% 47.6%
Mathematics 5th GradeContent
EconomicallyDisadvantaged
2015-16 17.7% 22.2% 6.9% 15.3% 36.0% 41.8%
Mathematics 5th GradeContent
EnglishLanguageLearners
2014-15 13.6% 8.9% 1.7% 7.2% 32.1% 59.0%
Mathematics 5th GradeContent
EnglishLanguageLearners
2015-16 12.8% 8.9% 1.6% 7.3% 34.0% 57.1%
Mathematics 5th GradeContent
Students WithDisabilities
2014-15 9.4% 11.5% 5.2% 6.3% 22.9% 65.6%
Mathematics 5th GradeContent
Students WithDisabilities
2015-16 10.2% 12.8% 7.0% 5.8% 18.6% 68.6%
Mathematics 6th GradeContent
All Students 2014-15 33.3% 22.0% 7.8% 14.2% 36.0% 42.0%
Mathematics 6th GradeContent
All Students 2015-16 32.8% 20.7% 6.9% 13.8% 33.1% 46.1%
Mathematics 6th GradeContent
American Indianor Alaska Native
2014-15 25.0% <10 <10 <10 <10 <10
Mathematics 6th GradeContent
American Indianor Alaska Native
2015-16 22.2% <10 <10 <10 <10 <10
Annual Education ReportWarren Consolidated Schools02/07/2017
A service of the Center for Educational Performance and Information (CEPI) Page 18 of 91
M-STEP Grades 3-11
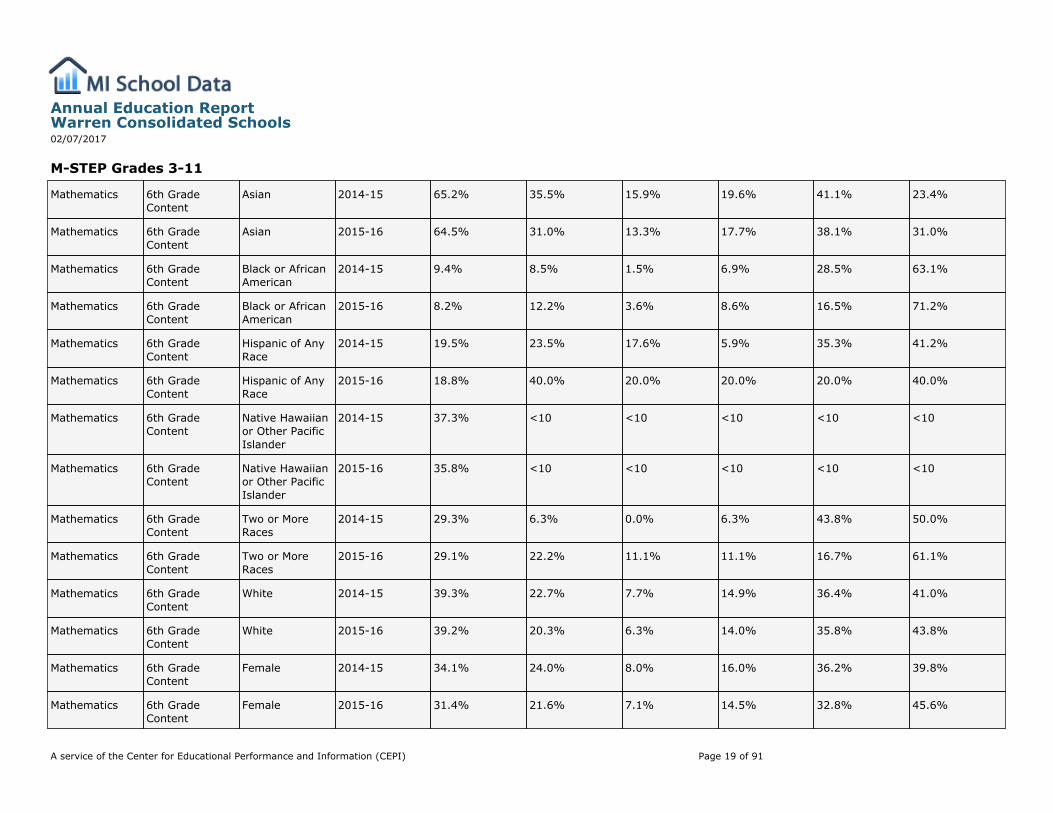
Mathematics 6th GradeContent
Asian 2014-15 65.2% 35.5% 15.9% 19.6% 41.1% 23.4%
Mathematics 6th GradeContent
Asian 2015-16 64.5% 31.0% 13.3% 17.7% 38.1% 31.0%
Mathematics 6th GradeContent
Black or AfricanAmerican
2014-15 9.4% 8.5% 1.5% 6.9% 28.5% 63.1%
Mathematics 6th GradeContent
Black or AfricanAmerican
2015-16 8.2% 12.2% 3.6% 8.6% 16.5% 71.2%
Mathematics 6th GradeContent
Hispanic of AnyRace
2014-15 19.5% 23.5% 17.6% 5.9% 35.3% 41.2%
Mathematics 6th GradeContent
Hispanic of AnyRace
2015-16 18.8% 40.0% 20.0% 20.0% 20.0% 40.0%
Mathematics 6th GradeContent
Native Hawaiianor Other PacificIslander
2014-15 37.3% <10 <10 <10 <10 <10
Mathematics 6th GradeContent
Native Hawaiianor Other PacificIslander
2015-16 35.8% <10 <10 <10 <10 <10
Mathematics 6th GradeContent
Two or MoreRaces
2014-15 29.3% 6.3% 0.0% 6.3% 43.8% 50.0%
Mathematics 6th GradeContent
Two or MoreRaces
2015-16 29.1% 22.2% 11.1% 11.1% 16.7% 61.1%
Mathematics 6th GradeContent
White 2014-15 39.3% 22.7% 7.7% 14.9% 36.4% 41.0%
Mathematics 6th GradeContent
White 2015-16 39.2% 20.3% 6.3% 14.0% 35.8% 43.8%
Mathematics 6th GradeContent
Female 2014-15 34.1% 24.0% 8.0% 16.0% 36.2% 39.8%
Mathematics 6th GradeContent
Female 2015-16 31.4% 21.6% 7.1% 14.5% 32.8% 45.6%
Annual Education ReportWarren Consolidated Schools02/07/2017
A service of the Center for Educational Performance and Information (CEPI) Page 19 of 91

M-STEP Grades 3-11
Mathematics 6th GradeContent
Male 2014-15 32.5% 20.1% 7.6% 12.5% 35.8% 44.1%
Mathematics 6th GradeContent
Male 2015-16 34.1% 19.9% 6.8% 13.2% 33.4% 46.6%
Mathematics 6th GradeContent
EconomicallyDisadvantaged
2014-15 17.6% 16.4% 4.3% 12.1% 34.2% 49.4%
Mathematics 6th GradeContent
EconomicallyDisadvantaged
2015-16 16.8% 13.3% 4.5% 8.8% 30.7% 55.9%
Mathematics 6th GradeContent
EnglishLanguageLearners
2014-15 11.5% 5.8% 2.2% 3.6% 25.0% 69.2%
Mathematics 6th GradeContent
EnglishLanguageLearners
2015-16 10.7% 5.9% 0.7% 5.2% 26.3% 67.8%
Mathematics 6th GradeContent
Students WithDisabilities
2014-15 7.8% 4.3% 2.2% 2.2% 17.2% 78.5%
Mathematics 6th GradeContent
Students WithDisabilities
2015-16 7.2% 1.9% 1.9% 0.0% 13.6% 84.5%
Mathematics 7th GradeContent
All Students 2014-15 33.3% 19.7% 6.2% 13.5% 30.1% 50.2%
Mathematics 7th GradeContent
All Students 2015-16 35.3% 22.9% 7.9% 15.1% 32.4% 44.6%
Mathematics 7th GradeContent
American Indianor Alaska Native
2014-15 22.0% <10 <10 <10 <10 <10
Mathematics 7th GradeContent
American Indianor Alaska Native
2015-16 26.2% <10 <10 <10 <10 <10
Mathematics 7th GradeContent
Asian 2014-15 66.4% 35.2% 16.2% 19.0% 33.3% 31.4%
Mathematics 7th GradeContent
Asian 2015-16 68.1% 33.6% 14.2% 19.5% 35.4% 31.0%
Annual Education ReportWarren Consolidated Schools02/07/2017
A service of the Center for Educational Performance and Information (CEPI) Page 20 of 91

M-STEP Grades 3-11
Mathematics 7th GradeContent
Black or AfricanAmerican
2014-15 10.6% 9.4% 1.4% 7.9% 25.9% 64.7%
Mathematics 7th GradeContent
Black or AfricanAmerican
2015-16 10.4% 10.4% 2.2% 8.1% 24.4% 65.2%
Mathematics 7th GradeContent
Hispanic of AnyRace
2014-15 19.3% 6.7% 0.0% 6.7% 26.7% 66.7%
Mathematics 7th GradeContent
Hispanic of AnyRace
2015-16 20.7% 27.3% 18.2% 9.1% 36.4% 36.4%
Mathematics 7th GradeContent
Native Hawaiianor Other PacificIslander
2014-15 41.8% <10 <10 <10 <10 <10
Mathematics 7th GradeContent
Native Hawaiianor Other PacificIslander
2015-16 34.7% <10 <10 <10 <10 <10
Mathematics 7th GradeContent
Two or MoreRaces
2014-15 29.2% 24.0% 8.0% 16.0% 24.0% 52.0%
Mathematics 7th GradeContent
Two or MoreRaces
2015-16 31.7% 6.7% 0.0% 6.7% 33.3% 60.0%
Mathematics 7th GradeContent
White 2014-15 39.0% 19.6% 5.8% 13.8% 30.6% 49.8%
Mathematics 7th GradeContent
White 2015-16 41.6% 23.7% 7.7% 16.0% 33.3% 43.0%
Mathematics 7th GradeContent
Female 2014-15 33.0% 19.3% 5.9% 13.3% 32.0% 48.7%
Mathematics 7th GradeContent
Female 2015-16 34.5% 22.5% 7.6% 14.9% 33.9% 43.6%
Mathematics 7th GradeContent
Male 2014-15 33.5% 20.1% 6.5% 13.6% 28.2% 51.7%
Mathematics 7th GradeContent
Male 2015-16 36.1% 23.3% 8.1% 15.2% 31.1% 45.6%
Annual Education ReportWarren Consolidated Schools02/07/2017
A service of the Center for Educational Performance and Information (CEPI) Page 21 of 91

M-STEP Grades 3-11
Mathematics 7th GradeContent
EconomicallyDisadvantaged
2014-15 17.8% 13.4% 3.7% 9.7% 26.5% 60.2%
Mathematics 7th GradeContent
EconomicallyDisadvantaged
2015-16 18.7% 16.3% 5.7% 10.6% 32.2% 51.5%
Mathematics 7th GradeContent
EnglishLanguageLearners
2014-15 12.0% 2.7% 0.5% 2.3% 18.1% 79.2%
Mathematics 7th GradeContent
EnglishLanguageLearners
2015-16 13.0% 5.4% 2.5% 2.9% 24.1% 70.5%
Mathematics 7th GradeContent
Students WithDisabilities
2014-15 6.5% 2.1% 1.1% 1.1% 8.5% 89.4%
Mathematics 7th GradeContent
Students WithDisabilities
2015-16 7.7% 8.8% 2.9% 5.9% 10.8% 80.4%
Mathematics 8th GradeContent
All Students 2014-15 32.2% 22.0% 9.4% 12.6% 27.8% 50.2%
Mathematics 8th GradeContent
All Students 2015-16 32.7% 24.2% 9.1% 15.0% 26.4% 49.4%
Mathematics 8th GradeContent
American Indianor Alaska Native
2014-15 19.8% <10 <10 <10 <10 <10
Mathematics 8th GradeContent
American Indianor Alaska Native
2015-16 21.5% <10 <10 <10 <10 <10
Mathematics 8th GradeContent
Asian 2014-15 65.5% 39.0% 17.1% 21.9% 29.5% 31.4%
Mathematics 8th GradeContent
Asian 2015-16 67.6% 48.7% 20.0% 28.7% 20.0% 31.3%
Mathematics 8th GradeContent
Black or AfricanAmerican
2014-15 9.7% 5.2% 3.0% 2.2% 17.2% 77.6%
Mathematics 8th GradeContent
Black or AfricanAmerican
2015-16 9.9% 8.4% 3.5% 4.9% 33.6% 58.0%
Annual Education ReportWarren Consolidated Schools02/07/2017
A service of the Center for Educational Performance and Information (CEPI) Page 22 of 91
M-STEP Grades 3-11
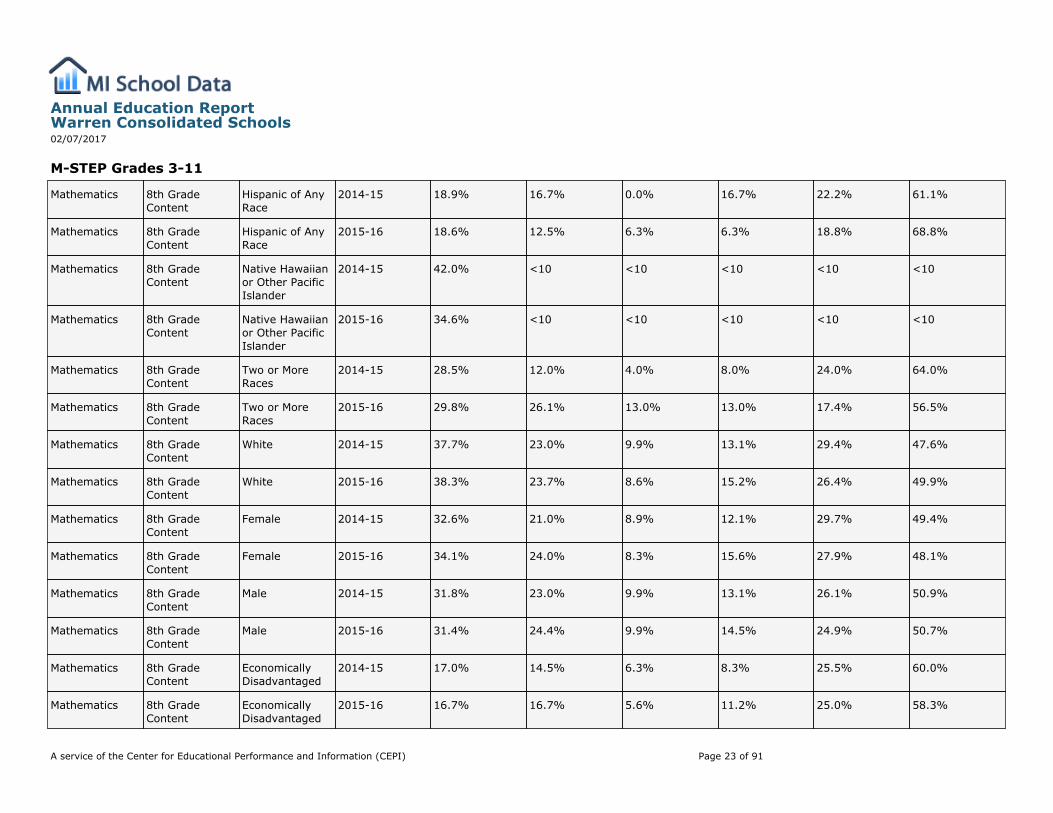
Mathematics 8th GradeContent
Hispanic of AnyRace
2014-15 18.9% 16.7% 0.0% 16.7% 22.2% 61.1%
Mathematics 8th GradeContent
Hispanic of AnyRace
2015-16 18.6% 12.5% 6.3% 6.3% 18.8% 68.8%
Mathematics 8th GradeContent
Native Hawaiianor Other PacificIslander
2014-15 42.0% <10 <10 <10 <10 <10
Mathematics 8th GradeContent
Native Hawaiianor Other PacificIslander
2015-16 34.6% <10 <10 <10 <10 <10
Mathematics 8th GradeContent
Two or MoreRaces
2014-15 28.5% 12.0% 4.0% 8.0% 24.0% 64.0%
Mathematics 8th GradeContent
Two or MoreRaces
2015-16 29.8% 26.1% 13.0% 13.0% 17.4% 56.5%
Mathematics 8th GradeContent
White 2014-15 37.7% 23.0% 9.9% 13.1% 29.4% 47.6%
Mathematics 8th GradeContent
White 2015-16 38.3% 23.7% 8.6% 15.2% 26.4% 49.9%
Mathematics 8th GradeContent
Female 2014-15 32.6% 21.0% 8.9% 12.1% 29.7% 49.4%
Mathematics 8th GradeContent
Female 2015-16 34.1% 24.0% 8.3% 15.6% 27.9% 48.1%
Mathematics 8th GradeContent
Male 2014-15 31.8% 23.0% 9.9% 13.1% 26.1% 50.9%
Mathematics 8th GradeContent
Male 2015-16 31.4% 24.4% 9.9% 14.5% 24.9% 50.7%
Mathematics 8th GradeContent
EconomicallyDisadvantaged
2014-15 17.0% 14.5% 6.3% 8.3% 25.5% 60.0%
Mathematics 8th GradeContent
EconomicallyDisadvantaged
2015-16 16.7% 16.7% 5.6% 11.2% 25.0% 58.3%
Annual Education ReportWarren Consolidated Schools02/07/2017
A service of the Center for Educational Performance and Information (CEPI) Page 23 of 91
M-STEP Grades 3-11
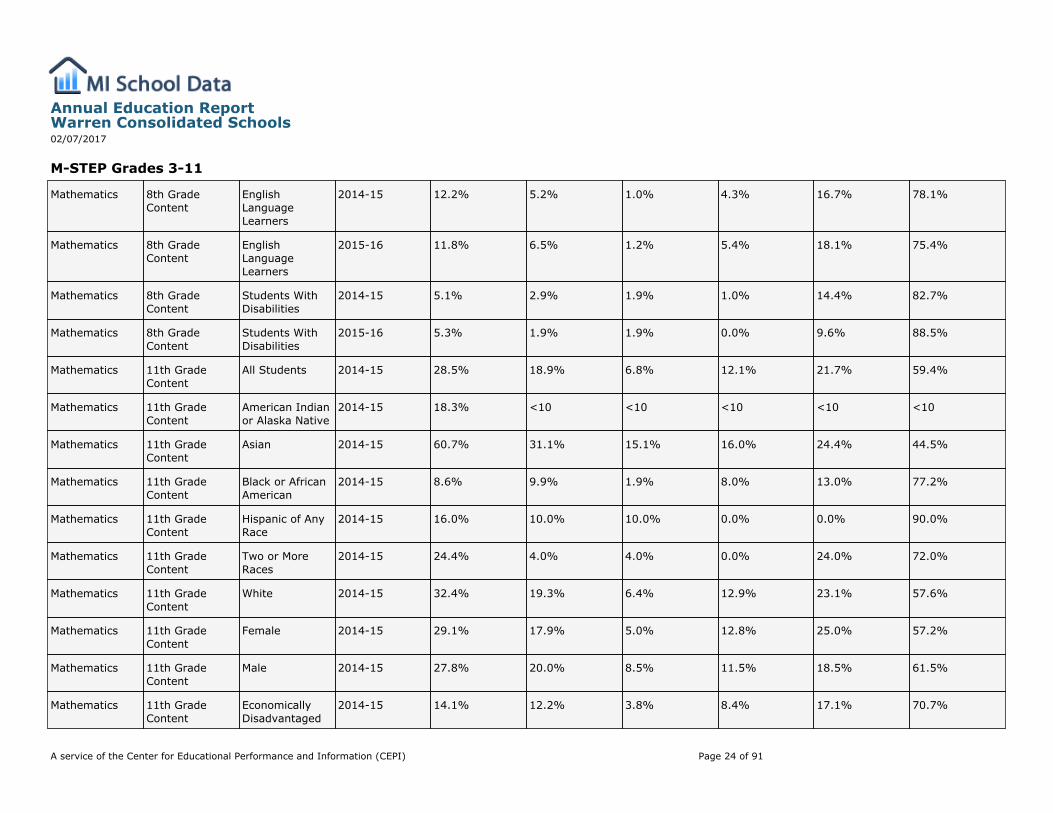
Mathematics 8th GradeContent
EnglishLanguageLearners
2014-15 12.2% 5.2% 1.0% 4.3% 16.7% 78.1%
Mathematics 8th GradeContent
EnglishLanguageLearners
2015-16 11.8% 6.5% 1.2% 5.4% 18.1% 75.4%
Mathematics 8th GradeContent
Students WithDisabilities
2014-15 5.1% 2.9% 1.9% 1.0% 14.4% 82.7%
Mathematics 8th GradeContent
Students WithDisabilities
2015-16 5.3% 1.9% 1.9% 0.0% 9.6% 88.5%
Mathematics 11th GradeContent
All Students 2014-15 28.5% 18.9% 6.8% 12.1% 21.7% 59.4%
Mathematics 11th GradeContent
American Indianor Alaska Native
2014-15 18.3% <10 <10 <10 <10 <10
Mathematics 11th GradeContent
Asian 2014-15 60.7% 31.1% 15.1% 16.0% 24.4% 44.5%
Mathematics 11th GradeContent
Black or AfricanAmerican
2014-15 8.6% 9.9% 1.9% 8.0% 13.0% 77.2%
Mathematics 11th GradeContent
Hispanic of AnyRace
2014-15 16.0% 10.0% 10.0% 0.0% 0.0% 90.0%
Mathematics 11th GradeContent
Two or MoreRaces
2014-15 24.4% 4.0% 4.0% 0.0% 24.0% 72.0%
Mathematics 11th GradeContent
White 2014-15 32.4% 19.3% 6.4% 12.9% 23.1% 57.6%
Mathematics 11th GradeContent
Female 2014-15 29.1% 17.9% 5.0% 12.8% 25.0% 57.2%
Mathematics 11th GradeContent
Male 2014-15 27.8% 20.0% 8.5% 11.5% 18.5% 61.5%
Mathematics 11th GradeContent
EconomicallyDisadvantaged
2014-15 14.1% 12.2% 3.8% 8.4% 17.1% 70.7%
Annual Education ReportWarren Consolidated Schools02/07/2017
A service of the Center for Educational Performance and Information (CEPI) Page 24 of 91
M-STEP Grades 3-11
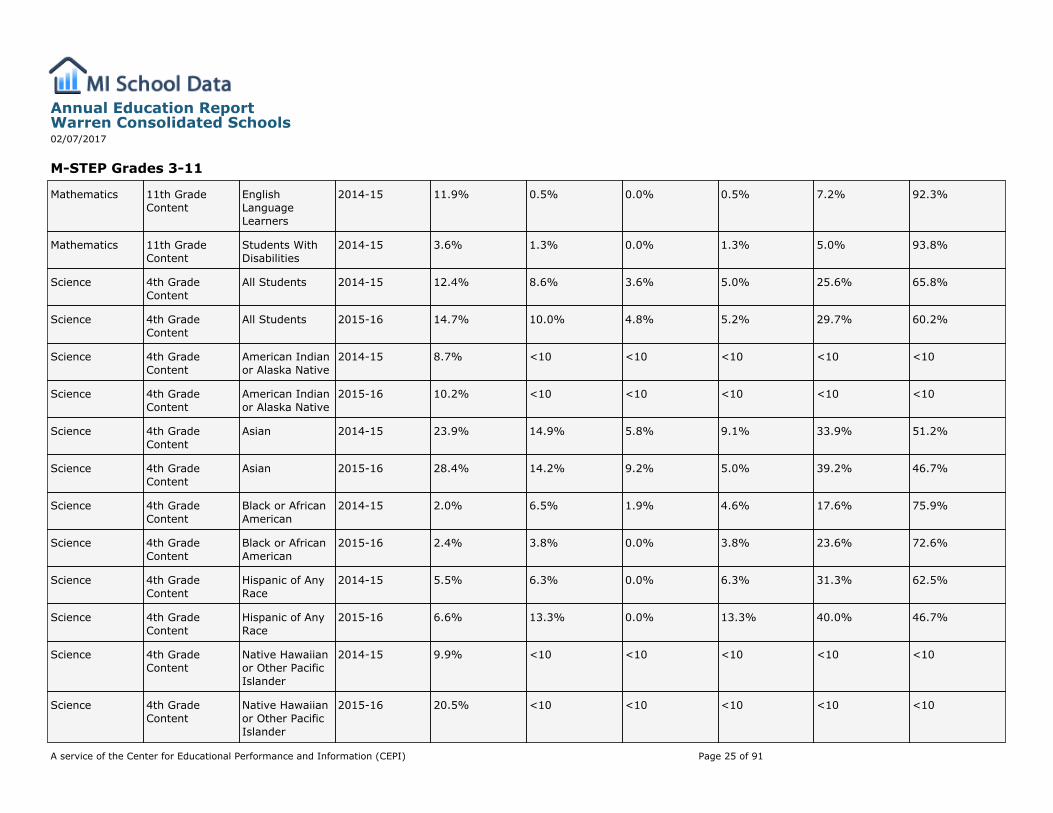
Mathematics 11th GradeContent
EnglishLanguageLearners
2014-15 11.9% 0.5% 0.0% 0.5% 7.2% 92.3%
Mathematics 11th GradeContent
Students WithDisabilities
2014-15 3.6% 1.3% 0.0% 1.3% 5.0% 93.8%
Science 4th GradeContent
All Students 2014-15 12.4% 8.6% 3.6% 5.0% 25.6% 65.8%
Science 4th GradeContent
All Students 2015-16 14.7% 10.0% 4.8% 5.2% 29.7% 60.2%
Science 4th GradeContent
American Indianor Alaska Native
2014-15 8.7% <10 <10 <10 <10 <10
Science 4th GradeContent
American Indianor Alaska Native
2015-16 10.2% <10 <10 <10 <10 <10
Science 4th GradeContent
Asian 2014-15 23.9% 14.9% 5.8% 9.1% 33.9% 51.2%
Science 4th GradeContent
Asian 2015-16 28.4% 14.2% 9.2% 5.0% 39.2% 46.7%
Science 4th GradeContent
Black or AfricanAmerican
2014-15 2.0% 6.5% 1.9% 4.6% 17.6% 75.9%
Science 4th GradeContent
Black or AfricanAmerican
2015-16 2.4% 3.8% 0.0% 3.8% 23.6% 72.6%
Science 4th GradeContent
Hispanic of AnyRace
2014-15 5.5% 6.3% 0.0% 6.3% 31.3% 62.5%
Science 4th GradeContent
Hispanic of AnyRace
2015-16 6.6% 13.3% 0.0% 13.3% 40.0% 46.7%
Science 4th GradeContent
Native Hawaiianor Other PacificIslander
2014-15 9.9% <10 <10 <10 <10 <10
Science 4th GradeContent
Native Hawaiianor Other PacificIslander
2015-16 20.5% <10 <10 <10 <10 <10
Annual Education ReportWarren Consolidated Schools02/07/2017
A service of the Center for Educational Performance and Information (CEPI) Page 25 of 91

M-STEP Grades 3-11
Science 4th GradeContent
Two or MoreRaces
2014-15 11.8% 6.3% 6.3% 0.0% 25.0% 68.8%
Science 4th GradeContent
Two or MoreRaces
2015-16 12.5% 24.1% 17.2% 6.9% 13.8% 62.1%
Science 4th GradeContent
White 2014-15 15.4% 8.1% 3.5% 4.6% 25.4% 66.5%
Science 4th GradeContent
White 2015-16 18.4% 9.7% 4.4% 5.2% 29.6% 60.7%
Science 4th GradeContent
Female 2014-15 10.4% 6.8% 2.8% 3.9% 25.2% 68.0%
Science 4th GradeContent
Female 2015-16 13.0% 10.6% 4.8% 5.8% 28.1% 61.3%
Science 4th GradeContent
Male 2014-15 14.3% 10.4% 4.4% 6.0% 26.1% 63.5%
Science 4th GradeContent
Male 2015-16 16.4% 9.5% 4.8% 4.6% 31.4% 59.2%
Science 4th GradeContent
EconomicallyDisadvantaged
2014-15 5.5% 4.2% 1.3% 3.0% 20.7% 75.1%
Science 4th GradeContent
EconomicallyDisadvantaged
2015-16 6.6% 6.4% 2.3% 4.1% 26.7% 66.9%
Science 4th GradeContent
EnglishLanguageLearners
2014-15 2.2% 0.0% 0.0% 0.0% 7.7% 92.3%
Science 4th GradeContent
EnglishLanguageLearners
2015-16 2.9% 2.5% 0.7% 1.8% 15.9% 81.6%
Science 4th GradeContent
Students WithDisabilities
2014-15 4.6% 8.3% 0.0% 8.3% 8.3% 83.3%
Science 4th GradeContent
Students WithDisabilities
2015-16 5.3% 4.9% 2.0% 2.9% 14.7% 80.4%
Annual Education ReportWarren Consolidated Schools02/07/2017
A service of the Center for Educational Performance and Information (CEPI) Page 26 of 91
M-STEP Grades 3-11
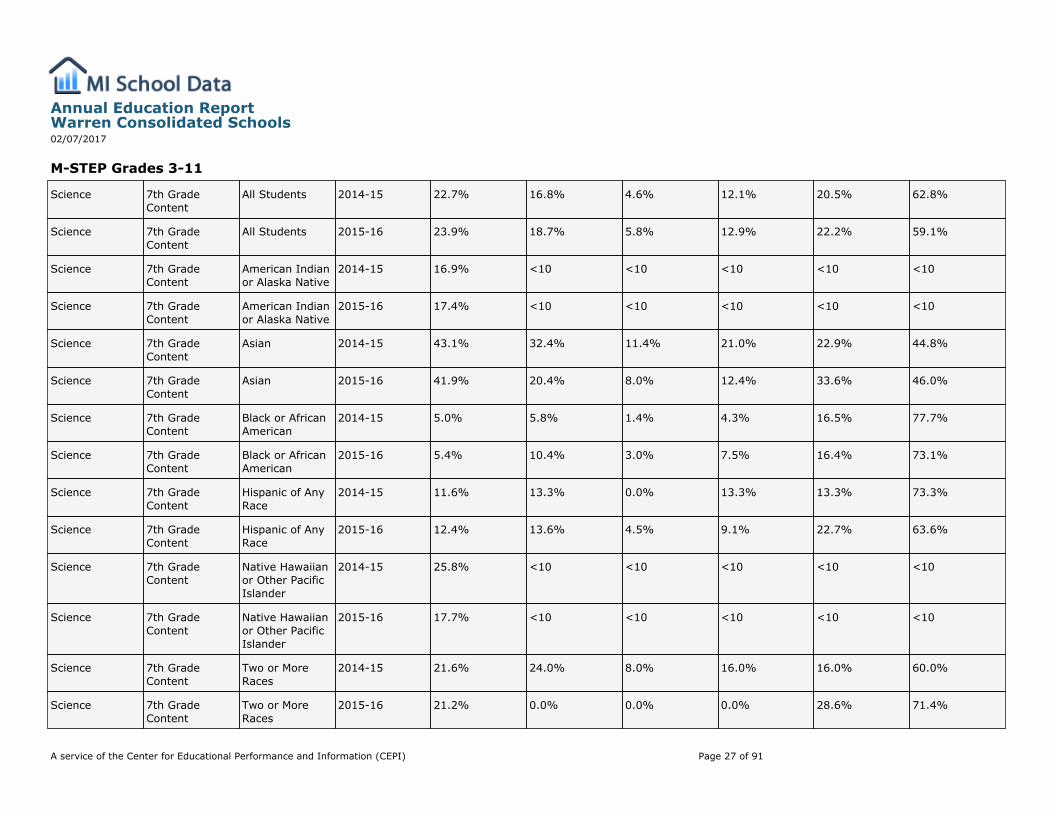
Science 7th GradeContent
All Students 2014-15 22.7% 16.8% 4.6% 12.1% 20.5% 62.8%
Science 7th GradeContent
All Students 2015-16 23.9% 18.7% 5.8% 12.9% 22.2% 59.1%
Science 7th GradeContent
American Indianor Alaska Native
2014-15 16.9% <10 <10 <10 <10 <10
Science 7th GradeContent
American Indianor Alaska Native
2015-16 17.4% <10 <10 <10 <10 <10
Science 7th GradeContent
Asian 2014-15 43.1% 32.4% 11.4% 21.0% 22.9% 44.8%
Science 7th GradeContent
Asian 2015-16 41.9% 20.4% 8.0% 12.4% 33.6% 46.0%
Science 7th GradeContent
Black or AfricanAmerican
2014-15 5.0% 5.8% 1.4% 4.3% 16.5% 77.7%
Science 7th GradeContent
Black or AfricanAmerican
2015-16 5.4% 10.4% 3.0% 7.5% 16.4% 73.1%
Science 7th GradeContent
Hispanic of AnyRace
2014-15 11.6% 13.3% 0.0% 13.3% 13.3% 73.3%
Science 7th GradeContent
Hispanic of AnyRace
2015-16 12.4% 13.6% 4.5% 9.1% 22.7% 63.6%
Science 7th GradeContent
Native Hawaiianor Other PacificIslander
2014-15 25.8% <10 <10 <10 <10 <10
Science 7th GradeContent
Native Hawaiianor Other PacificIslander
2015-16 17.7% <10 <10 <10 <10 <10
Science 7th GradeContent
Two or MoreRaces
2014-15 21.6% 24.0% 8.0% 16.0% 16.0% 60.0%
Science 7th GradeContent
Two or MoreRaces
2015-16 21.2% 0.0% 0.0% 0.0% 28.6% 71.4%
Annual Education ReportWarren Consolidated Schools02/07/2017
A service of the Center for Educational Performance and Information (CEPI) Page 27 of 91

M-STEP Grades 3-11
Science 7th GradeContent
White 2014-15 27.4% 16.5% 4.3% 12.2% 21.1% 62.4%
Science 7th GradeContent
White 2015-16 28.9% 20.2% 5.9% 14.3% 21.6% 58.2%
Science 7th GradeContent
Female 2014-15 20.8% 14.6% 5.0% 9.6% 22.7% 62.7%
Science 7th GradeContent
Female 2015-16 22.6% 16.9% 5.4% 11.5% 23.8% 59.2%
Science 7th GradeContent
Male 2014-15 24.6% 18.9% 4.3% 14.6% 18.3% 62.8%
Science 7th GradeContent
Male 2015-16 25.1% 20.3% 6.1% 14.2% 20.7% 59.0%
Science 7th GradeContent
EconomicallyDisadvantaged
2014-15 10.9% 10.2% 1.5% 8.6% 16.0% 73.8%
Science 7th GradeContent
EconomicallyDisadvantaged
2015-16 11.7% 12.0% 3.0% 9.0% 19.6% 68.4%
Science 7th GradeContent
EnglishLanguageLearners
2014-15 2.3% 1.8% 0.0% 1.8% 6.3% 91.9%
Science 7th GradeContent
EnglishLanguageLearners
2015-16 3.5% 1.2% 0.4% 0.8% 10.0% 88.8%
Science 7th GradeContent
Students WithDisabilities
2014-15 4.7% 2.2% 1.1% 1.1% 3.2% 94.6%
Science 7th GradeContent
Students WithDisabilities
2015-16 5.6% 5.0% 2.0% 3.0% 8.0% 87.0%
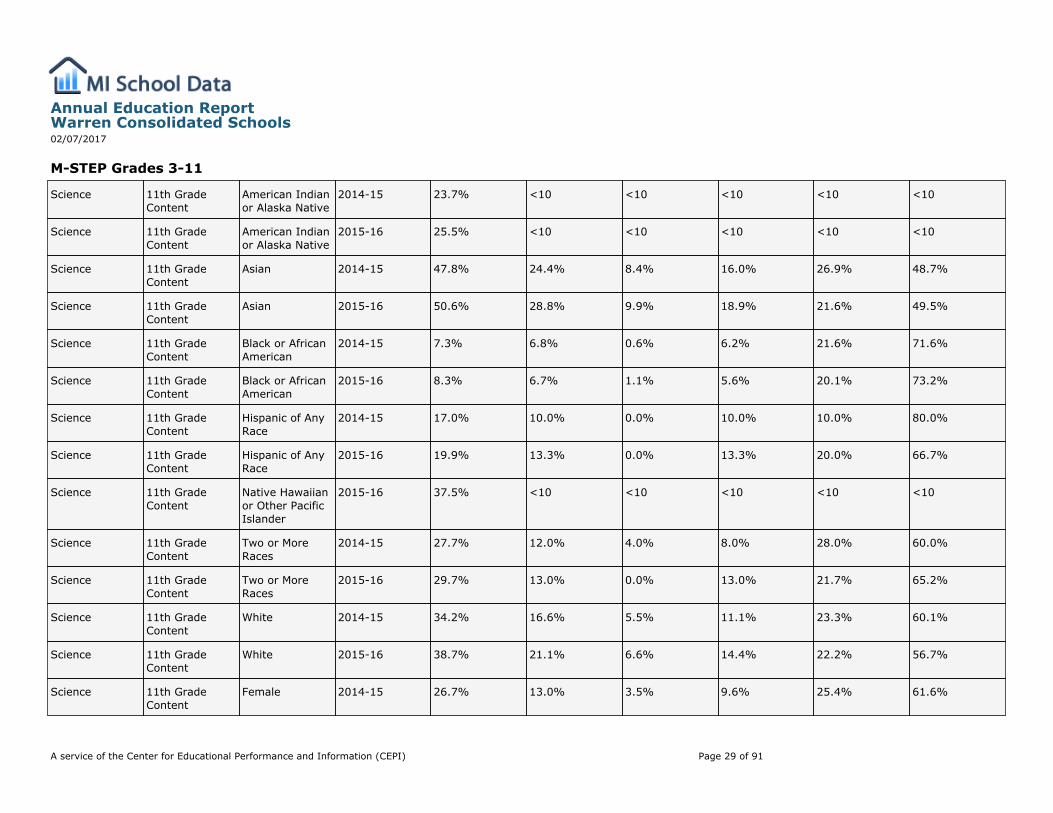
Science 11th GradeContent
All Students 2014-15 29.4% 16.0% 5.1% 10.9% 23.3% 60.6%
Science 11th GradeContent
All Students 2015-16 33.0% 19.3% 6.0% 13.4% 21.8% 58.8%
Annual Education ReportWarren Consolidated Schools02/07/2017
A service of the Center for Educational Performance and Information (CEPI) Page 28 of 91
M-STEP Grades 3-11
Science 11th GradeContent
American Indianor Alaska Native
2014-15 23.7% <10 <10 <10 <10 <10
Science 11th GradeContent
American Indianor Alaska Native
2015-16 25.5% <10 <10 <10 <10 <10
Science 11th GradeContent
Asian 2014-15 47.8% 24.4% 8.4% 16.0% 26.9% 48.7%
Science 11th GradeContent
Asian 2015-16 50.6% 28.8% 9.9% 18.9% 21.6% 49.5%
Science 11th GradeContent
Black or AfricanAmerican
2014-15 7.3% 6.8% 0.6% 6.2% 21.6% 71.6%
Science 11th GradeContent
Black or AfricanAmerican
2015-16 8.3% 6.7% 1.1% 5.6% 20.1% 73.2%
Science 11th GradeContent
Hispanic of AnyRace
2014-15 17.0% 10.0% 0.0% 10.0% 10.0% 80.0%
Science 11th GradeContent
Hispanic of AnyRace
2015-16 19.9% 13.3% 0.0% 13.3% 20.0% 66.7%
Science 11th GradeContent
Native Hawaiianor Other PacificIslander
2015-16 37.5% <10 <10 <10 <10 <10
Science 11th GradeContent
Two or MoreRaces
2014-15 27.7% 12.0% 4.0% 8.0% 28.0% 60.0%
Science 11th GradeContent
Two or MoreRaces
2015-16 29.7% 13.0% 0.0% 13.0% 21.7% 65.2%
Science 11th GradeContent
White 2014-15 34.2% 16.6% 5.5% 11.1% 23.3% 60.1%
Science 11th GradeContent
White 2015-16 38.7% 21.1% 6.6% 14.4% 22.2% 56.7%
Science 11th GradeContent
Female 2014-15 26.7% 13.0% 3.5% 9.6% 25.4% 61.6%
Annual Education ReportWarren Consolidated Schools02/07/2017
A service of the Center for Educational Performance and Information (CEPI) Page 29 of 91
M-STEP Grades 3-11
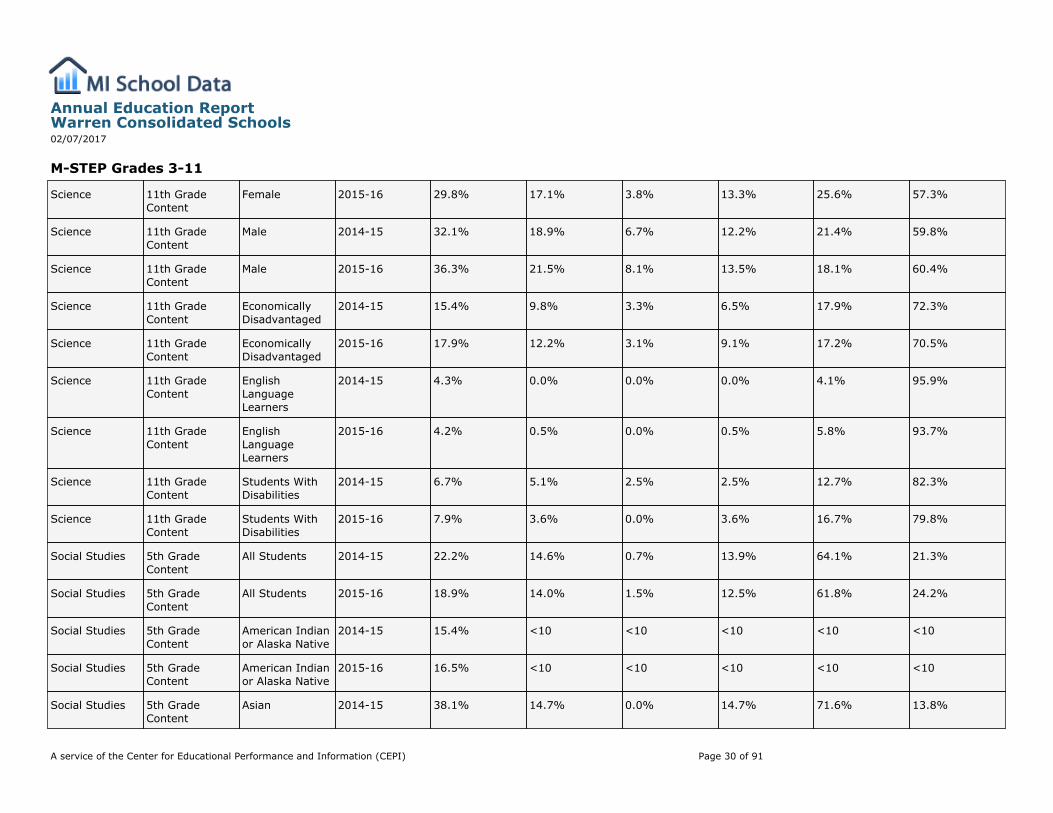
Science 11th GradeContent
Female 2015-16 29.8% 17.1% 3.8% 13.3% 25.6% 57.3%
Science 11th GradeContent
Male 2014-15 32.1% 18.9% 6.7% 12.2% 21.4% 59.8%
Science 11th GradeContent
Male 2015-16 36.3% 21.5% 8.1% 13.5% 18.1% 60.4%
Science 11th GradeContent
EconomicallyDisadvantaged
2014-15 15.4% 9.8% 3.3% 6.5% 17.9% 72.3%
Science 11th GradeContent
EconomicallyDisadvantaged
2015-16 17.9% 12.2% 3.1% 9.1% 17.2% 70.5%
Science 11th GradeContent
EnglishLanguageLearners
2014-15 4.3% 0.0% 0.0% 0.0% 4.1% 95.9%
Science 11th GradeContent
EnglishLanguageLearners
2015-16 4.2% 0.5% 0.0% 0.5% 5.8% 93.7%
Science 11th GradeContent
Students WithDisabilities
2014-15 6.7% 5.1% 2.5% 2.5% 12.7% 82.3%
Science 11th GradeContent
Students WithDisabilities
2015-16 7.9% 3.6% 0.0% 3.6% 16.7% 79.8%
Social Studies 5th GradeContent
All Students 2014-15 22.2% 14.6% 0.7% 13.9% 64.1% 21.3%
Social Studies 5th GradeContent
All Students 2015-16 18.9% 14.0% 1.5% 12.5% 61.8% 24.2%
Social Studies 5th GradeContent
American Indianor Alaska Native
2014-15 15.4% <10 <10 <10 <10 <10
Social Studies 5th GradeContent
American Indianor Alaska Native
2015-16 16.5% <10 <10 <10 <10 <10
Social Studies 5th GradeContent
Asian 2014-15 38.1% 14.7% 0.0% 14.7% 71.6% 13.8%
Annual Education ReportWarren Consolidated Schools02/07/2017
A service of the Center for Educational Performance and Information (CEPI) Page 30 of 91
M-STEP Grades 3-11
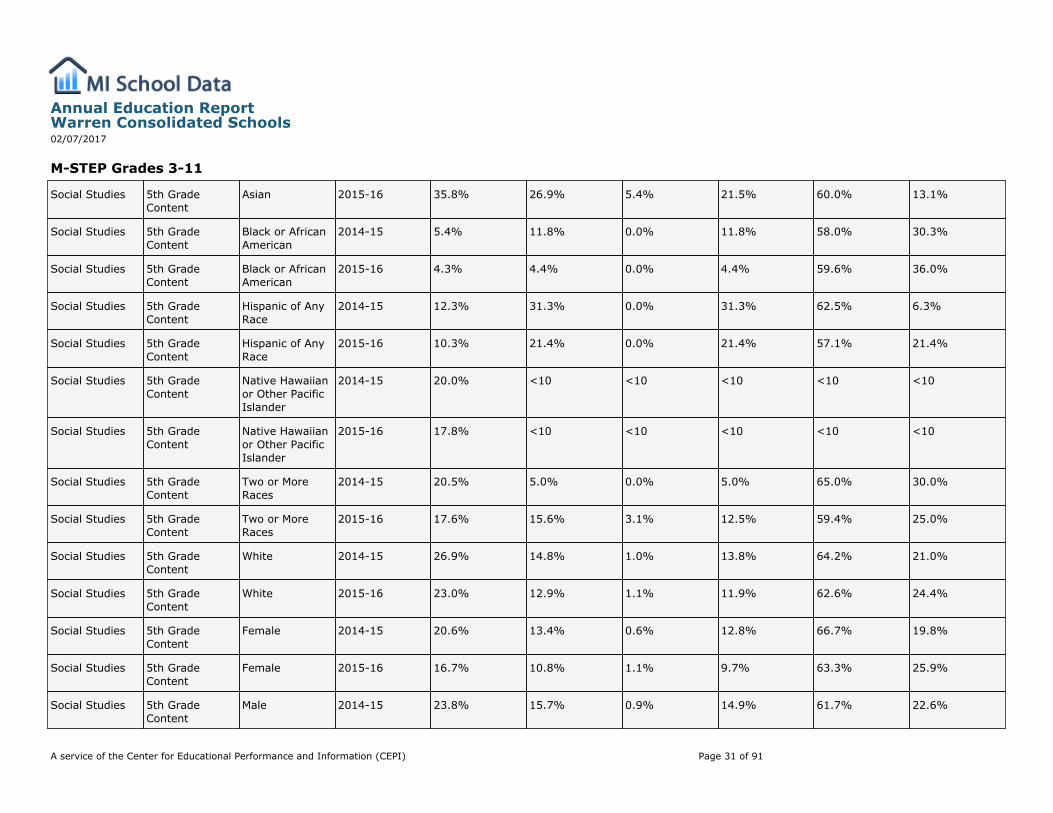
Social Studies 5th GradeContent
Asian 2015-16 35.8% 26.9% 5.4% 21.5% 60.0% 13.1%
Social Studies 5th GradeContent
Black or AfricanAmerican
2014-15 5.4% 11.8% 0.0% 11.8% 58.0% 30.3%
Social Studies 5th GradeContent
Black or AfricanAmerican
2015-16 4.3% 4.4% 0.0% 4.4% 59.6% 36.0%
Social Studies 5th GradeContent
Hispanic of AnyRace
2014-15 12.3% 31.3% 0.0% 31.3% 62.5% 6.3%
Social Studies 5th GradeContent
Hispanic of AnyRace
2015-16 10.3% 21.4% 0.0% 21.4% 57.1% 21.4%
Social Studies 5th GradeContent
Native Hawaiianor Other PacificIslander
2014-15 20.0% <10 <10 <10 <10 <10
Social Studies 5th GradeContent
Native Hawaiianor Other PacificIslander
2015-16 17.8% <10 <10 <10 <10 <10
Social Studies 5th GradeContent
Two or MoreRaces
2014-15 20.5% 5.0% 0.0% 5.0% 65.0% 30.0%
Social Studies 5th GradeContent
Two or MoreRaces
2015-16 17.6% 15.6% 3.1% 12.5% 59.4% 25.0%
Social Studies 5th GradeContent
White 2014-15 26.9% 14.8% 1.0% 13.8% 64.2% 21.0%
Social Studies 5th GradeContent
White 2015-16 23.0% 12.9% 1.1% 11.9% 62.6% 24.4%
Social Studies 5th GradeContent
Female 2014-15 20.6% 13.4% 0.6% 12.8% 66.7% 19.8%
Social Studies 5th GradeContent
Female 2015-16 16.7% 10.8% 1.1% 9.7% 63.3% 25.9%
Social Studies 5th GradeContent
Male 2014-15 23.8% 15.7% 0.9% 14.9% 61.7% 22.6%
Annual Education ReportWarren Consolidated Schools02/07/2017
A service of the Center for Educational Performance and Information (CEPI) Page 31 of 91
M-STEP Grades 3-11
Social Studies 5th GradeContent
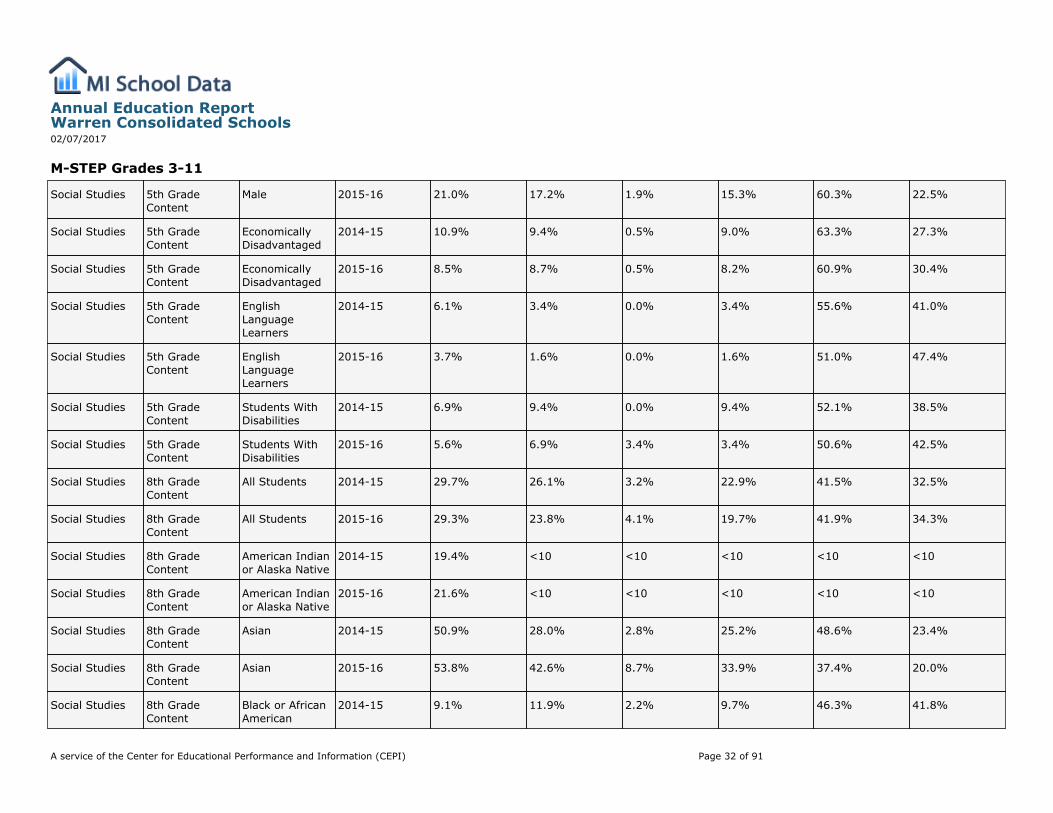
Male 2015-16 21.0% 17.2% 1.9% 15.3% 60.3% 22.5%
Social Studies 5th GradeContent
EconomicallyDisadvantaged
2014-15 10.9% 9.4% 0.5% 9.0% 63.3% 27.3%
Social Studies 5th GradeContent
EconomicallyDisadvantaged
2015-16 8.5% 8.7% 0.5% 8.2% 60.9% 30.4%
Social Studies 5th GradeContent
EnglishLanguageLearners
2014-15 6.1% 3.4% 0.0% 3.4% 55.6% 41.0%
Social Studies 5th GradeContent
EnglishLanguageLearners
2015-16 3.7% 1.6% 0.0% 1.6% 51.0% 47.4%
Social Studies 5th GradeContent
Students WithDisabilities
2014-15 6.9% 9.4% 0.0% 9.4% 52.1% 38.5%
Social Studies 5th GradeContent
Students WithDisabilities
2015-16 5.6% 6.9% 3.4% 3.4% 50.6% 42.5%
Social Studies 8th GradeContent
All Students 2014-15 29.7% 26.1% 3.2% 22.9% 41.5% 32.5%
Social Studies 8th GradeContent
All Students 2015-16 29.3% 23.8% 4.1% 19.7% 41.9% 34.3%
Social Studies 8th GradeContent
American Indianor Alaska Native
2014-15 19.4% <10 <10 <10 <10 <10
Social Studies 8th GradeContent
American Indianor Alaska Native
2015-16 21.6% <10 <10 <10 <10 <10
Social Studies 8th GradeContent
Asian 2014-15 50.9% 28.0% 2.8% 25.2% 48.6% 23.4%
Social Studies 8th GradeContent
Asian 2015-16 53.8% 42.6% 8.7% 33.9% 37.4% 20.0%
Social Studies 8th GradeContent
Black or AfricanAmerican
2014-15 9.1% 11.9% 2.2% 9.7% 46.3% 41.8%
Annual Education ReportWarren Consolidated Schools02/07/2017
A service of the Center for Educational Performance and Information (CEPI) Page 32 of 91
M-STEP Grades 3-11
Social Studies 8th GradeContent
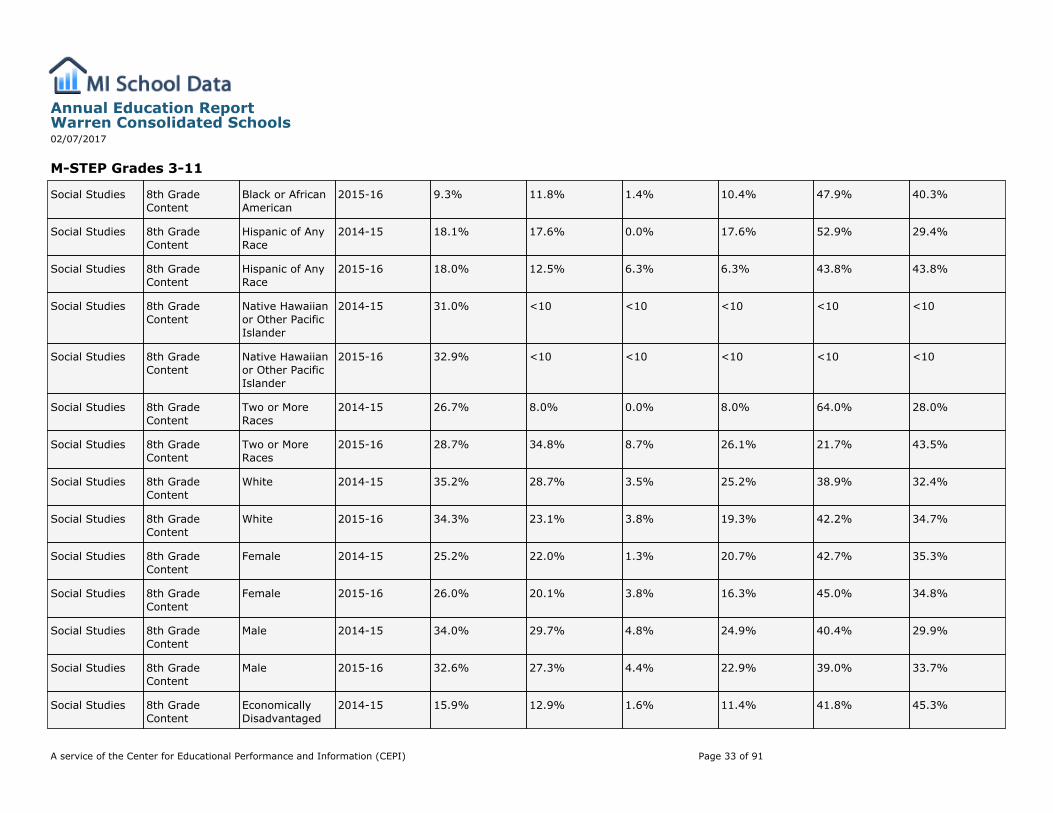
Black or AfricanAmerican
2015-16 9.3% 11.8% 1.4% 10.4% 47.9% 40.3%
Social Studies 8th GradeContent
Hispanic of AnyRace
2014-15 18.1% 17.6% 0.0% 17.6% 52.9% 29.4%
Social Studies 8th GradeContent
Hispanic of AnyRace
2015-16 18.0% 12.5% 6.3% 6.3% 43.8% 43.8%
Social Studies 8th GradeContent
Native Hawaiianor Other PacificIslander
2014-15 31.0% <10 <10 <10 <10 <10
Social Studies 8th GradeContent
Native Hawaiianor Other PacificIslander
2015-16 32.9% <10 <10 <10 <10 <10
Social Studies 8th GradeContent
Two or MoreRaces
2014-15 26.7% 8.0% 0.0% 8.0% 64.0% 28.0%
Social Studies 8th GradeContent
Two or MoreRaces
2015-16 28.7% 34.8% 8.7% 26.1% 21.7% 43.5%
Social Studies 8th GradeContent
White 2014-15 35.2% 28.7% 3.5% 25.2% 38.9% 32.4%
Social Studies 8th GradeContent
White 2015-16 34.3% 23.1% 3.8% 19.3% 42.2% 34.7%
Social Studies 8th GradeContent
Female 2014-15 25.2% 22.0% 1.3% 20.7% 42.7% 35.3%
Social Studies 8th GradeContent
Female 2015-16 26.0% 20.1% 3.8% 16.3% 45.0% 34.8%
Social Studies 8th GradeContent
Male 2014-15 34.0% 29.7% 4.8% 24.9% 40.4% 29.9%
Social Studies 8th GradeContent
Male 2015-16 32.6% 27.3% 4.4% 22.9% 39.0% 33.7%
Social Studies 8th GradeContent
EconomicallyDisadvantaged
2014-15 15.9% 12.9% 1.6% 11.4% 41.8% 45.3%
Annual Education ReportWarren Consolidated Schools02/07/2017
A service of the Center for Educational Performance and Information (CEPI) Page 33 of 91
M-STEP Grades 3-11
Social Studies 8th GradeContent
EconomicallyDisadvantaged
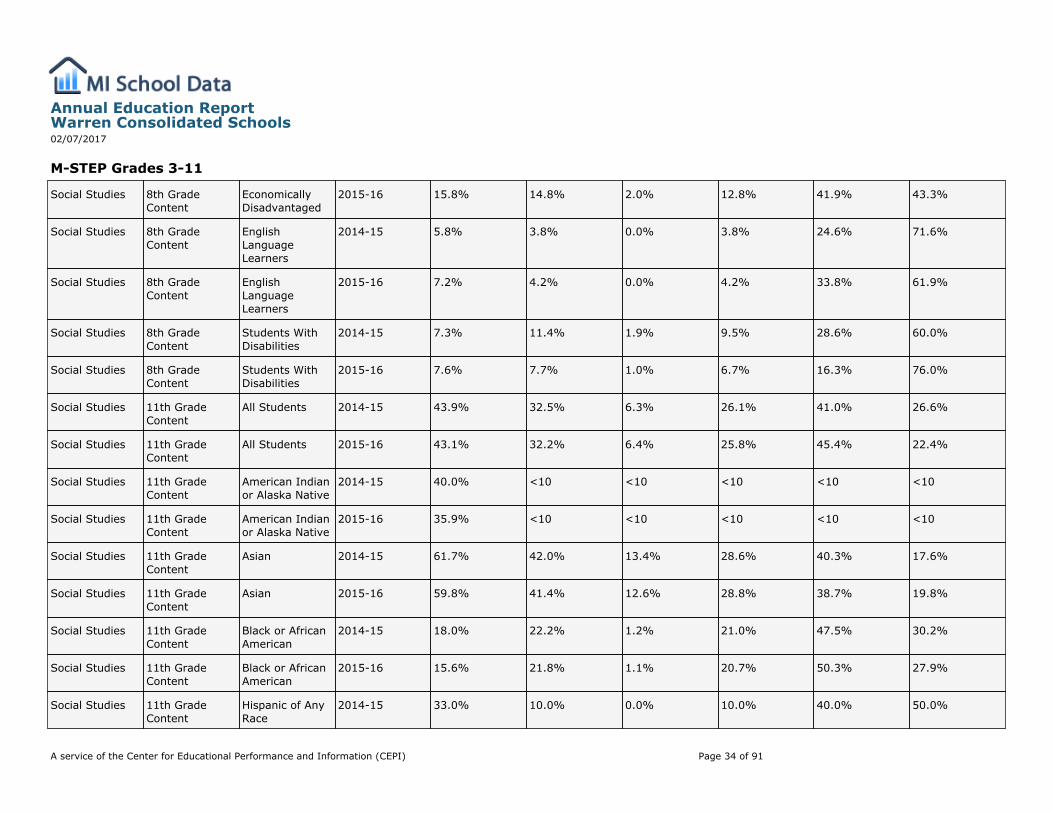
2015-16 15.8% 14.8% 2.0% 12.8% 41.9% 43.3%
Social Studies 8th GradeContent
EnglishLanguageLearners
2014-15 5.8% 3.8% 0.0% 3.8% 24.6% 71.6%
Social Studies 8th GradeContent
EnglishLanguageLearners
2015-16 7.2% 4.2% 0.0% 4.2% 33.8% 61.9%
Social Studies 8th GradeContent
Students WithDisabilities
2014-15 7.3% 11.4% 1.9% 9.5% 28.6% 60.0%
Social Studies 8th GradeContent
Students WithDisabilities
2015-16 7.6% 7.7% 1.0% 6.7% 16.3% 76.0%
Social Studies 11th GradeContent
All Students 2014-15 43.9% 32.5% 6.3% 26.1% 41.0% 26.6%
Social Studies 11th GradeContent
All Students 2015-16 43.1% 32.2% 6.4% 25.8% 45.4% 22.4%
Social Studies 11th GradeContent
American Indianor Alaska Native
2014-15 40.0% <10 <10 <10 <10 <10
Social Studies 11th GradeContent
American Indianor Alaska Native
2015-16 35.9% <10 <10 <10 <10 <10
Social Studies 11th GradeContent
Asian 2014-15 61.7% 42.0% 13.4% 28.6% 40.3% 17.6%
Social Studies 11th GradeContent
Asian 2015-16 59.8% 41.4% 12.6% 28.8% 38.7% 19.8%
Social Studies 11th GradeContent
Black or AfricanAmerican
2014-15 18.0% 22.2% 1.2% 21.0% 47.5% 30.2%
Social Studies 11th GradeContent
Black or AfricanAmerican
2015-16 15.6% 21.8% 1.1% 20.7% 50.3% 27.9%
Social Studies 11th GradeContent
Hispanic of AnyRace
2014-15 33.0% 10.0% 0.0% 10.0% 40.0% 50.0%
Annual Education ReportWarren Consolidated Schools02/07/2017
A service of the Center for Educational Performance and Information (CEPI) Page 34 of 91
M-STEP Grades 3-11
Social Studies 11th GradeContent
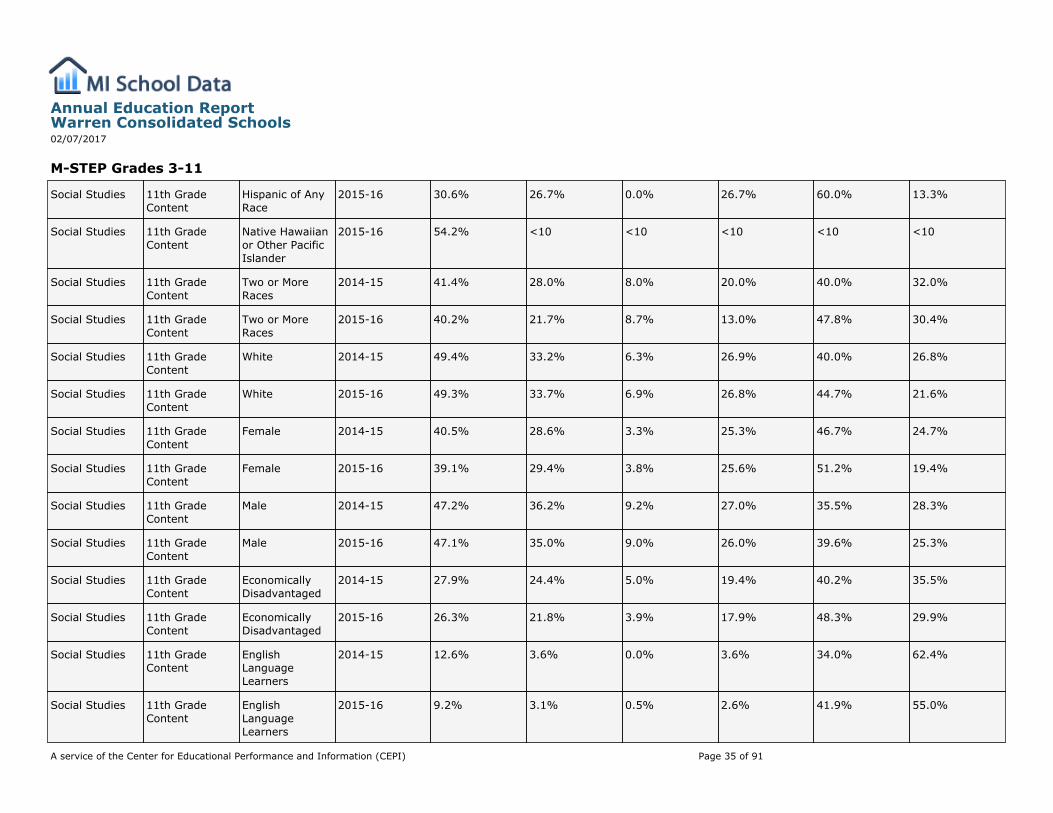
Hispanic of AnyRace
2015-16 30.6% 26.7% 0.0% 26.7% 60.0% 13.3%
Social Studies 11th GradeContent
Native Hawaiianor Other PacificIslander
2015-16 54.2% <10 <10 <10 <10 <10
Social Studies 11th GradeContent
Two or MoreRaces
2014-15 41.4% 28.0% 8.0% 20.0% 40.0% 32.0%
Social Studies 11th GradeContent
Two or MoreRaces
2015-16 40.2% 21.7% 8.7% 13.0% 47.8% 30.4%
Social Studies 11th GradeContent
White 2014-15 49.4% 33.2% 6.3% 26.9% 40.0% 26.8%
Social Studies 11th GradeContent
White 2015-16 49.3% 33.7% 6.9% 26.8% 44.7% 21.6%
Social Studies 11th GradeContent
Female 2014-15 40.5% 28.6% 3.3% 25.3% 46.7% 24.7%
Social Studies 11th GradeContent
Female 2015-16 39.1% 29.4% 3.8% 25.6% 51.2% 19.4%
Social Studies 11th GradeContent
Male 2014-15 47.2% 36.2% 9.2% 27.0% 35.5% 28.3%
Social Studies 11th GradeContent
Male 2015-16 47.1% 35.0% 9.0% 26.0% 39.6% 25.3%
Social Studies 11th GradeContent
EconomicallyDisadvantaged
2014-15 27.9% 24.4% 5.0% 19.4% 40.2% 35.5%
Social Studies 11th GradeContent
EconomicallyDisadvantaged
2015-16 26.3% 21.8% 3.9% 17.9% 48.3% 29.9%
Social Studies 11th GradeContent
EnglishLanguageLearners
2014-15 12.6% 3.6% 0.0% 3.6% 34.0% 62.4%
Social Studies 11th GradeContent
EnglishLanguageLearners
2015-16 9.2% 3.1% 0.5% 2.6% 41.9% 55.0%
Annual Education ReportWarren Consolidated Schools02/07/2017
A service of the Center for Educational Performance and Information (CEPI) Page 35 of 91
M-STEP Grades 3-11
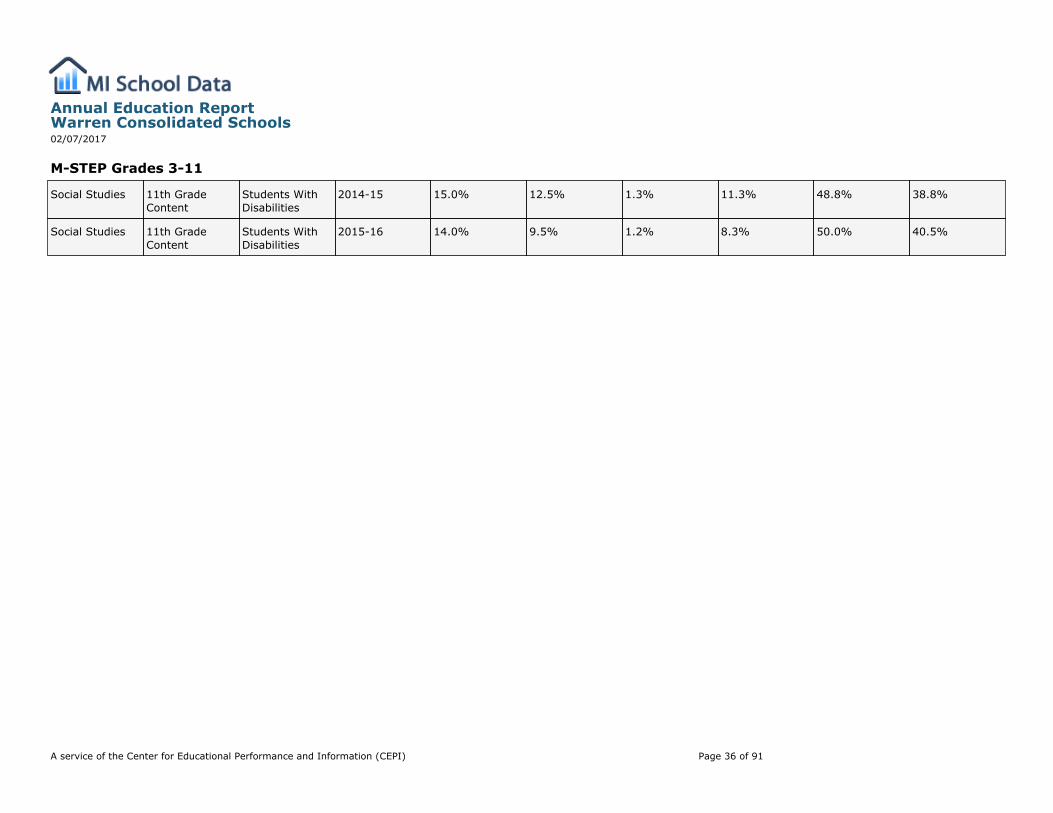
Social Studies 11th GradeContent
Students WithDisabilities
2014-15 15.0% 12.5% 1.3% 11.3% 48.8% 38.8%
Social Studies 11th GradeContent
Students WithDisabilities
2015-16 14.0% 9.5% 1.2% 8.3% 50.0% 40.5%
Annual Education ReportWarren Consolidated Schools02/07/2017
A service of the Center for Educational Performance and Information (CEPI) Page 36 of 91
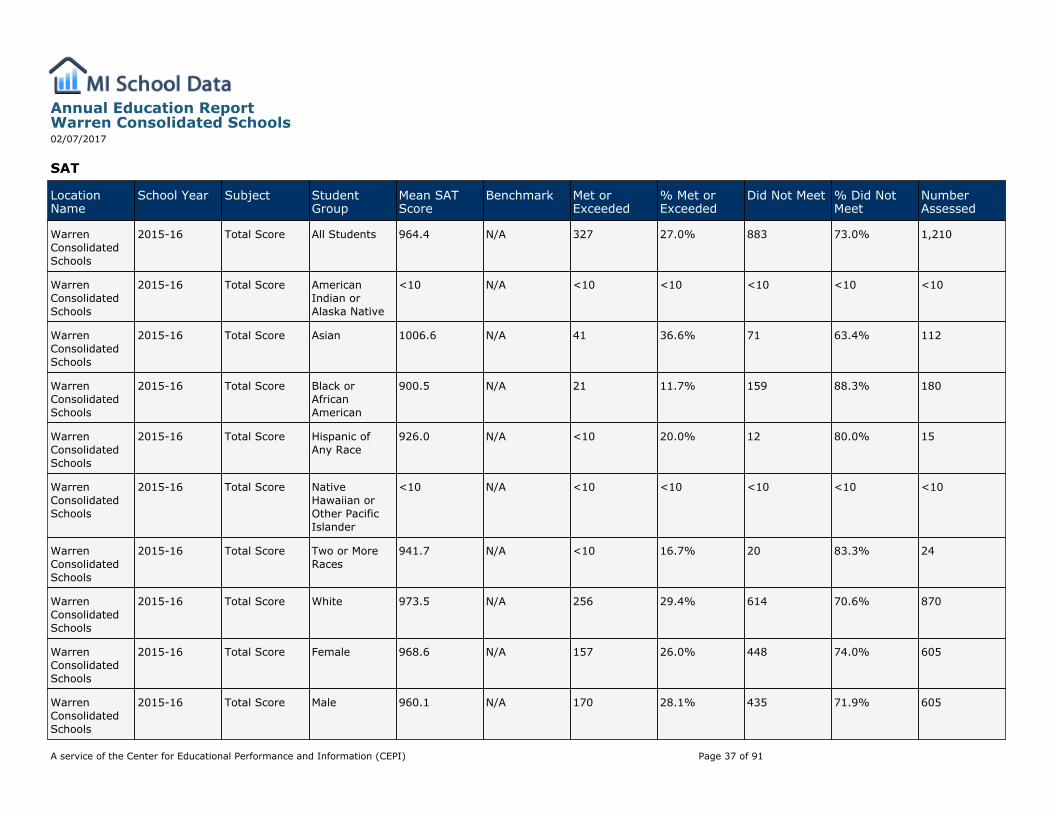
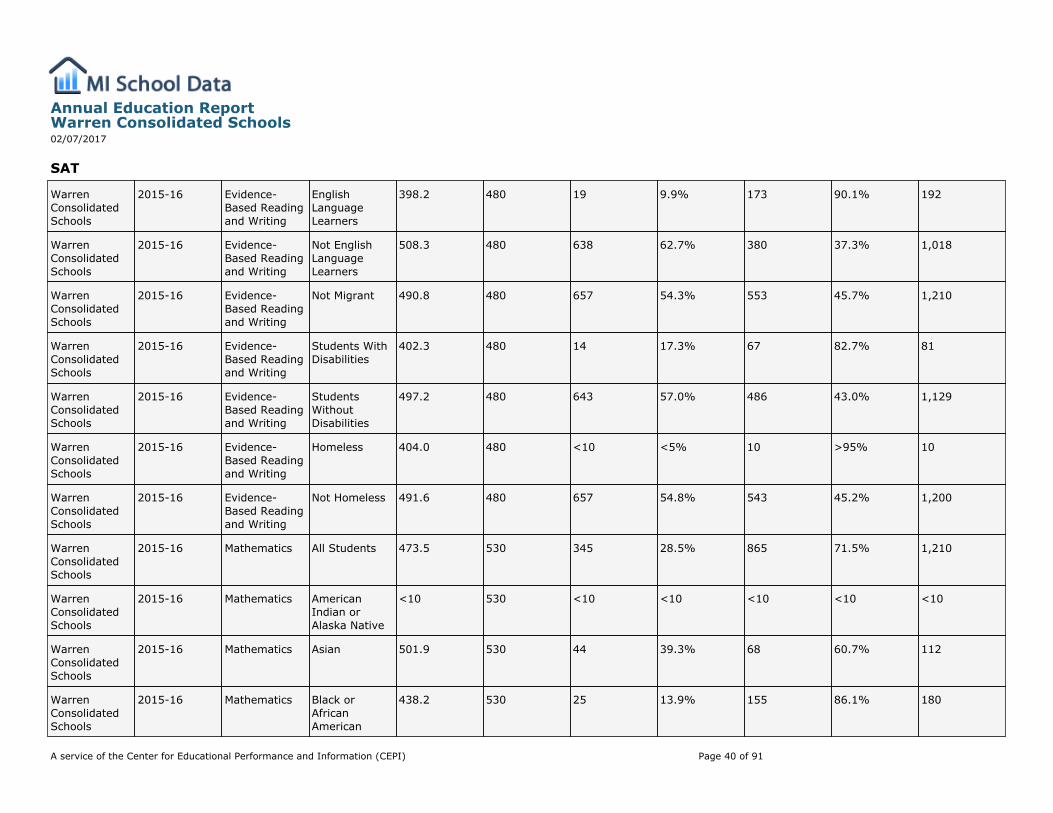
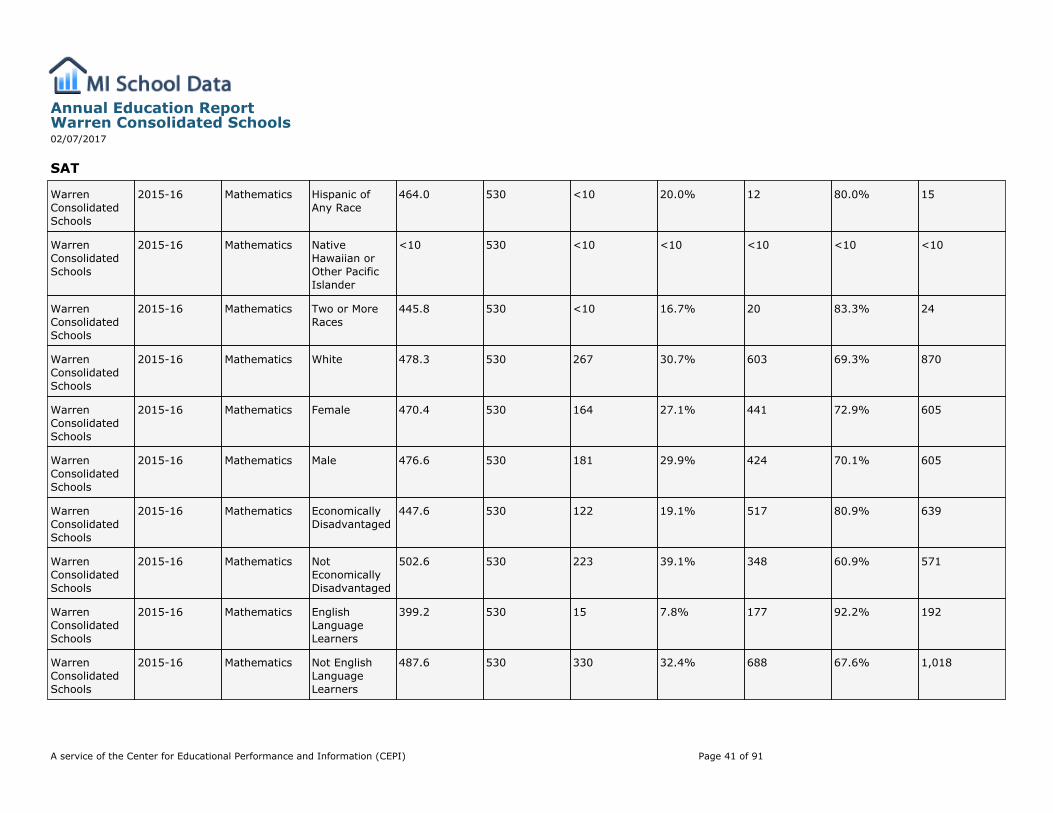
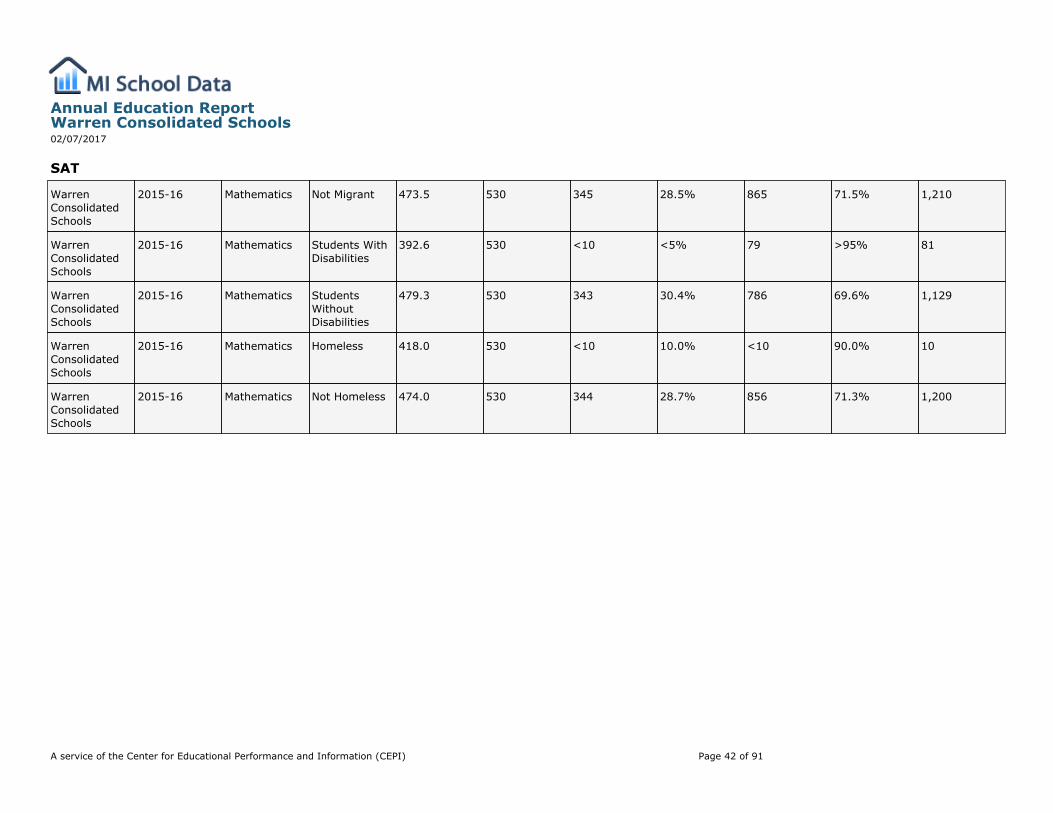
SAT
LocationName
School Year Subject StudentGroup
Mean SATScore
Benchmark Met orExceeded
% Met orExceeded
Did Not Meet % Did NotMeet
NumberAssessed
WarrenConsolidatedSchools
2015-16 Total Score All Students 964.4 N/A 327 27.0% 883 73.0% 1,210
WarrenConsolidatedSchools
2015-16 Total Score AmericanIndian orAlaska Native
<10 N/A <10 <10 <10 <10 <10
WarrenConsolidatedSchools
2015-16 Total Score Asian 1006.6 N/A 41 36.6% 71 63.4% 112
WarrenConsolidatedSchools
2015-16 Total Score Black orAfricanAmerican
900.5 N/A 21 11.7% 159 88.3% 180
WarrenConsolidatedSchools
2015-16 Total Score Hispanic ofAny Race
926.0 N/A <10 20.0% 12 80.0% 15
WarrenConsolidatedSchools
2015-16 Total Score NativeHawaiian orOther PacificIslander
<10 N/A <10 <10 <10 <10 <10
WarrenConsolidatedSchools
2015-16 Total Score Two or MoreRaces
941.7 N/A <10 16.7% 20 83.3% 24
WarrenConsolidatedSchools
2015-16 Total Score White 973.5 N/A 256 29.4% 614 70.6% 870
WarrenConsolidatedSchools
2015-16 Total Score Female 968.6 N/A 157 26.0% 448 74.0% 605
WarrenConsolidatedSchools
2015-16 Total Score Male 960.1 N/A 170 28.1% 435 71.9% 605
Annual Education ReportWarren Consolidated Schools02/07/2017
A service of the Center for Educational Performance and Information (CEPI) Page 37 of 91
SAT
WarrenConsolidatedSchools
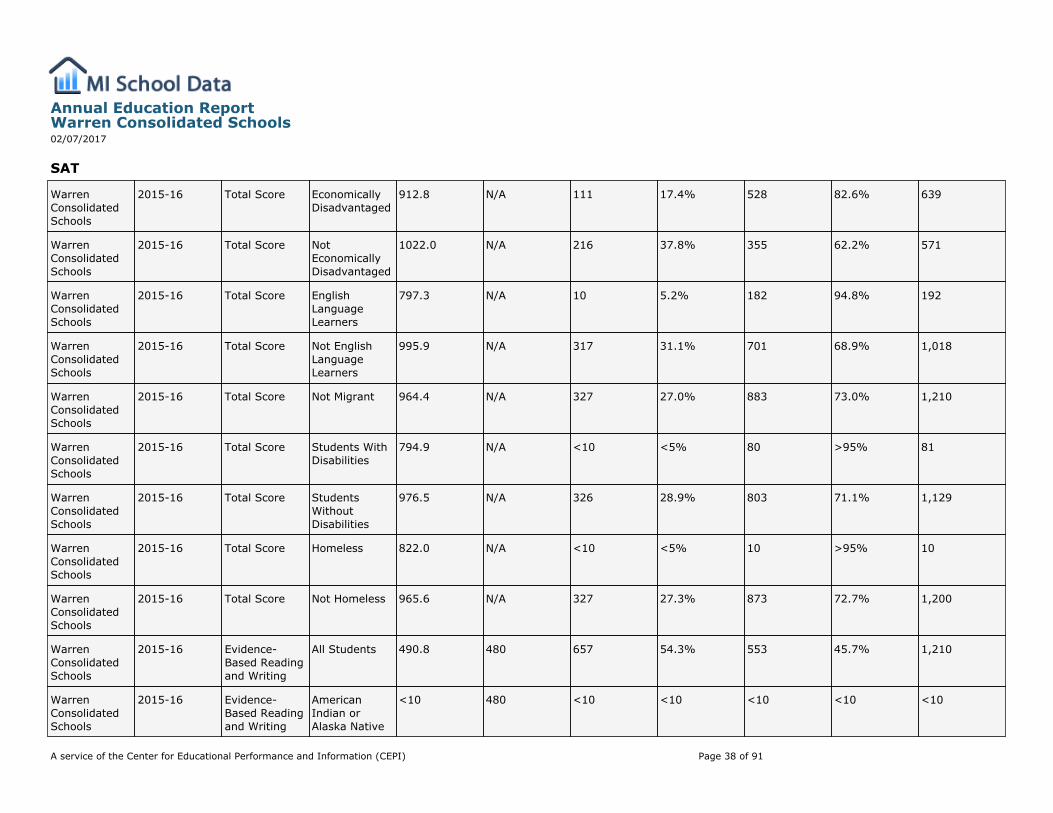
2015-16 Total Score EconomicallyDisadvantaged
912.8 N/A 111 17.4% 528 82.6% 639
WarrenConsolidatedSchools
2015-16 Total Score NotEconomicallyDisadvantaged
1022.0 N/A 216 37.8% 355 62.2% 571
WarrenConsolidatedSchools
2015-16 Total Score EnglishLanguageLearners
797.3 N/A 10 5.2% 182 94.8% 192
WarrenConsolidatedSchools
2015-16 Total Score Not EnglishLanguageLearners
995.9 N/A 317 31.1% 701 68.9% 1,018
WarrenConsolidatedSchools
2015-16 Total Score Not Migrant 964.4 N/A 327 27.0% 883 73.0% 1,210
WarrenConsolidatedSchools
2015-16 Total Score Students WithDisabilities
794.9 N/A <10 <5% 80 >95% 81
WarrenConsolidatedSchools
2015-16 Total Score StudentsWithoutDisabilities
976.5 N/A 326 28.9% 803 71.1% 1,129
WarrenConsolidatedSchools
2015-16 Total Score Homeless 822.0 N/A <10 <5% 10 >95% 10
WarrenConsolidatedSchools
2015-16 Total Score Not Homeless 965.6 N/A 327 27.3% 873 72.7% 1,200
WarrenConsolidatedSchools
2015-16 Evidence-Based Readingand Writing
All Students 490.8 480 657 54.3% 553 45.7% 1,210
WarrenConsolidatedSchools
2015-16 Evidence-Based Readingand Writing
AmericanIndian orAlaska Native
<10 480 <10 <10 <10 <10 <10
Annual Education ReportWarren Consolidated Schools02/07/2017
A service of the Center for Educational Performance and Information (CEPI) Page 38 of 91
SAT
WarrenConsolidatedSchools
2015-16 Evidence-Based Readingand Writing
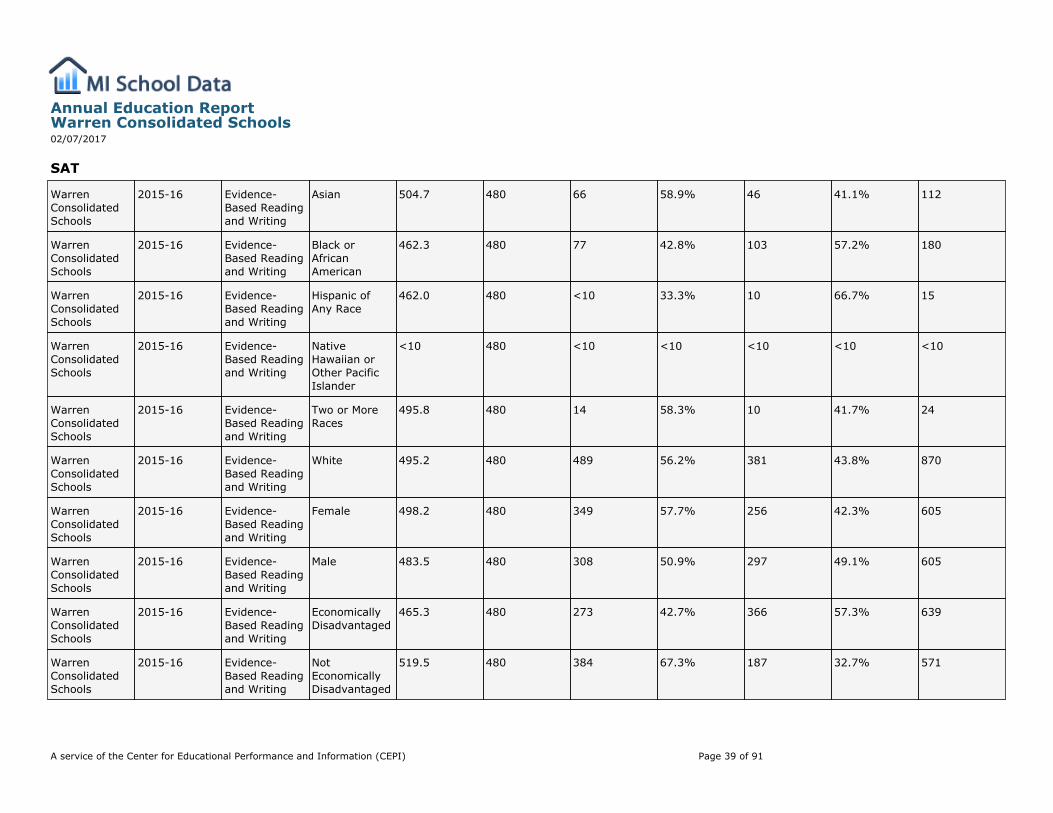
Asian 504.7 480 66 58.9% 46 41.1% 112
WarrenConsolidatedSchools
2015-16 Evidence-Based Readingand Writing
Black orAfricanAmerican
462.3 480 77 42.8% 103 57.2% 180
WarrenConsolidatedSchools
2015-16 Evidence-Based Readingand Writing
Hispanic ofAny Race
462.0 480 <10 33.3% 10 66.7% 15
WarrenConsolidatedSchools
2015-16 Evidence-Based Readingand Writing
NativeHawaiian orOther PacificIslander
<10 480 <10 <10 <10 <10 <10
WarrenConsolidatedSchools
2015-16 Evidence-Based Readingand Writing
Two or MoreRaces
495.8 480 14 58.3% 10 41.7% 24
WarrenConsolidatedSchools
2015-16 Evidence-Based Readingand Writing
White 495.2 480 489 56.2% 381 43.8% 870
WarrenConsolidatedSchools
2015-16 Evidence-Based Readingand Writing
Female 498.2 480 349 57.7% 256 42.3% 605
WarrenConsolidatedSchools
2015-16 Evidence-Based Readingand Writing
Male 483.5 480 308 50.9% 297 49.1% 605
WarrenConsolidatedSchools
2015-16 Evidence-Based Readingand Writing
EconomicallyDisadvantaged
465.3 480 273 42.7% 366 57.3% 639
WarrenConsolidatedSchools
2015-16 Evidence-Based Readingand Writing
NotEconomicallyDisadvantaged
519.5 480 384 67.3% 187 32.7% 571
Annual Education ReportWarren Consolidated Schools02/07/2017
A service of the Center for Educational Performance and Information (CEPI) Page 39 of 91
SAT
WarrenConsolidatedSchools
2015-16 Evidence-Based Readingand Writing
EnglishLanguageLearners
398.2 480 19 9.9% 173 90.1% 192
WarrenConsolidatedSchools
2015-16 Evidence-Based Readingand Writing
Not EnglishLanguageLearners
508.3 480 638 62.7% 380 37.3% 1,018
WarrenConsolidatedSchools
2015-16 Evidence-Based Readingand Writing
Not Migrant 490.8 480 657 54.3% 553 45.7% 1,210
WarrenConsolidatedSchools
2015-16 Evidence-Based Readingand Writing
Students WithDisabilities
402.3 480 14 17.3% 67 82.7% 81
WarrenConsolidatedSchools
2015-16 Evidence-Based Readingand Writing
StudentsWithoutDisabilities
497.2 480 643 57.0% 486 43.0% 1,129
WarrenConsolidatedSchools
2015-16 Evidence-Based Readingand Writing
Homeless 404.0 480 <10 <5% 10 >95% 10
WarrenConsolidatedSchools
2015-16 Evidence-Based Readingand Writing
Not Homeless 491.6 480 657 54.8% 543 45.2% 1,200
WarrenConsolidatedSchools
2015-16 Mathematics All Students 473.5 530 345 28.5% 865 71.5% 1,210
WarrenConsolidatedSchools
2015-16 Mathematics AmericanIndian orAlaska Native
<10 530 <10 <10 <10 <10 <10
WarrenConsolidatedSchools
2015-16 Mathematics Asian 501.9 530 44 39.3% 68 60.7% 112
WarrenConsolidatedSchools
2015-16 Mathematics Black orAfricanAmerican
438.2 530 25 13.9% 155 86.1% 180
Annual Education ReportWarren Consolidated Schools02/07/2017
A service of the Center for Educational Performance and Information (CEPI) Page 40 of 91
SAT
WarrenConsolidatedSchools
2015-16 Mathematics Hispanic ofAny Race
464.0 530 <10 20.0% 12 80.0% 15
WarrenConsolidatedSchools
2015-16 Mathematics NativeHawaiian orOther PacificIslander
<10 530 <10 <10 <10 <10 <10
WarrenConsolidatedSchools
2015-16 Mathematics Two or MoreRaces
445.8 530 <10 16.7% 20 83.3% 24
WarrenConsolidatedSchools
2015-16 Mathematics White 478.3 530 267 30.7% 603 69.3% 870
WarrenConsolidatedSchools
2015-16 Mathematics Female 470.4 530 164 27.1% 441 72.9% 605
WarrenConsolidatedSchools
2015-16 Mathematics Male 476.6 530 181 29.9% 424 70.1% 605
WarrenConsolidatedSchools
2015-16 Mathematics EconomicallyDisadvantaged
447.6 530 122 19.1% 517 80.9% 639
WarrenConsolidatedSchools
2015-16 Mathematics NotEconomicallyDisadvantaged
502.6 530 223 39.1% 348 60.9% 571
WarrenConsolidatedSchools
2015-16 Mathematics EnglishLanguageLearners
399.2 530 15 7.8% 177 92.2% 192
WarrenConsolidatedSchools
2015-16 Mathematics Not EnglishLanguageLearners
487.6 530 330 32.4% 688 67.6% 1,018
Annual Education ReportWarren Consolidated Schools02/07/2017
A service of the Center for Educational Performance and Information (CEPI) Page 41 of 91
SAT
WarrenConsolidatedSchools
2015-16 Mathematics Not Migrant 473.5 530 345 28.5% 865 71.5% 1,210
WarrenConsolidatedSchools
2015-16 Mathematics Students WithDisabilities
392.6 530 <10 <5% 79 >95% 81
WarrenConsolidatedSchools
2015-16 Mathematics StudentsWithoutDisabilities
479.3 530 343 30.4% 786 69.6% 1,129
WarrenConsolidatedSchools
2015-16 Mathematics Homeless 418.0 530 <10 10.0% <10 90.0% 10
WarrenConsolidatedSchools
2015-16 Mathematics Not Homeless 474.0 530 344 28.7% 856 71.3% 1,200
Annual Education ReportWarren Consolidated Schools02/07/2017
A service of the Center for Educational Performance and Information (CEPI) Page 42 of 91
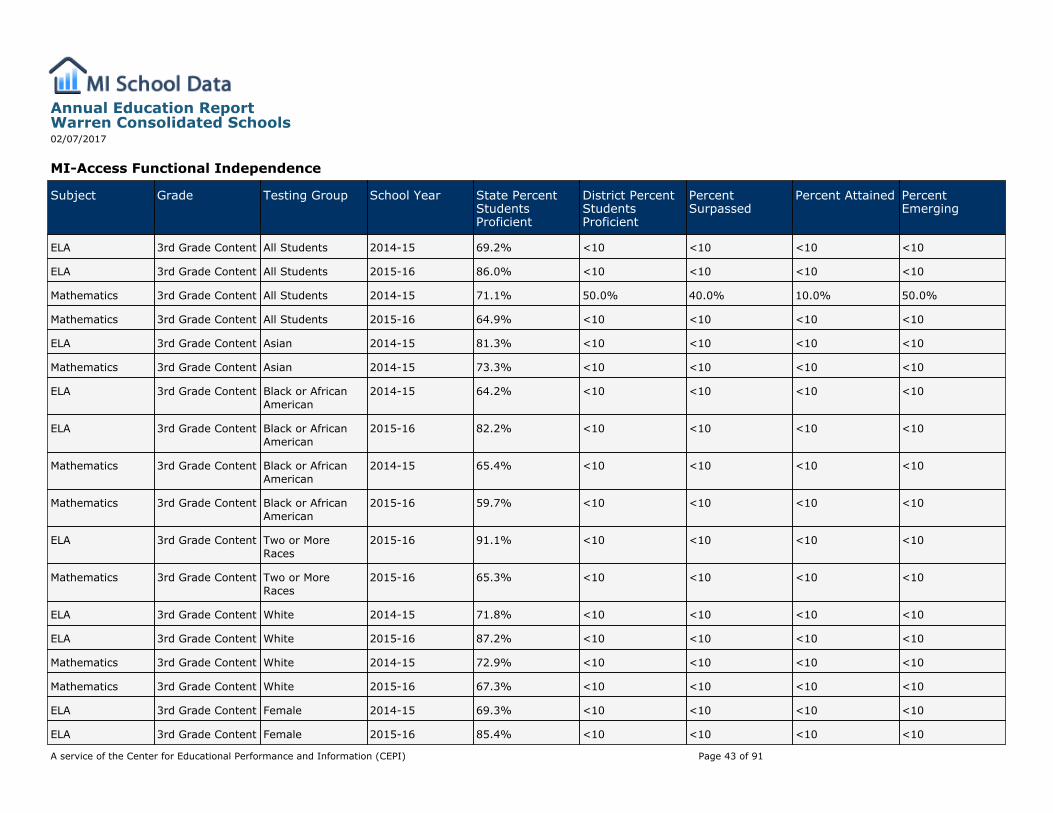
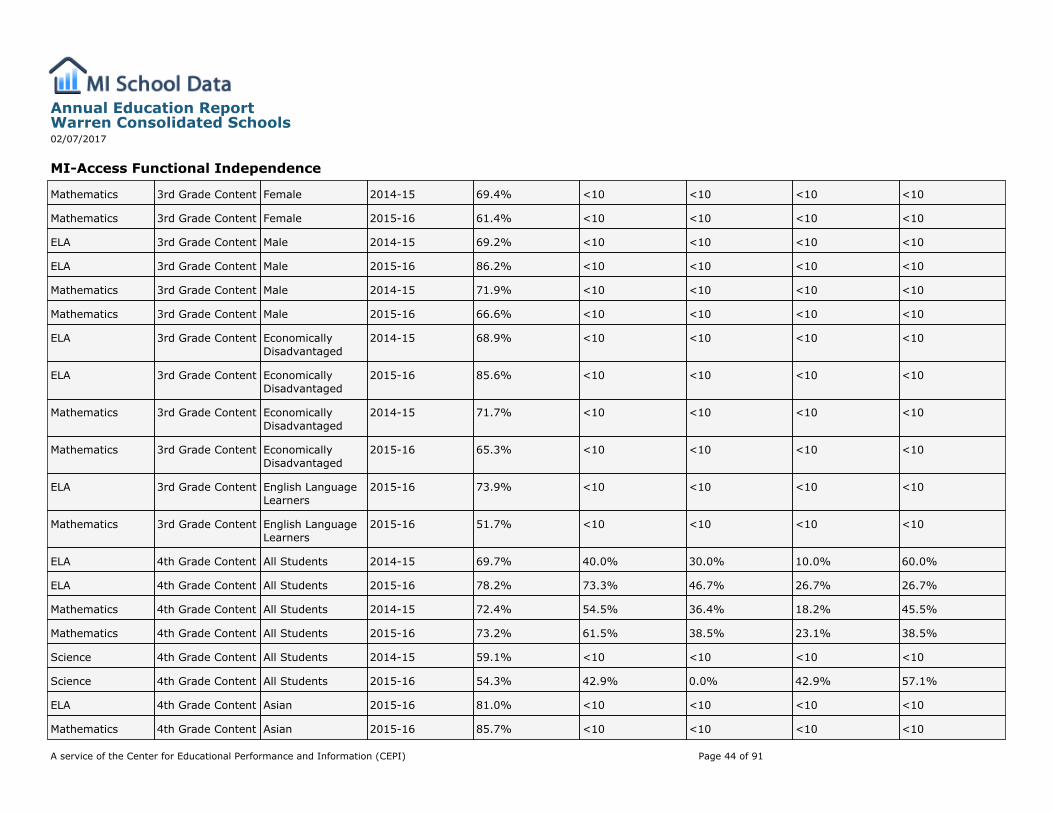
MI-Access Functional Independence
Subject Grade Testing Group School Year State PercentStudentsProficient
District PercentStudentsProficient
PercentSurpassed
Percent Attained PercentEmerging
ELA 3rd Grade Content All Students 2014-15 69.2% <10 <10 <10 <10
ELA 3rd Grade Content All Students 2015-16 86.0% <10 <10 <10 <10
Mathematics 3rd Grade Content All Students 2014-15 71.1% 50.0% 40.0% 10.0% 50.0%
Mathematics 3rd Grade Content All Students 2015-16 64.9% <10 <10 <10 <10
ELA 3rd Grade Content Asian 2014-15 81.3% <10 <10 <10 <10
Mathematics 3rd Grade Content Asian 2014-15 73.3% <10 <10 <10 <10
ELA 3rd Grade Content Black or AfricanAmerican
2014-15 64.2% <10 <10 <10 <10
ELA 3rd Grade Content Black or AfricanAmerican
2015-16 82.2% <10 <10 <10 <10
Mathematics 3rd Grade Content Black or AfricanAmerican
2014-15 65.4% <10 <10 <10 <10
Mathematics 3rd Grade Content Black or AfricanAmerican
2015-16 59.7% <10 <10 <10 <10
ELA 3rd Grade Content Two or MoreRaces
2015-16 91.1% <10 <10 <10 <10
Mathematics 3rd Grade Content Two or MoreRaces
2015-16 65.3% <10 <10 <10 <10
ELA 3rd Grade Content White 2014-15 71.8% <10 <10 <10 <10
ELA 3rd Grade Content White 2015-16 87.2% <10 <10 <10 <10
Mathematics 3rd Grade Content White 2014-15 72.9% <10 <10 <10 <10
Mathematics 3rd Grade Content White 2015-16 67.3% <10 <10 <10 <10
ELA 3rd Grade Content Female 2014-15 69.3% <10 <10 <10 <10
ELA 3rd Grade Content Female 2015-16 85.4% <10 <10 <10 <10
Annual Education ReportWarren Consolidated Schools02/07/2017
A service of the Center for Educational Performance and Information (CEPI) Page 43 of 91
MI-Access Functional Independence
Mathematics 3rd Grade Content Female 2014-15 69.4% <10 <10 <10 <10
Mathematics 3rd Grade Content Female 2015-16 61.4% <10 <10 <10 <10
ELA 3rd Grade Content Male 2014-15 69.2% <10 <10 <10 <10
ELA 3rd Grade Content Male 2015-16 86.2% <10 <10 <10 <10
Mathematics 3rd Grade Content Male 2014-15 71.9% <10 <10 <10 <10
Mathematics 3rd Grade Content Male 2015-16 66.6% <10 <10 <10 <10
ELA 3rd Grade Content EconomicallyDisadvantaged
2014-15 68.9% <10 <10 <10 <10
ELA 3rd Grade Content EconomicallyDisadvantaged
2015-16 85.6% <10 <10 <10 <10
Mathematics 3rd Grade Content EconomicallyDisadvantaged
2014-15 71.7% <10 <10 <10 <10
Mathematics 3rd Grade Content EconomicallyDisadvantaged
2015-16 65.3% <10 <10 <10 <10
ELA 3rd Grade Content English LanguageLearners
2015-16 73.9% <10 <10 <10 <10
Mathematics 3rd Grade Content English LanguageLearners
2015-16 51.7% <10 <10 <10 <10
ELA 4th Grade Content All Students 2014-15 69.7% 40.0% 30.0% 10.0% 60.0%
ELA 4th Grade Content All Students 2015-16 78.2% 73.3% 46.7% 26.7% 26.7%
Mathematics 4th Grade Content All Students 2014-15 72.4% 54.5% 36.4% 18.2% 45.5%
Mathematics 4th Grade Content All Students 2015-16 73.2% 61.5% 38.5% 23.1% 38.5%
Science 4th Grade Content All Students 2014-15 59.1% <10 <10 <10 <10
Science 4th Grade Content All Students 2015-16 54.3% 42.9% 0.0% 42.9% 57.1%
ELA 4th Grade Content Asian 2015-16 81.0% <10 <10 <10 <10
Mathematics 4th Grade Content Asian 2015-16 85.7% <10 <10 <10 <10
Annual Education ReportWarren Consolidated Schools02/07/2017
A service of the Center for Educational Performance and Information (CEPI) Page 44 of 91
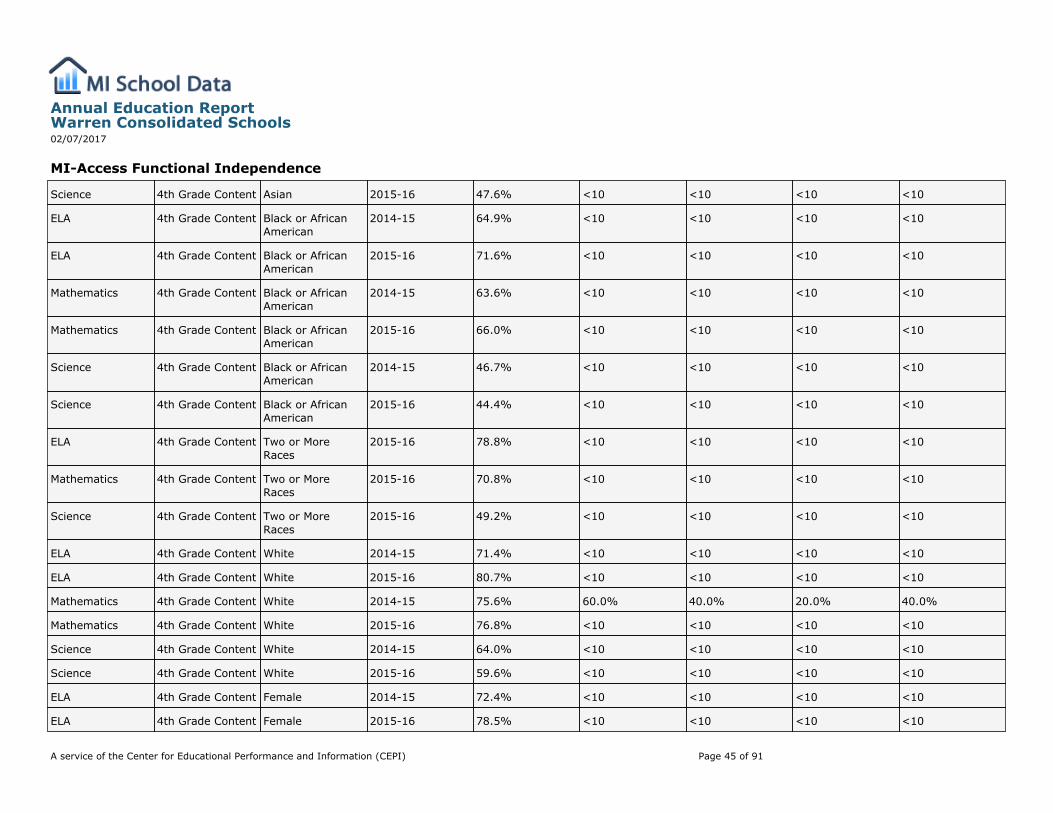
MI-Access Functional Independence
Science 4th Grade Content Asian 2015-16 47.6% <10 <10 <10 <10
ELA 4th Grade Content Black or AfricanAmerican
2014-15 64.9% <10 <10 <10 <10
ELA 4th Grade Content Black or AfricanAmerican
2015-16 71.6% <10 <10 <10 <10
Mathematics 4th Grade Content Black or AfricanAmerican
2014-15 63.6% <10 <10 <10 <10
Mathematics 4th Grade Content Black or AfricanAmerican
2015-16 66.0% <10 <10 <10 <10
Science 4th Grade Content Black or AfricanAmerican
2014-15 46.7% <10 <10 <10 <10
Science 4th Grade Content Black or AfricanAmerican
2015-16 44.4% <10 <10 <10 <10
ELA 4th Grade Content Two or MoreRaces
2015-16 78.8% <10 <10 <10 <10
Mathematics 4th Grade Content Two or MoreRaces
2015-16 70.8% <10 <10 <10 <10
Science 4th Grade Content Two or MoreRaces
2015-16 49.2% <10 <10 <10 <10
ELA 4th Grade Content White 2014-15 71.4% <10 <10 <10 <10
ELA 4th Grade Content White 2015-16 80.7% <10 <10 <10 <10
Mathematics 4th Grade Content White 2014-15 75.6% 60.0% 40.0% 20.0% 40.0%
Mathematics 4th Grade Content White 2015-16 76.8% <10 <10 <10 <10
Science 4th Grade Content White 2014-15 64.0% <10 <10 <10 <10
Science 4th Grade Content White 2015-16 59.6% <10 <10 <10 <10
ELA 4th Grade Content Female 2014-15 72.4% <10 <10 <10 <10
ELA 4th Grade Content Female 2015-16 78.5% <10 <10 <10 <10
Annual Education ReportWarren Consolidated Schools02/07/2017
A service of the Center for Educational Performance and Information (CEPI) Page 45 of 91
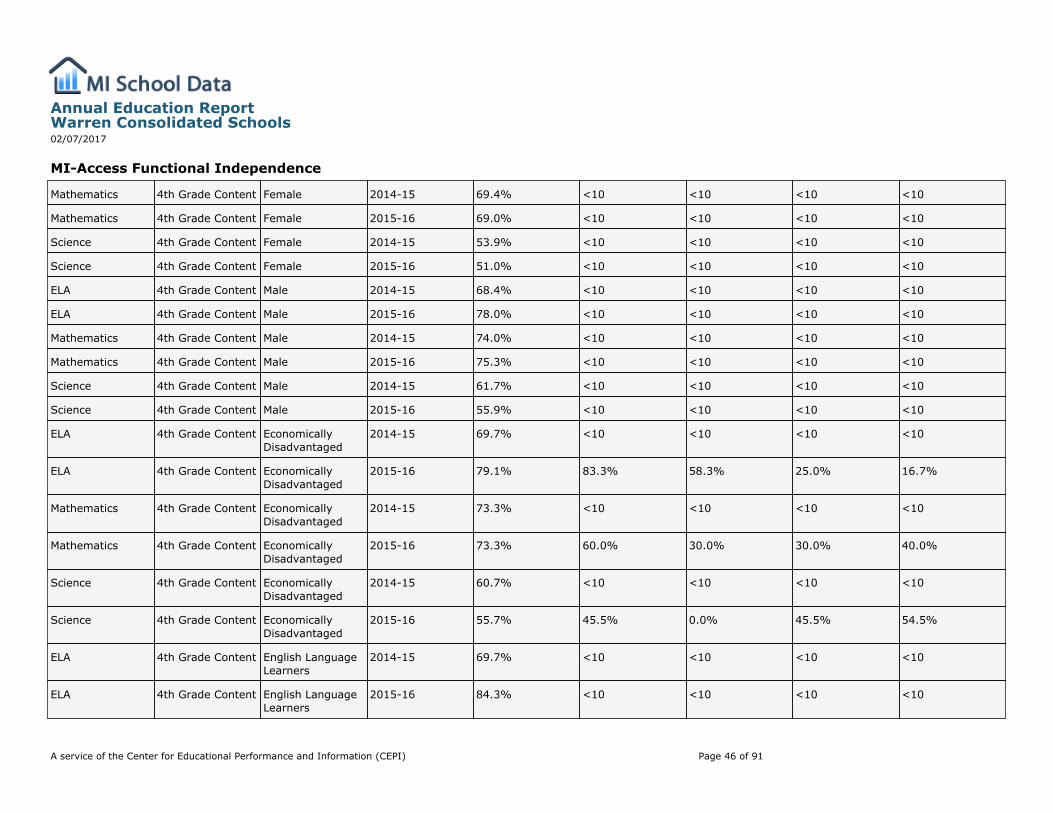
MI-Access Functional Independence
Mathematics 4th Grade Content Female 2014-15 69.4% <10 <10 <10 <10
Mathematics 4th Grade Content Female 2015-16 69.0% <10 <10 <10 <10
Science 4th Grade Content Female 2014-15 53.9% <10 <10 <10 <10
Science 4th Grade Content Female 2015-16 51.0% <10 <10 <10 <10
ELA 4th Grade Content Male 2014-15 68.4% <10 <10 <10 <10
ELA 4th Grade Content Male 2015-16 78.0% <10 <10 <10 <10
Mathematics 4th Grade Content Male 2014-15 74.0% <10 <10 <10 <10
Mathematics 4th Grade Content Male 2015-16 75.3% <10 <10 <10 <10
Science 4th Grade Content Male 2014-15 61.7% <10 <10 <10 <10
Science 4th Grade Content Male 2015-16 55.9% <10 <10 <10 <10
ELA 4th Grade Content EconomicallyDisadvantaged
2014-15 69.7% <10 <10 <10 <10
ELA 4th Grade Content EconomicallyDisadvantaged
2015-16 79.1% 83.3% 58.3% 25.0% 16.7%
Mathematics 4th Grade Content EconomicallyDisadvantaged
2014-15 73.3% <10 <10 <10 <10
Mathematics 4th Grade Content EconomicallyDisadvantaged
2015-16 73.3% 60.0% 30.0% 30.0% 40.0%
Science 4th Grade Content EconomicallyDisadvantaged
2014-15 60.7% <10 <10 <10 <10
Science 4th Grade Content EconomicallyDisadvantaged
2015-16 55.7% 45.5% 0.0% 45.5% 54.5%
ELA 4th Grade Content English LanguageLearners
2014-15 69.7% <10 <10 <10 <10
ELA 4th Grade Content English LanguageLearners
2015-16 84.3% <10 <10 <10 <10
Annual Education ReportWarren Consolidated Schools02/07/2017
A service of the Center for Educational Performance and Information (CEPI) Page 46 of 91
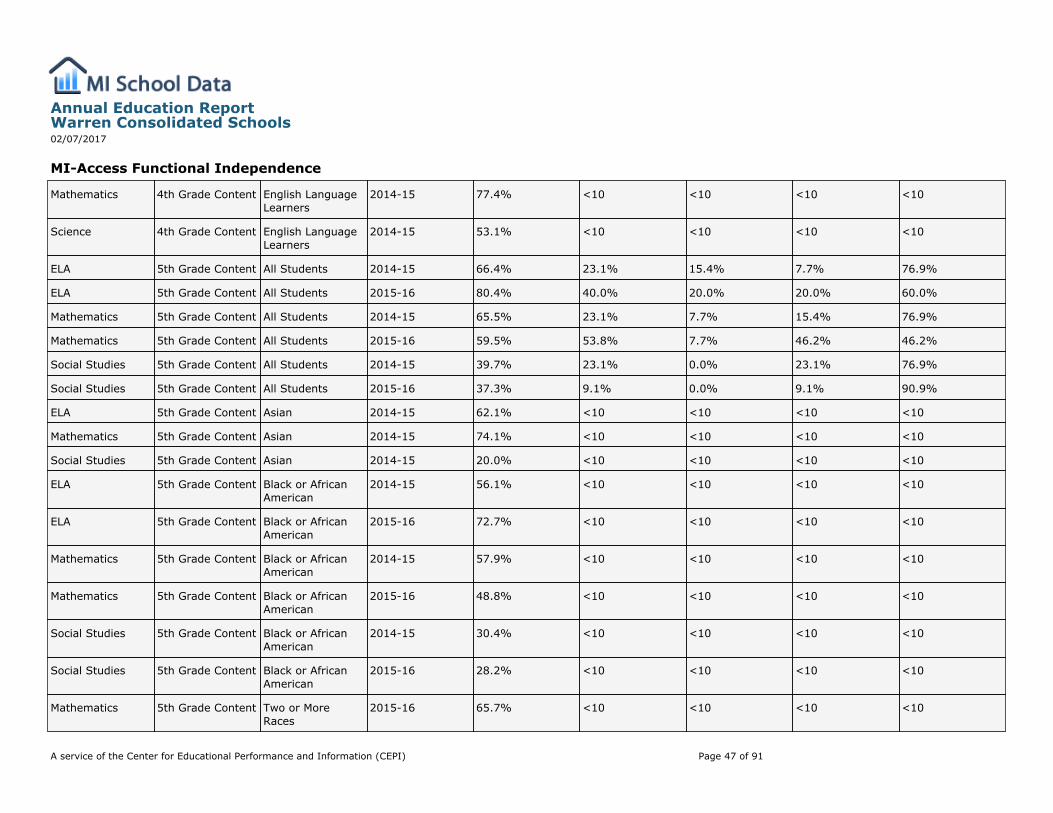
MI-Access Functional Independence
Mathematics 4th Grade Content English LanguageLearners
2014-15 77.4% <10 <10 <10 <10
Science 4th Grade Content English LanguageLearners
2014-15 53.1% <10 <10 <10 <10
ELA 5th Grade Content All Students 2014-15 66.4% 23.1% 15.4% 7.7% 76.9%
ELA 5th Grade Content All Students 2015-16 80.4% 40.0% 20.0% 20.0% 60.0%
Mathematics 5th Grade Content All Students 2014-15 65.5% 23.1% 7.7% 15.4% 76.9%
Mathematics 5th Grade Content All Students 2015-16 59.5% 53.8% 7.7% 46.2% 46.2%
Social Studies 5th Grade Content All Students 2014-15 39.7% 23.1% 0.0% 23.1% 76.9%
Social Studies 5th Grade Content All Students 2015-16 37.3% 9.1% 0.0% 9.1% 90.9%
ELA 5th Grade Content Asian 2014-15 62.1% <10 <10 <10 <10
Mathematics 5th Grade Content Asian 2014-15 74.1% <10 <10 <10 <10
Social Studies 5th Grade Content Asian 2014-15 20.0% <10 <10 <10 <10
ELA 5th Grade Content Black or AfricanAmerican
2014-15 56.1% <10 <10 <10 <10
ELA 5th Grade Content Black or AfricanAmerican
2015-16 72.7% <10 <10 <10 <10
Mathematics 5th Grade Content Black or AfricanAmerican
2014-15 57.9% <10 <10 <10 <10
Mathematics 5th Grade Content Black or AfricanAmerican
2015-16 48.8% <10 <10 <10 <10
Social Studies 5th Grade Content Black or AfricanAmerican
2014-15 30.4% <10 <10 <10 <10
Social Studies 5th Grade Content Black or AfricanAmerican
2015-16 28.2% <10 <10 <10 <10
Mathematics 5th Grade Content Two or MoreRaces
2015-16 65.7% <10 <10 <10 <10
Annual Education ReportWarren Consolidated Schools02/07/2017
A service of the Center for Educational Performance and Information (CEPI) Page 47 of 91
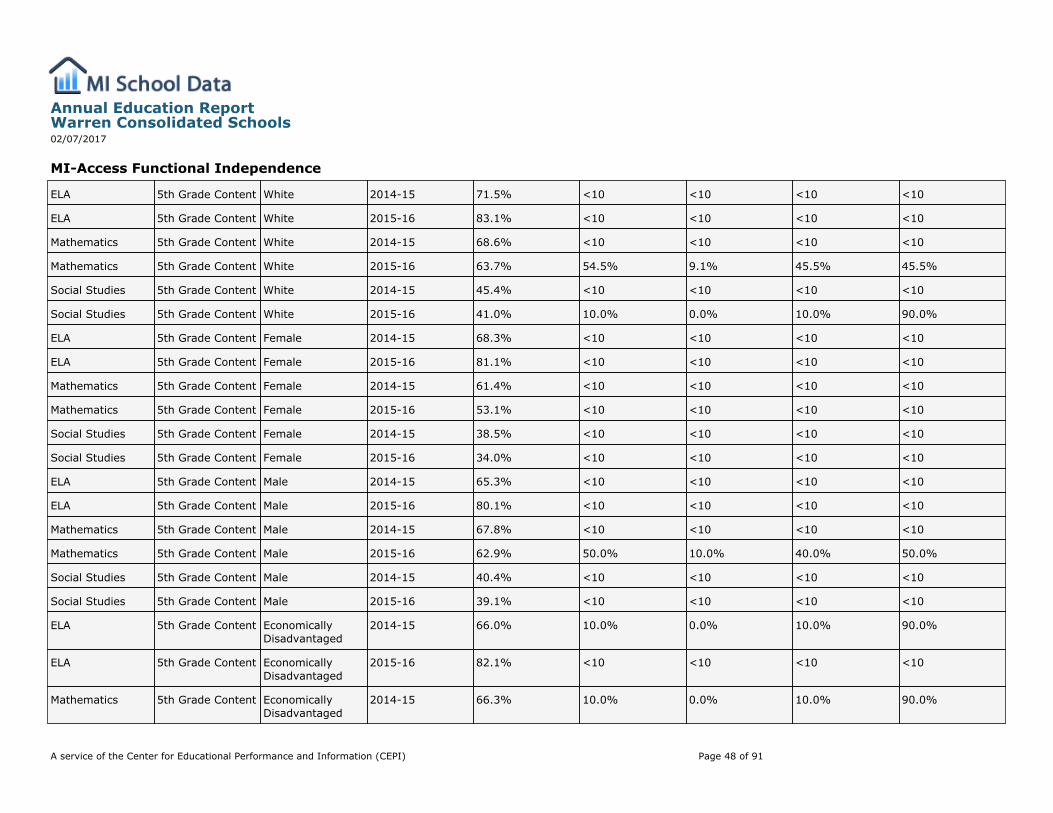
MI-Access Functional Independence
ELA 5th Grade Content White 2014-15 71.5% <10 <10 <10 <10
ELA 5th Grade Content White 2015-16 83.1% <10 <10 <10 <10
Mathematics 5th Grade Content White 2014-15 68.6% <10 <10 <10 <10
Mathematics 5th Grade Content White 2015-16 63.7% 54.5% 9.1% 45.5% 45.5%
Social Studies 5th Grade Content White 2014-15 45.4% <10 <10 <10 <10
Social Studies 5th Grade Content White 2015-16 41.0% 10.0% 0.0% 10.0% 90.0%
ELA 5th Grade Content Female 2014-15 68.3% <10 <10 <10 <10
ELA 5th Grade Content Female 2015-16 81.1% <10 <10 <10 <10
Mathematics 5th Grade Content Female 2014-15 61.4% <10 <10 <10 <10
Mathematics 5th Grade Content Female 2015-16 53.1% <10 <10 <10 <10
Social Studies 5th Grade Content Female 2014-15 38.5% <10 <10 <10 <10
Social Studies 5th Grade Content Female 2015-16 34.0% <10 <10 <10 <10
ELA 5th Grade Content Male 2014-15 65.3% <10 <10 <10 <10
ELA 5th Grade Content Male 2015-16 80.1% <10 <10 <10 <10
Mathematics 5th Grade Content Male 2014-15 67.8% <10 <10 <10 <10
Mathematics 5th Grade Content Male 2015-16 62.9% 50.0% 10.0% 40.0% 50.0%
Social Studies 5th Grade Content Male 2014-15 40.4% <10 <10 <10 <10
Social Studies 5th Grade Content Male 2015-16 39.1% <10 <10 <10 <10
ELA 5th Grade Content EconomicallyDisadvantaged
2014-15 66.0% 10.0% 0.0% 10.0% 90.0%
ELA 5th Grade Content EconomicallyDisadvantaged
2015-16 82.1% <10 <10 <10 <10
Mathematics 5th Grade Content EconomicallyDisadvantaged
2014-15 66.3% 10.0% 0.0% 10.0% 90.0%
Annual Education ReportWarren Consolidated Schools02/07/2017
A service of the Center for Educational Performance and Information (CEPI) Page 48 of 91
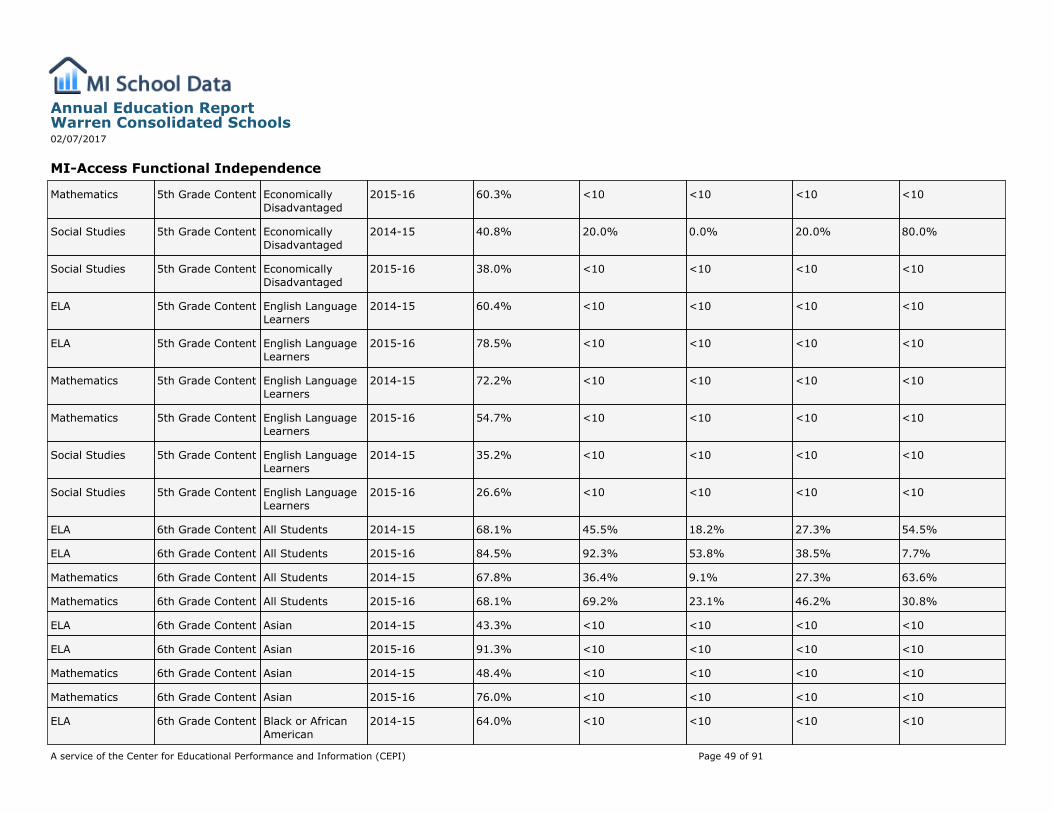
MI-Access Functional Independence
Mathematics 5th Grade Content EconomicallyDisadvantaged
2015-16 60.3% <10 <10 <10 <10
Social Studies 5th Grade Content EconomicallyDisadvantaged
2014-15 40.8% 20.0% 0.0% 20.0% 80.0%
Social Studies 5th Grade Content EconomicallyDisadvantaged
2015-16 38.0% <10 <10 <10 <10
ELA 5th Grade Content English LanguageLearners
2014-15 60.4% <10 <10 <10 <10
ELA 5th Grade Content English LanguageLearners
2015-16 78.5% <10 <10 <10 <10
Mathematics 5th Grade Content English LanguageLearners
2014-15 72.2% <10 <10 <10 <10
Mathematics 5th Grade Content English LanguageLearners
2015-16 54.7% <10 <10 <10 <10
Social Studies 5th Grade Content English LanguageLearners
2014-15 35.2% <10 <10 <10 <10
Social Studies 5th Grade Content English LanguageLearners
2015-16 26.6% <10 <10 <10 <10
ELA 6th Grade Content All Students 2014-15 68.1% 45.5% 18.2% 27.3% 54.5%
ELA 6th Grade Content All Students 2015-16 84.5% 92.3% 53.8% 38.5% 7.7%
Mathematics 6th Grade Content All Students 2014-15 67.8% 36.4% 9.1% 27.3% 63.6%
Mathematics 6th Grade Content All Students 2015-16 68.1% 69.2% 23.1% 46.2% 30.8%
ELA 6th Grade Content Asian 2014-15 43.3% <10 <10 <10 <10
ELA 6th Grade Content Asian 2015-16 91.3% <10 <10 <10 <10
Mathematics 6th Grade Content Asian 2014-15 48.4% <10 <10 <10 <10
Mathematics 6th Grade Content Asian 2015-16 76.0% <10 <10 <10 <10
ELA 6th Grade Content Black or AfricanAmerican
2014-15 64.0% <10 <10 <10 <10
Annual Education ReportWarren Consolidated Schools02/07/2017
A service of the Center for Educational Performance and Information (CEPI) Page 49 of 91

MI-Access Functional Independence
ELA 6th Grade Content Black or AfricanAmerican
2015-16 79.8% <10 <10 <10 <10
Mathematics 6th Grade Content Black or AfricanAmerican
2014-15 64.6% <10 <10 <10 <10
Mathematics 6th Grade Content Black or AfricanAmerican
2015-16 59.5% <10 <10 <10 <10
ELA 6th Grade Content White 2014-15 70.5% <10 <10 <10 <10
ELA 6th Grade Content White 2015-16 86.0% <10 <10 <10 <10
Mathematics 6th Grade Content White 2014-15 69.4% <10 <10 <10 <10
Mathematics 6th Grade Content White 2015-16 71.3% <10 <10 <10 <10
ELA 6th Grade Content Female 2014-15 72.5% <10 <10 <10 <10
ELA 6th Grade Content Female 2015-16 85.4% <10 <10 <10 <10
Mathematics 6th Grade Content Female 2014-15 64.2% <10 <10 <10 <10
Mathematics 6th Grade Content Female 2015-16 68.9% <10 <10 <10 <10
ELA 6th Grade Content Male 2014-15 66.0% <10 <10 <10 <10
ELA 6th Grade Content Male 2015-16 84.1% <10 <10 <10 <10
Mathematics 6th Grade Content Male 2014-15 69.7% <10 <10 <10 <10
Mathematics 6th Grade Content Male 2015-16 67.6% <10 <10 <10 <10
ELA 6th Grade Content EconomicallyDisadvantaged
2014-15 69.3% <10 <10 <10 <10
ELA 6th Grade Content EconomicallyDisadvantaged
2015-16 86.3% 90.0% 60.0% 30.0% 10.0%
Mathematics 6th Grade Content EconomicallyDisadvantaged
2014-15 69.9% <10 <10 <10 <10
Mathematics 6th Grade Content EconomicallyDisadvantaged
2015-16 69.6% 70.0% 10.0% 60.0% 30.0%
Annual Education ReportWarren Consolidated Schools02/07/2017
A service of the Center for Educational Performance and Information (CEPI) Page 50 of 91
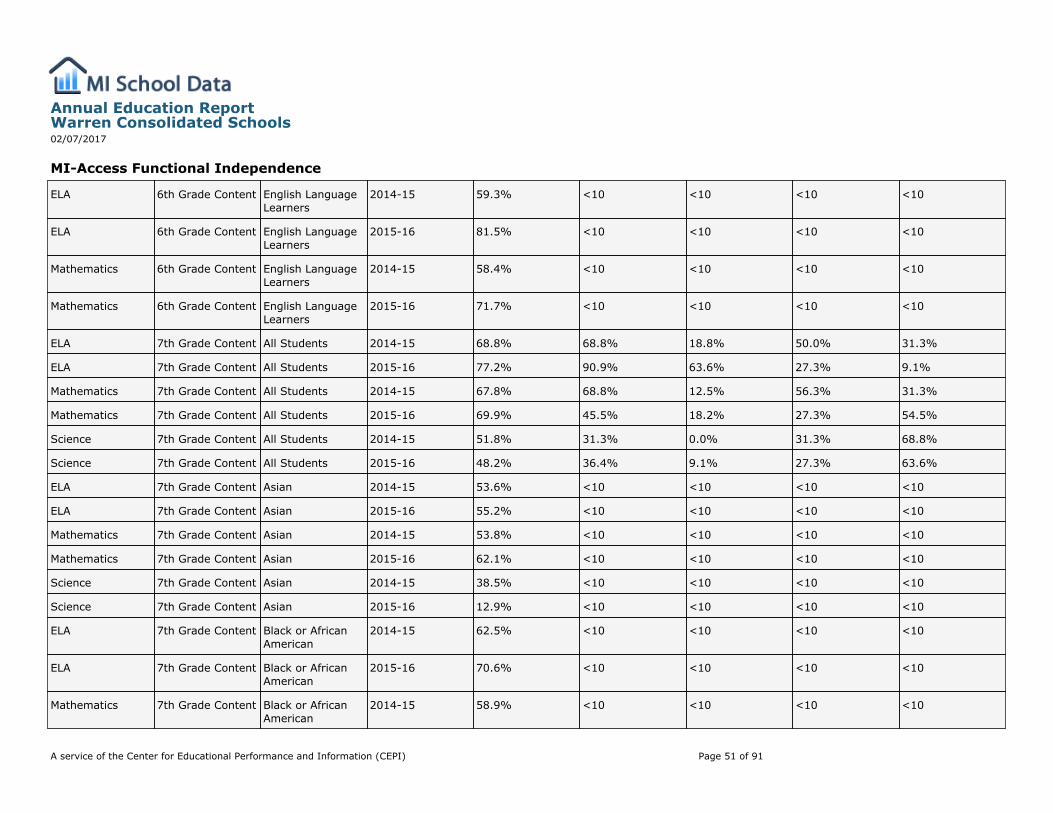
MI-Access Functional Independence
ELA 6th Grade Content English LanguageLearners
2014-15 59.3% <10 <10 <10 <10
ELA 6th Grade Content English LanguageLearners
2015-16 81.5% <10 <10 <10 <10
Mathematics 6th Grade Content English LanguageLearners
2014-15 58.4% <10 <10 <10 <10
Mathematics 6th Grade Content English LanguageLearners
2015-16 71.7% <10 <10 <10 <10
ELA 7th Grade Content All Students 2014-15 68.8% 68.8% 18.8% 50.0% 31.3%
ELA 7th Grade Content All Students 2015-16 77.2% 90.9% 63.6% 27.3% 9.1%
Mathematics 7th Grade Content All Students 2014-15 67.8% 68.8% 12.5% 56.3% 31.3%
Mathematics 7th Grade Content All Students 2015-16 69.9% 45.5% 18.2% 27.3% 54.5%
Science 7th Grade Content All Students 2014-15 51.8% 31.3% 0.0% 31.3% 68.8%
Science 7th Grade Content All Students 2015-16 48.2% 36.4% 9.1% 27.3% 63.6%
ELA 7th Grade Content Asian 2014-15 53.6% <10 <10 <10 <10
ELA 7th Grade Content Asian 2015-16 55.2% <10 <10 <10 <10
Mathematics 7th Grade Content Asian 2014-15 53.8% <10 <10 <10 <10
Mathematics 7th Grade Content Asian 2015-16 62.1% <10 <10 <10 <10
Science 7th Grade Content Asian 2014-15 38.5% <10 <10 <10 <10
Science 7th Grade Content Asian 2015-16 12.9% <10 <10 <10 <10
ELA 7th Grade Content Black or AfricanAmerican
2014-15 62.5% <10 <10 <10 <10
ELA 7th Grade Content Black or AfricanAmerican
2015-16 70.6% <10 <10 <10 <10
Mathematics 7th Grade Content Black or AfricanAmerican
2014-15 58.9% <10 <10 <10 <10
Annual Education ReportWarren Consolidated Schools02/07/2017
A service of the Center for Educational Performance and Information (CEPI) Page 51 of 91
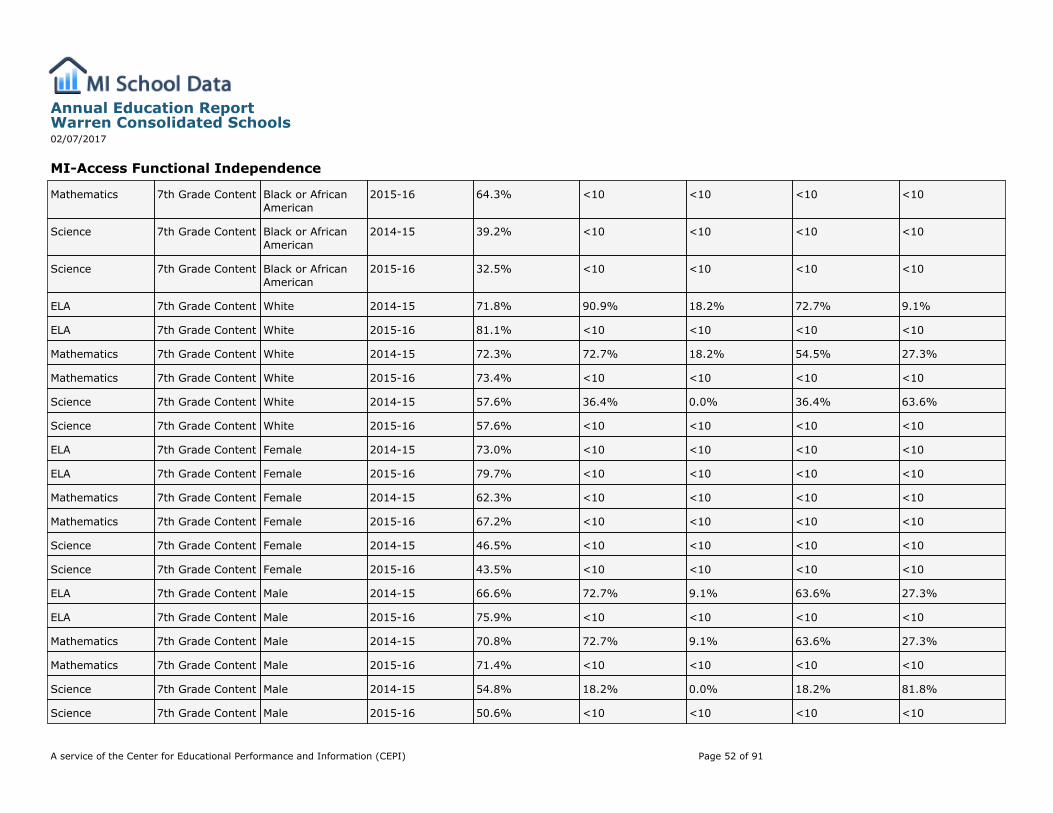
MI-Access Functional Independence
Mathematics 7th Grade Content Black or AfricanAmerican
2015-16 64.3% <10 <10 <10 <10
Science 7th Grade Content Black or AfricanAmerican
2014-15 39.2% <10 <10 <10 <10
Science 7th Grade Content Black or AfricanAmerican
2015-16 32.5% <10 <10 <10 <10
ELA 7th Grade Content White 2014-15 71.8% 90.9% 18.2% 72.7% 9.1%
ELA 7th Grade Content White 2015-16 81.1% <10 <10 <10 <10
Mathematics 7th Grade Content White 2014-15 72.3% 72.7% 18.2% 54.5% 27.3%
Mathematics 7th Grade Content White 2015-16 73.4% <10 <10 <10 <10
Science 7th Grade Content White 2014-15 57.6% 36.4% 0.0% 36.4% 63.6%
Science 7th Grade Content White 2015-16 57.6% <10 <10 <10 <10
ELA 7th Grade Content Female 2014-15 73.0% <10 <10 <10 <10
ELA 7th Grade Content Female 2015-16 79.7% <10 <10 <10 <10
Mathematics 7th Grade Content Female 2014-15 62.3% <10 <10 <10 <10
Mathematics 7th Grade Content Female 2015-16 67.2% <10 <10 <10 <10
Science 7th Grade Content Female 2014-15 46.5% <10 <10 <10 <10
Science 7th Grade Content Female 2015-16 43.5% <10 <10 <10 <10
ELA 7th Grade Content Male 2014-15 66.6% 72.7% 9.1% 63.6% 27.3%
ELA 7th Grade Content Male 2015-16 75.9% <10 <10 <10 <10
Mathematics 7th Grade Content Male 2014-15 70.8% 72.7% 9.1% 63.6% 27.3%
Mathematics 7th Grade Content Male 2015-16 71.4% <10 <10 <10 <10
Science 7th Grade Content Male 2014-15 54.8% 18.2% 0.0% 18.2% 81.8%
Science 7th Grade Content Male 2015-16 50.6% <10 <10 <10 <10
Annual Education ReportWarren Consolidated Schools02/07/2017
A service of the Center for Educational Performance and Information (CEPI) Page 52 of 91
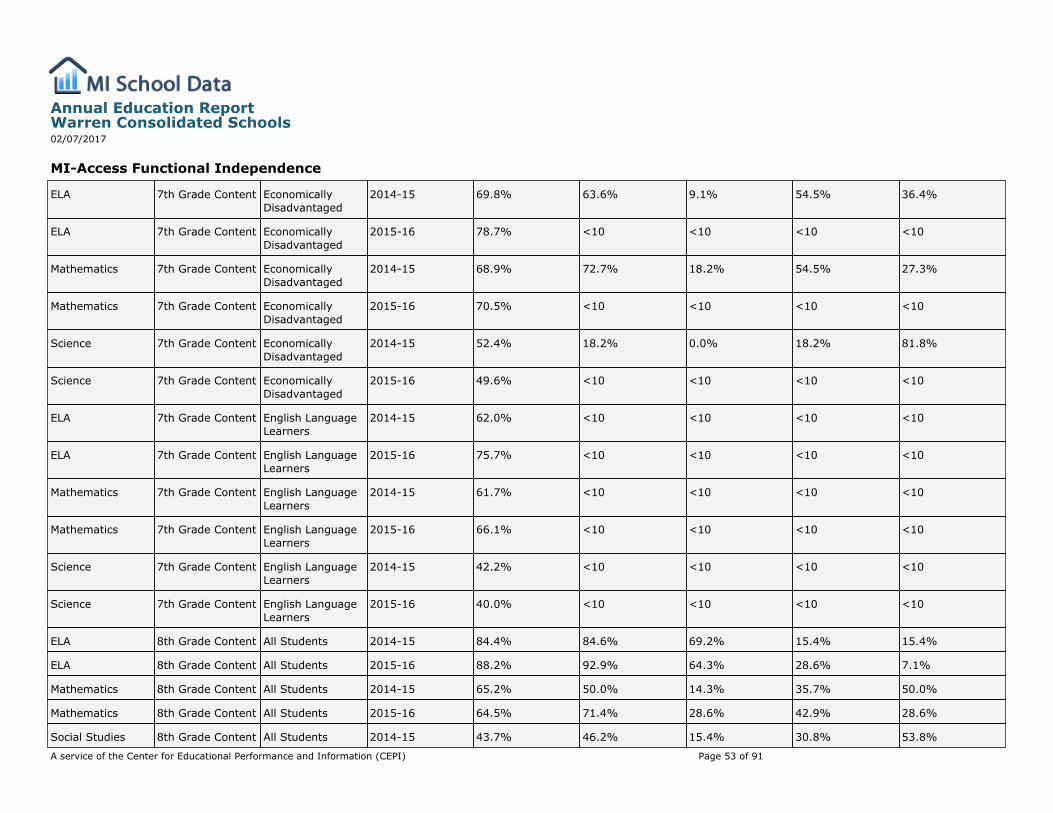
MI-Access Functional Independence
ELA 7th Grade Content EconomicallyDisadvantaged
2014-15 69.8% 63.6% 9.1% 54.5% 36.4%
ELA 7th Grade Content EconomicallyDisadvantaged
2015-16 78.7% <10 <10 <10 <10
Mathematics 7th Grade Content EconomicallyDisadvantaged
2014-15 68.9% 72.7% 18.2% 54.5% 27.3%
Mathematics 7th Grade Content EconomicallyDisadvantaged
2015-16 70.5% <10 <10 <10 <10
Science 7th Grade Content EconomicallyDisadvantaged
2014-15 52.4% 18.2% 0.0% 18.2% 81.8%
Science 7th Grade Content EconomicallyDisadvantaged
2015-16 49.6% <10 <10 <10 <10
ELA 7th Grade Content English LanguageLearners
2014-15 62.0% <10 <10 <10 <10
ELA 7th Grade Content English LanguageLearners
2015-16 75.7% <10 <10 <10 <10
Mathematics 7th Grade Content English LanguageLearners
2014-15 61.7% <10 <10 <10 <10
Mathematics 7th Grade Content English LanguageLearners
2015-16 66.1% <10 <10 <10 <10
Science 7th Grade Content English LanguageLearners
2014-15 42.2% <10 <10 <10 <10
Science 7th Grade Content English LanguageLearners
2015-16 40.0% <10 <10 <10 <10
ELA 8th Grade Content All Students 2014-15 84.4% 84.6% 69.2% 15.4% 15.4%
ELA 8th Grade Content All Students 2015-16 88.2% 92.9% 64.3% 28.6% 7.1%
Mathematics 8th Grade Content All Students 2014-15 65.2% 50.0% 14.3% 35.7% 50.0%
Mathematics 8th Grade Content All Students 2015-16 64.5% 71.4% 28.6% 42.9% 28.6%
Social Studies 8th Grade Content All Students 2014-15 43.7% 46.2% 15.4% 30.8% 53.8%
Annual Education ReportWarren Consolidated Schools02/07/2017
A service of the Center for Educational Performance and Information (CEPI) Page 53 of 91
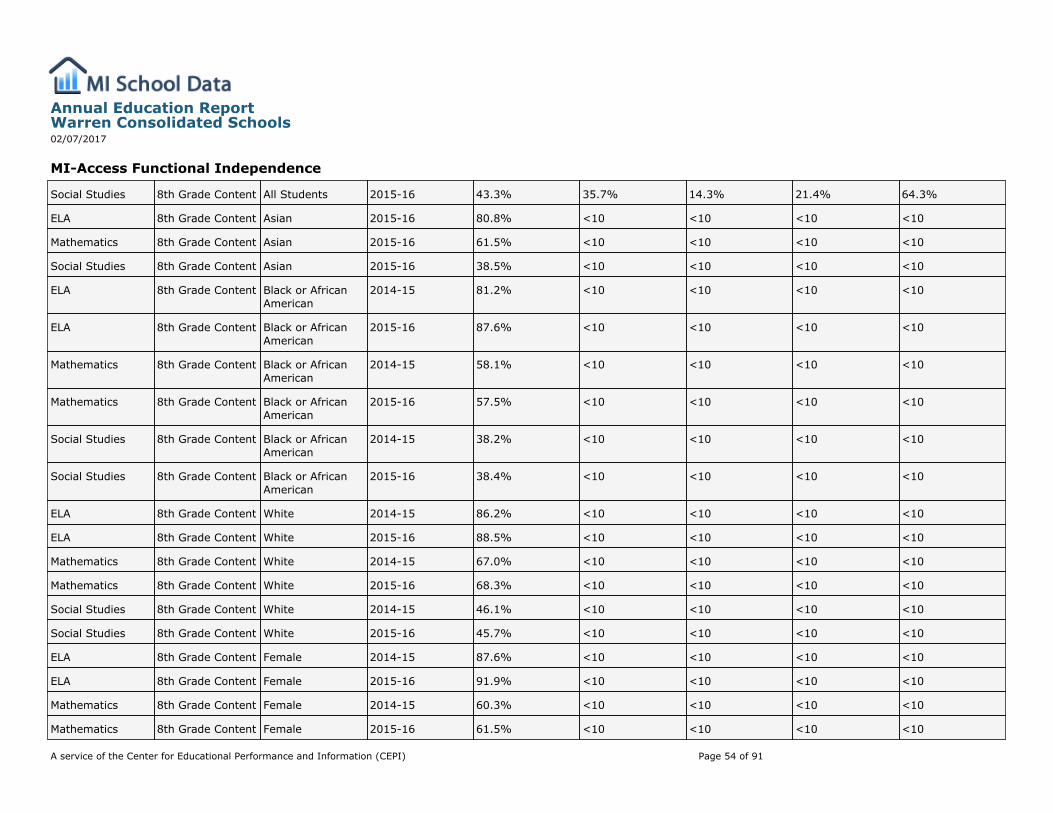
MI-Access Functional Independence
Social Studies 8th Grade Content All Students 2015-16 43.3% 35.7% 14.3% 21.4% 64.3%
ELA 8th Grade Content Asian 2015-16 80.8% <10 <10 <10 <10
Mathematics 8th Grade Content Asian 2015-16 61.5% <10 <10 <10 <10
Social Studies 8th Grade Content Asian 2015-16 38.5% <10 <10 <10 <10
ELA 8th Grade Content Black or AfricanAmerican
2014-15 81.2% <10 <10 <10 <10
ELA 8th Grade Content Black or AfricanAmerican
2015-16 87.6% <10 <10 <10 <10
Mathematics 8th Grade Content Black or AfricanAmerican
2014-15 58.1% <10 <10 <10 <10
Mathematics 8th Grade Content Black or AfricanAmerican
2015-16 57.5% <10 <10 <10 <10
Social Studies 8th Grade Content Black or AfricanAmerican
2014-15 38.2% <10 <10 <10 <10
Social Studies 8th Grade Content Black or AfricanAmerican
2015-16 38.4% <10 <10 <10 <10
ELA 8th Grade Content White 2014-15 86.2% <10 <10 <10 <10
ELA 8th Grade Content White 2015-16 88.5% <10 <10 <10 <10
Mathematics 8th Grade Content White 2014-15 67.0% <10 <10 <10 <10
Mathematics 8th Grade Content White 2015-16 68.3% <10 <10 <10 <10
Social Studies 8th Grade Content White 2014-15 46.1% <10 <10 <10 <10
Social Studies 8th Grade Content White 2015-16 45.7% <10 <10 <10 <10
ELA 8th Grade Content Female 2014-15 87.6% <10 <10 <10 <10
ELA 8th Grade Content Female 2015-16 91.9% <10 <10 <10 <10
Mathematics 8th Grade Content Female 2014-15 60.3% <10 <10 <10 <10
Mathematics 8th Grade Content Female 2015-16 61.5% <10 <10 <10 <10
Annual Education ReportWarren Consolidated Schools02/07/2017
A service of the Center for Educational Performance and Information (CEPI) Page 54 of 91
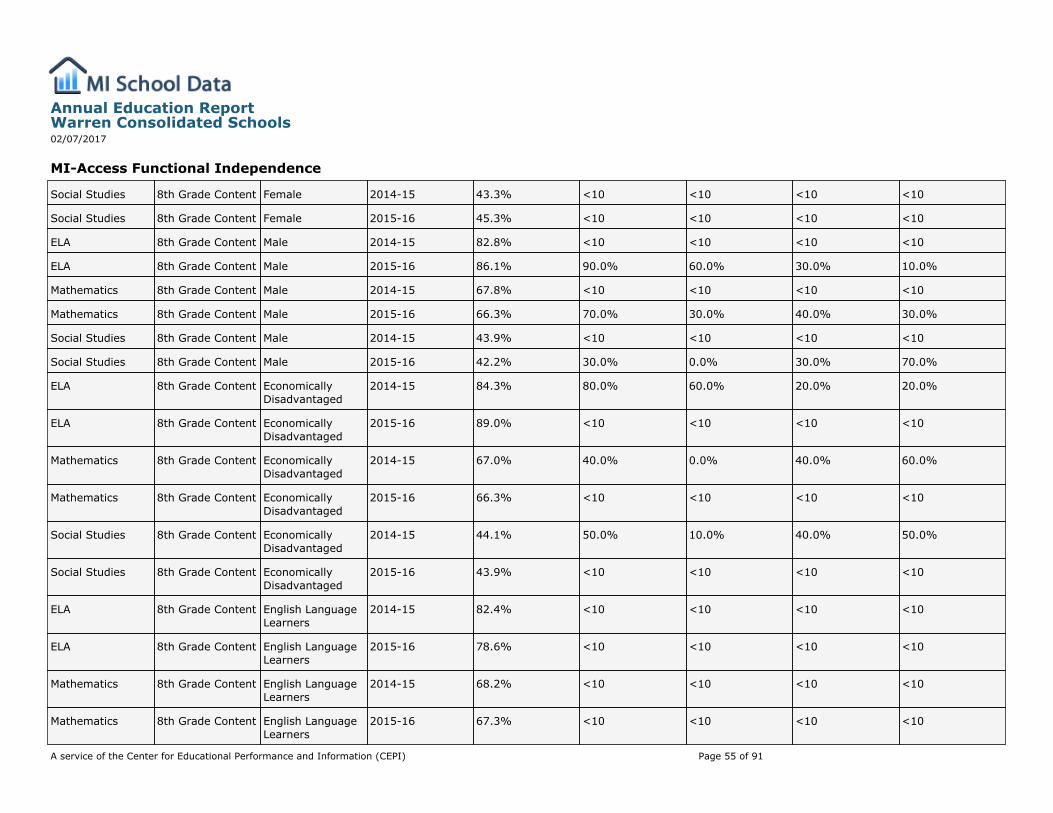
MI-Access Functional Independence
Social Studies 8th Grade Content Female 2014-15 43.3% <10 <10 <10 <10
Social Studies 8th Grade Content Female 2015-16 45.3% <10 <10 <10 <10
ELA 8th Grade Content Male 2014-15 82.8% <10 <10 <10 <10
ELA 8th Grade Content Male 2015-16 86.1% 90.0% 60.0% 30.0% 10.0%
Mathematics 8th Grade Content Male 2014-15 67.8% <10 <10 <10 <10
Mathematics 8th Grade Content Male 2015-16 66.3% 70.0% 30.0% 40.0% 30.0%
Social Studies 8th Grade Content Male 2014-15 43.9% <10 <10 <10 <10
Social Studies 8th Grade Content Male 2015-16 42.2% 30.0% 0.0% 30.0% 70.0%
ELA 8th Grade Content EconomicallyDisadvantaged
2014-15 84.3% 80.0% 60.0% 20.0% 20.0%
ELA 8th Grade Content EconomicallyDisadvantaged
2015-16 89.0% <10 <10 <10 <10
Mathematics 8th Grade Content EconomicallyDisadvantaged
2014-15 67.0% 40.0% 0.0% 40.0% 60.0%
Mathematics 8th Grade Content EconomicallyDisadvantaged
2015-16 66.3% <10 <10 <10 <10
Social Studies 8th Grade Content EconomicallyDisadvantaged
2014-15 44.1% 50.0% 10.0% 40.0% 50.0%
Social Studies 8th Grade Content EconomicallyDisadvantaged
2015-16 43.9% <10 <10 <10 <10
ELA 8th Grade Content English LanguageLearners
2014-15 82.4% <10 <10 <10 <10
ELA 8th Grade Content English LanguageLearners
2015-16 78.6% <10 <10 <10 <10
Mathematics 8th Grade Content English LanguageLearners
2014-15 68.2% <10 <10 <10 <10
Mathematics 8th Grade Content English LanguageLearners
2015-16 67.3% <10 <10 <10 <10
Annual Education ReportWarren Consolidated Schools02/07/2017
A service of the Center for Educational Performance and Information (CEPI) Page 55 of 91
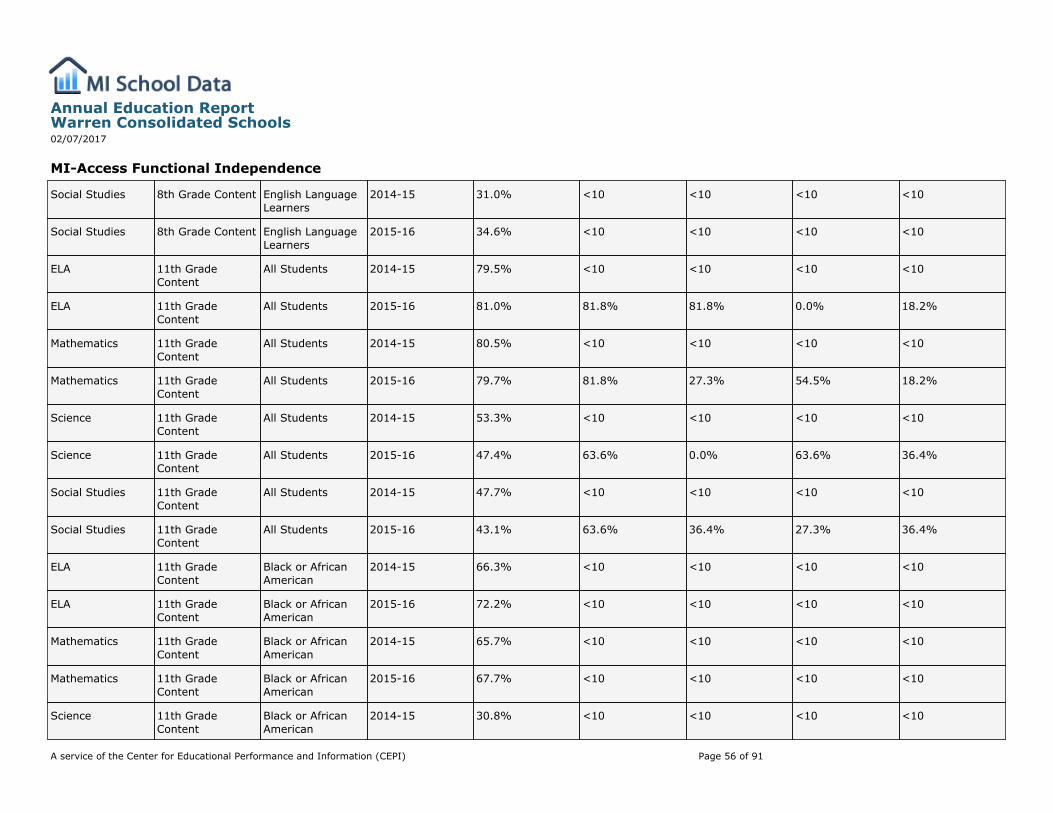
MI-Access Functional Independence
Social Studies 8th Grade Content English LanguageLearners
2014-15 31.0% <10 <10 <10 <10
Social Studies 8th Grade Content English LanguageLearners
2015-16 34.6% <10 <10 <10 <10
ELA 11th GradeContent
All Students 2014-15 79.5% <10 <10 <10 <10
ELA 11th GradeContent
All Students 2015-16 81.0% 81.8% 81.8% 0.0% 18.2%
Mathematics 11th GradeContent
All Students 2014-15 80.5% <10 <10 <10 <10
Mathematics 11th GradeContent
All Students 2015-16 79.7% 81.8% 27.3% 54.5% 18.2%
Science 11th GradeContent
All Students 2014-15 53.3% <10 <10 <10 <10
Science 11th GradeContent
All Students 2015-16 47.4% 63.6% 0.0% 63.6% 36.4%
Social Studies 11th GradeContent
All Students 2014-15 47.7% <10 <10 <10 <10
Social Studies 11th GradeContent
All Students 2015-16 43.1% 63.6% 36.4% 27.3% 36.4%
ELA 11th GradeContent
Black or AfricanAmerican
2014-15 66.3% <10 <10 <10 <10
ELA 11th GradeContent
Black or AfricanAmerican
2015-16 72.2% <10 <10 <10 <10
Mathematics 11th GradeContent
Black or AfricanAmerican
2014-15 65.7% <10 <10 <10 <10
Mathematics 11th GradeContent
Black or AfricanAmerican
2015-16 67.7% <10 <10 <10 <10
Science 11th GradeContent
Black or AfricanAmerican
2014-15 30.8% <10 <10 <10 <10
Annual Education ReportWarren Consolidated Schools02/07/2017
A service of the Center for Educational Performance and Information (CEPI) Page 56 of 91
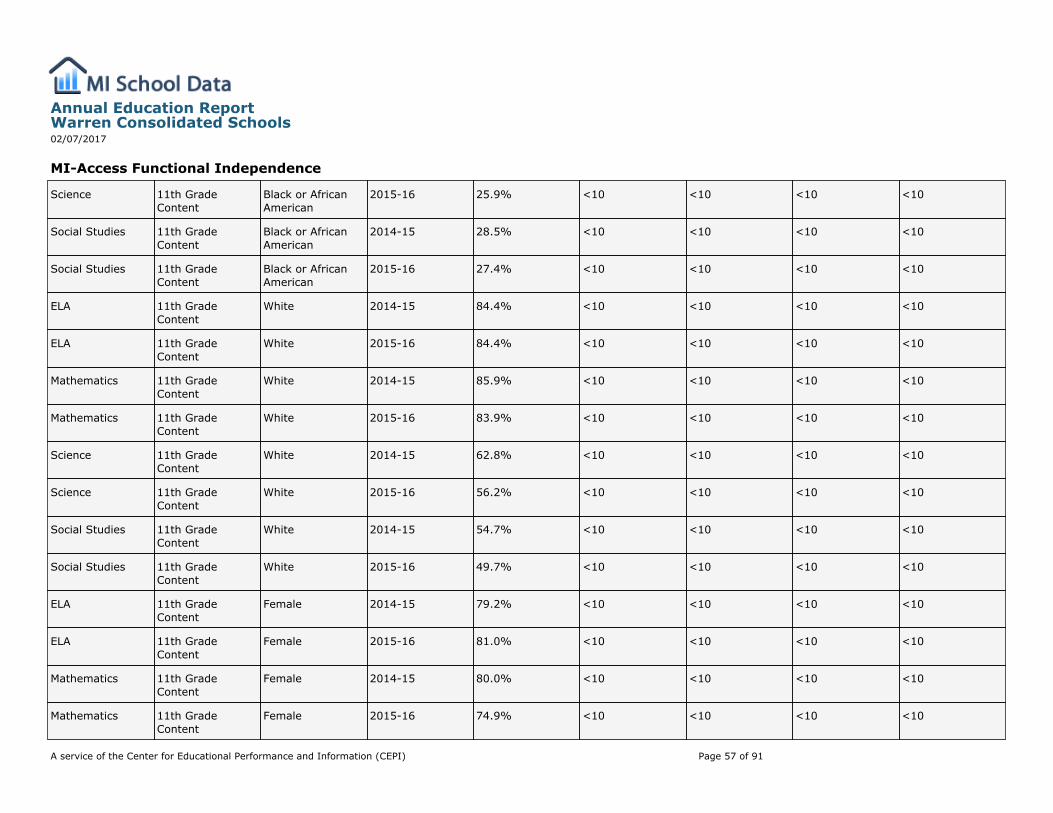
MI-Access Functional Independence
Science 11th GradeContent
Black or AfricanAmerican
2015-16 25.9% <10 <10 <10 <10
Social Studies 11th GradeContent
Black or AfricanAmerican
2014-15 28.5% <10 <10 <10 <10
Social Studies 11th GradeContent
Black or AfricanAmerican
2015-16 27.4% <10 <10 <10 <10
ELA 11th GradeContent
White 2014-15 84.4% <10 <10 <10 <10
ELA 11th GradeContent
White 2015-16 84.4% <10 <10 <10 <10
Mathematics 11th GradeContent
White 2014-15 85.9% <10 <10 <10 <10
Mathematics 11th GradeContent
White 2015-16 83.9% <10 <10 <10 <10
Science 11th GradeContent
White 2014-15 62.8% <10 <10 <10 <10
Science 11th GradeContent
White 2015-16 56.2% <10 <10 <10 <10
Social Studies 11th GradeContent
White 2014-15 54.7% <10 <10 <10 <10
Social Studies 11th GradeContent
White 2015-16 49.7% <10 <10 <10 <10
ELA 11th GradeContent
Female 2014-15 79.2% <10 <10 <10 <10
ELA 11th GradeContent
Female 2015-16 81.0% <10 <10 <10 <10
Mathematics 11th GradeContent
Female 2014-15 80.0% <10 <10 <10 <10
Mathematics 11th GradeContent
Female 2015-16 74.9% <10 <10 <10 <10
Annual Education ReportWarren Consolidated Schools02/07/2017
A service of the Center for Educational Performance and Information (CEPI) Page 57 of 91
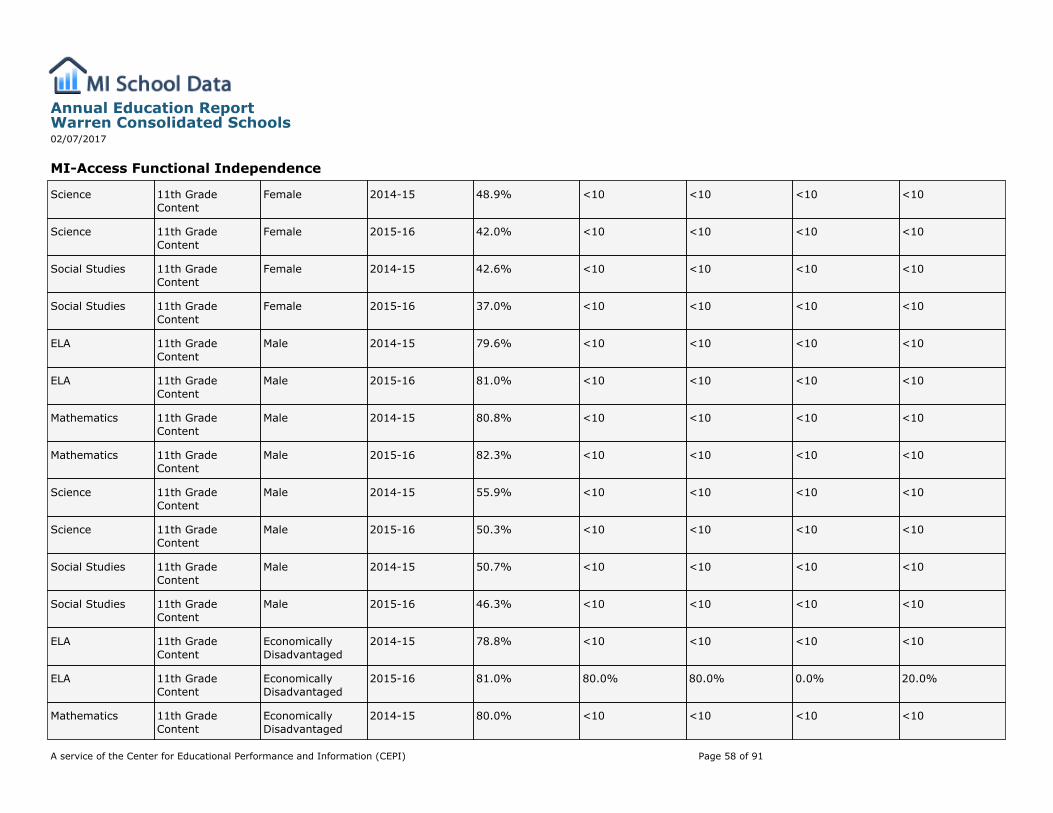
MI-Access Functional Independence
Science 11th GradeContent
Female 2014-15 48.9% <10 <10 <10 <10
Science 11th GradeContent
Female 2015-16 42.0% <10 <10 <10 <10
Social Studies 11th GradeContent
Female 2014-15 42.6% <10 <10 <10 <10
Social Studies 11th GradeContent
Female 2015-16 37.0% <10 <10 <10 <10
ELA 11th GradeContent
Male 2014-15 79.6% <10 <10 <10 <10
ELA 11th GradeContent
Male 2015-16 81.0% <10 <10 <10 <10
Mathematics 11th GradeContent
Male 2014-15 80.8% <10 <10 <10 <10
Mathematics 11th GradeContent
Male 2015-16 82.3% <10 <10 <10 <10
Science 11th GradeContent
Male 2014-15 55.9% <10 <10 <10 <10
Science 11th GradeContent
Male 2015-16 50.3% <10 <10 <10 <10
Social Studies 11th GradeContent
Male 2014-15 50.7% <10 <10 <10 <10
Social Studies 11th GradeContent
Male 2015-16 46.3% <10 <10 <10 <10
ELA 11th GradeContent
EconomicallyDisadvantaged
2014-15 78.8% <10 <10 <10 <10
ELA 11th GradeContent
EconomicallyDisadvantaged
2015-16 81.0% 80.0% 80.0% 0.0% 20.0%
Mathematics 11th GradeContent
EconomicallyDisadvantaged
2014-15 80.0% <10 <10 <10 <10
Annual Education ReportWarren Consolidated Schools02/07/2017
A service of the Center for Educational Performance and Information (CEPI) Page 58 of 91
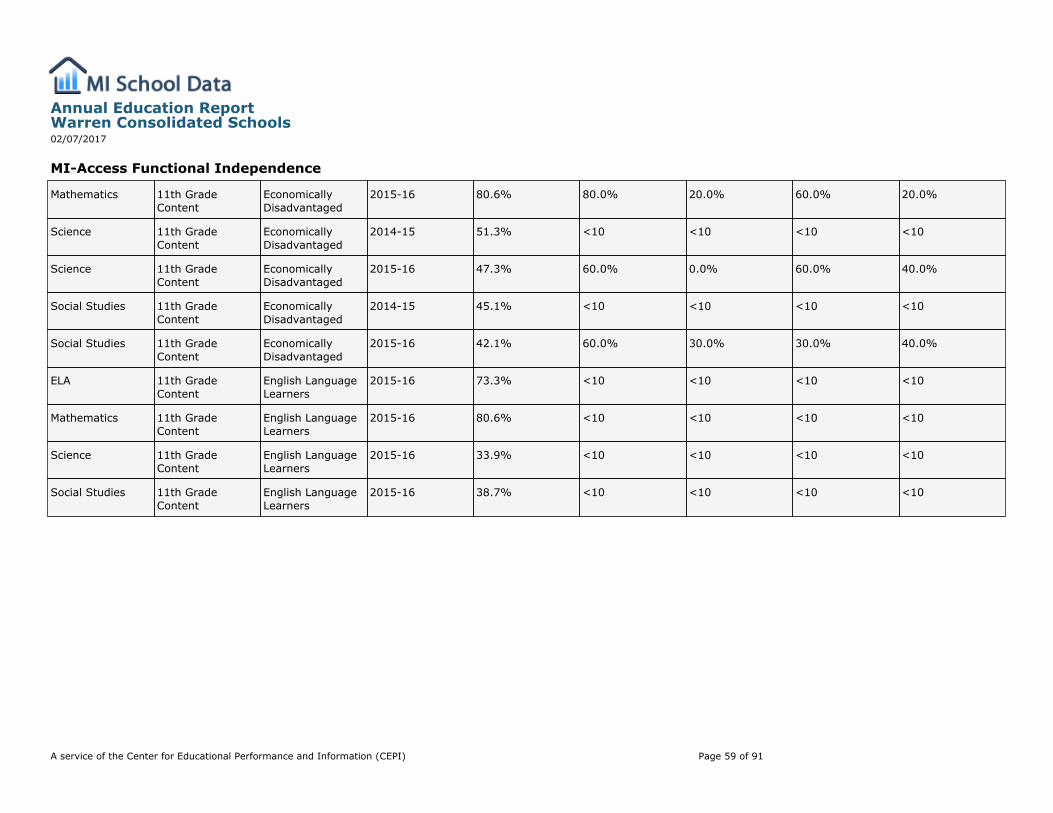
MI-Access Functional Independence
Mathematics 11th GradeContent
EconomicallyDisadvantaged
2015-16 80.6% 80.0% 20.0% 60.0% 20.0%
Science 11th GradeContent
EconomicallyDisadvantaged
2014-15 51.3% <10 <10 <10 <10
Science 11th GradeContent
EconomicallyDisadvantaged
2015-16 47.3% 60.0% 0.0% 60.0% 40.0%
Social Studies 11th GradeContent
EconomicallyDisadvantaged
2014-15 45.1% <10 <10 <10 <10
Social Studies 11th GradeContent
EconomicallyDisadvantaged
2015-16 42.1% 60.0% 30.0% 30.0% 40.0%
ELA 11th GradeContent
English LanguageLearners
2015-16 73.3% <10 <10 <10 <10
Mathematics 11th GradeContent
English LanguageLearners
2015-16 80.6% <10 <10 <10 <10
Science 11th GradeContent
English LanguageLearners
2015-16 33.9% <10 <10 <10 <10
Social Studies 11th GradeContent
English LanguageLearners
2015-16 38.7% <10 <10 <10 <10
Annual Education ReportWarren Consolidated Schools02/07/2017
A service of the Center for Educational Performance and Information (CEPI) Page 59 of 91
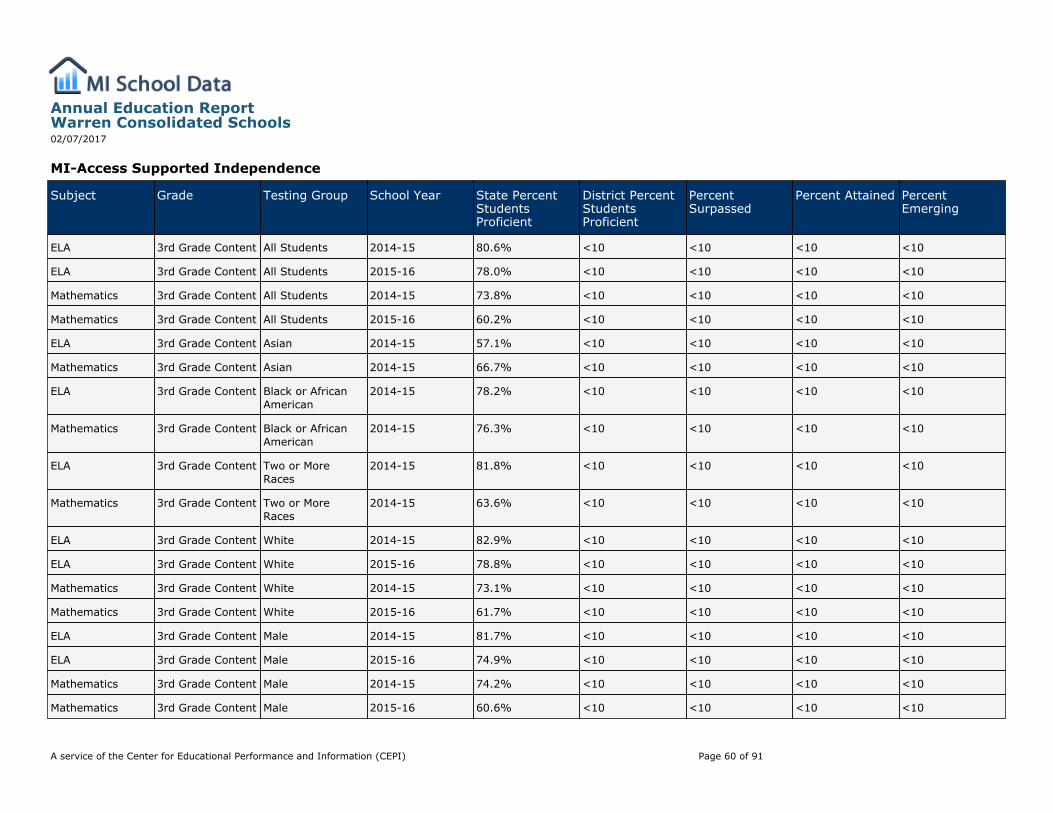
MI-Access Supported Independence
Subject Grade Testing Group School Year State PercentStudentsProficient
District PercentStudentsProficient
PercentSurpassed
Percent Attained PercentEmerging
ELA 3rd Grade Content All Students 2014-15 80.6% <10 <10 <10 <10
ELA 3rd Grade Content All Students 2015-16 78.0% <10 <10 <10 <10
Mathematics 3rd Grade Content All Students 2014-15 73.8% <10 <10 <10 <10
Mathematics 3rd Grade Content All Students 2015-16 60.2% <10 <10 <10 <10
ELA 3rd Grade Content Asian 2014-15 57.1% <10 <10 <10 <10
Mathematics 3rd Grade Content Asian 2014-15 66.7% <10 <10 <10 <10
ELA 3rd Grade Content Black or AfricanAmerican
2014-15 78.2% <10 <10 <10 <10
Mathematics 3rd Grade Content Black or AfricanAmerican
2014-15 76.3% <10 <10 <10 <10
ELA 3rd Grade Content Two or MoreRaces
2014-15 81.8% <10 <10 <10 <10
Mathematics 3rd Grade Content Two or MoreRaces
2014-15 63.6% <10 <10 <10 <10
ELA 3rd Grade Content White 2014-15 82.9% <10 <10 <10 <10
ELA 3rd Grade Content White 2015-16 78.8% <10 <10 <10 <10
Mathematics 3rd Grade Content White 2014-15 73.1% <10 <10 <10 <10
Mathematics 3rd Grade Content White 2015-16 61.7% <10 <10 <10 <10
ELA 3rd Grade Content Male 2014-15 81.7% <10 <10 <10 <10
ELA 3rd Grade Content Male 2015-16 74.9% <10 <10 <10 <10
Mathematics 3rd Grade Content Male 2014-15 74.2% <10 <10 <10 <10
Mathematics 3rd Grade Content Male 2015-16 60.6% <10 <10 <10 <10
Annual Education ReportWarren Consolidated Schools02/07/2017
A service of the Center for Educational Performance and Information (CEPI) Page 60 of 91

MI-Access Supported Independence
ELA 3rd Grade Content EconomicallyDisadvantaged
2014-15 81.0% <10 <10 <10 <10
ELA 3rd Grade Content EconomicallyDisadvantaged
2015-16 78.0% <10 <10 <10 <10
Mathematics 3rd Grade Content EconomicallyDisadvantaged
2014-15 76.9% <10 <10 <10 <10
Mathematics 3rd Grade Content EconomicallyDisadvantaged
2015-16 62.7% <10 <10 <10 <10
ELA 4th Grade Content All Students 2014-15 83.3% <10 <10 <10 <10
ELA 4th Grade Content All Students 2015-16 78.6% <10 <10 <10 <10
Mathematics 4th Grade Content All Students 2014-15 79.2% <10 <10 <10 <10
Mathematics 4th Grade Content All Students 2015-16 69.4% <10 <10 <10 <10
Science 4th Grade Content All Students 2014-15 89.3% <10 <10 <10 <10
Science 4th Grade Content All Students 2015-16 84.6% <10 <10 <10 <10
ELA 4th Grade Content Asian 2015-16 68.8% <10 <10 <10 <10
Mathematics 4th Grade Content Asian 2015-16 62.5% <10 <10 <10 <10
Science 4th Grade Content Asian 2015-16 75.0% <10 <10 <10 <10
ELA 4th Grade Content Black or AfricanAmerican
2015-16 83.1% <10 <10 <10 <10
Mathematics 4th Grade Content Black or AfricanAmerican
2015-16 70.8% <10 <10 <10 <10
Science 4th Grade Content Black or AfricanAmerican
2015-16 85.4% <10 <10 <10 <10
ELA 4th Grade Content Two or MoreRaces
2015-16 72.2% <10 <10 <10 <10
Mathematics 4th Grade Content Two or MoreRaces
2015-16 55.6% <10 <10 <10 <10
Annual Education ReportWarren Consolidated Schools02/07/2017
A service of the Center for Educational Performance and Information (CEPI) Page 61 of 91
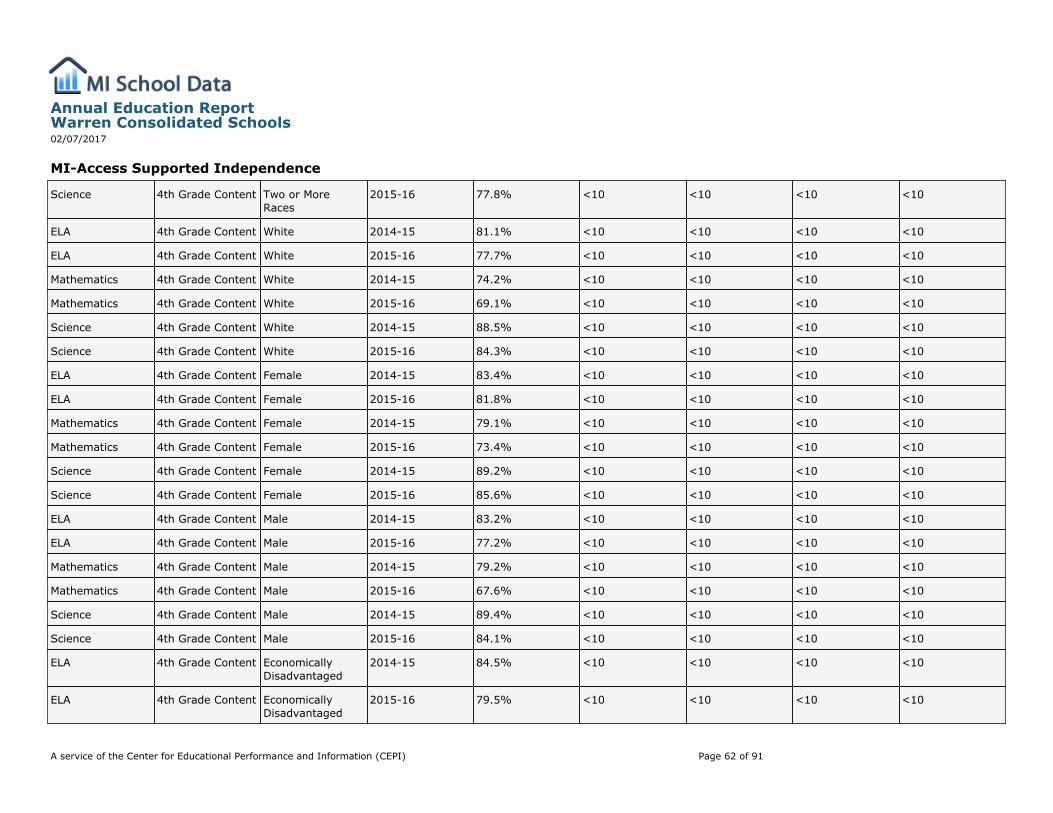
MI-Access Supported Independence
Science 4th Grade Content Two or MoreRaces
2015-16 77.8% <10 <10 <10 <10
ELA 4th Grade Content White 2014-15 81.1% <10 <10 <10 <10
ELA 4th Grade Content White 2015-16 77.7% <10 <10 <10 <10
Mathematics 4th Grade Content White 2014-15 74.2% <10 <10 <10 <10
Mathematics 4th Grade Content White 2015-16 69.1% <10 <10 <10 <10
Science 4th Grade Content White 2014-15 88.5% <10 <10 <10 <10
Science 4th Grade Content White 2015-16 84.3% <10 <10 <10 <10
ELA 4th Grade Content Female 2014-15 83.4% <10 <10 <10 <10
ELA 4th Grade Content Female 2015-16 81.8% <10 <10 <10 <10
Mathematics 4th Grade Content Female 2014-15 79.1% <10 <10 <10 <10
Mathematics 4th Grade Content Female 2015-16 73.4% <10 <10 <10 <10
Science 4th Grade Content Female 2014-15 89.2% <10 <10 <10 <10
Science 4th Grade Content Female 2015-16 85.6% <10 <10 <10 <10
ELA 4th Grade Content Male 2014-15 83.2% <10 <10 <10 <10
ELA 4th Grade Content Male 2015-16 77.2% <10 <10 <10 <10
Mathematics 4th Grade Content Male 2014-15 79.2% <10 <10 <10 <10
Mathematics 4th Grade Content Male 2015-16 67.6% <10 <10 <10 <10
Science 4th Grade Content Male 2014-15 89.4% <10 <10 <10 <10
Science 4th Grade Content Male 2015-16 84.1% <10 <10 <10 <10
ELA 4th Grade Content EconomicallyDisadvantaged
2014-15 84.5% <10 <10 <10 <10
ELA 4th Grade Content EconomicallyDisadvantaged
2015-16 79.5% <10 <10 <10 <10
Annual Education ReportWarren Consolidated Schools02/07/2017
A service of the Center for Educational Performance and Information (CEPI) Page 62 of 91
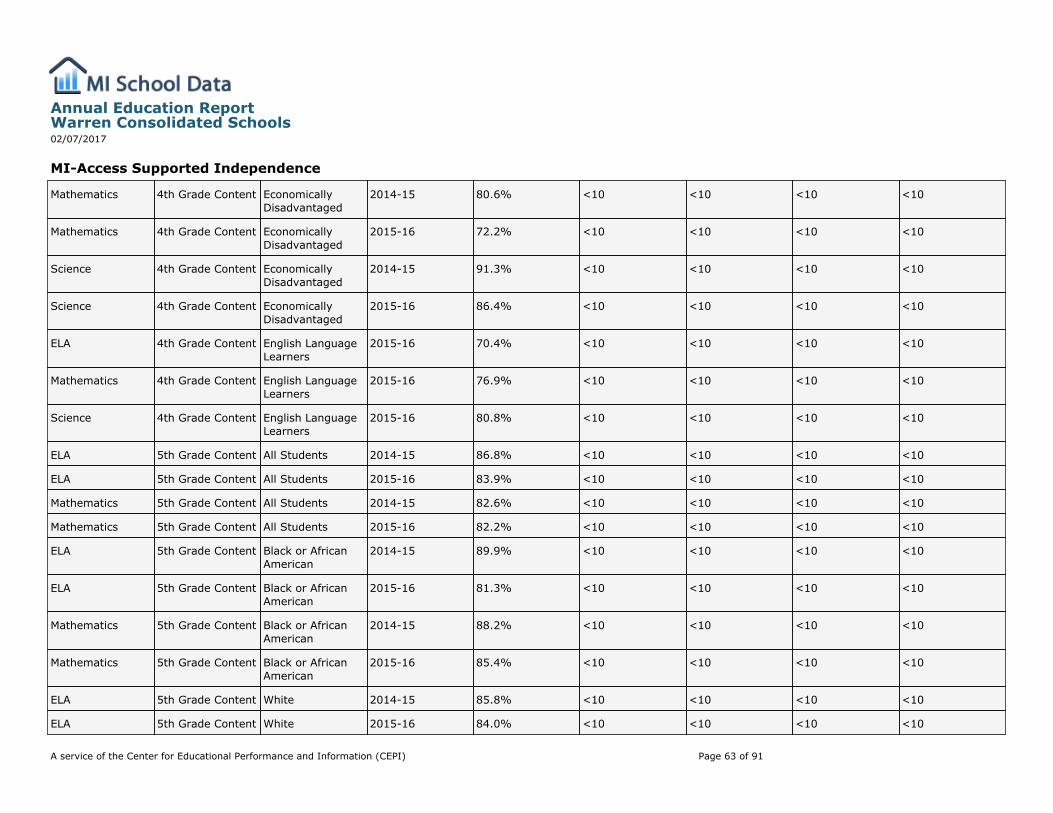
MI-Access Supported Independence
Mathematics 4th Grade Content EconomicallyDisadvantaged
2014-15 80.6% <10 <10 <10 <10
Mathematics 4th Grade Content EconomicallyDisadvantaged
2015-16 72.2% <10 <10 <10 <10
Science 4th Grade Content EconomicallyDisadvantaged
2014-15 91.3% <10 <10 <10 <10
Science 4th Grade Content EconomicallyDisadvantaged
2015-16 86.4% <10 <10 <10 <10
ELA 4th Grade Content English LanguageLearners
2015-16 70.4% <10 <10 <10 <10
Mathematics 4th Grade Content English LanguageLearners
2015-16 76.9% <10 <10 <10 <10
Science 4th Grade Content English LanguageLearners
2015-16 80.8% <10 <10 <10 <10
ELA 5th Grade Content All Students 2014-15 86.8% <10 <10 <10 <10
ELA 5th Grade Content All Students 2015-16 83.9% <10 <10 <10 <10
Mathematics 5th Grade Content All Students 2014-15 82.6% <10 <10 <10 <10
Mathematics 5th Grade Content All Students 2015-16 82.2% <10 <10 <10 <10
ELA 5th Grade Content Black or AfricanAmerican
2014-15 89.9% <10 <10 <10 <10
ELA 5th Grade Content Black or AfricanAmerican
2015-16 81.3% <10 <10 <10 <10
Mathematics 5th Grade Content Black or AfricanAmerican
2014-15 88.2% <10 <10 <10 <10
Mathematics 5th Grade Content Black or AfricanAmerican
2015-16 85.4% <10 <10 <10 <10
ELA 5th Grade Content White 2014-15 85.8% <10 <10 <10 <10
ELA 5th Grade Content White 2015-16 84.0% <10 <10 <10 <10
Annual Education ReportWarren Consolidated Schools02/07/2017
A service of the Center for Educational Performance and Information (CEPI) Page 63 of 91
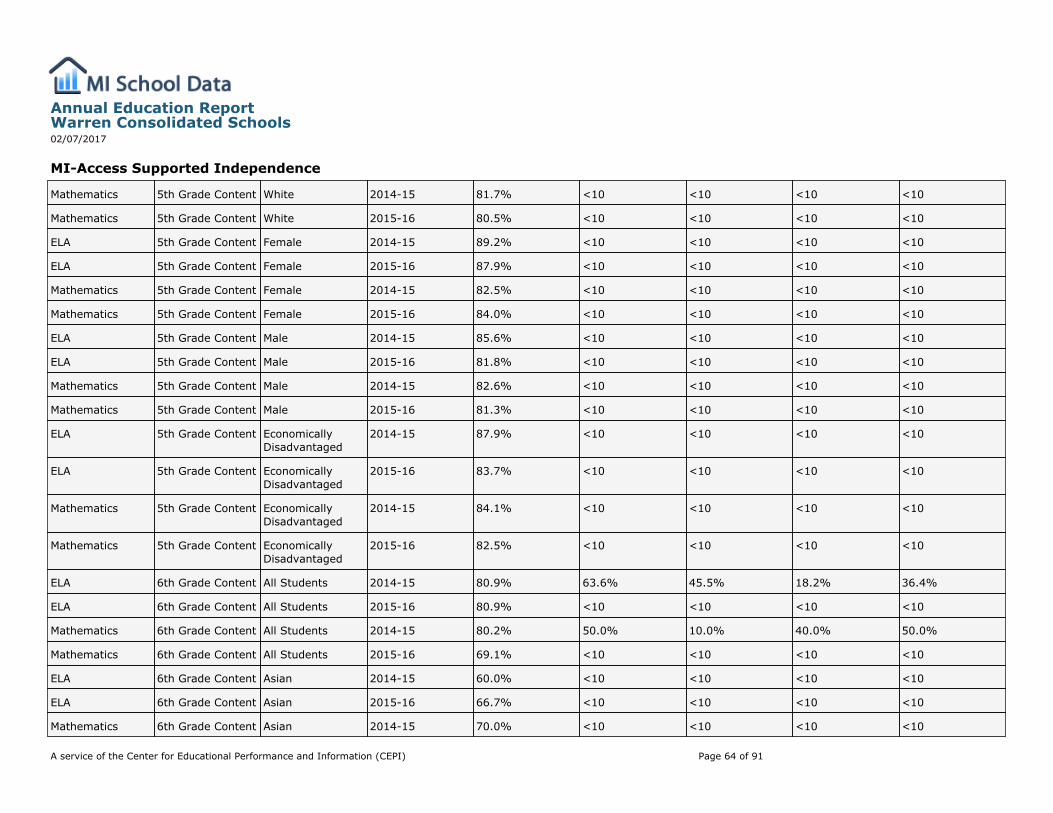
MI-Access Supported Independence
Mathematics 5th Grade Content White 2014-15 81.7% <10 <10 <10 <10
Mathematics 5th Grade Content White 2015-16 80.5% <10 <10 <10 <10
ELA 5th Grade Content Female 2014-15 89.2% <10 <10 <10 <10
ELA 5th Grade Content Female 2015-16 87.9% <10 <10 <10 <10
Mathematics 5th Grade Content Female 2014-15 82.5% <10 <10 <10 <10
Mathematics 5th Grade Content Female 2015-16 84.0% <10 <10 <10 <10
ELA 5th Grade Content Male 2014-15 85.6% <10 <10 <10 <10
ELA 5th Grade Content Male 2015-16 81.8% <10 <10 <10 <10
Mathematics 5th Grade Content Male 2014-15 82.6% <10 <10 <10 <10
Mathematics 5th Grade Content Male 2015-16 81.3% <10 <10 <10 <10
ELA 5th Grade Content EconomicallyDisadvantaged
2014-15 87.9% <10 <10 <10 <10
ELA 5th Grade Content EconomicallyDisadvantaged
2015-16 83.7% <10 <10 <10 <10
Mathematics 5th Grade Content EconomicallyDisadvantaged
2014-15 84.1% <10 <10 <10 <10
Mathematics 5th Grade Content EconomicallyDisadvantaged
2015-16 82.5% <10 <10 <10 <10
ELA 6th Grade Content All Students 2014-15 80.9% 63.6% 45.5% 18.2% 36.4%
ELA 6th Grade Content All Students 2015-16 80.9% <10 <10 <10 <10
Mathematics 6th Grade Content All Students 2014-15 80.2% 50.0% 10.0% 40.0% 50.0%
Mathematics 6th Grade Content All Students 2015-16 69.1% <10 <10 <10 <10
ELA 6th Grade Content Asian 2014-15 60.0% <10 <10 <10 <10
ELA 6th Grade Content Asian 2015-16 66.7% <10 <10 <10 <10
Mathematics 6th Grade Content Asian 2014-15 70.0% <10 <10 <10 <10
Annual Education ReportWarren Consolidated Schools02/07/2017
A service of the Center for Educational Performance and Information (CEPI) Page 64 of 91
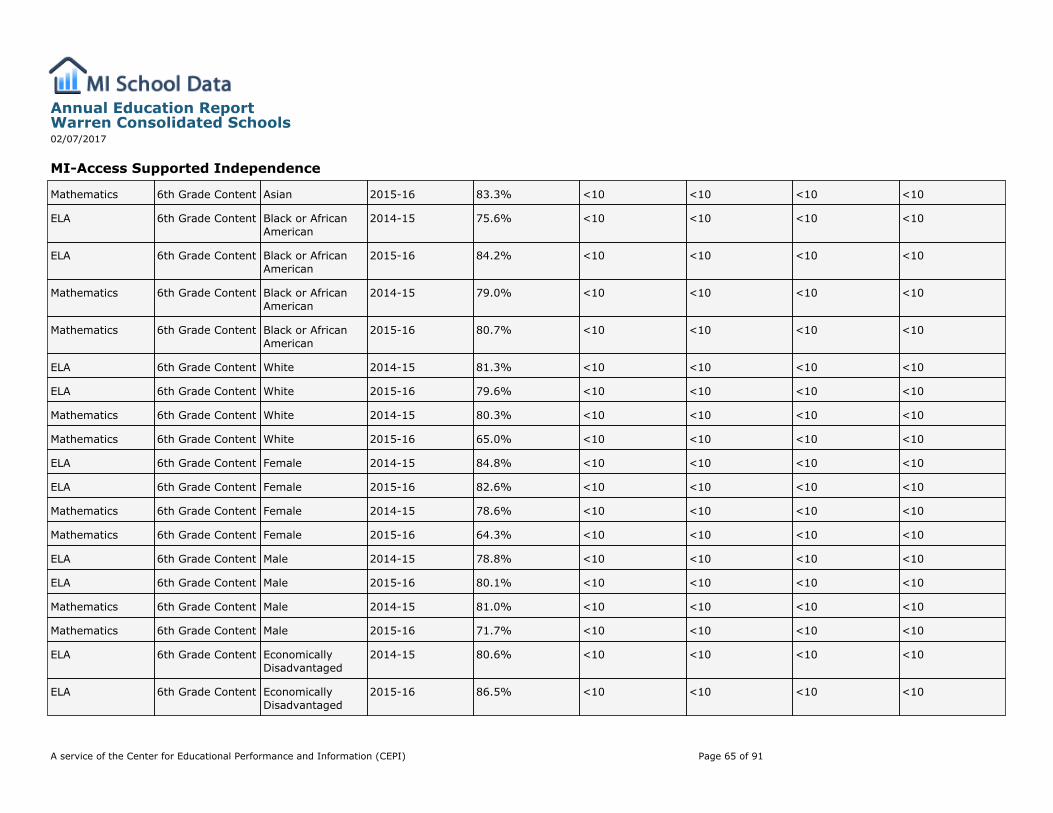
MI-Access Supported Independence
Mathematics 6th Grade Content Asian 2015-16 83.3% <10 <10 <10 <10
ELA 6th Grade Content Black or AfricanAmerican
2014-15 75.6% <10 <10 <10 <10
ELA 6th Grade Content Black or AfricanAmerican
2015-16 84.2% <10 <10 <10 <10
Mathematics 6th Grade Content Black or AfricanAmerican
2014-15 79.0% <10 <10 <10 <10
Mathematics 6th Grade Content Black or AfricanAmerican
2015-16 80.7% <10 <10 <10 <10
ELA 6th Grade Content White 2014-15 81.3% <10 <10 <10 <10
ELA 6th Grade Content White 2015-16 79.6% <10 <10 <10 <10
Mathematics 6th Grade Content White 2014-15 80.3% <10 <10 <10 <10
Mathematics 6th Grade Content White 2015-16 65.0% <10 <10 <10 <10
ELA 6th Grade Content Female 2014-15 84.8% <10 <10 <10 <10
ELA 6th Grade Content Female 2015-16 82.6% <10 <10 <10 <10
Mathematics 6th Grade Content Female 2014-15 78.6% <10 <10 <10 <10
Mathematics 6th Grade Content Female 2015-16 64.3% <10 <10 <10 <10
ELA 6th Grade Content Male 2014-15 78.8% <10 <10 <10 <10
ELA 6th Grade Content Male 2015-16 80.1% <10 <10 <10 <10
Mathematics 6th Grade Content Male 2014-15 81.0% <10 <10 <10 <10
Mathematics 6th Grade Content Male 2015-16 71.7% <10 <10 <10 <10
ELA 6th Grade Content EconomicallyDisadvantaged
2014-15 80.6% <10 <10 <10 <10
ELA 6th Grade Content EconomicallyDisadvantaged
2015-16 86.5% <10 <10 <10 <10
Annual Education ReportWarren Consolidated Schools02/07/2017
A service of the Center for Educational Performance and Information (CEPI) Page 65 of 91

MI-Access Supported Independence
Mathematics 6th Grade Content EconomicallyDisadvantaged
2014-15 80.4% <10 <10 <10 <10
Mathematics 6th Grade Content EconomicallyDisadvantaged
2015-16 74.8% <10 <10 <10 <10
ELA 6th Grade Content English LanguageLearners
2014-15 88.9% <10 <10 <10 <10
ELA 6th Grade Content English LanguageLearners
2015-16 78.6% <10 <10 <10 <10
Mathematics 6th Grade Content English LanguageLearners
2014-15 92.6% <10 <10 <10 <10
Mathematics 6th Grade Content English LanguageLearners
2015-16 72.4% <10 <10 <10 <10
ELA 7th Grade Content All Students 2014-15 79.9% <10 <10 <10 <10
ELA 7th Grade Content All Students 2015-16 85.2% <10 <10 <10 <10
Mathematics 7th Grade Content All Students 2014-15 79.0% <10 <10 <10 <10
Mathematics 7th Grade Content All Students 2015-16 76.4% <10 <10 <10 <10
Science 7th Grade Content All Students 2014-15 84.2% <10 <10 <10 <10
Science 7th Grade Content All Students 2015-16 85.8% <10 <10 <10 <10
ELA 7th Grade Content Asian 2015-16 75.0% <10 <10 <10 <10
Mathematics 7th Grade Content Asian 2015-16 83.3% <10 <10 <10 <10
Science 7th Grade Content Asian 2015-16 91.7% <10 <10 <10 <10
ELA 7th Grade Content Black or AfricanAmerican
2014-15 84.7% <10 <10 <10 <10
ELA 7th Grade Content Black or AfricanAmerican
2015-16 83.6% <10 <10 <10 <10
Mathematics 7th Grade Content Black or AfricanAmerican
2014-15 77.6% <10 <10 <10 <10
Annual Education ReportWarren Consolidated Schools02/07/2017
A service of the Center for Educational Performance and Information (CEPI) Page 66 of 91
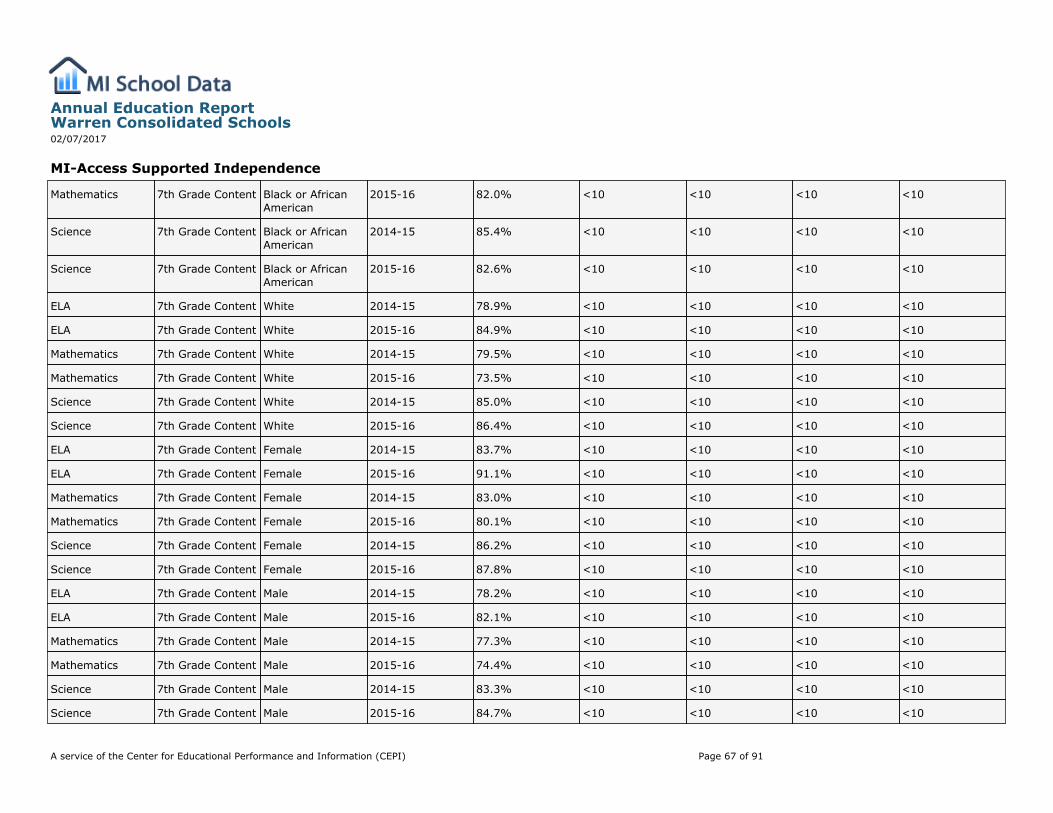
MI-Access Supported Independence
Mathematics 7th Grade Content Black or AfricanAmerican
2015-16 82.0% <10 <10 <10 <10
Science 7th Grade Content Black or AfricanAmerican
2014-15 85.4% <10 <10 <10 <10
Science 7th Grade Content Black or AfricanAmerican
2015-16 82.6% <10 <10 <10 <10
ELA 7th Grade Content White 2014-15 78.9% <10 <10 <10 <10
ELA 7th Grade Content White 2015-16 84.9% <10 <10 <10 <10
Mathematics 7th Grade Content White 2014-15 79.5% <10 <10 <10 <10
Mathematics 7th Grade Content White 2015-16 73.5% <10 <10 <10 <10
Science 7th Grade Content White 2014-15 85.0% <10 <10 <10 <10
Science 7th Grade Content White 2015-16 86.4% <10 <10 <10 <10
ELA 7th Grade Content Female 2014-15 83.7% <10 <10 <10 <10
ELA 7th Grade Content Female 2015-16 91.1% <10 <10 <10 <10
Mathematics 7th Grade Content Female 2014-15 83.0% <10 <10 <10 <10
Mathematics 7th Grade Content Female 2015-16 80.1% <10 <10 <10 <10
Science 7th Grade Content Female 2014-15 86.2% <10 <10 <10 <10
Science 7th Grade Content Female 2015-16 87.8% <10 <10 <10 <10
ELA 7th Grade Content Male 2014-15 78.2% <10 <10 <10 <10
ELA 7th Grade Content Male 2015-16 82.1% <10 <10 <10 <10
Mathematics 7th Grade Content Male 2014-15 77.3% <10 <10 <10 <10
Mathematics 7th Grade Content Male 2015-16 74.4% <10 <10 <10 <10
Science 7th Grade Content Male 2014-15 83.3% <10 <10 <10 <10
Science 7th Grade Content Male 2015-16 84.7% <10 <10 <10 <10
Annual Education ReportWarren Consolidated Schools02/07/2017
A service of the Center for Educational Performance and Information (CEPI) Page 67 of 91
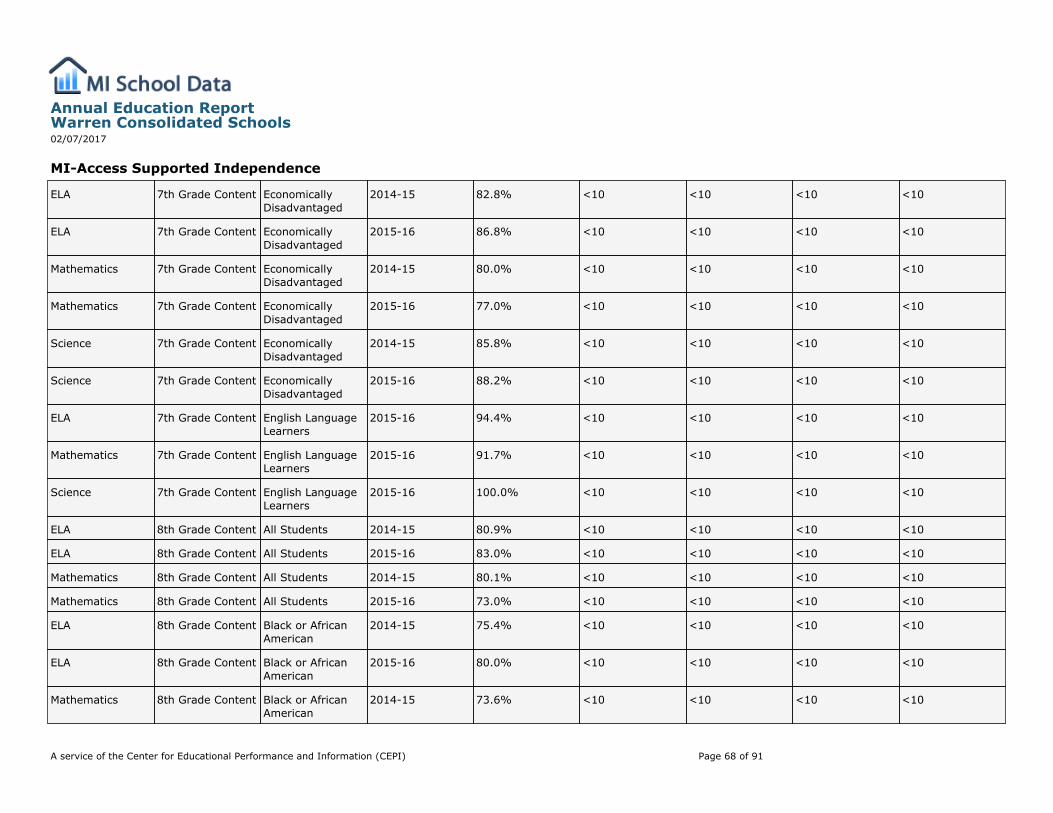
MI-Access Supported Independence
ELA 7th Grade Content EconomicallyDisadvantaged
2014-15 82.8% <10 <10 <10 <10
ELA 7th Grade Content EconomicallyDisadvantaged
2015-16 86.8% <10 <10 <10 <10
Mathematics 7th Grade Content EconomicallyDisadvantaged
2014-15 80.0% <10 <10 <10 <10
Mathematics 7th Grade Content EconomicallyDisadvantaged
2015-16 77.0% <10 <10 <10 <10
Science 7th Grade Content EconomicallyDisadvantaged
2014-15 85.8% <10 <10 <10 <10
Science 7th Grade Content EconomicallyDisadvantaged
2015-16 88.2% <10 <10 <10 <10
ELA 7th Grade Content English LanguageLearners
2015-16 94.4% <10 <10 <10 <10
Mathematics 7th Grade Content English LanguageLearners
2015-16 91.7% <10 <10 <10 <10
Science 7th Grade Content English LanguageLearners
2015-16 100.0% <10 <10 <10 <10
ELA 8th Grade Content All Students 2014-15 80.9% <10 <10 <10 <10
ELA 8th Grade Content All Students 2015-16 83.0% <10 <10 <10 <10
Mathematics 8th Grade Content All Students 2014-15 80.1% <10 <10 <10 <10
Mathematics 8th Grade Content All Students 2015-16 73.0% <10 <10 <10 <10
ELA 8th Grade Content Black or AfricanAmerican
2014-15 75.4% <10 <10 <10 <10
ELA 8th Grade Content Black or AfricanAmerican
2015-16 80.0% <10 <10 <10 <10
Mathematics 8th Grade Content Black or AfricanAmerican
2014-15 73.6% <10 <10 <10 <10
Annual Education ReportWarren Consolidated Schools02/07/2017
A service of the Center for Educational Performance and Information (CEPI) Page 68 of 91
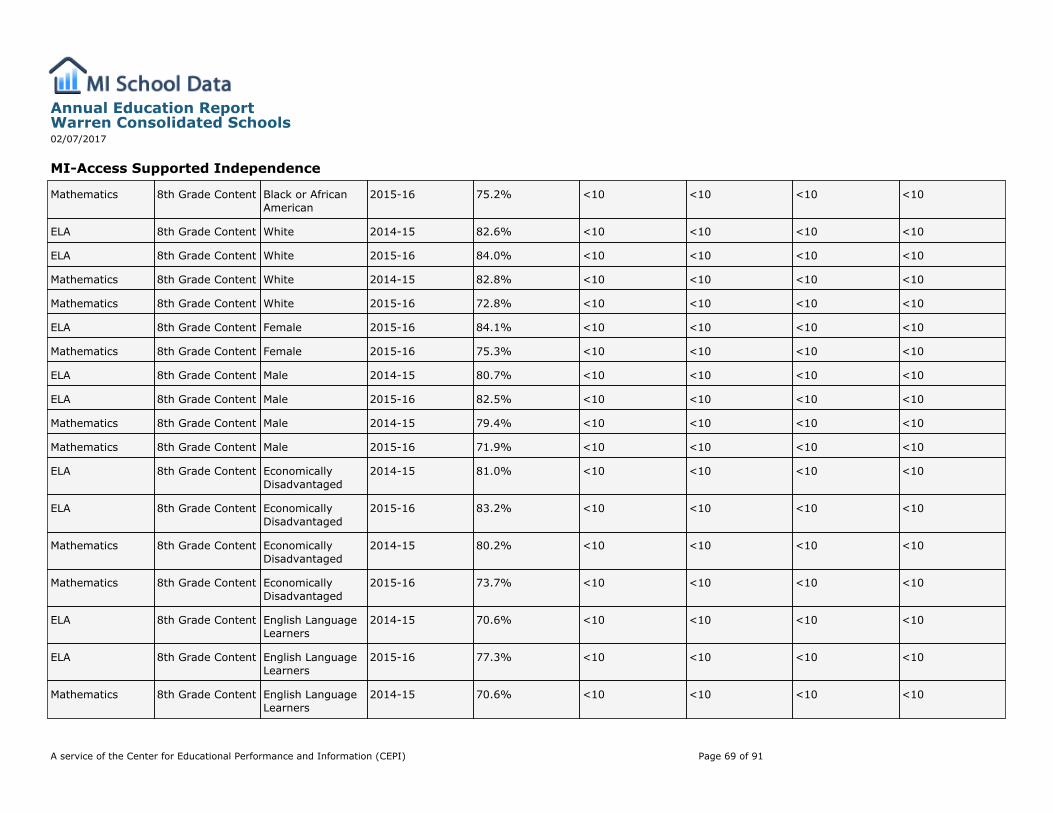
MI-Access Supported Independence
Mathematics 8th Grade Content Black or AfricanAmerican
2015-16 75.2% <10 <10 <10 <10
ELA 8th Grade Content White 2014-15 82.6% <10 <10 <10 <10
ELA 8th Grade Content White 2015-16 84.0% <10 <10 <10 <10
Mathematics 8th Grade Content White 2014-15 82.8% <10 <10 <10 <10
Mathematics 8th Grade Content White 2015-16 72.8% <10 <10 <10 <10
ELA 8th Grade Content Female 2015-16 84.1% <10 <10 <10 <10
Mathematics 8th Grade Content Female 2015-16 75.3% <10 <10 <10 <10
ELA 8th Grade Content Male 2014-15 80.7% <10 <10 <10 <10
ELA 8th Grade Content Male 2015-16 82.5% <10 <10 <10 <10
Mathematics 8th Grade Content Male 2014-15 79.4% <10 <10 <10 <10
Mathematics 8th Grade Content Male 2015-16 71.9% <10 <10 <10 <10
ELA 8th Grade Content EconomicallyDisadvantaged
2014-15 81.0% <10 <10 <10 <10
ELA 8th Grade Content EconomicallyDisadvantaged
2015-16 83.2% <10 <10 <10 <10
Mathematics 8th Grade Content EconomicallyDisadvantaged
2014-15 80.2% <10 <10 <10 <10
Mathematics 8th Grade Content EconomicallyDisadvantaged
2015-16 73.7% <10 <10 <10 <10
ELA 8th Grade Content English LanguageLearners
2014-15 70.6% <10 <10 <10 <10
ELA 8th Grade Content English LanguageLearners
2015-16 77.3% <10 <10 <10 <10
Mathematics 8th Grade Content English LanguageLearners
2014-15 70.6% <10 <10 <10 <10
Annual Education ReportWarren Consolidated Schools02/07/2017
A service of the Center for Educational Performance and Information (CEPI) Page 69 of 91
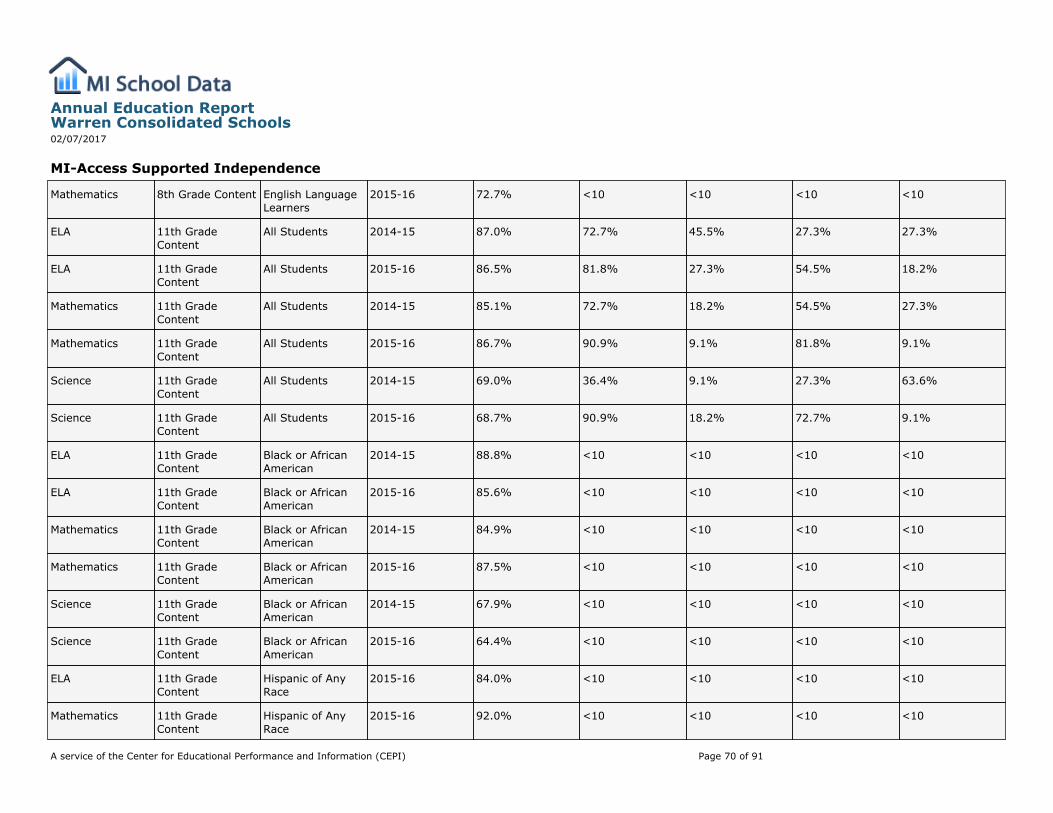
MI-Access Supported Independence
Mathematics 8th Grade Content English LanguageLearners
2015-16 72.7% <10 <10 <10 <10
ELA 11th GradeContent
All Students 2014-15 87.0% 72.7% 45.5% 27.3% 27.3%
ELA 11th GradeContent
All Students 2015-16 86.5% 81.8% 27.3% 54.5% 18.2%
Mathematics 11th GradeContent
All Students 2014-15 85.1% 72.7% 18.2% 54.5% 27.3%
Mathematics 11th GradeContent
All Students 2015-16 86.7% 90.9% 9.1% 81.8% 9.1%
Science 11th GradeContent
All Students 2014-15 69.0% 36.4% 9.1% 27.3% 63.6%
Science 11th GradeContent
All Students 2015-16 68.7% 90.9% 18.2% 72.7% 9.1%
ELA 11th GradeContent
Black or AfricanAmerican
2014-15 88.8% <10 <10 <10 <10
ELA 11th GradeContent
Black or AfricanAmerican
2015-16 85.6% <10 <10 <10 <10
Mathematics 11th GradeContent
Black or AfricanAmerican
2014-15 84.9% <10 <10 <10 <10
Mathematics 11th GradeContent
Black or AfricanAmerican
2015-16 87.5% <10 <10 <10 <10
Science 11th GradeContent
Black or AfricanAmerican
2014-15 67.9% <10 <10 <10 <10
Science 11th GradeContent
Black or AfricanAmerican
2015-16 64.4% <10 <10 <10 <10
ELA 11th GradeContent
Hispanic of AnyRace
2015-16 84.0% <10 <10 <10 <10
Mathematics 11th GradeContent
Hispanic of AnyRace
2015-16 92.0% <10 <10 <10 <10
Annual Education ReportWarren Consolidated Schools02/07/2017
A service of the Center for Educational Performance and Information (CEPI) Page 70 of 91
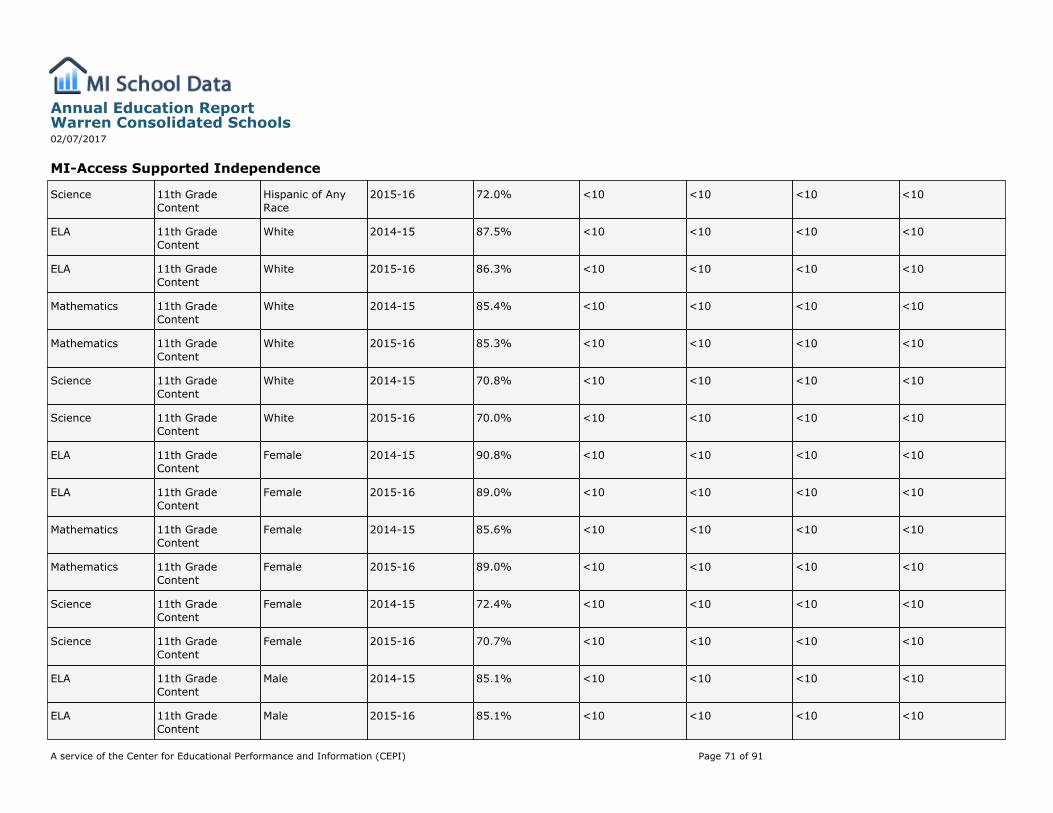
MI-Access Supported Independence
Science 11th GradeContent
Hispanic of AnyRace
2015-16 72.0% <10 <10 <10 <10
ELA 11th GradeContent
White 2014-15 87.5% <10 <10 <10 <10
ELA 11th GradeContent
White 2015-16 86.3% <10 <10 <10 <10
Mathematics 11th GradeContent
White 2014-15 85.4% <10 <10 <10 <10
Mathematics 11th GradeContent
White 2015-16 85.3% <10 <10 <10 <10
Science 11th GradeContent
White 2014-15 70.8% <10 <10 <10 <10
Science 11th GradeContent
White 2015-16 70.0% <10 <10 <10 <10
ELA 11th GradeContent
Female 2014-15 90.8% <10 <10 <10 <10
ELA 11th GradeContent
Female 2015-16 89.0% <10 <10 <10 <10
Mathematics 11th GradeContent
Female 2014-15 85.6% <10 <10 <10 <10
Mathematics 11th GradeContent
Female 2015-16 89.0% <10 <10 <10 <10
Science 11th GradeContent
Female 2014-15 72.4% <10 <10 <10 <10
Science 11th GradeContent
Female 2015-16 70.7% <10 <10 <10 <10
ELA 11th GradeContent
Male 2014-15 85.1% <10 <10 <10 <10
ELA 11th GradeContent
Male 2015-16 85.1% <10 <10 <10 <10
Annual Education ReportWarren Consolidated Schools02/07/2017
A service of the Center for Educational Performance and Information (CEPI) Page 71 of 91
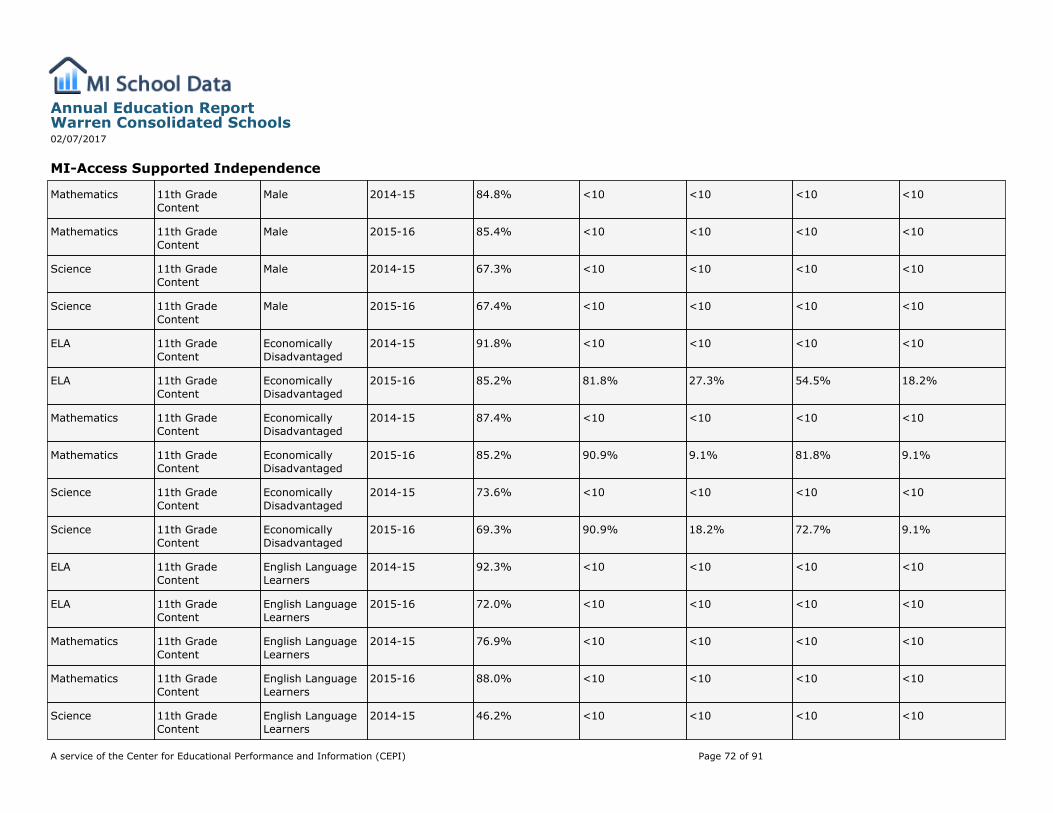
MI-Access Supported Independence
Mathematics 11th GradeContent
Male 2014-15 84.8% <10 <10 <10 <10
Mathematics 11th GradeContent
Male 2015-16 85.4% <10 <10 <10 <10
Science 11th GradeContent
Male 2014-15 67.3% <10 <10 <10 <10
Science 11th GradeContent
Male 2015-16 67.4% <10 <10 <10 <10
ELA 11th GradeContent
EconomicallyDisadvantaged
2014-15 91.8% <10 <10 <10 <10
ELA 11th GradeContent
EconomicallyDisadvantaged
2015-16 85.2% 81.8% 27.3% 54.5% 18.2%
Mathematics 11th GradeContent
EconomicallyDisadvantaged
2014-15 87.4% <10 <10 <10 <10
Mathematics 11th GradeContent
EconomicallyDisadvantaged
2015-16 85.2% 90.9% 9.1% 81.8% 9.1%
Science 11th GradeContent
EconomicallyDisadvantaged
2014-15 73.6% <10 <10 <10 <10
Science 11th GradeContent
EconomicallyDisadvantaged
2015-16 69.3% 90.9% 18.2% 72.7% 9.1%
ELA 11th GradeContent
English LanguageLearners
2014-15 92.3% <10 <10 <10 <10
ELA 11th GradeContent
English LanguageLearners
2015-16 72.0% <10 <10 <10 <10
Mathematics 11th GradeContent
English LanguageLearners
2014-15 76.9% <10 <10 <10 <10
Mathematics 11th GradeContent
English LanguageLearners
2015-16 88.0% <10 <10 <10 <10
Science 11th GradeContent
English LanguageLearners
2014-15 46.2% <10 <10 <10 <10
Annual Education ReportWarren Consolidated Schools02/07/2017
A service of the Center for Educational Performance and Information (CEPI) Page 72 of 91
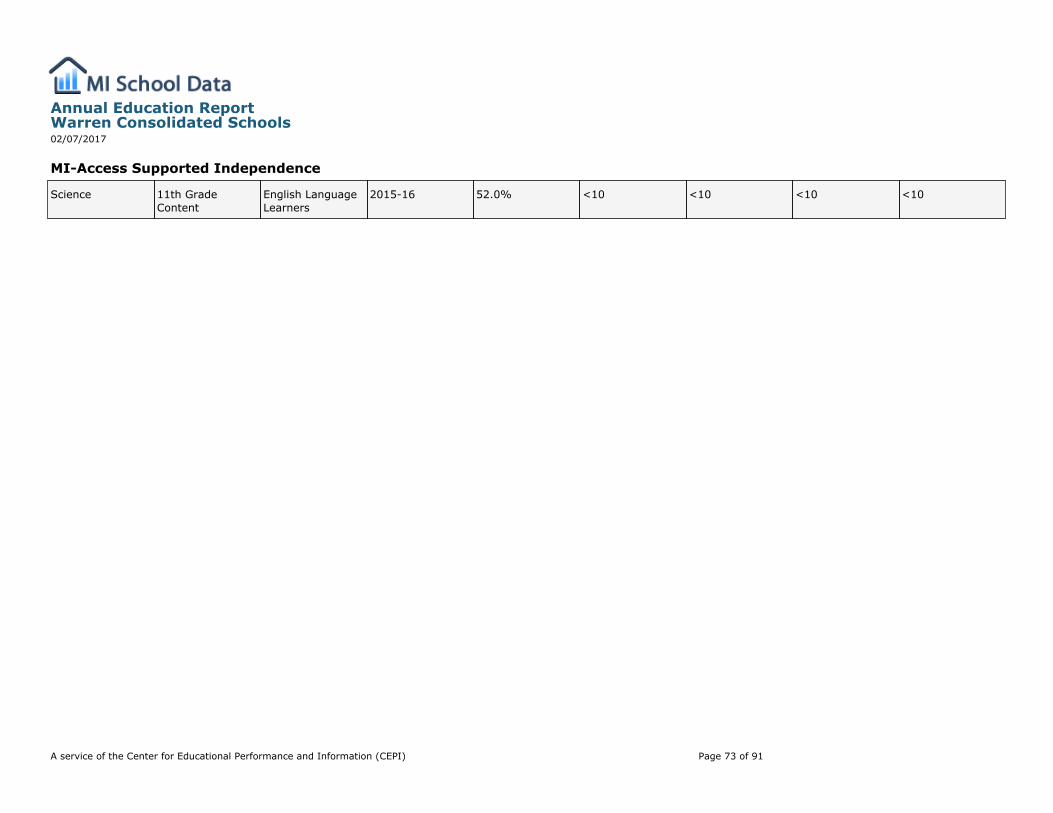
MI-Access Supported Independence
Science 11th GradeContent
English LanguageLearners
2015-16 52.0% <10 <10 <10 <10
Annual Education ReportWarren Consolidated Schools02/07/2017
A service of the Center for Educational Performance and Information (CEPI) Page 73 of 91
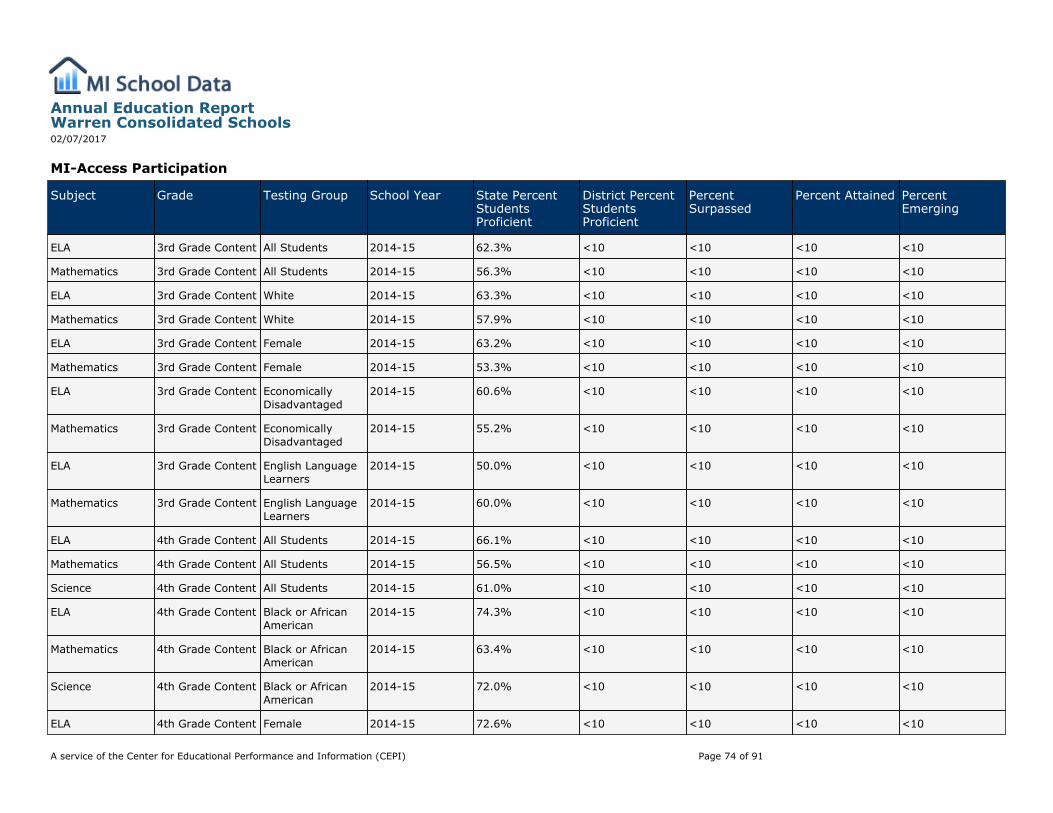
MI-Access Participation
Subject Grade Testing Group School Year State PercentStudentsProficient
District PercentStudentsProficient
PercentSurpassed
Percent Attained PercentEmerging
ELA 3rd Grade Content All Students 2014-15 62.3% <10 <10 <10 <10
Mathematics 3rd Grade Content All Students 2014-15 56.3% <10 <10 <10 <10
ELA 3rd Grade Content White 2014-15 63.3% <10 <10 <10 <10
Mathematics 3rd Grade Content White 2014-15 57.9% <10 <10 <10 <10
ELA 3rd Grade Content Female 2014-15 63.2% <10 <10 <10 <10
Mathematics 3rd Grade Content Female 2014-15 53.3% <10 <10 <10 <10
ELA 3rd Grade Content EconomicallyDisadvantaged
2014-15 60.6% <10 <10 <10 <10
Mathematics 3rd Grade Content EconomicallyDisadvantaged
2014-15 55.2% <10 <10 <10 <10
ELA 3rd Grade Content English LanguageLearners
2014-15 50.0% <10 <10 <10 <10
Mathematics 3rd Grade Content English LanguageLearners
2014-15 60.0% <10 <10 <10 <10
ELA 4th Grade Content All Students 2014-15 66.1% <10 <10 <10 <10
Mathematics 4th Grade Content All Students 2014-15 56.5% <10 <10 <10 <10
Science 4th Grade Content All Students 2014-15 61.0% <10 <10 <10 <10
ELA 4th Grade Content Black or AfricanAmerican
2014-15 74.3% <10 <10 <10 <10
Mathematics 4th Grade Content Black or AfricanAmerican
2014-15 63.4% <10 <10 <10 <10
Science 4th Grade Content Black or AfricanAmerican
2014-15 72.0% <10 <10 <10 <10
ELA 4th Grade Content Female 2014-15 72.6% <10 <10 <10 <10
Annual Education ReportWarren Consolidated Schools02/07/2017
A service of the Center for Educational Performance and Information (CEPI) Page 74 of 91
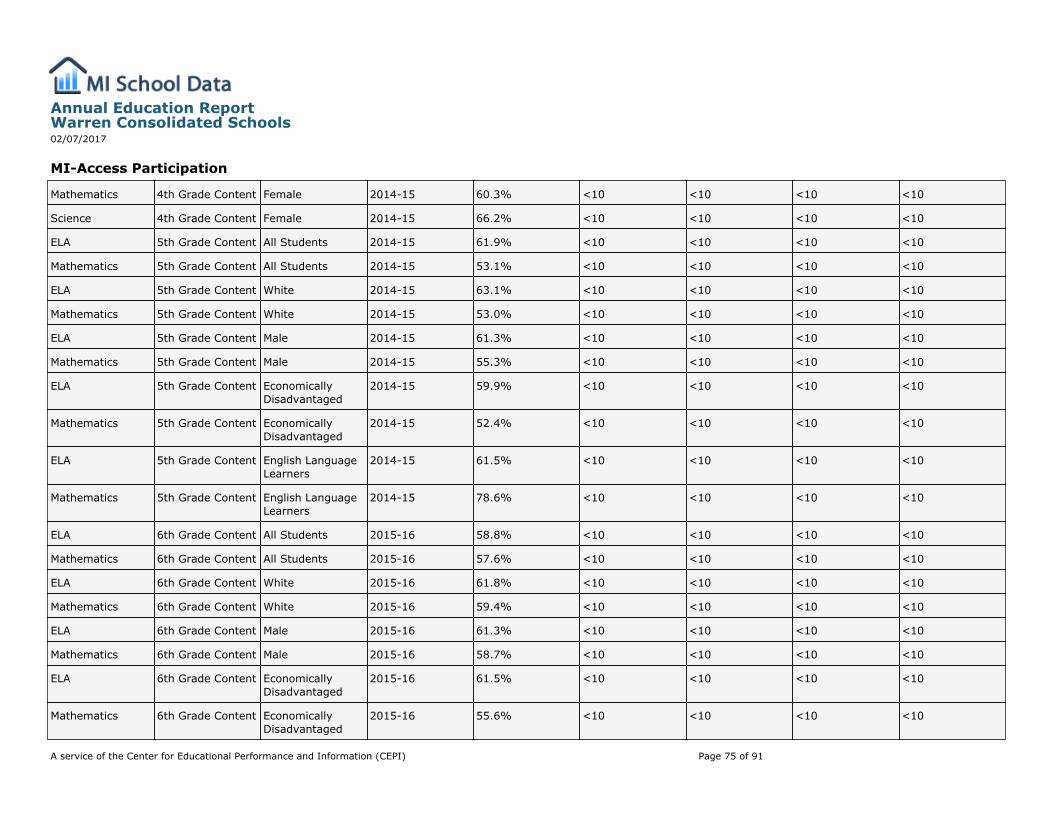
MI-Access Participation
Mathematics 4th Grade Content Female 2014-15 60.3% <10 <10 <10 <10
Science 4th Grade Content Female 2014-15 66.2% <10 <10 <10 <10
ELA 5th Grade Content All Students 2014-15 61.9% <10 <10 <10 <10
Mathematics 5th Grade Content All Students 2014-15 53.1% <10 <10 <10 <10
ELA 5th Grade Content White 2014-15 63.1% <10 <10 <10 <10
Mathematics 5th Grade Content White 2014-15 53.0% <10 <10 <10 <10
ELA 5th Grade Content Male 2014-15 61.3% <10 <10 <10 <10
Mathematics 5th Grade Content Male 2014-15 55.3% <10 <10 <10 <10
ELA 5th Grade Content EconomicallyDisadvantaged
2014-15 59.9% <10 <10 <10 <10
Mathematics 5th Grade Content EconomicallyDisadvantaged
2014-15 52.4% <10 <10 <10 <10
ELA 5th Grade Content English LanguageLearners
2014-15 61.5% <10 <10 <10 <10
Mathematics 5th Grade Content English LanguageLearners
2014-15 78.6% <10 <10 <10 <10
ELA 6th Grade Content All Students 2015-16 58.8% <10 <10 <10 <10
Mathematics 6th Grade Content All Students 2015-16 57.6% <10 <10 <10 <10
ELA 6th Grade Content White 2015-16 61.8% <10 <10 <10 <10
Mathematics 6th Grade Content White 2015-16 59.4% <10 <10 <10 <10
ELA 6th Grade Content Male 2015-16 61.3% <10 <10 <10 <10
Mathematics 6th Grade Content Male 2015-16 58.7% <10 <10 <10 <10
ELA 6th Grade Content EconomicallyDisadvantaged
2015-16 61.5% <10 <10 <10 <10
Mathematics 6th Grade Content EconomicallyDisadvantaged
2015-16 55.6% <10 <10 <10 <10
Annual Education ReportWarren Consolidated Schools02/07/2017
A service of the Center for Educational Performance and Information (CEPI) Page 75 of 91
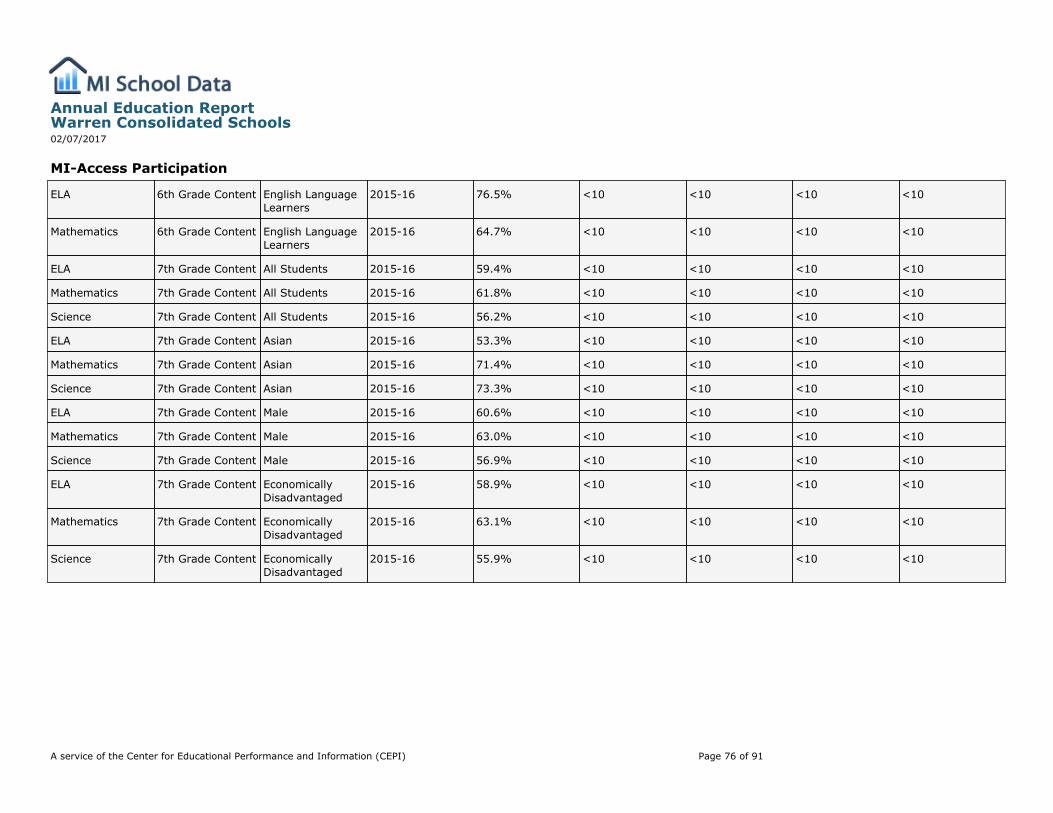
MI-Access Participation
ELA 6th Grade Content English LanguageLearners
2015-16 76.5% <10 <10 <10 <10
Mathematics 6th Grade Content English LanguageLearners
2015-16 64.7% <10 <10 <10 <10
ELA 7th Grade Content All Students 2015-16 59.4% <10 <10 <10 <10
Mathematics 7th Grade Content All Students 2015-16 61.8% <10 <10 <10 <10
Science 7th Grade Content All Students 2015-16 56.2% <10 <10 <10 <10
ELA 7th Grade Content Asian 2015-16 53.3% <10 <10 <10 <10
Mathematics 7th Grade Content Asian 2015-16 71.4% <10 <10 <10 <10
Science 7th Grade Content Asian 2015-16 73.3% <10 <10 <10 <10
ELA 7th Grade Content Male 2015-16 60.6% <10 <10 <10 <10
Mathematics 7th Grade Content Male 2015-16 63.0% <10 <10 <10 <10
Science 7th Grade Content Male 2015-16 56.9% <10 <10 <10 <10
ELA 7th Grade Content EconomicallyDisadvantaged
2015-16 58.9% <10 <10 <10 <10
Mathematics 7th Grade Content EconomicallyDisadvantaged
2015-16 63.1% <10 <10 <10 <10
Science 7th Grade Content EconomicallyDisadvantaged
2015-16 55.9% <10 <10 <10 <10
Annual Education ReportWarren Consolidated Schools02/07/2017
A service of the Center for Educational Performance and Information (CEPI) Page 76 of 91
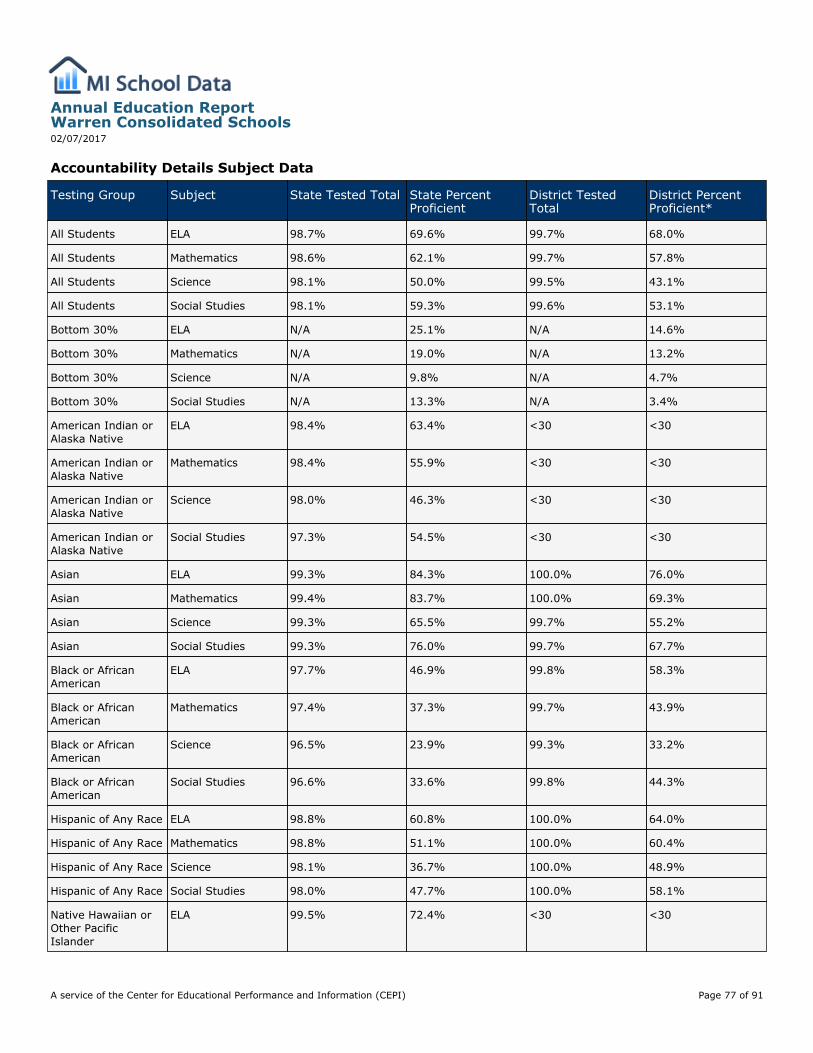
Accountability Details Subject Data
Testing Group Subject State Tested Total State PercentProficient
District TestedTotal
District PercentProficient*
All Students ELA 98.7% 69.6% 99.7% 68.0%
All Students Mathematics 98.6% 62.1% 99.7% 57.8%
All Students Science 98.1% 50.0% 99.5% 43.1%
All Students Social Studies 98.1% 59.3% 99.6% 53.1%
Bottom 30% ELA N/A 25.1% N/A 14.6%
Bottom 30% Mathematics N/A 19.0% N/A 13.2%
Bottom 30% Science N/A 9.8% N/A 4.7%
Bottom 30% Social Studies N/A 13.3% N/A 3.4%
American Indian orAlaska Native
ELA 98.4% 63.4% <30 <30
American Indian orAlaska Native
Mathematics 98.4% 55.9% <30 <30
American Indian orAlaska Native
Science 98.0% 46.3% <30 <30
American Indian orAlaska Native
Social Studies 97.3% 54.5% <30 <30
Asian ELA 99.3% 84.3% 100.0% 76.0%
Asian Mathematics 99.4% 83.7% 100.0% 69.3%
Asian Science 99.3% 65.5% 99.7% 55.2%
Asian Social Studies 99.3% 76.0% 99.7% 67.7%
Black or AfricanAmerican
ELA 97.7% 46.9% 99.8% 58.3%
Black or AfricanAmerican
Mathematics 97.4% 37.3% 99.7% 43.9%
Black or AfricanAmerican
Science 96.5% 23.9% 99.3% 33.2%
Black or AfricanAmerican
Social Studies 96.6% 33.6% 99.8% 44.3%
Hispanic of Any Race ELA 98.8% 60.8% 100.0% 64.0%
Hispanic of Any Race Mathematics 98.8% 51.1% 100.0% 60.4%
Hispanic of Any Race Science 98.1% 36.7% 100.0% 48.9%
Hispanic of Any Race Social Studies 98.0% 47.7% 100.0% 58.1%
Native Hawaiian orOther PacificIslander
ELA 99.5% 72.4% <30 <30
Annual Education ReportWarren Consolidated Schools02/07/2017
A service of the Center for Educational Performance and Information (CEPI) Page 77 of 91
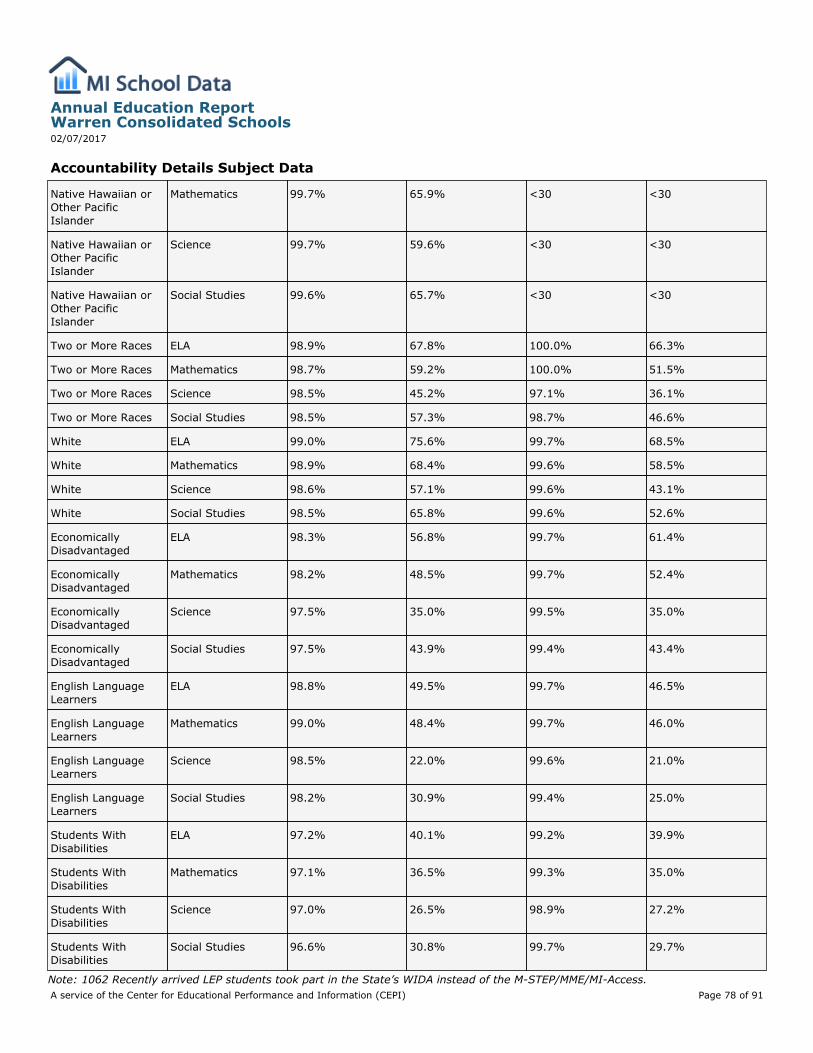
Accountability Details Subject Data
Native Hawaiian orOther PacificIslander
Mathematics 99.7% 65.9% <30 <30
Native Hawaiian orOther PacificIslander
Science 99.7% 59.6% <30 <30
Native Hawaiian orOther PacificIslander
Social Studies 99.6% 65.7% <30 <30
Two or More Races ELA 98.9% 67.8% 100.0% 66.3%
Two or More Races Mathematics 98.7% 59.2% 100.0% 51.5%
Two or More Races Science 98.5% 45.2% 97.1% 36.1%
Two or More Races Social Studies 98.5% 57.3% 98.7% 46.6%
White ELA 99.0% 75.6% 99.7% 68.5%
White Mathematics 98.9% 68.4% 99.6% 58.5%
White Science 98.6% 57.1% 99.6% 43.1%
White Social Studies 98.5% 65.8% 99.6% 52.6%
EconomicallyDisadvantaged
ELA 98.3% 56.8% 99.7% 61.4%
EconomicallyDisadvantaged
Mathematics 98.2% 48.5% 99.7% 52.4%
EconomicallyDisadvantaged
Science 97.5% 35.0% 99.5% 35.0%
EconomicallyDisadvantaged
Social Studies 97.5% 43.9% 99.4% 43.4%
English LanguageLearners
ELA 98.8% 49.5% 99.7% 46.5%
English LanguageLearners
Mathematics 99.0% 48.4% 99.7% 46.0%
English LanguageLearners
Science 98.5% 22.0% 99.6% 21.0%
English LanguageLearners
Social Studies 98.2% 30.9% 99.4% 25.0%
Students WithDisabilities
ELA 97.2% 40.1% 99.2% 39.9%
Students WithDisabilities
Mathematics 97.1% 36.5% 99.3% 35.0%
Students WithDisabilities
Science 97.0% 26.5% 98.9% 27.2%
Students WithDisabilities
Social Studies 96.6% 30.8% 99.7% 29.7%
Note: 1062 Recently arrived LEP students took part in the State’s WIDA instead of the M-STEP/MME/MI-Access.
Annual Education ReportWarren Consolidated Schools02/07/2017
A service of the Center for Educational Performance and Information (CEPI) Page 78 of 91
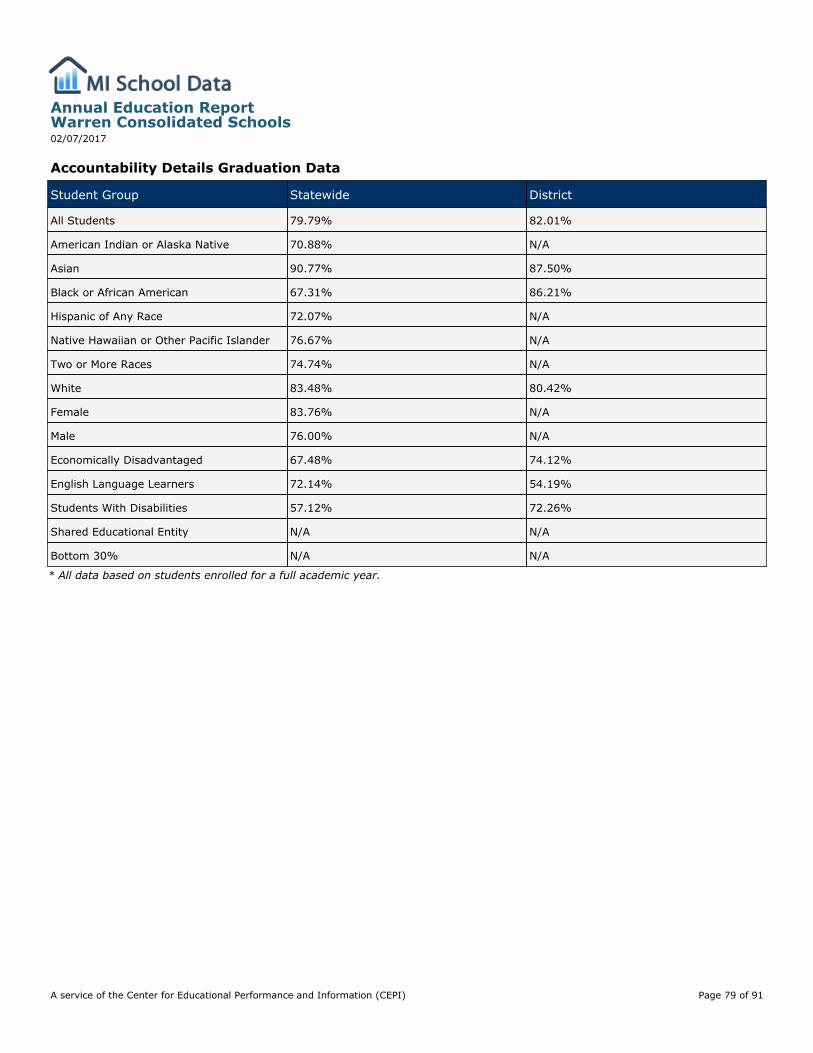
* All data based on students enrolled for a full academic year.
Accountability Details Graduation Data
Student Group Statewide District
All Students 79.79% 82.01%
American Indian or Alaska Native 70.88% N/A
Asian 90.77% 87.50%
Black or African American 67.31% 86.21%
Hispanic of Any Race 72.07% N/A
Native Hawaiian or Other Pacific Islander 76.67% N/A
Two or More Races 74.74% N/A
White 83.48% 80.42%
Female 83.76% N/A
Male 76.00% N/A
Economically Disadvantaged 67.48% 74.12%
English Language Learners 72.14% 54.19%
Students With Disabilities 57.12% 72.26%
Shared Educational Entity N/A N/A
Bottom 30% N/A N/A
Annual Education ReportWarren Consolidated Schools02/07/2017
A service of the Center for Educational Performance and Information (CEPI) Page 79 of 91
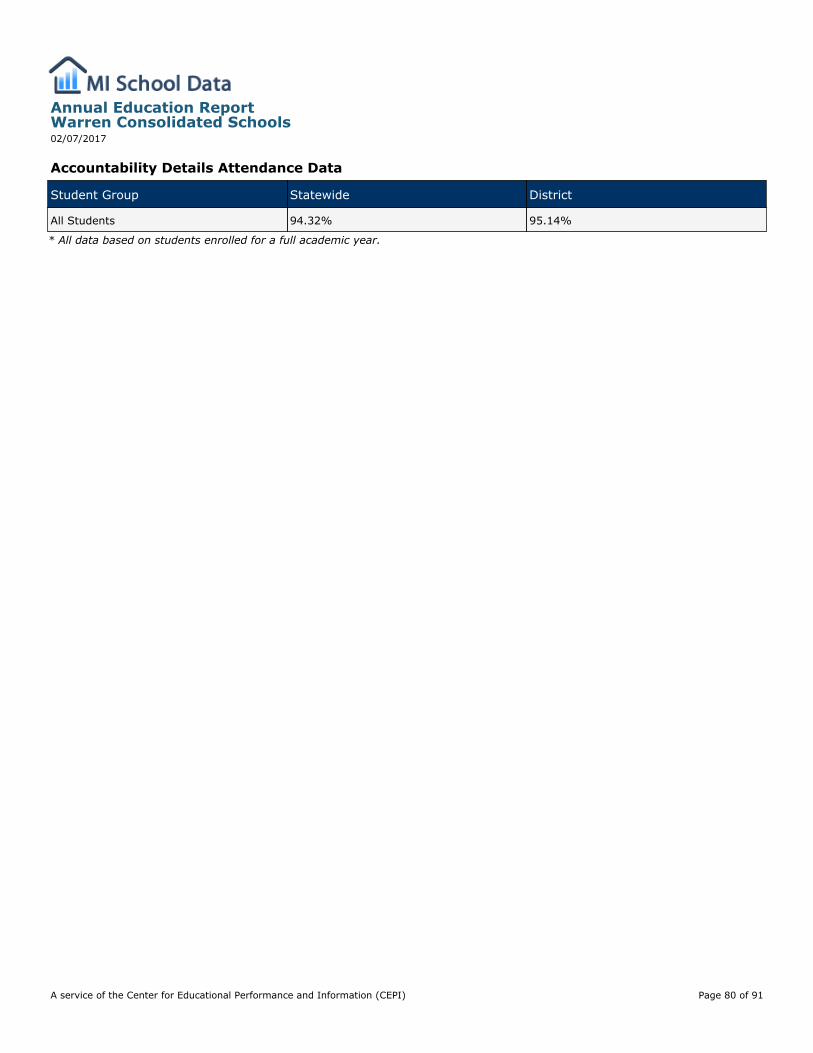
* All data based on students enrolled for a full academic year.
Accountability Details Attendance Data
Student Group Statewide District
All Students 94.32% 95.14%
Annual Education ReportWarren Consolidated Schools02/07/2017
A service of the Center for Educational Performance and Information (CEPI) Page 80 of 91
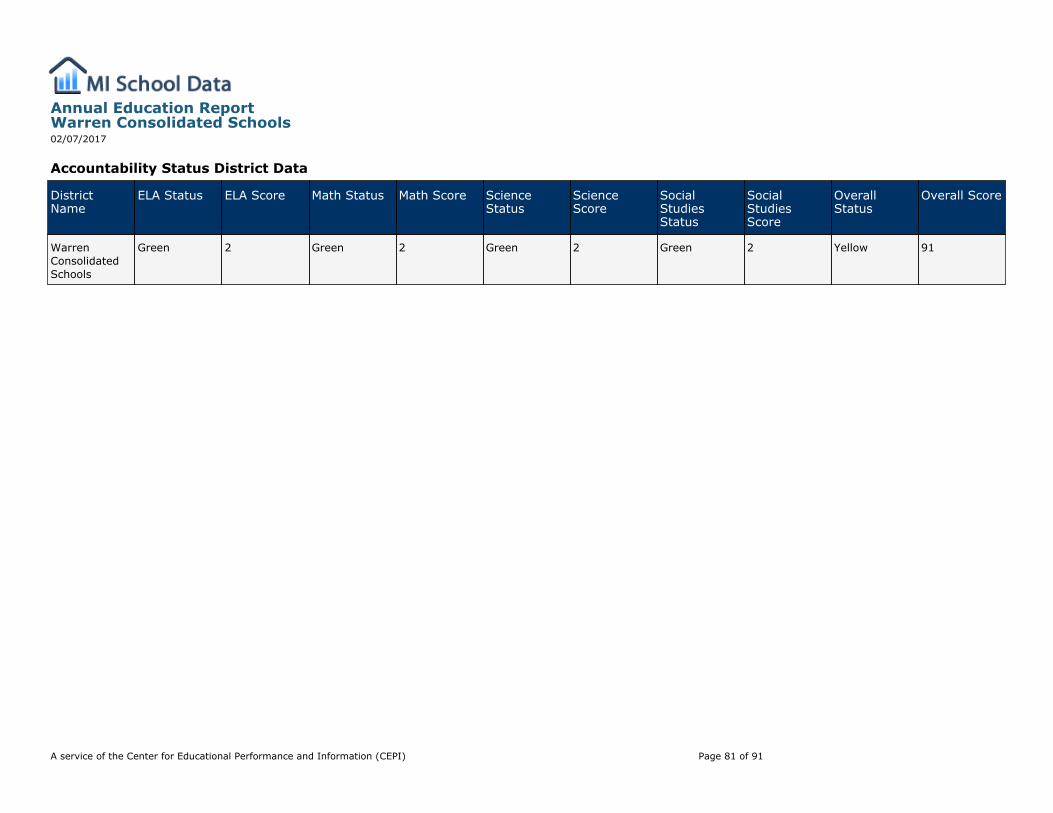
Accountability Status District Data
DistrictName
ELA Status ELA Score Math Status Math Score ScienceStatus
ScienceScore
SocialStudiesStatus
SocialStudiesScore
OverallStatus
Overall Score
WarrenConsolidatedSchools
Green 2 Green 2 Green 2 Green 2 Yellow 91
Annual Education ReportWarren Consolidated Schools02/07/2017
A service of the Center for Educational Performance and Information (CEPI) Page 81 of 91
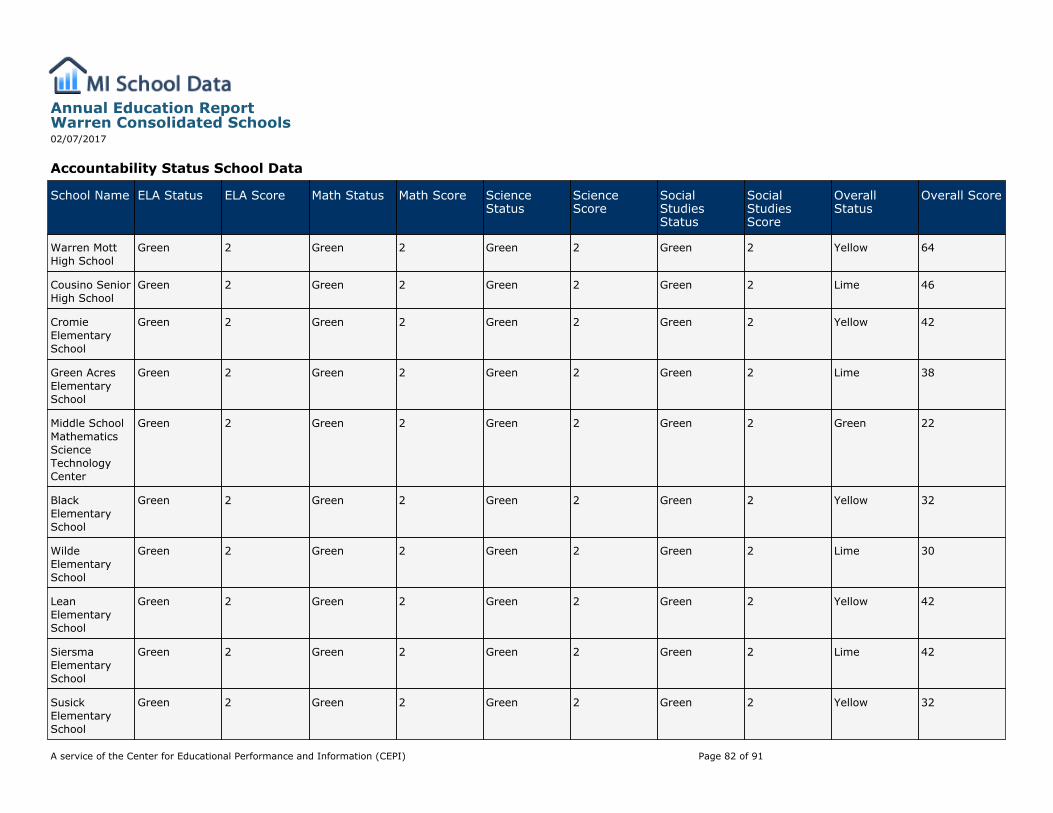
Accountability Status School Data
School Name ELA Status ELA Score Math Status Math Score ScienceStatus
ScienceScore
SocialStudiesStatus
SocialStudiesScore
OverallStatus
Overall Score
Warren MottHigh School
Green 2 Green 2 Green 2 Green 2 Yellow 64
Cousino SeniorHigh School
Green 2 Green 2 Green 2 Green 2 Lime 46
CromieElementarySchool
Green 2 Green 2 Green 2 Green 2 Yellow 42
Green AcresElementarySchool
Green 2 Green 2 Green 2 Green 2 Lime 38
Middle SchoolMathematicsScienceTechnologyCenter
Green 2 Green 2 Green 2 Green 2 Green 22
BlackElementarySchool
Green 2 Green 2 Green 2 Green 2 Yellow 32
WildeElementarySchool
Green 2 Green 2 Green 2 Green 2 Lime 30
LeanElementarySchool
Green 2 Green 2 Green 2 Green 2 Yellow 42
SiersmaElementarySchool
Green 2 Green 2 Green 2 Green 2 Lime 42
SusickElementarySchool
Green 2 Green 2 Green 2 Green 2 Yellow 32
Annual Education ReportWarren Consolidated Schools02/07/2017
A service of the Center for Educational Performance and Information (CEPI) Page 82 of 91
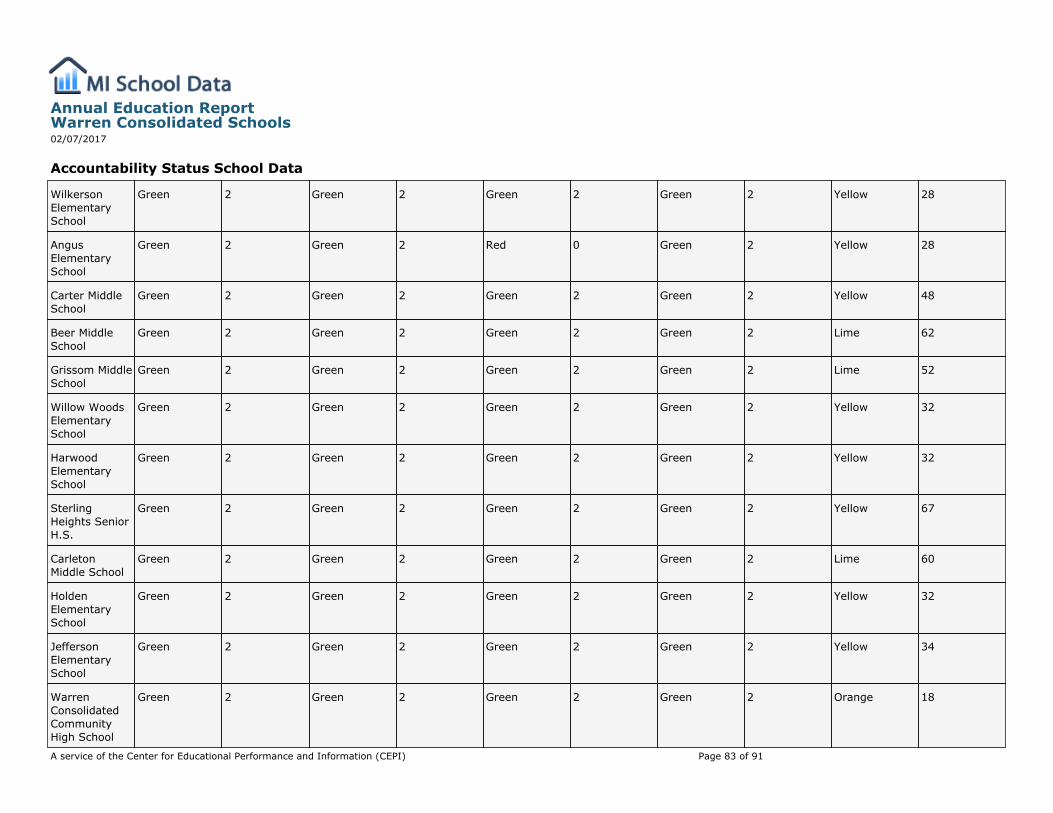
Accountability Status School Data
WilkersonElementarySchool
Green 2 Green 2 Green 2 Green 2 Yellow 28
AngusElementarySchool
Green 2 Green 2 Red 0 Green 2 Yellow 28
Carter MiddleSchool
Green 2 Green 2 Green 2 Green 2 Yellow 48
Beer MiddleSchool
Green 2 Green 2 Green 2 Green 2 Lime 62
Grissom MiddleSchool
Green 2 Green 2 Green 2 Green 2 Lime 52
Willow WoodsElementarySchool
Green 2 Green 2 Green 2 Green 2 Yellow 32
HarwoodElementarySchool
Green 2 Green 2 Green 2 Green 2 Yellow 32
SterlingHeights SeniorH.S.
Green 2 Green 2 Green 2 Green 2 Yellow 67
CarletonMiddle School
Green 2 Green 2 Green 2 Green 2 Lime 60
HoldenElementarySchool
Green 2 Green 2 Green 2 Green 2 Yellow 32
JeffersonElementarySchool
Green 2 Green 2 Green 2 Green 2 Yellow 34
WarrenConsolidatedCommunityHigh School
Green 2 Green 2 Green 2 Green 2 Orange 18
Annual Education ReportWarren Consolidated Schools02/07/2017
A service of the Center for Educational Performance and Information (CEPI) Page 83 of 91
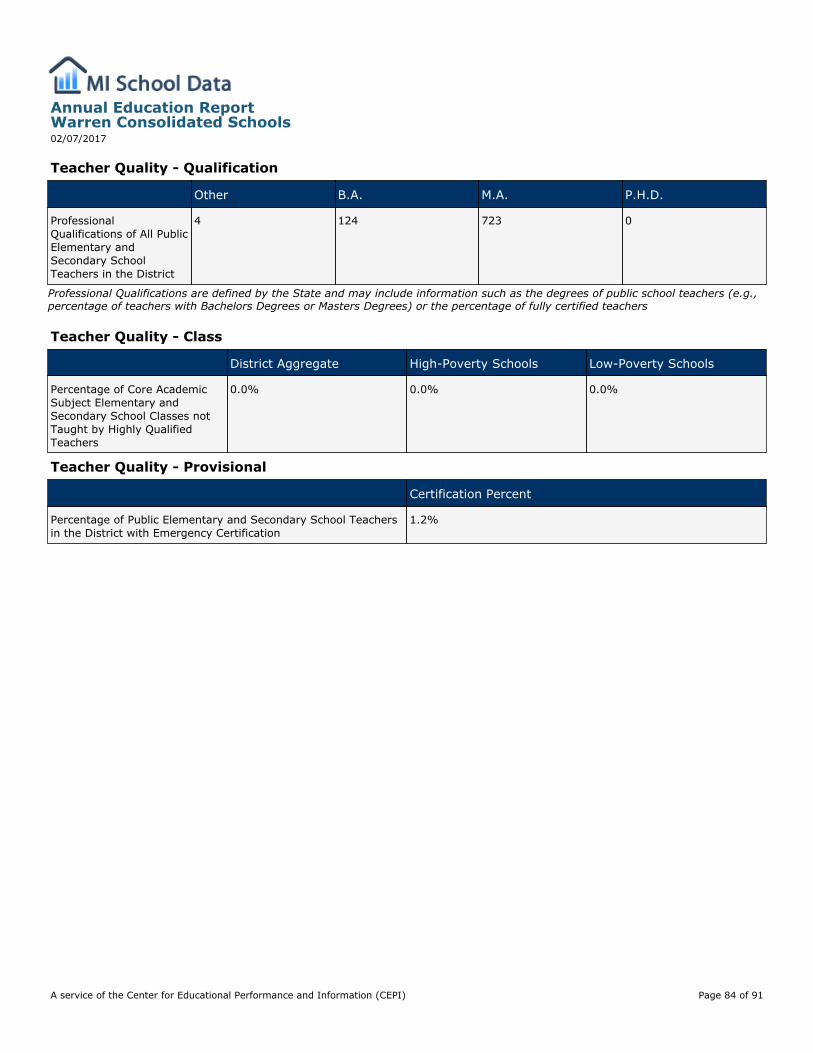
Professional Qualifications are defined by the State and may include information such as the degrees of public school teachers (e.g.,percentage of teachers with Bachelors Degrees or Masters Degrees) or the percentage of fully certified teachers
Teacher Quality - Qualification
Other B.A. M.A. P.H.D.
ProfessionalQualifications of All PublicElementary andSecondary SchoolTeachers in the District
4 124 723 0
Teacher Quality - Class
District Aggregate High-Poverty Schools Low-Poverty Schools
Percentage of Core AcademicSubject Elementary andSecondary School Classes notTaught by Highly QualifiedTeachers
0.0% 0.0% 0.0%
Teacher Quality - Provisional
Certification Percent
Percentage of Public Elementary and Secondary School Teachersin the District with Emergency Certification
1.2%
Annual Education ReportWarren Consolidated Schools02/07/2017
A service of the Center for Educational Performance and Information (CEPI) Page 84 of 91

‡ Reporting Standards not met. Note: Observed differences are not necessarily statistically significant. Detail may not sum to totalbecause of rounding. SOURCE: U.S. Department of Education. Institute for Education Sciences. National Center for EducationStatistics. National Assessment of Educational Progress (NAEP) 2015 Mathematics Achievement.
NAEP Grade 4 Math
Percent ofStudents
Percent belowBasic
Percent Basic Percent Proficient Percent Advanced
All Students 100 23 77 34 5
MaleFemale
5149
2223
7877
3632
64
National LunchProgram EligibilityEligibleNot EligibleInfo not available
4753#
3610‡
6490‡
1749‡
19‡
Race/EthnicityWhiteBlack or AfricanAmericanHispanicAsianAmerican Indian orAlaska NativeNative Hawaiian orOther PacificIslanderTwo or More Races
7215641#3
15533811‡‡‡
85476289‡‡‡
39102158‡‡‡
5觷‡‡‡
Student classified ashaving a disabilitySDNot SD
1288
4719
5381
1437
15
Student is an EnglishLanguage LearnerELLNot ELL
595
4222
5878
1635
15
Annual Education ReportWarren Consolidated Schools02/07/2017
A service of the Center for Educational Performance and Information (CEPI) Page 85 of 91

‡ Reporting Standards not met. NOTE: Observed differences are not necessarily statistically significant. Detail may not sum to totalbecause of rounding. SOURCE: U.S. Department of Education. Institute for Education Sciences. National Center for EducationStatistics. National Assessment of Educational Progress (NAEP) 2015 Mathematics Achievement.
NAEP Grade 8 Math
Percent ofStudents
Percent belowBasic
Percent Basic Percent Proficient Percent Advanced
All Students 100 32 39 22 7
MaleFemale
5149
3134
3939
2321
76
National LunchProgram EligibilityEligibleNot EligibleInfo not available
4555#
4819‡
3940‡
1230‡
211‡
Race/EthnicityWhiteBlack or AfricanAmericanHispanicAsianAmerican Indian orAlaska NativeNative Hawaiian orOther PacificIslanderTwo or More Races
6920431#2
23663811‡‡‡
43294418‡‡‡
2651539‡‡‡
7#432‡‡‡
Student classified ashaving a disabilitySDNot SD
1189
7727
1941
324
#7
Student is an EnglishLanguage LearnerELLNot ELL
397
5432
3339
1122
27
Annual Education ReportWarren Consolidated Schools02/07/2017
A service of the Center for Educational Performance and Information (CEPI) Page 86 of 91

‡ Reporting Standards not met. NOTE: Observed differences are not necessarily statistically significant. Detail may not sum to totalbecause of rounding. SOURCE: U.S. Department of Education. Institute for Education Sciences. National Center for EducationStatistics. National Assessment of Educational Progress (NAEP) 2015 Mathematics Achievement.
NAEP Grade 12 Math
Percent ofStudents
Percent belowBasic
Percent Basic Percent Proficient Percent Advanced
All Students 100 34 41 23 2
MaleFemale
5149
3235
4142
2622
11
National LunchProgram EligibilityEligibleNot EligibleInfo not available
35640
54220
37440
9320
020
Race/EthnicityWhiteBlack or AfricanAmericanHispanicAsianAmerican Indian orAlaska NativeNative Hawaiian orOther PacificIslanderTwo or More Races
761453101
26685826000
42273332000
305935000
2007000
Student classified ashaving a disabilitySDNot SD
991
7830
1943
325
02
Student is an EnglishLanguage LearnerELLNot ELL
298
033
041
024
02
Annual Education ReportWarren Consolidated Schools02/07/2017
A service of the Center for Educational Performance and Information (CEPI) Page 87 of 91

# Rounds to zero‡ Reporting Standards not met. NOTE: Observed differences are not necessarily statistically significant. Detail may not sum to totalbecause of rounding. SOURCE: U.S. Department of Education, Institute of Education Sciences, National Center for EducationStatistics, National Assessment of Educational Progress (NAEP), 2015 Reading Assessment.
NAEP Grade 4 Reading
Percent ofStudents
Percent belowBasic
Percent Basic Percent Proficient Percent Advanced
All Students 100 37 63 29 5
MaleFemale
5050
3934
6166
2631
56
National LunchProgram EligibilityEligibleNot EligibleInfo not available
4852#
5024‡
5076‡
1640‡
18‡
Race/EthnicityWhiteBlack or AfricanAmericanHispanicAsianAmerican Indian orAlaska NativeNative Hawaiian orOther PacificIslanderTwo or More Races
7214641#3
32664916‡‡30
68345184‡‡70
3291749‡‡37
61115‡‡8
Student classified ashaving a disabilitySDNot SD
1288
7632
2468
731
#6
Student is an EnglishLanguage LearnerELLNot ELL
496
5236
4864
1629
25
Annual Education ReportWarren Consolidated Schools02/07/2017
A service of the Center for Educational Performance and Information (CEPI) Page 88 of 91

# Rounds to zero‡ Reporting Standards not met. NOTE: Observed differences are not necessarily statistically significant. Detail may not sum to totalbecause of rounding. SOURCE: U.S. Department of Education, Institute of Education Sciences, National Center for EducationStatistics, National Assessment of Educational Progress (NAEP), 2015 Reading Assessment.
NAEP Grade 8 Reading
Percent ofStudents
Percent belowBasic
Percent Basic Percent Proficient Percent Advanced
All Students 100 24 44 29 3
MaleFemale
5149
2920
4542
2534
24
National LunchProgram EligibilityEligibleNot EligibleInfo not available
4555#
3714‡
4543‡
1739‡
14‡
Race/EthnicityWhiteBlack or AficanAmericanHispanicAsian/NativeHawaiian or PacificIslanderAmerican Indian orAlaska NativeTwo or More Races
69204312
18472713‡‡
44444135‡‡
3492941‡‡
3觮‡‡
Student classified ashaving a disabilitySDNot SD
1090
6420
3045
532
#3
Student is an EnglishLanguage LearnerELLNot ELL
397
5723
3744
630
#3
Annual Education ReportWarren Consolidated Schools02/07/2017
A service of the Center for Educational Performance and Information (CEPI) Page 89 of 91
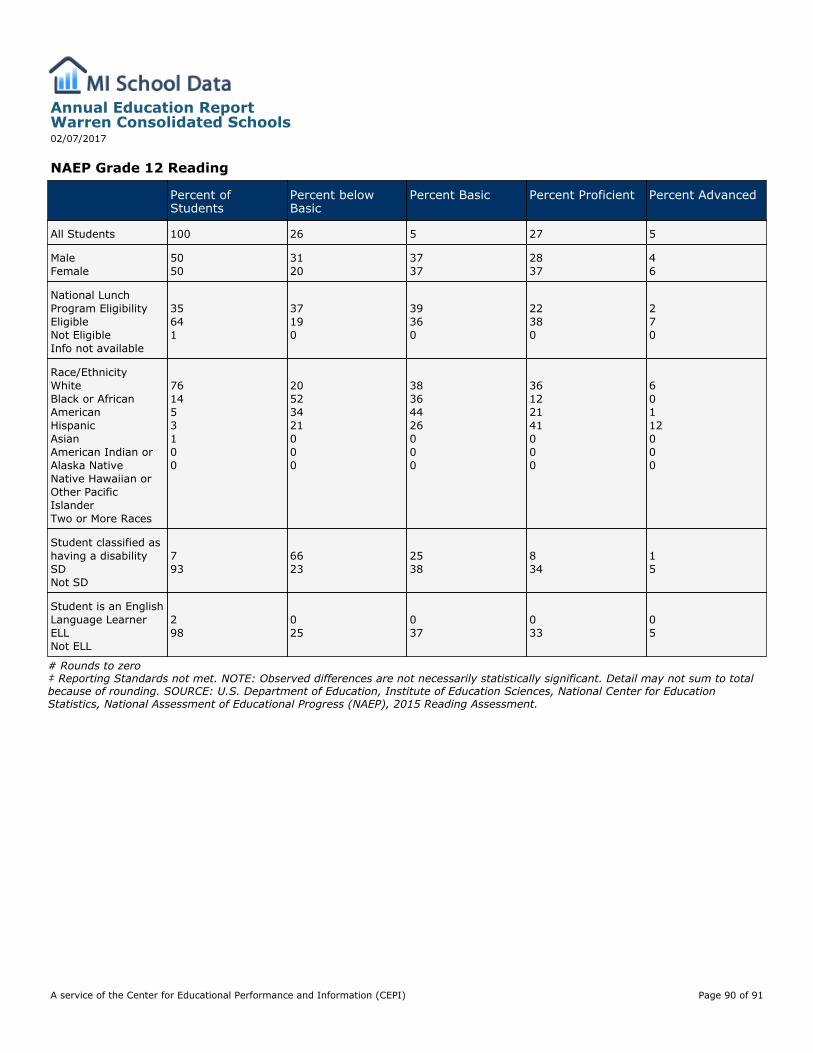
# Rounds to zero‡ Reporting Standards not met. NOTE: Observed differences are not necessarily statistically significant. Detail may not sum to totalbecause of rounding. SOURCE: U.S. Department of Education, Institute of Education Sciences, National Center for EducationStatistics, National Assessment of Educational Progress (NAEP), 2015 Reading Assessment.
NAEP Grade 12 Reading
Percent ofStudents
Percent belowBasic
Percent Basic Percent Proficient Percent Advanced
All Students 100 26 5 27 5
MaleFemale
5050
3120
3737
2837
46
National LunchProgram EligibilityEligibleNot EligibleInfo not available
35641
37190
39360
22380
270
Race/EthnicityWhiteBlack or AfricanAmericanHispanicAsianAmerican Indian orAlaska NativeNative Hawaiian orOther PacificIslanderTwo or More Races
761453100
20523421000
38364426000
36122141000
60112000
Student classified ashaving a disabilitySDNot SD
793
6623
2538
834
15
Student is an EnglishLanguage LearnerELLNot ELL
298
025
037
033
05
Annual Education ReportWarren Consolidated Schools02/07/2017
A service of the Center for Educational Performance and Information (CEPI) Page 90 of 91
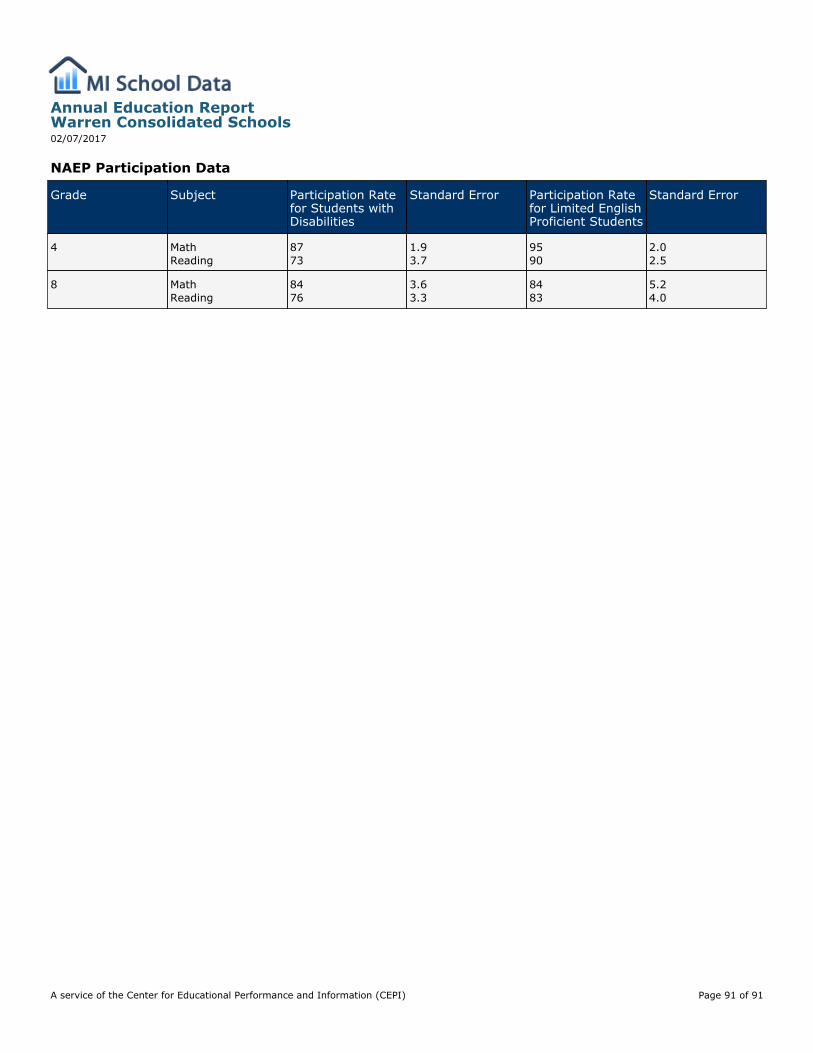
NAEP Participation Data
Grade Subject Participation Ratefor Students withDisabilities
Standard Error Participation Ratefor Limited EnglishProficient Students
Standard Error
4 MathReading
8773
1.93.7
9590
2.02.5
8 MathReading
8476
3.63.3
8483
5.24.0
Annual Education ReportWarren Consolidated Schools02/07/2017
A service of the Center for Educational Performance and Information (CEPI) Page 91 of 91