Embed Size (px)
Citation preview

1
Warehousing in a major mental health system Richard A. Warner Seattle,WA [email protected] Abstract
Over the past decade, proposals to transform our nation’s mental health system have called
for an end to the “warehousing” of system clients and the provision of services that promote
recovery. In King County, Washington, efforts would also appear to be underway to establish a
recovery-based system. But outcome reports from the King County mental health system
suggest that it has moved increasingly in the direction of warehousing its clients and that real
recovery, the absence of symptoms and the elimination of any need for medication, is a goal
that is being abandoned. This paper explores the reality of warehousing amidst the promises of
recovery for clients of the King County (Washington State) mental health system.
*********************
Introduction
Mental health systems have frequently been criticized for warehousing their clients. In
2002, the National Council on Disability released a report which charged that “most people
with psychiatric disabilities who are poor are merely being ‘warehoused’ in the community
rather than being helped toward recovery and independence” (National Council on Disability,
2002, p.10). Note that warehousing here does not mean locked in an institution. It can occur
just as well “in the community” and essentially refers to maintaining someone on psychiatric
drugs with little or no improvement in their mental health and functioning. As the President’s
New Freedom Commission (NFC) on Mental Health wrote in the introductory letter to its 2003
report on our nation’s mental health system, Achieving the Promise: Transforming Mental
Health Care in America, “Too often, today’s system simply manages symptoms and accepts

2
long-term disability” (President’s New Freedom Commission on Mental Health [NFC], 2003.
From the cover letter, p.1.).
The NFC answered its own criticism by calling for a transformation of our nation’s mental
health system to provide clients of the system with services that lead toward recovery. The
word recovery appears 66 times in the commission’s report. The NFC stated, “This
transformation must ensure that mental health services and supports actively facilitate recovery
….” (NFC, 2003, p. 1). State and county programs around the nation have largely adopted the
NFC’s transformation recommendations and King County (principal city, Seattle), the 14th
largest county in the U.S. with a population over 1.9 million, is no exception.
In 2000 the King County Council passed the “Recovery Ordinance” which made progress
toward recovery a central goal of the mental health system. In 2004, a Recovery Initiatives
Committee was formed under the King County Mental Health, Chemical Abuse and
Dependency Services Division (MHCADSD). In September 2005, the Division presented its
“Recovery Plan for Mental Health Services” to the Metropolitan King County Council and in
November of that year the Council passed an ordinance “adopting the recovery model as the
policy framework for developing and operating the mental health services for which King
County is responsible….” (Metropolitan King County Council, 2005, p.1).
However, despite its outward support of the recovery model, the King County system’s own
outcome reports and publications, as well as additional information obtained through public
disclosure requests, suggest that over the past decade it has moved increasingly in the direction of
warehousing. Outcomes in the King County system are revealed in three different sets of
documents: the mental health division’s Year End Report Cards, the division’s Recovery Ordinance
reports from 2001-2003, and data obtained through public disclosure requests. These sources point
to a mental health system in which warehousing – managing symptoms and accepting long-term
disability – appears to be the operational principal that determines how success and failure are
measured.

3
King County Year End Report Cards – 2000 – 2007
From 2000 to 2007, the King County Mental Health, Chemical Abuse and Dependency
Services Division (MHCADSD) published a King County Regional Support Network*Year
End Report Card, in which it presented data on a variety of outcome measures related to its
outpatient clients. Report cards used measures such as “Psychiatric symptoms,” “Level of
functioning,” “Homelessness,” and “Paid employment,” and then evaluated the Division
according to whether its performance on each measure improved or did not improve over the
previous year’s performance. These report cards were made available by the Division on its
website. (The 2000, 2001, 2002, 2003, and 2004 reports are no longer available at the website.)
The Psychiatric Symptoms and Level of Functioning outcome measures** are, of
course, the measures that most directly assess the mental health of MHCADSD’s clients. The
report cards presented statistical data for both of these measures in terms of what percentage of
outpatient clients improved, declined, or did not change (described in the report cards as
“maintained” or “stable”) on the measure after a year of services. The Division’s interpretation
of that data reveals a significant aspect of the King County mental health system’s expectations:
no change is considered a good thing, a positive outcome. Warehousing, in this sense, is
precisely what the system is trying to achieve.
Tables 1 and 2 below summarize the King County data on these two outcome measures –
psychiatric symptoms and level of functioning – between 2000 and 2008. The psychiatric
symptoms measure did not appear in the 2006 Year End Report Card. The level of functioning
measure was eliminated after the first quarter 2008 report.
________________ * In 1989 fourteen Regional Support Networks (RSNs) were established throughout Washington State to develop local systems of care for persons with mental illness. Counties (or groups of counties) were authorized to become RSNs. The King County Mental Health, Chemical Abuse and Dependency Services Division serves as the Regional Support Network (RSN) for King County and manages the King County mental health system. ** The psychiatric symptoms outcome measure was based upon a “Comparison of Problem Severity Summary (PSS) symptom indicator scores for adults and older adults at the beginning of a benefit for benefits expired year-to-date.” (King County Regional Support Network (KCRSN), 2005, p. 13. The same quote appears in the 2000 – 2004 report cards.) For a detailed report on the psychometric properties and utility of the PSS see Srebnik, Uehara, Smukler, Russo, Comtois and Snowden , 2002.) Level of Functioning measures were based upon scores on the Global Assessment of Functioning (adults) and the Children’s Global Assessment Scale.)
4
Table 1: Psychiatric symptoms YEAR % clients with increased
symptoms % clients who had no change in
psychiatric symptoms % clients with
decreased symptoms 2000 21.4% 49.6% 29.0% 2001 19.7% 51.7% 28.6% 2002 18.7% 55.0% 26.3% 2003 18.0% 58.7% 23.2% 2004 16.8% 61.2% 22.0% 2005 16.0% 64.4% 19.6%
Source: King County Regional Support Network, Year End Report Cards, 2000 – 2005 Table 2: Level of functioning
YEAR % clients who declined in functioning
% clients who had no change in functioning
% clients who improved in functioning
2000 18.5% 48.2% 33.3% 2001 17.3% 49.2 % 33.5% 2002 22% 45.1% 32.9% 2003 21.2% 46.9% 31.9% 2004 20.7% 49% 30.4% 2005 18.8% 52.3% 28.9% 2006 16.4 57.1% 26.5% 2007 16.2% 55.9% 27.9%
1st Q 2008 16.0 58.8 25.9 Source: King County Regional Support Network, Year End Report Cards, 2000 – 2006 and 2007 3rd Quarter Report Card.
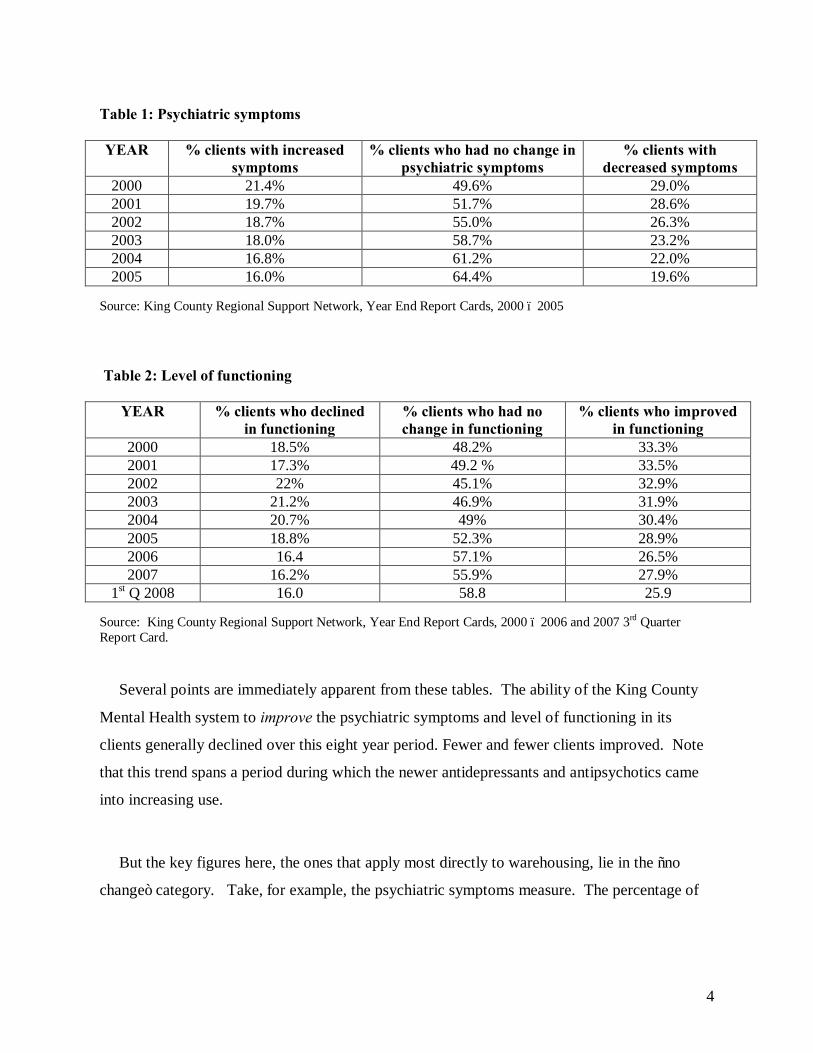
Several points are immediately apparent from these tables. The ability of the King County
Mental Health system to improve the psychiatric symptoms and level of functioning in its
clients generally declined over this eight year period. Fewer and fewer clients improved. Note
that this trend spans a period during which the newer antidepressants and antipsychotics came
into increasing use.
But the key figures here, the ones that apply most directly to warehousing, lie in the “no
change” category. Take, for example, the psychiatric symptoms measure. The percentage of

5
clients who had no change in psychiatric symptoms increased nearly 15% between 2000 and
2005. About 10% of that rise was accounted for by clients who moved from the symptom
decrease category to the no change category. The other 5% represented clients whose status
shifted from symptom increase to no change.
Certainly the system can be credited for lowering the percentage of clients whose symptoms
worsened. But the growth of the no-change group and the decline of the decreased symptoms
group, which one would think should be cause for concern, were viewed as an overall positive
by the Division.
Every year from 2000 through 2005, MHCADSD rated itself in its report cards as
“Improved” on the psychiatric symptoms measure, based primarily on the increasing percentage
of clients who remained unchanged. The Division referred to these clients as “stable.” In its
report cards it asked, “Are we able to stabilize or decrease psychiatric symptoms for adults and
older adults by benefit end?” (King County Regional Support Network [KCRSN], 2001 Year
End Report Card, p. 9a. On all subsequent report cards (2002 – 2007) the quote appears on p.
11a.) As long as the percentage of clients in this “stable or decreased” category was rising, the
Division rated itself as “Improved.”
One consequence of this grading system was that the movement of clients from the
decreased-symptoms to the no-change, or “stable,” category did not affect MHCADSD’s self-
rating. The “Improved” rating simply required a small statistical sleight-of-hand. If we
combine the statistic for the percentage of clients who have shown a decrease in symptoms
(Table 1, column 4) with the statistic for the percentage who have had no change (Table 1,
column 3), we get the following table.

6
Table 3: Percentage of clients who had no change (“stable”) or decreased symptoms
YEAR % with no change or decreased symptoms
2000 78.6% 2001 80.3% 2002 81.3% 2003 81.9% 2004 83.2% 2005 84.0%
Source: King County Regional Support Network, Year End Report Cards, 2000 – 2005. By combining the two statistics, MHCADSD produced a slightly rising statistic, representing its
stable-or-decreased-symptoms population. This is the statistic that the Division used to justify its
“Improved” grade. The improved grade, according to the Division, “means that the current results
are in a positive direction compared to the previous year” (KCRSN, 2006, p. 4).
The level of functioning statistics, which also led to “Improved” ratings for every year except
2002, reveal a similar, though less dramatic, trend. The percentage of clients who had no change in
functioning increased 10.6% between 2000 and the first quarter, 2008. 7.4% of that rise is
accounted for by clients who moved from the improved functioning category to the no change
category. The other 3.2% represents clients whose status shifted from declining functioning to no
change.
Do these 8-year results truly represent a “positive direction”? The ultimate end result of this
trajectory would be an entire population of clients whose mental health is not improved as a result
of treatment. All clients would be no-change clients. The mental health system would become a
defacto warehouse. Yet this is what MHCADSD calls a positive direction. It is the goal toward
which they move.
Using the data in Tables 1 and 2, the Division could just as well have published “No
improvement as a result of treatment” statistics, as in Figure 1 below.
7
Figure 1. Percentage of clients who did not improve following 1 year of services.
Instead, the Division equated no change with “stability” and gave itself a passing grade.
King County Mental Health’s “stable” clients
Ultimately, a fair evaluation of the Division’s performance hinges, to a significant degree, on
where its clients are being “stabilized.” In other words, are they doing relatively well or not?
Stability is something of a double-edged sword. The dictionary defines stable as, “resistant to
change of position or condition … enduring or permanent.” A man standing on top of a cliff might
be said to be stable. If he’s dangling on a branch 10 feet below the top of the cliff, that’s another
sort of stability. If he falls and lands on a ledge halfway down the cliff and breaks a leg, he is also
relatively stable. If he falls to the bottom of the cliff and breaks his back (or dies), a different sort of
stability has been reached. So it is necessary to know just what condition has been made “stable”
and how long that condition will last.
In terms of the MHCADSD outcomes, we might ask, “What is the level of functioning of the
Division’s no-change clients after a year of benefits?” Are they standing on top of the functioning

8
“cliff,” stuck half way down, or lying in dust at the bottom? At what point on the continuum of
mental health, ranging from relative normalcy to severe emotional disturbance, is this “stability”
occurring? Are these no-change clients individuals whose symptoms are under control and who can
function fairly well in life? Or are they “stably” unable to function, with severe mental and
emotional difficulties?
To answer these questions it is necessary to turn to the actual scores upon which the level of
functioning measure is based. According to the 2006 report card, level of functioning outcome
measures are based on a, “[C]omparison of Tier 2 and 3 GAF [Global Assessment of Functioning]
and CGAS (Children’s Global Assessment Scale] scores at the beginning of the benefit with scores
at the end of the benefit for benefits expired year-to-date” (KCRSN, 2006, p.4).
Several definitions are needed here. A tier benefit has been described as a, “service package
based on service intensity and expected outcomes that includes an array of services tailored to meet
the consumers’ needs identified in the treatment plan” (King County Department of Community and
Human Services, 2002, p. 3, footnote #4.). A Client Services Coordinator for MHCADSD
explained that, “the community mental health agencies with whom King County Mental Health
contracts are expected to meet the mental health needs of the mental health consumer for whom an
outpatient benefit has been authorized…. The assignment of a particular type of outpatient benefit,
e.g. ‘a 3A Tier’, as it used to be called, is to be based upon the services deemed to be necessary”
(Personal email #1, June 2007). These services,
… would often include case management, medication management, psychiatric assessment,
mental health case management and related services. Medication is monitored on a five day
per week basis for some clients depending on the assessed need. What type of worker, e.g.,
social worker, psychiatrist, case manager, nurse practitioner, etc, would be dependent upon
the prescriptions in the individual service plan, which is to be tailored to the needs of the
particular client. The frequency of service is also prescribed on an individual basis.
(Personal email #2, June 2007)
According to the report cards, the word “tiered” refers to, “A client who has met the medical
necessity requirements for the King County Mental Health Outpatient Program” (KCRSN, 2006, p.
12). To meet the medical necessity requirements for the outpatient program, adult clients must have
9
GAF scores of 60 or lower. The corresponding scale for children is the CGAS. Both scales, which
assign the client a score between 1 and 100, measure the relative severity of a client’s psychiatric
symptoms and degree of social and psychological impairment.
For example, a GAF score from 51-60 indicates, “Moderate symptoms (e.g. depressed mood and
mild insomnia) or some difficulty in social, occupational, or school functioning (e.g., occasional
truancy, or theft within the household) but generally functioning pretty well, has some meaningful
interpersonal relationships” (American Psychiatric Association [APA], 1994, p. 32). Scores from
41-50 indicate, “Serious symptoms (e.g., suicidal ideation, severe obsessional rituals, frequent
shoplifting) or serious impairment in social, occupational, or school functioning (e.g., no friends,
unable to keep a job)” (APA, p.32). Below 40 we find serious impairment in reality testing,
delusions, hallucinations, inability to work, persistent suicide attempts and incoherency (APA, p.
32).
The GAF scale, which is found in the latest edition of the American Psychiatric Association’s
Diagnostic and Statistical Manual of Mental Disorders, has been referred to as “an easily scored
summary assessment of global mental health status. Scores on the scale have been correlated with
both functional capacity and symptom severity, which are highly salient outcomes in the assessment
of treatment effectiveness” (Sernyak, Leslie, Rosenhack, 2003, p.311).
We would like to know where the Division’s clients, particularly their no-change clients, lie on
this GAF (or CGAS) scale after a year of benefits. Where are they on our functioning “cliff?” The
MHCADSD report cards do not present this data. In response to a public disclosure request, the
Division answered, “The other information you requested, mean and median [CGAS and GAF]
scores with standard deviations, are not analyses that we do on this type of data, so that information
is not available” (Robertson, July 11, 2007, letter to author). A second request, for the raw CGAS
and GAF scores upon which the Division’s 2006 Level of Functioning percentages (see Table 2,
last row) were based, was also not successful, but it did produce the following tables.

10
Table 4: CGAS scores of MHCADSD clients in 2006 Range Numberat start of clients Mean StdDev Median Mode Min Max0-20 11 11.55 16.164 0 0 0 4821-25 7 4.43 7.976 0 0 -3 1626-30 47 4.19 6.842 1 0 -9 2531-35 209 2.42 5.566 0 0 -18 2736-40 416 2.09 5.51 0 0 -11 3541-45 1,169 2.12 5.317 0 0 -30 4046-50 1,899 1.05 5.295 0 0 -30 3551-55 384 1.57 5.07 0 0 -20 2956-60 388 0.97 6.931 0 0 -20 35All 4,530 1.59 5.591 0 0 -30 48
Change in CGAS from start to end of benefit
Source: Data sent to the author by Jean Robertson, Assistant Division Director, King County Mental Health, Chemical Abuse and Dependency Services Division/King County Regional Support Network Administrator, August 24, 2007. Table 5: GAF scores of MHCADSD clients in 2006 Range Numberat start of clients Mean StdDev Median Mode Min Max0-20 333 5.48 9.493 0 0 -10 4521-25 378 1.82 5.441 0 0 -15 2526-30 1,007 1.27 5.567 0 0 -16 3031-35 1,306 1.25 5.409 0 0 -25 2736-40 2,528 0.76 4.319 0 0 -30 5041-45 3,630 0.24 3.911 0 0 -35 3546-50 3,723 -0.56 4.189 0 0 -30 3951-55 515 -0.68 4.159 0 0 -22 1756-60 439 -2.04 5.347 0 0 -30 20All 13,859 0.35 4.789 0 0 -35 50
Change in GAF from start to end of benefit
Source: Same as Table 4.
In its response to the disclosure request, the Division also noted, “In the Report Card, a
change of one point or more is counted as improved or declined. That is, 41 to 42 is
‘Improved,’ 42 to 41 is ‘Declined’” (Shoenfeld, Amnon, August 1, 2007, letter to author.).

11
While these 2006 figures do not exactly answer the question of where MHCADSD’s clients
lie on our functioning “cliff,” they give us a pretty good idea. In 2006, over 90% of the
Division’s clients began the benefit period with GAF or CGAS scores below 51. The average
gain of all clients (children and adults combined) following a year of benefits was .66, i.e., two-
thirds of one point. Those adults whose functioning was relatively high on the GAF scale
actually appeared to decline after a year of benefits. From the King County report cards we
know that, even though it took only a one point gain to move into the “improved functioning”
category, by 2008 nearly 75% of King County’s clients either worsened or had no change in
functioning that year.
Moreover, a one point gain is clearly a low standard upon which to base improvement. Had
the Division asked what percentage of its clients achieved clinically significant improvement on
their functioning scores, an even larger percentage of clients would have ended up in the no-
change category.
Just how large that percentage would have been is suggested by a 2008 report from the
Washington State Institute for Public Policy (WSIPP) that profiled adult public mental health
consumers, including their GAF scores. The report estimated that “individual change [on the
GAF scale] would need to be in the 9 to 15 point range to be considered reliable” (Washington
State Institute for Public Policy (WSIPP, p. 7). Based on this range, the WSIPP stated that “5.7
to 12.5 percent of consumers in the study cohort had a meaningful improvement in GAF scores
during the period of service” (WSIPP, p. 7). Significantly, the report found that “[I]mprovement
levels did not appear to be related to utilization patterns” (WSIPP, p. 7). In other words, those
who utilized mental health services frequently apparently fared no better than those who used
them infrequently.
Viewing the King County GAF scores though the lens of the WSIPP report strongly
suggests that very few clients of the King County mental health system achieve any meaningful
progress towards real mental health.

12
Add to this the fact that, as of 2005 (the last year that a specific psychiatric symptom
outcome measure was published), only 19.6% of clients had decreased psychiatric symptoms as
a result of their treatment, and there is little doubt that a very large percentage of the Division’s
clients are being “stabilized” rather far down on our imaginary cliff. They are severely
disabled.
Further support for this conclusion comes from a different set of reports on mental health
outcomes in King County – reports that were generated as a result of the previously mentioned
Recovery Ordinance. They were never published on the Division’s website but were available
upon request.
The Recovery Ordinance
In 2000, the King County Council, led by the late King County councilman, Kent Pullen,
passed an ordinance designed to explore the reality of recovery for clients of the mental health
system. Pullen wanted to know just how many clients of the King County mental health system
were really progressing toward, or achieving, anything resembling recovery. His ordinance was
intended to provide some answers.
Ordinance 13974, which came to be known as the “recovery ordinance,” passed the King
County Council on October 16, 2000. It was “designed to promote recovery as an achievable
outcome for adult consumers of the publicly-funded mental health system” (King County
Department of Community and Human Services [KCDCHS], 2002, p. 1) and it required
MHCADSD to report annually on outcomes in the mental health system in relation to the
recovery goal.
Using the GAF scale, the Division was asked to evaluate mental health outcomes relative to
three broadly defined categories:

13
1. Dependence (significant disability, serious symptoms and impairment, GAF score below
51, not employable);
2. Less dependence (some disability, progress toward recovery, moderate or mild
symptoms, GAF score between 51 and 80, functioning pretty well); and
3. Recovered (absent or minimal symptoms, GAF score above 80, discharged or receiving
infrequent maintenance services, engaged in some type of work or educational or vocational
activity).
GAF scores were the primary means by which clients were grouped in these categories.
The first recovery ordinance report, released in April of 2002, presented results from
calendar year 2001. In that year, 7,831 adult outpatients completed a tier benefit. 5879
consumers began their benefit period as dependent. At the end of their benefit period, 5284
(90%) remained dependent and 593 (10%) progressed to less dependent. 2 (<1%) recovered.
1952 consumers began their benefit as less dependent. Of these, 285 (15%) regressed to
dependent, 1665 (85%) remained unchanged and 2 (<1%) progressed to recovered. Overall,
after a year of tailored benefits, 285 patients (3.6%) regressed, 6949 (88.7%) remained in the
same outcome category, and 597 (7.6%) improved. Only four patients (.05%) ended their
benefit period as recovered (KCDCHS, 2002, p. 4).
The second annual report, covering calendar year 2002, was released in May of 2003. 9302
adult outpatients completed a benefit package. According to the report, of the 7009 consumers
who began their benefit period as dependent, 6433 (92%) remained dependent at the end of
their benefit period and 573 (8%) progressed to less dependent. 5 (<1%) recovered. 2295
consumers began their benefit period as less dependent. Of these, 561 (24%) regressed to
dependent, 1730 (75%) remained unchanged and 1 (<1%) progressed to recovered. Overall, of
the 9304 consumers, only 561 6% progressed. 94% regressed or remained unchanged
(KCDCHS, 2003, pp. 3-4).
The third annual report, covering calendar year 2003, was released in April of 2004.
According to the report, of the 7696 consumers who began their benefit period as dependent,

14
7242 (94%) remained dependent at the end of their benefit period and 454 (6%) progressed to
less dependent. 1655 consumers began their benefit as less dependent. Of these, 402 (24%)
became dependent, 1250 (75%) remained unchanged and 3 (<1%) progressed to recovered.
Overall, of the 9351 consumers, only 5% progressed. 95% regressed or remained unchanged
(KCDCHS, 2004, pp. 3-4).
Over a three year period, only 8% of clients who began the year in the dependent category
were able to move out of that category. In both 2002 and 2003, 24% of consumers in the “Less
Dependent” category regressed, becoming more dependent, while less than 1% progressed.
This suggests that over time the actual number of consumers who are able to stably move out of
the dependent category (GAF < 51;severe symptoms and impairment), let alone achieve
recovery, is minimal - in the range of 5% or less.
From 2001 – 2003, a total of 12 clients achieved “recovered” status. 8% of clients moved
out of the dependent category during this three year period. But 21% of less dependent clients
regressed back to the dependent category. Thus, the number of clients in the dependent
category fell by an average of only 1.8% per year during this period. The vast majority of clients
remained dependent, continually struggling with mental and emotional disability.
Figure 2: Change in the number of dependent clients following 1 year of services.
Source: King County Dept. of Community and Human Services [KCDCHS] 2002-2004 Year End Report Cards.
5879 5569
7009 6994 7696 7644

15
The recovery ordinance reports were never published on the Division’s website and they
were done away with in 2005. But they help shed light on the mental health system’s “stable”
clients. The recovery reports show that very few dependent clients progress out of that category
and fewer still do so with any degree of stability. A large percentage of the Report Card’s
“stable” clients are, in fact, stably dependent (GAF below 51), with serious symptoms and
impairment. They are stuck in a chronic, severely impaired, condition.
The redefinition of recovery
Outcomes are often reflective of outlooks. You achieve what you expect to achieve. You
attain the goal which you believe is attainable. Low expectations undoubtedly affect outcomes
in the mental health system. But they are also the product of poor outcomes. A system in
which almost no one gets well, in which disability and decay is expected to be, and becomes,
the status quo, is, ipso facto, a warehouse and it generates a warehouse mentality.
One aspect of that mentality is the current redefinition of recovery in the mental health field.
In an April 27, 2004 letter to the chair of the Metropolitan King County Council, King County
Executive Ron Sims called for the Council to join the MHCADSD in replacing the recovery
ordinance reports with a new “set of measures that provide a broader and more accurate image
of the recovery efforts being implemented ….” (Sims, 2004, p.4). “Recovery from a serious
mental illness,” wrote Sims, “can be thought of as a process, rather than as a condition at a
specific time” (Sims, 2004, p.3).
Here Sims echoed the language of the NFC’s 2003 report. The Commission envisioned a
future mental health system in which “recovery will be the common, recognized outcome of
mental health services” (NFC, 2003, p. 4). But the Commission defined recovery as “the
process in which people are able to live, work, learn, and participate fully in their communities.
For some individuals, recovery is the ability to live a fulfilling and productive life despite a
disability. For others, recovery implies the reduction or complete remission of symptoms”

16
(NFC, 2003, p.5). In other words, recovery was defined to include the process of living with
continuing illness.
Mental illness has generally been defined to be incurable. In his 1999 report on mental
health, Surgeon General David Satcher stated, “Appropriate treatment can alleviate, if not cure,
the symptoms and associated disability of mental illness” (Satcher, 1999, p. 453). In the Mental
Health Topics section of its website, the Menninger Clinic presents its “Top Five Myths of
Mental Illness.” Myth #2: “Medication cures mental illness” (The Menninger Clinic, 2007,
online report). A 1999 article in Psychiatric Services offered the following view:
“…the treatment of individual patients with serious mental illness and the allocation of
resources for this patient group have the same high status as the care of those who can be
cured. Thus persons with serious mental illness are no longer treated as second-class
citizens, and their need for treatment resources is no longer displaced by the supposedly
stronger claims of those who are potentially curable” (Callahan, D., 1999, p. 664).
So while the NFC might bemoan the practice of managing symptoms and accepting long
term disability, this would appear to be how most mental health professionals view their task.
They might therefore be expected to welcome a concept of recovery that is aligned with the
idea of living with continuing dysfunction. The King County system has adopted this
viewpoint. MHCADSD states,
• Recovery is not an end point that, once reached, ends a person’s need for
supports (King County Mental Health, Chemical Abuse and Dependency
Division [MHCADSD], Sept. 15, 2005, slide #3).
• It is a process of learning to live with mental illness and achieve the highest level
of functioning possible (MHCADSD, 2005, slide #3).
• “Recovery” means a way of living a satisfying, hopeful and contributing life,
even with illness caused limitations” (Metropolitan King County Council, 2005,
p. 5).
• MHCADSD’s goal is the “…recovery of function and participation in the

17
community to the maximum extent possible in spite of illness that persists in
most cases” (Metropolitan King County Council, 2005, pp. 2-3).
Thus, persisting disability – no change – becomes part of the new definition of “recovery,”
which, course, makes it much easier to talk about recovery even if no change in the direction of
real mental health is occurring.
To a certain extent the focus on recovery as a process is consumer driven, an attempt to push
mental health systems to view their clients not simply as patients but as human beings and to
provide non-medical services that improve the quality of life. The 2005 King County
ordinance that adopted the recovery model for mental health services reflects this influence,
advocating that, “The mental health system shall, therefore, strive to …2. Focus on the whole
person, including strengths, capabilities, latent abilities and aspirations, not just symptoms and
pathologies … 3. Pursue activities in the larger community rather than the clinical setting …
7. Help persons with serious mental illness develop or restore normal life roles and
functions….” (Metropolitan King County Council, 2005, p. 6).
These are laudable, indeed fundamental, objectives. But without a successful address of
“symptoms and pathologies” the realization of these objectives is, at the very least, made
immeasurably more difficult.
There is also a profound danger is describing recovery in terms of continuing illness, rather
than using what Courtenay Harding has called “the universal criteria for recovery … defined as
no current signs and symptoms of any mental illness, no current medications, working, relating
well to family and friends, integrated into the community, and behaving in a way as to not
being able to detect having ever been hospitalized for any kind of psychiatric problems”
(Harding, 1994, p. 140). It solidifies and perpetuates the idea that real recovery is not possible.
As a consequence, “managing symptoms” can proceed as usual, with no one asking why the
mental health of system clients does not improve or why, if this “illness” is caused by chemical
imbalances, a treatment system based on drugs that allegedly restore the balance produces such
poor results. If mental disorders are, as claimed, physical illnesses, then recovery from those

18
disorders should be defined just as recovery from cancer or the measles - by an absence of the
core symptoms for the disease.
But here another equally important problem arises. The vast weight of medical science has
now thoroughly discredited the chemical imbalance theories that are used to justify psychiatric
drugging (Moncrieff, 2009, Valenstein, 1998, Glenmullen, 2000). Yet clients of the mental
health system are told that they are inflicted with an incurable brain disease. That false and
clearly disempowering message can’t help but have a negative impact on an individual’s hope
for recovery and on the recovery process itself.
The 2005 ordinance itself admitted, “It is now clear that changing to a recovery model
entails a fundamental change in how business is done, not just the addition of some new
employment and housing services” (Metropolitan King County Council, 2005, p. 3). If
fundamental change is occurring we should see it in outcomes related to the psychiatric
symptoms or level of functioning of King County system clients. The desperation, seen in the
King County mental health report cards, to produce the appearance of positive change, even
when none is occurring, and the fact that the King County mental health report cards, after
years of declining results , no long report outcomes related to psychiatric symptoms or overall
functioning, is of particular concern in this regard.
Recent studies of antipsychotics and antidepressants, long term outcomes
The importance of preserving Harding’s definition of recovery is heightened when viewed in
light of the results of recent major studies and metaanalyses of psychiatric drugs. Two of the
most important reviews of antipsychotic effectiveness have found that second generation
antipsychotics are no more effective than their first generation predecessors (Lieberman, 2005;
Jones, 2006), with 74% of patients discontinuing their medications, primarily due to inefficacy
or intolerable side effects (Lieberman, 2005). In the Lieberman study the median “duration of
successful treatment” was 3 months for one drug and 1 month for all the others.

19
A review (by Eric Turner of Oregon Health and Science University, published in the New
England Journal of Medicine) of FDA data for twelve antidepressants approved between 1987
and 2004, found that nearly half (36) of the studies failed to show any statistical benefit for the
antidepressants. In a revealing look at publication bias, Turner found that, while 36 of the
studies viewed by the FDA as having positive results were published, studies having negative
or questionable results “were, with three exceptions, either not published (22 studies) or
published in a way that, in our opinion, conveyed a positive outcome (11 studies)” (Turner &
matthews, 2008, p. 252). Indeed, various forms of deceit in drug research have become so
commonplace that Marcia Angell (editor of The New England Journal of Medicine for two
decades), citing numerous examples from psychiatric drug research, lamented, “It is simply no
longer possible to believe much of the clinical research that is published, or to rely on the
judgment of trusted physicians or authoritative medical guidelines” (Angell, 2009).
A 2008 study by Irving Kirsch, a psychologist at the University of Hull in the United
Kingdom who has done extensive research into antidepressant trials, found that in the trials of
Prozac, Effexor, Serzone, and Paxil, the difference in Hamilton Rating Scale of Depression
scores between medicated patients and those on placebo was, overall, clinically insignificant.
These results confirmed the results of previous metaanalyses. Joanna Moncrief and Kirsch
summarized these results in a 2005 paper published in the British Medical Journal, noting that,
“Recent meta-analyses show selective serotonin reuptake inhibitors have no clinically
meaningful advantage over placebo. Claims that antidepressants are more effective in more
severe conditions have little evidence to support them” (Kirsch and Moncrief, 2005, p. 156.).
Making matters worse, the research literature on long-term results indicates that outcomes
for individuals not taking psychiatric drugs are better than the outcomes for those who continue
taking medication. A 2007 NIMH-funded study on fifteen-year outcomes for patients with
schizophrenia found that at 4.5 years 39% of those in the off-medication group were “in
recovery” and more than 60% were working. Only 6% of those in the on-medication group
were in recovery. At 15 years only 28% of the off-med group suffered from psychotic
symptoms, whereas 64% of the on-med group were actively psychotic (Harrow & Jobe, 2007).
The authors identified several prognostic indicators that were associated with those who were

20
able to recover without antipsychotics and noted that “multiple other factors also are involved
because the off-medication patients showed better global outcomes than the on-antipsychotic
patients, even when subgroups with similar prognostic status were compared” (Harrow & Jobe,
2007, p. 412, emphasis added).
Outcomes in depression treatment follow a similar pattern. In a large 4-stage NIMH study
of antidepressants known as the STAR*D trial, participants were given an SSRI antidepressant
in the first stage. In subsequent stages participants who did not achieve remission in a previous
stage could switch medications or add additional medications to their treatment. Despite the fact
that the study excluded participants who had demonstrated an inadequate response to, or clear-
cut intolerance of, the antidepressants to be used in the first two treatment steps, the results
were not encouraging. Only about half the participants achieved remission (National Institute
of Mental Health, 2010). Compare these results to those of a 2006 study which found that, of
patients who recovered from an initial episode of depression and then relapsed—but did not go
back on medication—23% recovered in one month, 67% in 6 months, and 85% within a year
(Posternak, 2006). These patients were arguably more depressed than the patients who
participated in the STAR*D trials.*
The problem with outcomes is compounded by the fact that the drugs themselves are highly
toxic, with a wide range of serious effects including heart disease, diabetes, stroke, and brain
damage. In 2006 the National Association of State Mental Health Program Directors released a
report which revealed that “people with serious mental illness served by our public mental
health systems die, on average, 25 years earlier than the general population” (National
Association of State Mental Health Program Directors, 2006, p.11). Three of the states
averaged over 28 years of life lost and in Ohio the figure was 32 years of potential life lost per
patient. This years-of-potential-life-lost figure was 10 in 1980. It has risen steadily for the past
three decades (Tsuang,1980; Osby, 2000; Hannerz, 2001; Saha, 2007) and may well increase as
_________________
* The baseline mean Hamilton Depression Rating Scale (HAM-D) score for the untreated patients in Posternak’s study was 24.8. Baseline mean HAM-D score in STAR*D was 21.8 for the patients who participated in stage 1 (Trivedi & Rush, 2006) and 18.9 (Rush & Trivedi, 2006) or 15.8 (Trivedi, Fava, 2006) for the patients in stage 2.

21
more children are prescribed psychiatric drugs at increasingly younger ages.
Warehousing in the mental health system
The most significant aspect of King County’s year-end report cards is the insight they
provide into how the mental health system views its clients. The fact that no change after a year
(or years) of treatment is considered a positive result is indicative of just how low the
expectations are in the system. If a severely impaired client can simply be kept from
deteriorating further that is considered a positive result. That consideration is both a cause and
an effect of current results of mental health treatment and it is fundamental to the warehousing
mentality that guides the mental health system and has been a target of system critics.
Certainly, in one sense, no-change is a positive. If one stops a wound from bleeding that is a
positive. The person is not losing blood. That is a good thing. Ultimately, however, a process
must occur to restore the body to health. The lost blood must somehow be replaced. The
damage to the body must be repaired. If these improvements do not occur, poorer health is
certain to result. Stopping the blood loss, while it might be considered a temporary stability, is,
in fact, a short-lived point of stasis on the way to either improving health or death. It is the sort
of “stability” one finds in the hospital’s critical care ward.
Eventually, however, conditions either improve or decline. The silver vase sitting on the
mantle gathers dust and tarnishes. We stabilize patients after a serious injury but they must
soon move toward increasing health or they will die. As the ability to improve mental health
declines, there is less and less chance that clients will move in a positive direction – leaving
only one other direction to go.
So to equate no-change with stability, and stability with improvement, is to believe in a
double fiction. But it is just such a fiction that provides the philosophical underpinnings of
mental health warehousing. It serves a common purpose of fiction – to assure us that things
aren’t as bad as they seem. The man stuck in quicksand searches for evidence that he at least

22
isn’t sinking. He’s desperate to believe he’s floating.
With their success at improving the mental health of their clients already low and trending
lower, the King County system first set its sights on the next best thing: no change. However,
both the recovery reports and the report cards continued to demonstrate that what was occurring
was not floating, but sinking.
The King County data demonstrate that very few clients move out of the dependent category
and those that do have a far greater chance of moving back in than recovering. As noted above,
in both 2002 and 2003 recovery ordinance reports, 24% of consumers in the “Less Dependent”
category regressed, becoming more dependent, while only a small fraction of a percent
progressed. King County’s “stable” clients are most likely far from stable and the odds of
anyone truly recovering in the current King County mental health system are poor.
The data suggest that nearly all of those clients who are described in the King County report
cards as having “stabilized psychiatric symptoms,” are, in fact, chronically emotionally and
mentally disabled. They are being warehoused. Yet the system counts them as the acceptable
products of their treatment efforts, as proof that “current results are in a positive direction.”
Conclusion
In the King County mental health system very few clients recover in any meaningful sense.
Outcome data indicate that a year of “services tailored to meet the consumers’ needs” does not
result in any meaningful progress toward mental health for the vast majority of the system’s
clients. The operational goals of the mental health division reflect this reality. The elimination
of key measures reflecting the psychological and social functioning of King County’s clients,
coupled with a definition of recovery that includes living with significant symptoms, suggests
that the Division does not believe that real progress toward recovery is achievable. The Division
considers that results are in a positive direction even if clients make no progress toward
recovery - as long as they don’t, in the short term, decline.

23
What the mental health division calls “stability” is in fact deterioration and decay. The data
lend support to Robert Whitaker’s contention that current treatment methods “increase the
likelihood that a person will become chronically ill” (Whitaker, 2005, p. 23). Though King
County proclaims to have adopted a recovery-oriented mental health system, the system’s
outcome reports and statements offer evidence of a guiding belief that real recovery is not
possible and the best that can be achieved is, in the final analysis, a form of warehousing.
Richard Warner
Copyright 2007, 2010
References
American Psychiatric Association (1994). Diagnostic and Statistical Manual of Mental Disorders, Fourth Edition. Marcia Angell, “Drug Companies & Doctors: A Story of Corruption,” The New York Review of Books, Volume 56, Number 1, January 15, 2009. Callahan, D. (1999). Balancing Efficiency and Need in Allocating Resources to the Care of Persons with Serious Mental Illness, Psychiatric Services, 50, 664-666. Cole, J., “Therapeutic efficacy of antidepressant drugs,” Journal of the American Medical Association 190 (1964): 488-55. Glenmullen, Joseph, Prozac Backlash, Simon and Schuster, 2000. Glenmullen writes, “In recent decades, we have had no shortage of alleged biochemical imbalances for psychiatric conditions. Diligent though these attempts have been, not one has been proven.” Hannerz, H., Borga P., and Borritz, M. (2001). Life expectancies for individuals with psychiatric diagnoses. Public Health, 115, 328–337. This study of the life expectancy for individuals with psychiatric diagnoses found the life expectancies reduced by 8 – 15 years for schizophrenia and functional or affective psychoses.
Harding, C. (1994). Empirical correction of seven myths about schizophrenia with implications for treatment. Acta Psychiatrica Scandanavia, 90 (Suppl 384), 140-146. Harrow, M., Jobe, T., “Factors Involved in Outcome and Recovery in Schizophrenia Patients Not on Antipsychotic Medications: A 15-year Multifollow-Up Study,” The Journal of Nervous and Mental Disease, 195 (5), May 2007: 406-14. Jones, Peter B., Barnes, Thomas R. E., Davies, Linda, et al., “Randomized Controlled Trial of the Effect on Quality of Life of Second- vs First-Generation Antipsychotic Drugs in Schizophrenia,” Archives of General Psychiatry 63 (2006): 1079 – 1087.

24
King County Department of Community and Human Services, King County Mental Health, Chemical Abuse and Dependency Services Division (2002). King County Ordinance #13974, First Annual Report: Recovery Model. King County Department of Community and Human Services, King County Mental Health, Chemical Abuse and Dependency Services Division (2003). King County Ordinance #13974, Second Annual Report: Recovery Model. King County Department of Community and Human Services, King County Mental Health, Chemical Abuse and Dependency Services Division (2004). King County Ordinance #13974, Third Annual Report: Recovery Model. King County Mental Health, Chemical Abuse and Dependency Services Division (September 15, 2005). Chemical Abuse and Dependency Division, Recovery Plan for Mental Health Services, [PowerPoint] Presentation to Law, Justice and Human Services Committee.
King County Regional Support Network (2000). 2000 Prepaid Health Plan, Year End Report Card. King County Regional Support Network (2001). 2001 Prepaid Health Plan, Year End Report Card.” Available: http://www.metrokc.gov/dchs/mhd/rptsindx.htm. King County Regional Support Network (2002). 2002 Mental Health Plan, Year End Report Card. Available: http://www.metrokc.gov/dchs/mhd/rptsindx.htm. King County Regional Support Network (2003). 2003 Mental Health Plan, Year End Report Card. Available: http://www.metrokc.gov/dchs/mhd/rptsindx.htm. King County Regional Support Network (2004). 2004 Mental Health Plan, Year End Report Card. Available: http://www.metrokc.gov/dchs/mhd/rptsindx.htm. King County Regional Support Network (2005). 2005 Mental Health Plan, Year End Report Card. Available: http://www.metrokc.gov/dchs/mhd/rptsindx.htm. King County Regional Support Network (2006). 2006 Mental Health Plan, Year End Report Card. Available: http://www.metrokc.gov/dchs/mhd/rptsindx.htm. King County Regional Support Network (2007). 2007 First Quarter Report Card. Available: http://www.metrokc.gov/dchs/mhd/rptsindx.htm. Kirsch, I., “Initial severity and antidepressant benefits,” PLoS Medicine 5 (2008): 260-268. Lieberman, J., et al., “Effectiveness of antipsychotic drugs in patients with schizophrenia.” New England Journal of Medicine 353 (2005):1209-1233. The Menninger Clinic (2007). Mental illness myths. Available: http://www.menningerclinic.com/newsroom/topic.htm#myths. Metropolitan King County Council (November 15, 2005). King County Signature Report, Ordinance #15327. Moncrieff, Joanna, The Myth of the Chemical Cure, Palgrave MacMillan, St. Martin’s Press, New York, N.Y., 2009.
Moncrief, J., Kirsch, I., “Efficacy of Antidepressants in Adults,” British Medical Journal 331 (2005): 155-157.

25
National Association of State Mental Health Program Directors (NASMHPD), “Morbidity and Mortality in People with Serious Mental Illness,” October, 2006, p. 11. National Center for Health Statistics (June 11, 2008). U.S. Mortality Drops Sharply in 2006, Latest Data Show. Available at: http://www.cdc.gov/nchs/PRESSROOM/08newsreleases/mortality2006.htm National Center for Health Statistics (2007). Health, United States, 2007, p. 175.
National Council on Disability (September 16, 2002). The Well Being of Our Nation: An Inter-Generational Vision of Effective Mental Health Services and Supports. Available: http://www.ncd.gov/newsroom/publications/2002/publications.htm. National Institute of Mental Health, 2010. The STAR*D trial results are summarized at http://www.nimh.nih.gov/trials/practical/stard/allmedicationlevels.shtml. See also, Rubinow, David, “Treatment Strategies after SSRI Failure – Good News and Bad News,” The New England Journal of Medicine 354 (12), March 23, 2006, pp. 1305-1307. Rubinow writes, “… at least half of patients with depression do not have a remission.” Osby U, Correia N, Brandt L, Ekbom A, Sparen P. (2000). Time trends in schizophrenia mortality in Stockholm County, Sweden: cohort study. British Medical Journal, 321(7259): 483-484. The study found a linear increasing trend of mortality during 5-year periods from 1976 to 1995 among people with schizophrenia.) Personal email #1, June 29, 2007, 2:34 p.m. Personal email #2, June 29, 2007, 12:05 p.m. Posternak, M., “The naturalistic course of unipolar major depression in the absence of somatic therapy,” Journal of Nervous and Mental Disease 194 (2006): 324-49.
President’s New Freedom Commission on Mental Health (2003). Achieving the Promise: Transforming Mental Health Care in America. Available: http://www.mentalhealthcommission.gov/.
Robertson, Jean (July 5, 2007). Letter to author. Robertson is the Assistant Division Director, King County Mental Health, Chemical Abuse and Dependency Services Division. The letter was in response to the author’s public disclosure request of July 5, 2007. Robertson, Jean (August 24, 2007). Letter to author. In response to the author’s public disclosure request (PDR), Amnon Shoenfeld, Division Director, sent all of the data contained in Tables 4 and 5, except the standard deviations. A second PDR resulted in Robertson’s resending of the data, with the standard deviations included. Rush, J.A., Trivedi, M.H. et al. (2006). Buproprion-SR, Sertraline, or Venlafaxine-XR after Failure of SSRIs for Depression. The New England Journal of Medicine 354: 1231-42.
Saha, S., Chant, D., McGrath, J. (2007). A Systematic Review of Mortality in Schizophrenia. Arch Gen Psychiatry,64(10):1123-1131. This review, which investigated mortality in schizophrenia published between 1980 and 2006, found, “With respect to mortality, a substantial gap exists between the health of people with schizophrenia and the general community. This differential mortality gap has worsened in recent decades.”
Satcher, D. (1999). Mental health, A report of the surgeon general. Available: http://www.surgeongeneral.gov/library/mentalhealth/home.html. Shoenfeld, Amnon (August 1, 2007). Letter to author. Shoenfeld, is the Division Director, King County Mental Health, Chemical Abuse and Dependency Services Division. Shoenfeld’s letter was in response to the author’s public disclosure request to Assistant Division Director Jean Robertson, dated July 16, 2007.

26
Sernyak, M., Leslie D., Rosenheck R. (2003). Use of System-Wide Monitoring Data to Compare the Effectiveness of Atypical Neuroleptic Medications. American Journal of Psychiatry, 160: 310-315. Srebnik, D., Uehara, E., Smukler, M., Russo, J., Comtois K., & Snowden, M. (2002). Psychometric Properties and Utility of the Problem Severity Summary for Adults with Serious Mental Illness. Psychiatric Services, 53: 1010-1017. Sims, R. (April 27, 2004). King County Executive, letter to King County Councilmember Larry Phillips. The letter was part of a folder prepared by MHCADSD’s Lisbeth Gilbert for parties interested in the recovery ordinance and its future. Trivedi, M.H., Fava, M., et al. (2006). Medication Augmentation after the Failure of SSRIs for Depression. The New England Journal of Medicine 354: 1243-52. Trivedi, M.H., Rush, J.A., et al. (2006) Evaluation of Outcomes with Citalopram for Depression Using Measurement-Based Care in STAR*D: Implications for Clinical Practice. American Journal of Psychiatry 163:28-40 Tsuang, M.T., Woolson, R.F., Fleming, J.A., “Premature deaths in schizophrenia and affective disorders,” Archives of General Psychiatry, 37 (9): 979-983, September 1980. In 2000, (A 2001 (Finally, a 2007 analysis of studies that (
Turner, E., Matthews, A.M., et. al. (2008) Selective publication of antidepressant trials and its influence on apparent efficacy. New England Journal of Medicine 358 (2008): 252-60. Valenstein, Elliot, Blaming the Brain, The Free Press, 1998. Valenstein, who is Professor Emeritus of Psychology and Neuroscience at the University of Michigan, writes, "Contrary to what is claimed, no biochemical, anatomical, or functional signs have been found to reliably distinguish the brains of mental patients." (p. 125) Washington State Institute for Public Policy (2008). Who Stays and Who Leaves? A Profile of Adult Mental Health Consumers. Available at: http://www.wsipp.wa.gov/topic.asp?cat=13&subcat=0&dteSlct=0
Whitaker, R. (2005). Anatomy of an Epidemic, Psychiatric Drugs and the Astonishing Rise of Mental Illness in America. Ethical Human Psychology and Psychiatry, Vol. 7, Number 1, 23-35.