Embed Size (px)
Citation preview
Warehouse
Mapping
Processes Best Practices for Warehouse
Temperature Management and
Control
This guide does not purport to be an interpretation of law and/or regulations and is for guidance purposes only.
© Cryopak 2015 2
This guide does not purport to be an interpretation of law and/or regulations and is for guidance purposes
only.
PUBLISHED BY:
This material is subject to copyright protection, with all copyrights retained by Cryopak and its individual
partners. All rights reserved. The reproduction, transfer, distribution or storage of information contained in
this document in any form without the prior written consent of Cryopak is strictly prohibited. All
specifications — technical included — are subject to change without notice.
www.cryopak.com
CANADA UNITED STATES OF AMERICA FRANCE 11000 Parkway Blvd Anjou, QC H1J 1R6
1.888.423.7251 [email protected]
1053 Derwent Way Delta, BC V3M 5R4
1.800.667.2532 [email protected]
551 Raritan Center Parkway Edison, NJ 08837
1.888.827.3393 [email protected]
11870 Community Road, suite 220 Poway, CA 92064
1.858.668.1800 [email protected]
1 rue Berthelot, ZI la Maine 76150 Maromme, France
+33 (0) 2 32 82 59 65 [email protected]
This guide does not purport to be an interpretation of law and/or regulations and is for guidance purposes only.
© Cryopak 2015 3
Contents
1. AUTHOR & CONTRIBUTORS ........................................................................................ 4
2. ABBREVIATION & DEFINITION .................................................................................. 5
3. SCOPE ................................................................................................................................... 7
4. PROJECT REQUIREMENTS ............................................................................................ 8
5. PROCESS .............................................................................................................................. 9
5.1. Step 1 – Protocol Writing ............................................................................................... 9
5.1.1. Choosing the Perfect Moment ............................................................................ 9
5.1.2. Data Logger Distribution ..................................................................................... 9
5.1.3. Study Duration .................................................................................................... 12
5.1.4. Measuring Range ................................................................................................ 13
5.1.5. Testing .................................................................................................................. 13
5.2. Step 2 – Protocol Execution .......................................................................................... 14
5.2.1. Programming Data Loggers .............................................................................. 14
5.2.2. Installing Data Loggers ...................................................................................... 15
5.2.3. Documentation .................................................................................................... 15
5.2.4. Removing Data Loggers .................................................................................... 15
5.3. Step 3 – Report .............................................................................................................. 16
5.3.1. Data Compilation ............................................................................................... 16
5.3.2. Mean Kinetic Temperature (MKT) ................................................................... 16
5.3.3. Calibration and Post-Calibration Requirements ............................................ 17
5.3.4. Data Analysis ...................................................................................................... 17
6. CONCLUSION .................................................................................................................. 19
7. REFERENCES ..................................................................................................................... 20
This guide does not purport to be an interpretation of law and/or regulations and is for guidance purposes only.
© Cryopak 2015 4
1. AUTHOR & CONTRIBUTORS
Jalal Belbal, B.Sc. (eng.) – Main Author
Jalal Belbal, Validation & Regulatory Compliance Manager at Cryopak, has 10 years of experience
in the pharmaceutical, biotechnology, and life science industries. He has worked on a wide range
of qualification projects including mapping process, laboratory equipment, packaging and
software validation to help the Life Science industry fulfill US and Canadian regulatory
requirements and best practices, such as the Guide 0069, PIC/s-Annex11, PDA – Technical Report
No.64, USP 36 Chapter <1079>, GAMP and FDA’s 21 CFR Parts 11, 210, 211, and 820.
Jalal Belbal earned a bachelor’s degree in Biochemistry & Environmental Engineering from
University Laval, Quebec.
Benoît Chedhomme - Contributor
Benoît Chedhomme, Sales Manager – Canada at Cryopak, has over 10 years of experience in the
pharmaceutical, biotechnology and life science industries. After immigrating to Canada in 2004,
he joined Alternatives Technologie Pharma, a start-up company that grew to become a recognized
national cold chain solution provider. Over the years, Benoît has helped many CRO/CMO, 3PL
and pharmaceutical wholesalers to comply with regulatory requirements and optimize their cold
chain process.
Benoît Chedhomme earned a master’s degree in Sales & Distribution Network from University of
Montpellier, France.
Geneviève Joseph – Contributor
Geneviève Joseph, Marketing Coordinator at Cryopak, has over 10 years of experience in retail
sales & customer service. She joined Alternatives Technologie Pharma in 2012 as a documentation
specialist, where she gained experience in mapping process and thermal equipment qualification.
She joined the Sales & marketing team at Cryopak, its sister company, a year later.
Geneviève Joseph earned a degree in Political Science and a certificate in Professional Writing from
University of Montreal, Quebec. She is currently a McGill University student in Marketing.
This guide does not purport to be an interpretation of law and/or regulations and is for guidance purposes only.
© Cryopak 2015 5
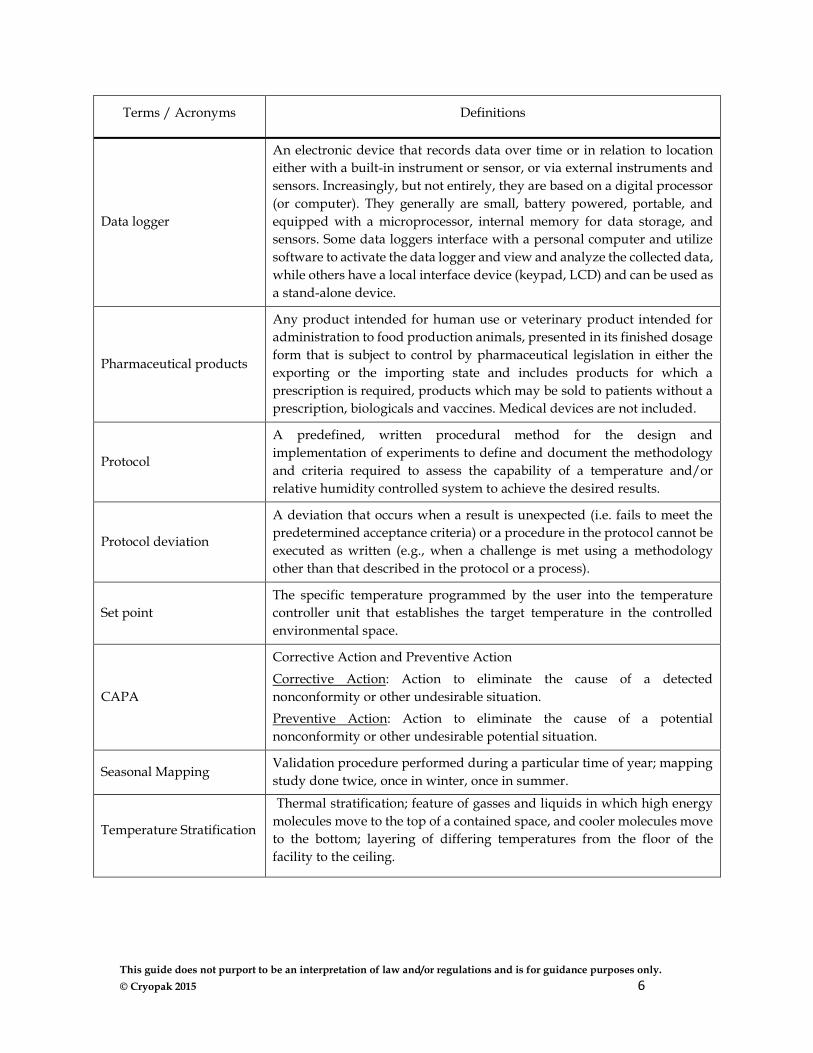
2. ABBREVIATION & DEFINITION
In order to aid the understanding of terms and acronyms used in this document, a brief technical
definition is shown below.
Please note: This document only refers to temperature mapping. This service is also available for
relative humidity.
Terms / Acronyms Definitions
HC Health Canada
HVAC Heating, Ventilation, and Air Conditioning
HPRA Health Product Regulatory Authority
EMA European Medicines Agency
USP U.S Pharmacopeia
GMP Good Manufacturing Practice
PDA Parenteral Drug Association
PIC/S Pharmaceutical Inspection Co-operation Scheme
WHO World Health Organization
FDA Food and Drugs Administration
ISPE International Society For Pharmaceutical Engineering
ICH Internal Conference on Harmonisation
GDP Good Distribution Practice
MKT Mean Kinetic Temperature
EMS Environmental Monitoring System
21 CFR Code of Federal Regulation, number 21 from Food and Drug
Administration (FDA)
NIST National Institute of Standards and Technology
NCRC National Calibration Reference Centre
SOP Standard Operating Procedure
Software
Software is a generic term for organized collections of computer data and
instructions, often broken into two major categories: system software that
provides the basic non-task-specific functions of the computer, and
application software which is used by users to accomplish specific tasks.
This guide does not purport to be an interpretation of law and/or regulations and is for guidance purposes only.
© Cryopak 2015 6
Terms / Acronyms Definitions
Data logger
An electronic device that records data over time or in relation to location
either with a built-in instrument or sensor, or via external instruments and
sensors. Increasingly, but not entirely, they are based on a digital processor
(or computer). They generally are small, battery powered, portable, and
equipped with a microprocessor, internal memory for data storage, and
sensors. Some data loggers interface with a personal computer and utilize
software to activate the data logger and view and analyze the collected data,
while others have a local interface device (keypad, LCD) and can be used as
a stand-alone device.
Pharmaceutical products
Any product intended for human use or veterinary product intended for
administration to food production animals, presented in its finished dosage
form that is subject to control by pharmaceutical legislation in either the
exporting or the importing state and includes products for which a
prescription is required, products which may be sold to patients without a
prescription, biologicals and vaccines. Medical devices are not included.
Protocol
A predefined, written procedural method for the design and
implementation of experiments to define and document the methodology
and criteria required to assess the capability of a temperature and/or
relative humidity controlled system to achieve the desired results.
Protocol deviation
A deviation that occurs when a result is unexpected (i.e. fails to meet the
predetermined acceptance criteria) or a procedure in the protocol cannot be
executed as written (e.g., when a challenge is met using a methodology
other than that described in the protocol or a process).
Set point
The specific temperature programmed by the user into the temperature
controller unit that establishes the target temperature in the controlled
environmental space.
CAPA
Corrective Action and Preventive Action
Corrective Action: Action to eliminate the cause of a detected
nonconformity or other undesirable situation.
Preventive Action: Action to eliminate the cause of a potential
nonconformity or other undesirable potential situation.
Seasonal Mapping Validation procedure performed during a particular time of year; mapping
study done twice, once in winter, once in summer.
Temperature Stratification
Thermal stratification; feature of gasses and liquids in which high energy
molecules move to the top of a contained space, and cooler molecules move
to the bottom; layering of differing temperatures from the floor of the
facility to the ceiling.
This guide does not purport to be an interpretation of law and/or regulations and is for guidance purposes only.
© Cryopak 2015 7
3. SCOPE
A mapping study is performed to generate a temperature profile
of the facility, in order to ensure it maintains the temperature
range required by the specific products. Temperature mapping
studies help manufacturers, distributors and transporters of
pharmaceutical, biotechnology and other temperature sensitive
products protect their value by identifying potential
environmental control problems before products are affected, as
inadequately controlled environments can lead to ineffective
and spoiled products. It’s also an essential exercise to determine
the location of the real-time monitoring system sensors..
Fundamental to any controlled process is the expectation that
pharmaceutical and other products that are stored and shipped
within a controlled environment are maintained within their
defined range, as all drugs should be stored according to the
conditions described on the label.
The temperature within an environmentally controlled
warehouse is expected to be maintained1:
Reliably and consistently through the entire period the
product is stored within the controlled environment;
In compliance with the product requirements for
temperature at all locations in which the product might
be stored (i.e. temperature and location/storage
boundary).
The recent changes in the FDA and Canadian regulations (GUI-
0069 and various federal CFR codes), along with the objective to eliminate the waste of time and
money to fix environmental conditions failures has made temperature mapping an integral aspect
of any storage area operation.
1 PARENTERAL DRUG ASSOCIATION. Technical Report No.64 – Active Temperature Controlled
Systems: Qualification Guidance, PDA, 2013, 58p.
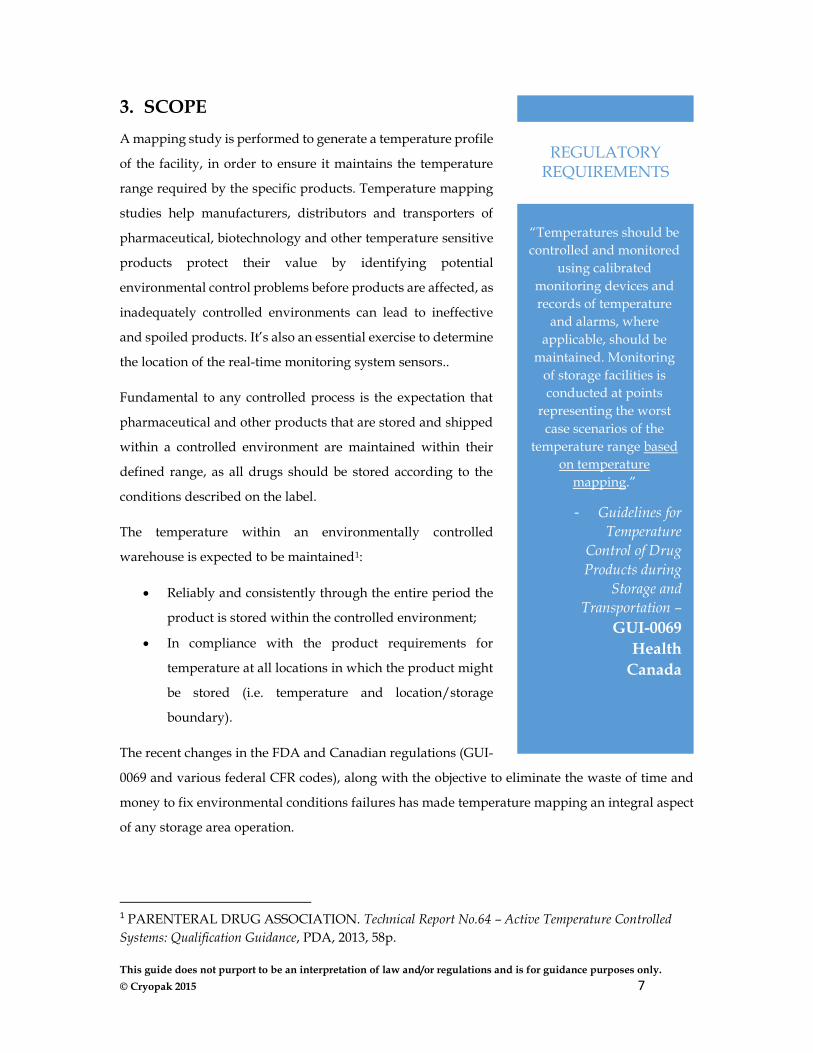
“Temperatures should be
controlled and monitored
using calibrated
monitoring devices and
records of temperature
and alarms, where
applicable, should be
maintained. Monitoring
of storage facilities is
conducted at points
representing the worst
case scenarios of the
temperature range based
on temperature
mapping.”
- Guidelines for
Temperature
Control of Drug
Products during
Storage and
Transportation –
GUI-0069
Health
Canada
REGULATORY REQUIREMENTS
This guide does not purport to be an interpretation of law and/or regulations and is for guidance purposes only.
© Cryopak 2015 8
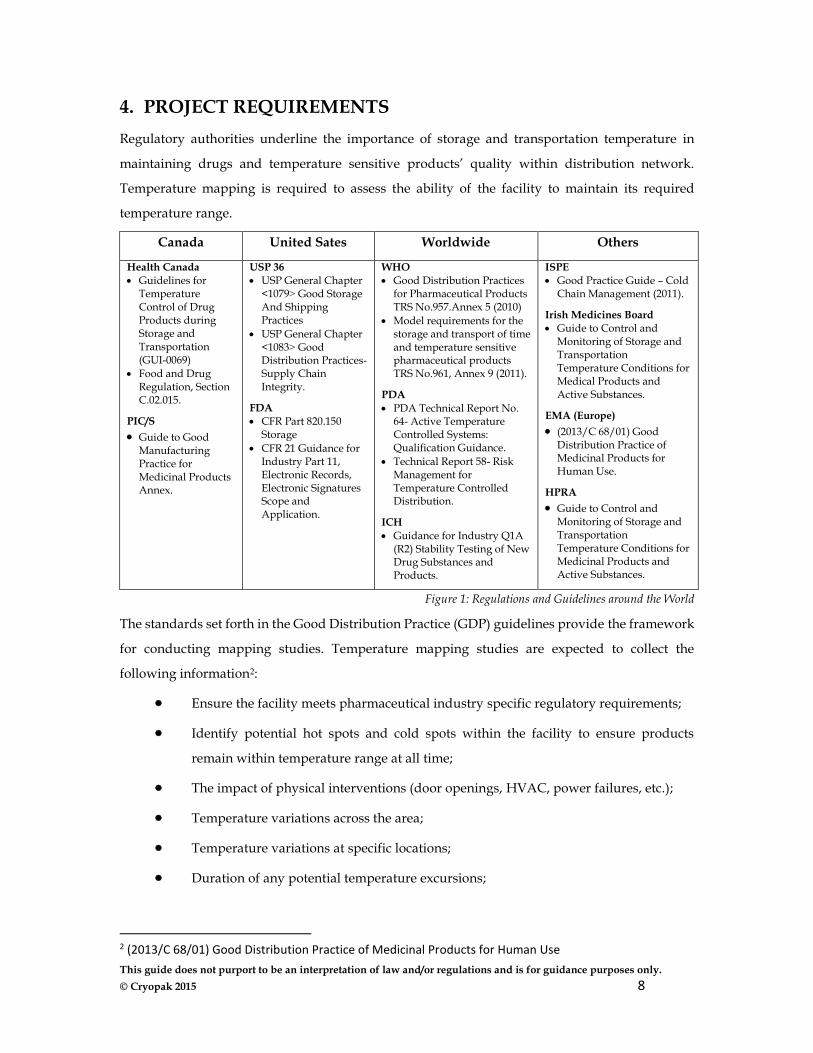
4. PROJECT REQUIREMENTS
Regulatory authorities underline the importance of storage and transportation temperature in
maintaining drugs and temperature sensitive products’ quality within distribution network.
Temperature mapping is required to assess the ability of the facility to maintain its required
temperature range.
Canada United Sates Worldwide Others
Health Canada
Guidelines for Temperature Control of Drug Products during Storage and Transportation (GUI-0069)
Food and Drug Regulation, Section C.02.015.
PIC/S
Guide to Good Manufacturing Practice for Medicinal Products Annex.
USP 36
USP General Chapter <1079˃ Good Storage And Shipping Practices
USP General Chapter <1083˃ Good Distribution Practices-Supply Chain Integrity.
FDA
CFR Part 820.150 Storage
CFR 21 Guidance for Industry Part 11, Electronic Records, Electronic Signatures Scope and Application.
WHO
Good Distribution Practices for Pharmaceutical Products TRS No.957.Annex 5 (2010)
Model requirements for the storage and transport of time and temperature sensitive pharmaceutical products TRS No.961, Annex 9 (2011).
PDA
PDA Technical Report No. 64- Active Temperature Controlled Systems: Qualification Guidance.
Technical Report 58- Risk Management for Temperature Controlled Distribution.
ICH
Guidance for Industry Q1A (R2) Stability Testing of New Drug Substances and Products.
ISPE
Good Practice Guide – Cold Chain Management (2011).
Irish Medicines Board
Guide to Control and Monitoring of Storage and Transportation Temperature Conditions for Medical Products and Active Substances.
EMA (Europe)
(2013/C 68/01) Good Distribution Practice of Medicinal Products for Human Use.
HPRA
Guide to Control and Monitoring of Storage and Transportation Temperature Conditions for Medicinal Products and Active Substances.
Figure 1: Regulations and Guidelines around the World
The standards set forth in the Good Distribution Practice (GDP) guidelines provide the framework
for conducting mapping studies. Temperature mapping studies are expected to collect the
following information2:
Ensure the facility meets pharmaceutical industry specific regulatory requirements;
Identify potential hot spots and cold spots within the facility to ensure products
remain within temperature range at all time;
The impact of physical interventions (door openings, HVAC, power failures, etc.);
Temperature variations across the area;
Temperature variations at specific locations;
Duration of any potential temperature excursions;
2 (2013/C 68/01) Good Distribution Practice of Medicinal Products for Human Use
This guide does not purport to be an interpretation of law and/or regulations and is for guidance purposes only.
© Cryopak 2015 9
Identify and eliminate potential weaknesses or failures in the cold chain process;
Identify any machinery that might generate heat in the warehouse;
Protect and ensure the products quality that are manufactured and distributed;
Optimise the use of space and energy within individual storage facilities.
As regulators increase their emphasis on GMP requirements, the definitive method to demonstrate
that all controlled storage equipment, or storage areas, stay within the specified limits is through a
thorough temperature mapping study.
5. PROCESS
Proper organization and documentation are critical to maintaining compliance and consistency.
Cryopak’s regulatory compliance experts strongly recommend the following 3 step approach:
5.1. Step 1 – Protocol Writing
The protocol is a comprehensive document used to guide the executants through the verification
of the temperature distribution within the warehouse during worst case scenarios, which are
usually at the coldest and warmest extremes of the winter and summer seasons. This detailed
protocol should include a few elements that are detailed below.
5.1.1. Choosing the Perfect Moment
Choosing the perfect timing is an art our regulatory compliance experts have mastered over the
years. Temperature mapping should be performed during the coldest week of the winter season
and the warmest week of the summer season for all storage areas to ensure that they are likely to
remain within the specified temperature limits at all time through the year. These seasons are
chosen as extreme temperatures are more likely to adversely affect the temperature distribution
within the storage area.
Although it is strongly recommended to map the storage area when empty and loaded to get a
better understanding of the temperature distribution, it is almost impossible to do so for practical
reasons. However, customers opening a new facility or moving in a new building will likely
perform an empty mapping in order to get their license from the authorities.
5.1.2. Data Logger Distribution
There are no standards or set formulas for the number or placement of data loggers that should be
used for a mapping study. However, your study must demonstrate 3-dimensional uniformity and
compliance with your product requirements. These multiple data points account for gradients or
This guide does not purport to be an interpretation of law and/or regulations and is for guidance purposes only.
© Cryopak 2015 10
temperature extremes in critical areas where product will be stored. Good practice is to use a
sufficient number to understand the environment, but not more than needed. Not enough sensors
cannot justify the results; too many means handling more data than necessary.
You should set the number of data loggers to use according to the warehouse volume.
When determining sensor location, you need to identify areas where unacceptable temperature
variations may affect the products’ quality. Large and open spaces are more difficult to maintain
at a consistent temperature. Make sure to install data loggers at all potentially problematic and
critical locations3:
Temperature gradients between the cooler floor and warmer air at the ceiling: as
heated air rises, make sure to measure any temperature stratification in larger spaces;
HVAC system’s capacity to move air, as well as the sizing of blowers or fans to
adequately circulate air: poor airflow or a bad fan location can cause extreme
temperature near sources of heat or cold, such as HVAC ducts or windows;
Layout of racks, shelves, pallets and other surfaces where products will potentially be
stored: racking and shelving configurations may create hot spots by obstructing the
airflow.
Close to the controllers;
Doors, windows and other risky areas, including outside walls that may respond to
external temperatures: doors or exits left open to regulate the overall temperature will
affect the environmental conditions around nearby racks;
Effect of incidences like power failures and vulnerable areas where there may be wide
variations in temperature, such as shipping doors;
Areas that are non-shelved, but deemed to be used as interim storage areas before
placing on racking;
Measure the external temperature during the study by installing one data logger
outside.
3 ROBEY, Sarah. Our blog Whichwarehouse, [http://www.whichwarehouse.com/blog/news/tips-pharma-storage-speciality-warehouse-storage-warehouse-space/] (page consulted on April 14th, 2015)
This guide does not purport to be an interpretation of law and/or regulations and is for guidance purposes only.
© Cryopak 2015 11
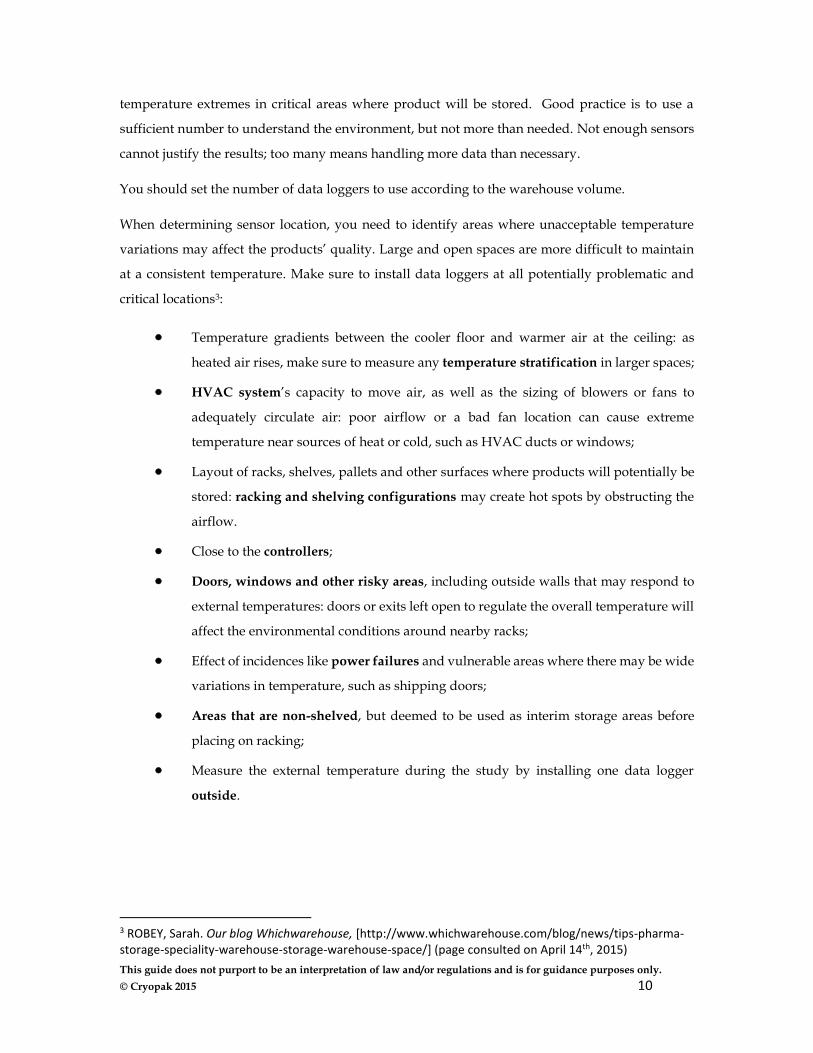
Using a 3-dimensional temperature profile means installing data loggers on at least three planes –
top to bottom, left to right and front to back (see figure 2), or on three (3) rows in height
(approximately at 6 feet, 12 feet and 18 feet high) where high racking exists. Additional data loggers
should be added where known cool or warm areas exist. No matter which option you choose, make
sure to use a consistent rationale for data loggers’ distribution.
Figure 2: Example of Data Loggers Location
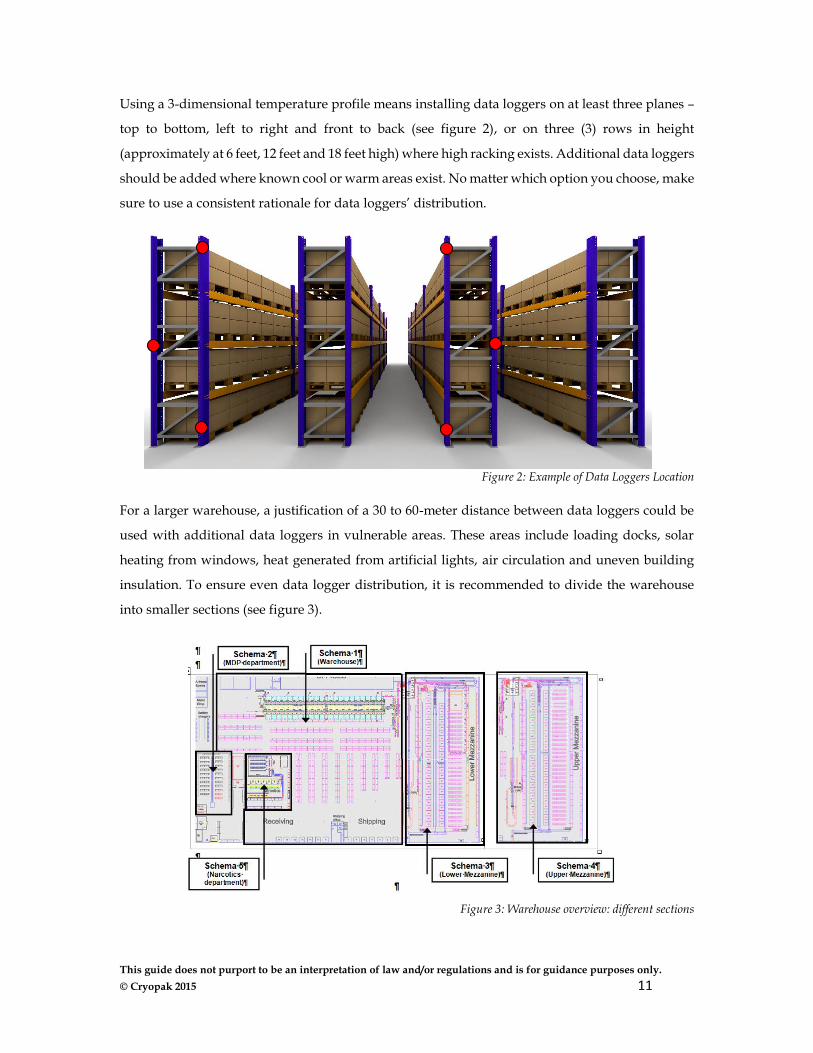
For a larger warehouse, a justification of a 30 to 60-meter distance between data loggers could be
used with additional data loggers in vulnerable areas. These areas include loading docks, solar
heating from windows, heat generated from artificial lights, air circulation and uneven building
insulation. To ensure even data logger distribution, it is recommended to divide the warehouse
into smaller sections (see figure 3).
Figure 3: Warehouse overview: different sections
This guide does not purport to be an interpretation of law and/or regulations and is for guidance purposes only.
© Cryopak 2015 12
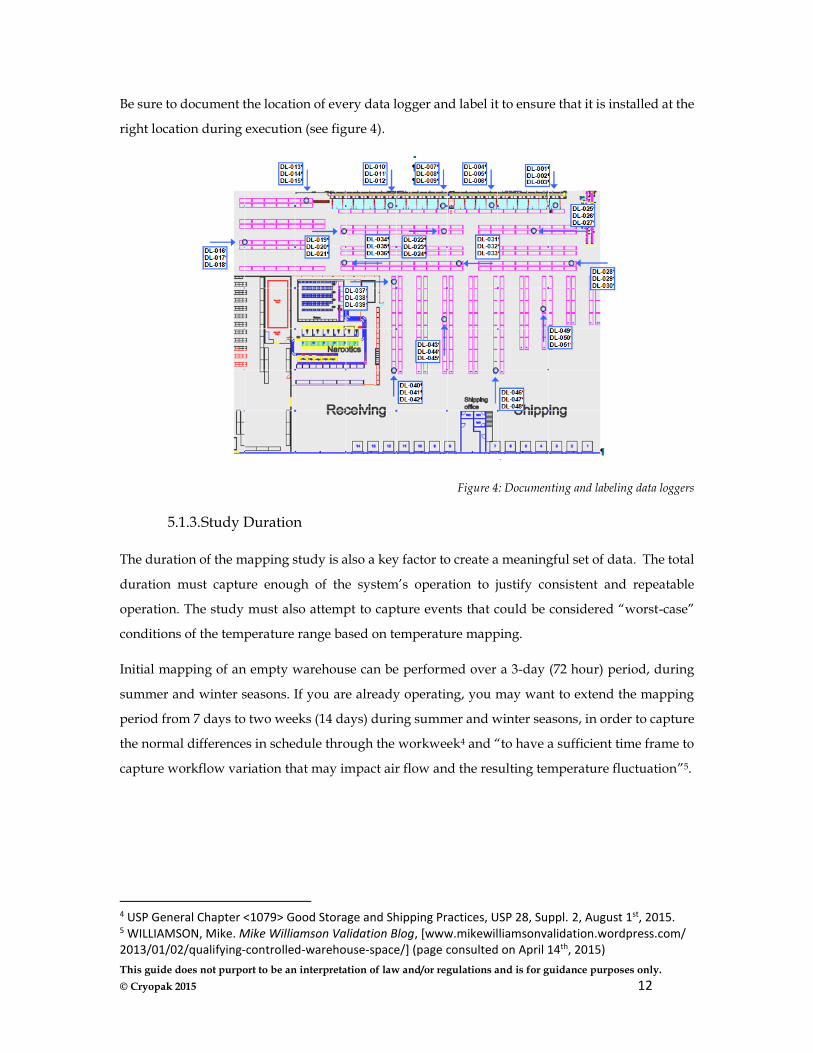
Be sure to document the location of every data logger and label it to ensure that it is installed at the
right location during execution (see figure 4).
Figure 4: Documenting and labeling data loggers
5.1.3. Study Duration
The duration of the mapping study is also a key factor to create a meaningful set of data. The total
duration must capture enough of the system’s operation to justify consistent and repeatable
operation. The study must also attempt to capture events that could be considered “worst-case”
conditions of the temperature range based on temperature mapping.
Initial mapping of an empty warehouse can be performed over a 3-day (72 hour) period, during
summer and winter seasons. If you are already operating, you may want to extend the mapping
period from 7 days to two weeks (14 days) during summer and winter seasons, in order to capture
the normal differences in schedule through the workweek4 and “to have a sufficient time frame to
capture workflow variation that may impact air flow and the resulting temperature fluctuation”5.
4 USP General Chapter <1079> Good Storage and Shipping Practices, USP 28, Suppl. 2, August 1st, 2015. 5 WILLIAMSON, Mike. Mike Williamson Validation Blog, [www.mikewilliamsonvalidation.wordpress.com/ 2013/01/02/qualifying-controlled-warehouse-space/] (page consulted on April 14th, 2015)
This guide does not purport to be an interpretation of law and/or regulations and is for guidance purposes only.
© Cryopak 2015 13
5.1.4. Measuring Range
Storage conditions for pharmaceutical products and materials should be in compliance with the
product labelling, which is based on the results of stability testing storage conditions. All drugs
should be stored according to the conditions described on the label.
Temperature, relative humidity, and ventilation should be appropriate and should not adversely
affect the quality of pharmaceutical products during their manufacture and storage, or the accurate
functioning of equipment. The temperature acceptance limits that will be tested and verified
during the temperature distribution verification must be based on the label specification to prove
that the storage conditions reflects the labelling specifications. In case you have various storage
conditions, you need to test the smallest temperature range. The established acceptance limits will
inform us if there are excursions observed
during the mapping period. “All excursions
outside the labelled storage conditions must be
appropriately investigated and the disposition
of the stock in question must be evidence-
based (technical justification). Corrective
actions (CAPA) should be identified and
implemented following the investigation to
prevent reoccurrence”6.
5.1.5. Testing
The temperature distribution test is performed according to the procedure described in the
protocol, which identifies the steps required to perform and document the study. This test is
designed to allow analysis of temperature distribution inside the warehouse. It will be analyzed
as follows:
Warehouse temperature distribution verification - winter season
Warehouse temperature distribution verification - summer season
The temperature distribution during winter and summer seasons will be verified by conducting a
7-day to 14-day temperature mapping of the loaded warehouse by using a predetermined number
6 HPRA. Guide to Control and Monitoring of Storage and Transportation Temperature Conditions for Medicinal Products and Active Substances, IA-G0011-1 Date 05/10/2011
This guide does not purport to be an interpretation of law and/or regulations and is for guidance purposes only.
© Cryopak 2015 14
of data loggers, which will be positioned as described in the protocol. Refer yourself to the section
5.1.2 Data Loggers Distribution for more details on where to install the data loggers.
The reading interval will be set at 15 minutes for the test. The temperature set point of all
thermostats will be documented. The external warehouse environmental conditions should be
taken into consideration. If these conditions are stable, a shorter length of time might be
appropriate. However, if the conditions are variable, more time might be required.
The temperature mapping should be repeated every 3-4 years. Mapping should also be redone
after any significant modification to the premises, stock layout, or heating system. Heat gain of
goods stored next to sun-facing windows, at high level in poorly insulated stores, or next to heaters,
should be considered.
The temperature distribution verification must be conducted by trained and experienced technical
personnel and must be documented in a scientific manner using an established format. This study
is meant to be representative and to be close to the real use of the warehouse. The temperature
distribution study is to be executed during normal working conditions.
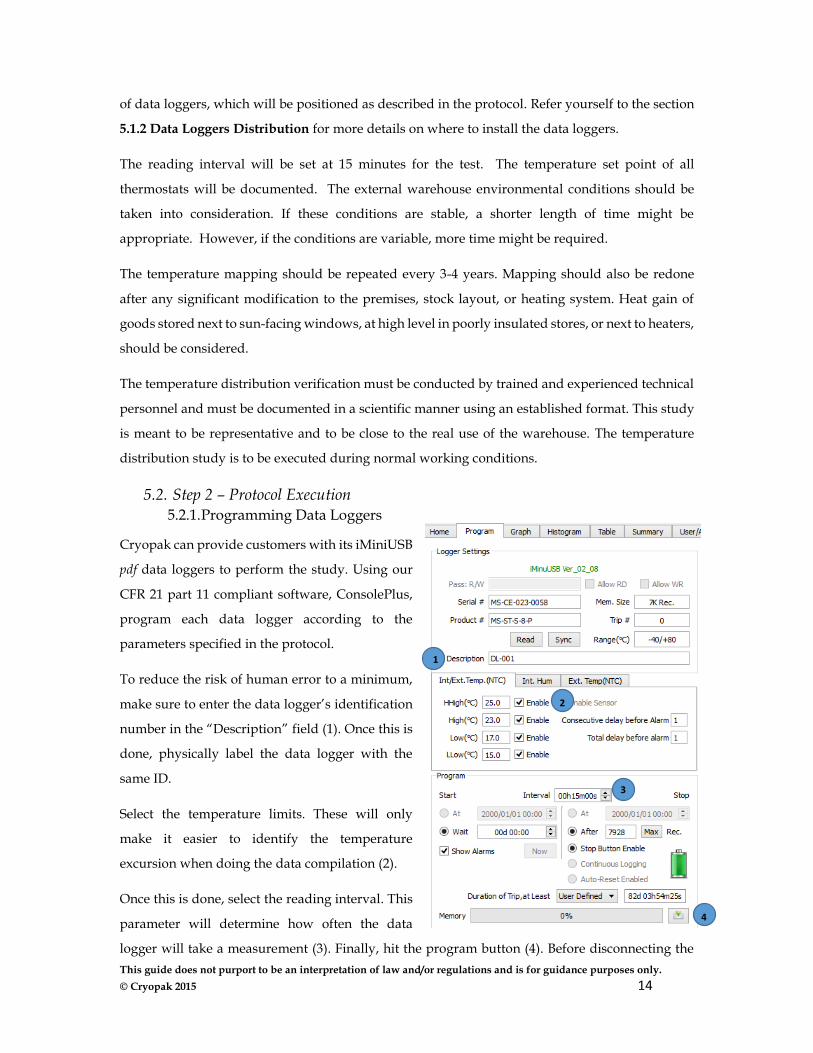
5.2. Step 2 – Protocol Execution 5.2.1. Programming Data Loggers
Cryopak can provide customers with its iMiniUSB
pdf data loggers to perform the study. Using our
CFR 21 part 11 compliant software, ConsolePlus,
program each data logger according to the
parameters specified in the protocol.
To reduce the risk of human error to a minimum,
make sure to enter the data logger’s identification
number in the “Description” field (1). Once this is
done, physically label the data logger with the
same ID.
Select the temperature limits. These will only
make it easier to identify the temperature
excursion when doing the data compilation (2).
Once this is done, select the reading interval. This
parameter will determine how often the data
logger will take a measurement (3). Finally, hit the program button (4). Before disconnecting the
1
2
3
4
This guide does not purport to be an interpretation of law and/or regulations and is for guidance purposes only.
© Cryopak 2015 15
data logger, make sure all the lights blink on the data logger, meaning it was successfully
programmed.
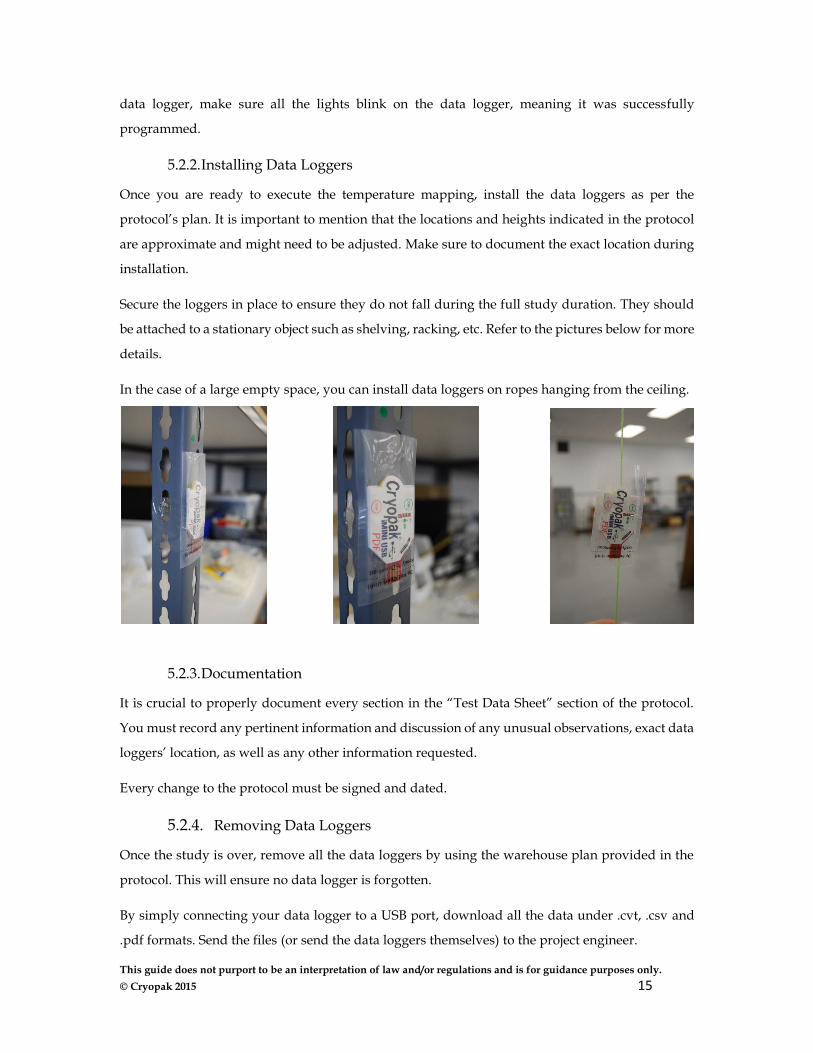
5.2.2. Installing Data Loggers
Once you are ready to execute the temperature mapping, install the data loggers as per the
protocol’s plan. It is important to mention that the locations and heights indicated in the protocol
are approximate and might need to be adjusted. Make sure to document the exact location during
installation.
Secure the loggers in place to ensure they do not fall during the full study duration. They should
be attached to a stationary object such as shelving, racking, etc. Refer to the pictures below for more
details.
In the case of a large empty space, you can install data loggers on ropes hanging from the ceiling.
5.2.3. Documentation
It is crucial to properly document every section in the “Test Data Sheet” section of the protocol.
You must record any pertinent information and discussion of any unusual observations, exact data
loggers’ location, as well as any other information requested.
Every change to the protocol must be signed and dated.
5.2.4. Removing Data Loggers
Once the study is over, remove all the data loggers by using the warehouse plan provided in the
protocol. This will ensure no data logger is forgotten.
By simply connecting your data logger to a USB port, download all the data under .cvt, .csv and
.pdf formats. Send the files (or send the data loggers themselves) to the project engineer.
This guide does not purport to be an interpretation of law and/or regulations and is for guidance purposes only.
© Cryopak 2015 16
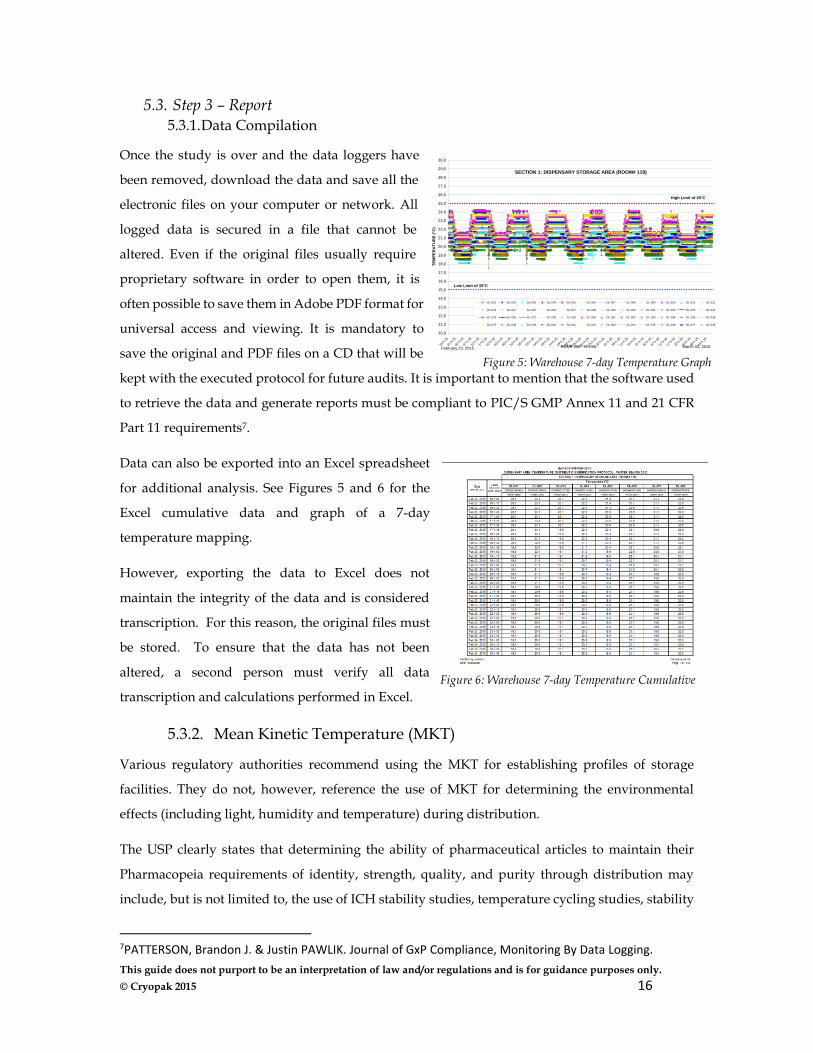
5.3. Step 3 – Report 5.3.1. Data Compilation
Once the study is over and the data loggers have
been removed, download the data and save all the
electronic files on your computer or network. All
logged data is secured in a file that cannot be
altered. Even if the original files usually require
proprietary software in order to open them, it is
often possible to save them in Adobe PDF format for
universal access and viewing. It is mandatory to
save the original and PDF files on a CD that will be
kept with the executed protocol for future audits. It is important to mention that the software used
to retrieve the data and generate reports must be compliant to PIC/S GMP Annex 11 and 21 CFR
Part 11 requirements7.
Data can also be exported into an Excel spreadsheet
for additional analysis. See Figures 5 and 6 for the
Excel cumulative data and graph of a 7-day
temperature mapping.
However, exporting the data to Excel does not
maintain the integrity of the data and is considered
transcription. For this reason, the original files must
be stored. To ensure that the data has not been
altered, a second person must verify all data
transcription and calculations performed in Excel.
5.3.2. Mean Kinetic Temperature (MKT)
Various regulatory authorities recommend using the MKT for establishing profiles of storage
facilities. They do not, however, reference the use of MKT for determining the environmental
effects (including light, humidity and temperature) during distribution.
The USP clearly states that determining the ability of pharmaceutical articles to maintain their
Pharmacopeia requirements of identity, strength, quality, and purity through distribution may
include, but is not limited to, the use of ICH stability studies, temperature cycling studies, stability
7PATTERSON, Brandon J. & Justin PAWLIK. Journal of GxP Compliance, Monitoring By Data Logging.
SECTION 1: DISPENSARY STORAGE AREA (ROOM# 119)
10,0
11,0
12,0
13,0
14,0
15,0
16,0
17,0
18,0
19,0
20,0
21,0
22,0
23,0
24,0
25,0
26,0
27,0
28,0
29,0
30,0
16 h
15
21 h
15
02 h
15
07 h
15
12 h
15
17 h
15
22 h
15
03 h
15
08 h
15
13 h
15
18 h
15
23 h
15
04 h
15
09 h
15
14 h
15
19 h
15
00 h
15
05 h
15
10 h
15
15 h
15
20 h
15
01 h
15
06 h
15
11 h
15
16 h
15
21 h
15
02 h
15
07 h
15
12 h
15
17 h
15
22 h
15
03 h
15
08 h
15
13 h
15
HOUR (GMT -05 h 00)
TE
MP
ER
AT
UR
E (
°C)
DL-001 DL-002 DL-003 DL-004 DL-005 DL-006 DL-007 DL-008 DL-009 DL-010 DL-011 DL-012
DL-013 DL-014 DL-015 DL-016 DL-017 DL-018 DL-019 DL-020 DL-021 DL-022 DL-023 DL-024
DL-025 DL-026 DL-027 DL-028 DL-029 DL-030 DL-031 DL-032 DL-033 DL-034 DL-035 DL-036
DL-037 DL-038 DL-039 DL-040 DL-041 DL-042 DL-043 DL-044 DL-045 DL-046 DL-047 DL-048
Low Limit of 15°C
High Limit of 25°C
March 02, 2015February 23, 2015
Figure 5: Warehouse 7-day Temperature Graph
Figure 6: Warehouse 7-day Temperature Cumulative
This guide does not purport to be an interpretation of law and/or regulations and is for guidance purposes only.
© Cryopak 2015 17
shipping studies, ongoing regulatory stability commitment studies, market experience portfolios
and product labelling commitments.
Nevertheless, a small number of manufacturers, distributers and shippers of temperature sensitive
pharmaceuticals rely solely on MKT calculations to justify their shipping methods and packaging
requirements, thereby sending their products out in unqualified - and possibly inadequate -
packaging, incapable of maintaining recommended storage requirements, and potentially putting
their product at risk. If needed, the MKT is a calculated fixed temperature that simulates the effects
of temperature variations over a period of time. It expresses the cumulative thermal stress
experienced by a product at varying temperatures during storage and distribution.
5.3.3. Calibration and Post-Calibration Requirements
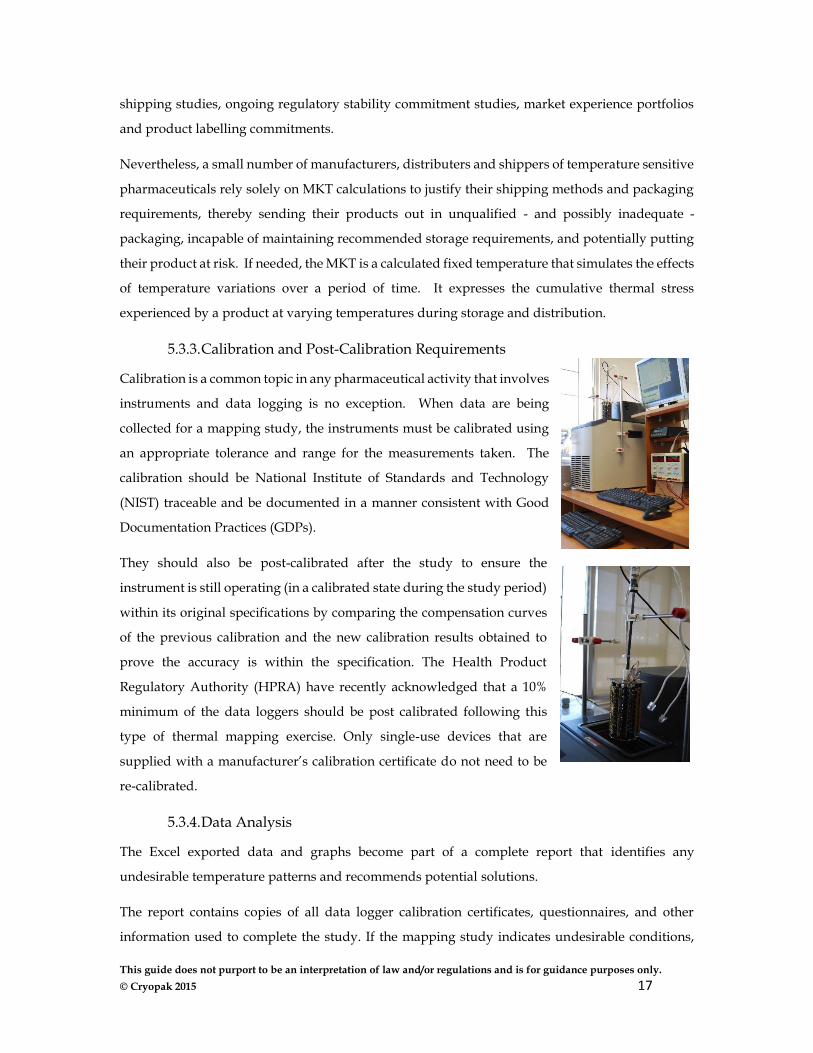
Calibration is a common topic in any pharmaceutical activity that involves
instruments and data logging is no exception. When data are being
collected for a mapping study, the instruments must be calibrated using
an appropriate tolerance and range for the measurements taken. The
calibration should be National Institute of Standards and Technology
(NIST) traceable and be documented in a manner consistent with Good
Documentation Practices (GDPs).
They should also be post-calibrated after the study to ensure the
instrument is still operating (in a calibrated state during the study period)
within its original specifications by comparing the compensation curves
of the previous calibration and the new calibration results obtained to
prove the accuracy is within the specification. The Health Product
Regulatory Authority (HPRA) have recently acknowledged that a 10%
minimum of the data loggers should be post calibrated following this
type of thermal mapping exercise. Only single-use devices that are
supplied with a manufacturer’s calibration certificate do not need to be
re-calibrated.
5.3.4. Data Analysis
The Excel exported data and graphs become part of a complete report that identifies any
undesirable temperature patterns and recommends potential solutions.
The report contains copies of all data logger calibration certificates, questionnaires, and other
information used to complete the study. If the mapping study indicates undesirable conditions,
This guide does not purport to be an interpretation of law and/or regulations and is for guidance purposes only.
© Cryopak 2015 18
facility owners can take a wide range of measures, depending on the problems’ severity. They
include:
Removing products from problem areas (such as hot spots near ceilings);
Changing work practices (such as keeping doors open or closed);
Changing racking or shelving configurations;
Repositioning racks or shelving to improve air circulation;
Changing the location of heating devices;
Installing an air conditioning system;
Improving ventilation;
Installing more or larger-capacity fans;
Adding humidification or dehumidification;
Installing an HVAC control system.
The analysis can also identify the storage area’s hot and cold spots. The purpose of determining
hot and cold spots is to identify the locations where the environmental monitoring system (EMS)
sensors should be installed to record the most vulnerable spots in the storage area and avoid any
temperature excursions that could affect the products. Hot and cold spots need to be determined
seasonally.
Determining hot spots: Any zone of the warehouse where the highest average temperature
was recorded closest to the upper limit.
Determining cold spots: Any zone of the warehouse where the lowest average temperature
was recorded closest to the lower limit.
An attractive option is to install monitoring sensors that communicate continuously with a Part 11
compliant environmental monitoring system (EMS). The EMS can be programmed with alarm set
points to alert service technicians by e-mail, pager or telephone to notify changes in space
conditions before it has any effect on the products.
Real-time monitoring provides an added assurance that space conditions match product storage
specifications. A continuous record can also be valuable in case of regulatory authorities’ inquiry
or audits - all records must be retained for a duration as in accordance with the legal requirements
and be readily retrievable – especially if the monitoring information is combined with the detailed
inventory data pharmaceutical companies already keep. With both kinds of data in hand, a
This guide does not purport to be an interpretation of law and/or regulations and is for guidance purposes only.
© Cryopak 2015 19
company could document the location in which a given pharmaceutical product was stored and
the temperature conditions that existed while it was there.
6. CONCLUSION
Temperature mapping is a valuable exercise. If regulatory requirements clearly explain when a
mapping study has to be done, internal procedures should detail how often this exercise has to be
repeated over the years. Initially, when a Drug Establishment License has to be submitted, all
protocols must be ready for your auditors. Extreme season mappings are in most cases executed
winter and summer. However, in some parts of the world, humidity and other factors should be
taken into consideration.
Even if a company Quality Department is well equipped to perform a mapping project, partnering
with an external company can bring an independent approach. A clear assessment of the client’s
needs, as well as a good knowledge of national and international regulatory are crucial. This first
step will help with the protocol writing. The protocol must be complete and detailed, and clear
about the approach to be taken and how the study will be performed.
Determining the position of loggers within your area to be mapped is essential: it is always better
to have more loggers than less and a scientific rational is always appreciated by all auditors and
quality departments. Different 3D models exist, and the protocol has to explain the rational of
logger placement.
Clients will have to make sure that loggers used with their appropriate software are compliant for
their industry for calibration and also to make sure that it complies with other regulatory
requirements such as CFR Part 11, NIST traceability and validation (Installation, Operational, and
Performance).
Final report conclusions must be clear and identify the pass and fail outcomes of the study. If no
acceptance criteria have been written in the protocol, it will be the customer’s responsibility to take
appropriate actions according to the results obtained.
We strongly recommend that mapping studies be repeated on a regular basis -every 3 or 4 years
to demonstrate to your auditors that you are in control of your cold chain, and that products you
are responsible for are maintained within a proper temperature range.
This guide does not purport to be an interpretation of law and/or regulations and is for guidance purposes only.
© Cryopak 2015 20
7. REFERENCES
PARENTERAL DRUG ASSOCIATION. Technical Report No.64 – Active Temperature Controlled
Systems: Qualification Guidance, PDA, 2013, 58p.
(2013/C 68/01) Good Distribution Practice of Medicinal Products for Human Use
ROBEY, Sarah. Our blog Whichwarehouse, [http://www.whichwarehouse.com/blog/news/tips-
pharma-storage-speciality-warehouse-storage-warehouse-space/] (page consulted on April 14th,
2015)
USP General Chapter <1079> Good Storage and Shipping Practices, USP 28, Suppl. 2, August 1st,
2015.
WILLIAMSON, Mike. Mike Williamson Validation Blog, [www.mikewilliamsonvalidation.wordpress.com/2013/01/02/qualifying-controlled-warehouse-space/] (page consulted on April 14th, 2015) HPRA. Guide to Control and Monitoring of Storage and Transportation Temperature Conditions
for Medicinal Products and Active Substances, IA-G0011-1 Date 05/10/2011
PATTERSON, Brandon J. & Justin PAWLIK. Journal of GxP Compliance, Monitoring By Data
Logging.