Embed Size (px)
Citation preview
REPORT DOCUMENTATION FORMWAlER REsOURCES REsEARCH CENTER
University of Hawaii at Manoa1 SERIES
NUMBER Special Report 10.05:903
1TILE
Urbanization, land-use planning, and groundwater management in central Oahu, Hawaii
4,,''''''1llTDATE'SNO.OF
PAGES
~O.OFTABLES
9GllANf AGENCY
04-C
October 1990
viii + 30
17NO.OF
8 FIGURES 7
Mark A. RidgleyThomas W. Giambelluca
Director's Office
IDENTIFIERS:
110ESCRlPfORS: *urban hydrology, *~undwater management, *urbanization, *land use, groundwaterrecharge, hydrologic budget, multiobjective planning, optimization, simulation,population density, agriculture
"'groundwater sustainability, "'land-use conversion, agricultural land, population limits, OahuGeneral Plan, central Oahu. Hawaii
12ABSTRACT (PURPOSE, METIIOO. RESULTS. CONCLUSIONS)
In the Hawaiian Islands, planners and public officials have decided recently to raise the pennissible levelofurban development in central Oahu. The decision is opposed by many on the grounds that it threatensagricultural land as well as the sustainability ofaquifers. A two-part procedure is presented for exploringthe impact of such development and designing urban-expansion patterns that minimize them. First, awater-balance simulation model is used to calculate groundwater recharge as it varies with land use andlocation within the area. The difference between recharge and withdrawal is computed, and any changesare then estimated for different land uses. Second, this infonnation is incorporated into multiobjectiveprogramming models with objectives related to agricultural land retention, groundwater balance, andresidential population growth. The models generate alternative land-use expansion plans and show thetradeoffs among the objectives. The consideration of slightly suboptimal (dominated) solutions allowsa significant expansion in the range of such alternatives. The results suggest that if future agriculturaldevelopmentdoes notoccuroncurrentlynonagricultural land, thenbothagricultural land and groundwatersustainability will suffer significant adverse effects under the new population limits.
2540 Dole Street· Honolulu, Hawaii 96822· U.S.A.· (808) 956-7847

AUTHORS:
Dr. Mark A. RidgleyAssociate ProfessorDepmttnentofGeographyUniversity of Hawaii at Manoa2424 Maile WayHonolulu, Hawaii 96822Tel.: 808/956-8164
Dr. Thomas W. GiambellucaAssociate ProfessorDepmttnent of GeographyUniversity of Hawaii at Manoa2424 Maile WayHonolulu, Hawaii 96822Tel.: 808/956-7683
URBANIZATION, LAND-USE PLANNING,AND GROUNDWATER MANAGEMENT
IN CENTRAL 0'AHU, HAWAI'I
Mark A. RidgleyThomas W. Giambelluca
Special Report 10.05:90
October 1990
Funded by: Director's Office
WATER RESOURCES RESEARCH CENTERUniversity of Hawaii at Manoa
Honolulu, Hawaii 96822

v
ABSTRACT
In the Hawaiian Islands, planners and public officials have decided recently to raise the
permissible level of urban development in"central O'abu. The decision is opposed by many on
the grounds that it threatens agricultural land as well as the sustainability of aquifers. A two
part procedure is presented for exploring the impact of such development and designing urban
expansion patterns that minimize them. First, a water-balance simulation model is used to
calculate groundwater recharge as it varies with land use and location within the area. The
difference between recharge and withdrawal is computed, and any changes are then estimated
for different land uses. Second, this information is incorporated into multiobjective
programming models with objectives related to agricultural land retention, groundwater
balance, and residential population growth. The models generate alternative land-use expansion
plans and show the tradeoffs among the objectives. The consideration of slightly suboptimal
(dominated) solutions allows a significant expansion in the range of such alternatives. The
results suggest that if future agricultural development does not occur on currently
nonagricultural land, then both agricultural land and groundwater sustainability will suffer
significant adverse effects under the new population limits.

V11
CONTENTS
ABSIRACf . . . . . . . . . . . . . • . . . • . . . • . . . • . . . . . . • . . • . . . . . . . . . . • • . . . . • . . . . v
IN'1'RODUCfION . . . . . . . . . . . . . . . . . . . . . . . . . . . . . . . . . . . . . . . . . . . . . . . . . . . . . 1
REGIONAL HYDROLOGY . . . . . . . . . • • • • • . • • • • • • • • . . • • . • • . • . . . • • . • . . . . . . . 3
Land-Use Impacts on Hydrology ......•...••..•..•.................•...• 3
Net Groundwater Effects of Land-Use Conversion •...••.•...........•.......• 4
PROGRAMMING LAND-USE CHANGES ....••.•...•.•..................... 5
Optimal Land-Use Configurations. . . • . . . . . . . . • • . . . . • . . . . • . . . . • • . . . . . . . . . • 7
Suboptimal Land-Use Configurations .•..............•..•................. 17
Constraining Agricultural Expansion . . . . . . . . . . . . . . . . . . . . . . . . . . . . . . . . . . . . . . 19
CONCLUSIONS. . . . . . . . . . . . . . . . . . . . . . . . . . . . • . • . • . . . . . . . . . . . . . . . . . . . . . 24
REFERENCES CrrED. . . . . . . . . . . . . . . . . . . . . . . . . . . . . . . . . . . . . . . . . . . . . . . . . . 29
Figures
1. Principal Planning Areas and Ko'olau and Wai'anae Ranges,O'ahu, Hawai'i .........................•.......•.................. 2
2. Seven Zones Comprising the Study Area, O'ahu, Hawai'i. . . . . . . . . . . . . . . . . . . . . . . . 5
3. Alternative Patterns of Residential Expansion under Limit of40000 New Residents ...........•.•..•••.•..•......•................ 14
4. Tradeoff Between Agricultural Land Loss and Residential PopulationIncrease, Optimally Distributed, When Net Groundwater RechargeEquals or Exceeds Withdrawal . . . . . . . . . . . . . . . . . . . . . . . . . . . . . . . . . . . . . . . . . . 20
5. Alternative Patterns of Residential Expansion under Limit of40 000 New Residents, Disallowing Agricultural Developmentin Areas of Presently Nonagricultural Use. . . . . . . . . • • • . . . . . . . . . . . . . . . . . . . . . . . 21
6. Tradeoff Between Agricultural Land Loss and Differencebetween Net Groundwater Recharge and Withdrawal,Given Optimal Distribution of 11 500 Additional Residents • . • . . . . . . . . . . . . . . . . . . . . 24
7. Alternative Patterns ofResidential Expansion under FonnerLimit of 11 500 New Residents, Disallowing AgriculturalDevelopment in Areas of Presently Nonagricultural Use •• . . . . . . . . . . . . . . . . • . . . . . . 26
Tables
1. Groundwater Recharge as a Function of Land Use and Zone • . . . . . . . . . . . . . . . . . . • . • 6
2. Water Demand as a Function of Land Use and Zone • . . • • . . . . . • . . . . . . . . . . . . . . . . . 6
3. Land-Use Transitions Considered in Programming Models I-IV 7
4. PayoffTable for Three Objectives . • • • • • • . • • • • • • • . . . . . . . . . . . . . . . . . . . . . . . . . 12

Vlll
5. Groundwater Allocation, Use, and Sustainable Yield in Pearl HarborGroundwater Control Area ..••..•.••....•.....••••.••....•......•..... 12
6. Selected Otaracteristics of Optimal Solution to Model I-A and ofFive Solutions Generated by Model IV. • . • • • . . • • . • . . . • • • • . . • • • . • • . • . . • • • . . . 13
7. Payoffs for Three Objectives When Agricultural Development onCurrently Nonagricultural Land Is Disallowed. • • • . • . • • • • • . • . . . • . . . . . . . • • . • . • . 19
8. Selected Characteristics of Optimal and Suboptimal Solutionsto Model V with New Residential Population Limited to 11 500 • . . . • . . • . . . . . . • . . . . . 25
INTRODUCTION
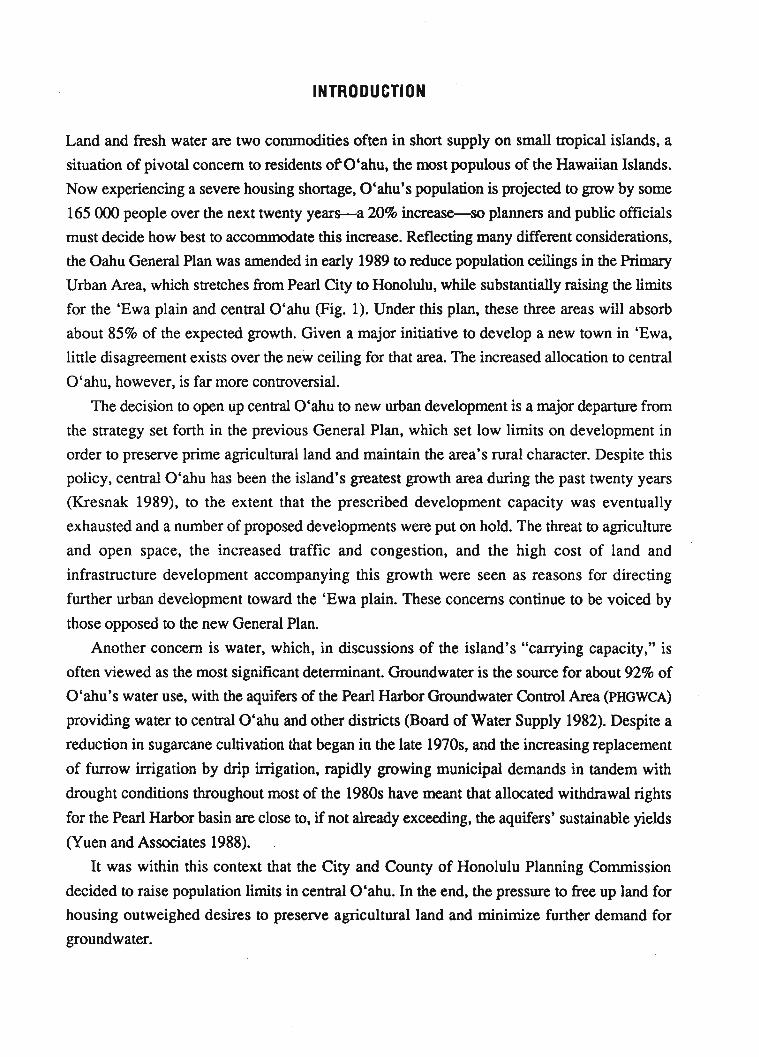
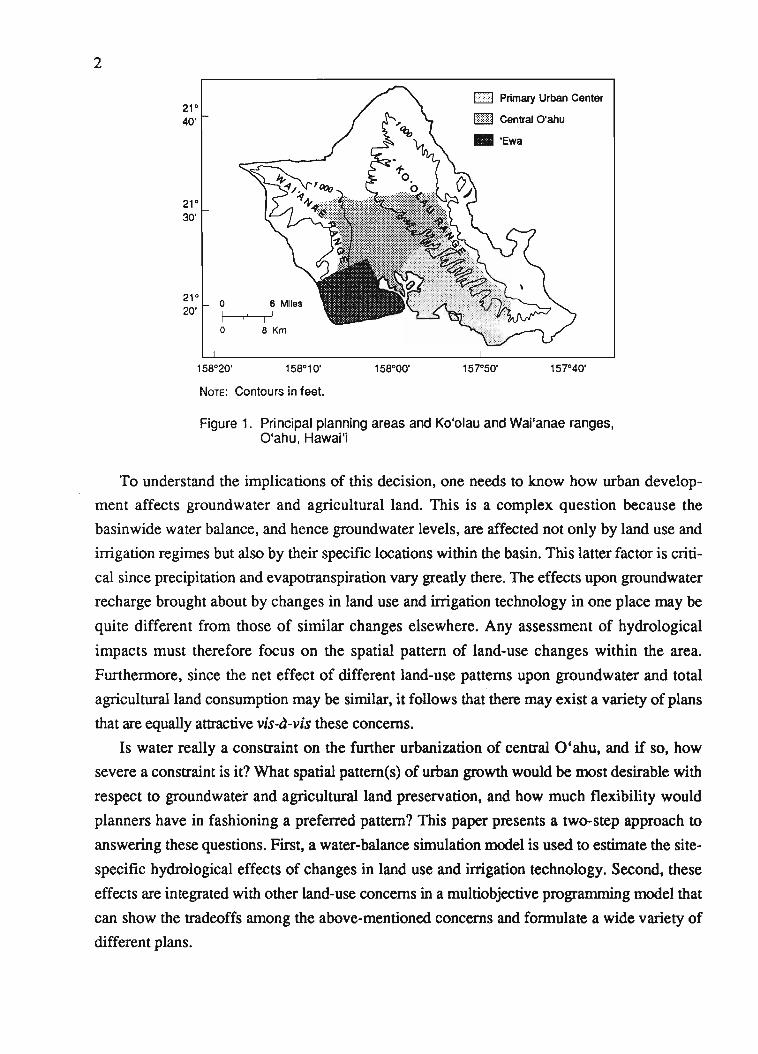
Land and fresh water are two commodities often in short supply on small tropical islands, a
situation of pivotal concern to residents ofO'ahu, the most populous of the Hawaiian Islands.
Now experiencing a severe housing shortage, O'ahu's population is projected to grow by some
165 000 people over the next twenty years-a 20% increase-so planners and public officials
must decide how best to accommodate this increase. Reflecting many different considerations,
the Oahu General Plan was amended in early 1989 to reduce population ceilings in the Primary
Urban Area, which stretches from Pearl City to Honolulu, while substantially raising the limits
for the 'Ewa plain and central O'ahu (Fig. 1). Under this plan, these three areas will absorb
about 85% of the expected growth. Given a major initiative to develop a new town in 'Ewa,
little disagreement exists over the new ceiling for that area. The increased allocation to central
O'ahu, however, is far more controversial.
The decision to open up central O'ahu to new urban development is a major departure from
the strategy set forth in the previous General Plan, which set low limits on development in
order to preserve prime agricultural land and maintain the area's rural character. Despite this
policy, central O'ahu has been the island's greatest growth area during the past twenty years
(Kresnak 1989), to the extent that the prescribed development capacity was eventually
exhausted and a number of proposed developments were put on hold. The threat to agriculture
and open space, the increased traffic and congestion, and the high cost of land and
infrastructure development accompanying this growth were seen as reasons for directing
further urban development toward the 'Ewa plain. These concerns continue to be voiced by
those opposed to the new General Plan.
Another concern is water, which, in discussions of the island's "carrying capacity," is
often viewed as the most significant determinant. Groundwater is the source for about 92% of
O'ahu's water use, with the aquifers of the Pearl Harbor Groundwater Control Area (PHGWCA)
providing water to central O'ahu and other districts (Board of Water Supply 1982). Despite a
reduction in sugarcane cultivation that began in the late 1970s, and the increasing replacement
of furrow irrigation by drip irrigation, rapidly growing municipal demands in tandem with
drought conditions throughout most of the 1980s have meant that allocated withdrawal rights
for the Pearl Harbor basin are close to, if not already exceeding, the aquifers' sustainable yields
(Yuen and Associates 1988).
It was within this context that the City and County of Honolulu Planning Commission
decided to raise population limits in central O'ahu. In the end, the pressure to free up land for
housing outweighed desires to preserve agricultural land and minimize further demand for
groundwater.
2
21°40'
21°30'
21°20'
o 6 Miles
I " I I
o 8 Km
[IT] Primary Urban Center
[ill] Central Q'ahu
.'Ewa
158°10'
NOTE: Contours in feet.
158°00' 157°50' 157°40'
Figure 1. Principal planning areas and Ko'olau and Wai'anae ranges,O'ahu. Hawai'i
To understand the implications of this decision, one needs to know how urban develop
ment affects groundwater and agricultural land. This is a complex question because the
basinwide water balance, and hence groundwater levels, are affected not only by land use and
irrigation regimes but also by their specific locations within the basin. This latter factor is criti
cal since precipitation and evapotranspiration vary greatly there. The effects upon groundwater
recharge brought about by changes in land use and irrigation technology in one place may be
quite different from those of similar changes elsewhere. Any assessment of hydrological
impacts must therefore focus on the spatial pattern of land-use changes within the area.
Furthermore, since the net effect of different land-use patterns upon groundwater and total
agricultural land consumption may be similar. it follows that there may exist a variety of plans
that are equally attractive vised-vis these concerns.
Is water really a constraint on the further urbanization ofcentral O'ahu. and if so, how
severe a constraint is it? What spatial pattern(s) of urban growth would be most desirable with
respect to groundwater and agricultural land preservation. and how much flexibility would
planners have in fashioning a preferred pattern? This paper presents a two-step approach to
answering these questions. First. a water-balance simulation model is used to estimate the site
specific hydrological effects of changes in land use and irrigation technology. Second. these
effects are integrated with other land-use concerns in a multiobjective programming model that
can show the tradeoffs among the above-mentioned concerns and formulate a wide variety of
different plans.
3
REGIONAL HYDROLOGY
Open-ocean rainfall in the vicinity of the Hawaiian Islands is estimated to be approximately
600 rnrn/yr (Elliott and Reed 1984). Because of the orographic and thennal effects of the land,
rainfall on the islands ranges from 250 to 11 000 rnrn/yr, depending on location. Steep
gradients in rainfall coincide with persistent orographic clouds anchored to topographic
barriers. Solar radiation, temperature, and evaporation also exhibit high spatial variability
related to topographic relief. On O'abu, high rainfall and low evaporation along the Ko'olau
mountain crest produce a substantial water surplus, most of which percolates through the
porous soil and rock and recharges underlying aquifers. Leeward of the Ko'olaus, rainfall
diminishes rapidly. The rates of the resulting natural recharge within the Pearl Harbor basin
range from more than 4 000 rnrn/yr along the Ko'olau crest at the northeast corner of the basin
to less than 100 mm/yr along the leeward coastline (Giambelluca 1986).
Land-Use Impacts on Hydrology
Agricultural and urban land uses in the Pearl Harbor basin greatly affect recharge rates by
altering runoff and evaporation and by adding irrigation. Furrow irrigation was the dominant
technology in sugarcane cultivation until the late 1970s, when most fields in the basin were
c&nverted to drip-irrigation systems. In furrow irrigation, applied water typically reached 3 m
a~nually. The conversion to drip irrigation increased the amount of water used by the crop
while reducing both irrigation requirements and recharge rate. King (1988) found that
conversion to drip irrigation increased sugarcane evapotranspiration by an average of 18% and
reduced recharge by 55%. For the two plantations studied, water used for irrigation decreased
by an average of 32%.
The pineapple crop in Hawai'i has a much lower water requirement than sugarcane. Ekern
(1965) showed that under optimal conditions, a pineapple crop uses an average of about 20%
the amount of water that a sugarcane crop uses. As a result, groundwater recharge is enhanced
under pineapple cultivation. Until the recent introduction of drip irrigation in some fields, very
little irrigation was applied; drip-irrigated pineapple fields now receive about
300 rnrn/yr.
The most obvious effect of urbanization on the water balance is the increase in surface
runoff. Medium-density residential land in central O'ahu (precipitation of 1 000 rnrn/yr) was
estimated to produce about 2.6 times the runoff of undeveloped land (Giambelluca 1986),
while high-density urbanization produced 4.2 times the undeveloped land runoff. Substantial
amounts of irrigation are applied as residential lawn watering and golf-course sprinkling.
4
Paved surfaces reduce the evaporative surface area and tend to focus rainfall into smaller areas.
The result is that urbanization may either decrease or (as in the drier areas of O'ahu) increase
groundwater recharge. Model results for central O'ahu indicate that reduction of evaporation
generally exceeds the increase in surface runoff, so that recharge is greater for urbanized
surfaces than for undeveloped surfaces, and recharge generally increases with the level of
urbanization (Giambelluca 1986).
Net Groundwater Effects 01 Land-Use Conversions
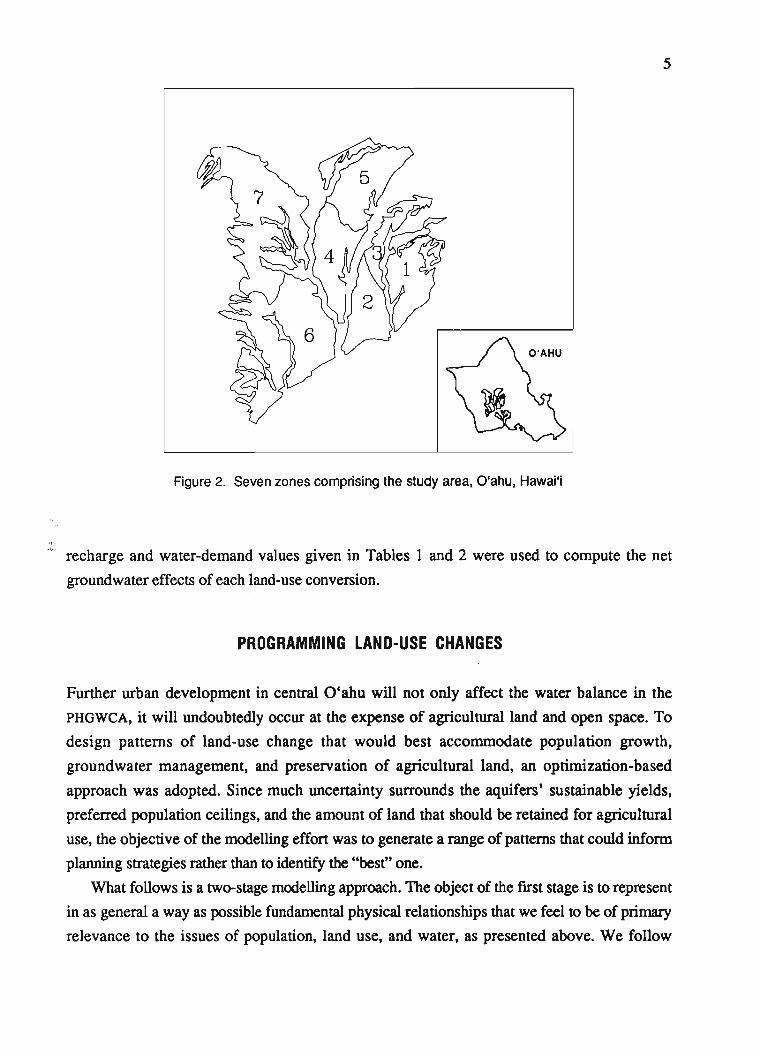
For the purposes of this study, a portion of the Pearl Harbor basin was selected and sulxlivided
into seven zones (Fig. 2). The study area was one in which agricultural land uses, principally
sugarcane and pineapple cultivation, are rapidly giving way to urbanization.
The regional subdivision for this study was done on the basis of natural landscape
divisions: steep-sided stream gulches separating relatively flat land fit for cultivation or urban
development. Other boundaries were imposed on the basis of current land use and climate. For
these seven zones, the net impacts on groundwater availability of possible land-use
conversions were estimated by calculating approximate groundwater recharge and water use
associated with each land use and zone.
Groundwater recharge was estimated for nine land-use categories and seven regional
subdivisions using a water-balance simulation model. The model was a variant of the
Thomthwaite procedure (Thomthwaite and Mather 1955), as modified by Giambelluca (1986).
In the model, inputs into the soil-plant system, precipitation, and irrigation were monitored.
Runoff was estimated from stream-flow data and from values derived using the U.S. Soil
Conservation Service (1972) runoff-curve-number method. Evapotranspiration and recharge
were determined on the basis of potential evapotranspiration and the model's running estimate
of soil water content. Precipitation was determined using measurements from a dense network
of gages. Irrigation for various agricultural and urban land uses was estimated from a variety of
information sources, including plantation irrigation records, water-use data, and personal
communication. For urban uses, a single rate was assigned to each land use. For furrow- and
drip-irrigated sugarcane, spatial variation in irrigation was recognized. The water-balance
simulation was run using a historical, 30-yr climate record. Separate runs were made of each
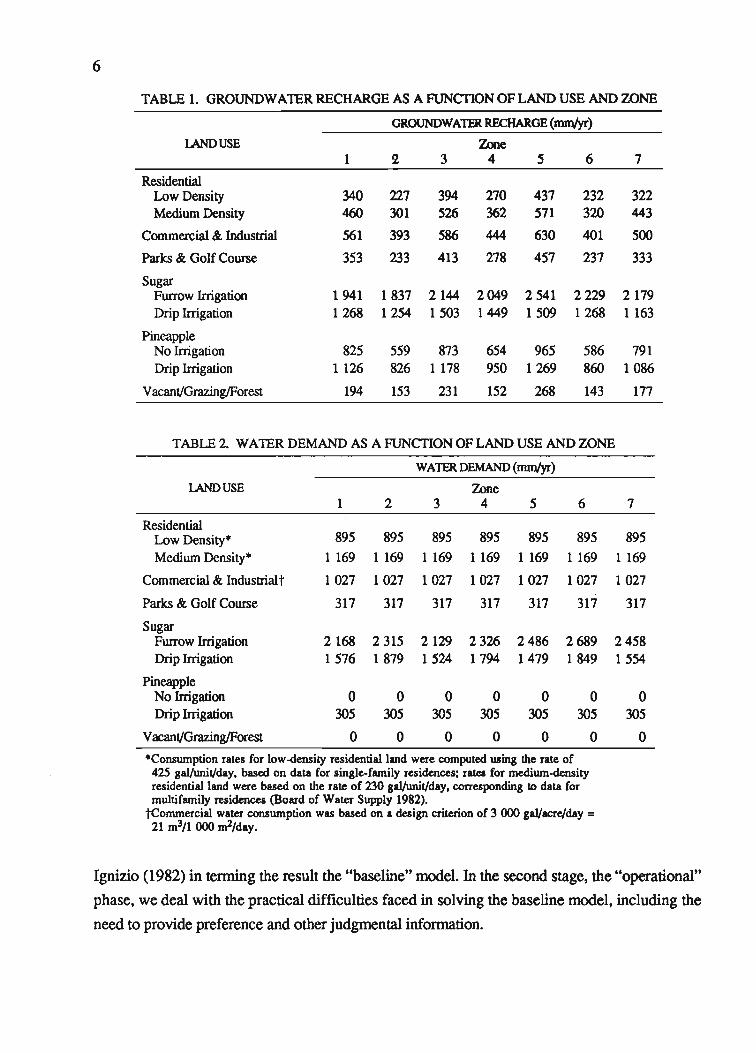
zone and land-use type. Simulated groundwater recharge rates for each land use and zone are
given in Table 1.
Each of the major land-use types found in central O'ahu has an associated water demand.
Based on irrigation estimates and residential and commercial water-use figures, water demand
associated with each land use and zone was estimated for this study (Table 2). Groundwater-
5
Figure 2. Seven zones comprising the study area, O'ahu, Hawai'i
.,: recharge and water-demand values given in Tables 1 and 2 were used to compute the net
groundwater effects of each land-use conversion.
PROGRAMMING LAND-USE CHANGES
Further urban development in central O'ahu will not only affect the water balance in the
PHGWCA, it will undoubtedly occur at the expense of agricultural land and open space. To
design patterns of land-use change that would best accommodate population growth,
groundwater management, and preservation of agricultural land, an optimization-based
approach was adopted. Since much uncertainty surrounds the aquifers' sustainable yields,
preferred population ceilings, and the amount of land that should be retained for agricultural
use, the objective of the modelling effort was to generate a range of patterns that could inform
planning strategies rather than to identify the "best" one.
What follows is a two-stage modelling approach. The object of the first stage is to represent
in as general a way as possible fundamental physical relationships that we feel to be of primary
relevance to the issues of population, land use, and water, as presented above. We follow
6
TABLE 1. GROUNDWATER RECHARGE AS A FUNCTION OF LAND USE AND ZONE
GROUNDWATER. RECHARGE (mmIyr)
LAND USE Zone1 2 3 4 5 6 7
ResidentialLow Density 340 '127 394 270 437 232 322Medium Density 460 301 526 362 571 320 443
Commercial &: Industrial 561 393 586 444 630 401 500
Parks &: Golf Course 353 233 413 278 457 237 333
SugarFurrow Irrigation 1941 1837 2144 2049 2541 2229 2179Drip Irrigation 1268 1254 1503 1449 1509 1268 1163
PineappleNo Irrigation 825 559 873 654 965 586 791Drip Irrigation 1126 826 1 178 950 1269 860 1086
Vacant/Grazing/Forest 194 153 231 152 268 143 177
TABLE 2. WATER DEMAND AS A FUNCTION OF LAND USE AND ZONE
WATER. DEMAND (mmIyr)
LAND USE Zone1 2 3 4 5 6 7
ResidentialLow Density· 895 895 895 895 895 895 895Medium Density· 1 169 1169 1 169 1169 1169 1169 1 169
Commercial &: Industrialt 1027 1027 1027 1027 1027 1027 1027
Parks &: Golf Course 317 317 317 317 317 317 317
SugarFurrow Irrigation 2168 2315 2129 2326 2486 2689 2458Drip Irrigation 1576 1879 1524 1794 1479 1849 1554
PineappleNo Irrigation 0 0 0 0 0 0 0Drip Irrigation 305 305 305 305 305 305 305
Vacant/Grazing/Forest 0 0 0 0 0 0 0
·Consurnption rates for low~ensity residential land were computed using the rate of425 gal/unil/day, based on data for single-family residences; r&tea for medium~ityresidential land were based on the rate of 230 gal/unit/day, corresponding to data formultifamily residences (Board of Water Supply 1982).
tCommercial water consumption was based on a design criterion of 3 000 gal/acre/day =21 m3/1 000 m2/day.
Ignizio (1982) in tenning the result the "baseline" model. In the second stage, the "operational"
phase, we deal with the practical difficulties faced in solving the baseline model, including the
need to provide preference and other judgmental infonnation.
7
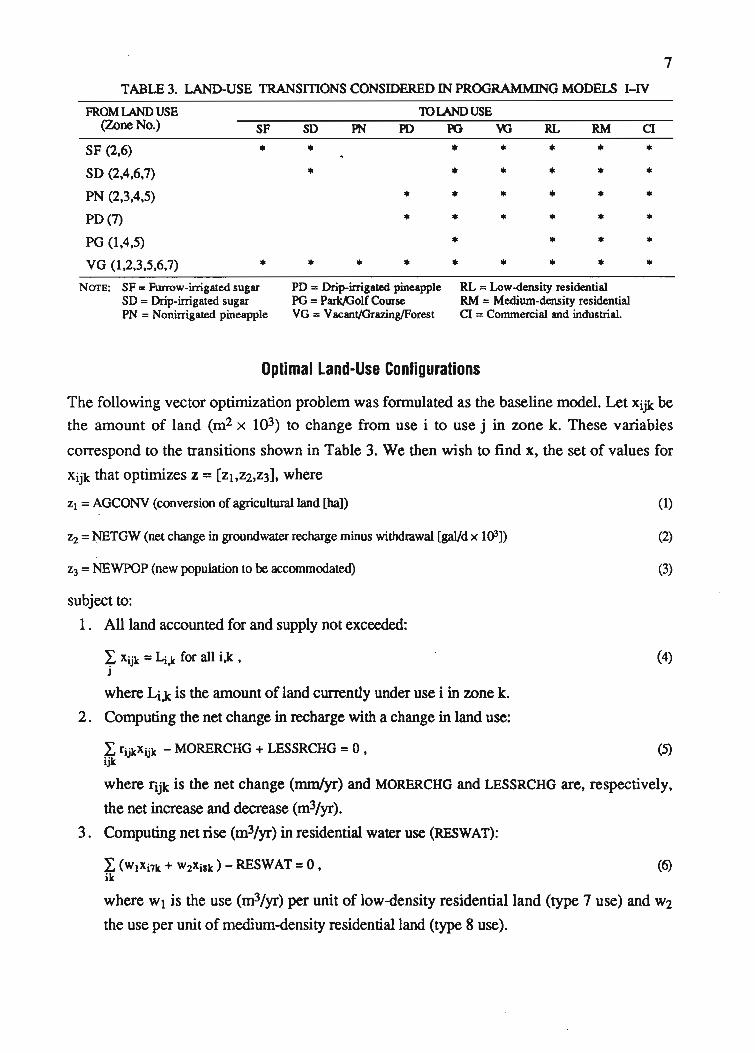
TABLE 3. LAND-USE TRANSmONS CONSIDERED IN PROORAMMING MODELS I-IV
FROM lAND USE ID lAND USE(Zone No.) SF SO PN PO PO VG RL RM CI
SF (2.6) • • • • • • •SO (2.4.6.7) • • • • • •PN (2.3.4,5) • • • • • •PD(7) • • • • • •PG (1.4,5) • • • •VG (1.2,3.5.6.7) • • • • • • • • •
NOTE: SF =Furrow-irrigated sugar PO =Drip-irrigated pineapple RL =Low-density residentialSO =Drip-irrigated sugar PO =ParklGolf Course RM = Medium-density residentialPN = Nonirrigated pineapple VO = Vacant/Grazing/Forest CI = Commercial and industrial.
Optimal Land-Use Configurations
The following vector optimization problem was formulated as the baseline model. Let Xijk be
the amount of land (m2 x 103) to change from use i to use j in zone k. These variables
correspond to the transitions shown in Table 3. We then wish to find x. the set of values for
Xijk that optimizes z = [ZI,Z2,Z3], where
Zl = AGCONV (conversion of agricultural land [ha])
Zz = ~TGW (net change in groundwater recharge minus withdrawal [gal/d x 1()3J)
Z3 =NEWPOP (new population to be accommodated)
subject to:
1. All land accounted for and supply not exceeded:
(1)
(2)
(3)
(4)~ Xijk =4,lc for all i,k •J
where Li,k is the amount of land currently under use i in zone k.
2. Computing the net change in recharge with a change in land use:
:L rijkXijk - MORERCHG + LESSRCHG =0 , (5)ijk
where rijk is the net change (mm/yr) and MORERCHG and LESSRCHG are, respectively,
the net increase and decrease (m3/yr).
3. Computing net rise (m3/yr) in residential water use (RESWAT):
:L (WIXi7k + WZXi8k) - RESWAT =O.ik
(6)
where WI is the use (m3/yr) per unit of low-density residential land (type 7 use) and W2
the use per unit of medium-density residential land (type 8 use).
8
4. Computing net rise (rri3/yr) in commercial water use (COMWAT):
L CXi9k - COMWAT =0 •ik
(1)
(9)
where c is the use (rri31yr) per unit of ne~ commercial land (type 9 use).
5. Computing net change in irrigation (m3/yr):
L tijkXijk - MOREIRR + LESSIRR =0 • (8)ijk
where tijk is the net change (mm/yr) per unit of land change ijk, and MOREIRR and
LESSIRR the cumulative net increase and decrease in irrigation (m3/yr), respectively.
6. Computing total net change (gaVd x 1()3) in groundwater recharge minus withdrawal
(NETGW):
[(0.724)(MORERCHG + LESSIRR - LESSRCHG - MOREIRR -
COMWAT - RESWAT)] - 1 000 NETGW =0 .
7. Calculating conversion of agricultural land (AGCONV):
L Xijk - 10 AGCONV =0 •ijk
where i is an agricultural use, j nonagricultural.
8. Calculating total population increase (NEWPOP):
L (Plxi7k + P2xisk) - NEWPOP =0,ik
(10)
(11)
where PI and P2 are, respectively, the average number of people per unit of low-density
and medium-density residential land.
9. Calculating the amount (ha) of new commercial and industrial land (COMLAND):
L Xijk - 10 COMLAND =0 • (12)ijk
where i is noncommercial land and j commercial.
10. Calculating the amount (ha) (LANDRL) and medium-density (LANDRM) residential land:
L Xi7k - 10 LANDRL =0ik
L xi8k - 10 LANDRM =0 .ik
(13)
(14)
11. Calculating additional commercial and industrial land required to accompany residential
development:
COMLAND - ml LANDRL - m2 LANDRM ~ 0 ,
where ml and m2 represent multiplier effects.
(15)
9
Reliable data on multiplier effects were not available when this study was done. Further,
given patterns of commuting and shopping, one cannot say where such commercial land would
naturally be developed (i.e., if no locational constraints were operating) in response to
additional residential land development. This makes problematic the computation of such
multipliers for particular subareas of O'abu. In addition, the number of additional residents
most likely must cross some minimum threshold before additional commercial land
development is triggered.
Despite these problems, possible multiplier effects must be addressed and incorporated in
such a model. One solution was to use plausible values exhibited in empirical cases: based on
the then-proposed Waiawa development, we let mt and m2 equal 0.1 and 0.2, respectively. We
noted in doing so that locational constraints are abundant and severe, many deriving from
zoning and other planning regulations, and that insofar as such regulations require certain
percentages of commercial land to accompany new residential development, they reflect or are
informed by multiplier effects believed to be operative. For simplicity, as well as for lack of
data, we chose to ignore threshold effects. This allowed the entire model to remain linear.
However, it is easy and straightforward to represent minimal thresholds by using a binary
variable in the manner employed to model constraints on minimum batch size (e.g., see
Wagner 1975). Similarly, other values could be used as desired.
This baseline model is a multiobjective land-allocation model that differs from baseline
single-objective models in important ways. Most obviously, it assumes that people judge the
attractiveness of a given land-use pattern along various dimensions, with no single one able to
supplant or represent all others. In the case at hand, this means that, for at least some people,
knowing the effect upon water of a particular land-use change will not by itself enable an
adequate appraisal of that change; information on the consequences for population
accommodation and agricultural land use would also matter. In contrast, single-objective
models assume that people would happily base their appraisals on only a single criterion.
Consequently, the builders of such models must decide the criterion to optimize. That decision
may be made by (1) selecting, with varying degrees of arbitrariness, one criterion from those
that have been proposed; (2) formulating or selecting a criterion that reflects a particular theory
or normative principle, such as the net economic benefits criterion often favored by economists;
or (3) using a criterion that reflects the preferences of a given decision maker, analyst, or other
party interested in the issue. In all cases, the other candidate objectives are treated as
constraints, merely monitored as state (accounting) variables, or ignored altogether.
Common examples of the single-objective approach are models that strive to maximize
some measure of output, such as production or revenue, subject to availability of resources,
two of which may be land and water. In such representations, resources are considered to be
10
only means to an end; they have no value other than that of their contribution to the maximal
attainment of the (single) objective. As such, there is no acceptable tradeoff between resources
conserved and the further attainment of the objective; there is no limit to the amount of
resources used to achieve an additional unit of output.
The distinction between multiobjective and single-objective philosophies can also apPear in
the operational model. (Of course, where the baseline model is single-objective, the operational
one will be too, and the baseline-operational distinction disappears altogether. This is
invariably true in conventional linear programming, but exceptions may occur in nonlinear,
integer, and combinatorial programming, where analytical or computational challenges can
often be confronted in a variety of tactical ways.) The conflicts between the objectives in the
multiobjective case can be dealt with operationally in two principal ways. One approach is to
construct a multidimensional function that incorporates all the relevant criteria as well as the
relative preference for, or importance of, each one. Such a function is often called a
(multiattribute) utility or value function, the construction and properties of which are based on
utility or value theory (Keeney and Raiffa 1976; von Winterfeldt and Edwards 1986). Other
approaches reflect the view that such a: function is in practice difficult and time-consuming to
formulate (Saaty 1990), may not be unique, and may not even exist for a single person (e.g.,
the decision maker), let alone for a group (Zeleny 1982). In this second set of approaches,
various tacks are available (Cohon 1978; Steuer 1986). Three common ones are: (1) setting
targets for each objective and minimizing the deviation from them; (2) optimizing one objective
while relegating the others to the constraint set; and (3) optimizing the weighted sum of the
objectives. Although this last method also involves constructing a superobjective, it differs
from the utility-function approach in that the weighted-sum objective is used only to generate
nondominated candidate solutions and is not postulated to represent the overall utility
(attractiveness) of any particular one. In a similar spirit, the second method treats objectives as
constraints also for the purpose of generating nondominated solutions; in so doing, it is not
subordinating those objectives to the one appearing in the criterion function.
The approach taken here is multiobjective in both the baseline and the operational models. It
seems clear that none of the three concerns identified above clearly and unequivocally
dominates the others. Nor does it appear that one can use any normative theory to formulate a
single criterion function that would accurately reflect society's preferences regarding these three
issues. For example, given the poor data presently available and the known deficiencies of
prices as measures of public preference as well as of resource scarcity (Nijkamp 1977; Pearce
and Turner 1990), an economic production function would be a poor choice for such a single
objective function; likewise, the construction of a utility function begs the question of whose
utility is being represented and inevitably leads to the analytically awesome (if at all possible)
11
and pragmatically impossible task of building a group utility function. Finally, the multiple
stakeholder nature of public planning, and the negotiation and bargaining that arise out of it,
suggest clearly the hazards of selecting a single-objective function on the basis of a single
party's (e.g., the analyst's) interest~venassuming that such a party has but one interest.
MODEll. Two factors were important in developing an operational model of equations (1)
to (15). First, the relative importance of each objective could not be determined apriori due to
the highly politicized nature of land development on O'ahu and the uncertainty of the levels at
which the three objectives might be attained. Second, notwithstanding this uncertainty, it was
clear that the problem was neither to maximize nor minimize Z2 (NETGW) or Z3 (NEWPOP), but
rather to aim for desirable, and yet unknown, targets; minimization would only make sense
with respect to Zl (AGCONV). In conjunction with the need to identify a variety of land-use
patterns, these considerations suggested a generating approach, where Z2 and Z3 would be
constrained to meet certain minimum values. Thus, the baseline model became Model I:
min Zl =AGCONV (1-1)
S.t.
~ NETGW~L2 (1-2)
Z:3 NEWPOP~y (1-3)
x E F. (1-4)r_'·.·,
wh.~!e (1-4) simply denotes the feasibility constraint set (eqq. [4]-[15]).
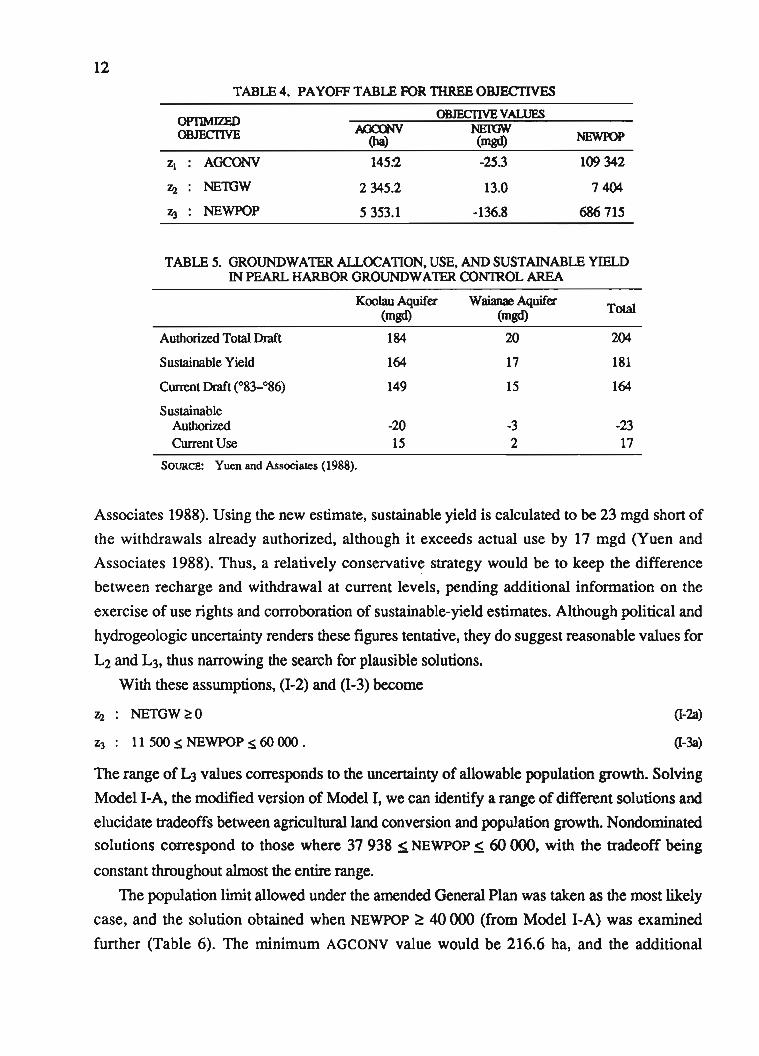
As a ftrst step, a payoff table (Table 4) was developed to give an idea of the range of values
each objective could attain. The table suggests that satisfactory levels of AGCONV and NEWPOP
might well be attainable without lowering groundwater heads signiftcantly; indeed, it would
seem possible even to augment groundwater storage.
Systematically varying the values of~ and~ over the ranges shown in their respective
columns of the payoff table (Table 4) will generate a variety of solutions to Model I. When Z2
and Z3 are binding, the solutions will be nondominated (Cohon 1978). Many values within
these ranges, however, would be unrealistic vis-a-vis the planning problem, so information in
the General Plan and other sources was used to narrow the range of values and thus identify
plausible solutions.
Two pieces of information were particularly pertinent. First, the Oahu General Plan was
recently revised to allow a population increase of 41 ()()() people in the central O'ahu planning
district (Kresnak 1989), markedly greater than the previous allowable increase of 11 500. With
frequent and vociferous cries to maintain the original ceiling, the amendment still faces
considerable opposition. Second, a recent reappraisal of the PHGWCA's sustainable yield
(Table 5) resulted in a reduction from its 1985 level of 208 mgd to 181 mgd (Yuen and
12
TABLE 4. PAYOFF TABLE FOR THREE OBJECTIVES
0PI1MIZEDOBJECITVE
Zl AGCONV
7J2 NElGW
Z) NEWPOP
145:2
2345.2
5353.1
0BJECI1VE VALUESNErGW(mgd)
-25.3
13.0
-136.8
NEWPOP
109 342
7404
686 715
TABLE 5. GROUNDWATER ALLOCATION. USE. AND SUSTAINABLE YIELDIN PEARL HARBOR GROUNDWATER CONlROL AREA
Authorized Total Draft
Sustainable Yield
Current Draft (083-°86)
Koolau Aquifer Waianae Aquifer(mgd) (mgd)
184 20
164 17
149 15
Total
204
181
164
SustainableAuthorizedCurrent Use
-2015
-32
-2317
SOURCE: Yuen and Associates (1988).
Associates 1988). Using the new estimate, sustainable yield is calculated to be 23 mgd short of
the withdrawals already authorized. although it exceeds actual use by 17 mgd (Yuen and
Associates 1988). Thus. a relatively conservative strategy would be to keep the difference
between recharge and withdrawal at current levels. pending additional information on the
exercise of use rights and corroboration of sustainable-yield estimates. Although political and
hydrogeologic uncertainty renders these figures tentative, they do suggest reasonable values for
L2 and L3' thus narrowing the search for plausible solutions.
With these assumptions, (1-2) and (1-3) become
7J2 NETGW ~o
Z3 11 500 ~ NEWPOP ~ 60 000 .
(I-2a)
(I-3a)
The range of L3 values corresponds to the uncertainty of allowable population growth. Solving
Model I-A, the modified version of Model I, we can identify a range of different solutions and
elucidate tradeoffs between agricultural land conversion and population growth. Nondominated
solutions correspond to those where 37 938 So NEWPOP So 60 000, with the tradeoff being
constant throughout almost the entire range.
The population limit allowed under the amended General Plan was taken as the most likely
case, and the solution obtained when NEWPOP ~ 40 ()()() (from Model I-A) was examined
further (Table 6). The minimum AGCONV value would be 216.6 ha, and the additional
13
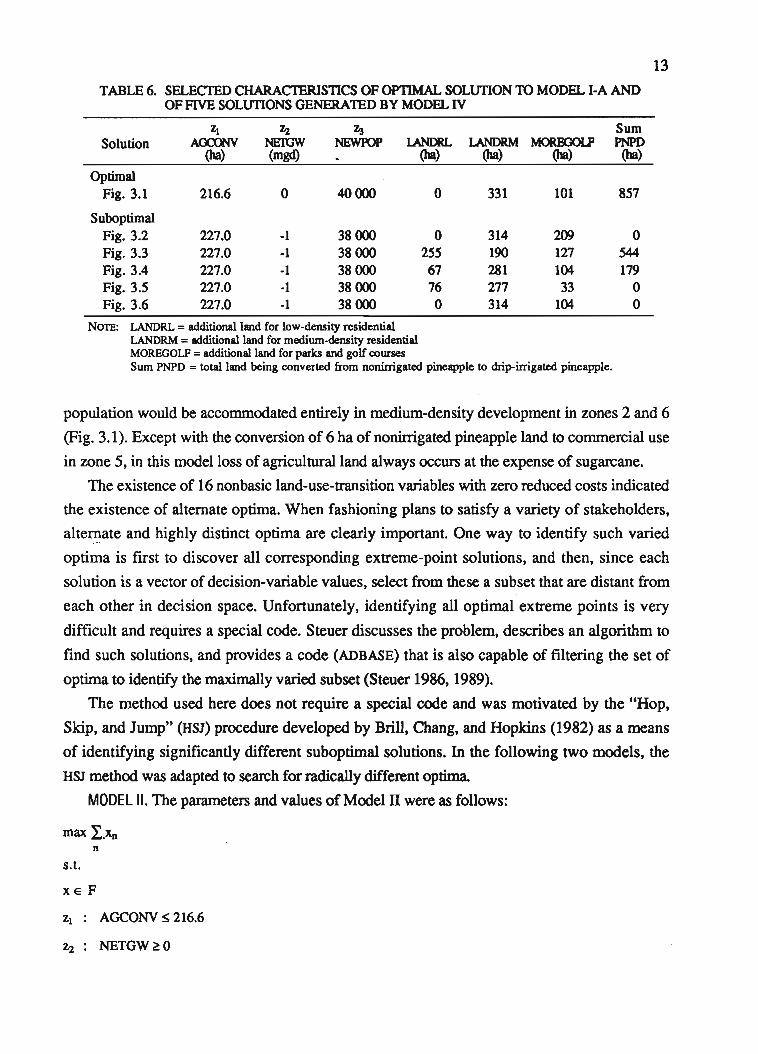
TABLE 6. SELECTED CHARACTERISTICS OF OPTIMAL SOLUflON TO MODEL I-A ANDOF FIVE SOLUflONS GENERAlED BY MODEL IV
Zt ~ z" SumSolution AOC£N{ NETGW NEWPOP l.ANDRL LANDRM MORF.OOI..P PNPD
(ha) (mgd) (ha) (ha) (ha) (ha)
OptimalFig. 3.1 216.6 0 40000 0 331 101 857
SuboptimalFig. 3.2 227.0 -1 38000 0 314 209 0Fig. 3.3 227.0 -1 38000 255 190 127 S44Fig. 3.4 227.0 -1 38000 67 281 104 179Fig. 3.5 227.0 -I 38000 76 277 33 0Fig. 3.6 227.0 -1 38000 0 314 104 0
NOTE: LANDRL = additional land for low-density residentialLANDRM = additional land for medium-density residentialMOREGOLF = additional land for parks and golf coursesSum PNPD = total land being converted from nonirrigated pineapple to drip-irrigated pineapple.
population would be accommodated entirely in medium-density development in zones 2 and 6
(Fig. 3.1). Except with the conversion of 6 ha of noninigated pineapple land to commercial use
in zone 5, in this model loss of agricultural land always occurs at the expense of sugarcane.
The existence of 16 nonbasic land-use-transition variables with zero reduced costs indicated
the existence of alternate optima. When fashioning plans to satisfy a variety of stakeholders,
alte£1ate and highly distinct optima are clearly important. One way to identify such varied
optima is fIrst to discover all corresponding extreme-point solutions, and then, since each
solution is a vector of decision-variable values, select from these a subset that are distant from
each other in decision space. Unfortunately, identifying all optimal extreme points is very
diffIcult and requires a special code. Steuer discusses the problem, describes an algorithm to
fInd such solutions, and provides a code (ADBASE) that is also capable of flltering the set of
optima to identify the maximally varied subset (Steuer 1986, 1989).
The method used here does not require a special code and was motivated by the "Hop,
Skip, and Jump" (HSJ) procedure developed by Brill, Chang, and Hopkins (1982) as a means
of identifying signifIcantly different suboptimal solutions. In the following two models, the
HSJ method was adapted to search for radically different optima
MODEl II. The parameters and values of Model IT were as follows:
n
S.t.
x e F
Zt AGCONV ~ 216.6
Z2 NETGW~O
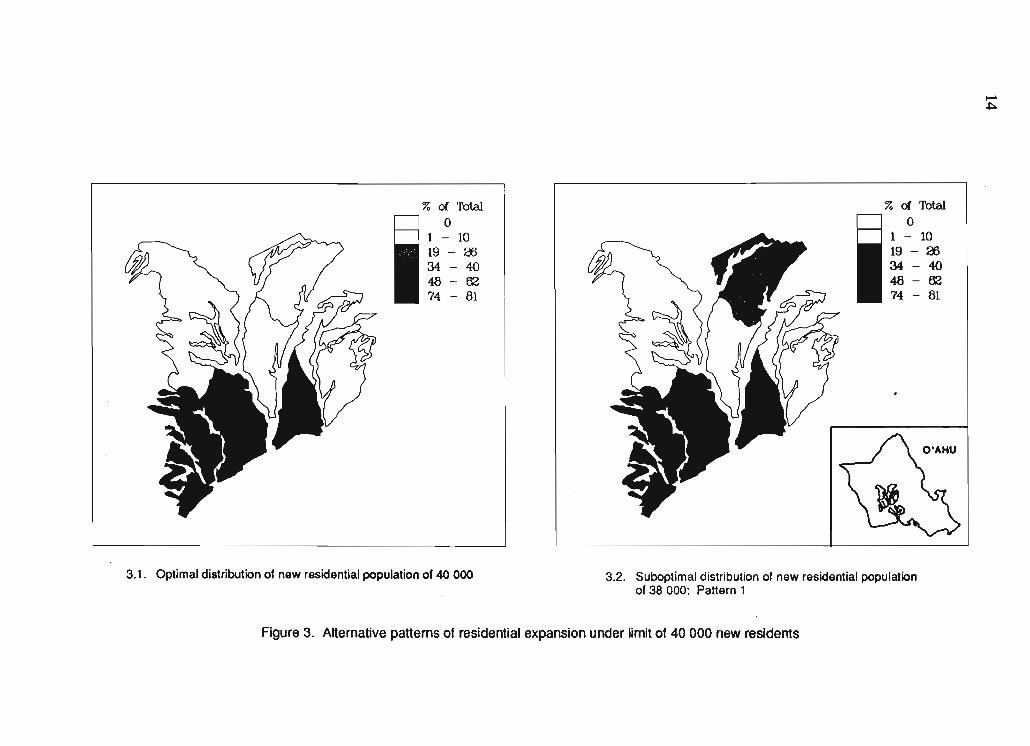
% of Totalo
1 - 1019 - a:;34-4048-~
74 - 81
% of Totalo
1 - 1019 - a:;34-4048-~
74 - 81
-~
3.1. Optimal distribution of new residential population of 40 000 3.2. Suboptimal distribution of new residential populationof 38 000: Pattern 1
Figure 3. Alternative patterns of residential expansion under limit of 40 000 new residents
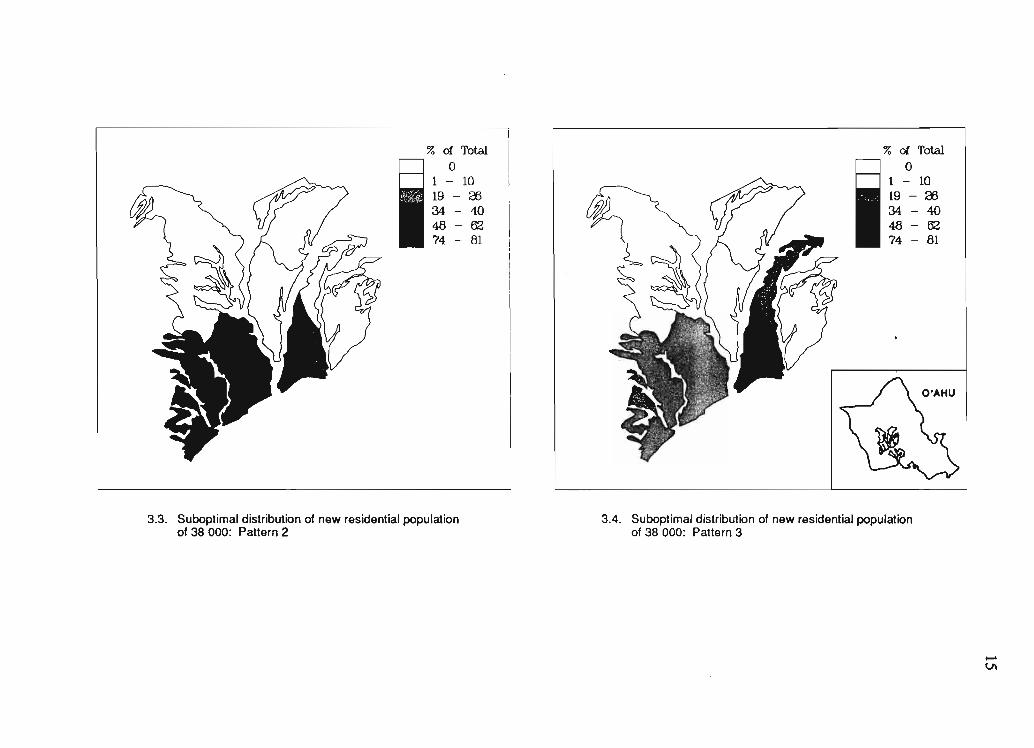
% of Totalo
1 - 1019 - 2634-4048-~
74 - 81
% of Totalo
1 - 1019 - 2634-4048-~
74 - 81
3.3. Suboptimal distribution of new residential populationof 38 000: Pattern 2
3.4. Suboptimal distribution of new residential populationof 38 000: Pattern 3
VI
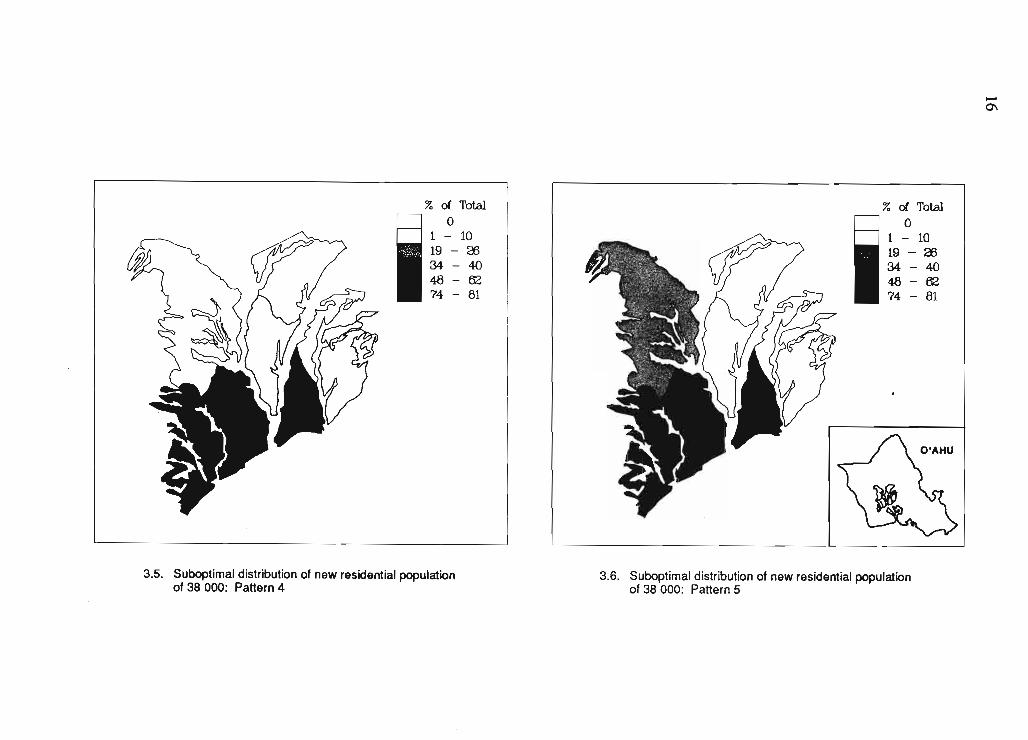
% of Totalo
1 - 1019 - 2634-4048-~
74 - 81
% of Totalo
1 - 1019 - 2634-4048-~
74 - 81
.....0\
3.5. Suboptimal distribution of new residential populationof 38 000: Pattern 4
3.6. Suboptimal distribution of new residential populationof 38 000: Pattern 5
17
Z3 : NEWPOP S 40 000
Xn EN, N ~ {Xijk nonbasic with zero reduced costs at optimality} .
Although a very large number of combi!1ations of Xn can be identified and used to define
different objective functions, only five were explored. Each set contained only those Xn
corresponding to new residential development in zones I, 3, 4, 5, or 7, that is, in areas not
previously assigned such transitions. An alternative to attempting to drive currently nonbasic
transitions into solution is to try to force some of the nonzero assignments out of the currently
optimal basis. This was attempted with Model m, where the basic variables in question were
those representing residential expansion into zones 2 and 6.
MODEL III. The parameters and values of Model m were as follows:
min L Xbb
s.t.
X E F
Zl AGCONV oS 216.6
q NETGW~O
Z3 NEWPOP ~ 40000
Xb E B. B !:: {Xijk basic at optimality}.
Although in this application 5 new land-use-transition variables (out of 29 basic ones) came
into solution in every case, residential development showed negligible differences: zone 2
received almost 38% of the population, zone 6 received 62%, and a few individuals were
assigned variously to the other zones. No residential development was ever allocated to zone 5,
and the total amount of land being converted to residential use was invariant at 330 ha, the
entirety always at medium density. However, whereas under the initial optimal plan (Model
I-B) much of the nonirrigated pineapple land would have to become drip irrigated, several of
the new solutions did not require such a change. Clearly, such a qualitative difference
potentially is of great importance.
Suboptimal Land-Use Configurations
The solutions examined so far are Pareto optimal with respect to the baseline model. It may be
useful, however, intentionally to consider plans that are suboptimal if in so doing a wider range
of solutions can be identified (Brill, Chang, and Hopkins 1982; Chang, Brill, and Hopkins
1982; Harrington and Gidley 1985). If slightly degrading a nondominated solution leads to a
plan that is nearly as good with respect to objective attainment and yet far more acceptable
(e.g., implementable), the tradeoff might well be worth considering.
18
MODEL IV. The HSJ approach was employed to generate such nearly optimal solutions as
those just described. A new model, Model IV, was fonnulated by loosening the constraints on
objective attainment in Model III-about 5% of Zt and Z3, and 1 mgd in the case of Z2:
min L Xbb
S.t.
X E F
Zl AGCONV ~ 227
Z2 NETGW ~ -1 ()()()
Z3 NEWPOP ~ 38 000
Xb E B, B!:: {Xijk basic at optimality}.
In this application, all variables with nonzero values in the optimal solution to Model III were
placed in the objective function. Basic variables appearing in the solution of Model IV that were
not in the objective function were then added to it, defining a new problem, whereupon the
procedure was repeated. It should be noted, however, that Model IV does not require the
objective function to include all basic variables from a preceding solution, but rather any subset
of them. For example, one might wish to minimize only the basic variables corresponding to
land-use change in zones 2 and 6.
The procedure was repeated fifteen times, and the cumulative number of different nonzero
land-use transitions grew from 28 to 110, spawning a great variety of different plans. Table 6
shows the variation among five of the plans along four different dimensions, other than those
pertaining to the three objectives, which would likely be significant in any evaluation. In at
least one plan, considerable residential expansion-accommodating at least 20% of total
population increase---occurred in each zone, with zones 2 and 6 often allocated less residential
development than other areas (Figs. 3.2-3.6). Total land area being converted to residential use
now ranged from 314 ha to 444 ha, with low-density development accounting for as much as
254 ha in some cases. Whereas in the optimal plans the amount of land destined for use as
parks or golf courses always rose by exactly 100 ha, the increases in the nearly optimal cases
ranged from 33 ha to 303 ha. Since the different land-use programs exhibit even greater variety
than do these gross indicators, the deliberate consideration of slightly suboptimal plans has
allowed the generation of a far greater array of options.
These results suggest that it may well be possible to accommodate considerable urban
growth while adhering to constraints imposed by groundwater management and agricultural
land preservation. However, any optimization model for land-use plan design makes
assumptions regarding the acceptability and plausibility of future land-use transitions. In the
19
TABLE 7. PAYOFFS FOR THREE OBJECTIVES WHEN AGRICULnJRALDEVELOPMENT ON CURRENTLY NONAGRICULTURAL LANDIS DISAUOWED
Optimized Al:XXJN NEI'GW NEWPOPObjective (ha). (mgd)
zt=AGCONV 145.2 -2.2 7404-5.7 40 ()()()
zz=NETGW 2345.2 6.8 7404
z3=NEWPOP 5353.1 -136.5 686 715
models described thus far, for example, changes from nonagricultural uses to agricultural ones
are pennitted. Since pineapple cultivation yields moderate groundwater recharge (Table 1) yet
demands little or no irrigation (Table 2), expansion of pineapple acreage increases NETGW. In
all models, significant amounts of acreage were therefore converted from vacant or grazing
land to pineapple fields. Yet is it realistic to assume an increase in pineapple cultivation?
Constraining Agricultural Expansion
MODEL V. To examine the implications of not increasing agricultural acreage, a new model,
Model V, was created by appending to Model I a constraint eliminating conversions of non
agricultural to agricultural uses. Optimizing each objective in turn produced the payoffs shown
in "Dable 7. Since AGCONV (Zt) only concerns land parcels that are removed from agricultural
use and is not affected by new agricultural development, which might be viewed as
compensating for losses of agricultural land incurred elsewhere, its values remain unchanged
from those used in Model I (Table 4). Also unaffected is NEWPOP (Z3), since the amount of
land available for residential use remains unaltered. What does change is NETGW (Z2), as
withdrawal increases by roughly 3 to 7 mgd (depending on the additional population to be
accommodated) relative to recharge. For example, with the additional constraints of 40 000
more residents and minimal agricultural land loss (a combination not shown in Table 7),
NETGW (Z2) would decline by 5.3 mgd.
The greater impact on groundwater under these new, perhaps more realistic, conditions
makes one less sanguine about the prospect of continuing intense urban development in central
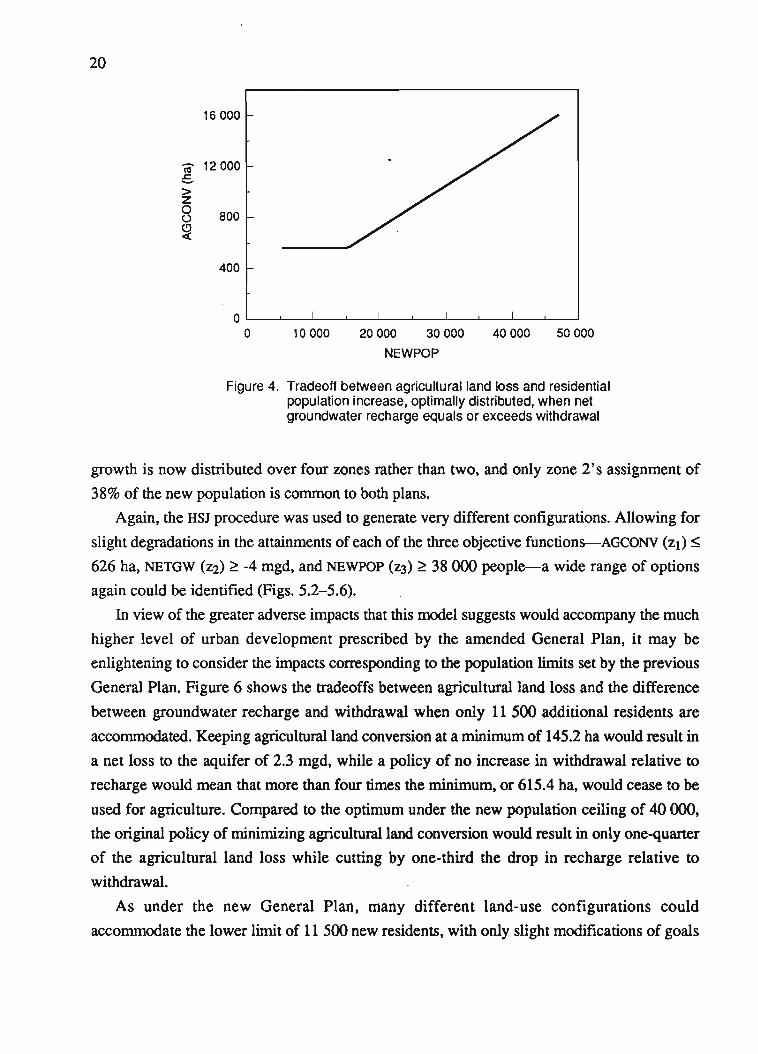
O'ahu. Figure 4 shows the tradeoff between agricultural land conversion and additional
residential population if NETGW remains unchanged. Allowing 40 ()()() new residents in the
area would now result in a near tripling of agricultural land loss (Zt =596 ha), while recharge
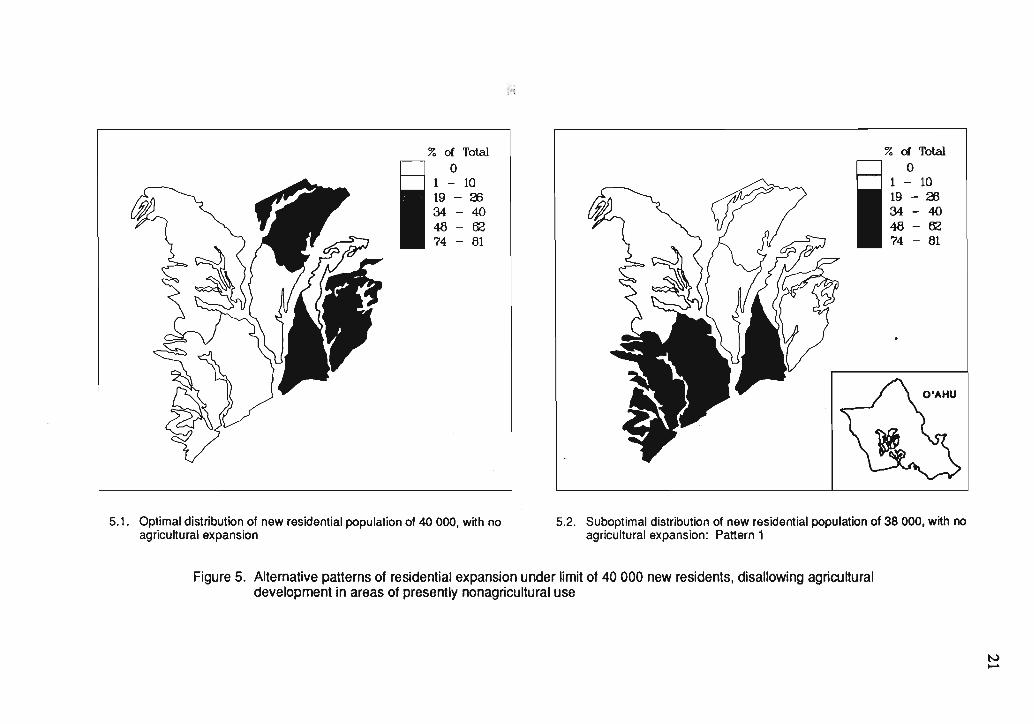
would fall by 3.5 mgd relative to withdrawal (i.e., Z2 = -3.5 mgd). An optimal residential land
use expansion pattern corresponding to these values is shown in Figure 5.1. In addition to the
higher price now paid in terms of Zl and Z2, the settlement pattern is quite different: residential
20
40 000 50 00020 000 30 000
NEWPOP
10 0000'------'_---l...._-'-_-'--_I------1._---l...._-'-_-'-----'
a
'iii' 12 000:S>z0 800C,)
~
400
16 000
Figure 4. Tradeoff between agricultural land loss and residentialpopulation increase, optimally distributed, when netgroundwater recharge equals or exceeds withdrawal
growth is now distributed over four zones rather than two, and only zone 2's assignment of
38% of the new population is common to both plans.
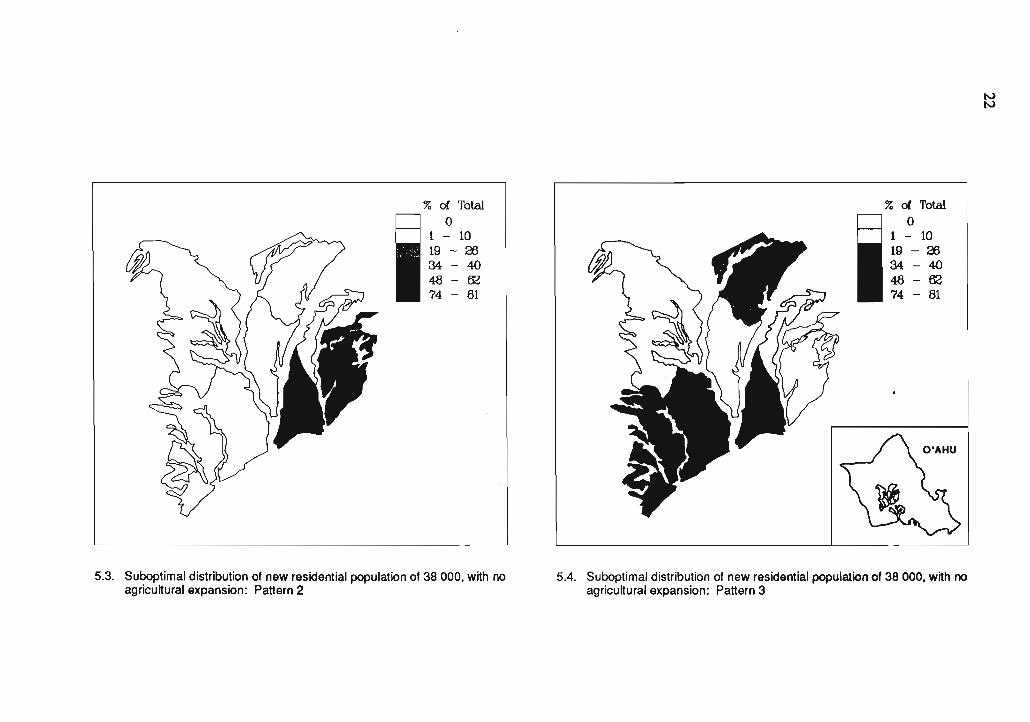
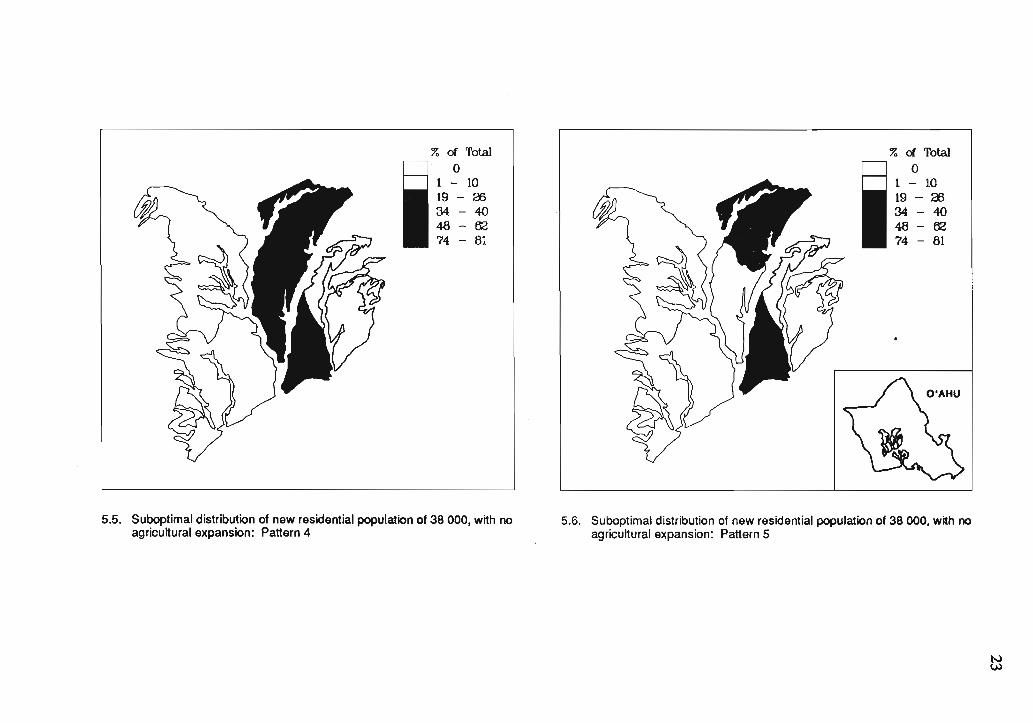
Again, the HSJ procedure was used to generate very different configurations. Allowing for
slight degradations in the attainments of each of the three objective functions-AGCONV (Zl) ~
626 ha, NETGW (Z2) ~ -4 mgd, and NEWPOP (Z3) ~ 38000 people-a wide range of options
again could be identified (Figs. 5.2-5.6).
In view of the greater adverse impacts that this model suggests would accompany the much
higher level of urban development prescribed by the amended General Plan, it may be
enlightening to consider the impacts corresponding to the population limits set by the previous
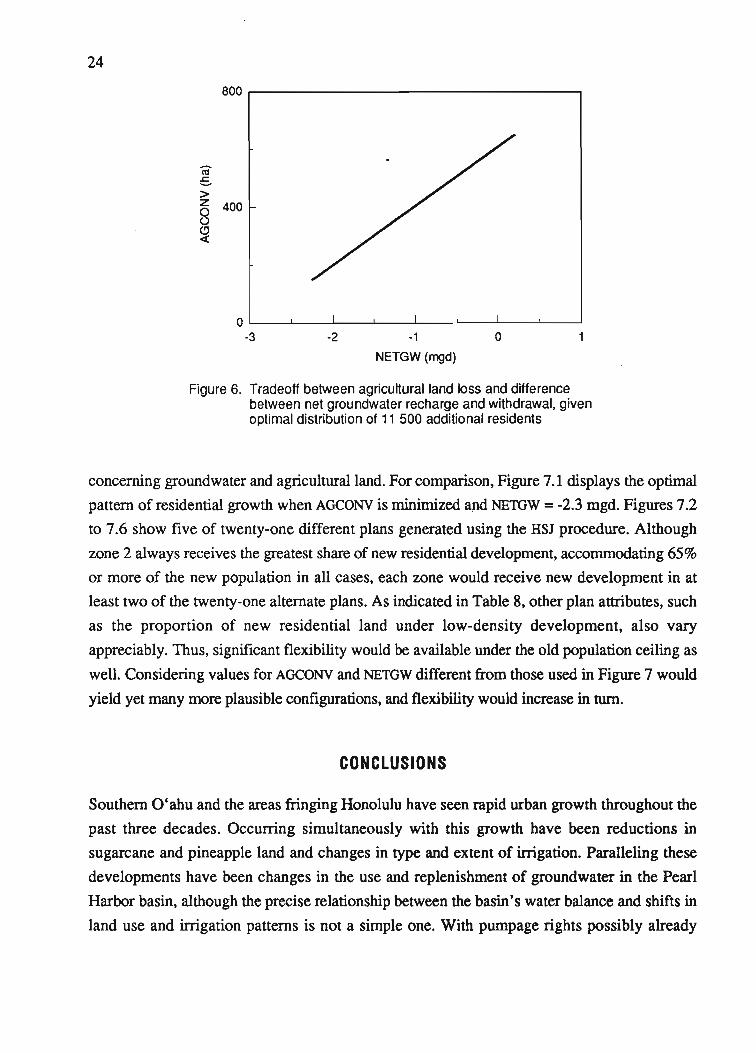
General Plan. Figure 6 shows the tradeoffs between agricultural land loss and the difference
between groundwater recharge and withdrawal when only 11 500 additional residents are
accommodated. Keeping agricultural land conversion at a minimum of 145.2 ha would result in
a net loss to the aquifer of 2.3 mgd, while a policy of no increase in withdrawal relative to
recharge would mean that more than four times the minimum, or 615.4 ha, would cease to be
used for agriculture. Compared to the optimum under the new population ceiling of 40 000,
the original policy of minimizing agricultural land conversion would result in only one-quarter
of the agricultural land loss while cutting by one-third the drop in recharge relative to
withdrawal.
As under the new General Plan, many different land-use configurations could
accommodate the lower limit of 11 500 new residents, with only slight modifications of goals
% of Totalo
1 - 1019 - 2634-4048-6274 - 81
~:~~
% of Totalo
1 - 1019 - 2634-4048-6274 - 81
5.1. Optimal distribution of new residential population of 40 ODD, with noagricultural expansion
5.2. Suboptimal distribution of new residential population of 38 000, with noagricultural expansion: Pattern 1
Figure 5. Alternative patterns of residential expansion under limit of 40 000 new residents, disallowing agriculturaldevelopment in areas of presently nonagricultural use
tv-
% of Totalo
1 - 1019 - a;34-4048-6274 - 81
% of Totalo
1 - 1019 - a;34-4048-6274 - 81
IVIV
5.3. Suboptimal distribution of new residential population of 38 000, with noagricultural expansion: Pattern 2
5.4. Suboptimal distribution of new residential population of 38 000, with noagricultural expansion: Pattern 3
% ot Totalo
1 - 1019 - as34-4048-6274 - 81
% ot Totalo
1 - 1019 - as34-4048-6274 - 81
5.5. Suboptimal distribution of new residential population of 38 000, with noagricultural expansion: Pattern 4
5.6. Suboptimal distribution of new residential population of 38 000, with noagricultural expansion: Pattern 5
tvW
24
800 ,....---------------------,
o-1
NETGW (mgd)
-2
Ol..--_-'--_---L_--I.._---Jl..--_-'--_.....L-_--I-_----'
-3
lil:S>z 4008~
Figure 6. Tradeoff between agricultural land loss and differencebetween net groundwater recharge and withdrawal, givenoptimal distribution of 11 500 additional residents
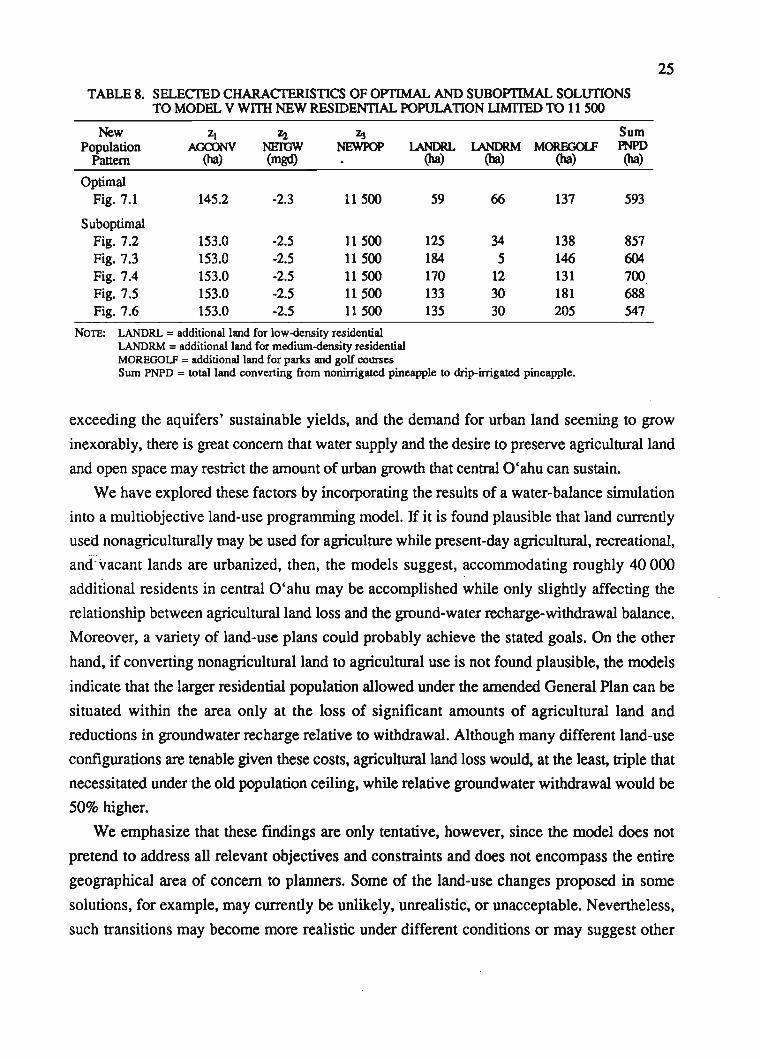
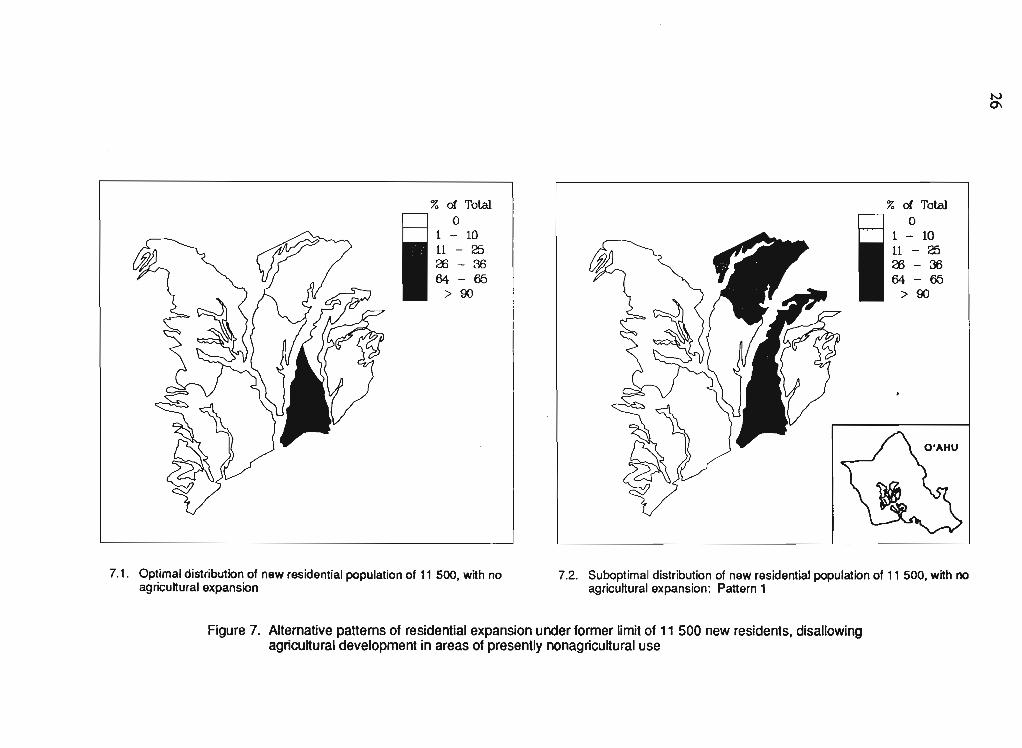
concerning groundwater and agricultural land. For comparison, Figure 7.1 displays the optimal
pattern of residential growth when AGCONV is minimized ap.d NETGW = -2.3 mgd. Figures 7.2
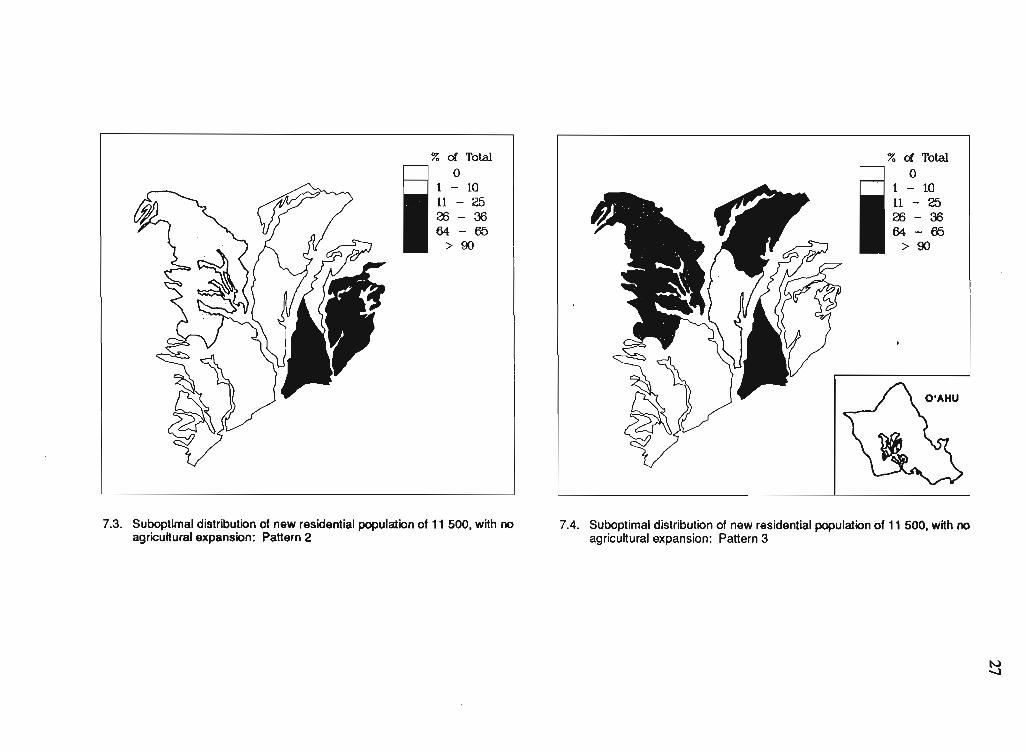
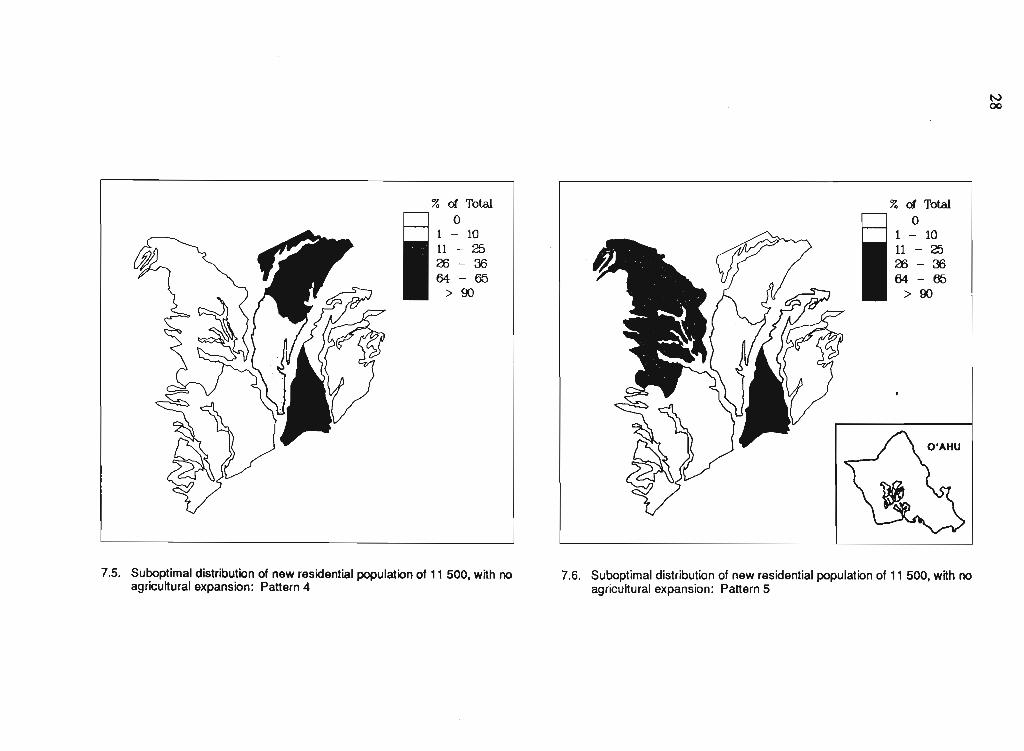
to 7.6 show five of twenty-one different plans generated using the HSJ procedure. Although
zone 2 always receives the greatest share of new residential development, accommodating 65%
or more of the new population in all cases, each zone would receive new development in at
least two of the twenty-one alternate plans. As indicated in Table 8, other plan attributes, such
as the proportion of new residential land under low-density development, also vary
appreciably. Thus, significant flexibility would be available under the old population ceiling as
well. Considering values for AGCONV and NETGW different from those used in Figure 7 would
yield yet many more plausible configurations, and flexibility would increase in turn.
CONCLUSIONS
Southern O'ahu and the areas fringing Honolulu have seen rapid urban growth throughout the
past three decades. Occurring simultaneously with this growth have been reductions in
sugarcane and pineapple land and changes in type and extent of irrigation. Paralleling these
developments have been changes in the use and replenishment of groundwater in the Pearl
Harbor basin, although the precise relationship between the basin's water balance and shifts in
land use and irrigation patterns is not a simple one. With pumpage rights possibly already
25
TABLE 8. SELECTED CHARACTERISTICS OF OPTIMAL AND SUBOPTIMAL SOLUTIONSTO MODEL V WITII NEW RESIDENTIAL POPULATION LIMITED 10 11 500
New Zl ~ ZJ SumPopulation AcxnNV NE1GW NEWPOP l.ANDRL lANDRM MORF..GOLF PNPD
Pattern (ha) (mgd) (ha) (ba) (ha) (ha)
OptimalFig. 7.1 145.2 -2.3 11500 59 66 137 593
SuboptimalFig. 7.2 153.0 -2.5 11500 125 34 138 857Fig. 7.3 153.0 -2.5 11500 184 5 146 604Fig. 7.4 153.0 -2.5 11500 170 12 131 700Fig. 7.5 153.0 -2.5 11500 133 30 181 688Fig. 7.6 153.0 -2.5 11500 135 30 205 547
NOTE: LANDRL =additional land for low-density residentialLANDRM =additional land for medium-density residentialMOREGOLF =additional land for parks and golf COUISesSum PNPD =total land converting from nonirrigated pineapple to drip-irrigated pineapple.
exceeding the aquifers' sustainable yields, and the demand for urban land seeming to grow
inexorably, there is great concern that water supply and the desire to preserve agricultural land
and open space may restrict the amount of urban growth that central O'abu can sustain.
We have explored these factors by incorporating the results of a water-balance simulation
into a multiobjective land-use programming model. If it is found plausible that land currently
used nonagriculturally may be used for agriculture while present-day agricultural, recreational,
ancFvacant lands are urbanized, then, the models suggest, accommodating roughly 40000
additional residents in central O'ahu may be accomplished while only slightly affecting the
relationship between agricultural land loss and the ground-water recharge-withdrawal balance.
Moreover, a variety of land-use plans could probably achieve the stated goals. On the other
hand, if converting nonagricultural land to agricultural use is not found plausible, the models
indicate that the larger residential population allowed under the amended General Plan can be
situated within the area only at the loss of significant amounts of agricultural land and
reductions in groundwater recharge relative to withdrawal. Although many different land-use
configurations are tenable given these costs, agricultural land loss would, at the least, triple that
necessitated under the old population ceiling, while relative groundwater withdrawal would be
50% higher.
We emphasize that these findings are only tentative, however, since the model does not
pretend to address all relevant objectives and constraints and does not encompass the entire
geographical area of concern to planners. Some of the land-use changes proposed in some
solutions, for example, may currently be unlikely, unrealistic, or unacceptable. Nevertheless,
such transitions may become more realistic under different conditions or may suggest other
% of Totalo
1 - 1011-25a>-3664-65
>90
% of Totalo
1 - 1011-25a>-3664-65
>90
N0\
7.1. Optimal distribution of new residential population of 11 500, with noagricuhural expansion
7.2. Suboptimal distribution of new residential population of 11 500, with noagricuhural expansion: Pattern 1
Figure 7. Alternative patterns of residential expansion under former limit of 11 500 new residents, disallowingagricultural development in areas of presently nonagricultural use
% of Totalo
1 - 1011-25a>-3664-65
>90
% of Totalo
1 - 1011-25a>-3664-65
>90
7.3. Suboptimal distribution of new residential population of 11 500, with noagricultural expansion: Pattern 2
7.4. Suboptimal distribution of new residential population of 11 500, with noagricultural expansion: Pattern 3
!:j
% of Totalo
1 - 1011-25ai-3664-65
>90
% of Totalo
1 - 1011-25ai-3664-65
>90
tv00
7.5. Suboptimal distribution of new residential population of 11 500, with noagricultural expansion: Pattern 4
7.6. Suboptimal distribution of new residential population of 11 500, with noagricultural expansion: Pattern 5
29
options with the same effect, such as the initiation of land-management practices to alter
recharge. As Geoffrion (1976) reminded us, "the purpose of mathematical programming is
insight, not numbers." By considering both optimal and near-optimal programming solutions,
it is possible to formulate a wide variety of land-use plans that respond well to goals
concerning population growth, water management, and agricultural land. What is required,
however, is a more systematic, basinwide framework for evaluating decisions about land-use
change than that currently in use.
REFERENCES CITED
Board of Water Supply. 1982. Oahu water plan. Summary Report. City and County ofHonolulu, State of Hawaii.
Brill, E.D.; Chang, S.-Y.; and Hopkins, L.D. 1982. Modeling to generate alternatives: TheHSJ approach and an illustration using a problem in land use planning. ManagementScience 28(3):221-35.
Chang, S.-Y.; Brill, E.D.; and Hopkins, L.D. 1982. Use of mathematical models to generatealternative solutions to water resources planning problems. Water Resour. Res. 18(1):5864.
Cohon, J. 1978. Multiobjective programming andplanning. New York: Academic Press.
Elliott, W.P., and Reed, R.K. 1984. A climatological estimate of precipitation for the worldocean. J. Clim. Appl. Meteorol. 23:434-39.
Ekern, P.C. 1965. Evapotranspiration of pineapple in Hawaii. Plant Physiol. 40:736-39.
Geoffrion, A. 1976. The purpose of mathematical programming is insight, not numbers.Interfaces 7(1):81-92.
Giambelluca, T.W. 1986. Land-use effects on the water balance of a tropical island. Nat.Geog. Res. 2:125-51.
Harrington, J.J., and Gidley, J.S. 1985. The variability of alternative decisions in a waterresources planning problem. Water Resour. Res. 21(12):1831-40.
Ignizio, J. 1982. Linear programming in single- and multiple-objective systems. EnglewoodCliffs, NJ: Prentice Hall.
Keeney, R.L., and Raiffa, H. 1976. Decisions with multiple objectives: Preferences and valuetradeoffs. New York: Wiley.
King, D.L. 1988. Impact on groundwater resources of the conversion from furrow to dripirrigation in the Hawaiian sugar industry. Master's thesis (Geography), University ofHawaii at Manoa, Honolulu. 138 p.
30
Kresnak, W. 1989. General plan reflects new thinking on growth. Honolulu Star-Bulletin, 20January 1989, p. A-5.
Nijkamp, P. 1977. Theory and application of environmental economics. Amsterdam: NorthHolland.
Pearce, D.W., and Turner, R.K. 1990. Economics of natural resources and the environment.New York: Harvester Wheatsheaf.
Saaty, T.L. 1990. An exposition of the AHP in reply to the paper "Remarks on the analytichierarchy process." Management Science 36(3): 259-68.
Steuer, R. 1986. Multiple criteria optimization: Theory, computation, and application. NewYork: John Wiley.
___. 1989. ADBASE multiple objective linear programming package. Department ofManagement Science and Information Technology, University of Georgia, Athens.
Thomthwaite, C.W., and Mather, J.R. 1955. The water balance. Publications in Climatology8:1-104.
U.S. Soil Conservation Service. 1972. Hydrology. National engineering handbook. U.S.Department of Agriculture. Washington, DC: Government Printing Office.
von Winterfeldt, D., and Edwards, W. 1986. Decision analysis and behavioral research.Cambridge, England: Cambridge University Press.
Wagner, H.M. 1975. Principles ofoperations research. Englewood Cliffs, NJ: Prentice Hall.
Yuen, George A.L., and Associates, Inc. 1988. Review and re-evaluation of groundwaterconditions in the Pearl Harbor Groundwater Control Area, Oahu, Hawaii. Report R78,Department of Land and Natural Resources, Honolulu.
Zeleny, M. 1982. Multiple criteria decision making. New York: McGraw-Hill.