Embed Size (px)
Citation preview
Waipatiki Catchment Flood Hazard Analysis
June 2008 AM 08/04
HBRC Plan Number 4029

Asset Management Group Technical Report
ISSN 1174 3085
Engineering Section
Waipatiki Catchment: Flood Hazard Analysis
Prepared by: Ir. Craig Goodier: Senior Design Engineer
Reviewed by: Ir. Gary Clode: Manager Engineering
June 2008 AM 08/04
HBRC Plan Number 4029 © Copyright: Hawke’s Bay Regional Council

Waipatiki Catchment Flood Hazard Analysis
Table Of Contents 1 Summary ______________________________________________________ 1 2 Catchment Description ____________________________________________ 1
2.1 Land Use __________________________________________________ 4 3 Hydrologic Analysis ______________________________________________ 4
3.1 Rainfall Analysis _____________________________________________ 5 3.2 Design Rainfall ______________________________________________ 7 3.3 Effects of Climate Change on Rainfall ____________________________ 8 3.4 Hydrologic Model Description ___________________________________ 9 3.5 Hydrologic Model Calibration ___________________________________ 9 3.6 Design Rainfall Model Run ____________________________________ 12
4 Hydrodynamic Model Description___________________________________ 13 4.1 Hydrodynamic Model Parameters ______________________________ 14 4.2 June 1963 Event ___________________________________________ 15 4.3 April 2000 Event (approximately 5 - 10 year return period) ___________ 17 4.4 Design Events _____________________________________________ 18
5 Discussion ____________________________________________________ 20 6 Flood Hazard Map ______________________________________________ 23 7 Effects of Raising of Flood Prone Area above the Recommended Flood Level 24 8 Conclusion ____________________________________________________ 24 9 Recommendation _______________________________________________ 24 10 References: _________________________________________________ 25

Waipatiki Catchment Flood Hazard Analysis
M:\Data_Files\Waipatiki\Report\4029 AM0804 Waipatiki Catchment Flood Hazard Analysis.doc 1
Waipatiki Catchment Flood Hazard Analysis
1 Summary
The Waipatiki Catchment is located about 25 km north of Napier on the east coast of the North Island. The catchment is in an area that is known for short duration flash flooding. The settlement of Waipatiki is located on the floodplain near the coast. The Hawkes Bay Regional Council (HBRC) has been requested to provide flood hazard information for the settlement area. A hydrologic and hydrodynamic model has been created for the catchment in order to assess the likely runoff from a design storm, and to assess the likely extent of flooding in the valley floor during the design flood event. This report provides a description of the methods used in the analysis, and provides the results in terms of flood levels that form the basis for a map showing the flood hazard zone. Safety is of great concern in this valley during flood events, since there is almost no warning time for evacuation. Avoidance of the flood prone areas may be the sensible and practicable choice to prevent loss of life and property.
2 Catchment Description
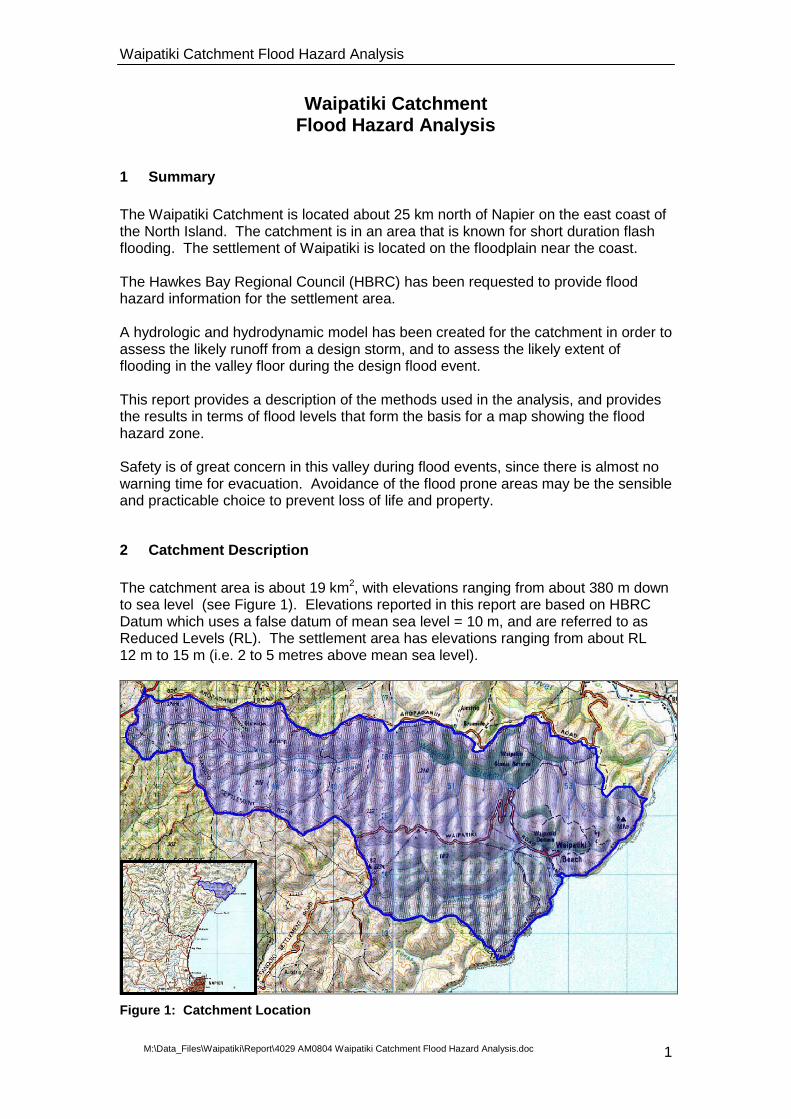
The catchment area is about 19 km2, with elevations ranging from about 380 m down to sea level (see Figure 1). Elevations reported in this report are based on HBRC Datum which uses a false datum of mean sea level = 10 m, and are referred to as Reduced Levels (RL). The settlement area has elevations ranging from about RL 12 m to 15 m (i.e. 2 to 5 metres above mean sea level).
Figure 1: Catchment Location
Waipatiki Catchment Flood Hazard Analysis
M:\Data_Files\Waipatiki\Report\4029 AM0804 Waipatiki Catchment Flood Hazard Analysis.doc 2
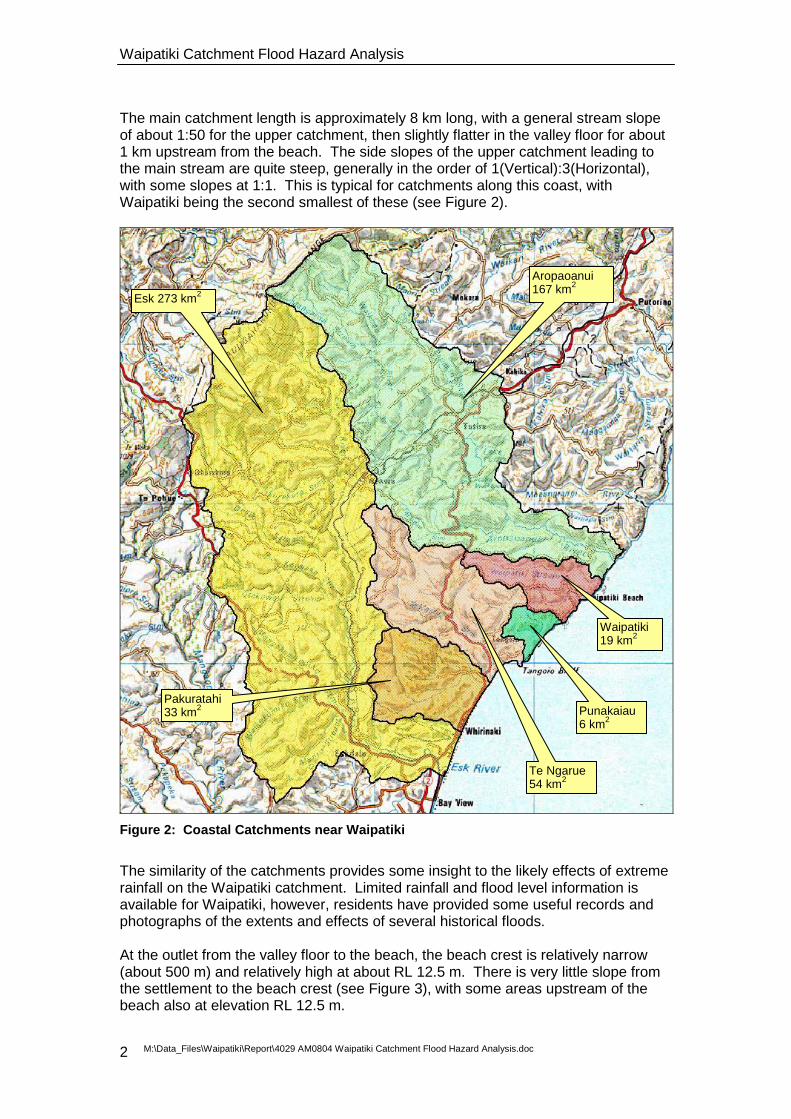
The main catchment length is approximately 8 km long, with a general stream slope of about 1:50 for the upper catchment, then slightly flatter in the valley floor for about 1 km upstream from the beach. The side slopes of the upper catchment leading to the main stream are quite steep, generally in the order of 1(Vertical):3(Horizontal), with some slopes at 1:1. This is typical for catchments along this coast, with Waipatiki being the second smallest of these (see Figure 2).
Figure 2: Coastal Catchments near Waipatiki
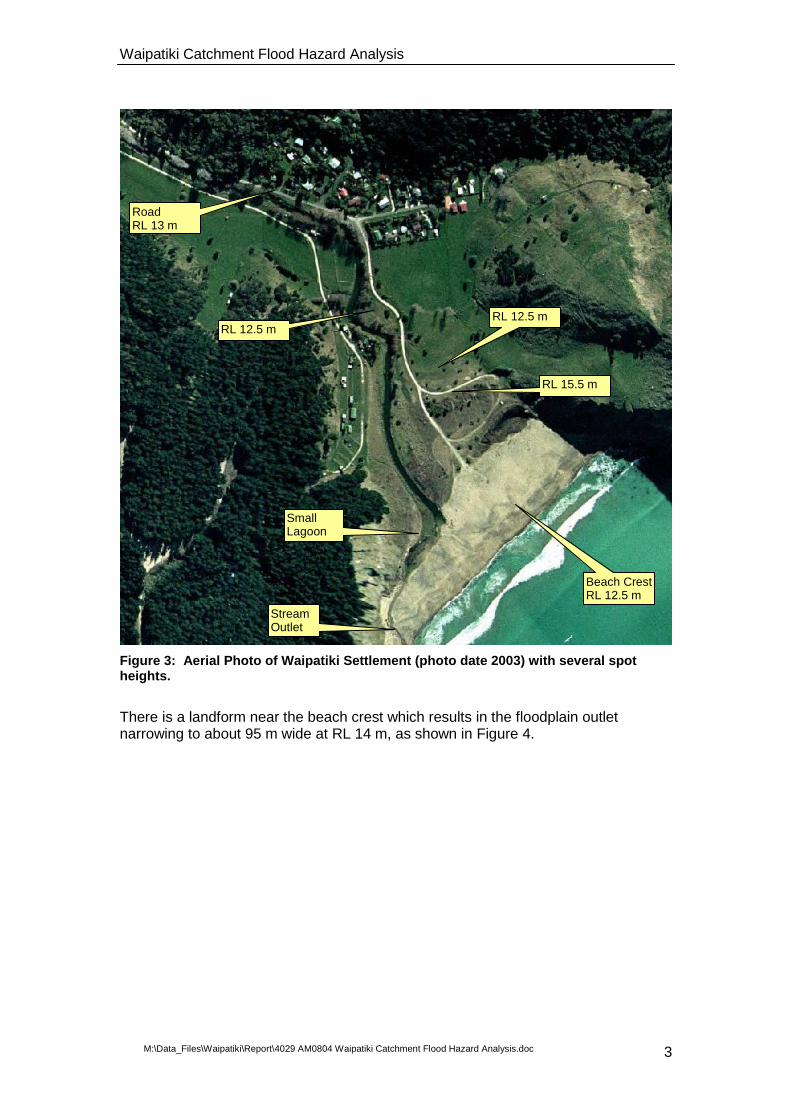
The similarity of the catchments provides some insight to the likely effects of extreme rainfall on the Waipatiki catchment. Limited rainfall and flood level information is available for Waipatiki, however, residents have provided some useful records and photographs of the extents and effects of several historical floods. At the outlet from the valley floor to the beach, the beach crest is relatively narrow (about 500 m) and relatively high at about RL 12.5 m. There is very little slope from the settlement to the beach crest (see Figure 3), with some areas upstream of the beach also at elevation RL 12.5 m.
Aropaoanui 167 km
2
Esk 273 km2
Pakuratahi 33 km
2
Te Ngarue 54 km
2
Waipatiki 19 km
2
Punakaiau 6 km
2
Waipatiki Catchment Flood Hazard Analysis
M:\Data_Files\Waipatiki\Report\4029 AM0804 Waipatiki Catchment Flood Hazard Analysis.doc 3
Figure 3: Aerial Photo of Waipatiki Settlement (photo date 2003) with several spot heights.
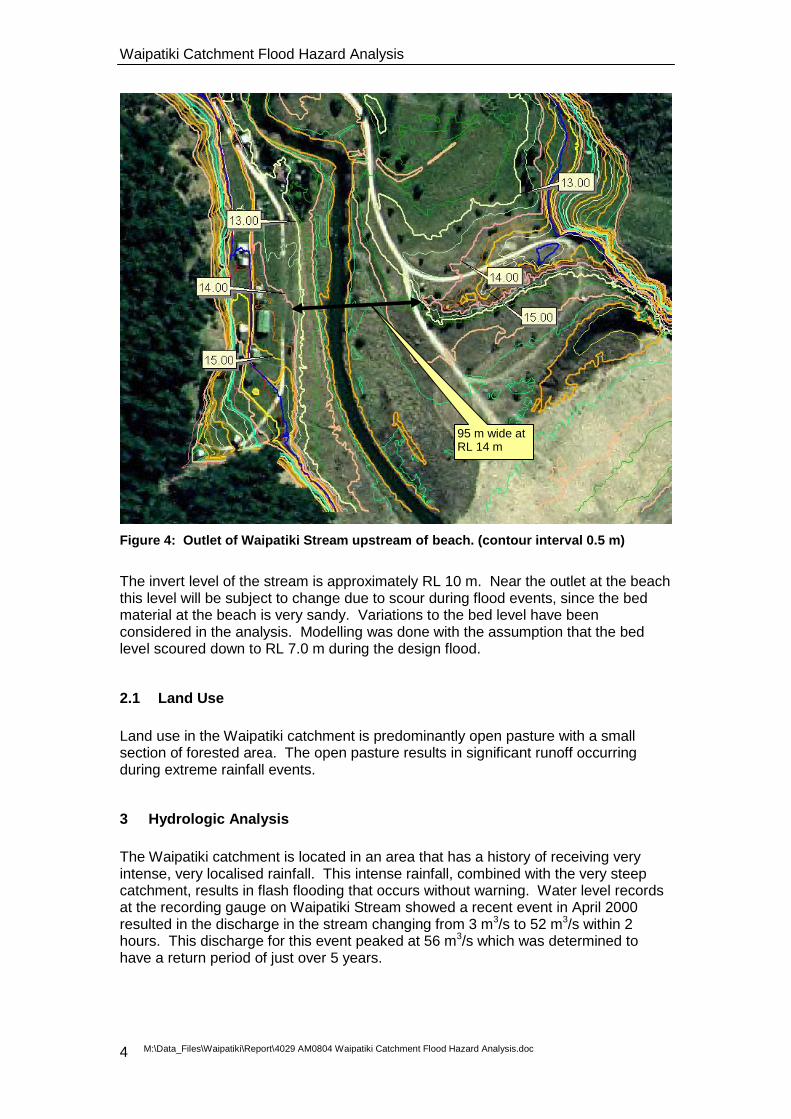
There is a landform near the beach crest which results in the floodplain outlet narrowing to about 95 m wide at RL 14 m, as shown in Figure 4.
Beach Crest RL 12.5 m
Small Lagoon
Stream Outlet
RL 12.5 m
Road RL 13 m
RL 15.5 m
RL 12.5 m
Waipatiki Catchment Flood Hazard Analysis
M:\Data_Files\Waipatiki\Report\4029 AM0804 Waipatiki Catchment Flood Hazard Analysis.doc 4
Figure 4: Outlet of Waipatiki Stream upstream of beach. (contour interval 0.5 m)
The invert level of the stream is approximately RL 10 m. Near the outlet at the beach this level will be subject to change due to scour during flood events, since the bed material at the beach is very sandy. Variations to the bed level have been considered in the analysis. Modelling was done with the assumption that the bed level scoured down to RL 7.0 m during the design flood.
2.1 Land Use
Land use in the Waipatiki catchment is predominantly open pasture with a small section of forested area. The open pasture results in significant runoff occurring during extreme rainfall events.
3 Hydrologic Analysis
The Waipatiki catchment is located in an area that has a history of receiving very intense, very localised rainfall. This intense rainfall, combined with the very steep catchment, results in flash flooding that occurs without warning. Water level records at the recording gauge on Waipatiki Stream showed a recent event in April 2000 resulted in the discharge in the stream changing from 3 m3/s to 52 m3/s within 2 hours. This discharge for this event peaked at 56 m3/s which was determined to have a return period of just over 5 years.
95 m wide at RL 14 m
Waipatiki Catchment Flood Hazard Analysis
M:\Data_Files\Waipatiki\Report\4029 AM0804 Waipatiki Catchment Flood Hazard Analysis.doc 5
3.1 Rainfall Analysis
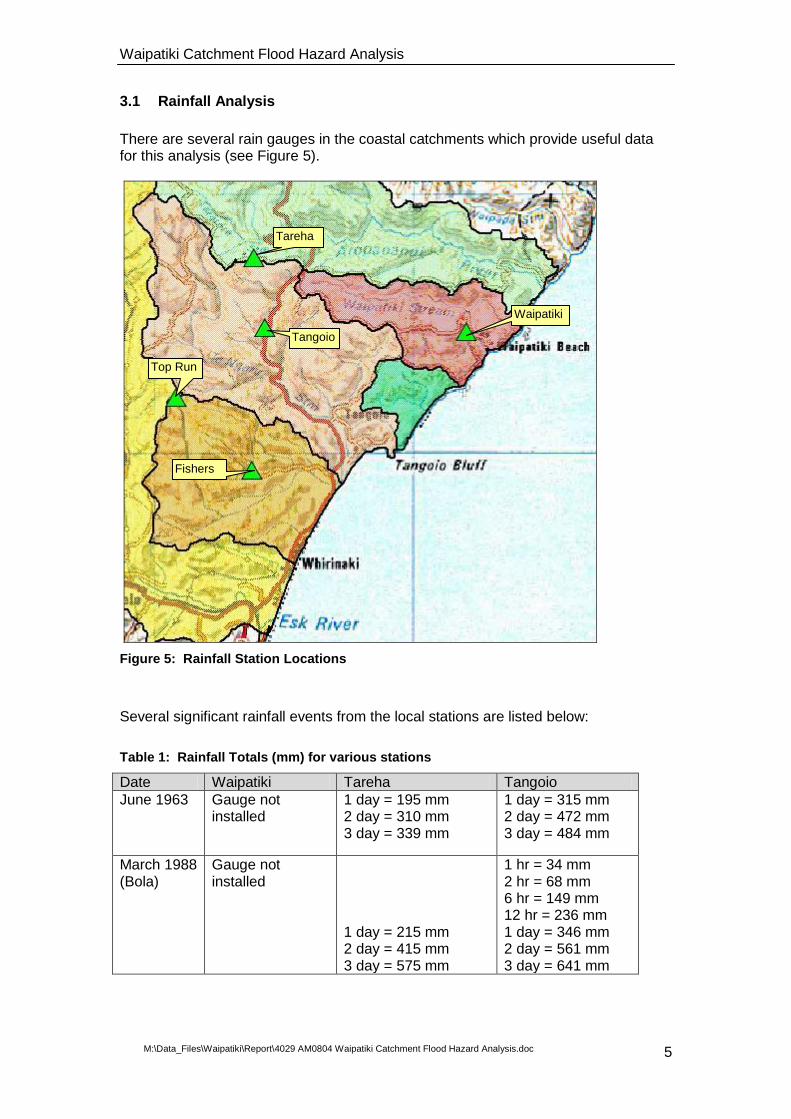
There are several rain gauges in the coastal catchments which provide useful data for this analysis (see Figure 5).
Figure 5: Rainfall Station Locations
Several significant rainfall events from the local stations are listed below:
Table 1: Rainfall Totals (mm) for various stations
Date Waipatiki Tareha Tangoio
June 1963 Gauge not installed
1 day = 195 mm 2 day = 310 mm 3 day = 339 mm
1 day = 315 mm 2 day = 472 mm 3 day = 484 mm
March 1988 (Bola)
Gauge not installed
1 day = 215 mm 2 day = 415 mm 3 day = 575 mm
1 hr = 34 mm 2 hr = 68 mm 6 hr = 149 mm 12 hr = 236 mm 1 day = 346 mm 2 day = 561 mm 3 day = 641 mm
Tangoio
Tareha
Top Run
Fishers
Waipatiki
Waipatiki Catchment Flood Hazard Analysis
M:\Data_Files\Waipatiki\Report\4029 AM0804 Waipatiki Catchment Flood Hazard Analysis.doc 6
Date Waipatiki Tareha Tangoio
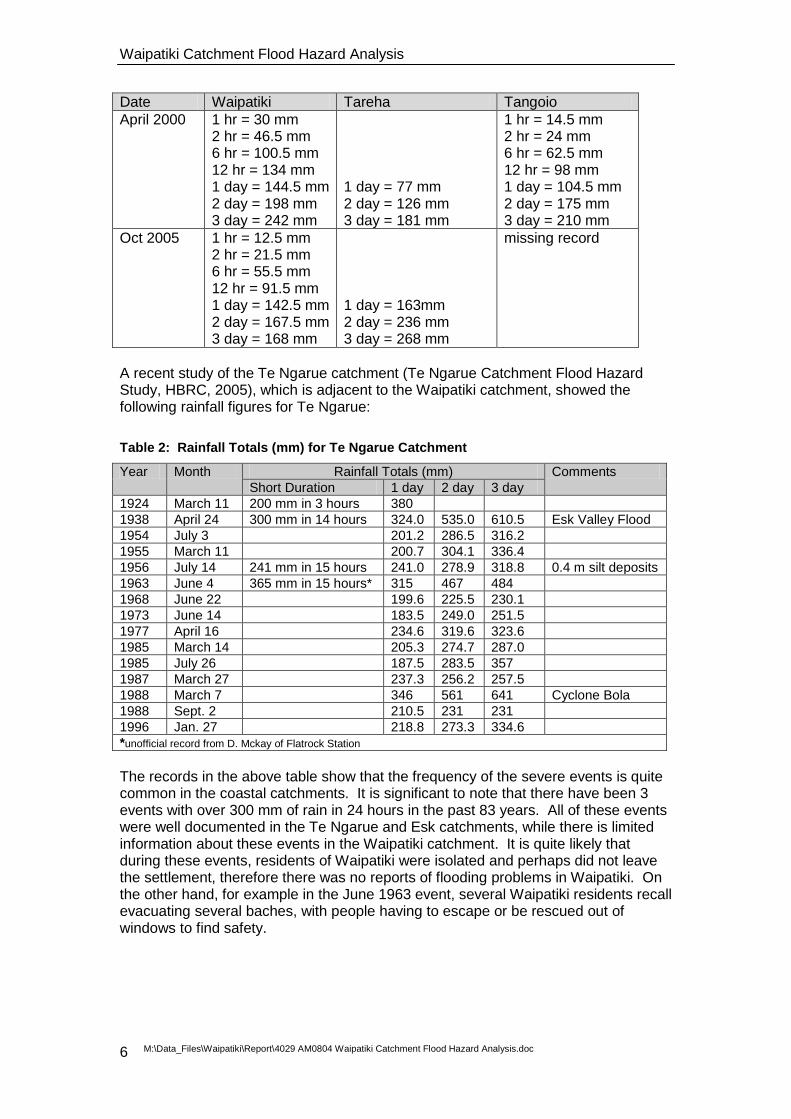
April 2000 1 hr = 30 mm 2 hr = 46.5 mm 6 hr = 100.5 mm 12 hr = 134 mm 1 day = 144.5 mm 2 day = 198 mm 3 day = 242 mm
1 day = 77 mm 2 day = 126 mm 3 day = 181 mm
1 hr = 14.5 mm 2 hr = 24 mm 6 hr = 62.5 mm 12 hr = 98 mm 1 day = 104.5 mm 2 day = 175 mm 3 day = 210 mm
Oct 2005 1 hr = 12.5 mm 2 hr = 21.5 mm 6 hr = 55.5 mm 12 hr = 91.5 mm 1 day = 142.5 mm 2 day = 167.5 mm 3 day = 168 mm
1 day = 163mm 2 day = 236 mm 3 day = 268 mm
missing record
A recent study of the Te Ngarue catchment (Te Ngarue Catchment Flood Hazard Study, HBRC, 2005), which is adjacent to the Waipatiki catchment, showed the following rainfall figures for Te Ngarue:
Table 2: Rainfall Totals (mm) for Te Ngarue Catchment
Year Month Rainfall Totals (mm) Comments
Short Duration 1 day 2 day 3 day
1924 March 11 200 mm in 3 hours 380
1938 April 24 300 mm in 14 hours 324.0 535.0 610.5 Esk Valley Flood
1954 July 3 201.2 286.5 316.2
1955 March 11 200.7 304.1 336.4
1956 July 14 241 mm in 15 hours 241.0 278.9 318.8 0.4 m silt deposits
1963 June 4 365 mm in 15 hours* 315 467 484
1968 June 22 199.6 225.5 230.1
1973 June 14 183.5 249.0 251.5
1977 April 16 234.6 319.6 323.6
1985 March 14 205.3 274.7 287.0
1985 July 26 187.5 283.5 357
1987 March 27 237.3 256.2 257.5
1988 March 7 346 561 641 Cyclone Bola
1988 Sept. 2 210.5 231 231
1996 Jan. 27 218.8 273.3 334.6
*unofficial record from D. Mckay of Flatrock Station
The records in the above table show that the frequency of the severe events is quite common in the coastal catchments. It is significant to note that there have been 3 events with over 300 mm of rain in 24 hours in the past 83 years. All of these events were well documented in the Te Ngarue and Esk catchments, while there is limited information about these events in the Waipatiki catchment. It is quite likely that during these events, residents of Waipatiki were isolated and perhaps did not leave the settlement, therefore there was no reports of flooding problems in Waipatiki. On the other hand, for example in the June 1963 event, several Waipatiki residents recall evacuating several baches, with people having to escape or be rescued out of windows to find safety.
Waipatiki Catchment Flood Hazard Analysis
M:\Data_Files\Waipatiki\Report\4029 AM0804 Waipatiki Catchment Flood Hazard Analysis.doc 7
3.2 Design Rainfall
The rainfall statistics provided by The Frequency of High Intensity Rainfalls in New Zealand, Technical Publication 19 (TP19) for the Waipatiki Catchment are as follows:
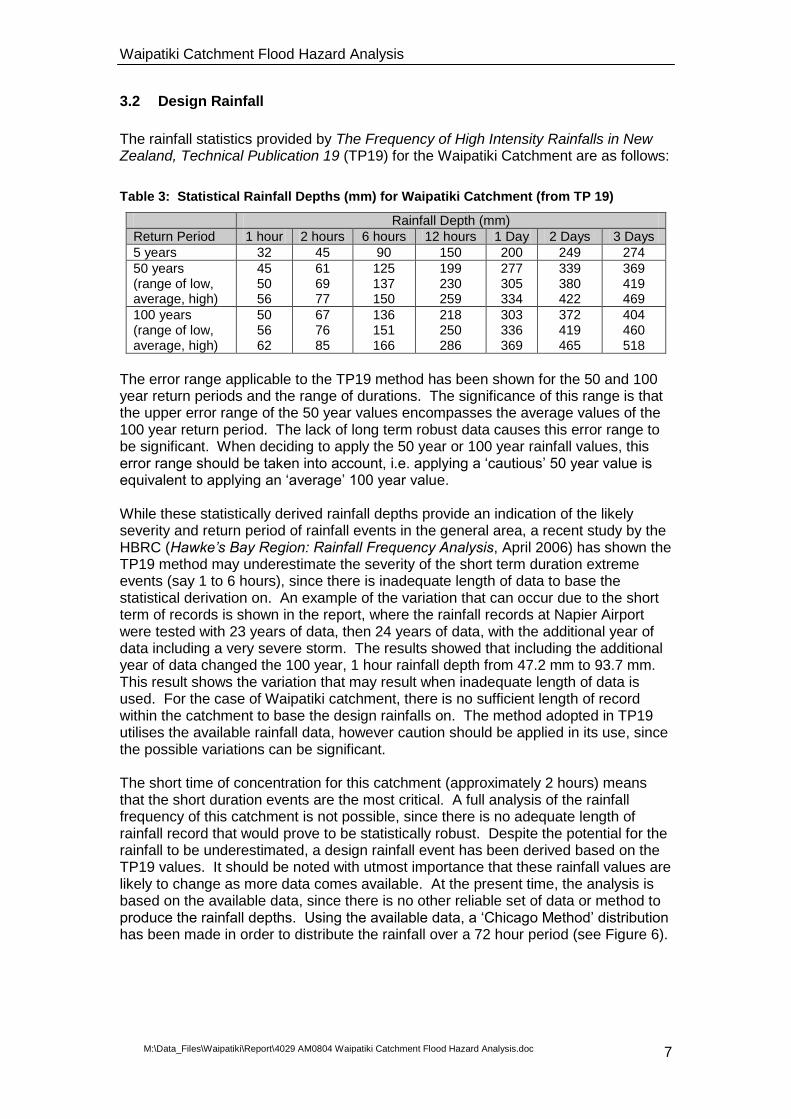
Table 3: Statistical Rainfall Depths (mm) for Waipatiki Catchment (from TP 19)
Rainfall Depth (mm)
Return Period 1 hour 2 hours 6 hours 12 hours 1 Day 2 Days 3 Days
5 years 32 45 90 150 200 249 274
50 years (range of low, average, high)
45 50 56
61 69 77
125 137 150
199 230 259
277 305 334
339 380 422
369 419 469
100 years (range of low, average, high)
50 56 62
67 76 85
136 151 166
218 250 286
303 336 369
372 419 465
404 460 518
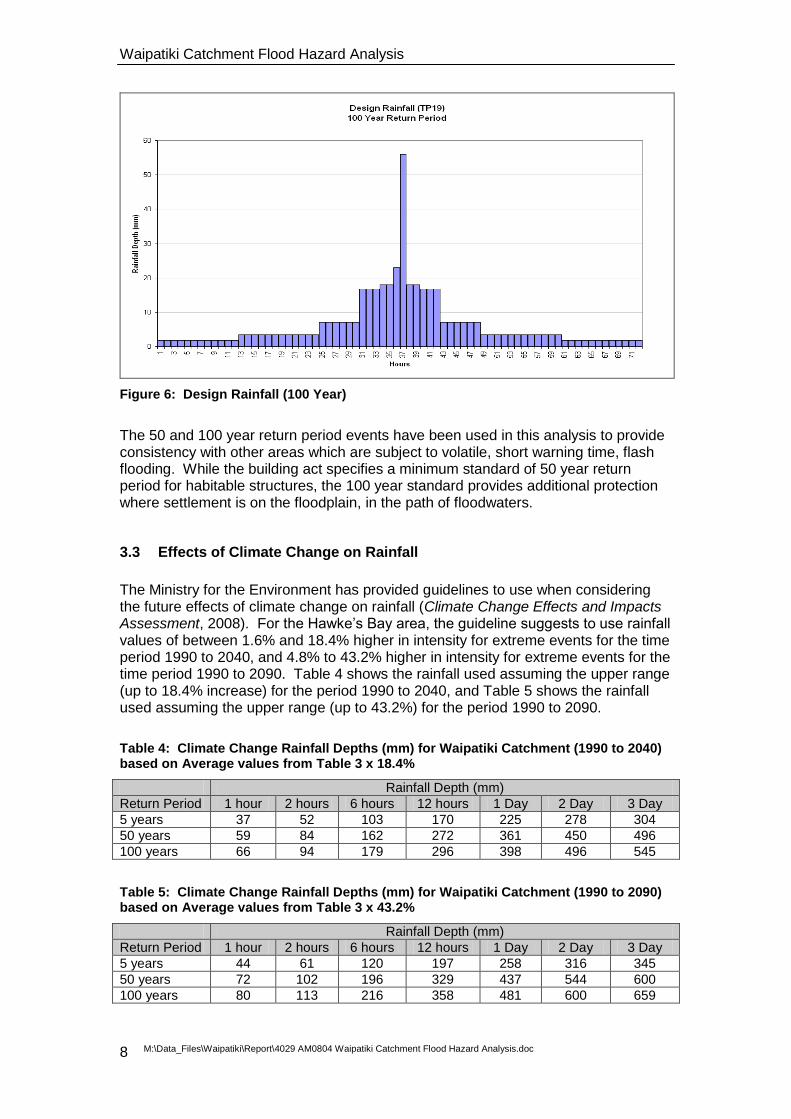
The error range applicable to the TP19 method has been shown for the 50 and 100 year return periods and the range of durations. The significance of this range is that the upper error range of the 50 year values encompasses the average values of the 100 year return period. The lack of long term robust data causes this error range to be significant. When deciding to apply the 50 year or 100 year rainfall values, this error range should be taken into account, i.e. applying a ‘cautious’ 50 year value is equivalent to applying an ‘average’ 100 year value. While these statistically derived rainfall depths provide an indication of the likely severity and return period of rainfall events in the general area, a recent study by the HBRC (Hawke’s Bay Region: Rainfall Frequency Analysis, April 2006) has shown the TP19 method may underestimate the severity of the short term duration extreme events (say 1 to 6 hours), since there is inadequate length of data to base the statistical derivation on. An example of the variation that can occur due to the short term of records is shown in the report, where the rainfall records at Napier Airport were tested with 23 years of data, then 24 years of data, with the additional year of data including a very severe storm. The results showed that including the additional year of data changed the 100 year, 1 hour rainfall depth from 47.2 mm to 93.7 mm. This result shows the variation that may result when inadequate length of data is used. For the case of Waipatiki catchment, there is no sufficient length of record within the catchment to base the design rainfalls on. The method adopted in TP19 utilises the available rainfall data, however caution should be applied in its use, since the possible variations can be significant. The short time of concentration for this catchment (approximately 2 hours) means that the short duration events are the most critical. A full analysis of the rainfall frequency of this catchment is not possible, since there is no adequate length of rainfall record that would prove to be statistically robust. Despite the potential for the rainfall to be underestimated, a design rainfall event has been derived based on the TP19 values. It should be noted with utmost importance that these rainfall values are likely to change as more data comes available. At the present time, the analysis is based on the available data, since there is no other reliable set of data or method to produce the rainfall depths. Using the available data, a ‘Chicago Method’ distribution has been made in order to distribute the rainfall over a 72 hour period (see Figure 6).
Waipatiki Catchment Flood Hazard Analysis
M:\Data_Files\Waipatiki\Report\4029 AM0804 Waipatiki Catchment Flood Hazard Analysis.doc 8
Figure 6: Design Rainfall (100 Year)
The 50 and 100 year return period events have been used in this analysis to provide consistency with other areas which are subject to volatile, short warning time, flash flooding. While the building act specifies a minimum standard of 50 year return period for habitable structures, the 100 year standard provides additional protection where settlement is on the floodplain, in the path of floodwaters.
3.3 Effects of Climate Change on Rainfall
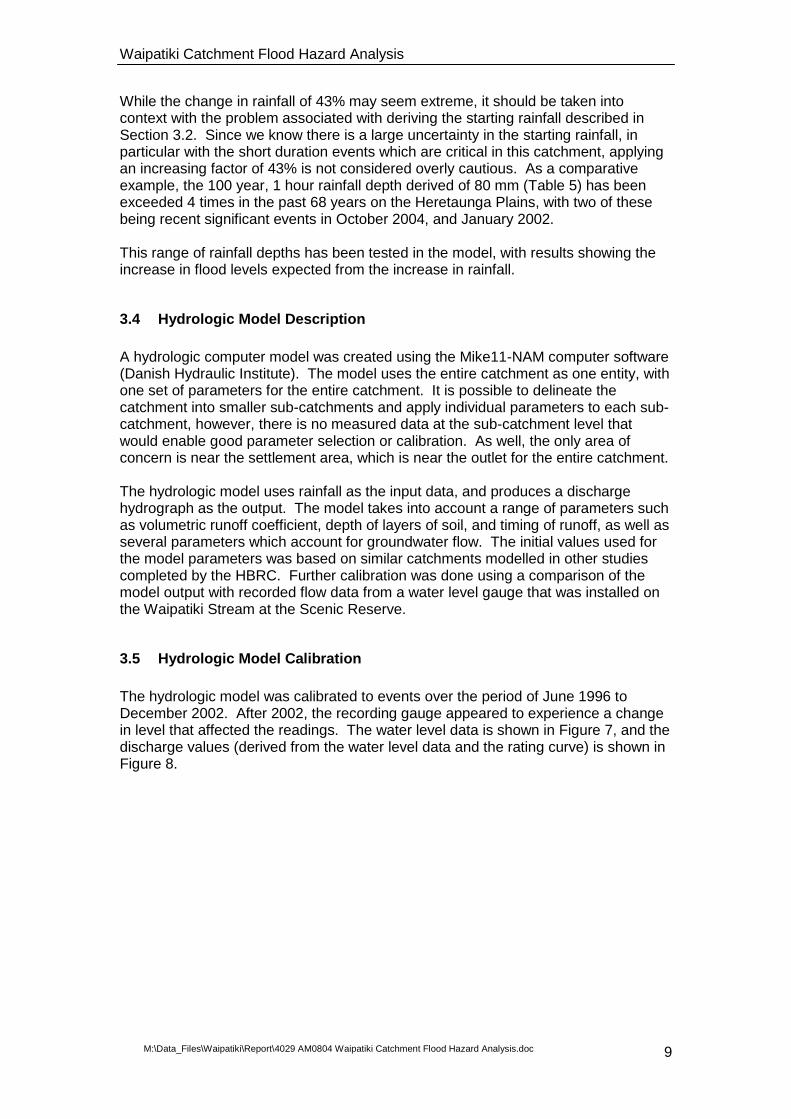
The Ministry for the Environment has provided guidelines to use when considering the future effects of climate change on rainfall (Climate Change Effects and Impacts Assessment, 2008). For the Hawke’s Bay area, the guideline suggests to use rainfall values of between 1.6% and 18.4% higher in intensity for extreme events for the time period 1990 to 2040, and 4.8% to 43.2% higher in intensity for extreme events for the time period 1990 to 2090. Table 4 shows the rainfall used assuming the upper range (up to 18.4% increase) for the period 1990 to 2040, and Table 5 shows the rainfall used assuming the upper range (up to 43.2%) for the period 1990 to 2090.
Table 4: Climate Change Rainfall Depths (mm) for Waipatiki Catchment (1990 to 2040) based on Average values from Table 3 x 18.4%
Rainfall Depth (mm)
Return Period 1 hour 2 hours 6 hours 12 hours 1 Day 2 Day 3 Day
5 years 37 52 103 170 225 278 304
50 years 59 84 162 272 361 450 496
100 years 66 94 179 296 398 496 545
Table 5: Climate Change Rainfall Depths (mm) for Waipatiki Catchment (1990 to 2090) based on Average values from Table 3 x 43.2%
Rainfall Depth (mm)
Return Period 1 hour 2 hours 6 hours 12 hours 1 Day 2 Day 3 Day
5 years 44 61 120 197 258 316 345
50 years 72 102 196 329 437 544 600
100 years 80 113 216 358 481 600 659
Waipatiki Catchment Flood Hazard Analysis
M:\Data_Files\Waipatiki\Report\4029 AM0804 Waipatiki Catchment Flood Hazard Analysis.doc 9
While the change in rainfall of 43% may seem extreme, it should be taken into context with the problem associated with deriving the starting rainfall described in Section 3.2. Since we know there is a large uncertainty in the starting rainfall, in particular with the short duration events which are critical in this catchment, applying an increasing factor of 43% is not considered overly cautious. As a comparative example, the 100 year, 1 hour rainfall depth derived of 80 mm (Table 5) has been exceeded 4 times in the past 68 years on the Heretaunga Plains, with two of these being recent significant events in October 2004, and January 2002. This range of rainfall depths has been tested in the model, with results showing the increase in flood levels expected from the increase in rainfall.
3.4 Hydrologic Model Description
A hydrologic computer model was created using the Mike11-NAM computer software (Danish Hydraulic Institute). The model uses the entire catchment as one entity, with one set of parameters for the entire catchment. It is possible to delineate the catchment into smaller sub-catchments and apply individual parameters to each sub-catchment, however, there is no measured data at the sub-catchment level that would enable good parameter selection or calibration. As well, the only area of concern is near the settlement area, which is near the outlet for the entire catchment. The hydrologic model uses rainfall as the input data, and produces a discharge hydrograph as the output. The model takes into account a range of parameters such as volumetric runoff coefficient, depth of layers of soil, and timing of runoff, as well as several parameters which account for groundwater flow. The initial values used for the model parameters was based on similar catchments modelled in other studies completed by the HBRC. Further calibration was done using a comparison of the model output with recorded flow data from a water level gauge that was installed on the Waipatiki Stream at the Scenic Reserve.
3.5 Hydrologic Model Calibration
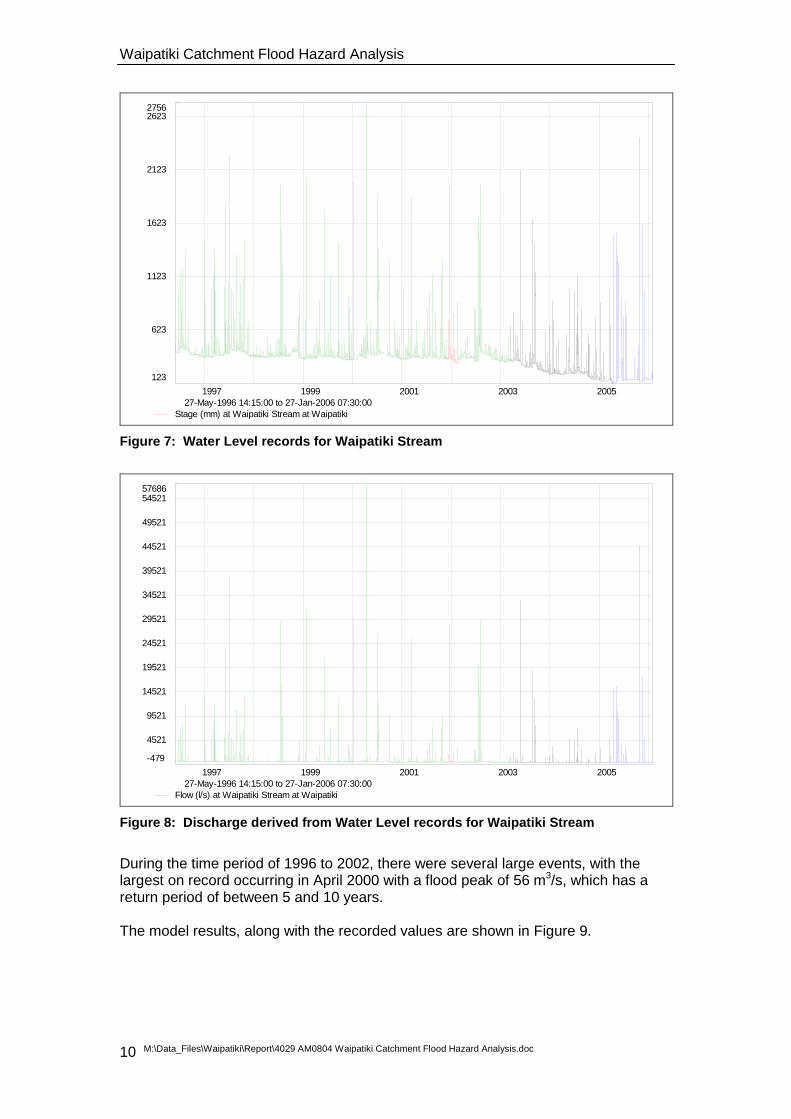
The hydrologic model was calibrated to events over the period of June 1996 to December 2002. After 2002, the recording gauge appeared to experience a change in level that affected the readings. The water level data is shown in Figure 7, and the discharge values (derived from the water level data and the rating curve) is shown in Figure 8.
Waipatiki Catchment Flood Hazard Analysis
M:\Data_Files\Waipatiki\Report\4029 AM0804 Waipatiki Catchment Flood Hazard Analysis.doc 10
1997 1999 2001 2003 2005
123
623
1123
1623
2123
26232756
27-May-1996 14:15:00 to 27-Jan-2006 07:30:00
Stage (mm) at Waipatiki Stream at Waipatiki
Figure 7: Water Level records for Waipatiki Stream
1997 1999 2001 2003 2005
-479
4521
9521
14521
19521
24521
29521
34521
39521
44521
49521
5452157686
27-May-1996 14:15:00 to 27-Jan-2006 07:30:00
Flow (l/s) at Waipatiki Stream at Waipatiki
Figure 8: Discharge derived from Water Level records for Waipatiki Stream
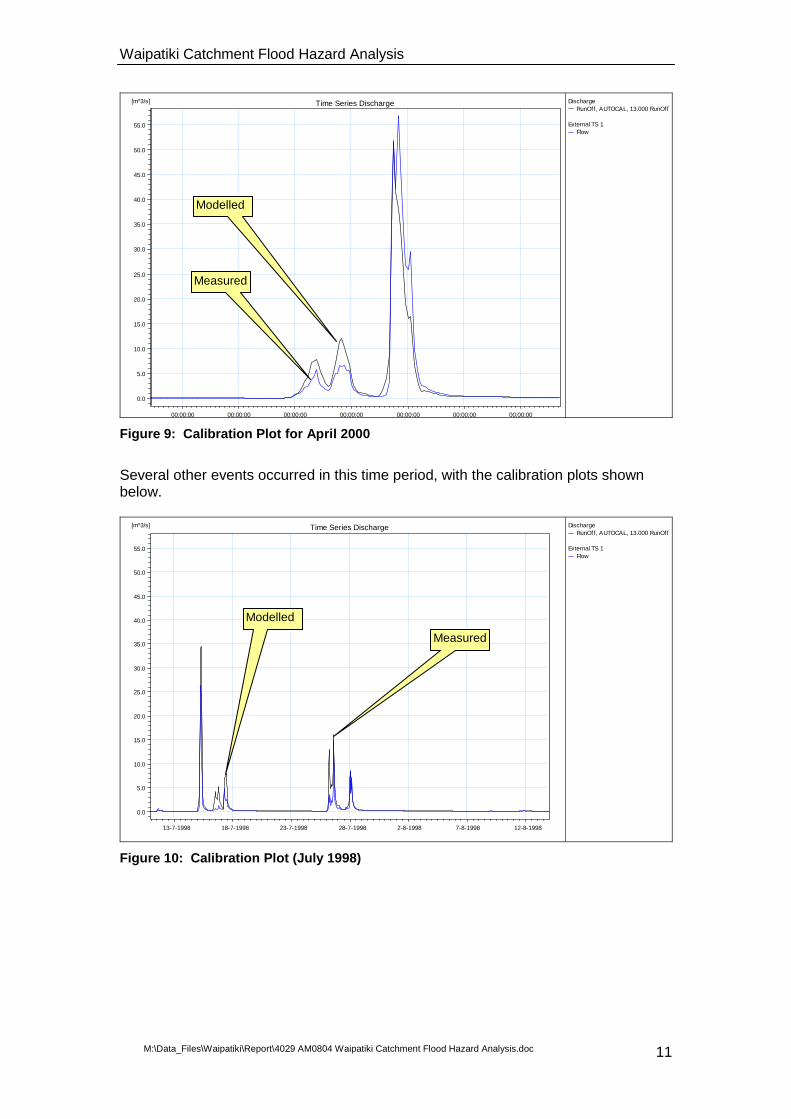
During the time period of 1996 to 2002, there were several large events, with the largest on record occurring in April 2000 with a flood peak of 56 m3/s, which has a return period of between 5 and 10 years. The model results, along with the recorded values are shown in Figure 9.
Waipatiki Catchment Flood Hazard Analysis
M:\Data_Files\Waipatiki\Report\4029 AM0804 Waipatiki Catchment Flood Hazard Analysis.doc 11
00:00:00
7-4-2000
00:00:00
8-4-2000
00:00:00
9-4-2000
00:00:00
10-4-2000
00:00:00
11-4-2000
00:00:00
12-4-2000
00:00:00
13-4-2000
0.0
5.0
10.0
15.0
20.0
25.0
30.0
35.0
40.0
45.0
50.0
55.0
[m^3/s] Time Series Discharge Discharge
RunOff, AUTOCAL, 13.000 RunOff
External TS 1
Flow
Figure 9: Calibration Plot for April 2000
Several other events occurred in this time period, with the calibration plots shown below.
13-7-1998 18-7-1998 23-7-1998 28-7-1998 2-8-1998 7-8-1998 12-8-1998
0.0
5.0
10.0
15.0
20.0
25.0
30.0
35.0
40.0
45.0
50.0
55.0
[m^3/s] Time Series Discharge Discharge
RunOff, AUTOCAL, 13.000 RunOff
External TS 1
Flow
Figure 10: Calibration Plot (July 1998)
Measured
Modelled
Measured
Modelled
Waipatiki Catchment Flood Hazard Analysis
M:\Data_Files\Waipatiki\Report\4029 AM0804 Waipatiki Catchment Flood Hazard Analysis.doc 12
27-6-2000 2-7-2000 7-7-2000 12-7-2000 17-7-2000 22-7-2000 27-7-2000
0.0
5.0
10.0
15.0
20.0
25.0
30.0
35.0
40.0
45.0
50.0
55.0
[m^3/s] Time Series Discharge Discharge
RunOff, AUTOCAL, 13.000 RunOff
External TS 1
Flow
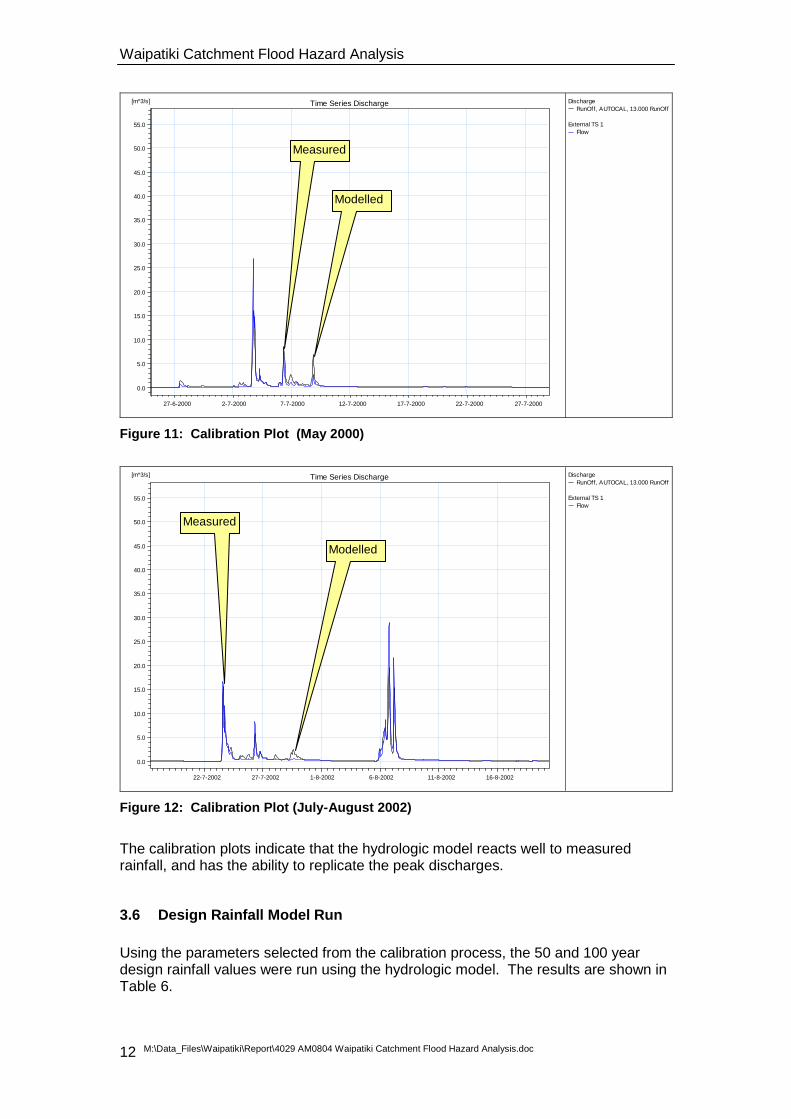
Figure 11: Calibration Plot (May 2000)
22-7-2002 27-7-2002 1-8-2002 6-8-2002 11-8-2002 16-8-2002
0.0
5.0
10.0
15.0
20.0
25.0
30.0
35.0
40.0
45.0
50.0
55.0
[m^3/s] Time Series Discharge Discharge
RunOff, AUTOCAL, 13.000 RunOff
External TS 1
Flow
Figure 12: Calibration Plot (July-August 2002)
The calibration plots indicate that the hydrologic model reacts well to measured rainfall, and has the ability to replicate the peak discharges.
3.6 Design Rainfall Model Run
Using the parameters selected from the calibration process, the 50 and 100 year design rainfall values were run using the hydrologic model. The results are shown in Table 6.
Modelled
Measured
Modelled
Measured
Waipatiki Catchment Flood Hazard Analysis
M:\Data_Files\Waipatiki\Report\4029 AM0804 Waipatiki Catchment Flood Hazard Analysis.doc 13
Table 6: Design Discharge Values
Location Catchment Area (km2)
50 year return period Discharge
(m3/s)
100 year return period Discharge
(m3/s)
Gauge 13 95 107
Stream Outlet 19.3 141 159
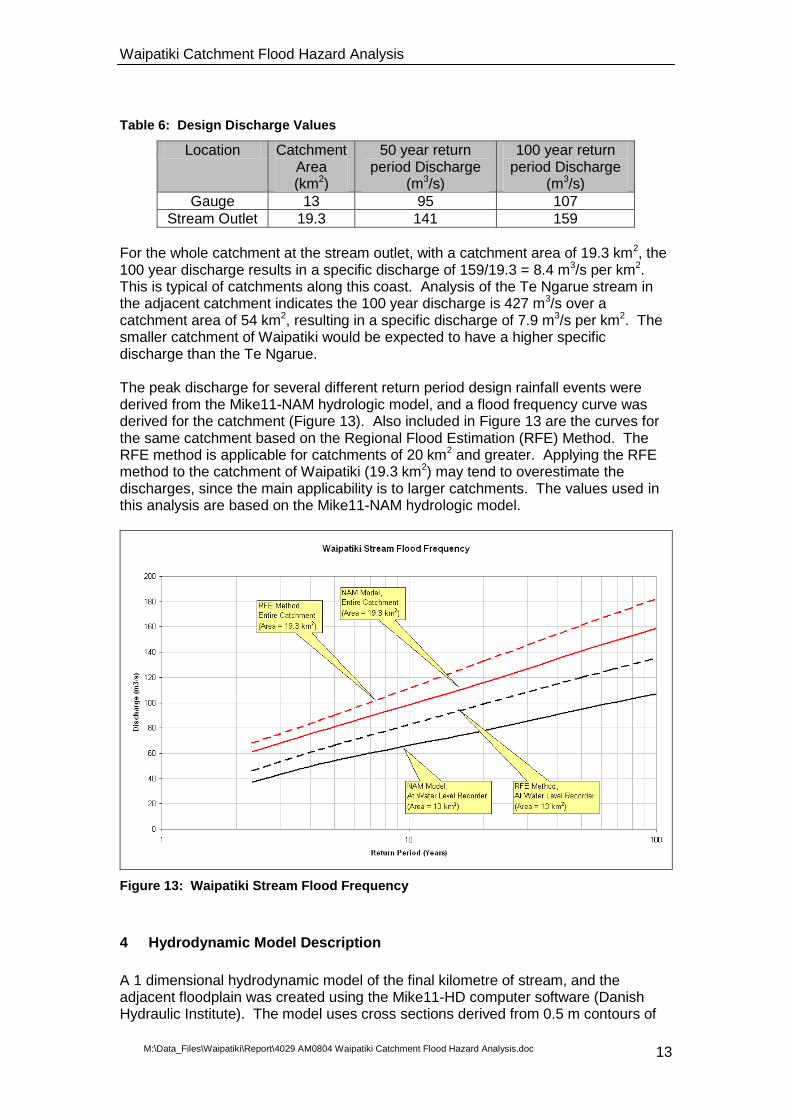
For the whole catchment at the stream outlet, with a catchment area of 19.3 km2, the 100 year discharge results in a specific discharge of 159/19.3 = 8.4 m3/s per km2. This is typical of catchments along this coast. Analysis of the Te Ngarue stream in the adjacent catchment indicates the 100 year discharge is 427 m3/s over a catchment area of 54 km2, resulting in a specific discharge of 7.9 m3/s per km2. The smaller catchment of Waipatiki would be expected to have a higher specific discharge than the Te Ngarue. The peak discharge for several different return period design rainfall events were derived from the Mike11-NAM hydrologic model, and a flood frequency curve was derived for the catchment (Figure 13). Also included in Figure 13 are the curves for the same catchment based on the Regional Flood Estimation (RFE) Method. The RFE method is applicable for catchments of 20 km2 and greater. Applying the RFE method to the catchment of Waipatiki (19.3 km2) may tend to overestimate the discharges, since the main applicability is to larger catchments. The values used in this analysis are based on the Mike11-NAM hydrologic model.
Figure 13: Waipatiki Stream Flood Frequency
4 Hydrodynamic Model Description
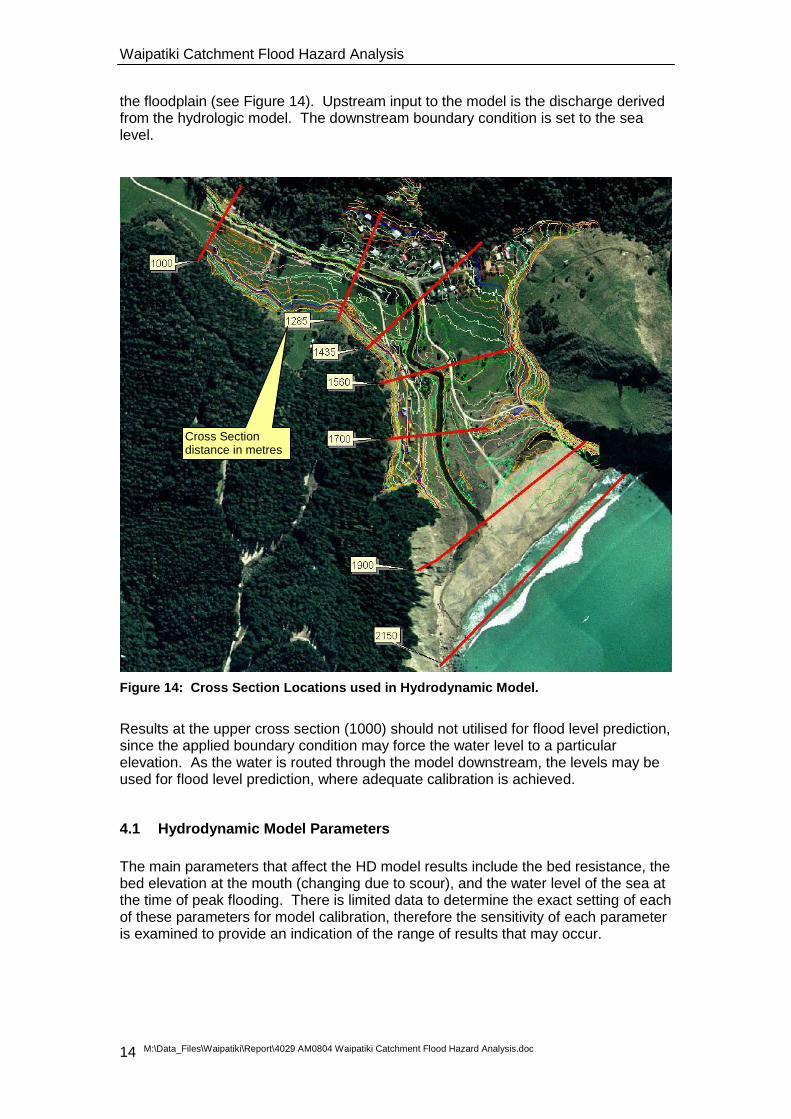
A 1 dimensional hydrodynamic model of the final kilometre of stream, and the adjacent floodplain was created using the Mike11-HD computer software (Danish Hydraulic Institute). The model uses cross sections derived from 0.5 m contours of
Waipatiki Catchment Flood Hazard Analysis
M:\Data_Files\Waipatiki\Report\4029 AM0804 Waipatiki Catchment Flood Hazard Analysis.doc 14
the floodplain (see Figure 14). Upstream input to the model is the discharge derived from the hydrologic model. The downstream boundary condition is set to the sea level.
Figure 14: Cross Section Locations used in Hydrodynamic Model.
Results at the upper cross section (1000) should not utilised for flood level prediction, since the applied boundary condition may force the water level to a particular elevation. As the water is routed through the model downstream, the levels may be used for flood level prediction, where adequate calibration is achieved.
4.1 Hydrodynamic Model Parameters
The main parameters that affect the HD model results include the bed resistance, the bed elevation at the mouth (changing due to scour), and the water level of the sea at the time of peak flooding. There is limited data to determine the exact setting of each of these parameters for model calibration, therefore the sensitivity of each parameter is examined to provide an indication of the range of results that may occur.
Cross Section distance in metres
Waipatiki Catchment Flood Hazard Analysis
M:\Data_Files\Waipatiki\Report\4029 AM0804 Waipatiki Catchment Flood Hazard Analysis.doc 15
4.2 June 1963 Event
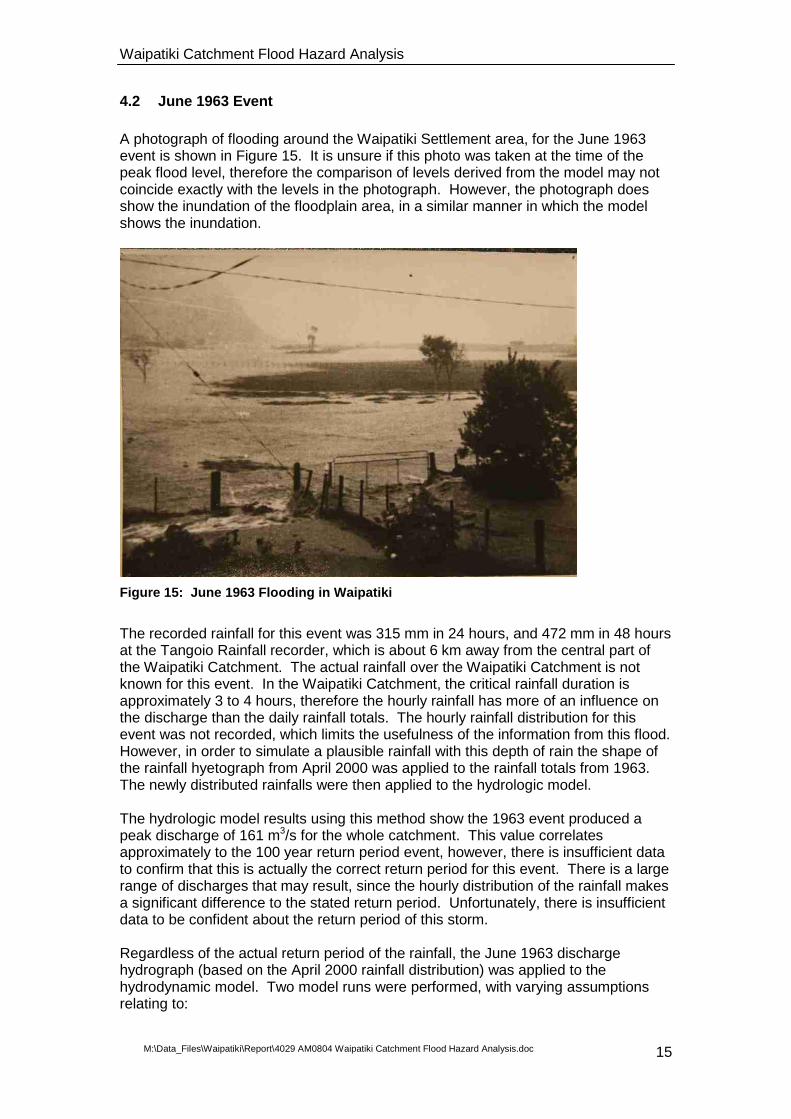
A photograph of flooding around the Waipatiki Settlement area, for the June 1963 event is shown in Figure 15. It is unsure if this photo was taken at the time of the peak flood level, therefore the comparison of levels derived from the model may not coincide exactly with the levels in the photograph. However, the photograph does show the inundation of the floodplain area, in a similar manner in which the model shows the inundation.
Figure 15: June 1963 Flooding in Waipatiki
The recorded rainfall for this event was 315 mm in 24 hours, and 472 mm in 48 hours at the Tangoio Rainfall recorder, which is about 6 km away from the central part of the Waipatiki Catchment. The actual rainfall over the Waipatiki Catchment is not known for this event. In the Waipatiki Catchment, the critical rainfall duration is approximately 3 to 4 hours, therefore the hourly rainfall has more of an influence on the discharge than the daily rainfall totals. The hourly rainfall distribution for this event was not recorded, which limits the usefulness of the information from this flood. However, in order to simulate a plausible rainfall with this depth of rain the shape of the rainfall hyetograph from April 2000 was applied to the rainfall totals from 1963. The newly distributed rainfalls were then applied to the hydrologic model. The hydrologic model results using this method show the 1963 event produced a peak discharge of 161 m3/s for the whole catchment. This value correlates approximately to the 100 year return period event, however, there is insufficient data to confirm that this is actually the correct return period for this event. There is a large range of discharges that may result, since the hourly distribution of the rainfall makes a significant difference to the stated return period. Unfortunately, there is insufficient data to be confident about the return period of this storm. Regardless of the actual return period of the rainfall, the June 1963 discharge hydrograph (based on the April 2000 rainfall distribution) was applied to the hydrodynamic model. Two model runs were performed, with varying assumptions relating to:
Waipatiki Catchment Flood Hazard Analysis
M:\Data_Files\Waipatiki\Report\4029 AM0804 Waipatiki Catchment Flood Hazard Analysis.doc 16
the mouth of the river scoured between RL 7.0 m and RL 9.0 m
the vegetation state of the channel ranged from average to overgrown
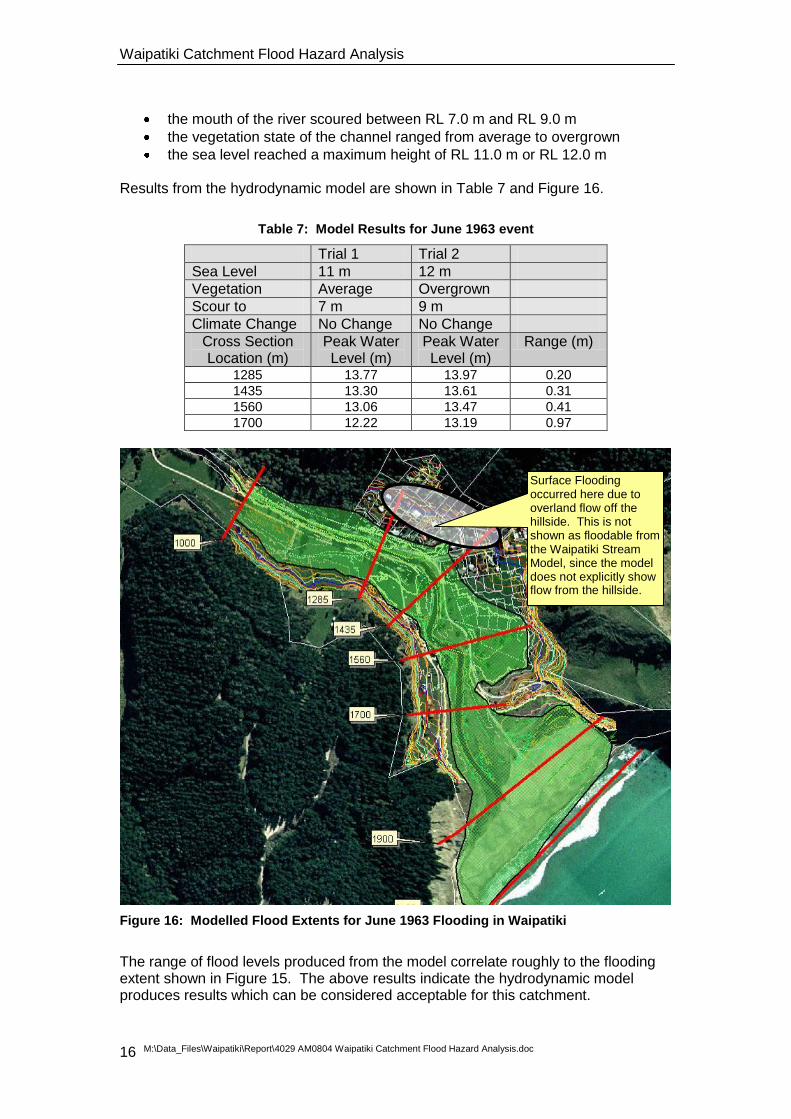
the sea level reached a maximum height of RL 11.0 m or RL 12.0 m Results from the hydrodynamic model are shown in Table 7 and Figure 16.
Table 7: Model Results for June 1963 event
Trial 1 Trial 2
Sea Level 11 m 12 m
Vegetation Average Overgrown
Scour to 7 m 9 m
Climate Change No Change No Change
Cross Section Location (m)
Peak Water Level (m)
Peak Water Level (m)
Range (m)
1285 13.77 13.97 0.20
1435 13.30 13.61 0.31
1560 13.06 13.47 0.41
1700 12.22 13.19 0.97
Figure 16: Modelled Flood Extents for June 1963 Flooding in Waipatiki
The range of flood levels produced from the model correlate roughly to the flooding extent shown in Figure 15. The above results indicate the hydrodynamic model produces results which can be considered acceptable for this catchment.
Surface Flooding occurred here due to overland flow off the hillside. This is not shown as floodable from the Waipatiki Stream Model, since the model does not explicitly show flow from the hillside.
Waipatiki Catchment Flood Hazard Analysis
M:\Data_Files\Waipatiki\Report\4029 AM0804 Waipatiki Catchment Flood Hazard Analysis.doc 17
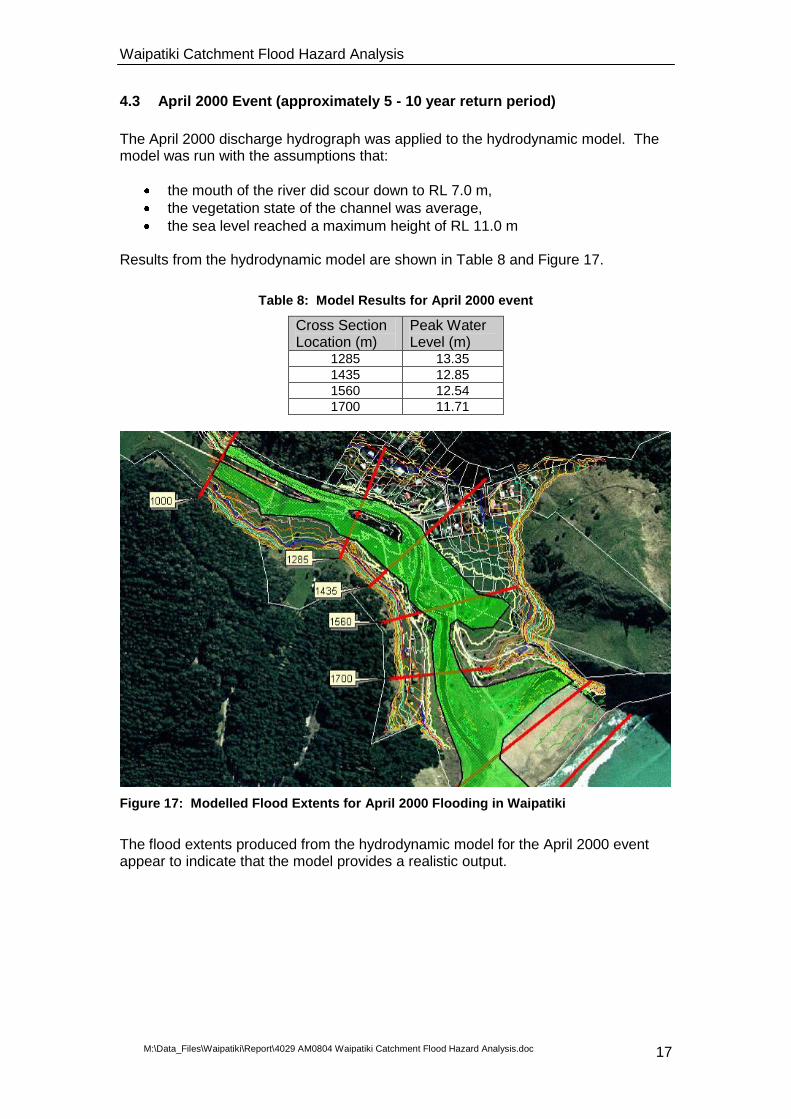
4.3 April 2000 Event (approximately 5 - 10 year return period)
The April 2000 discharge hydrograph was applied to the hydrodynamic model. The model was run with the assumptions that:
the mouth of the river did scour down to RL 7.0 m,
the vegetation state of the channel was average,
the sea level reached a maximum height of RL 11.0 m Results from the hydrodynamic model are shown in Table 8 and Figure 17.
Table 8: Model Results for April 2000 event
Cross Section Location (m)
Peak Water Level (m)
1285 13.35
1435 12.85
1560 12.54
1700 11.71
Figure 17: Modelled Flood Extents for April 2000 Flooding in Waipatiki
The flood extents produced from the hydrodynamic model for the April 2000 event appear to indicate that the model provides a realistic output.
Waipatiki Catchment Flood Hazard Analysis
M:\Data_Files\Waipatiki\Report\4029 AM0804 Waipatiki Catchment Flood Hazard Analysis.doc 18
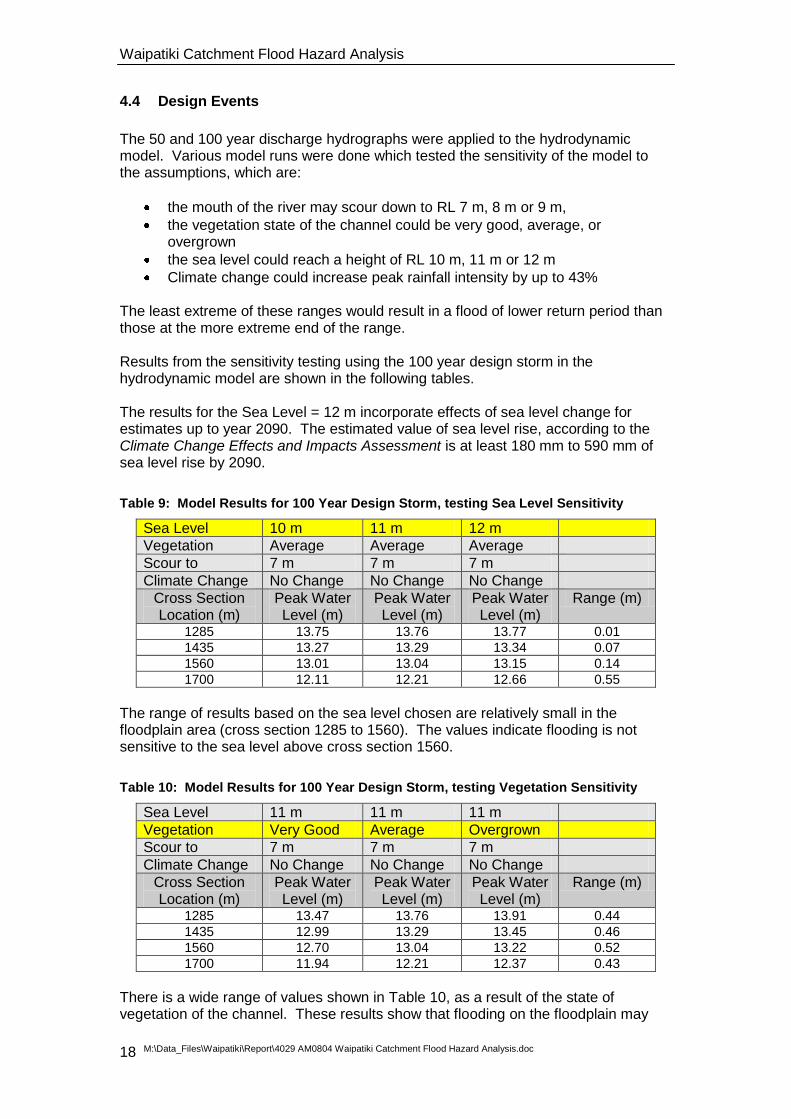
4.4 Design Events
The 50 and 100 year discharge hydrographs were applied to the hydrodynamic model. Various model runs were done which tested the sensitivity of the model to the assumptions, which are:
the mouth of the river may scour down to RL 7 m, 8 m or 9 m,
the vegetation state of the channel could be very good, average, or overgrown
the sea level could reach a height of RL 10 m, 11 m or 12 m
Climate change could increase peak rainfall intensity by up to 43% The least extreme of these ranges would result in a flood of lower return period than those at the more extreme end of the range. Results from the sensitivity testing using the 100 year design storm in the hydrodynamic model are shown in the following tables. The results for the Sea Level = 12 m incorporate effects of sea level change for estimates up to year 2090. The estimated value of sea level rise, according to the Climate Change Effects and Impacts Assessment is at least 180 mm to 590 mm of sea level rise by 2090.
Table 9: Model Results for 100 Year Design Storm, testing Sea Level Sensitivity
Sea Level 10 m 11 m 12 m
Vegetation Average Average Average
Scour to 7 m 7 m 7 m
Climate Change No Change No Change No Change
Cross Section Location (m)
Peak Water Level (m)
Peak Water Level (m)
Peak Water Level (m)
Range (m)
1285 13.75 13.76 13.77 0.01
1435 13.27 13.29 13.34 0.07
1560 13.01 13.04 13.15 0.14
1700 12.11 12.21 12.66 0.55
The range of results based on the sea level chosen are relatively small in the floodplain area (cross section 1285 to 1560). The values indicate flooding is not sensitive to the sea level above cross section 1560.
Table 10: Model Results for 100 Year Design Storm, testing Vegetation Sensitivity
Sea Level 11 m 11 m 11 m
Vegetation Very Good Average Overgrown
Scour to 7 m 7 m 7 m
Climate Change No Change No Change No Change
Cross Section Location (m)
Peak Water Level (m)
Peak Water Level (m)
Peak Water Level (m)
Range (m)
1285 13.47 13.76 13.91 0.44
1435 12.99 13.29 13.45 0.46
1560 12.70 13.04 13.22 0.52
1700 11.94 12.21 12.37 0.43
There is a wide range of values shown in Table 10, as a result of the state of vegetation of the channel. These results show that flooding on the floodplain may
Waipatiki Catchment Flood Hazard Analysis
M:\Data_Files\Waipatiki\Report\4029 AM0804 Waipatiki Catchment Flood Hazard Analysis.doc 19
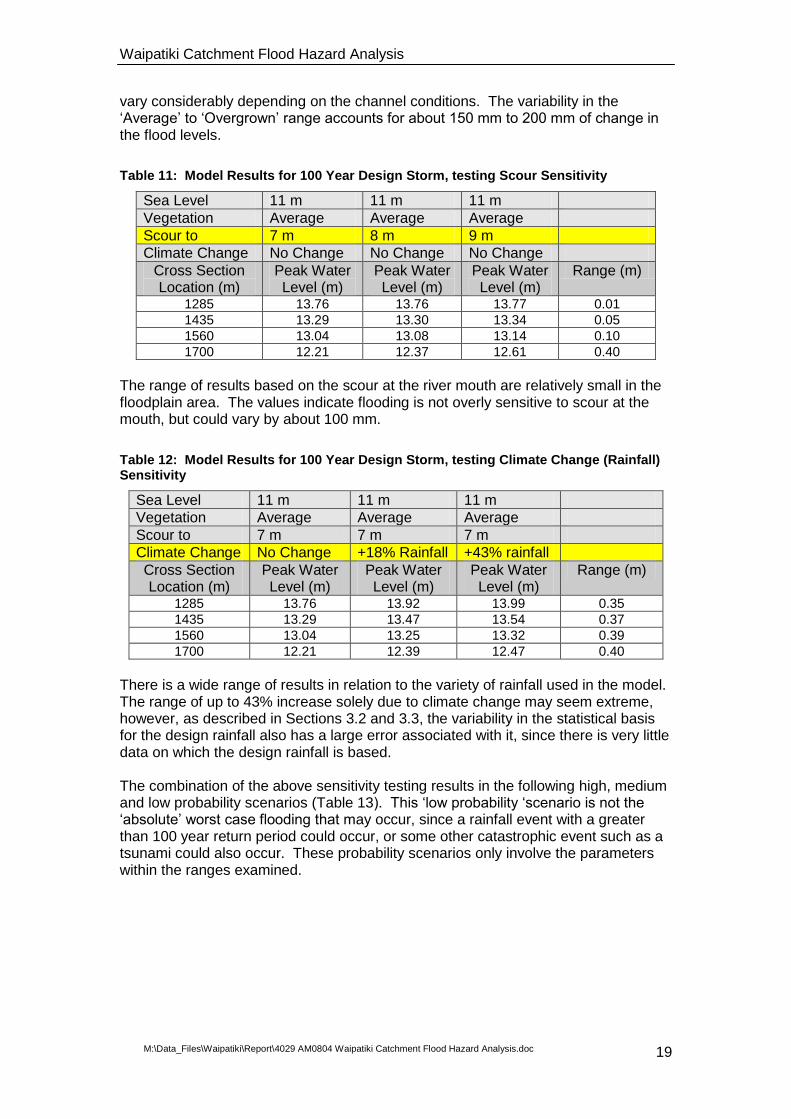
vary considerably depending on the channel conditions. The variability in the ‘Average’ to ‘Overgrown’ range accounts for about 150 mm to 200 mm of change in the flood levels.
Table 11: Model Results for 100 Year Design Storm, testing Scour Sensitivity
Sea Level 11 m 11 m 11 m
Vegetation Average Average Average
Scour to 7 m 8 m 9 m
Climate Change No Change No Change No Change
Cross Section Location (m)
Peak Water Level (m)
Peak Water Level (m)
Peak Water Level (m)
Range (m)
1285 13.76 13.76 13.77 0.01
1435 13.29 13.30 13.34 0.05
1560 13.04 13.08 13.14 0.10
1700 12.21 12.37 12.61 0.40
The range of results based on the scour at the river mouth are relatively small in the floodplain area. The values indicate flooding is not overly sensitive to scour at the mouth, but could vary by about 100 mm.
Table 12: Model Results for 100 Year Design Storm, testing Climate Change (Rainfall) Sensitivity
Sea Level 11 m 11 m 11 m
Vegetation Average Average Average
Scour to 7 m 7 m 7 m
Climate Change No Change +18% Rainfall +43% rainfall
Cross Section Location (m)
Peak Water Level (m)
Peak Water Level (m)
Peak Water Level (m)
Range (m)
1285 13.76 13.92 13.99 0.35
1435 13.29 13.47 13.54 0.37
1560 13.04 13.25 13.32 0.39
1700 12.21 12.39 12.47 0.40
There is a wide range of results in relation to the variety of rainfall used in the model. The range of up to 43% increase solely due to climate change may seem extreme, however, as described in Sections 3.2 and 3.3, the variability in the statistical basis for the design rainfall also has a large error associated with it, since there is very little data on which the design rainfall is based. The combination of the above sensitivity testing results in the following high, medium and low probability scenarios (Table 13). This ‘low probability ‘scenario is not the ‘absolute’ worst case flooding that may occur, since a rainfall event with a greater than 100 year return period could occur, or some other catastrophic event such as a tsunami could also occur. These probability scenarios only involve the parameters within the ranges examined.
Waipatiki Catchment Flood Hazard Analysis
M:\Data_Files\Waipatiki\Report\4029 AM0804 Waipatiki Catchment Flood Hazard Analysis.doc 20
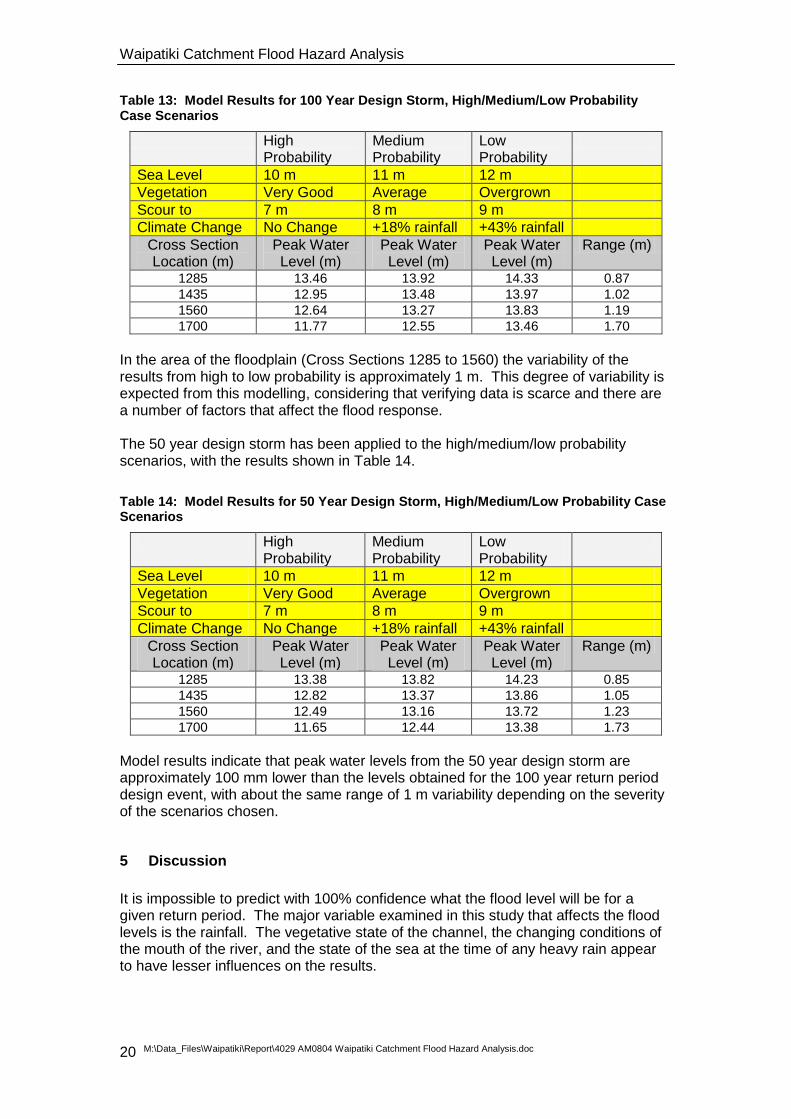
Table 13: Model Results for 100 Year Design Storm, High/Medium/Low Probability Case Scenarios
High Probability
Medium Probability
Low Probability
Sea Level 10 m 11 m 12 m
Vegetation Very Good Average Overgrown
Scour to 7 m 8 m 9 m
Climate Change No Change +18% rainfall +43% rainfall
Cross Section Location (m)
Peak Water Level (m)
Peak Water Level (m)
Peak Water Level (m)
Range (m)
1285 13.46 13.92 14.33 0.87
1435 12.95 13.48 13.97 1.02
1560 12.64 13.27 13.83 1.19
1700 11.77 12.55 13.46 1.70
In the area of the floodplain (Cross Sections 1285 to 1560) the variability of the results from high to low probability is approximately 1 m. This degree of variability is expected from this modelling, considering that verifying data is scarce and there are a number of factors that affect the flood response. The 50 year design storm has been applied to the high/medium/low probability scenarios, with the results shown in Table 14.
Table 14: Model Results for 50 Year Design Storm, High/Medium/Low Probability Case Scenarios
High Probability
Medium Probability
Low Probability
Sea Level 10 m 11 m 12 m
Vegetation Very Good Average Overgrown
Scour to 7 m 8 m 9 m
Climate Change No Change +18% rainfall +43% rainfall
Cross Section Location (m)
Peak Water Level (m)
Peak Water Level (m)
Peak Water Level (m)
Range (m)
1285 13.38 13.82 14.23 0.85
1435 12.82 13.37 13.86 1.05
1560 12.49 13.16 13.72 1.23
1700 11.65 12.44 13.38 1.73
Model results indicate that peak water levels from the 50 year design storm are approximately 100 mm lower than the levels obtained for the 100 year return period design event, with about the same range of 1 m variability depending on the severity of the scenarios chosen.
5 Discussion
It is impossible to predict with 100% confidence what the flood level will be for a given return period. The major variable examined in this study that affects the flood levels is the rainfall. The vegetative state of the channel, the changing conditions of the mouth of the river, and the state of the sea at the time of any heavy rain appear to have lesser influences on the results.
Waipatiki Catchment Flood Hazard Analysis
M:\Data_Files\Waipatiki\Report\4029 AM0804 Waipatiki Catchment Flood Hazard Analysis.doc 21
A computer model has been used to assist in determining the flood level that may result from a given rainfall. The calibration of this model is considered good for the events that it has been tested on. The results indicate a significant flood hazard exists in the floodplain area. The HBRC has a responsibility to ensure that where hazards are identified, the land owners are aware of the hazards, along with the likely timing and effects. It is necessary now to rationalise the results of this study to determine a suitable level for which a habitable building could be considered reasonably safe from flooding. The Territorial Authority has an obligation to ensure the minimum standard applicable from the Building Code is applied to all new habitable buildings built in the flood plain. The current minimum standard indicates that the 50 year (or 2% annual exceedence probability) should be applied. The Building Code requirement is based on flooding that would occur in relatively tranquil conditions, such as might exist in an urban area where the drainage capacity is exceeded. A freeboard of 0.5 m is added to the 50 year flood level to allow for waves caused by passing vehicles. This ‘tranquil’ flooding situation is not what exists at Waipatiki. The floodable area of Waipatiki has relatively fast flowing water, including flood debris and silt, and therefore a higher standard of flood protection is called for. In this case, large variations in predicted flood levels occur from the factors identified in the analysis, which produce variations of up to 500 mm (for the range tested in the model), and none of these variations includes waves in the flood flow. The NZ Standards for Land Development and Subdivision Engineering (2004) also provide guidance on suitable freeboard, although there is arguably some conflict with the Building Act. The Standards state:
The minimum freeboard height additional to the computed flood protection level shall be 0.5 m for habitable buildings.
Freeboard is a provision for flood level design estimate imprecision, construction tolerances and natural phenomena (e.g. waves, debris, aggradations, channel transitions and bend effects) not explicitly included in the calculations.
A minimum freeboard height of 0.5 m is generally applicable but should be increased for sites adjoining steep rough channels and may be reduced for sites adjoining tranquil ponds.
The floodplain area of Waipatiki is not a tranquil pond, and more closely tends to a steep rough channel, indicating a freeboard of greater than 0.5 m is applicable. In order to arrive at a suitable flood level from the above analysis, it may be suggested that a moderate approach of using the 18% increase in rainfall due to climate change should be used, however, this 18% increase was derived for the period 1990 to 2040. The year 2040 is only 32 years from the present, and it is anticipated any structure built in the floodplain would have a life of at least 50 years, and more likely up to 100 years. A sensible approach would thus be to incorporate potential rainfall increases which take into account the time frame beyond 2040. The following tables show the medium and low probability flood level values, along with the average of these values for each cross section location. The average value takes into account the possibility of some increase in rainfall, either from climate change, or from an increase in the design rainfall values due to changes after examining the statistics using a longer period of data. The average value also takes
Waipatiki Catchment Flood Hazard Analysis
M:\Data_Files\Waipatiki\Report\4029 AM0804 Waipatiki Catchment Flood Hazard Analysis.doc 22
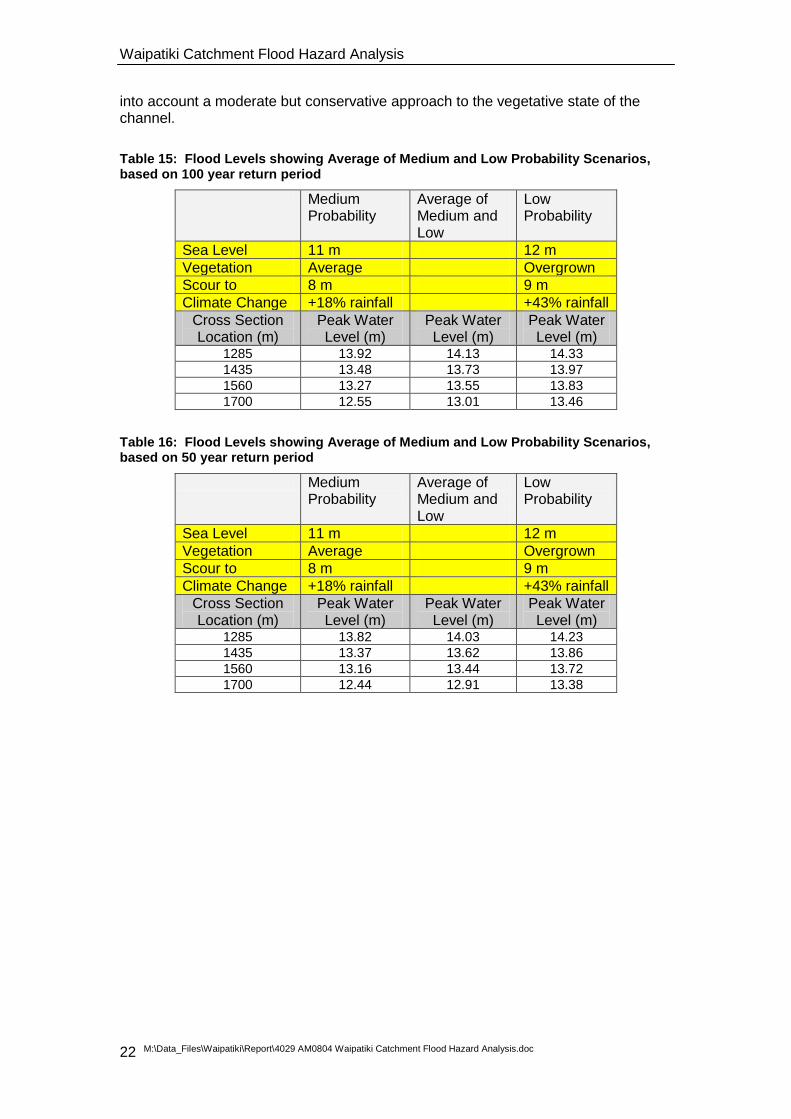
into account a moderate but conservative approach to the vegetative state of the channel.
Table 15: Flood Levels showing Average of Medium and Low Probability Scenarios, based on 100 year return period
Medium Probability
Average of Medium and Low
Low Probability
Sea Level 11 m 12 m
Vegetation Average Overgrown
Scour to 8 m 9 m
Climate Change +18% rainfall +43% rainfall
Cross Section Location (m)
Peak Water Level (m)
Peak Water Level (m)
Peak Water Level (m)
1285 13.92 14.13 14.33
1435 13.48 13.73 13.97
1560 13.27 13.55 13.83
1700 12.55 13.01 13.46
Table 16: Flood Levels showing Average of Medium and Low Probability Scenarios, based on 50 year return period
Medium Probability
Average of Medium and Low
Low Probability
Sea Level 11 m 12 m
Vegetation Average Overgrown
Scour to 8 m 9 m
Climate Change +18% rainfall +43% rainfall
Cross Section Location (m)
Peak Water Level (m)
Peak Water Level (m)
Peak Water Level (m)
1285 13.82 14.03 14.23
1435 13.37 13.62 13.86
1560 13.16 13.44 13.72
1700 12.44 12.91 13.38
Waipatiki Catchment Flood Hazard Analysis
M:\Data_Files\Waipatiki\Report\4029 AM0804 Waipatiki Catchment Flood Hazard Analysis.doc 23
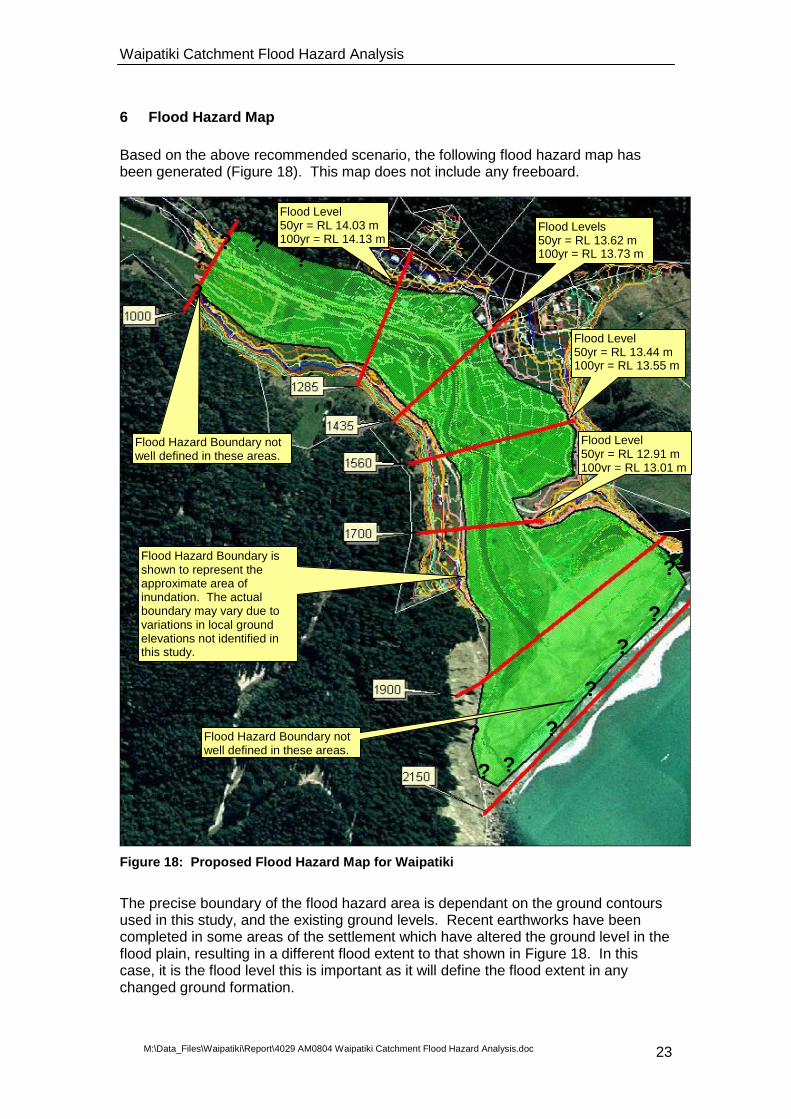
6 Flood Hazard Map
Based on the above recommended scenario, the following flood hazard map has been generated (Figure 18). This map does not include any freeboard.
Figure 18: Proposed Flood Hazard Map for Waipatiki
The precise boundary of the flood hazard area is dependant on the ground contours used in this study, and the existing ground levels. Recent earthworks have been completed in some areas of the settlement which have altered the ground level in the flood plain, resulting in a different flood extent to that shown in Figure 18. In this case, it is the flood level this is important as it will define the flood extent in any changed ground formation.
Flood Level 50yr = RL 14.03 m 100yr = RL 14.13 m
Flood Levels 50yr = RL 13.62 m 100yr = RL 13.73 m
Flood Level 50yr = RL 13.44 m 100yr = RL 13.55 m
Flood Level 50yr = RL 12.91 m 100yr = RL 13.01 m m
?
?
? ?
?
?
?
?
Flood Hazard Boundary not well defined in these areas.
?
? ? ?
?
Flood Hazard Boundary not well defined in these areas.
Flood Hazard Boundary is shown to represent the approximate area of inundation. The actual boundary may vary due to variations in local ground elevations not identified in this study.
Waipatiki Catchment Flood Hazard Analysis
M:\Data_Files\Waipatiki\Report\4029 AM0804 Waipatiki Catchment Flood Hazard Analysis.doc 24
7 Effects of Raising of Flood Prone Area above the Recommended Flood Level
The computer model was used to examine the effects of filling a portion of the left bank of the floodplain area, around cross section 1560. The model results indicate that filling the area (i.e. removing it from being available for conveyance of flood waters) results in an increase of about 100 mm in the peak flood level upstream of the filled area.
8 Conclusion
The settlement of Waipatiki is located in the floodplain of a small coastal catchment, just north of Napier. The valley has been subjected to several severe floods in the past, and it is highly likely that flooding will occur again in the valley. Based on the information available, as with many cases involving weather events, there are a number of uncertainties, and therefore a precautionary approach is recommended when deciding the values to apply in terms of flood levels. Using a precautionary approach, a flood hazard area has been delineated for the Waipatiki Settlement area.
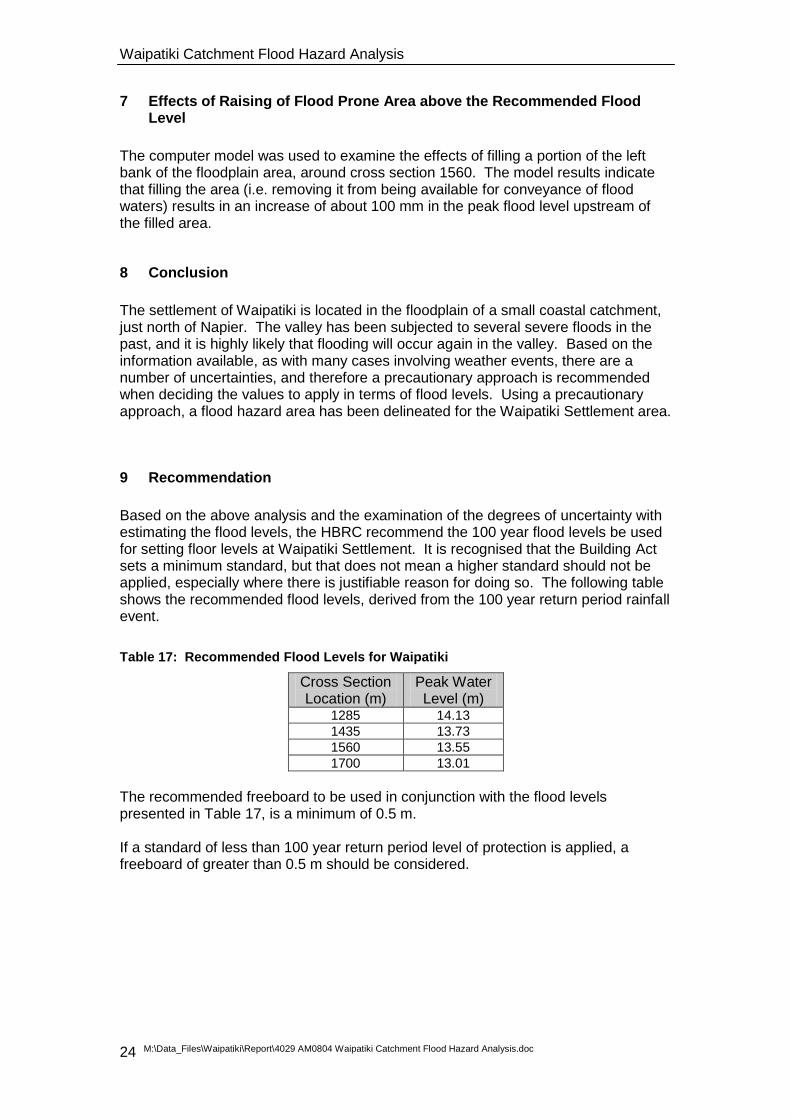
9 Recommendation
Based on the above analysis and the examination of the degrees of uncertainty with estimating the flood levels, the HBRC recommend the 100 year flood levels be used for setting floor levels at Waipatiki Settlement. It is recognised that the Building Act sets a minimum standard, but that does not mean a higher standard should not be applied, especially where there is justifiable reason for doing so. The following table shows the recommended flood levels, derived from the 100 year return period rainfall event.
Table 17: Recommended Flood Levels for Waipatiki
Cross Section Location (m)
Peak Water Level (m)
1285 14.13
1435 13.73
1560 13.55
1700 13.01
The recommended freeboard to be used in conjunction with the flood levels presented in Table 17, is a minimum of 0.5 m. If a standard of less than 100 year return period level of protection is applied, a freeboard of greater than 0.5 m should be considered.
Waipatiki Catchment Flood Hazard Analysis
M:\Data_Files\Waipatiki\Report\4029 AM0804 Waipatiki Catchment Flood Hazard Analysis.doc 25
10 References:
Hawke’s Bay Regional Council (2005), Te Ngarue Catchment Flood Hazard Study, HBRC Plan Number 3794, Report Number AM05/08. Hawke’s Bay Regional Council (2006), Hawke’s Bay Region: Rainfall Frequency Analysis, HBRC Plan Number 3842, Report Number AM06/06. McKerchar, A., Beable, M., (1983) Regional Flood Estimation - A Design Procedure, Transactions of the Institute of Professional Engineers of New Zealand, Vol.10, No.1. Ministry for the Environment (2008) Climate Change Effects and Impacts Assessment: A Guidance Manual for Local Government in New Zealand. 2nd Edition. Mullan, B. et. al. Ministry for the Environment, Wellington. New Zealand Standards (2004), Land Development and Subdivision Engineering, NZS 4404:2004. Tomlinson, A. (1980) The Frequency of High Intensity Rainfalls in New Zealand, Technical Publication 19. National Water and Soil Conservation Organisation.