Embed Size (px)
Citation preview
Brisbane River Catchment
Flood Studyoverview
Brisbane River Catchment Flood Study overview
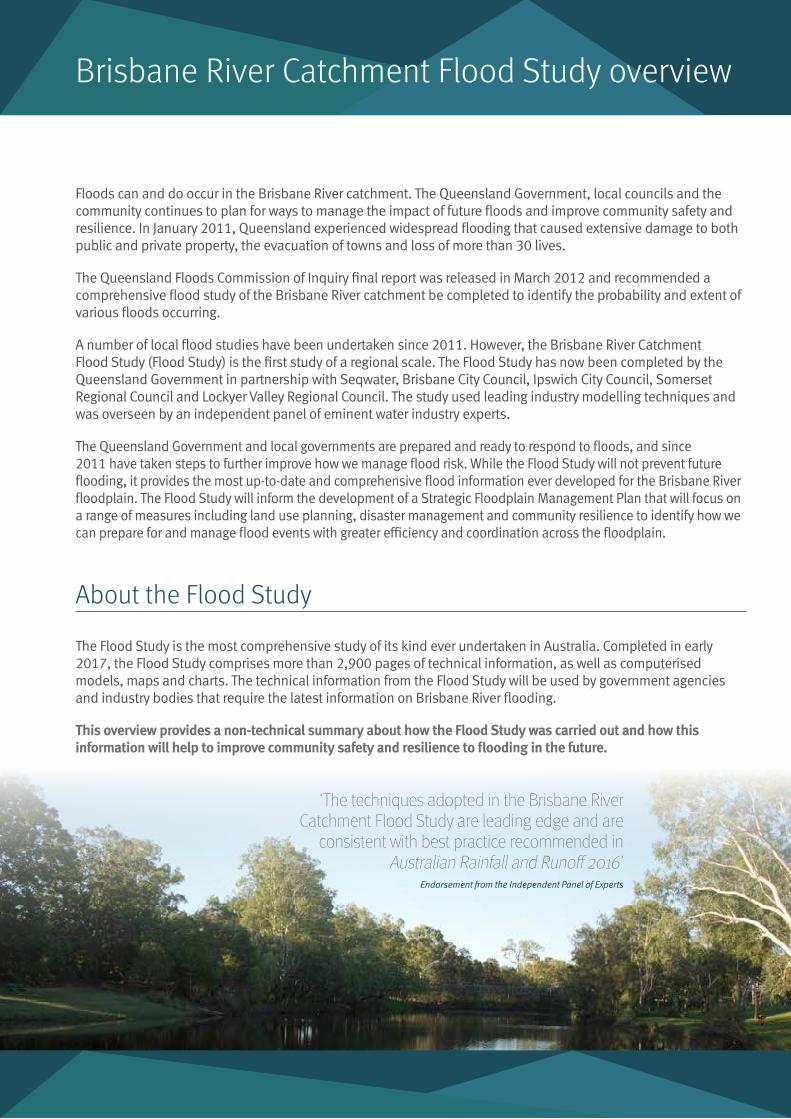
Floods can and do occur in the Brisbane River catchment. The Queensland Government, local councils and the community continues to plan for ways to manage the impact of future floods and improve community safety and resilience. In January 2011, Queensland experienced widespread flooding that caused extensive damage to both public and private property, the evacuation of towns and loss of more than 30 lives.
The Queensland Floods Commission of Inquiry final report was released in March 2012 and recommended a comprehensive flood study of the Brisbane River catchment be completed to identify the probability and extent of various floods occurring.
A number of local flood studies have been undertaken since 2011. However, the Brisbane River Catchment Flood Study (Flood Study) is the first study of a regional scale. The Flood Study has now been completed by the Queensland Government in partnership with Seqwater, Brisbane City Council, Ipswich City Council, Somerset Regional Council and Lockyer Valley Regional Council. The study used leading industry modelling techniques and was overseen by an independent panel of eminent water industry experts.
The Queensland Government and local governments are prepared and ready to respond to floods, and since 2011 have taken steps to further improve how we manage flood risk. While the Flood Study will not prevent future flooding, it provides the most up-to-date and comprehensive flood information ever developed for the Brisbane River floodplain. The Flood Study will inform the development of a Strategic Floodplain Management Plan that will focus on a range of measures including land use planning, disaster management and community resilience to identify how we can prepare for and manage flood events with greater efficiency and coordination across the floodplain.
About the Flood Study
The Flood Study is the most comprehensive study of its kind ever undertaken in Australia. Completed in early 2017, the Flood Study comprises more than 2,900 pages of technical information, as well as computerised models, maps and charts. The technical information from the Flood Study will be used by government agencies and industry bodies that require the latest information on Brisbane River flooding.
This overview provides a non-technical summary about how the Flood Study was carried out and how this information will help to improve community safety and resilience to flooding in the future.
Brisbane River Catchment Flood Study overview
‘The techniques adopted in the Brisbane River Catchment Flood Study are leading edge and are
consistent with best practice recommended in Australian Rainfall and Runoff 2016’
Endorsement from the Independent Panel of Experts
www.qldra.org.au/BRCFS
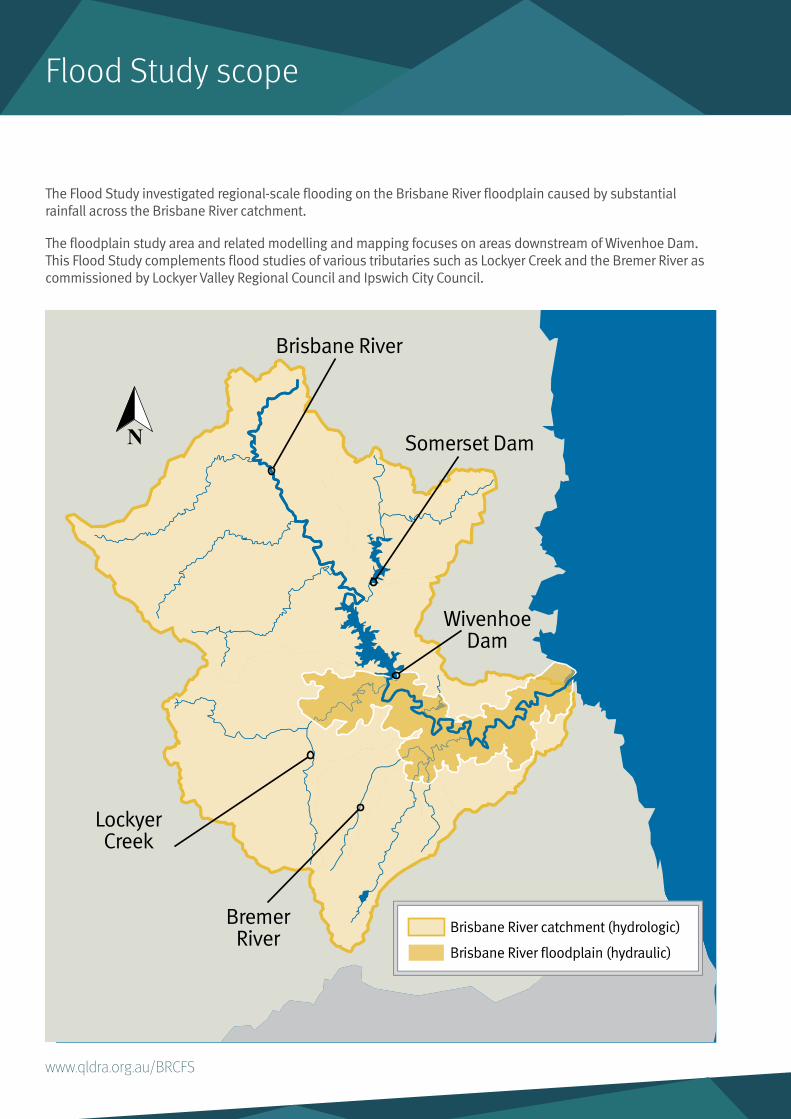
The Flood Study investigated regional-scale flooding on the Brisbane River floodplain caused by substantial rainfall across the Brisbane River catchment.
The floodplain study area and related modelling and mapping focuses on areas downstream of Wivenhoe Dam. This Flood Study complements flood studies of various tributaries such as Lockyer Creek and the Bremer River as commissioned by Lockyer Valley Regional Council and Ipswich City Council.
Wivenhoe Dam
Lockyer Creek
Bremer River
Somerset Dam
Brisbane River
Brisbane River catchment (hydrologic)
Brisbane River fl oodplain (hydraulic)
Flood Study scope
Brisbane River Catchment Flood Study overview
Terminology used to describe flood events
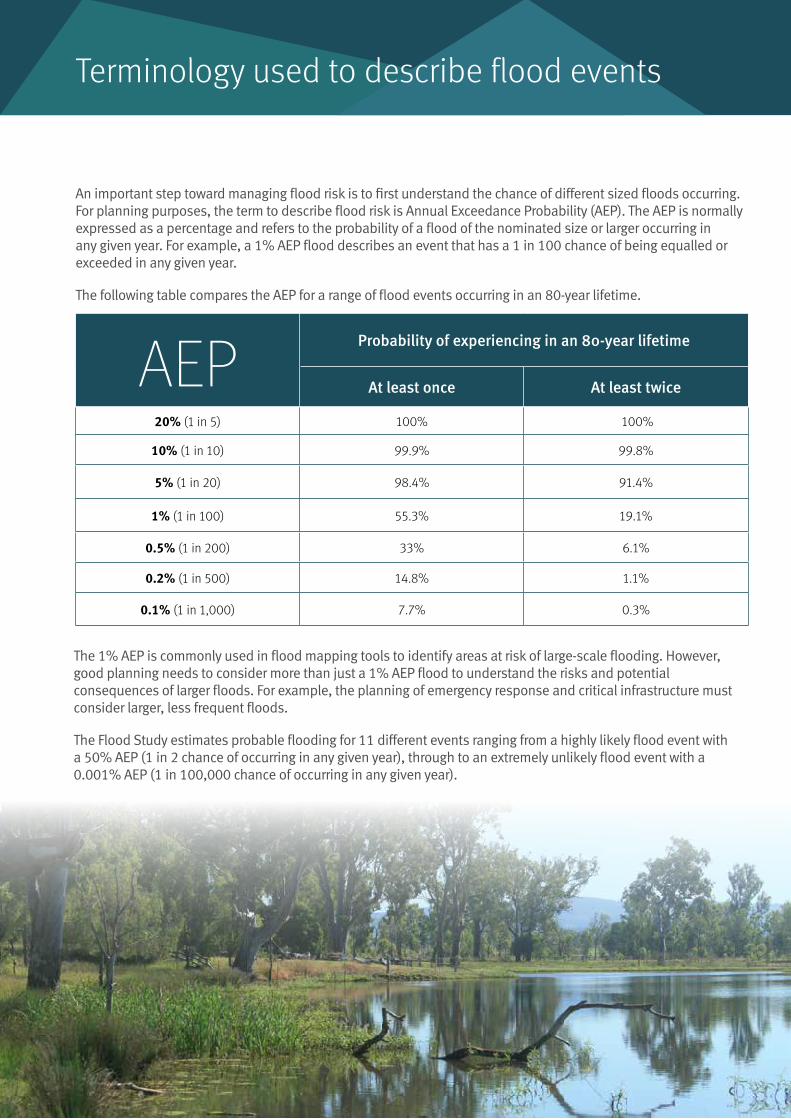
AEPProbability of experiencing in an 80-year lifetime
At least once At least twice
20% (1 in 5) 100% 100%
10% (1 in 10) 99.9% 99.8%
5% (1 in 20) 98.4% 91.4%
1% (1 in 100) 55.3% 19.1%
0.5% (1 in 200) 33% 6.1%
0.2% (1 in 500) 14.8% 1.1%
0.1% (1 in 1,000) 7.7% 0.3%
The 1% AEP is commonly used in flood mapping tools to identify areas at risk of large-scale flooding. However, good planning needs to consider more than just a 1% AEP flood to understand the risks and potential consequences of larger floods. For example, the planning of emergency response and critical infrastructure must consider larger, less frequent floods.
The Flood Study estimates probable flooding for 11 different events ranging from a highly likely flood event with a 50% AEP (1 in 2 chance of occurring in any given year), through to an extremely unlikely flood event with a 0.001% AEP (1 in 100,000 chance of occurring in any given year).
An important step toward managing flood risk is to first understand the chance of different sized floods occurring. For planning purposes, the term to describe flood risk is Annual Exceedance Probability (AEP). The AEP is normally expressed as a percentage and refers to the probability of a flood of the nominated size or larger occurring in any given year. For example, a 1% AEP flood describes an event that has a 1 in 100 chance of being equalled or exceeded in any given year.
The following table compares the AEP for a range of flood events occurring in an 80-year lifetime.
www.qldra.org.au/BRCFS
Steps to deliver the Flood Study
The information below outlines the processes undertaken to deliver the Flood Study and next steps, including the development of a Strategic Floodplain Management Plan and Local Floodplain Management Plans.
These processes follow best practice in risk management as set out by the Australian Government in Handbook 7: Managing the Floodplain – a guide to best practice flood risk management in Australia.
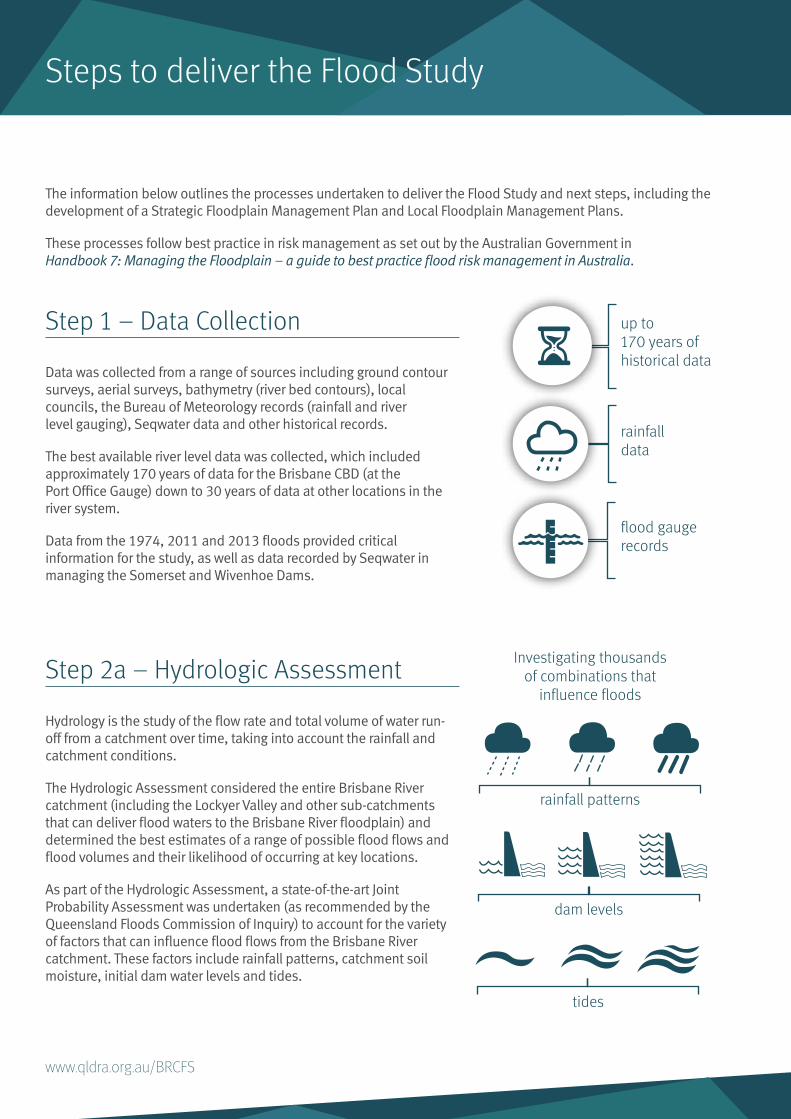
Step 1 – Data Collection
Data was collected from a range of sources including ground contour surveys, aerial surveys, bathymetry (river bed contours), local councils, the Bureau of Meteorology records (rainfall and river level gauging), Seqwater data and other historical records.
The best available river level data was collected, which included approximately 170 years of data for the Brisbane CBD (at the Port Office Gauge) down to 30 years of data at other locations in the river system.
Data from the 1974, 2011 and 2013 floods provided critical information for the study, as well as data recorded by Seqwater in managing the Somerset and Wivenhoe Dams.
Step 2a – Hydrologic Assessment
Hydrology is the study of the flow rate and total volume of water run-off from a catchment over time, taking into account the rainfall and catchment conditions.
The Hydrologic Assessment considered the entire Brisbane River catchment (including the Lockyer Valley and other sub-catchments that can deliver flood waters to the Brisbane River floodplain) and determined the best estimates of a range of possible flood flows and flood volumes and their likelihood of occurring at key locations.
As part of the Hydrologic Assessment, a state-of-the-art Joint Probability Assessment was undertaken (as recommended by the Queensland Floods Commission of Inquiry) to account for the variety of factors that can influence flood flows from the Brisbane River catchment. These factors include rainfall patterns, catchment soil moisture, initial dam water levels and tides.
up to 170 years of historical data
flood gauge records
rainfall data
rainfall patterns
dam levels
tides
Investigating thousands of combinations that
influence floods
Brisbane River Catchment Flood Study overview
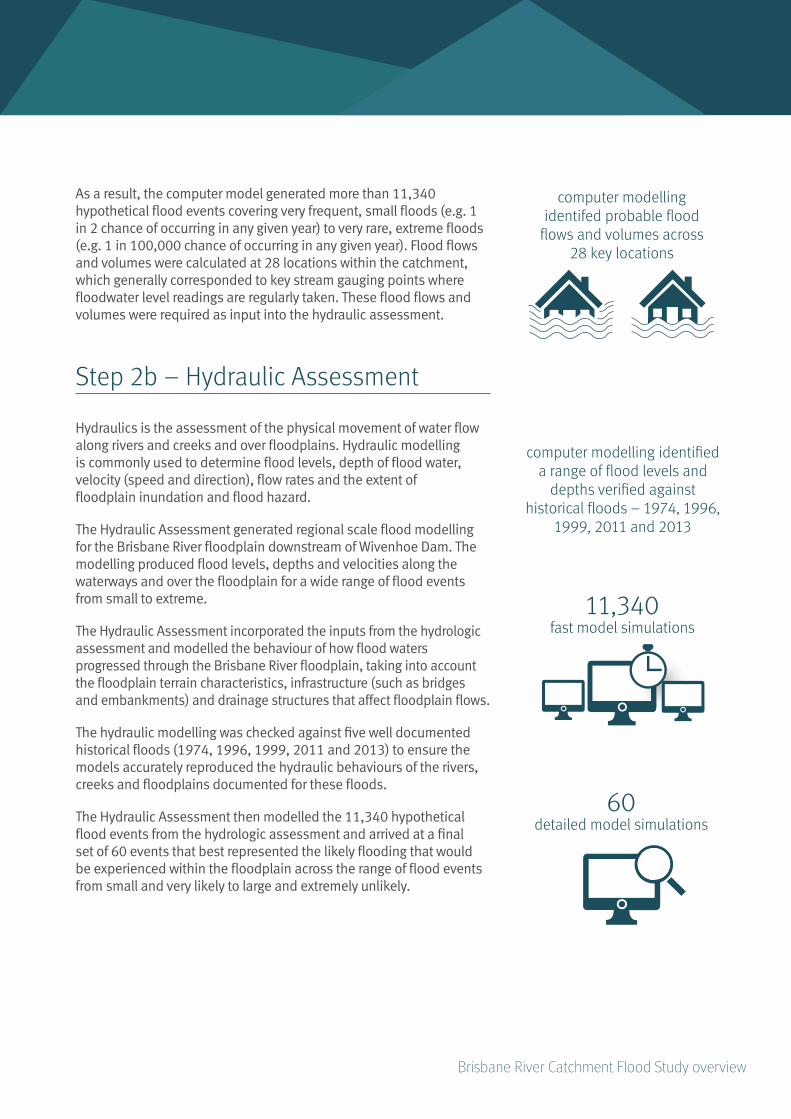
computer modelling identifed probable flood
flows and volumes across 28 key locations
computer modelling identified a range of flood levels and
depths verified against historical floods – 1974, 1996,
1999, 2011 and 2013
11,340fast model simulations
60detailed model simulations
As a result, the computer model generated more than 11,340 hypothetical flood events covering very frequent, small floods (e.g. 1 in 2 chance of occurring in any given year) to very rare, extreme floods (e.g. 1 in 100,000 chance of occurring in any given year). Flood flows and volumes were calculated at 28 locations within the catchment, which generally corresponded to key stream gauging points where floodwater level readings are regularly taken. These flood flows and volumes were required as input into the hydraulic assessment.
Step 2b – Hydraulic Assessment
Hydraulics is the assessment of the physical movement of water flow along rivers and creeks and over floodplains. Hydraulic modelling is commonly used to determine flood levels, depth of flood water, velocity (speed and direction), flow rates and the extent of floodplain inundation and flood hazard.
The Hydraulic Assessment generated regional scale flood modelling for the Brisbane River floodplain downstream of Wivenhoe Dam. The modelling produced flood levels, depths and velocities along the waterways and over the floodplain for a wide range of flood events from small to extreme.
The Hydraulic Assessment incorporated the inputs from the hydrologic assessment and modelled the behaviour of how flood waters progressed through the Brisbane River floodplain, taking into account the floodplain terrain characteristics, infrastructure (such as bridges and embankments) and drainage structures that affect floodplain flows.
The hydraulic modelling was checked against five well documented historical floods (1974, 1996, 1999, 2011 and 2013) to ensure the models accurately reproduced the hydraulic behaviours of the rivers, creeks and floodplains documented for these floods.
The Hydraulic Assessment then modelled the 11,340 hypothetical flood events from the hydrologic assessment and arrived at a final set of 60 events that best represented the likely flooding that would be experienced within the floodplain across the range of flood events from small and very likely to large and extremely unlikely.
www.qldra.org.au/BRCFS
Differing combinations of rainfall (amounts, timing and location) and ground conditions influence flood behaviour in diverse ways and can impact the speed of flood waters, timing of when and where water levels will rise and likely flood heights. The Flood Study provides the most up-to-date flood information ever obtained for the Brisbane River floodplain to help increase our level of understanding about flood behaviour to better predict the likely impact of flood events as they develop.
No two flood events are the same. They can involve minor localised flooding due to high rainfall over a short period in an isolated area or major flood events across the entire floodplain due to extreme weather over an extended period.
The Flood Study assessed 11 possible AEPs ranging from a 50% AEP (1 in 2) to a 0.001% AEP (1 in 100,000), which is considered the rarest event that can be estimated and is included in line with best practice in flood risk management. This flood study demonstrates that, while larger floods are rare and much less likely to occur, they can happen and we need to be prepared.
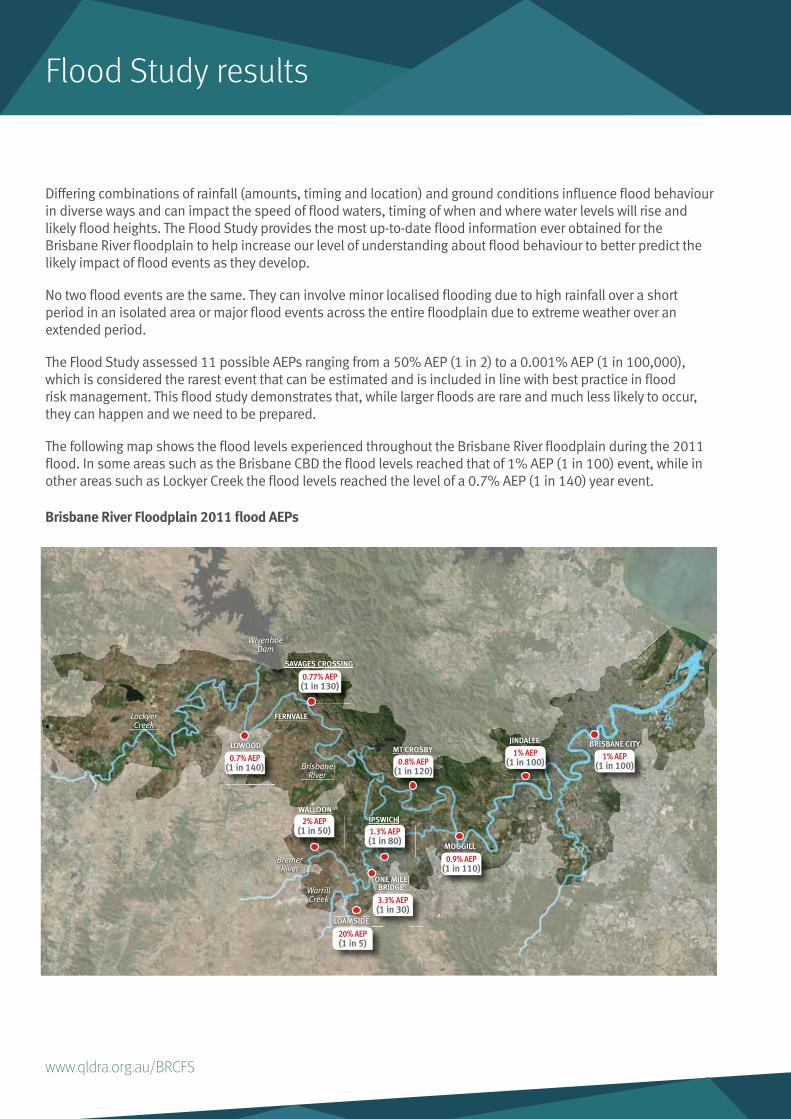
The following map shows the flood levels experienced throughout the Brisbane River floodplain during the 2011 flood. In some areas such as the Brisbane CBD the flood levels reached that of 1% AEP (1 in 100) event, while in other areas such as Lockyer Creek the flood levels reached the level of a 0.7% AEP (1 in 140) year event.
Brisbane River Floodplain 2011 flood AEPs
Flood Study results
1% AEP(1 in 100)
1% AEP(1 in 100)0.8% AEP
(1 in 120)
0.9% AEP(1 in 110)
2% AEP(1 in 50)
3.3% AEP(1 in 30)
1.3% AEP(1 in 80)
20% AEP(1 in 5)
0.77% AEP(1 in 130)
0.7% AEP(1 in 140)
LOWOOD BRISBANE CITYMT CROSBY
SAVAGES CROSSING
MOGGILL
JINDALEE
IPSWICH
ONE MILEBRIDGE
WALLOON
LOAMSIDE
FERNVALE
Brisbane River
Wivenhoe Dam
Lockyer Creek
Bremer River
Warrill Creek
Brisbane River Catchment Flood Study overview
Flood Study outputs
The Flood Study has delivered the following information that will be used by governments to analyse the risk and impacts of a variety of floods that may occur in the future.
• Technical Summary Report – an 80-page report summarising more than 2,900 pages of technical information including maps, tables and charts.
• Flood levels and results – identification of flood events for 11 AEPs ranging from small and highly likely to extreme and highly unlikely.
• Detailed Hydraulic Model – a one and two-dimensional computer (mathematical) model that simulates floods. It is designed to produce high-quality information about flood levels, depths and velocities for a wide range of floods from small to extreme. The model will be used throughout the development of the Strategic Floodplain Management Plan to understand the impacts of a range of options including structural works, land use planning and disaster management.
Flood Study outputs
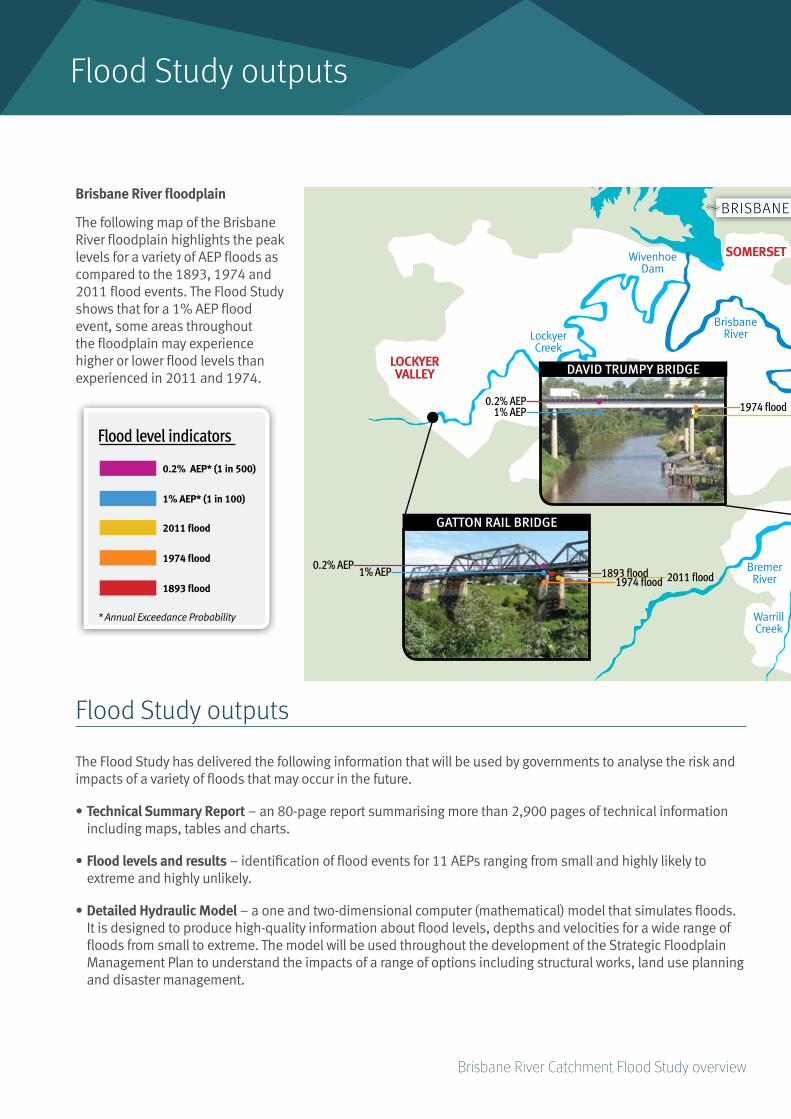
Brisbane River floodplain
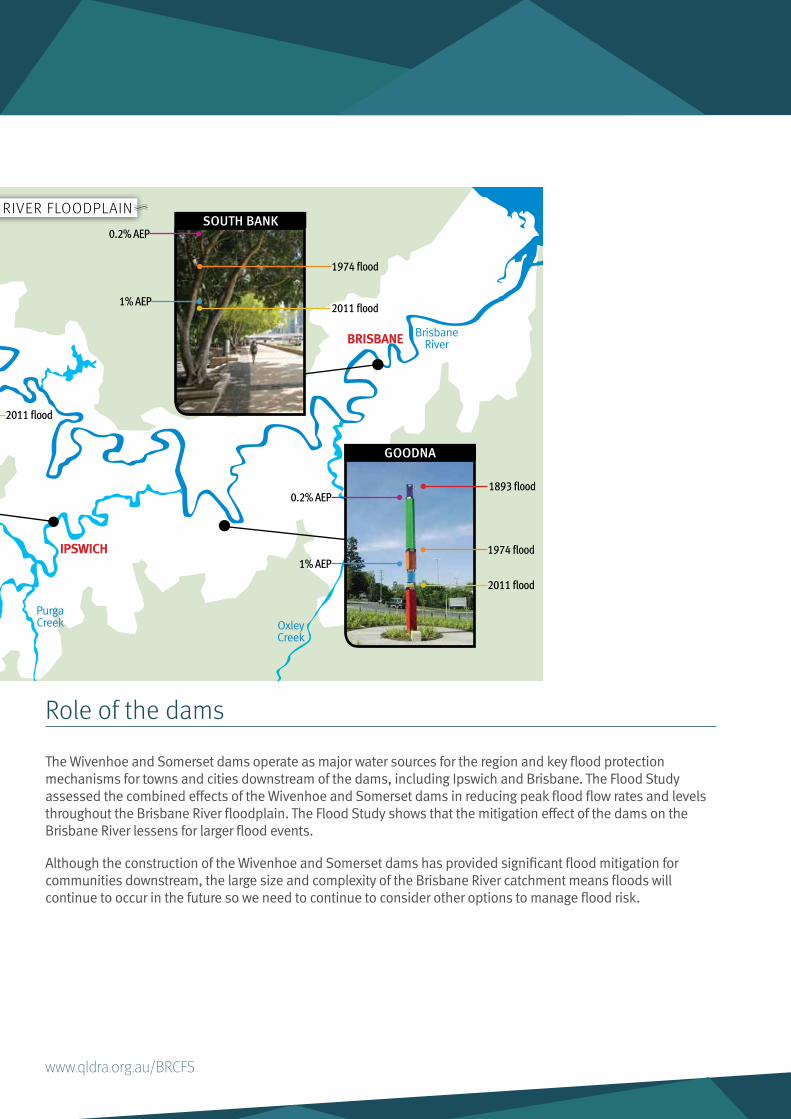
The following map of the Brisbane River floodplain highlights the peak levels for a variety of AEP floods as compared to the 1893, 1974 and 2011 flood events. The Flood Study shows that for a 1% AEP flood event, some areas throughout the floodplain may experience higher or lower flood levels than experienced in 2011 and 1974.
Brisbane River
Brisbane River
Wivenhoe Dam
Oxley Creek
Lockyer Creek
Bremer River
Warrill Creek
Purga Creek
BRISBANE
LOCKYERVALLEY
IPSWICH
SOMERSET
GATTON RAIL BRIDGE
0.2% AEP1% AEP 1893 fl ood
1974 fl ood 2011 fl ood
DAVID TRUMPY BRIDGE
2011 fl ood1974 fl ood1% AEP
0.2% AEP
SOUTH BANK0.2% AEP
2011 fl ood
1974 fl ood
1% AEP
0.2% AEP
2011 fl ood
1974 fl ood1% AEP
1893 fl ood
GOODNA
BRISBANE RIVER FLOODPLAIN
Flood level indicators
0.2% AEP* (1 in 500)
1% AEP* (1 in 100)
2011 fl ood
1974 fl ood
1893 fl ood
* Annual Exceedance Probability
www.qldra.org.au/BRCFS
Role of the dams
The Wivenhoe and Somerset dams operate as major water sources for the region and key flood protection mechanisms for towns and cities downstream of the dams, including Ipswich and Brisbane. The Flood Study assessed the combined effects of the Wivenhoe and Somerset dams in reducing peak flood flow rates and levels throughout the Brisbane River floodplain. The Flood Study shows that the mitigation effect of the dams on the Brisbane River lessens for larger flood events.
Although the construction of the Wivenhoe and Somerset dams has provided significant flood mitigation for communities downstream, the large size and complexity of the Brisbane River catchment means floods will continue to occur in the future so we need to continue to consider other options to manage flood risk.
Brisbane River
Brisbane River
Wivenhoe Dam
Oxley Creek
Lockyer Creek
Bremer River
Warrill Creek
Purga Creek
BRISBANE
LOCKYERVALLEY
IPSWICH
SOMERSET
GATTON RAIL BRIDGE
0.2% AEP1% AEP 1893 fl ood
1974 fl ood 2011 fl ood
DAVID TRUMPY BRIDGE
2011 fl ood1974 fl ood1% AEP
0.2% AEP
SOUTH BANK0.2% AEP
2011 fl ood
1974 fl ood
1% AEP
0.2% AEP
2011 fl ood
1974 fl ood1% AEP
1893 fl ood
GOODNA
BRISBANE RIVER FLOODPLAIN
Brisbane River Catchment Flood Study overview
The Queensland Government and local governments are working with communities and emergency services to manage flood risk. Prior to the completion of the Flood Study, a set of disaster management maps were developed as an interim disaster management tool ahead of the 2013/14 wet season. The tool complements existing local government flood strategies. It also provides interim guidance to councils on flood risk management while awaiting the outcomes of the Strategic Floodplain Management Plan.
The Wivenhoe and Somerset Dams Optimisation Study was completed in 2014 and examined existing dam flood operations to determine options for improved flood mitigation while ensuring water supply security. Seqwater has updated its flood operations manual for Wivenhoe and Somerset Dams in response to the recommendations from the optimisation study. The new operational strategy changes water releases from Wivenhoe Dam to improve flood mitigation for urban areas. The changes enhance flood mitigation without putting future water supplies at risk.
The four local governments involved in the Flood Study have all adopted planning scheme amendments that incorporate revised flood overlays and policies as recommended through the Queensland Floods Commission of Inquiry (QFCoI). Further steps have been taken by councils to improve community safety and manage flood risk such as the installation of new and upgraded flood early warning systems, updated local disaster management plans, purchase of flood prone properties and completion of more than 50 local flood studies of important tributaries and creeks across the floodplain. Other important measures delivered since 2011 include:
Brisbane City Council
• highly Commended by Engineers Australia in 2016 for building a Flood Resilient Brisbane as a result of completing all 74 QFCoI interim report recommendations relevant to Council and all 50 of the Commission’s final report recommendations, plus 53 actions in council’s own Flood Action Plan
• a strategic approach to flood risk management through the development and implementation of the FloodSmart Future Strategy including a hazard-based land use planning scheme
• development of online flood tools, products and services including updated FloodWise Property Reports and new Flood Awareness Maps as guides for residents and businesses, enabling communities to understand and prepare for flood
• investment in improved drainage infrastructure, backflow prevention devices and flood resilient designs for infrastructure at high risk of flooding such as ferry terminals and Riverwalk
• implementation of a new 24/7 Floodwise monitoring and reporting system with the installation of new telemetry gauges for rainfall (2) and stream level (2) and the relocation of two existing rainfall gauges.
Ipswich City Council
• investment in flood mitigation infrastructure including the Thagoona Township levee, and regional detention basins for the Jim Donald and Redbank Plains parklands
• upgrade and expansion of real-time flood gauge networks
• major updates to the Local Disaster Management Plan and emergency management procedures.
Somerset Regional Council
• investment in LED signs for emergency messaging, flood cameras at eight locations and establishment of Local Disaster Coordination Centres at Esk, Kilcoy and Fernvale
• implementation of a Disaster Management Dashboard and free Early Warning Network service for residents
• installation of electronic ‘Road Closed’ signs at Twin Bridges and Savages Crossing.
Lockyer Valley Regional Council
• a land swap initiative to relocate the town of Grantham as part of the Strengthening Grantham Project
• Lockyer Creek Action Plan 2015 – 2018, developed under the Resilient Rivers Initiative
• investment in a flood warning siren for the Grantham township, flood-level monitoring devices, cameras, and rainfall/river-height alert gauges at more than 50 locations.
Achievements since the 2011 flood
www.qldra.org.au/BRCFS
Strategic Floodplain Management Plan
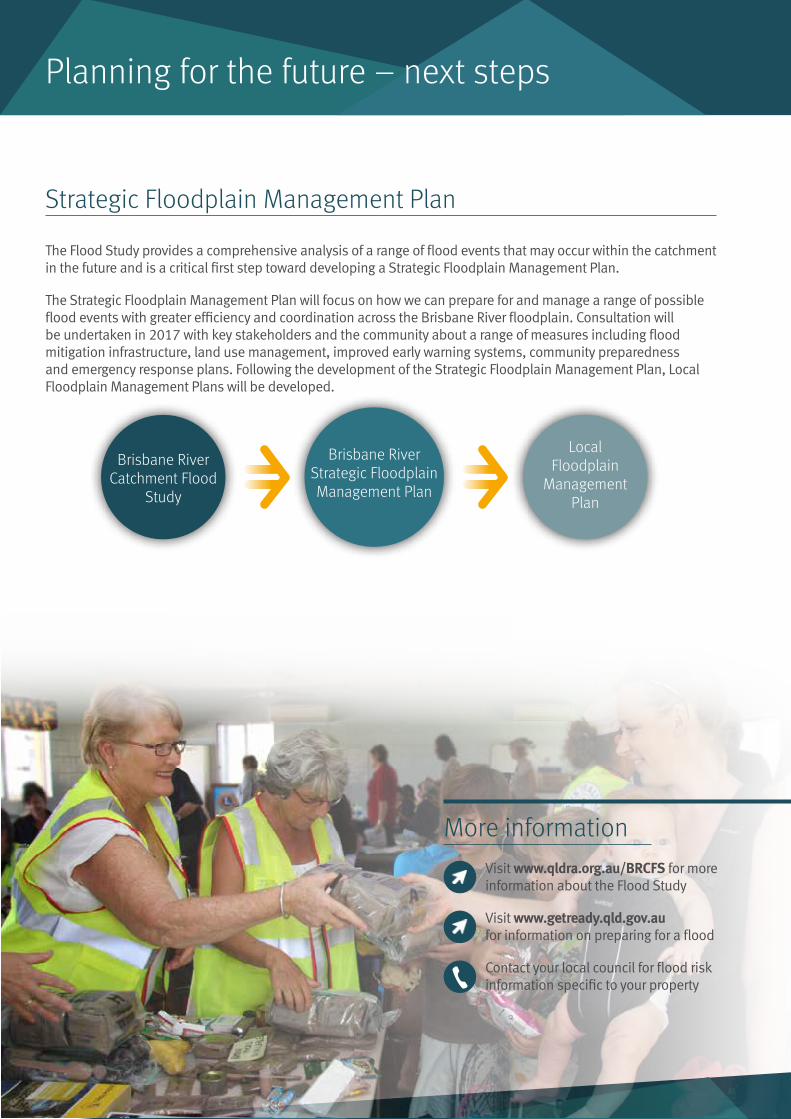
The Flood Study provides a comprehensive analysis of a range of flood events that may occur within the catchment in the future and is a critical first step toward developing a Strategic Floodplain Management Plan.
The Strategic Floodplain Management Plan will focus on how we can prepare for and manage a range of possible flood events with greater efficiency and coordination across the Brisbane River floodplain. Consultation will be undertaken in 2017 with key stakeholders and the community about a range of measures including flood mitigation infrastructure, land use management, improved early warning systems, community preparedness and emergency response plans. Following the development of the Strategic Floodplain Management Plan, Local Floodplain Management Plans will be developed.
Planning for the future – next steps
More informationVisit www.qldra.org.au/BRCFS for more information about the Flood Study
Visit www.getready.qld.gov.au for information on preparing for a flood
Contact your local council for flood risk information specific to your property
Brisbane River Catchment Flood
Study
Brisbane River Strategic Floodplain Management Plan
Local Floodplain
Management Plan