Embed Size (px)
Citation preview

KPI’S “R” USWai Phyo Kyaw | Seetoh Yong Chuen | Daryl
Lee

Gain an understanding on how a logistics business measures their operations performance
Industrial Practice - Using operational data to derive the key performance indicators
Y3 maintains a large number of logistics and delivery operation related information systems
These charts give insights on operation performance against various KPI measures
Tedious and have maintenance overheads, limited user interaction
Y3 is currently planning on providing its users with a visual analytics tool that would be able to offer interactivity and yet be simple enough for users to learn
Store Operations Data in various Information
Systems
Extract data monthly to derive the KPIs (inventory
& delivery operations)
Use MS Excel to collate and generate score card
Motivation for Project

Objectives of ProjectDevelop an end user
reporting tool that effectively communicates the various KPI scorecards used to assess the level of performance in the firm
Create a user manual package for the clients in order to assist in user training of tool

Methodology Used
Data used for our analysis is provided by Y3 Technologies
Extracted data are stored in numerous MS Excel filesCompile these data into a single fileUse JMP to compile and prepare the data
before loading into a database

Project References (Internal)
Description: Customer Satisfaction Project by Team Statisfied that uses a Heatmap to assess customer satisfaction across different touchpoints in a hospitals.
Source: https://wiki.smu.edu.sg/1011t1is428/IS428_Visual_Analytics_Project:_IS428_2010-11_VA_Project_T14

Project References (External)
Description: A order fulfillment dashboard application used to track incoming orders, incoming fiscal orders for 2 warehouses for the previous year, shipping orders, fiscal orders shipped for the previous year, top 10 shipping customers for the previous year and backlog by month.
Source: http://examples.idashboards.com/idashboards/?guestuser=wpman1

Project References (External)
Description: Strategic Solutions by Unyson Logistics, a 3PL, who provides tech solutions for similar logistics company. The dashborad shows the overall shipment volumes and number of shipments across the different states in North America.
Source:http://www.unysonlogistics.com/whatwedo/index.aspx?id=78
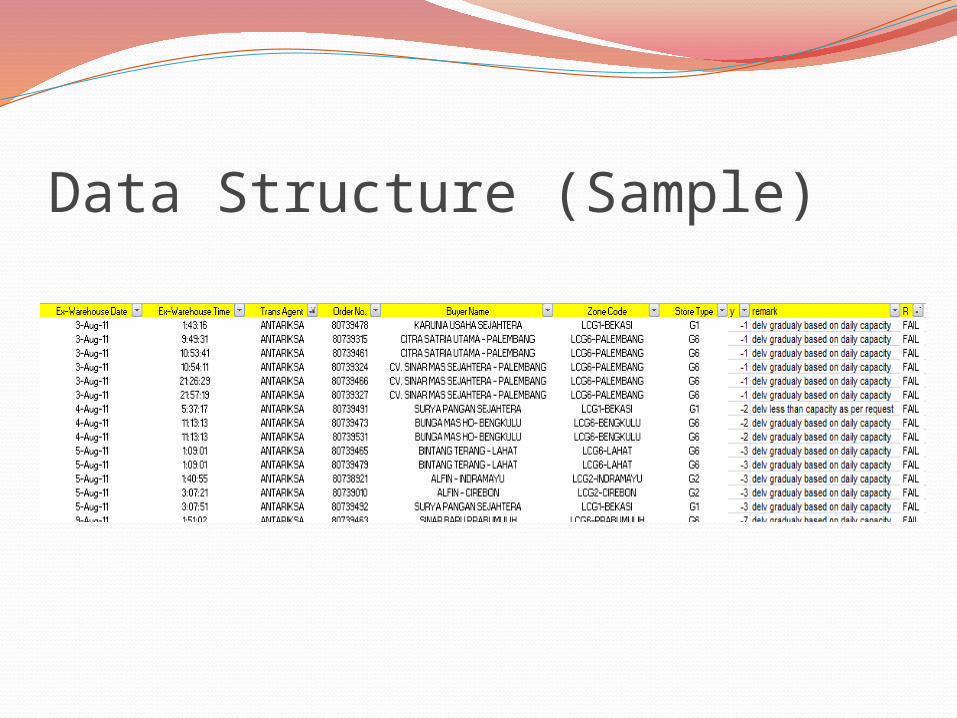
Data Structure (Sample)

Dashboard HierarchyMain Dashboard
TransAgent/Buyer
Performance
Pass/Fail Ratio Cases
Y3 Overview Scorecard
Growth Rate Running Total Cases
Damages Scorecard (KIV)
Breakdown of damages per TransAgent
Cases

Proof of Concept – Trans Agent Performance
MonthFilter:

Proof of Concept – Trans Agent Performance
MonthFilter:

Proof of Concept – Trans Agent Performance
MonthFilter:

Proof of Concept – Y3 Delivery KPI
1. Overview

Proof of Concept – Y3 Delivery KPI

Proof of Concept – Y3 Delivery KPI

Proof of Concept – Y3 Delivery KPI (Drill Down)

Proof of Concept – Damages (KIV)
Ttl. 2009
Ttl. 2010
Av. 2009
Av. 2010
Jan Feb Mar Apr May Jun Jul Aug Sep Oct Nov Dec0.000%
0.015%
0.030%
0.045%
0.060%
0.075%
0.090%
0.105%
0%
1%
2%
3%
4%
5%
6%
7%
8%
9%
DAMAGE DURING TRANSPORTATION
Percentage (Ctn) Target Allowance Percentage (Cases)
by
ctn
by
case
s

Proof of Concept – Damages (KIV)
June July August September0
100
200
300
400
500
600
700
Number of Claims Damage from Transporter
D1 (3% of goods price) D2 (20% of goods price) D3 (100% of goods price)
Quantity

ADIGUNA
ALAM W
IJAY
ALAMUI
ANTARIKSA
ANUGERAH
ARTHA
CARGO
CV RASIT
A
CV. AL O
NEDES
DHESTA
DINOYO
DKUDM
P
GADINGGM
THJP
INDAH
JAPALIN
DOJA
YA
KECE
KOM
BA
MERAPI
NATIMAKS
NKM
RAMASAKTI
RPP
SARIJASA
SEGORO
R A SLI
SPTTFT
WIN
DU PERSADA
WIN
TAGES0
4080
120
June: Number of Claims Damage from Transporter
D1 (3% of goods price) D2 (20% of goods price) D3 (100% of goods price)
Quantity
DO_Number No_Pol TPTCustomer_Na
meMaterial Damage Qty Remarks
Status_on_DO
Comments_YCH
COMPANY GatePass_No. Data_Month
80713159 R1632HB ADIGUNA XXX 103395 D1 1
D1 - REPACKABLE
AND RESALEABLE
EXCEPT INDUCED BY
FFI TALLY AAA
2011-60600
June
80720461 B9003JR ADIGUNA YYY 103448 D1 1
D1 - REPACKABLE
AND RESALEABLE
EXCEPT INDUCED BY
FFI TALLY AAA
2011-63681
June
80722618 B9528OT ADIGUNA YYY 103450 D1 4
D1 - REPACKABLE
AND RESALEABLE
EXCEPT INDUCED BY
FFI TALLY AAA
2011-64481
June
80722894 G1773CG ADIGUNA ZZZ 103450 D1 4
D1 - REPACKABLE
AND RESALEABLE
EXCEPT INDUCED BY
FFI TALLY AAA
2011-65273
June
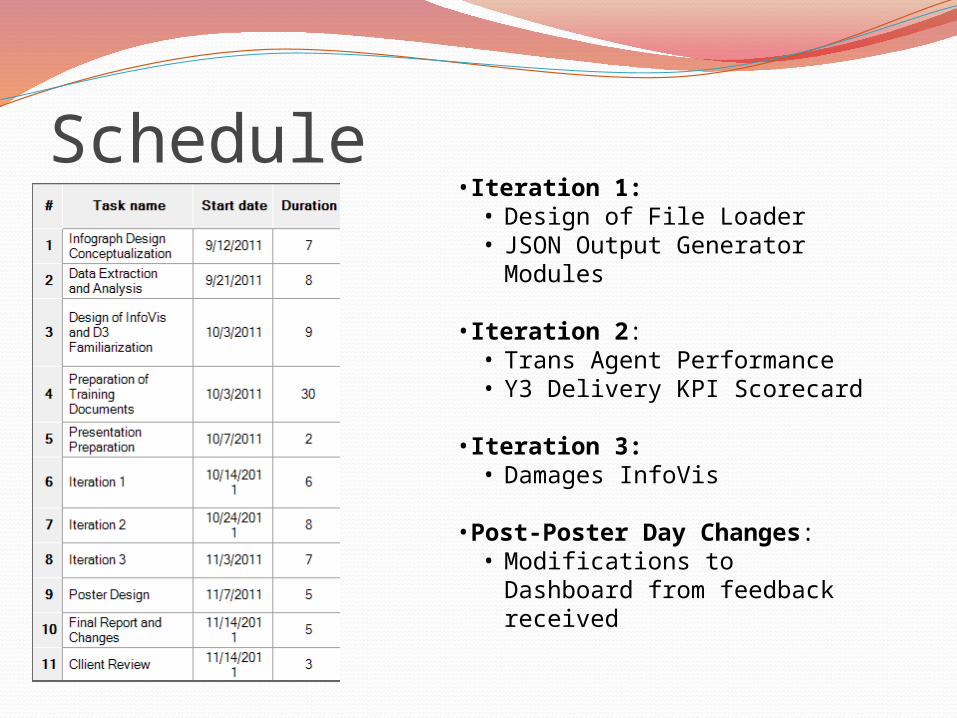
Schedule•Iteration 1:
• Design of File Loader• JSON Output Generator
Modules
•Iteration 2: • Trans Agent Performance• Y3 Delivery KPI Scorecard
•Iteration 3: • Damages InfoVis
•Post-Poster Day Changes:• Modifications to Dashboard
from feedback received

Milestones•Milestone 1: Approval of Project Proposal and Client Review of Training Documents
•Milestone 2: File Loader + JSON Generator
•Milestone 3: Trans Agent Bullet charts + Y3 Delivery Scorecard
•Milestone 4: Damage Chart
•Milestone 5: Final Client Review and Completion of Poster Day
•Milestone 6: Submission of Deliverables

Roles and Responsibilities•Daryl Lee Ker Hwa : Data Analyst + InfoVis Developer
Modules Assigned – Data Loader Classes, Trans Agent Performance InfoVis
•Lex Seetoh Yong Chuen : InfoVis Architect Modules Assigned – JSON Output Generator,
Trans Agent and Damages InfoVis
•Wai Phyo Kyaw : Client Liaison + InfoVis Developer Modules Assigned – JSON Output Generator, Y3
Delivery Scorecard InfoVis

Development EnvironmentJMP Pro 9
Data manipulation, transposing, etcTableau Public
Creation of initial mockups NetBeans
JSP csv upload + JSON format conversionInkscape
Initial design of InfoVis + SVG output NotePad++ / TextWrangler
Creation of D3.js scriptsBrowser Inspectors
To debug javascript errors

Project Risks#1 Unfamiliar Development Tools
Description: New languages such as D3 Integration with Javascript and output files such as
JSON and SVG which are new to the team New frameworks to be adopted
Mitigation Strategy: Each member takes charge of at least on InfoVis in
order to ensure that team has an understanding of how to code in D3
Set aside days to learn new tools

Project Risks#2 Inconsistent Data Format
Description: Massive operations data in inconsistent formats Repopulate certain columns ourselves, replacing
certain informationMitigation Strategy:
Work closely with client’s operations manager to understand the columns used in current scorecards
Consolidate relevant data into one integrated sheet Create calculated columns for visualization
purposes (i.e. % late deliveries)

Project Risks#3 Technical Limitations
Description: Unearthed limitations of D3.js, JSON format, etc. Could affect feasibility of chosen InfoVis designs
Mitigation Strategy: Consider as simple InfoVis designs as possible Damages InfoVis used as backup plan should team
fail to deliver TreeMap InfoVis

Q&AThank you!