Embed Size (px)
Citation preview

WahleachProject
Water Use Plan
1 December 2004
B
Revised for Acceptanceby the Comptroller ofWater Rights

Wahleach ProjectWater Use Plan
Revised for Acceptance by the Comptroller of Water Rights
Generation 1 December 2004

Wahleach – Water Use Plan
Generation 1 December 2004
Wahleach Project Water Use Plan


Wahleach –Water Use Plan
Generation 1 December 2004
Preface
The water use planning process for BC Hydro’s Wahleach hydroelectric facility wasinitiated in September 2000 and completed in October 2002.
The proposed conditions in this Water Use Plan, for the operation of BC Hydro’sWahleach hydroelectric facility reflect the October 2002 recommendations of theWahleach Water Use Plan Consultative Committee.
BC Hydro thanks all those who participated in the process that led to the production ofthis Water Use Plan, for their effort and dedication. The proposed conditions for theoperation of BC Hydro’s Wahleach hydroelectric facility will not come into effect untilimplemented under the Water Act.


Wahleach – Water Use Plan Page i
Generation 1 December 2004
Table of Contents
1.0 INTRODUCTION .................................................................................................1
2.0 DESCRIPTION OF WORKS...............................................................................1
2.1 The Wahleach System ..................................................................................1
2.2 Existing Works .............................................................................................2
3.0 HYDROLOGY OF THE WAHLEACH BASIN ................................................4
4.0 OPERATING CONDITIONS FOR FACILITY ................................................4
4.1 Role of Facility in BC Hydro’s System ........................................................4
4.2 Use of Water for Power Generation at the Wahleach Facility....................4
4.3 Emergencies and Dam Safety ......................................................................4
4.4 Conditions for the Operation of Works for Diversion and Useof Water........................................................................................................5
4.4.1 Boulder Creek Minimum Flow ........................................................5
4.4.2 Jones Lake Reservoir Elevation.......................................................5
4.4.3 Jones Creek Minimum Flow ............................................................5
4.4.4 Jones Creek Fish Habitat Enhancement..........................................6
4.4.5 Wahleach Generating Station Capacity ..........................................6
5.0 PROGRAMS FOR ADDITIONAL INFORMATION.......................................6
6.0 IMPLEMENTATION OF RECOMMENDATIONS.........................................7
7.0 EXPECTED WATER MANAGEMENT IMPLICATIONS .............................7
7.1 First Nations ................................................................................................7
7.2 Archaeological Considerations ...................................................................8
7.3 Fisheries.......................................................................................................8
7.4 Flood Control ..............................................................................................8
7.5 Industrial Use of Water................................................................................8
7.6 Other Licensed Uses of Water .....................................................................8
7.7 Power Generation........................................................................................8
7.8 Recreation....................................................................................................9
7.9 Riparian Rights ............................................................................................9
7.10 Water Quality...............................................................................................9

Page ii Wahleach – Water Use Plan
Generation 1 December 2004
7.11 Wildlife ........................................................................................................ 9
8.0 RECORDS AND REPORTS................................................................................ 9
8.1 Compliance Reporting ................................................................................ 9
8.2 Non-compliance Reporting ......................................................................... 9
8.3 Monitoring Program Reporting ................................................................ 10
9.0 PLAN REVIEW .................................................................................................. 10
10.0 NOTIFICATION PROCEDURES.................................................................... 10
List of Tables
Table 5-1: Monitoring Program Components and Research Questions. .........................7
List of Figures
Figure 2-1: Wahleach Hydroelectric Facility Area Map ..................................................3
List of Appendices
Appendix 1: Wahleach Creek Basin Hydrology Memo

Wahleach – Water Use Plan Page 1
Generation 1 December 2004
1.0 INTRODUCTION
The proposed conditions in this Water Use Plan, for the operation of BC Hydro’sWahleach hydroelectric facility reflect the October 2002 recommendations of theWahleach Water Use Plan Consultative Committee. The proposed terms andconditions to be authorized under the Water Act for the beneficial use of water atthe Wahleach hydroelectric facility are set out in this document. Future referenceto the Wahleach hydroelectric facility includes: the Boulder Creek DiversionDam, the Jones Lake Reservoir, the Wahleach Dam, and the WahleachGenerating Station.
The proposed conditions will change current operations and are expected toaffect fish, power generation, recreation and wildlife.
A monitoring program is proposed in order to study key uncertainties to enableimproved operating decisions in the future. Refer to the Wahleach Water UsePlan: Consultative Committee Report dated October 2003 for details on theconsultative process, interests, objectives, performance measures and valuesassociated with operating alternatives and details of the proposed monitoringprogram. A review period has also been specified for this Water Use Plan.
2.0 DESCRIPTION OF WORKS
2.1 The Wahleach System
The Wahleach hydroelectric facility is situated in the Lower Mainlandapproximately 25 km west of Hope and 100 km east of Vancouver. An area mapof the Wahleach hydroelectric facility is provided in Figure 2-1.
The Wahleach Dam is situated at the outlet of Jones Lake Reservoir, which was anatural lake prior to impoundment. The Wahleach Dam has since raised the lakelevel. Water is drawn from the west side of the reservoir through the FourBrothers Mountain via a tunnel and penstock. The penstock connects to theWahleach Generating Station, which diverts water into the Herrling IslandSidechannel of the Fraser River.
Additional water is supplied to the reservoir by the diversion of Boulder Creekinto Jones Lake Reservoir. The Boulder Creek Diversion Dam is locatedapproximately 400 m east of the Wahleach Dam.

Page 2 Wahleach – Water Use Plan
Generation 1 December 2004
Jones Creek, which is also known as Wahleach Creek, originates on CheamRidge. From the headwaters, the creek flows approximately 3 km north andenters Jones Lake Reservoir. Most of the flow from Jones Creek is divertedthrough the power tunnel and into the Wahleach Generating Station. Theremaining creek-water and the water released from the Wahleach Dam flowsnorth, then passes under the Trans-Canada Highway and the Canadian NationalRailway to the creek's confluence with the Fraser River near Laidlaw. Thesection of the creek referred to as lower Jones Creek flows from the WahleachDam to the confluence of the Fraser River. The total length of lower Jones Creekis approximately 9 km, of which less than 1 km is accessible to anadromousspecies as access is blocked by a natural barrier located 100 m aboveLaidlaw Bridge crossing. The lower Jones Creek non-anadromous section isbetween the natural barrier and the Wahleach Dam. The lower Jones Creekanadromous section is between its confluence with the Fraser River and thenatural barrier.
2.2 Existing Works
Boulder Creek Diversion Dam: The Boulder Creek Diversion Dam is anearthfill dam with a crest length of 180 m. The Dam diverts flow fromBoulder Creek into Boulder Creek Diversion Channel which flows intoJones Lake Reservoir. The Boulder Creek Diversion Dam was originally builtwith a release gate capable of allowing up to 1.4 m3/s of Boulder Creek flow tocontinue into Jones Creek to provide flows for an artificial spawning habitat.However, over time, erosion at the intake of this gate has resulted in all the waternow being diverted to the reservoir at very low flows.
Wahleach Dam: The Wahleach Dam is an earthfill dam with a crest length of418 m and a normal maximum elevation of 646.2 m. A free-crest overflowspillway is located on the east abutment of the dam. The spillway discharges intoan excavated channel, which then carries water into Jones Creek, approximately400 m downstream of the dam. In 1969, a fish water release siphon capable ofdiverting up to 0.85 m3/s of flow from Jones Lake Reservoir into Jones Creekwas added to the top of the dam near to the west abutment of Wahleach Dam.The siphon can be primed at elevations over 637.6 m and becomes deprimedbelow 636.4 m.
Jones Lake Reservoir: Jones Lake Reservoir is the storage reservoir in theWahleach hydroelectric facility. It is an oligotrophic lake with a surface area of460 ha, a maximum depth of 29 m and a mean depth of 13.4 m.
Penstock and Wahleach Generating Station: Water from Jones Lake Reservoirenters an intake structure on the west side of the reservoir and is carried through a4.2 km tunnel and a 500 m penstock to the generating station, on the south bankof the Fraser River. The station has a 60 MW Canadian General Electricgenerator with a maximum sustained generating capacity of 63 MW.

Wahleach – Water Use Plan Page 3
Generation 1 December 2004
Figure 2-1: Wahleach Hydroelectric Facility Area Map
Page 4 Wahleach – Water Use Plan
Generation 1 December 2004
3.0 HYDROLOGY OF THE WAHLEACH BASIN
Appendix 1, Wahleach Water Use Plan Hydrology Memo, describes thephysiography, climate, and hydrology of the Wahleach basin. The memo alsodescribes daily inflow and seasonal volume inflow forecasting procedures, thesupporting network of hydrometeorological stations in the area and thesummaries of inflow hydrographs for Jones Lake Reservoir.
4.0 OPERATING CONDITIONS FOR FACILITY
4.1 Role of Facility in BC Hydro’s System
The Wahleach hydroelectric facility is part of BC Hydro’s Coastal Region, whichis described in Making the Connection, published by BC Hydro in April 2000.
The Wahleach hydroelectric facility is one of six hydroelectric developments inthe Fraser Valley Region. Given the facility's close proximity to the load center,it provides consistent voltage in the transmission network, and system security inthe event of transmission or generation problems elsewhere in the system. TheWahleach hydroelectric facility has historically provided an average of 245 GWhper year and contributes approximately 0.67% of BC Hydro’s hydroelectricgeneration.
4.2 Use of Water for Power Generation at the Wahleach Facility
The Wahleach hydroelectric facility is classified as a “coastal” system with themajority of inflow resulting from seasonal rainstorms and spring snowmelt. As aresult, the average daily turbine discharge from the Wahleach Generating Stationvaries seasonally and daily with the demand for electricity and the availability ofwater. Spills occur when inflows exceed generation and storage capacity.
4.3 Emergencies and Dam Safety
Emergencies and dam safety requirements shall take precedence over theoperational constraints outlined in this Water Use Plan. Emergencies include, butare not limited to, actual and potential loss of power to customers. Dam safetyrequirements for operations are outlined in Wahleach: Operation, Maintenanceand Surveillance Requirements (OMS) for Dam Safety issued by BC Hydro’sDirector of Dam Safety.

Wahleach – Water Use Plan Page 5
Generation 1 December 2004
4.4 Conditions for the Operation of Works for Diversion and Use of Water
BC Hydro proposes to operate the Wahleach hydroelectric facility in accordancewith the conditions outlined below. BC Hydro may not be able to operate withinthese conditions during extreme hydrological events.
4.4.1 Boulder Creek Minimum Flow
To the extent that Boulder Creek inflows are available, BC Hydro will provide aminimum flow of 0.14 m3/s from Boulder Creek to Jones Lake Reservoir via theBoulder Creek Diversion Channel year-round. It is expected that there will betimes when the minimum flow will not be available.
To the extent that Boulder Creek inflows are available, flows from Boulder Creekin excess of 0.14 m3/s can be diverted at the Boulder Creek Diversion Dam to theoriginal Boulder Creek channel to meet flow obligations downstream in JonesCreek. This condition may require a capital investment to undertake structuralmodifications to the discharge facilities at the Boulder Creek Diversion Dam.
It is recommended that the Comptroller of Water Rights direct BC Hydro toprovide temporary works to modify the discharge facilities at the Boulder CreekDiversion Dam for five years. It is recommended that the Comptroller of WaterRights direct BC Hydro to undertake permanent structural modifications to thedischarge facilities at the Boulder Creek Diversion Dam upon review of theresults of the monitoring program and the availability of Boulder Creek inflowsfive years after implementation of this Water Use Plan.
The details regarding this recommendation are provided in the Wahleach WaterUse Plan Consultative Committee Report.
4.4.2 Jones Lake Reservoir Elevation
The minimum operating level of Jones Lake Reservoir is 628 m.
A fertilization program in Jones Lake Reservoir is recommended, in lieu ofoperational constraints on the reservoir, as a means to improve littoral andpelagic productivity. It is recommended that the Comptroller of Water Rightsdirect BC Hydro to implement a fertilization program for Jones Lake Reservoirto be reviewed after five years. The details regarding this recommendation areprovided in the Wahleach Water Use Plan Consultative Committee Report.
4.4.3 Jones Creek Minimum Flow
When the Jones Lake Reservoir elevation level is at or above 637.6 m and/orBoulder Creek inflows in excess of 0.14 m3/s are available:

Page 6 Wahleach – Water Use Plan
Generation 1 December 2004
• From 15 September to 30 November, BC Hydro will maintain a minimumflow of 1.1 m3/s in Jones Creek measured at a staff gauge installed inJones Creek near Laidlaw.
• BC Hydro will maintain a minimum flow of 0.6 m3/s in Jones Creekmeasured at a staff gauge to be installed in Jones Creek near Laidlaw.
It is expected that there will be times when the minimum flow will not beavailable.
4.4.4 Jones Creek Fish Habitat Enhancement
A fish habitat enhancement project in Jones Creek is recommended, in lieu ofoperational constraints that would maintain a minimum flow in Jones Creekgreater than that proposed in section 4.4.3, as a means to improve fish habitat. Itis recommended that the Comptroller of Water Rights direct BC Hydro toimplement a fish habitat enhancement project in Jones Creek. The detailsregarding this recommendation are provided in the Wahleach Water Use PlanConsultative Committee Report.
4.4.5 Wahleach Generating Station Capacity
From 15 September to 30 November, BC Hydro will curtail generation to zerofor a two-hour period every twenty-four hours. There is no time of day condition.At all other times, BC Hydro can generate at maximum capacity. There is noconstraint on the rate of change of flow from the powerhouse.
5.0 PROGRAMS FOR ADDITIONAL INFORMATION
Development of the proposed conditions for the Wahleach hydroelectric facilitywas complicated by uncertainties and information gaps. The October 2002recommendations of the Consultative Committee were contingent upon theimplementation of a monitoring program to reduce these uncertainties over time.The monitoring program is designed to address key questions that affecteddecision making throughout the consultative process.
Accordingly, it is recommended that the Comptroller of Water Rights directBC Hydro to undertake a monitoring program that will:
• Assess expected outcomes of the operational change being recommended.
• Provide improved information for future operating conditions.
Details and costs of the proposed monitoring program is provided in theWahleach Water Use Plan: Report of the Consultative Committee.
Table 5-1 provides a summary of the monitoring program and research questions.

Wahleach – Water Use Plan Page 7
Generation 1 December 2004
Table 5-1: Monitoring Program Components and Research Questions. Refer to the WahleachConsultative Report (October 2003) for details on program implementation andobjectives.
Component Research Questions
Salmonid ProductivityMonitoring: Lower Jones Creek
Will habitat improvements translate into fish productivity inlower Jones Creek?
Channel Stability Assessment:Lower Jones Creek
Does channel stability affect spawning success in lowerJones Creek?
Do flows in lower Jones Creek promote channel change?
Is spawning success related to hydrology further affected bychanging channel structure?
Pink Salmon GeneticComposition Assessment:Lower Jones Creek
Is the pink salmon spawning in lower Jones Creek on a bi-annualbasis distinct to that watershed?
Entrainment Monitoring:Jones Lake Reservoir
Will reservoir spill and penstock diversion affect fish abundancein Jones Lake Reservoir by entraining fish?
Chum Salmon SpawningBehaviour Monitoring: HerrlingIsland Sidechannel
Is chum salmon spawning behaviour affected by operations of theWahleach Generating Station?
Fertilization Program: JonesLake
Is the fertilization program methods and performance effective inmaintaining Kokanee abundance?
6.0 IMPLEMENTATION OF RECOMMENDATIONS
The proposed conditions and monitoring program in this Water Use Plan will beimplemented after BC Hydro receives direction from the Comptroller of WaterRights.
7.0 EXPECTED WATER MANAGEMENT IMPLICATIONS
Implications for the provincial interests that were considered during preparationof this Water Use Plan are expected outcomes relative to current operations basedon the best available information. After BC Hydro has been directed toimplement the proposed conditions, BC Hydro will be responsible for meetingthe operational parameters, but not for achieving the expected outcomes.
7.1 First Nations
BC Hydro’s Wahleach hydroelectric facility is located within the claimedtraditional territory of the Stó:lō Nation. The Stó:lō Nation is divided into anumber of member bands including Popkum, Cheam and Shwx’ow’hamelFirst Nations. Stó:lō Nation and its member bands, the Peters Band and theSeabird Island First Nation participated to some extent in the Wahleach water useplanning process. The proposed conditions in this Water Use Plan are expected to

Page 8 Wahleach – Water Use Plan
Generation 1 December 2004
benefit fish and wildlife in Jones Lake Reservoir, Jones Creek andHerrling Island Sidechannel, an objective of the First Nations.
7.2 Archaeological Considerations
The proposed conditions in this Water Use Plan are not expected to affectarchaeological interests.
7.3 Fisheries
The proposed conditions in this Water Use Plan are expected to increase trouthabitat in Jones Lake Reservoir through the provision of a fertilization programand a minimum reservoir elevation level. Salmon habitat is expected to increasein Jones Creek anadromous through the provision of a minimum flow and ahabitat enhancement project. Overall salmon habitat is expected to decrease inHerrling Island Sidechannel from decreased flows through the WahleachGenerating Station. Salmon spawning success is expected to increaseHerrling Island Sidechannel by curtailing generation to zero for a two-hourperiod every twenty-four hours. Fish passage is expected to be maintained inBoulder Creek below the Boulder Creek Diversion Dam through the provision ofa minimum flow.
7.4 Flood Control
The proposed conditions in this Water Use Plan are not expected to affectflooding routing associated with Jones Lake Reservoir, Jones Creek or theHerrling Island Sidechannel below the facilities.
7.5 Industrial Use of Water
There are no industrial uses of water in the Wahleach system that are affected bythe recommended changes in operations.
7.6 Other Licensed Uses of Water
The proposed conditions in this Water Use Plan are not expected to affect otherlicensed uses of the water associated with Jones Lake Reservoir, Jones Creek orthe Herrling Island Sidechannel below the facilities.
7.7 Power Generation
The proposed conditions in this Water Use Plan are expected to decrease powergeneration associated with the Wahleach hydroelectric facility relative to currentoperations. However, it has been BC Hydro's practice to ask the Comptroller ofWater Rights for permission to use water in excess of the current diversionlicence for power generation. The proposed conditions in this Water Use Plan areexpected to increase power generation associated with the Wahleachhydroelectric facility relative to the current diversion licence.
Wahleach – Water Use Plan Page 9
Generation 1 December 2004
7.8 Recreation
The proposed conditions in this Water Use Plan are expected to improverecreational opportunities on Jones Lake Reservoir through the provision of aminimum reservoir elevation level.
7.9 Riparian Rights
The proposed conditions in this Water Use Plan are not expected to affect otherriparian rights associated with Jones Lake Reservoir, Jones Creek or theHerrling Island Sidechannel below the facilities.
7.10 Water Quality
The proposed conditions in this Water Use Plan are not expected to affect waterquality associated with Jones Lake Reservoir, Jones Creek or the Herrling IslandSidechannel below the facilities.
7.11 Wildlife
The proposed conditions in this Water Use Plan are expected to increase riparianhabitat around Jones Lake Reservoir through the provision of a minimumreservoir elevation level.
8.0 RECORDS AND REPORTS
8.1 Compliance Reporting
BC Hydro will submit data as required by the Comptroller of Water Rights todemonstrate compliance with the conditions conveyed in the Water Licences.The submission will include records of:
• Jones Lake Reservoir elevation.
• Wahleach Dam discharges.
• Wahleach Generating Station discharges.
• Boulder Creek Diversion Dam discharges.
• Minimum flows measured at a staff gauge in Jones Creek near Laidlaw.
8.2 Non-compliance Reporting
Non-compliance with operating conditions, or anticipation thereof, will bereported to the Comptroller of Water Rights in a timely manner.

Page 10 Wahleach – Water Use Plan
Generation 1 December 2004
8.3 Monitoring Program Reporting
Reporting procedures will be determined as part of the detailed terms ofreference for each monitoring study or undertaking.
9.0 PLAN REVIEW
Five years after the implementation of this Water Use Plan, BC Hydro will assessthe results of the monitoring program and the Boulder Creek inflows and theneed to review the Wahleach Water Use Plan. A review may be triggered soonerif scientific data or significant new risks are identified that could result in arecommendation to change operations. If the Wahleach Water Use Plan is notreviewed five years after implementation, the plan will continue for an additionalfive years.
10.0 NOTIFICATION PROCEDURES
Notification procedures for floods and other emergency events are outlined in theWahleach Dam Emergency Planning Guide and the Power Supply EmergencyPlan (PSEP) Fraser Valley Generation (Alouette, Buntzen, Coquitlam, Stave,Ruskin and Wahleach dams). Both these documents are filed with the Office ofthe Comptroller of Water Rights.

Wahleach – Water Use Plan
Generation 1 December 2004
Appendix 1Wahleach Creek Basin Hydrology


wr199
Inter-office memoTO: Eric Weiss 4 February 2003
FROM: Chris Caryula File: PSE 151.0C-WAH-151.0
SUBJECT: Wahleach Water Use PlanHydrology of Wahleach Basin
1 INTRODUCTION
The Jones Lake / Wahleach project is a single reservoir hydroelectric project with the following
general characteristics:
! Wahleach Dam impounds Jones Lake Reservoir (also referred to as Wahleach Lake)
! Boulder Creek has been permanently diverted into Jones Lake Reservoir (no diversion
control structures) and is now considered to be part of the natural drainage basin.
! Spill and all other non-power releases from Wahleach Dam discharge into Wahleach
Creek
! Power releases (turbine discharge) are diverted via a 3.6 km power tunnel to the Wahleach
Power Plant (one unit, max output ~ 63 MW).
! Discharge from the Wahleach Power Plant enters the Fraser River
This report highlights the hydrology of the Wahleach hydroelectric system. Physiography and
climatology are reviewed for the Wahleach Creek watershed.
Methods used to calculate reservoir inflows, such as BC Hydro’s FLOCAL program, are discussed.
Typical inflow hydrographs and summaries are provided. Flow records for the Wahleach system
referred to in this report were used in power studies conducted for the Wahleach Water Use Plan.
Procedures used to provide daily inflow and seasonal volume inflow forecasts are also described.

- 2 -
2.1 Physiography1
The Wahleach basin is situated in the southern coastal mountains. The drainage area
upstream of Wahleach Dam is 88 km2. Steep valley side slopes and short tributary
streams that flow into Jones Lake from all directions characterize the Wahleach Basin.
Upstream of Wahleach dam, the valley trends in a southerly direction and is part of the
Skagit Range that extends further south and east outside the basin. The drainage basin
for the Wahleach system is shown in Figure 1.
Figure 1: Watershed Map and Hydrometeorological Stations
The mountains around the Wahleach basin represent the first major barrie
laden air masses from the Strait of Georgia encounter in their movement i
1 Basin information obtained from BC Hydro, “Wahleach Dam Probable Maximum Flood”Engineering Division report no. H1855, December 1985
Boulder Creek
BC Hydro DamBC Hydro DCPAES StationMSRM Snow CourseWater Survey CanadaLakeStreamWatershed BasinGlacier
wr199
r that moisture-
nto the Interior.
, Hydroelectric
- 3 -
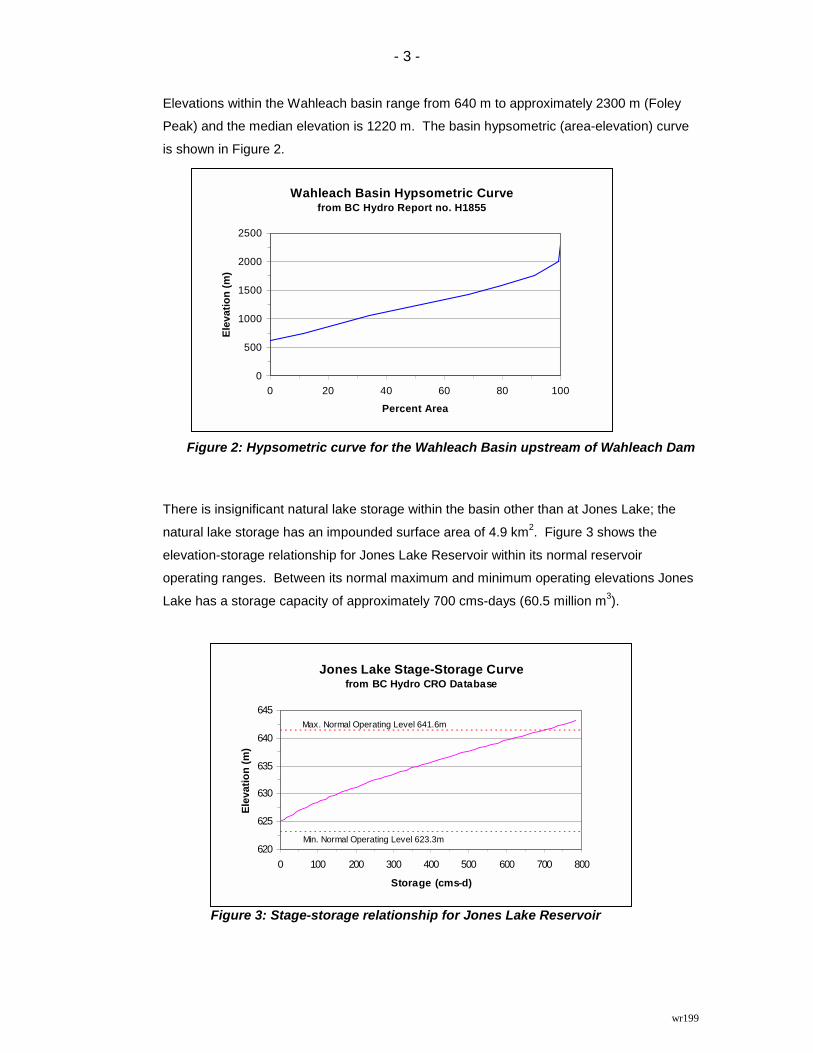
Elevations within the Wahleach basin range from 640 m to approximately 2300 m (Foley
Peak) and the median elevation is 1220 m. The basin hypsometric (area-elevation) curve
is shown in Figure 2.
F
There
natur
eleva
opera
Lake
igure 2: Hypsometric curve for the Wahleach Basin upstream of Wahleach Dam
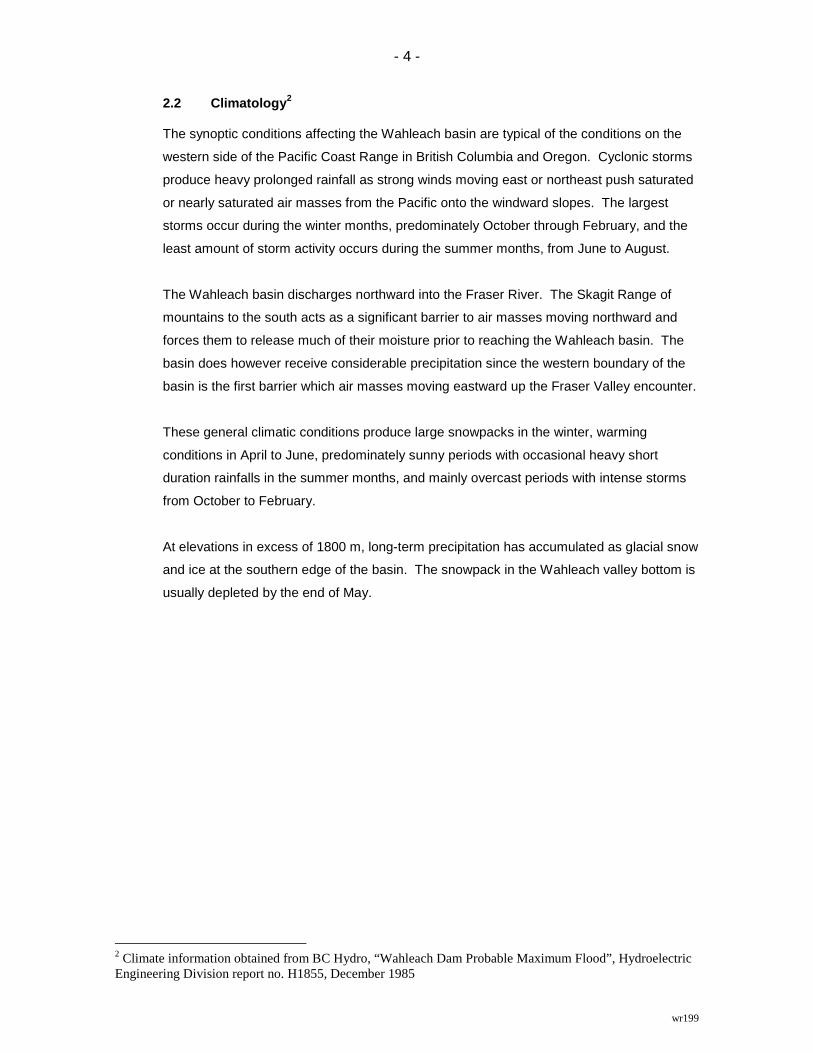
is insignificant natural lake storage within the basin other than at Jones Lake; the
al lake storage has an impounded surface area of 4.9 km2. Figure 3 shows the
tion-storage relationship for Jones Lake Reservoir within its normal reservoir
ting ranges. Between its normal maximum and minimum operating elevations Jones
has a storage capacity of approximately 700 cms-days (60.5 million m3).
F
Wahleach Basin Hypsometric Curvefrom BC Hydro Report no. H1855
0
500
1000
1500
2000
2500
0 20 40 60 80 100
Percent Area
Elev
atio
n (m
)
Jones Lake Stage-Storage Curve
wr199
igure 3: Stage-storage relationship for Jones Lake Reservoir
from BC Hydro CRO Database
620
625
630
635
640
645
0 100 200 300 400 500 600 700 800
Storage (cms-d)
Elev
atio
n (m
)
Min. Normal Operating Level 623.3m
Max. Normal Operating Level 641.6m
- 4 -
wr199
2.2 Climatology2
The synoptic conditions affecting the Wahleach basin are typical of the conditions on the
western side of the Pacific Coast Range in British Columbia and Oregon. Cyclonic storms
produce heavy prolonged rainfall as strong winds moving east or northeast push saturated
or nearly saturated air masses from the Pacific onto the windward slopes. The largest
storms occur during the winter months, predominately October through February, and the
least amount of storm activity occurs during the summer months, from June to August.
The Wahleach basin discharges northward into the Fraser River. The Skagit Range of
mountains to the south acts as a significant barrier to air masses moving northward and
forces them to release much of their moisture prior to reaching the Wahleach basin. The
basin does however receive considerable precipitation since the western boundary of the
basin is the first barrier which air masses moving eastward up the Fraser Valley encounter.
These general climatic conditions produce large snowpacks in the winter, warming
conditions in April to June, predominately sunny periods with occasional heavy short
duration rainfalls in the summer months, and mainly overcast periods with intense storms
from October to February.
At elevations in excess of 1800 m, long-term precipitation has accumulated as glacial snow
and ice at the southern edge of the basin. The snowpack in the Wahleach valley bottom is
usually depleted by the end of May.
2 Climate information obtained from BC Hydro, “Wahleach Dam Probable Maximum Flood”, HydroelectricEngineering Division report no. H1855, December 1985
- 5 -
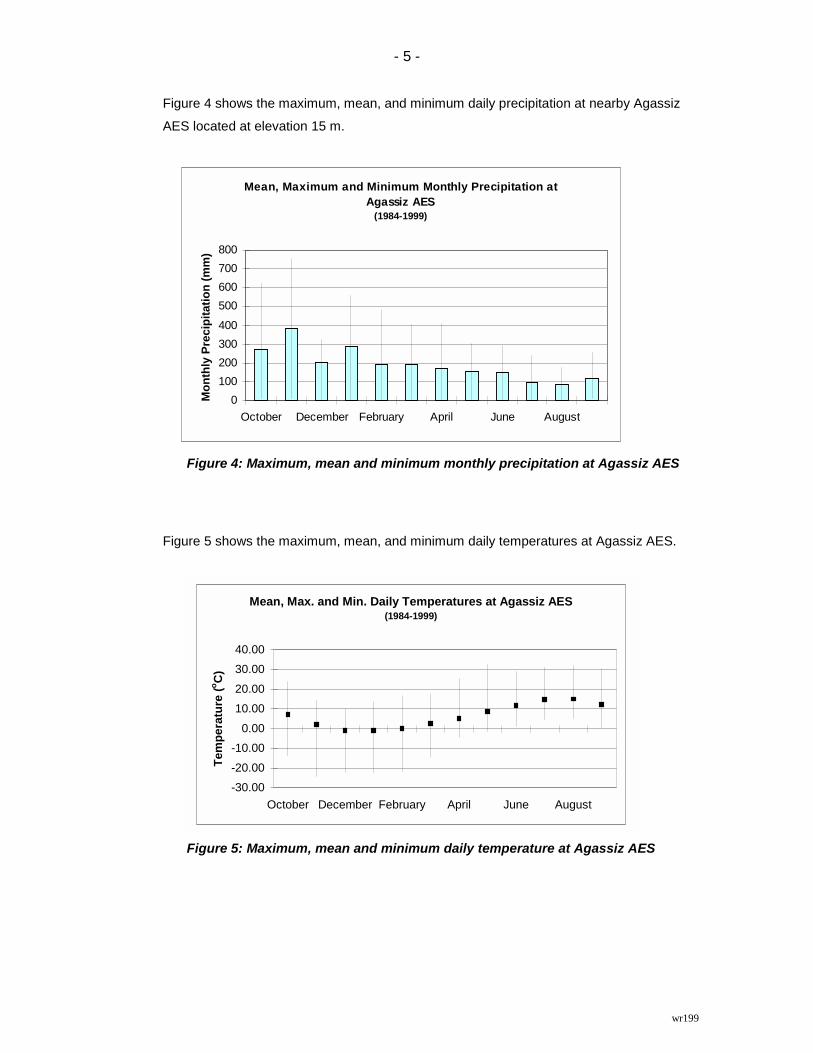
Figure 4 shows the maximum, mean, and minimum daily precipitation at nearby Agassiz
AES located at elevation 15 m.
Figure 4: Maximum, mean and minimum monthly precipitation at Agassiz AES
Figure 5 shows the maximum, mean, and minimum daily temperatures at Agassiz AES.
Mean, Maximum and Minimum Monthly Precipitation at Agassiz AES
(1984-1999)
0100200300400500600700800
October December February April June August
Mon
thly
Pre
cipi
tatio
n (m
m)
wr199
Figure 5: Maximum, mean and minimum daily temperature at Agassiz AES
Mean, Max. and Min. Daily Temperatures at Agassiz AES(1984-1999)
-30.00-20.00-10.00
0.0010.0020.0030.0040.00
October December February April June August
Tem
pera
ture
(o C)
- 6 -
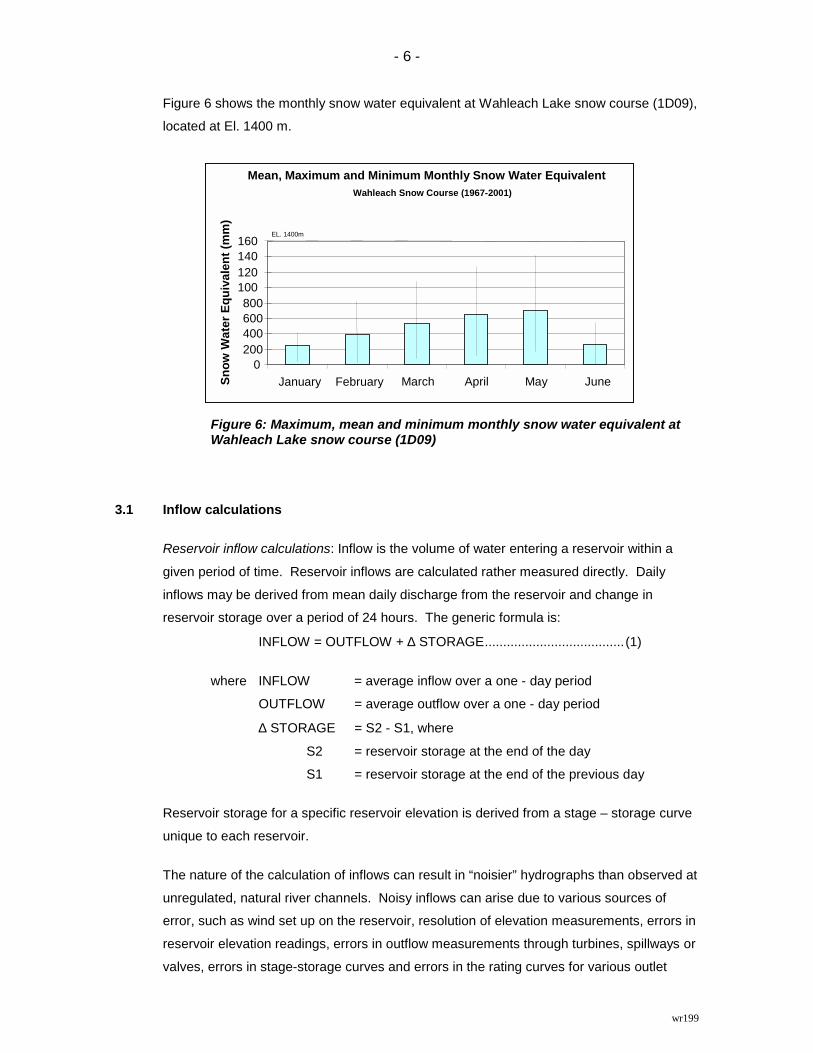
Figure 6 shows the monthly snow water equivalent at Wahleach Lake snow course (1D09),
located at El. 1400 m.
3.1 Inflow
Rese
given
inflow
reser
Rese
uniqu
The n
unreg
error,
reser
valve
wr199
Figure 6: Maximum, mean and minimum monthly snow water equivalent atWahleach Lake snow course (1D09)
calculations
rvoir inflow calculations: Inflow is the volume of water entering a reservoir within a
period of time. Reservoir inflows are calculated rather measured directly. Daily
s may be derived from mean daily discharge from the reservoir and change in
voir storage over a period of 24 hours. The generic formula is:
INFLOW = OUTFLOW + ∆ STORAGE...................................... (1)
where INFLOW = average inflow over a one - day period
OUTFLOW = average outflow over a one - day period
∆ STORAGE = S2 - S1, where
S2 = reservoir storage at the end of the day
S1 = reservoir storage at the end of the previous day
rvoir storage for a specific reservoir elevation is derived from a stage – storage curve
e to each reservoir.
ature of the calculation of inflows can result in “noisier” hydrographs than observed at
ulated, natural river channels. Noisy inflows can arise due to various sources of
such as wind set up on the reservoir, resolution of elevation measurements, errors in
voir elevation readings, errors in outflow measurements through turbines, spillways or
s, errors in stage-storage curves and errors in the rating curves for various outlet
Mean, Maximum and Minimum Monthly Snow Water EquivalentWahleach Snow Course (1967-2001)
0200400600800
100120140160
January February March April May JuneSnow
Wat
er E
quiv
alen
t (m
m)
EL. 1400m

- 7 -
wr199
facilities. The impact of noise tends to reduce as the time interval over which inflow is
computed increases.
Storage relationships: The storage relationships used to determine the volume of water in Jones
Lake Reservoir is shown in Figure 3.
Outflow relationships: Flow through turbines at the Wahleach powerhouse is computed based on
megawatt output and hydraulic head. “Hydraulic head” is a measure of the vertical
distance between the water level in the reservoir and the water level immediately below the
turbine outlet. Power output is proportional to head and turbine discharge. A generic
relationship between these variables is shown in Figure 7.
Generic relationship between flow, generation and head for a turbine
Increasing Generation
Incr
easi
ng F
low
Increasing Head
Figure 7: Generic relationship between flow, generation, and head for a turbine
- 8 -
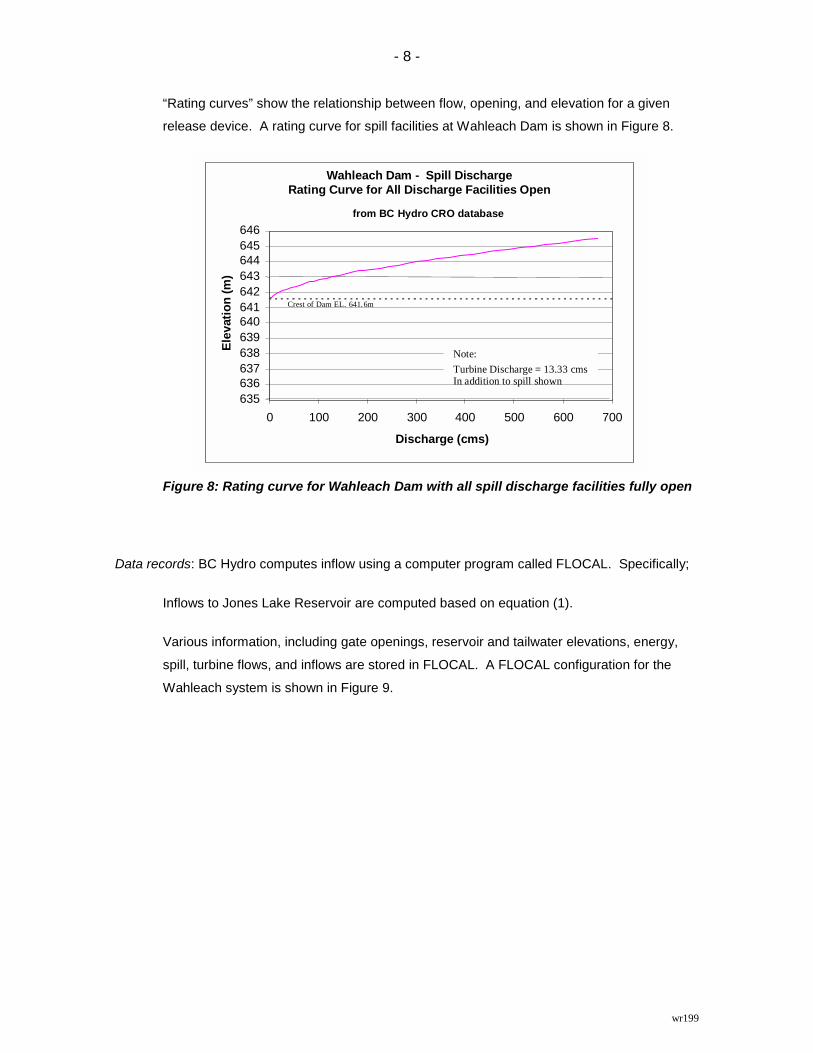
“Rating curves” show the relationship between flow, opening, and elevation for a given
release device. A rating curve for spill facilities at Wahleach Dam is shown in Figure 8.
Figur
Data records:
Inflow
Vario
spill,
Wahl
wr199
e 8: Rating curve for Wahleach Dam with all spill discharge facilities fully open
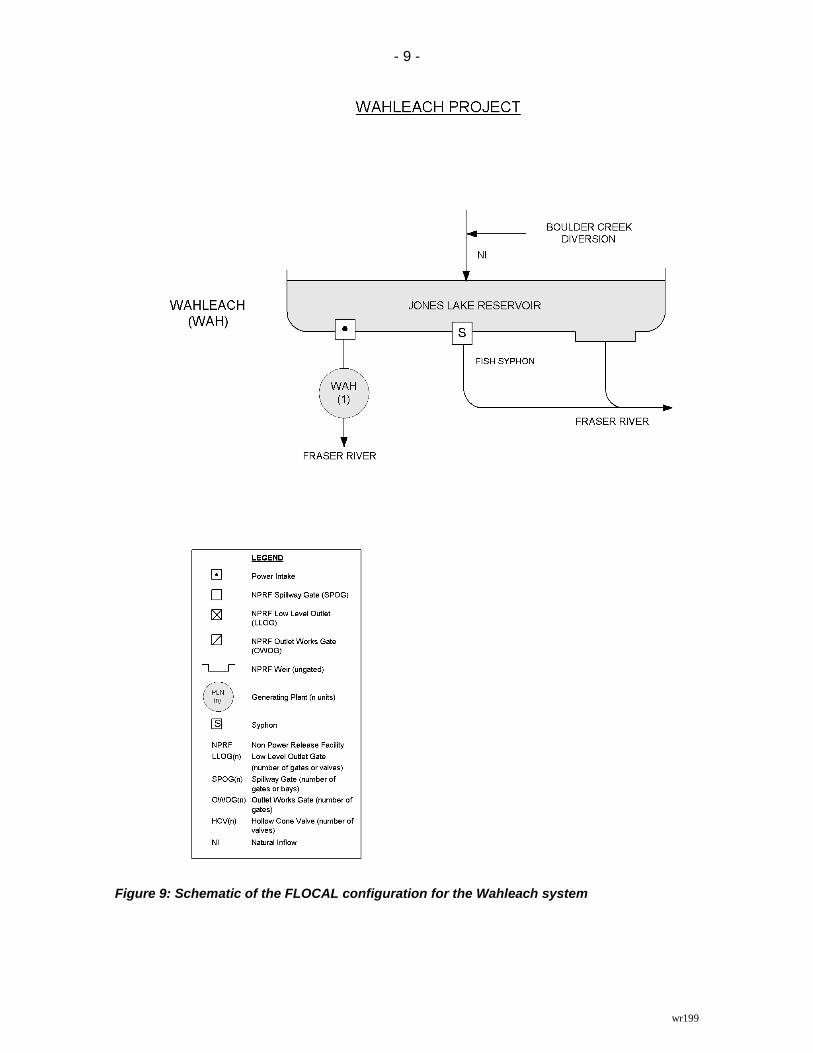
BC Hydro computes inflow using a computer program called FLOCAL. Specifically;
s to Jones Lake Reservoir are computed based on equation (1).
us information, including gate openings, reservoir and tailwater elevations, energy,
turbine flows, and inflows are stored in FLOCAL. A FLOCAL configuration for the
each system is shown in Figure 9.
Wahleach Dam - Spill DischargeRating Curve for All Discharge Facilities Open
from BC Hydro CRO database
635636637638639640641642643644645646
0 100 200 300 400 500 600 700
Discharge (cms)
Elev
atio
n (m
)
Crest of Dam EL. 641.6m
Note:Turbine Discharge = 13.33 cmsIn addition to spill shown
- 9 -
wr199
Figure 9: Schematic of the FLOCAL configuration for the Wahleach system

- 10 -
3.2 Reservoir inflow characteristics
Figure 10a shows a “spaghetti plot” of the historical inflows to the Wahleach project. The
10th, 50th and 90th percentile inflows are shown in bold. Figure 10b shows estimates of
historical Boulder Creek diversion flows. The estimates were determined by applying a
constant ratio to the daily inflows to Wahleach. The ratio was computed by dividing the
basin area for the Boulder Creek diversion basin (29.8 km2) by the total Wahleach basin
area, including Boulder Creek, (88.0 km2).
Figure 10a: Historical Daily Inflows to Jones Lake Reservoir (including BoulderDiversion)
Daily Inflow Hydrographs to Jones Lake ReservoirBased on BC Hydro PDSS Data 1960-1999
0
20
40
60
80
100
120
140
Oct Dec Feb Apr Jun Aug
Dai
ly In
flow
(cm
s)
Daily Inflow90th Percentile Inflow50th Percentile Inflow10th Percentile Inflow
Estimated Boulder Creek Daily Inflow
wr199
Figure 10b: Estimated Boulder Creek Daily Inflow
Est. by Basin Area Ratio 1960-1999
05
1015
20
25
3035
4045
Oct Dec Feb Apr Jun Aug
Dai
ly In
flow
(cm
s)
Daily Inflow90th Percentile Inflow50th Percentile Inflow10th Percentile Inflow

- 11 -
wr199
Figure 11 and Table 1 summarizes the daily inflows by month. Average monthly and
maximum and minimum daily inflows are shown to highlight the variability of inflows to the
project.
Figure 11: Variability in Wahleach Project’s daily inflows
Table 1: Wahleach Project’s daily inflows (1960-1999)
MeanDailyInflow(cms)
MaximumDailyInflow(cms)
MinimumDailyInflow(cms)
October 5 65 0November 7 118 1December 6 74 1January 5 93 0February 5 48 0March 4 48 0April 5 27 1May 10 40 2June 12 50 3July 9 50 2August 5 20 1September 4 58 1
A “flow duration curve” indicates the percent of time that a flow is greater than a given
discharge. Figure 12 shows a flow duration curve of daily inflows for the years 1960-1999;
it illustrates the large range and variability of project inflows.
Mean, Maximum and Minimum Daily Inflowsto Lake Jones Reservoir (1960-1999)
0
20
40
60
80
100
120
140
Oct Dec Feb Apr June Aug
Dai
ly In
flow
(cm
s)
- 12 -
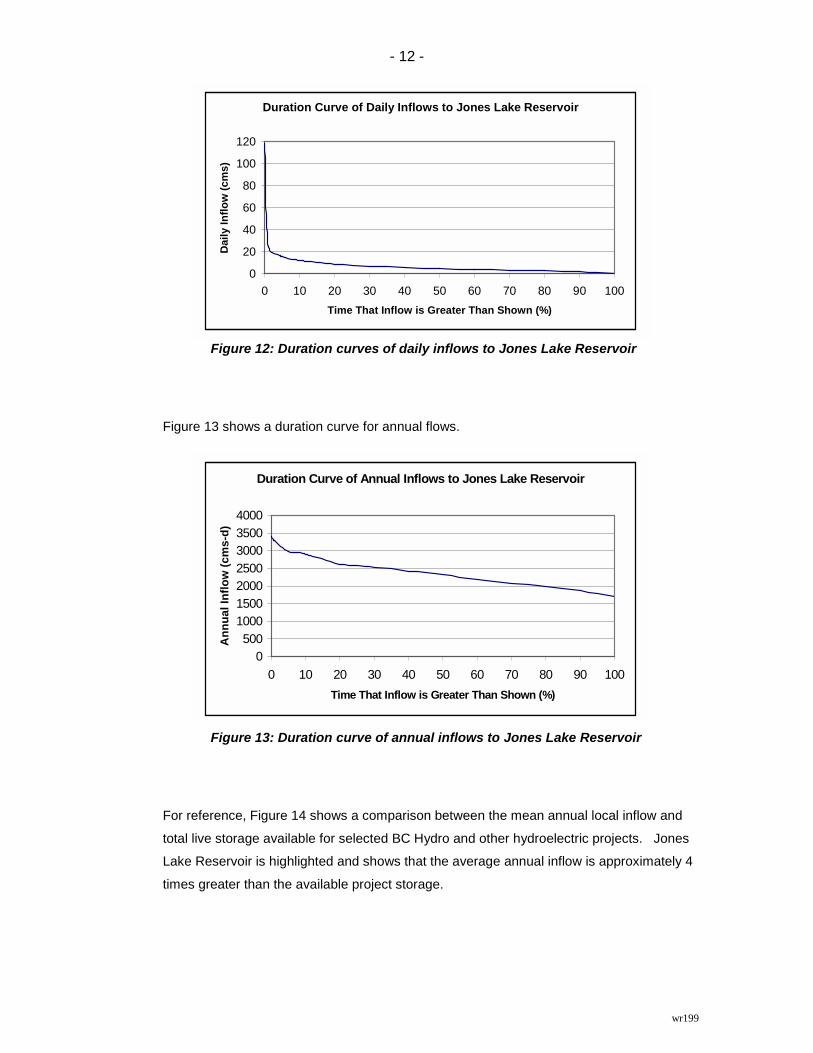
Figure 12: Duration curves of daily inflows to Jones Lake Reservoir
Figure 13 shows a duration curve for annual flows.
For re
total l
Lake
times
Duration Curve of Annual Inflows to Jones Lake Reservoir
Duration Curve of Daily Inflows to Jones Lake Reservoir
0
20
40
60
80
100
120
0 10 20 30 40 50 60 70 80 90 100Time That Inflow is Greater Than Shown (%)
Dai
ly In
flow
(cm
s)
wr199
Figure 13: Duration curve of annual inflows to Jones Lake Reservoir
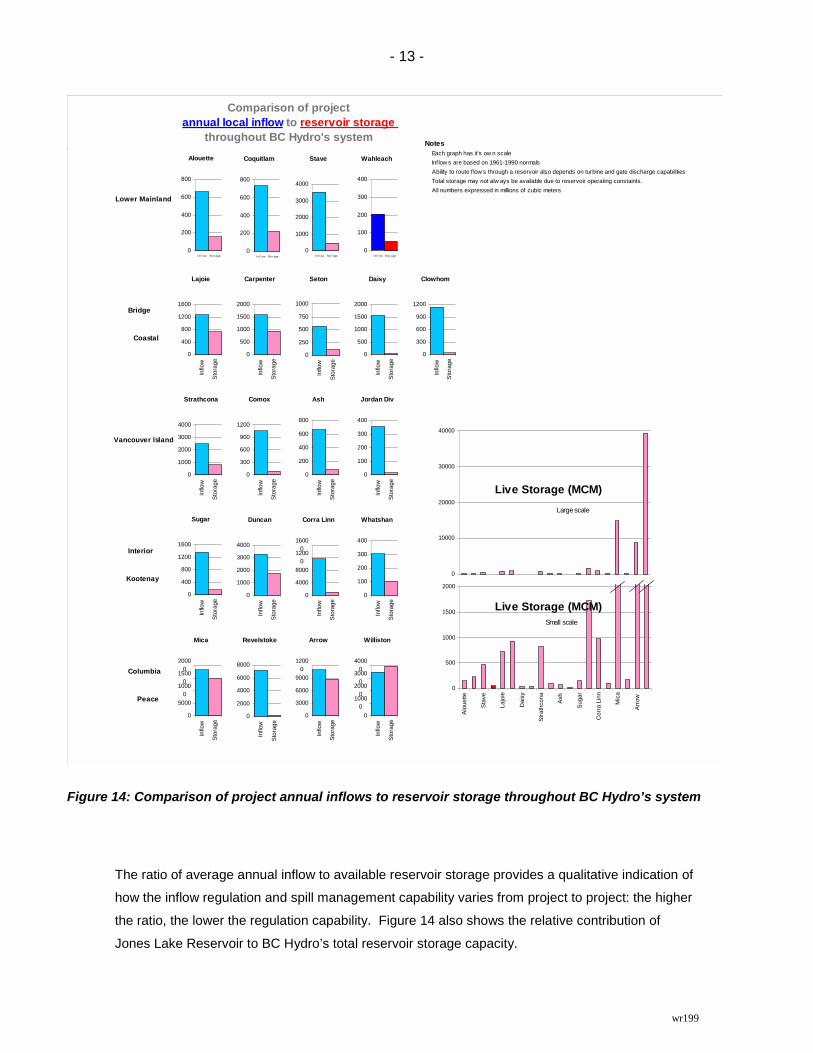
ference, Figure 14 shows a comparison between the mean annual local inflow and
ive storage available for selected BC Hydro and other hydroelectric projects. Jones
Reservoir is highlighted and shows that the average annual inflow is approximately 4
greater than the available project storage.
0500
1000150020002500300035004000
0 10 20 30 40 50 60 70 80 90 100Time That Inflow is Greater Than Shown (%)
Ann
ual I
nflo
w (c
ms-
d)
- 13 -
wr199
Notes Each graph has it's ow n scale Inf low s are based on 1961-1990 normals Ability to route f low s through a reservoir also depends on turbine and gate discharge capabilities Total storage may not alw ays be available due to reservoir operating constaints. All numbers expressed in millions of cubic meters
Lower Mainland
Bridge
Coastal
Vancouver Island
Interior
Kootenay
Columbia
Peace
Comparison of project annual local inflow to reservoir storage
throughout BC Hydro's system
0
10000
20000
30000
40000
Wahleach
0
100
200
300
400
Inf low Stor age
Duncan
0
1000
2000
3000
4000
Inflo
w
Stor
age
Jordan Div
0
100
200
300
400
Inflo
w
Stor
age
Alouette
0
200
400
600
800
Inf l ow Stor age
Ash
0
200
400
600
800
Inflo
w
Stor
age
Coquitlam
0
200
400
600
800
Inf l ow Stor age
Comox
0
300
600
900
1200
Inflo
w
Stor
age
Clowhom
0
300
600
900
1200
Inflo
w
Stor
age
Lajoie
0
400
800
1200
1600
Inflo
w
Stor
age
Sugar
0
400
800
1200
1600
Inflo
w
Stor
age
Daisy
0
500
1000
1500
2000
Inflo
w
Stor
age
Strathcona
0
1000
2000
3000
4000
Inflo
w
Stor
age
Carpenter
0
500
1000
1500
2000
Inflo
w
Stor
age
Corra Linn
0
4000
8000
12000
16000
Inflo
w
Stor
age
Stave
0
1000
2000
3000
4000
Inf l ow Stor age
Whatshan
0
100
200
300
400
Inflo
w
Stor
age
Mica
0
5000
10000
15000
20000
Inflo
w
Stor
age
Williston
0
10000
20000
30000
40000
Inflo
w
Stor
age
Arrow
0
3000
6000
9000
12000
Inflo
w
Stor
age
0
500
1000
1500
2000
Alou
ette
Stav
e
Lajo
ie
Dai
sy
Stra
thco
na
Ash
Suga
r
Cor
ra L
inn
Mic
a
Arro
w
Small scale
Large scale
Revelstoke
0
2000
4000
6000
8000
Inflo
w
Stor
age
Live Storage (MCM)
Live Storage (MCM)
Seton
0
250
500
750
1000
Inflo
w
Stor
age
Figure 14: Comparison of project annual inflows to reservoir storage throughout BC Hydro’s system
The ratio of average annual inflow to available reservoir storage provides a qualitative indication of
how the inflow regulation and spill management capability varies from project to project: the higher
the ratio, the lower the regulation capability. Figure 14 also shows the relative contribution of
Jones Lake Reservoir to BC Hydro’s total reservoir storage capacity.

- 14 -
wr199
4 Operational Inflow Forecasting
BC Hydro’s Resource Management produces two main types of hydrologic forecasts: daily
inflow and seasonal volume inflow forecasts for the Wahleach projects.
Daily inflow forecasts: Daily inflow forecasts are short-term forecasts that indicate the
inflow expected over the next few days. An in-house conceptual watershed model,
FLOCAST, is currently used to produce these forecasts. Each morning of each working
day, Resource Management enters observed and forecast precipitation, temperature, and
freezing level data into the model to forecast inflow over each of the next five days.
Volume inflow forecasts: Volume inflow forecasts estimate the volume of water that is
expected to flow in to the Wahleach system during a given period. BC Hydro typically
produces volume forecasts for the period of February through September. The ability to
forecast seasonal runoff for this period lies in the fact that much of the runoff during the
forecast period is the product of snowmelt runoff. By measuring snow water equivalent in
the mountain snowpack, as well as other parameters such as precipitation and streamflow
up to the forecast date, a more accurate estimate of future runoff can be made than one
based on historical inflow data alone. Volume inflow forecasts are issued beginning
January 1 of each year. The forecasts are updated on the first of each month until
August 1st.
- 15 -
wr199
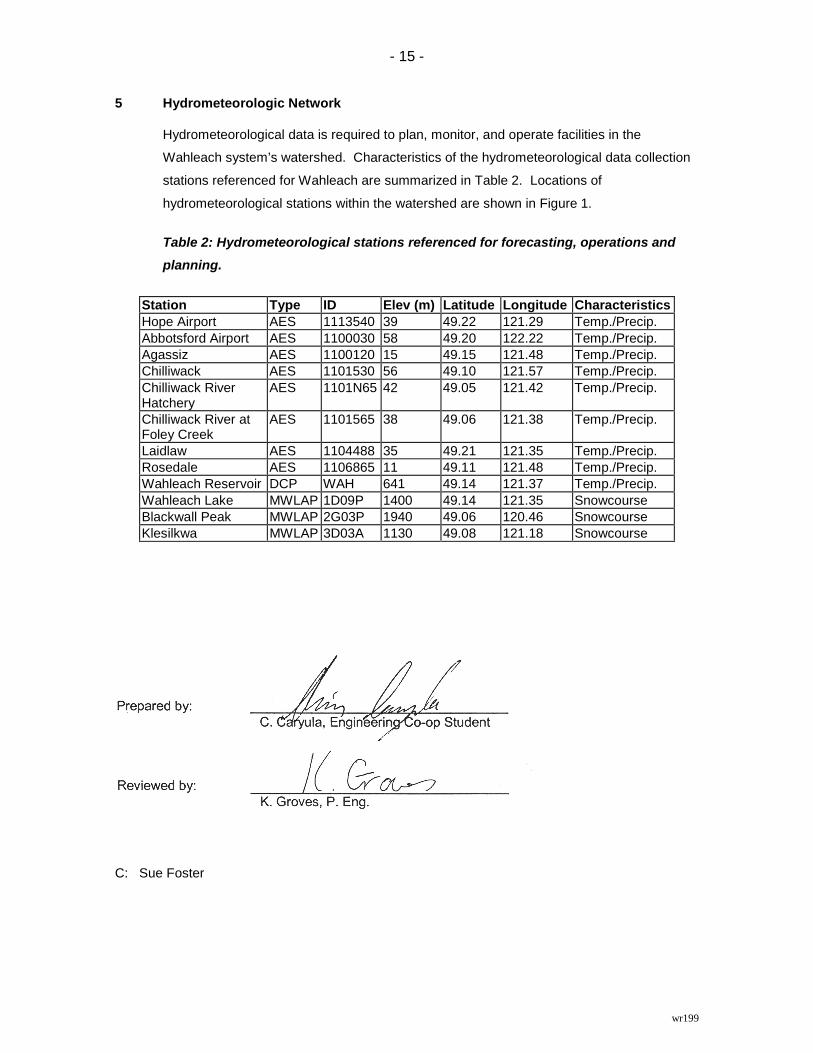
5 Hydrometeorologic Network
Hydrometeorological data is required to plan, monitor, and operate facilities in the
Wahleach system’s watershed. Characteristics of the hydrometeorological data collection
stations referenced for Wahleach are summarized in Table 2. Locations of
hydrometeorological stations within the watershed are shown in Figure 1.
Table 2: Hydrometeorological stations referenced for forecasting, operations andplanning.
Station Type ID Elev (m) Latitude Longitude CharacteristicsHope Airport AES 1113540 39 49.22 121.29 Temp./Precip.Abbotsford Airport AES 1100030 58 49.20 122.22 Temp./Precip.Agassiz AES 1100120 15 49.15 121.48 Temp./Precip.Chilliwack AES 1101530 56 49.10 121.57 Temp./Precip.Chilliwack RiverHatchery
AES 1101N65 42 49.05 121.42 Temp./Precip.
Chilliwack River atFoley Creek
AES 1101565 38 49.06 121.38 Temp./Precip.
Laidlaw AES 1104488 35 49.21 121.35 Temp./Precip.Rosedale AES 1106865 11 49.11 121.48 Temp./Precip.Wahleach Reservoir DCP WAH 641 49.14 121.37 Temp./Precip.Wahleach Lake MWLAP 1D09P 1400 49.14 121.35 SnowcourseBlackwall Peak MWLAP 2G03P 1940 49.06 120.46 SnowcourseKlesilkwa MWLAP 3D03A 1130 49.08 121.18 Snowcourse
C: Sue Foster