Embed Size (px)
Citation preview

Wages, Foreign Multinationals, and Local Plants in Thai Manufacturing
Atsuko Matsuoka Research Assistant Professor, ICSEAD
Working Paper Series Vol. 2001-15 June 2001
The views expressed in this publication are those of the author(s) and
do not necessarily reflect those of the Institute.
No part of this book may be used reproduced in any manner whatsoever
without written permission except in the case of brief quotations em-
bodied in articles and reviews. For information, please write to the Cen-
tre.
The International Centre for the Study of East Asian Development, Kitakyushu

1
Wages, Foreign Multinationals, and Local Plants in Thai Manufacturing
Atsuko Matsuoka*, Research Assistant Professor
The International Center for the East Asian Development (ICSEAD), Kitakyushu.
June 2001
Abstract This paper analyzes the wage differentials between plants belonging to foreign
multinational corporations (MNCs) and plants belonging to local firms in the Thai manufacturing sector. First, this paper finds evidence of positive wage differentials be-tween MNC plants and local plants for both non-production and production workers af-ter controlling for other plant characteristics. The magnitude of the wage differential is larger for non-production workers than for production workers. The magnitude of the wage differentials for both types of labor are also smaller for large plants and larger for plants that import a majority of their raw materials and parts. Second, this study also finds evidence of a positive correlation between the share of output by MNC plants to total output in an industry and the wage paid by local plants in the same industry.
Contents
1. Introduction
2. A Survey of the Literature
3. Methodology
4. The Thai Manufacturing Sector and the Data
5. Results of Econometric Estimation
6. Conclusion * The author would like to thank Dr. Somsak Tambunlertchai for providing the dataset and advice on this project and Dr. Eric D. Ramstetter for assistance with the dataset and other advice. This paper is prepared as a part of ICSEAD’s project, “Foreign Multina-tional Corporations and Host-Country Labor Markets in Asia”. The author also would like to thank ICSEAD for funding this study, as well as Dr. Shinichi Ichimura, Dr. Wil-liam E. James, Dr. Hiro Lee, other colleagues at ICSEAD, and other researchers for ad-vice.

2
1. Introduction
It is common to observe wage differentials between firms or plants. For exam-
ple, larger firms or plants tend to pay higher wages. There is also some evidence that
foreign multinational corporations (MNCs) or plants belonging to MNCs tend to pay
higher wages than local firms or plants in host economies, though the literature on wage
differentials between MNC plants and local plants is somewhat scarce. The main pur-
pose of this paper is to test for wage differentials between MNC plants and local plants
in Thai manufacturing after controlling for other plant characteristics, such as average
labor productivity, size, location, trade propensities, and industry affiliation. A second
goal of this paper is to see if the presence of MNC plants affects wage levels in local
plants.
This paper uses plant level data for the Thai manufacturing sector in 1996 to
investigate these questions. The paper is organized as follows. Section 2 surveys the lit-
erature on wage differentials and Section 3 explains the methodology used in this study.
Section 4 describes some major characteristics of the Thai manufacturing sector and the
data used in this study. Section 5 reports the results of regressions analyzing wage dif-
ferentials between MNC plants and local plants in Thailand as well as the results of re-
gressions analyzing the relationship between the share of foreign plants in total output
in an industry and wages paid by local plants in an industry. Some concluding remarks
are made in Section 6.
3
2. A Survey of the Literature
Wage differentials exist in several forms and it is common to divide the causes
of wage differentials into demand-side or employer-specific factors affecting the nature
of the labor required for a task and supply-side causes such as the type of labor services
a worker can provide.1 Davis and Haltiwanger (1991) and Lipsey and Sjöholm (2001)
explain how wage differentials between plants can be caused by labor-market factors
and by institutional factors or policy distortions. According to Davis and Haltiwanger
(1991), one factor related to labor markets is the fact that different plants may demand
different skill mixes. In their terminology, this may result in “sorting by ability”. In this
case, wage differentials may arise even if markets for each type of labor (or skill) are all
perfectly competitive, because the skill level of the each type of labor cannot be distin-
guished exactly.2
There are two factors may affect the skill mix demanded by a plant, techno-
logical heterogeneity among plants and differences in demand for the final goods pro-
duced by plants.3 More capital intensive or more technology intensive plants tend to
demand more skilled labor. Plants facing greater demand for technology-intensive
products tend to demand for skilled labor.4
1 For example, worker-specific characteristics are often measured in terms of a worker’s sex, race, age, educational attainment, skill-level, occupation, and length of their service. 2 Davis and Haltiwanger (1991) also describe how this can also happen in imperfectly competitive labor markets. 3 Skill-biased technological change and/or international trade are thought to be the main causes of wage differentials between skilled and unskilled labor in developed countries. See Davis and Haltiwanger (1991), Berman, Bound and Griliches (1994), Doms, Dunne and Troske (1997), Hanson and Harrison (1995). 4 See explanations in Hermash (1993), Adams (1999), and Troske (1999) for details about higher wages of larger firms and plants and for details about the substitutability
4
International trade may also be an important factor in this respect. Exporting
firms or plants may face greater demand for skill-intensive products. For example, re-
sults from Bernard and Jensen (1997) indicate that exports are the major cause of wage
gaps for skilled and unskilled labor among plants.5 In a related analysis, Feenstra and
Hanson (1996a, 1996b) stress the importance of imports of intermediate goods from the
developing countries as the causes of wage gaps between skilled and unskilled labor in
the developed countries. They suggest that outsourced production lines are usually in-
tensive in unskilled labor and that this is important reason for differences in the struc-
ture of labor demand and wage gaps between skilled and unskilled labor in developed
countries. For developing countries, the structure of labor demand and wage gaps may
be affected by imports of intermediate goods or capital goods from developed countries,
because these goods may embody the latest technologies in developed countries and are
often an important source of technology transfer.6
Wage differentials between MNC plants and local plants may also arise for the
reasons described above. MNCs are usually assumed to operate in imperfectly competi-
tive output markets and often in imperfectly competitive factor markets as well (e.g.,
Casson 1987; Caves 1996; Dunning 1988, 1993)7. Moreover, possession of ownership
advantages such as superior production technology is often thought to be a necessary
condition for a firm to become a MNC (e.g., Dunning 1988, 1993). Correspondingly,
and complementarity between various types of labor and various types of capital, or R&D. 5 And Sjöholm’s (1999a) results suggest that exporters or importers have relatively high labor productivity levels, and exporters have relatively high labor productivity growth. 6 See Romer (1993) or Coe, Helpman and Hoffmaister (1995). 7 Explanations of Casson (1987), Caves (1996), Dunning (1988,1993), and Markusen (1991) in this paragraph relies on Ramstetter and Matsuoka (2001) and Ramstetter (2001).
5
MNCs are generally expected to be more skill- or technology-intensive than non-MNCs
and demand more skilled-labor than non-MNCs. Others (e.g.,Casson 1987) dispute
this view saying that internalization of transactions is the key necessary condition for a
firm to become a MNC.8 However, this view also stresses the strong tendency for in-
ternalization to occur when information related to transactions is asymmetrically dis-
tributed between sellers and buyers such as transactions involving technology and
skilled labor.9 In any case, there is general agreement among theorists that MNCs will
tend to be more technology-intensive than non-MNCs and a large body of empirical re-
search suggesting that MNCs tend to have relatively high R&D-sales ratios and adver-
tising expenditure-sales ratios, and to possess a relatively large number of patents.10
Another important factor is that labor markets may be segmented and MNC
plants may face different labor markets than local plants face. Lipsey and Sjöholm
(2001), suggest three reasons that this might be the case. First, host-country regula-
tions or home country pressures might affect the ability of MNCs to hire or fire certain
types of labor. Second, workers may have a preference for locally-owned employers or
in some cases foreign-owned employers. Third, foreign-owned firms may seek to mini-
mize employee turnover, because they invest more in training than locally-owned firms,
or because they fear the leakage of their technological advantages if employees move to
other employers. In addition, if certain labor skills or skill combinations (e.g., the com-
8 According to this view ownership advantages are sufficient not necessary conditions for the MNC's existence. 9 The existence either ownership advantages implies that MNCs have market power while the existence of internalization implies that markets are not as efficient as other alternatives. Both assumptions therefore preclude the existence of perfect competition in at least some markets. 10 Barro and Sala-i-Martin (1991) and Glass and Saggi (1999) also present theories that MNCs engage R&D with more skilled labor and produce goods with unskilled labor.
6
bination of foreign language and engineering skills) are in very short supply and MNC
presence is relatively large in a developing country, as is the case in Thailand, the high
demand for such skills in MNCs could lead to MNC domination of markets for these
types of labor.
An important fact to keep in mind in the Thai case, is that most local firms are
not MNCs in their own right. Thus, comparisons of foreign MNCs and local plants in
Thailand, and many other developing economies, are essentially comparisons of MNCs
and non-MNCs. Unfortunately, there are very few previous studies of wage differen-
tials between MNCs and local plants in Thailand or other developing economies. For
example, Aitken, Harrison and Lipsey (1996) find evidence that MNCs paid higher
wages than local plants in manufacturing industries in Venezuela from 1977 to 1989 and
in Mexico from 1984 to 1990. The results of Lipsey and Sjöholm (2001) suggest that
the MNC plants paid higher wages than local plants in Indonesia’s manufacturing in-
dustries in 1996, even after controlling for numerous plant characteristics and the edu-
cational attainment of workers. Moreover, their results also indicate a positive rela-
tionship between the share of MNCs in an industry and the wage levels of local plants.
Ramstetter (1994) provides the only known previous estimate of wage differentials in a
sample of Thai firms that were promoted by the Thai Board of Investment (BOI) in
1990. The results suggest that MNCs pay higher wages than local firms but that cor-
responding differences in labor productivity were not statistically significant.11
11 This result is puzzling because wages are expected to be positively correlated with the marginal revenue product of labor (and the average revenue product of labor) across the plants. Note also that the finding of significant wage differentials is accompanied by findings of significant differences in labor productivity for Indonesia (e.g. Okamoto and Sjöholm 2000; Takii and Ramstetter 2000).
7
3. Methodology
In this study, two questions are examined. First do MNCs pay higher wages
than local plants after controlling for plant characteristics? Second, is larger MNC
presence in an industry correlated with wage levels in local plants in that industry?
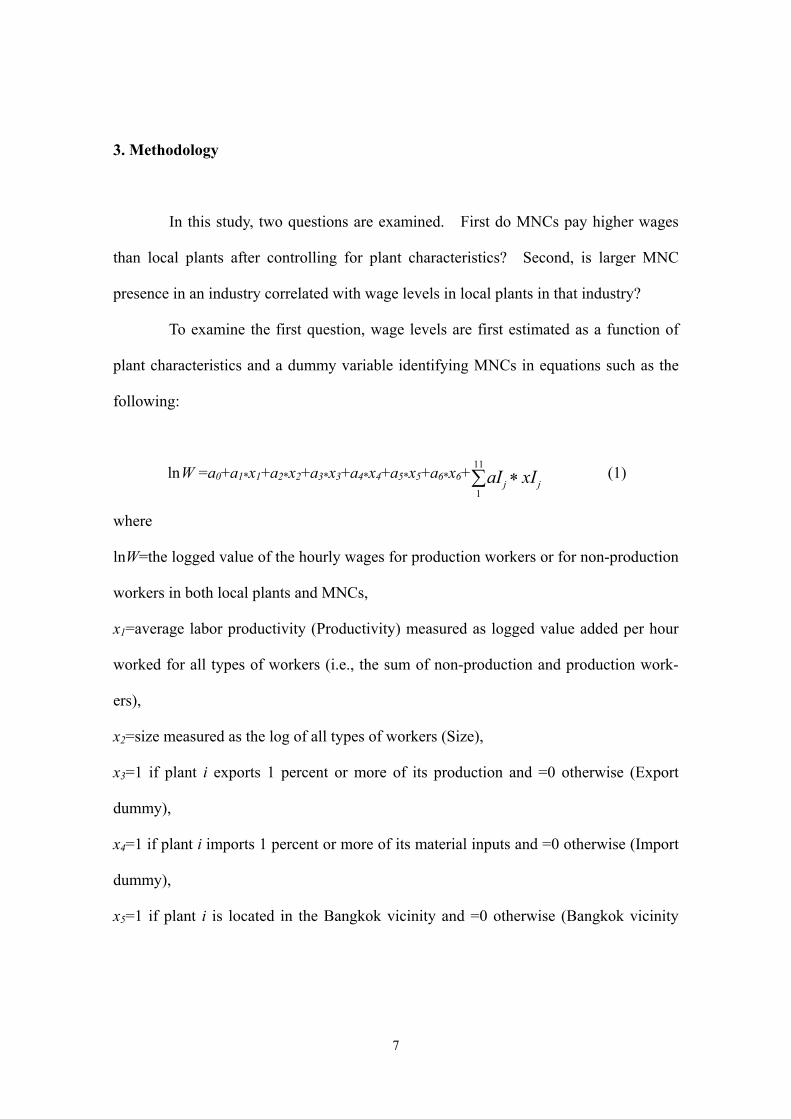
To examine the first question, wage levels are first estimated as a function of
plant characteristics and a dummy variable identifying MNCs in equations such as the
following:
Wln =a0+a1*x1+a2*x2+a3*x3+a4*x4+a5*x5+a6*x6+∑ ∗11
1jj xIaI (1)
where
lnW=the logged value of the hourly wages for production workers or for non-production
workers in both local plants and MNCs,
x1=average labor productivity (Productivity) measured as logged value added per hour
worked for all types of workers (i.e., the sum of non-production and production work-
ers),
x2=size measured as the log of all types of workers (Size),
x3=1 if plant i exports 1 percent or more of its production and =0 otherwise (Export
dummy),
x4=1 if plant i imports 1 percent or more of its material inputs and =0 otherwise (Import
dummy),
x5=1 if plant i is located in the Bangkok vicinity and =0 otherwise (Bangkok vicinity

8
dummy),12
x6 =1 if foreign ownership share of plant i is 1 percent or greater and =0 otherwise
(MNC dummy).
xIj =1 is an industry dummy variable if plant i belongs to the jth industry, =0 otherwise
(i.e., j=1 to 11).13
The magnitude of the coefficient on the MNC dummy (=a6), indicates the
magnitude of the wage differential between MNC plants and local plants in percent after
controlling for other plant-specific characteristics of plants (x1 to x5)14. Average labor
productivity (x1) is used as a proxy for the unobservable differences in labor skills be-
cause this dataset contains no information about skill types, abilities, or levels of educa-
tion attainment for either non-production labor or production labor.15 A positive sign is
expected for this coefficient because plants with relatively more skilled labor are
thought to exhibit higher labor productivity and higher average wages. Plant size (x2)
is also thought to be positively correlated with wages because larger plants expected to
be more capital intensive, more technology intensive, and may benefit from economies
12 The Bangkok vicinity is defined to include Bangkok, Samut Prakan, Nonthaburi, Pathum Thani, Nakhon Pathom, and Samut Sakon. 13 Industry dummies are specified for food, textiles, apparel, leather & footwear, chemicals & products, rubber and plastics, non-metallic mineral products, metal prod-ucts, general machinery, electric machinery, and motor vehicles. The control industry for which no dummy is specified is other manufacturing, including beverages, tobacco, wood and wood products, paper and paper products, publishing and printing, oil, coke and nuclear etc., basic metals, and other transport equipment. 14 However, strictly speaking, it is not sufficient to control only for plant characteristics. When examining the wage differentials between plants, wages for the same type of la-bor should be compared between plants after controlling the characteristics of workers. Data sets that match workers and employers make it possible to examine wage differentials between plants in more strict sense (e.g., Troske 1999). 15 It should be recognized that this variable might capture other effects, such as un-measured differences in factor intensities.

9
of scale. As a result, larger plants are expected to demand more skilled labor than
smaller plants. Dummies for exporters (x3) and importers (x4) are included to control for
the effects of international trade described in the previous section. Plant location is con-
trolled for because wages are known to be higher in Bangkok and the surrounding vi-
cinity than in the rest of the country. Finally, industry dummies are included to ac-
count for industry-specific differences in technology. Coefficients on these dummies
may also reflect plant-specific characteristics other than those explicitly accounted for
in these regressions if those characteristics tend to be clustered in specific industries.16
Estimates are done using the ordinary least squares method with White’s heteroscedas-
ticity consistent standard errors to evaluate t-statistics.17
The second question, whether the presence of MNCs affects wage levels in lo-
cal plants, is analyzed with a methodology developed by Lipsey and Sjöholm (2001).
In this approach, wages in local plants are viewed as a function of the control variables
identified above and the foreign share of output in the industry to which the local plant
belongs. The equation is:
WDln =b0+b1*x1+b2*x2+b3*x3+b4*x4+b5*x5+b6*z (2)
where
lnWD=the logged wages per hour for production workers or for non-production workers
in local plant i in industry j.
z =the share of foreign-owned plants (all plants with a foreign ownership share is 1 per-
cent or greater) in the output (=value added + intermediate consumption) of industry j,
16 This is a very restrictive way of dealing with intra-industry differentials, however, because it forces slope coefficients to be identical for all industries. A less restrictive approach would be to estimate separate equations for separate industries. 17 Observations with the top 1/64 and the bottom 1/64 of normalized residuals by OLS are removed from the sample and equations are estimated again without those outliers.

10
and all other variables are as defined above.
Industries are defined at the 2- or 3-digit level of ISIC revision 3 as presented
in National Statistical Office (1999) industry classification for 49 out of a total of 61
industries.18 This approach is similar to approaches used in the literature on productiv-
ity spillovers (see Sjöholm1999b; Takii 2001). The hypothesis is that the presence of
MNC plants affects local plants through direct and through increased competition
MNCs may bring. In labor markets, for example, the entry of MNCs may increase the
demand for all types of labor, leading to an increase of all wage levels for both MNC
plants and local plants. This may or may not affect the magnitude of the wage
differentials, depending on the relative sizes of the changes induced. The entry of MNC
plants may also affect the skill mix demanded by local plants. Technology spillovers
from MNC plants to local firms may also reduce technology gaps between MNC plants
and local plants. If the coefficient on the MNC share, b6, is positive, then larger presence
is associated with higher wages in local plants and the reverse is true if the coefficient is
negative.
4. The Thai Manufacturing Sector and the Data
Thailand experienced an unprecedented economic boom beginning in 1987.
During this boom, Thailand’s manufacturing sector grew very rapidly with real GDP
increasing an average of 13 percent annually in real terms in 1986-1996, and by 1996,
manufacturing accounted for 28 percent of GDP and 13 percent of employment, up
18 There are 61 3-digit level industries in National Statistical Office (1999) but indus-tries where the number of plants is less than 20 are combined.

11
from 24 percent and 8 percent, respectively, a decade earlier (Table 1 and its sources).
There are several possible ways to measure compensation or wages per em-
ployee in Thailand, all of which have important problems. First, in principle, the most
comprehensive measure is the ratio of total compensation as reported in the national
accounts to total employment from the labor force surveys. This calculation suggests
that nominal compensation per employee rose 21 percent annually in 1986-1996 to
reach 9,369 baht per month in 1996 (Table 1). One possible reason for the apparent
overestimate of growth by this calculation is that the labor force surveys underestimate
manufacturing employment or that the national accounts overestimate compensation in
manufacturing.19 Alternative estimates from a sample of employees reporting wages
in the labor force surveys suggest much lower compensation per employee in 1996,
6,245 baht, and much lower growth in 1986-1996, 9 percent annually. However, this
sample covers only 3.2 million of the 4.3 million employees reported to be in manufac-
turing by official data. This study analyzes an even smaller sample of plant-level un-
derlying the industrial census for 1996 (National Statistical Office 1999). Published
figures from this census covered only 2.4 million employees in 23,677 plants and com-
pensation per employee was 8,108 baht per month in this sample.20
Unfortunately, in the plant-level dataset underlying the published data, there are
apparently a large number of duplicate records, probably because many plants belong-
ing to multi-plant firms reported the same firm-wide data. Thus, for use in this study,
19 Ramstetter (1997, pp. 167-169) provides evidence suggesting that official statistics overestimate employment in agriculture and underestimate the shares of other sectors, including manufacturing. 20 The census database includes information on 32,489 establishments and published compilations cover 23,677 replying plants with 10 or more persons engaged.
12
all duplicate records are first removed from the sample to avoid double counting.21 In
addition, the published samples contain a lot of small plants and plants that report ap-
parently implausibly small values for many variables. Because comparisons of MNCs
are not thought to be meaningful in samples including very small plants, plants report-
ing less than 20 employees were eliminated from the sample. Plants reporting less
than one thousand baht in sales of goods produced, total fixed assets at both the begin-
ning and the end of the year, and machinery fixed assets at the beginning of the year,
were also excluded from the sample because these values are thought to be unrealisti-
cally small. The remaining sample consists of 8,432 plants, covering 1.4 million em-
ployees, which were paid 8,415 baht each in compensation per month (Table 1). Thus,
the sample studied below covers only 33 percent of total manufacturing employment
that was reported in the labor force survey, but it does account for a markedly larger
portion of value added reported in the national accounts, 57 percent. Coverage rates
for the industrial census (published figures) vary greatly across industries, however (see
Ramstetter 2001, pp. 10-11) and the same can be said for this sample.
Table 2 shows the shares of foreign MNCs in employment, value added and
output by industry. For all manufacturing, foreign MNCs accounted for 43 percent of
all employment, 54 percent of all value added, and 58 percent of all output.22 However,
there is a very large variation of these shares across industries. Shares were very large
in electric machinery and transportation machinery, where MNCs dominate, followed
21 See Ramstetter (2001, pp. 9-10) for details on how duplicates were identified. Note that this sample differs from the sample in Ramstetter (2001), because all duplicates were removed. In contrast, Ramstetter (2001) retains 1 record from each set of dupli-cates in an attempt to maximize sample coverage. 22 Note that these shares refer to this sample only. Shares for all Thai manufacturing, including plants not covered in the industrial census, are probably much smaller as ex-plained by Ramstetter (2001).
13
by general machinery and textiles. In contrast, shares were much smaller in food,
leather and footwear, non-metallic mineral products, and other manufacturing.
Table 3 shows the same shares for all manufacturing plants divided into four
groups by plant size, where plant size is measured as the number of total workers (i.e.,
the sum of non-production workers and production workers) per plant. Large plants
(plants with more than 150 total workers) accounted for 86 percent of the all value
added and 87 percent of output of the all the plants in this sample. 57 percent of the
value added and 63 percent of the output of these large plants originates in MNC plants
but MNC shares are smaller in groups of smaller firms. The share of large plants in total
workers (77 percent) and the MNC share of total workers in large plants (51 percent)
are both smaller than corresponding shares for value added and output.
Table 4 calculates hourly wages for both non-production workers and production
workers by industry and owner. In this table and in the analysis below, hourly wages
are broadly defined here to include all employee compensation except social security
payments.23 In all manufacturing, the mean of hourly wages for non-production work-
ers was 75 baht in MNC plants and 49 baht in local plants. In other words, the average
wage differential between MNCs and local plants for non-production workers was 53
percent in this sample. These differentials were highest in motor vehicles (94 percent),
other manufacturing (92 percent), and chemicals (59 percent) and smallest in leather
and footwear (3 percent), textiles (9 percent), metal products (17 percent), general ma-
chinery (20 percent), apparel (32 percent), electric machinery (36 percent), and rubber
23 Hours worked are calculated as the number of employees times the number of hours a factory is in operation in the year. Hourly wages are the wage bill (including wages and salaries, overtime, bonuses, and fringe benefits other than social security) divided by the number of hours worked.
14
and plastics (38 percent). Mean wages for production workers were lower than for
production workers, reflecting the relatively low skill levels of these workers. The
differential between wages for production workers in MNCs (31 baht) and in local
plants (25 baht) was also smaller than for non-production workers, only 25 percent in all
manufacturing. Wage differentials for production workers were largest in non-metallic
mineral products (61 percent), motor vehicles (48 percent), chemicals (34 percent), and
lowest in food (-3 percent), rubber and plastics (-2 percent), leather & footwear (0 per-
cent), and textiles and apparel (5 percent each).
By industry MNCs pay production workers the highest wages in chemicals and
motor vehicles, followed by general machinery, non-metallic mineral products, electric
machinery, and metal products (Table 4). MNCs also pay the highest wages to
non-production workers in chemicals and motor vehicles, followed by other manufac-
turing, and leather and footwear. Local plants pay production workers the highest
wages in chemicals, electric machinery, general machinery, and motor vehicles. For
non-production workers, local pay the most in leather and footwear, general machinery,
and chemicals. Thus, there is some weak evidence of a wage premium in industries
like chemicals and motor vehicles for both types of labor in both ownership groups and
it is likely that this premium reflects, at least in part, differences in skill mixes not cap-
tured by the distinction between production and non-production workers.
Table 5 shows mean wages for MNCs and local plants in all manufacturing by
plant size. For local plants, mean wages for production workers are slightly higher for
large plants than for small plants or for two intermediate size groups. Differences are
somewhat larger for non-production workers in local plants with wages in medium-large
and large plants both greatly exceeding corresponding levels in small and small-medium
15
plants. For MNC plants, mean wages for both types of labor are highest among me-
dium-large plants. For production workers, wage levels in medium-large MNC plants
are followed by small plants, small-medium plants, and finally by large plants. For
non-production workers wage levels in other size classes are similar and lower than in
medium-large MNC plants. The most important point here is that for each combina-
tion of size class and type of labor, wages in MNCs are again higher than for local
plants when comparisons are made for all manufacturing industries combined. These
differentials (measured in percentage terms) were smaller for large plants than for
groups of smaller plants and smaller for production workers than for non-production
workers.
A similar pattern is observed when wages are classified by trade propensity and
ownership (Table 6). For each trade propensity class and each type of labor in all
manufacturing, mean wages of MNC plants are higher than in local plants. Moreover,
the percentage differential is larger for non-production workers than for production
workers in all comparisons in the table. Mean wages were also higher for both own-
ership groups and both types of labor in plants importing the majority (50 percent or
more) of their raw materials and parts than in plants importing only half or less of their
raw materials and parts, though these differentials were much larger for non-production
workers than for production workers. Wages are also higher for non-production work-
ers in local plants that export a majority of their output, but this differential was very
small for production workers. MNC plants that exported the majority of their output
paid lower wages than MNC plants that exported less than half of their output, with the
gap being largest for production workers.

16
5. Results of Econometric Estimation
Tables 7-8 show the results for estimating equation (1) for non-production and
production workers, respectively. In both tables the results of estimating four specifi-
cations are reported to illustrate the sensitivity of the results to various specifications.
As expected, coefficients on control variables (average labor productivity, size, dum-
mies for plants with large trade propensities, and the dummy variable for plants located
in Bangkok and the surrounding area) are all positive and significant at the 5 percent
level or better in all regressions explaining wages of non-production workers (Table 7).
In other words, wages for non-production workers tended to be higher in plants with
higher average labor productivity, a larger number of employees, positive exports, posi-
tive imports, and for plants located in the Bangkok vicinity. Results obtained from es-
timates of production worker wages are similar with two exceptions (Table 8). First, in
specification (3), which includes dummies for plants engaged in international trade but
excludes the size variable, the coefficient on the dummy for exporting plants is very
small and insignificant, but this coefficient becomes larger and significantly positive
when the size variable is included. Second, in specification (2) and (4), which include
the size variable, the coefficient on the size variable is negative and significant, not
positive as expected. Although inconsistent with the theoretical explanation offered
above, this result is not inconsistent with the descriptive statistics in Table 5, which
suggest that production workers earn relatively low wages in large MNCs compared to
smaller MNCs and that wages are only slightly higher in large local plants than in
smaller local plants.24
24 There are two important statistical problems that could also be related to this result.

17
In this context, the most important result is that the sign and significance levels
of the coefficients on the MNC dummy variable are not affected by the inclusion or ex-
clusion of various control variables. Namely, the coefficients on the MNC dummy are
positive and significant in all specifications for both production and non-production
workers. However, the size of the coefficient on the MNC dummy is affected. For
non-production workers the coefficient is 0.26 in specification (1), which excludes the
size variable and the dummy variables for plants engaged in international trade (Table
7). Adding the dummy variables for plants engaged in international trade in specifica-
tion (3) greatly reduces this coefficient to 0.15. Further addition of the size variable in
specification (4) reduces the coefficient a little more to 0.14. This result suggests that
MNC plants pay non-production workers roughly 14 percent more than local plants, af-
ter the effects of all control variables in equation (1) are accounted for.
For production workers, wage differentials between MNCs and local plants are
relatively small but the control variables have a different effect on differentials for this
type of labor, largely because of the negative relationship between size and wages for
non-production workers (Table 8). The maximum differential is 0.11, which is ob-
served in specification (2) including the size variable but excluding dummy variables
for plants engaged in international trade. Conversely, the minimum differential is the
0.06 in specification (3), which excludes the size variable but includes the dummy vari-
ables for plants engaged in international trade. If all control variables are included as
First, multicollinearity, especially between value added per worker and size could be a problem. Second, the fact that size is measured in terms of total number employed could create simultaneity with the dependent variables, which include the number of production employees or non-production employees in their denominators. However, the result does not change much if output is used to measure size. Further regressions below attempt to illuminate other dimensions of this relationship.
18
in specification (4), the coefficient is 0.08, which suggests that MNC plants pay produc-
tion workers roughly 8 percent more than local plants. These results suggest that the
differential for production workers is only a little more than half of the corresponding
differential for non-production workers. This finding may result from a greater simi-
larity in the mix of skills between MNCs and local plants for production workers than
for non-production workers or it may result from the greater segmentation of markets
for non-production workers compared to production workers.
As indicated above, the sign of the coefficient on the size variable was not of
the expected sign for production workers and the descriptive statistics in Table 5 also
indicate that the relationship between wages and plant size is not a strong as indicated
by previous literature. Moreover, there is some indication that the unexpected results
for the size variable are related to results for dummies indicating international trade
status. In order to further investigate these relationships, equation (1) was estimated
for four size groups and four trade-propensity groups, and the results are reported in Ta-
bles 9-12 below.
There are three important results obtained from regressions by size group.
First, the results indicate that wage differentials between MNCs and local plants de-
crease with plant-size. For non-production workers, the coefficients on the MNC
dummy were 0.27 in small plants, 0.23 in small-medium plants, 0.17 in medium-large
plants, and 0.08 in large plants (Table 9). These results thus indicate that the wage
differential for non-production workers was much smaller in large plants compared to
all groups of smaller plants, for example only 8 percent in large plants but 27 percent in
small plants. For production workers, corresponding coefficients on the MNC dummy
were 0.13 in small and medium-large plants, 0.11 in small-medium plants, and 0.04 but

19
statistically insignificant in large plants (Table 10). These results thus suggest that
differentials for production workers were similar in all groups of smaller plants, 11-13
percent, but that the differential is essentially zero (i.e., statistically insignificant) in
large plants, 4 percent. The second important result is that wage differentials are larger
for all size groups of nonproduction workers compared to production workers. The
third important result is the observation of a significantly negative relationship between
plant size and wages for both types of labor in large plants and for production workers
in small plants. Thus, the negative relationship between plant size and wages appears
to be more common than the results in Tables 7-8 suggest.
In view of the results suggesting a strong negative relationship between wages
and size, regressions that distinguish plants by trade propensity only include plants with
60 or more employees. It is also important to note that the sample is divided into
plants that have export or import propensities of 50-100 percent or 0-49 percent, respec-
tively, and that this distinction is different than the one used when specifying the
dummy variables for trade propensities in equation (1), which distinguishes plants en-
gaged in international trade from those not involved in international trade. All of the in-
tercepts are positive, significant, and larger in the groups of plants with trade propensi-
ties of 50 percent or greater, indicating that plants heavily engaged international trade
paid higher wages (Tables 11-12). All coefficients on the MNC dummy were positive
and significant in these equations, indicating positive wage differentials here as well.
However, for wages of non-production workers the coefficient on the MNC dummy is
only slightly larger for plants exporting the majority of their output, 0.14, than for plants
exporting less than half of their output, 0.12 and the corresponding coefficient for wages
of production workers was actually smaller for plants exporting a majority of their out-

20
put, 0.07 compared to 0.09. In marked contrast, the coefficients on the MNC dummy
were much larger for large importers than for small importers, 0.21 versus 0.12 for
non-production workers and 0.13 versus 0.06 for production workers. Thus, the mag-
nitude of wage differentials between MNC and local plants is not affected much by ex-
port orientation but it is affected a lot by import orientation. This might suggest that
MNC plants may tend to import raw materials and parts that embody relatively sophis-
ticated technologies, thereby increasing the demand for relatively skilled labor in both
the production and non-production worker groups.
Finally, Tables 13 and 14 report the results of estimating equation (2) in an at-
tempt ascertain how greater MNC presence in an industry is related to wage levels of
local plants in that industry. The control variables are the same as in equation (1) and
the results obtained are very similar (Tables 13-14). Average labor productivity, posi-
tive import propensities, and location in the Bangkok area, are all positively correlated
with wage levels for both types of labor. Positive export propensities and plant size
are also positively correlated with wage levels for non-production workers but this is
not necessarily the case for production workers. Moreover, in all but one case, the
non-production wage equation specification (3), which excludes the size variable but
includes the trade propensity variables, coefficients on the MNC share of output are
positive and significant at the 5 percent level or better.25 These results are similar to
results for Indonesia in Lipsey and Sjoholm (2001), and suggest a positive correlation
between MNC presence in an industry and the wages of the local plants in that industry.
Interestingly, these results suggest a larger wage spillover for production workers than
25 Even in the one exception the coefficient on the MNC share is still positive and weakly significant at the 10 percent level.

21
for non-production workers. As indicated above, this finding could result from high
demand for labor resulting from large MNC presence or from differences in the skills
demanded by MNCs and local plants. This finding could also be a result of
productivity spillovers from MNC plants to local plants such as those documented by
Takii (2001), which would in turn be expected to reduce the magnitude of technological
heterogeneity between MNC plants and local plants.
6. Conclusion and remarks
This paper analyzes the wage differentials between plants belonging to foreign
multinational corporations (MNCs) and plants belonging to local firms in the Thai
manufacturing sector. The first major finding of the paper is evidence of positive wage
differentials between MNC plants and local plants for both non-production and produc-
tion labor after controlling the other plant characteristics, including average labor pro-
ductivity, size, trade propensities, and industry affiliation. The findings also suggest that
the magnitude of wage differentials is (1) larger for non-production workers than for
production workers, (2) larger within groups of relatively small plants than within a
group of larger plants, and (3) larger within the group of plants with large import pro-
pensities (50 percent or more) than within the group of plants with small import propen-
sities (49 percent or less). However, the magnitude of wage differentials is similar in
the group of plants with low export propensities and in the group of plants with large
export propensities. The results with respect to trade propensities suggest that MNC
plants may import materials or intermediate goods that embody new technology and
require more skilled labor than local plants but that MNC plants and local plants may
22
face similar product markets both in domestic and international markets, resulting in
similar labor demands in MNCs and local plants.
The second major finding is that wages in local plants are relatively high in in-
dustries where MNC shares of industrial output are relatively large. There are at least
two possible reasons for these positive wage spillovers. First, relatively large MNC
presence may stimulate the demand for all labor skills in an industry, thereby leading to
higher wages. Second, larger MNC presence may be associated with relatively large
technology transfer or productivity spillovers to local plants that lead to increased de-
mand for skilled labor relative to unskilled labor, and therefore to higher wages.
These findings are certainly plausible but there is still a lot of research that
needs to be done before they can be accepted. First, it is possible to extend the analy-
sis to 1998 and this would be of great interest given the large effects the economic crisis
imparted on Thailand in this year. Second, the industry dimension should be scruti-
nized more thoroughly by running regressions such as equation (1) at the industry level.
These regressions may suggest that slope dummies are also necessary in equation (2) as
well. Third, specification issues need to be addressed more thoroughly. For example,
in this context, it would be interesting to explore the use of the capital-labor ratio in-
stead of the average labor productivity in a manner that follows Lipsey and Sjoholm
(2001). Fourth, there are several important simultaneity issues raised by the specifica-
tion of equations (1) and (2). In view of the perverse sign on size, one important cor-
relation of possible concern is between the dependent variables (wages per hours
worked) and the employment-based measure of size used in this study but using a
value-based measure of size (output) instead does not seem to affect the results much.
Another is the possibility of correlations among independent variables. For example,
23
several studies view average labor productivity as a function of ownership and another
group of studies suggests that trade propensities are a function of ownership. Still an-
other problem is presented by the fact that outputs and factor inputs are usually deter-
mined simultaneously. There is clearly a limit to the ability to deal with problems like
these in the context of this data set but these problems do need more investigation in
future research.
However, in the final analysis, it should be emphasized this paper has shown
the major results summarized to be rather robust in a variety of specifications and sam-
ples. Thus, the major findings of positive wage differentials between MNCs and local
plants and positive wage spillovers from MNCs to local plants may well survive further
scrutiny. In the Thai context, the finding of positive wage differentials is of particular
interest because it is consistent with previous results for Thailand but contrasts mark-
edly with the mounting evidence that labor productivity differentials between MNCs
and local plants were generally insignificant in Thailand. The combination of these
two findings is of great interest because it implies that wage differentials result from
imperfections in output and/or factor markets, not from differences in labor productiv-
ity.

24
References
Adames, J.D. (1999) “The structure of Firm R&D, the Factor Intensity of Production,
and Skill Bias”, The Review of Economics and Statistics, Vol.81, No.3, pp
499-510.
Aitken, B., A. Harrison and R.E.Lipsey (1996) “Wages and Foreign Ownership: A
Comparative study of Mexico, Venezuela, and the United States”, Journal of
International Economics, Vo.40, pp 345-371.
Barro, R.J. and X. Sala-i-Martin (1995) Economic Growth, 1995, Cambridge,MA: The
MIT Press.
Berman, E., J. Bound, and Z. Griliches (1994) “Changes in the Demand for Skilled la-
bor within US Manufacturing: Evidence from the Annual Survey of Manufac-
tures”, The Quarterly Journal of Economics, Vol.109, No.2, pp. 367-397.
Bernard, A.W. and J.B. Jensen (1997) “Exporters, skill upgrading, and the wage gap”,
Journal of International Economics, Vo.42, pp 3-31.
Casson, M. (1987) The Firm and the Market. Cambridge,MA: The MIT Press.
Caves, R.E.(1996) Multinational Enterprise and Economic Analysis. Cambridge, UK:
Cambridge University Press.
Coe, D.T., E. Helpman and A.W. Hoffmaister (1995) “ North-South R&D Spillovers”,
NBER Working Paper, No.5048, Cambridge, MA: National Bureau of Eco-
nomic Research.
Davis, S.J. and J. Haltiwanger (1991) “Wage Dispersion between and within U.S.
Manufacturing Plants, 1963-86”, Brookings Papers on Economic Activity: Mi-
croeconomics, 1991, pp115-200.
Doms, M., T.Dunne and K.R.Troske (1997) “Workers, Wages, and Technology”, The

25
Quarterly Jounral of Economics, Vol.112, No.1, pp. 253-290.
Dunning, J.H. (1988) Explaining International Production. London: Unwin Hyman Ltd.
Dunning, J.H. (1993) Multinational Enterprises and the Global Economy. New York:
Addison-Wesley Publishing Company Inc.
Feenstra, R. and G. Hanson (1996a) “Globalization, Outsourcing, and Wage Inequality”,
American Economic Review, Vol.86, pp. 241-245.
Feenstra, R. and G. Hanson (1996a) “Foreign Investment, Outsourcing, and relative
wages” in R.C. Feenstra, G. M. Grossman, and D.A. Irwin, eds., The Political
Economy of Trade Policy, Cambridge, MA: The MIT Press, pp. 89-127.
Glass, A.J. and K. Saggi (1998) “Foreign Direct Investment and the Nature of R&D”,
Canadian Journal of Economics, Vol.32., No.1, pp. 92-117.
Hanson, G.H. and A. Harrison(1995) “Trade, Technology, and Wage Inequality”, NBER
Working Paper, No.5110, Cambridge, MA: National Bureau of Economic Re-
search.
Hermash, S. D. (1993) Labor Demand. Princeton, NJ: Princeton University Press.
Lipsey, R.E. and F. Sjöholm (2001) “Foreign Direct Investment and Wages in Indone-
sian Manufacturing”, Working Paper Series Vol. 2001-02, Kitakyushu: The
International Center for the Study of East Asian Economic Development.
Markusen, J.R. (1991) “The theory of the Multinational Enterprise: A common Analyti-
cal Framework”, in E.D. Ramstetter, ed., Direct Foreign Investment in Asia’s
Developing Economies and Structural Change in the Asia-Pacific Region,
Boulder, CO: Westview Press.
National Economic and Social Development Board (1999) National Income of Thailand
1980-1996. Bangkok: National Economic and Social Development Board.
26
National Economic and Social Development Board (2001) National Income of Thailand
1999. Bangkok: National Economic and Social Development Board.
National Statistical Office (1999) Report of the 1997 Industrial Census: Whole Kingdom,
Bangkok: National Statistical Office and Office of Prime Minister
National Statistical Office (various years) Report of the Labor Force Survey; Whole
Kingdom, 1986, and 1996, Bangkok: National Statistical Office and Office of
Prime Minister
Okamoto, Y. and F. Sjoholm (2000) “ Productivity in the Indonesian Automotive Indus-
try”, ASEAN Economic Bulletin, Vol.17, No.1, pp 60-73.
Ramstetter, E.D. (1994) “Comparisons of Japanese Multinationals and Other Firms in
Thailand’s Non-oil Manufacturing Industries”, ASEAN Economic Bulletin,
Vol.11, No.1, pp 36-58.
Ramstetter, E.D. (1997) “The Effect of Foreign Multinational Firms on Production and
Trade in Thailand: An Exploratory Macroeconomic Analysis”, in Mitsuru
Toida and Daisuke Hiratsuka, eds., Projections for Asian Industrializing Re-
gion: Economic Forecasts for 2005, Tokyo: Institute of Developing Econom-
ics, pp 145-212.
Ramstetter, E.D. (2001) “Labor Productivity in Local Plants and Foreign Multinationals
in Thai Manufacturing, 1996 and 1998”, Working Paper Series Vol. 2001-14,
Kitakyushu: The International Center for the Study of East Asian Economic
Development.
Ramstetter, E.D and A.Matsuoka (2001) “Recent Trends in Large Firms in Singapore
and Thailand: Did Foreign Multinationals Perform Differently than Local
Firms Through the Crisis?", in Mitsuru Toida and Daisuke Hiratsuka, eds.,

27
Ajia Kogyoken no Keizai Tenbo 2001 [Projections for Asian Industrializing
Region 2001], Tokyo: Institute of Developing Economies, pp. 79-180.
Romer, P (1993) “Idea Gaps and Object Gaps in Economic Development”, Journal of
Monetary Economics, Vol.32, pp 543-573.
Sjöholm, F. (1999a) “ Exports, Imports and Productivity: Results from Indonesian Data“,
World Development, Vol.27, No.4, pp 705-715.
Sjöholm, F. (1999b) “ Techonology Gap, Competition and Spillovers from Direct For-
eign Investment: Evidence from Establishment Data, Journal of Develop-
ment Studies, Vol.36, No.1, pp 53-73.
Takii S. (2001) “Productivity Spillover and Characteristics of Foreign Multinational
Plants in Indonesian Manufacturing 1990-1995”, Working Paper Series Vol.
2001-14, Kitakyushu: The International Center for the Study of East Asian
Economic Development.
Takii S., and E.D.Ramstetter (2000) “Foreign Multinationals in Indonesian Manufac-
turing 1985-1998: Shares, Relative Size, and Relative Labor productivity”,
Working Paper Series Vol. 2000-18, Kitakyushu: The International Center for
the Study of East Asian Economic Development.
Troske, K.R. (1999) “Evidence on the Employer Size-wage Premium from
Worker-Establishment Matched Data”, The Review of Economics and Statis-
tics, Vol.81, No.1, pp 15-26.

Table 1: Economic indicators for Thai manufacturing in 1996 and 1986-1996 (units as noted)
Indicator
NESDB,National
Accounts, orNSO,
Labor ForceSurveys,
samples of allemployees
NSO,Labor Force
Surveys,samples ofemployeesreporting
wages
NSO, 1987industrial
survey or 1997industrialcensus,
publishedestimates
NSO, 1997industrialcensus,
this sample
1996Value added, million current baht 1,303,417 NA 998,144 748,255Total workers, number 4,334,200 3,206,500 2,431,584 1,444,827Monthly compensation per employee, current baht 9,369 6,245 8,108 8,415Value added, % of all industries 28.20 NA NA NATotal workers, % of all industries 13.45 33.16 NA NA
1986-1996 (average annual percentage changes)Value added, 1988 baht 12.79 NA NA NAValue added, current baht 17.02 NA 17.23 NATotal workers, number 7.68 9.14 10.32 NAMonthly compensation per employee, current baht 21.45 9.23 NA NAGDP deflator for all industries, index 5.10 NA NA NAGDP deflator for manufacturing, index 3.75 NA NA NA
a-For labor force data, compensation includes bonuses, overtime, other income, cash benefits, and payments in kind(e.g, food, clothing, housing, transportation); for industrial census data in 1996, compensation includes wages, overtime, bonuses, cash benefits, and paymentsin kind.Sources: National Economic and Social Development Board (1999); National Statistical Office (1999,various years).
28

Table 2: Shares of MNC plants by industryNumber of plants Value Added (million baht) Output (million baht) Total workers
Industry All plants MNC plants All plantsMNC share
(%) All plantsMNC share
(%) All plantsMNC share
(%)
Manufacturing 8,432 1,444 748,255 53.5 2,388,891 58.4 1,444,827 42.9Food 470 82 49,507 24.0 162,480 30.3 144,174 35.4Textiles 548 102 27,415 63.1 111,935 65.8 115,252 43.7Apparel 607 82 17,162 35.6 58,051 38.0 115,360 32.4Leather & footwear 216 30 8,081 20.9 21,669 27.5 41,030 28.7Chemicals & products 402 108 38,244 71.4 115,464 59.0 51,807 33.5Rubber & plastics 690 153 45,965 44.7 165,054 42.8 115,401 39.6Non-metalic mineral products 824 51 27,042 28.6 78,478 40.0 76,280 22.7Metal products 653 94 25,141 61.4 89,456 60.9 72,842 37.6General Machinery 379 87 29,629 75.2 114,978 75.6 81,136 66.1Electric Machinery 421 216 99,065 90.3 336,515 90.3 181,987 83.6Motor Vehicles 375 72 124,991 91.4 402,366 91.5 68,117 64.2Other manufacturing 2,847 367 256,010 25.8 732,444 35.7 381,441 29.3
Source) Compilations from plant-level data underlying National Statistical Office (1999).
Table 3: Shares of MNC plants in manufacturing by plant sizeNumber of plants Value Added (million baht) Output (million baht) Total workers
Size All plants MNC plants All plantsMNC share
(%) All plantsMNC share
(%) All plantsMNC share
(%)
Small plants (30 workers or less) 2,415 92 15,516 4.7 40,227 6.2 56,498 4.0Small-medium plants (31-60 workers) 2,214 210 25,312 14.5 87,119 19.0 95,998 9.7Medium-large plants (61-150 workers) 1,812 386 65,053 41.9 194,856 37.3 174,768 22.3Large plants (151 workers or more) 1,991 756 642,374 57.3 2,066,689 63.1 1,117,563 50.9Source) Compilations from plant-level data underlying National Statistical Office (1999).
29

Table 4: Hourly wages by industry, and owner (Baht)Non-production workers Production workers
Local plants MNC plants Local plants MNC plants Industry Mean S.D. Mean S.D. Mean S.D. Mean S.D.
Manufacturing 8,432 49 69 75 115 24 28 31 37Food 470 42 46 61 76 20 19 19 12Textiles 548 43 54 46 51 19 13 20 16Apparel 607 57 102 75 76 25 26 26 11Leather & footwear 216 78 211 81 77 27 17 27 17Chemicals & products 402 63 80 101 173 32 30 43 37Rubber & plastics 690 40 38 55 88 19 14 19 20Non-metalic mineral products 824 44 61 63 62 22 44 36 34Metal products 653 55 51 64 56 27 19 34 27General Machinery 379 64 110 76 68 31 24 37 27Electric Machinery 421 55 43 74 97 32 26 35 73Motor Vehicles 375 46 45 88 86 29 16 43 32Other manufacturing 2,847 45 46 87 162 24 30 31 24
Source) Compilations from plant-level data underlying National Statistical Office (1999).
Table 5: Hourly wages in manufacturing by owner, and plant size (Baht)Non-production workers Production workers
Local plants MNC plants Local plants MNC plantsSize Mean S.D. Mean S.D. Mean S.D. Mean S.D.
Small plants (30 workers or less) 2,415 42 75 73 74 23 18 33 20Small-medium plants (31-60 workers) 2,214 46 44 74 77 25 22 31 24Medium-large plants (61-150 workers) 1,812 55 85 80 115 25 34 35 58Large plants (151 workers or more) 1,991 56 69 72 127 26 40 28 26Source) Compilations from plant-level data underlying National Statistical Office (1999).
Table 6: Hourly wages in manufacturing by owner and trade propensity (Baht)Non-production workers Production workers
Local plants MNC plants Local plants MNC plantsTrade Propensity Mean S.D. Mean S.D. Mean S.D. Mean S.D.
Export propensity<50% 6,669 47 65 76 118 24 26 36 49Export propensity>=50% 1,763 59 87 74 113 25 36 26 22
Import propensity<50% 6,603 46 65 65 76 24 27 29 25Import propensity>=50% 1,829 60 85 85 146 29 30 32 46
Source) Compilations from plant-level data underlying National Statistical Office (1999).
num-ber ofplants
num-ber ofplants
num-ber ofplants
30

Table 7: Wage differentials for non-production labor between MNC plants and local plants (All plants)Dependent variable(Y) : Log of hourly wage for non-production workers
(1) (2) (3) (4)Coef. T stat. Coef. T stat. Coef. T stat. Coef. T stat.
C 3.45 173.52 *** 3.26 82.07 *** 3.37 161.08 *** 3.28 81.57 ***
Productivity 0.20 25.21 *** 0.21 25.87 *** 0.20 24.93 *** 0.20 24.94 ***
Size 0.05 5.55 *** 0.02 2.67 ***
Export dummy 0.13 6.33 *** 0.11 5.03 ***
Import dummy 0.12 6.51 *** 0.12 6.21 ***
Bangkok vicinity dummy 0.39 21.15 *** 0.39 21.18 *** 0.38 20.37 *** 0.38 20.10 ***
MNC dummy 0.26 10.92 *** 0.21 8.53 *** 0.15 5.99 *** 0.14 5.37 ***
Industry dummies Food 0.01 0.21 -0.01 -0.34 -0.01 -0.14 -0.02 -0.41 Textiles -0.17 -4.90 *** -0.18 -5.11 *** -0.17 -4.81 *** -0.17 -4.88 ***
Apparel 0.07 1.95 * 0.06 1.66 * 0.03 0.95 0.04 1.07 Leather & footwear 0.24 4.58 *** 0.24 4.48 *** 0.20 3.78 *** 0.20 3.85 ***
Chemicals & products 0.11 2.86 *** 0.12 2.90 *** 0.06 1.57 0.07 1.70 *
Rubber & plastics -0.14 -4.50 *** -0.15 -4.82 *** -0.17 -5.29 *** -0.16 -5.24 ***
Non-metallic mineral products 0.02 0.69 0.03 0.93 0.07 1.98 ** 0.06 1.83 *
Metal products 0.12 3.61 *** 0.12 3.85 *** 0.11 3.43 *** 0.12 0.36 General Machinery 0.08 2.01 ** 0.08 2.03 ** 0.07 1.74 * 0.07 1.80 *
Electric Machinery 0.09 2.23 ** 0.07 1.69 * 0.04 1.00 0.03 0.85 Motor Vehicles -0.03 -0.82 -0.03 -0.67 -0.03 -0.72 -0.03 -0.65Adj.R2 / Obs. 0.21 6,924 0.21 6,924 0.22 6,924 0.22 6,924White test 191.66 0.00 232.74 0.00 257.69 0.00 306.17 0.00Mean of Y 3.58 3.58 3.58 3.58Standard deviation of Y 0.77 0.78 0.77 0.77Notes) T-statistics are calculated using White's heteroscedasticity-consistent standard errors. ***=significant at the 1 percent level, ** =significant at the 5 percent level, and *=significant at the 10 percent level.
31

Table 8: Wage differentials for production labor between MNC plants and local plants (All plants)Dependent variable(Y) : Log of hourly wage for production workers
(1) (2) (3) (4)Coef. T stat. Coef. T stat. Coef. T stat. Coef. T stat.
C 2.98 211.16 *** 3.07 115.41 *** 2.96 200.62 *** 3.09 113.44 ***
Productivity 0.26 39.42 *** 0.26 39.50 *** 0.26 39.21 *** 0.25 39.17 ***
Size -0.02 -3.96 *** -0.04 -5.87 ***
Export dummy 0.00 0.28 0.04 2.28 **
Import dummy 0.07 5.24 *** 0.08 6.25 ***
Bangkok vicinity dummy 0.36 28.06 *** 0.36 28.09 *** 0.34 26.65 *** 0.34 26.54 ***
MNC dummy 0.08 5.08 *** 0.11 6.19 *** 0.06 3.10 *** 0.08 4.12 ***
Industry dummies Food -0.09 -3.33 *** -0.08 -2.89 *** -0.09 -3.19 *** -0.07 -2.59 ***
Textiles -0.20 -7.80 *** -0.19 -7.69 *** -0.19 -7.70 *** -0.19 -7.70 ***
Apparel 0.03 1.46 0.04 1.70 * 0.03 1.58 0.04 1.72 *
Leather & footwear 0.09 2.62 *** 0.09 2.54 ** 0.08 2.40 ** 0.07 1.95 *
Chemicals & products 0.12 3.99 *** 0.12 4.03 *** 0.11 3.69 *** 0.11 3.56 ***
Rubber & plastics -0.24 -10.35 *** -0.24 -10.11 *** -0.24 -10.33 *** -0.24 -10.32 ***
Non-metallic mineral products 0.00 0.02 0.00 -0.13 0.01 0.37 0.01 0.40 Metal products 0.12 5.52 *** 0.11 5.29 *** 0.12 5.40 *** 0.11 5.12 ***
General Machinery 0.20 7.71 *** 0.21 7.76 *** 0.20 7.49 *** 0.20 7.35 ***
Electric Machinery 0.05 1.65 * 0.06 2.00 ** 0.03 1.08 0.04 1.39 Motor Vehicles 0.19 7.00 *** 0.19 7.03 *** 0.19 6.96 *** 0.19 6.92 ***
Adj.R2 / Obs. 0.38 8,170 0.37 8,170 0.38 8,170 0.38 8,170White test 689.49 0.00 687.40 0.00 699.95 0.00 708.42Mean of Y 2.98 2.98 2.98 0.30Standard deviation of Y 0.66 0.66 0.66 0.66Notes) T-statistics are calculated using White's heteroscedasticity-consistent standard errors. ***=significant at the 1 percent level, ** =significant at the 5 percent level, and *=significant at the 10 percent level.
32
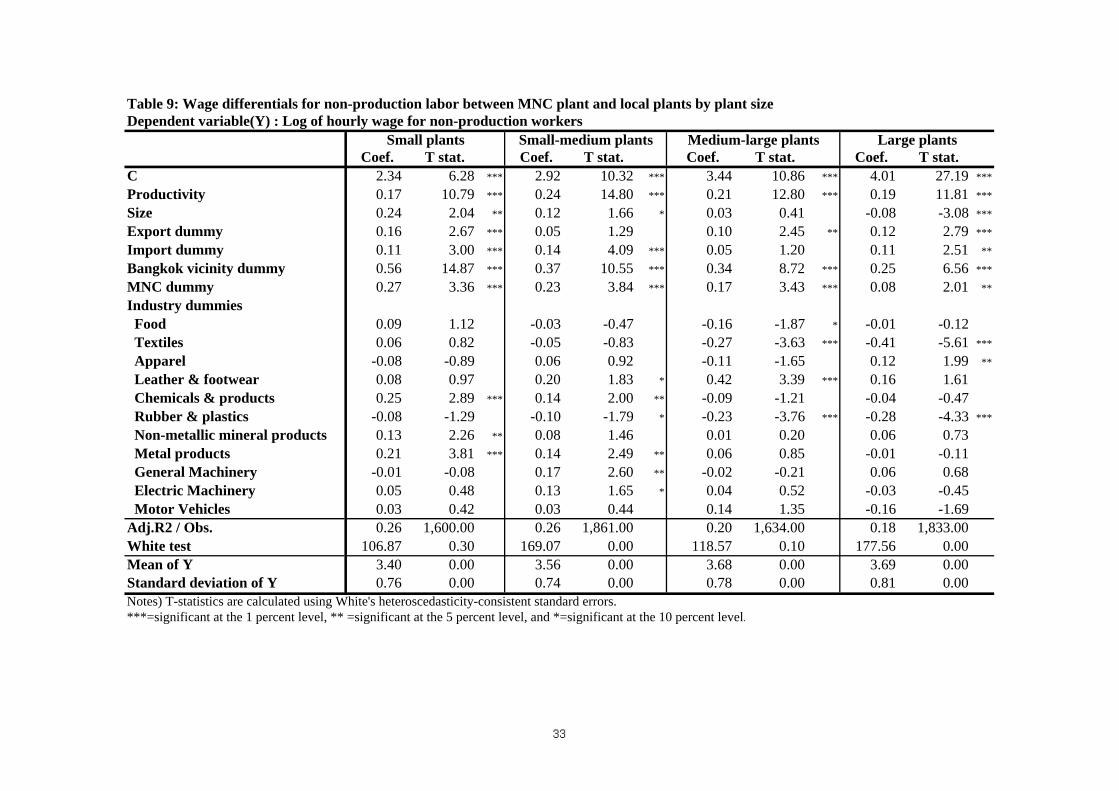
Table 9: Wage differentials for non-production labor between MNC plant and local plants by plant size Dependent variable(Y) : Log of hourly wage for non-production workers
Small plants Small-medium plants Medium-large plants Large plantsCoef. T stat. Coef. T stat. Coef. T stat. Coef. T stat.
C 2.34 6.28 *** 2.92 10.32 *** 3.44 10.86 *** 4.01 27.19 ***
Productivity 0.17 10.79 *** 0.24 14.80 *** 0.21 12.80 *** 0.19 11.81 ***
Size 0.24 2.04 ** 0.12 1.66 * 0.03 0.41 -0.08 -3.08 ***
Export dummy 0.16 2.67 *** 0.05 1.29 0.10 2.45 ** 0.12 2.79 ***
Import dummy 0.11 3.00 *** 0.14 4.09 *** 0.05 1.20 0.11 2.51 **
Bangkok vicinity dummy 0.56 14.87 *** 0.37 10.55 *** 0.34 8.72 *** 0.25 6.56 ***
MNC dummy 0.27 3.36 *** 0.23 3.84 *** 0.17 3.43 *** 0.08 2.01 **
Industry dummies Food 0.09 1.12 -0.03 -0.47 -0.16 -1.87 * -0.01 -0.12 Textiles 0.06 0.82 -0.05 -0.83 -0.27 -3.63 *** -0.41 -5.61 ***
Apparel -0.08 -0.89 0.06 0.92 -0.11 -1.65 0.12 1.99 **
Leather & footwear 0.08 0.97 0.20 1.83 * 0.42 3.39 *** 0.16 1.61 Chemicals & products 0.25 2.89 *** 0.14 2.00 ** -0.09 -1.21 -0.04 -0.47 Rubber & plastics -0.08 -1.29 -0.10 -1.79 * -0.23 -3.76 *** -0.28 -4.33 ***
Non-metallic mineral products 0.13 2.26 ** 0.08 1.46 0.01 0.20 0.06 0.73 Metal products 0.21 3.81 *** 0.14 2.49 ** 0.06 0.85 -0.01 -0.11 General Machinery -0.01 -0.08 0.17 2.60 ** -0.02 -0.21 0.06 0.68 Electric Machinery 0.05 0.48 0.13 1.65 * 0.04 0.52 -0.03 -0.45 Motor Vehicles 0.03 0.42 0.03 0.44 0.14 1.35 -0.16 -1.69Adj.R2 / Obs. 0.26 1,600.00 0.26 1,861.00 0.20 1,634.00 0.18 1,833.00White test 106.87 0.30 169.07 0.00 118.57 0.10 177.56 0.00Mean of Y 3.40 0.00 3.56 0.00 3.68 0.00 3.69 0.00Standard deviation of Y 0.76 0.00 0.74 0.00 0.78 0.00 0.81 0.00Notes) T-statistics are calculated using White's heteroscedasticity-consistent standard errors. ***=significant at the 1 percent level, ** =significant at the 5 percent level, and *=significant at the 10 percent level.
33
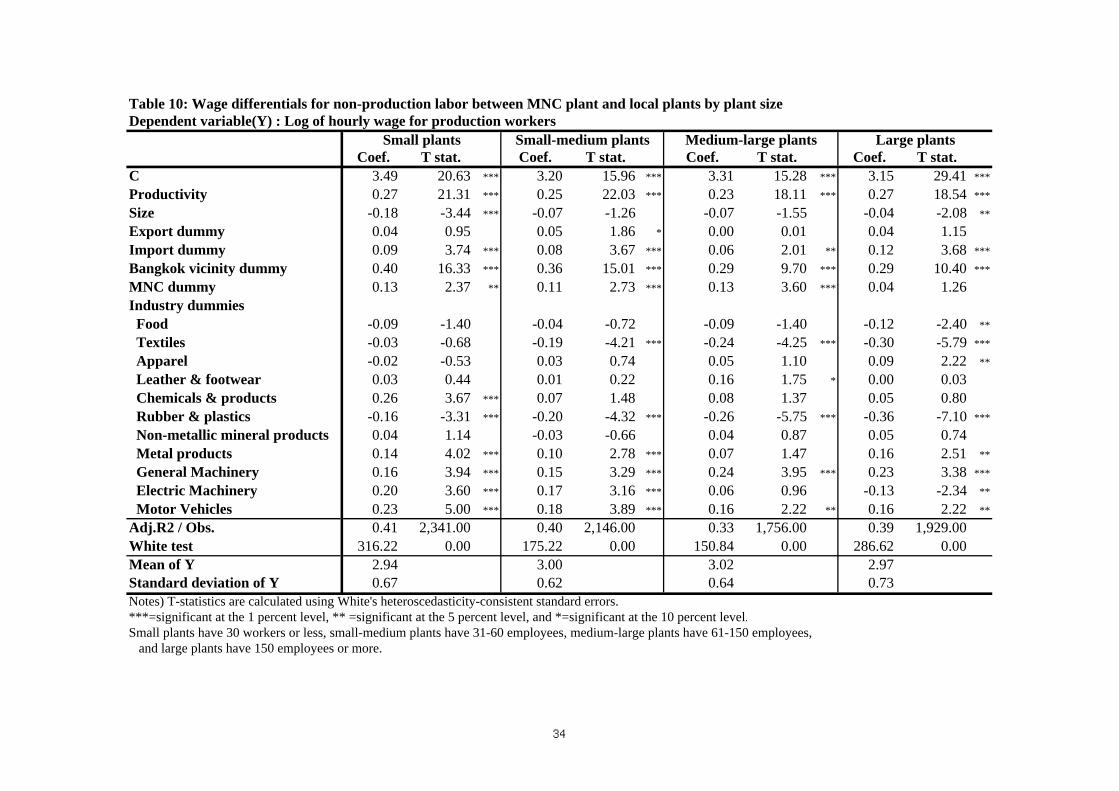
Table 10: Wage differentials for non-production labor between MNC plant and local plants by plant size Dependent variable(Y) : Log of hourly wage for production workers
Small plants Small-medium plants Medium-large plants Large plantsCoef. T stat. Coef. T stat. Coef. T stat. Coef. T stat.
C 3.49 20.63 *** 3.20 15.96 *** 3.31 15.28 *** 3.15 29.41 ***
Productivity 0.27 21.31 *** 0.25 22.03 *** 0.23 18.11 *** 0.27 18.54 ***
Size -0.18 -3.44 *** -0.07 -1.26 -0.07 -1.55 -0.04 -2.08 **
Export dummy 0.04 0.95 0.05 1.86 * 0.00 0.01 0.04 1.15Import dummy 0.09 3.74 *** 0.08 3.67 *** 0.06 2.01 ** 0.12 3.68 ***
Bangkok vicinity dummy 0.40 16.33 *** 0.36 15.01 *** 0.29 9.70 *** 0.29 10.40 ***
MNC dummy 0.13 2.37 ** 0.11 2.73 *** 0.13 3.60 *** 0.04 1.26Industry dummies Food -0.09 -1.40 -0.04 -0.72 -0.09 -1.40 -0.12 -2.40 **
Textiles -0.03 -0.68 -0.19 -4.21 *** -0.24 -4.25 *** -0.30 -5.79 ***
Apparel -0.02 -0.53 0.03 0.74 0.05 1.10 0.09 2.22 **
Leather & footwear 0.03 0.44 0.01 0.22 0.16 1.75 * 0.00 0.03 Chemicals & products 0.26 3.67 *** 0.07 1.48 0.08 1.37 0.05 0.80 Rubber & plastics -0.16 -3.31 *** -0.20 -4.32 *** -0.26 -5.75 *** -0.36 -7.10 ***
Non-metallic mineral products 0.04 1.14 -0.03 -0.66 0.04 0.87 0.05 0.74 Metal products 0.14 4.02 *** 0.10 2.78 *** 0.07 1.47 0.16 2.51 **
General Machinery 0.16 3.94 *** 0.15 3.29 *** 0.24 3.95 *** 0.23 3.38 ***
Electric Machinery 0.20 3.60 *** 0.17 3.16 *** 0.06 0.96 -0.13 -2.34 **
Motor Vehicles 0.23 5.00 *** 0.18 3.89 *** 0.16 2.22 ** 0.16 2.22 **
Adj.R2 / Obs. 0.41 2,341.00 0.40 2,146.00 0.33 1,756.00 0.39 1,929.00White test 316.22 0.00 175.22 0.00 150.84 0.00 286.62 0.00Mean of Y 2.94 3.00 3.02 2.97Standard deviation of Y 0.67 0.62 0.64 0.73Notes) T-statistics are calculated using White's heteroscedasticity-consistent standard errors. ***=significant at the 1 percent level, ** =significant at the 5 percent level, and *=significant at the 10 percent level.Small plants have 30 workers or less, small-medium plants have 31-60 employees, medium-large plants have 61-150 employees, and large plants have 150 employees or more.
34
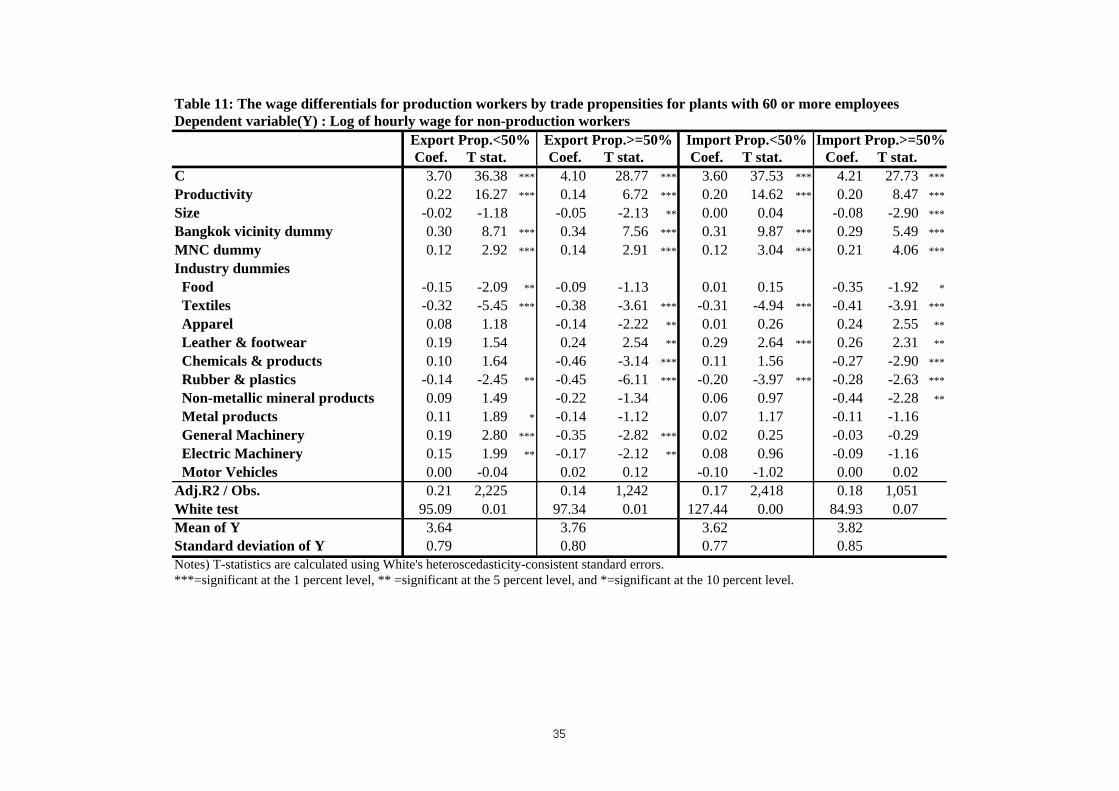
Table 11: The wage differentials for production workers by trade propensities for plants with 60 or more employeesDependent variable(Y) : Log of hourly wage for non-production workers
Export Prop.<50% Export Prop.>=50% Import Prop.<50% Import Prop.>=50%Coef. T stat. Coef. T stat. Coef. T stat. Coef. T stat.
C 3.70 36.38 *** 4.10 28.77 *** 3.60 37.53 *** 4.21 27.73 ***
Productivity 0.22 16.27 *** 0.14 6.72 *** 0.20 14.62 *** 0.20 8.47 ***
Size -0.02 -1.18 -0.05 -2.13 ** 0.00 0.04 -0.08 -2.90 ***
Bangkok vicinity dummy 0.30 8.71 *** 0.34 7.56 *** 0.31 9.87 *** 0.29 5.49 ***
MNC dummy 0.12 2.92 *** 0.14 2.91 *** 0.12 3.04 *** 0.21 4.06 ***
Industry dummies Food -0.15 -2.09 ** -0.09 -1.13 0.01 0.15 -0.35 -1.92 *
Textiles -0.32 -5.45 *** -0.38 -3.61 *** -0.31 -4.94 *** -0.41 -3.91 ***
Apparel 0.08 1.18 -0.14 -2.22 ** 0.01 0.26 0.24 2.55 **
Leather & footwear 0.19 1.54 0.24 2.54 ** 0.29 2.64 *** 0.26 2.31 **
Chemicals & products 0.10 1.64 -0.46 -3.14 *** 0.11 1.56 -0.27 -2.90 ***
Rubber & plastics -0.14 -2.45 ** -0.45 -6.11 *** -0.20 -3.97 *** -0.28 -2.63 ***
Non-metallic mineral products 0.09 1.49 -0.22 -1.34 0.06 0.97 -0.44 -2.28 **
Metal products 0.11 1.89 * -0.14 -1.12 0.07 1.17 -0.11 -1.16 General Machinery 0.19 2.80 *** -0.35 -2.82 *** 0.02 0.25 -0.03 -0.29 Electric Machinery 0.15 1.99 ** -0.17 -2.12 ** 0.08 0.96 -0.09 -1.16 Motor Vehicles 0.00 -0.04 0.02 0.12 -0.10 -1.02 0.00 0.02Adj.R2 / Obs. 0.21 2,225 0.14 1,242 0.17 2,418 0.18 1,051White test 95.09 0.01 97.34 0.01 127.44 0.00 84.93 0.07Mean of Y 3.64 3.76 3.62 3.82Standard deviation of Y 0.79 0.80 0.77 0.85Notes) T-statistics are calculated using White's heteroscedasticity-consistent standard errors. ***=significant at the 1 percent level, ** =significant at the 5 percent level, and *=significant at the 10 percent level.
35
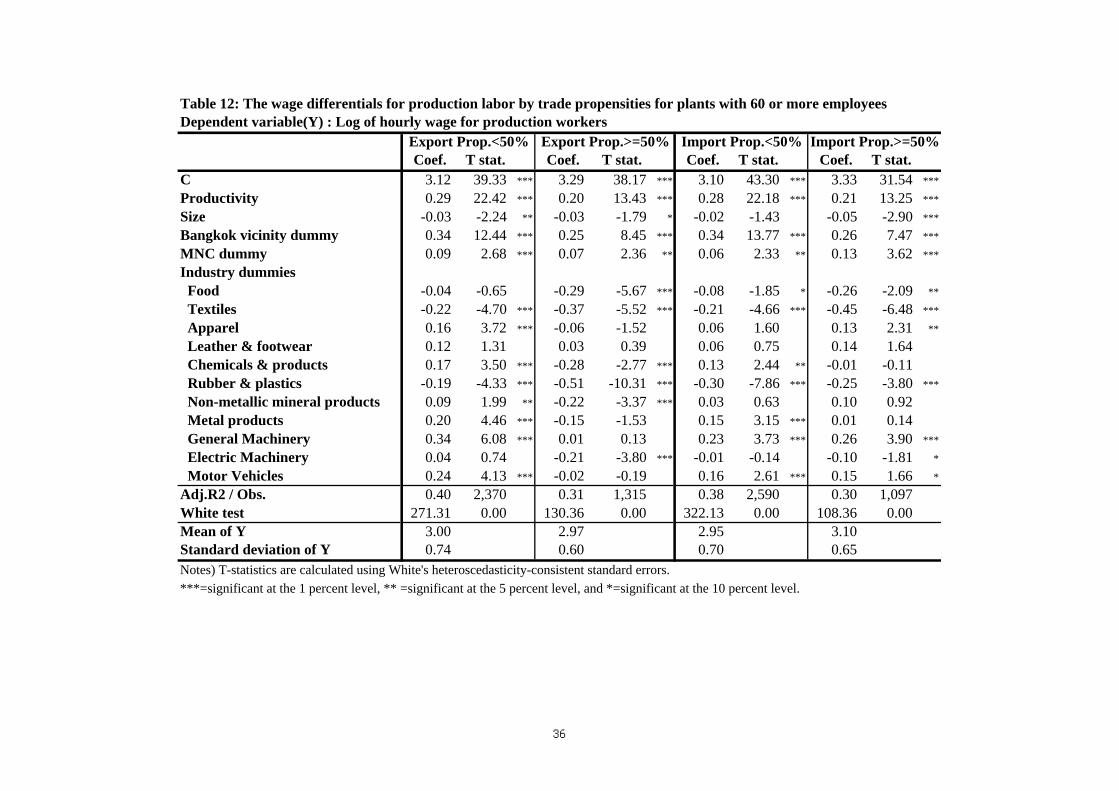
Table 12: The wage differentials for production labor by trade propensities for plants with 60 or more employeesDependent variable(Y) : Log of hourly wage for production workers
Export Prop.<50% Export Prop.>=50% Import Prop.<50% Import Prop.>=50%Coef. T stat. Coef. T stat. Coef. T stat. Coef. T stat.
C 3.12 39.33 *** 3.29 38.17 *** 3.10 43.30 *** 3.33 31.54 ***
Productivity 0.29 22.42 *** 0.20 13.43 *** 0.28 22.18 *** 0.21 13.25 ***
Size -0.03 -2.24 ** -0.03 -1.79 * -0.02 -1.43 -0.05 -2.90 ***
Bangkok vicinity dummy 0.34 12.44 *** 0.25 8.45 *** 0.34 13.77 *** 0.26 7.47 ***
MNC dummy 0.09 2.68 *** 0.07 2.36 ** 0.06 2.33 ** 0.13 3.62 ***
Industry dummies Food -0.04 -0.65 -0.29 -5.67 *** -0.08 -1.85 * -0.26 -2.09 **
Textiles -0.22 -4.70 *** -0.37 -5.52 *** -0.21 -4.66 *** -0.45 -6.48 ***
Apparel 0.16 3.72 *** -0.06 -1.52 0.06 1.60 0.13 2.31 **
Leather & footwear 0.12 1.31 0.03 0.39 0.06 0.75 0.14 1.64 Chemicals & products 0.17 3.50 *** -0.28 -2.77 *** 0.13 2.44 ** -0.01 -0.11 Rubber & plastics -0.19 -4.33 *** -0.51 -10.31 *** -0.30 -7.86 *** -0.25 -3.80 ***
Non-metallic mineral products 0.09 1.99 ** -0.22 -3.37 *** 0.03 0.63 0.10 0.92 Metal products 0.20 4.46 *** -0.15 -1.53 0.15 3.15 *** 0.01 0.14 General Machinery 0.34 6.08 *** 0.01 0.13 0.23 3.73 *** 0.26 3.90 ***
Electric Machinery 0.04 0.74 -0.21 -3.80 *** -0.01 -0.14 -0.10 -1.81 *
Motor Vehicles 0.24 4.13 *** -0.02 -0.19 0.16 2.61 *** 0.15 1.66 *
Adj.R2 / Obs. 0.40 2,370 0.31 1,315 0.38 2,590 0.30 1,097White test 271.31 0.00 130.36 0.00 322.13 0.00 108.36 0.00Mean of Y 3.00 2.97 2.95 3.10Standard deviation of Y 0.74 0.60 0.70 0.65Notes) T-statistics are calculated using White's heteroscedasticity-consistent standard errors. ***=significant at the 1 percent level, ** =significant at the 5 percent level, and *=significant at the 10 percent level.
36

Table 13: The effect of MNC plants on wage for non-production labor of local plants Dependent variable(Y) : Log of hourly wage for non-production labor (Local Plants)
(1) (2) (3) (4)Coef. T stat. Coef. T stat. Coef. T stat. Coef. T stat.
C 3.40 134.69 *** 3.05 67.34 *** 3.34 127.54 *** 3.11 67.44 ***
Productivity 0.21 23.38 *** 0.21 23.78 *** 0.21 23.07 *** 0.21 23.74 ***
Size 0.08 9.14 *** 0.06 5.72 ***
Export dummy 0.12 5.56 *** 0.07 2.93 ***
Import dummy 0.13 6.64 *** 0.11 5.81 ***
Bangkok vicinity dummy 0.42 21.69 *** 0.41 21.20 *** 0.39 19.68 *** 0.38 19.66 ***
MNC Share (Output) 0.11 2.23 ** 0.13 2.54 ** 0.09 1.79 * 0.10 2.00 **
Adj.R2 / Obs. 0.19 5,590 0.20 5,590 0.20 5,590 0.21 5,590White test 97.57 0.00 109.51 0.00 127.28 0.00 136.66Mean of Y 3.53 3.53 3.53 3.53Standard deviation of Y 0.74 0.74 0.74 0.75Notes) T-statistics are calculated using White's heteroscedasticity-consistent standard errors. ***=significant at the 1 percent level, ** =significant at the 5 percent level, and *=significant at the 10 percent level.
Table 14 : The effect of MNC plants on wage for production labor of local plants Dependent variable(Y) : Log of hourly wage for production labor (Local Plants)
(1) (2) (3) (4)Coef. T stat. Coef. T stat. Coef. T stat. Coef. T stat.
C 2.87 153.55 *** 2.94 90.90 *** 2.86 149.93 *** 2.98 88.65 ***
Productivity 0.28 37.10 *** 0.28 37.01 *** 0.28 36.96 *** 0.27 36.75 ***
Size -0.02 -2.73 *** -0.03 -4.20 ***
Export dummy -0.02 -1.51 0.00 0.21Import dummy 0.08 6.09 *** 0.09 6.67 ***
Bangkok vicinity dummy 0.36 26.42 *** 0.36 26.57 *** 0.34 24.59 *** 0.34 24.57 ***
MNC Share (Output) 0.30 8.11 *** 0.30 8.20 *** 0.28 7.57 *** 0.27 7.48 ***
Adj.R2 / Obs. 0.36 6,770 0.36 6,770 0.36 6,770 0.36 6,770White test 595.28 0.00 615.69 0.00 590.02 0.00 573.82 0.00Mean of Y 2.95 2.95 2.95 2.95Standard deviation of Y 0.65 0.65 0.65 0.65Notes) T-statistics are calculated using White's heteroscedasticity-consistent standard errors. ***=significant at the 1 percent level, ** =significant at the 5 percent level, and *=significant at the 10 percent level.
37