Embed Size (px)
Citation preview


DO MULTINATIONALS FEED LOCALDEVELOPMENT AND GROWTH?
Prelims.qxd 6/29/2007 10:15 AM Page i

Corporate Crisis and Risk ManagementAba-Bulgu and Islam
Developments in Work and OrganizationalPsychologyJackson & Shams
Corporate and Institutional Transparency forEconomic Growth in EuropeOxelheim
Managing Customer Relationships on theInternetLindstrand, Johanson & Sharma
The Common GlueMorosini
Non-Business Actors in a Business NetworkHadjikhani & Thilenius
European Union and the Race for ForeignDirect Investment in EuropeOxelheim & Ghauri
Strategic Alliances in Eastern and Central EuropeHyder & Abraha
Intellectual Property and Doing Business inChinaYang
Co-operative Strategies and AlliancesContractor & Lorange
Relationships and Networks in InternationalMarketsGemünden, Ritter & Walter
International Business NegotiationsGhauri & Usunier
Critical Perspectives on InternationalisationHavila, Forsgren & Håkansson
Managing Cultural DifferencesMorosini
Managing Networks in Transition EconomicsJohanson
Network Dynamics in InternationalMarketingNaude & Turnbull
The Global Challenge for MultinationalEnterprisesBuckley & Ghauri
Business Network LearningHakansson & Johanson
Managing International Business Ventures inChinaLi
Other titles of interest:
International Trade in the 21st CenturyFatemi
Globalization, Trade and Foreign DirectInvestmentDunning
International Trade and the New Economic OrderMoncarz
Contemporary Issues in Commercial PolicyKreinin
Related journals — sample copiesavailable on request:
European Management JournalInternational Business ReviewInternational Journal of Research in MarketingLong Range PlanningScandinavian Journal of Management
For full details of all IBM titles publishedunder the Elsevier imprint please go to:http://www.elsevier.com/locate/series/ibm
INTERNATIONAL BUSINESS AND MANAGEMENT SERIESSeries Editor: Pervez N. Ghauri
Published:
Prelims.qxd 6/29/2007 10:15 AM Page ii

INTERNATIONAL BUSINESS AND MANAGEMENT VOLUME 22
DO MULTINATIONALS FEEDLOCAL DEVELOPMENT ANDGROWTH?
EDITED BY
LUCIA PISCITELLOPolitecnico di Milano, Italy
and
GRAZIA D. SANTANGELOUniversità degli Studi di Catania, Italy
Series Editor: Pervez N. Ghauri
Amsterdam ● Boston ● Heidelberg ● London ● New York ● OxfordParis ● San Diego ● San Francisco ● Singapore ● Sydney ● Tokyo
Prelims.qxd 6/29/2007 10:15 AM Page iii

ElsevierLinacre House, Jordan Hill, Oxford OX2 8DP, UKRadarweg 29, PO Box 211, 1000 AE Amsterdam, The Netherlands
First edition 2007
Copyright © 2007 Elsevier Ltd. All rights reserved
No part of this publication may be reproduced, stored in a retrieval systemor transmitted in any form or by any means electronic, mechanical, photocopying,recording or otherwise without the prior written permission of the publisher
Permissions may be sought directly from Elsevier’s Science & Technology RightsDepartment in Oxford, UK: phone (+44) (0) 1865 843830; fax (+44) (0) 1865 853333;email: [email protected]. Alternatively you can submit your request online byvisiting the Elsevier web site at http://www.elsevier.com/locate/permissions, and selectingObtaining permission to use Elsevier material
NoticeNo responsibility is assumed by the publisher for any injury and/or damage to personsor property as a matter of products liability, negligence or otherwise, or from any useor operation of any methods, products, instructions or ideas contained in the materialherein. Because of rapid advances in the medical sciences, in particular, independentverification of diagnoses and drug dosages should be made
British Library Cataloguing in Publication DataA catalogue record for this book is available from the British Library
Library of Congress Cataloging-in-Publication DataA catalog record for this book is available from the Library of Congress
ISBN: 978-0-08-045360-6
Printed and bound in The Netherlands
07 08 09 10 11 10 9 8 7 6 5 4 3 2 1
For information on all Elsevier publicationsvisit our website at books.elsevier.com
Prelims.qxd 6/29/2007 10:15 AM Page iv

Contents
List of Figures vii
List of Tables ix
Contributors xi
1. Introduction 1Lucia Piscitello and Grazia D. Santangelo
Impact on Host Development and Growth
2. Foreign Direct Investment and Economic Development:Opportunities and Limitations from a DevelopingCountry Perspective 13Rajneesh Narula and Brian Portelli
3. The Role of the Sectoral Composition of Foreign Direct Investment on Growth 35Dilek Aykut and Selin Sayek
Knowledge Flows in Local Context
4. MNEs’ Location Behaviour and Industrial Clustering 63Philip McCann and Ram Mudambi
5. Exploring the Characteristics of Technology Spillovers UsingPatent Citation Data 95John Cantwell and Camilla Noonan
6. Global and Local Knowledge Linkages: The Case ofMNE Subsidiaries in Argentina 129Elisa Giuliani and Anabel Marin
Contents.qxd 6/29/2007 10:14 AM Page v

vi Contents
Impact on Home Competitiveness
7. The Impact of Knowledge Transfer on MNEs’ Parent Companies.Evidence from the Italian Case 169Lucia Piscitello and Larissa Rabbiosi
8. Home Country Effects of Investing Abroad:Evidence from Italy 195Anna Maria Falzoni and Mara Grasseni
9. Globalization and Its Impact on Development: Policy Issues 223Pervez N. Ghauri
Author Index 233
Subject Index 239
Contents.qxd 6/29/2007 10:14 AM Page vi
List of Figures
Figure 3.1: FDI inflow stock by sector, 2004. 36Figure 3.2: (a) Economic Growth and Primary FDI. (b) Economic
Growth and Manufacturing FDI. (c) Economic Growth and Services FDI. 43
Figure 4.1: MNEs, knowledge and location. 64Figure 4.2: MNE competence-creating knowledge flows. 75Figure 4.3: The cluster system of innovation. 76Figure 4.4: The MNE knowledge network. 77
Figure 5.1: Distribution of patent citations. 100Figure 5.2: Age distribution of technology sourcing. Citations to
(i) home country; (ii) other foreign countries; (iii) local knowledge sources. 107
Figure 5.3: Patterns of intra-regional of technology sourcing. 112Figure 5.4: Patterns of inter-/intra-regional technology sourcing. 121
Figure 6.1: The case of a globally diversified subsidiary. 154Figure 6.2: The case of a globally dependent subsidiary. 156Figure 6.3: The case of a globally independent subsidiary. 158Figure 6.4: The case of a globally isolated subsidiary. 158
Figure 8.1: Average share of employees in foreign affiliates by parent size and destination. 203
Figure 8.2: Average share of employees in foreign affiliates by labour productivity of parent firms and destination. 204
Figure 8.3: (a) Average share of employees in foreign affiliates by parent sector and destination — year 1995. (b) Average share of employees in foreign affiliates by parent sector and destination — year 1997. 205
Figure 9.1: Globalization as a sequential process. 230
LOF.qxd 6/29/2007 10:14 AM Page vii

This page intentionally left blank

List of Tables
Table 2.1: Basic world FDI indicators. 16Table 2.2: Basic FDI indicators for developing regional groups. 18Table 2.3: FDI to developing regions in relation to total inward FDI stock. 19Table 2.4: Share of inward FDI stock by sector in developing countries. 20
Table 3.1: Simple correlations between the sectoral FDI inflows and economic growth. 44
Table 3.2: Simple correlations between measures of the composition of FDI and economic growth. 45
Table 3.3: Simple correlations between alternative measures of the composition of FDI and economic growth. 46
Table 3.4: List of variables. 48Table 3.5a: Growth effects of the sectoral composition of FDI inflows
Dependent variable: Growth of Real GDP per capita (1990–2002). 50
Table 3.5b: Growth effects of the sectoral composition of FDI inflowsDependent variable: Growth of Reel GDP per capita (1990–2002). 53
Table 4.1: Entry objectives and entry modes. 79Table 4.2. Industrial clusters: A transactions cost perspective. 81
Table 5.1: The regional origin of foreign firm patent citing patents 1975–1995. 101
Table 5.2: Knowledge sources for foreign firms located in Germany,1975–1995. 102
Table 5.3: Knowledge sources for foreign firms (by patent assignee). 104Table 5.4: Ratio of citations to patents, by region. 109Table 5.5: Percentage of citations to regional versus outside knowledge. 111Table 5.6: Percentage of citations to regional versus outside knowledge
(no self cites). 113
LOT.qxd 6/29/2007 10:15 AM Page ix

x List of Tables
Table 5.7: Citations revealed technological advantage. 116Table 5.8: Results from regression analysis (citations RTA with
self cites). 119Table 5.9: Results from regression analysis (citations RTA omitting
self cites). 120
Table 6.1: Indicators of technological activity: Basic statistics. 143Table 6.2: Product and process innovation. 144Table 6.3: General features of each type of subsidiary. 145Table 6.4: Distribution of types of subsidiaries across industry OECD. 146Table 6.5: Types of subsidiary and innovative activity: Inputs. 147Table 6.6: Types of subsidiary and innovative activity: Outputs. 149Table 6.7: Global and local linkages. 150
Table 7.1: Descriptive statistics. 180Table 7.2: Subsidiary effect on parent company’s innovativeness:
The role of RKT. 181Table 7.3: KT mechanisms and parent company’s innovativeness. 182Table 7.A.1: Sample’s representativeness. 186Table 7.A.2: Marginal effects from Table 3, models 2 and 3. 187Table 7.A.3: Correlations matrix. 187Table 7.A.4: Correlations matrix, subset of parent company–foreign
subsidiary pairs, where KT occurred. 188
Table 8.1: Descriptive Statistics — Years: 1996–1998. 201Table 8.2: Descriptive Statistics. 202Table 8.3: Effect of investing abroad on parents’ labour productivity. 208Table 8.4: Effect of investing abroad on parents’ labour productivity. 211Table 8.5: Effect of investing abroad on parents’ employment. 213Table 8.6: Effect of investing abroad on parents’ employment. 216Table 8.A.1: Tests of equality between coefficients at different
quantiles of Table 8.3 and Table 8.4. 218Table 8.A.2: Tests of equality between coefficients at different
quantiles of Table 8.5 and Table 8.6. 219
Table 9.1: MNE/government interaction. 226Table 9.2: Reinvigorating functions of state. 227
LOT.qxd 6/29/2007 10:15 AM Page x

Contributors
Dilek Aykut World Bank, Washington DC, USA
John Cantwell Rutgers Business School, Rutgers University – USA
Anna Maria Falzoni Department of Economic Studies, University ofBergamo, Bergamo and CESPRI, Bocconi University – Italy
Pervez N. Ghauri Manchester Business School, The University ofManchester – UK
Elisa Giuliani SPRU, Sussex University – UK
Mara Grasseni Department of Economic Studies, University ofBergamo – Italy
Anabel Marin Universidad Nacional de General Sarmiento (UNGS) – Argentina and SPRU, University of Sussex – UK
Philip McCann University of Reading – UK and University of Waikato – New Zealand
Ram Mudambi Fox School of Business, Temple University – USA
Rajneesh Narula Business School, University of Reading – UK
Camilla Noonan UCD Business School, University College Dublin – Ireland
Lucia Piscitello Politecnico di Milano – Italy
LOC.qxd 6/29/2007 10:14 AM Page xi

xii Contributors
Brian Portelli PricewaterhouseCoopers – Malta
Larissa Rabbiosi Politecnico di Milano – Italy
Selin Sayek Department of Economics, Bilkent University – Turkey
Grazia D. Santangelo Università degli Studi di Catania – Italy
LOC.qxd 6/29/2007 10:14 AM Page xii

Chapter 1
Introduction
Lucia Piscitello and Grazia D. Santangelo
1. The Topic and the Aim of the Volume
Scholars debating on the effects of multinational enterprises (MNEs) haverecently reached consensus on the latter’s beneficial role, although with the duequalifications in terms of sectors involved, corporate competencies and absorp-tive capacity of the local economy. Conversely, the debate among policy-makersis still open. This further volume on the topic intends to make the point about thecurrent academic position, providing fresh empirical evidence and conceptualschemes in order to offer additional insights to policy makers.
Traditionally, the impact of MNEs’ activity was theorised to depend on theextent of the technological gap between foreign investors and local economies(Findlay, 1978). More specifically, it was suggested that the larger the technologi-cal gap between host country firms and foreign-owned firms, the larger the poten-tial for technology transfer and for productivity spillovers to the former. Such aposition was challenged by the “technological accumulation hypothesis” (Cantwell,1989), which was consistent with several pieces of evidences (Kokko, 1994).According to this hypothesis, lower technological gap between domestic and for-eign firms implies higher absorptive capacity (Cohen & Levinthal, 1990) of theformer, and thus higher expected benefits in terms of technology transfer to domes-tic firms. Moving from this, a large stream of studies has taken off, focusing on thelinkages that MNEs develop with local actors (Rodriguez-Claire, 1996; UNCTAD,2001; Alfaro & Rodriguez-Claire, 2004; Smarzynska, 2004). Spillovers to the localfirms may assume several forms and occur through different (both direct and indi-rect) channels (see the recent surveys by Lipsey, 2002; Barba Navaretti & Venables,
Do Multinationals Feed Local Development and Growth?© 2007 by Elsevier Ltd.All rights of reproduction in any form reservedISBN: 978-0-08-045360-6
Ch001.qxd 6/29/2007 10:08 AM Page 1

2004; Castellani & Zanfei, 2006). MNEs may indeed improve innovative capabili-ties and competitiveness of local firms by: (1) fostering spin-off process and pro-viding local firms with opportunities to access highly qualified workforce (Fosfuri,Motta, & Ronde, 2001); (2) stimulating imitation, reverse engineering and involun-tary diffusion of information on advanced technologies and managerial techniques(Mansfield & Romeo, 1980; Dunning, 1993); (3) causing competitive pressures thatstimulate local productivity (Caves, 1974, 1996; Cantwell, 1989); (4) creating back-ward and forward linkages that increase the demand for local input, make advancedintermediate goods available to users, favour specialisation economies and fosterinteraction processes with local institutions and universities (Hirschman, 1958;Rodriguez-Clare, 1996; Markusen & Venables, 1999; Santangelo, 2002; Alfaro &Rodriguez-Clare, 2004). Negative effects are instead related to the fact that MNEsmight monopolise local markets, thus leading local companies to reduce their pro-duction levels and their technical efficiency (Aitken & Harrison, 1999). MNEsmight also displace domestic production of input, as they facilitate the entry of for-eign suppliers thus destroying pre-existing linkages (Lall, 1978). The net impact oninnovation and efficiency of the local host economy does actually depend on whichforce will prevail (Blomström, 1989, 1991; Haddad & Harrison, 1993; Rodriguez-Clare, 1996). Additionally, potential benefits from Foreign Direct Investment (FDI)might not take place, as a crucial condition to benefit from spillovers is related tothe local firms’ technological capabilities and absorptive capacity (Cantwell, 1989;Blomström & Kokko, 1998; Aghion, Blundell, Griffith, Howitt, & Prantl, 2006).
Although acknowledged that MNEs’ activities have also an impact on their homecountries, this side of the story has received less attention so far (Brainard & Riker,1997; Blomström & Kokko, 1998; Lipsey, 2002; Hansson, 2005). However, due tothe emergence of new economic actors in the global scene and to the related chal-lenges for the developed countries from which FDI traditionally departs, this aspecthas gained more and more relevance. Within this context, the main concerns refer tothe relocation of labour-intensive and innovation-intensive activities in particular tolow wage and fast-growing countries, respectively (UNCTAD, 2005). Researchersare increasingly investigating the soundness of this fear. Nonetheless, it should bealso recognised that FDI may be a source of opportunities for enhancing competi-tiveness by allowing multinationals to overcome the weaknesses of their home inno-vation system as well as to search and pick up unexpected chances for newknowledge exploration. The literature has in fact documented that MNEs go abroadnot just for mere market and efficiency factors, but increasingly for accessingsources of knowledge that are localised in several countries in order to strengthenthe whole company’s technological base (Cantwell, 1995; Dunning & Narula, 1995;Almeida, 1996; Cantwell & Piscitello, 1999; Zanfei, 2000; Frost, 2001). The dif-ferent motivations for FDI are mirrored in foreign subsidiaries’ heterogeneity. Inparticular, MNEs may undertake competence-creating and/or competence-exploiting
2 Lucia Piscitello and Grazia D. Santangelo
Ch001.qxd 6/29/2007 10:08 AM Page 2

activities (Pearce, 1999; Cantwell & Mudambi, 2005), also named in Kuemmerle’s(1997, 1999) words Home Based Augmenting and Home Based Exploiting, respec-tively. Both activities concern technological competencies and tacit know-how (seeKogut & Zander, 1992; Iwasa & Odagiri, 2004), as well as managerial competenciesand skills in marketing, production and organisation (Goshal, Korine, & Szulanski,1994; Björkman, Barner-Rasmussen, & Li, 2004). Nonetheless, the former aims tothe development of new knowledge, while the latter to the adaptation of the existingone to the local environment. Parent company’s absorptive capacity as well as thetechnological gap between MNEs and the host economy play a major role (Gupta &Govindarajan, 2000; Ambos, Ambos, & Schlegelmilch, 2006).
In this context, the present volume has the following aims:
1. Contributing to the analysis of the impact of MNEs’ activities on host coun-tries development and growth (Chapters 2 and 3).
2. Analysing and testing the creation of linkages and knowledge flows in localcontexts (Chapters 4–6).
3. Investigating the relationships between foreign activities and home countriescompetitiveness (Chapters 7 and 8).
4. Shedding light on the role of industrial and economic policy (Chapter 9).
More specifically, the impact on host country development is tackled inChapter 2, which provides a review of the empirical studies on FDI-led growth.Rajneesh Narula and Brian Portelli argue that this is not a process that occursautomatically in the host country, thus reflecting the complex nature of the inter-relationships between MNEs and host country economic agents. Host countriescannot capture the full benefits associated with FDI until a threshold level ofcapabilities is reached. The importance of this threshold absorptive-capacity levelhighlights the non-automatic interactions between FDI and development in thehost country. Not Surprisingly, countries at early stages of economic developmentdo not have fully developed assets and hence their location advantages are pre-sumed to be insufficient to attract inward direct investment, with the exception ofFDI arising from the possession of natural resources. Chapter 3 contributes to theliterature on the impact of the FDI on growth by focusing on the role of their sec-toral composition. The evidence currently available is mixed. With reference to33 OECD countries, Aykut Dilek and Selin Sayek investigate whether the sectoralcomposition of FDI matters while contributing to the economic growth of therecipient country by drawing on a data set from various international institutionsand country sources. The analysis is based on the premise that the growth effectsof FDI may be elusive not only due to the characteristics of the recipient econ-omy but also due to the sectoral characteristics of the flows themselves.
The volume, then, turns to the issue of knowledge flows and linkages creationstemming from MNEs’ activities. In Chapter 4, Philip McCann and Ram Mudambi
Introduction 3
Ch001.qxd 6/29/2007 10:08 AM Page 3

emphasise the significance of the spatial aspect of MNEs’ behaviour, which isinfluenced by the nature of the MNE’s inter-firm relations and by the trade-offconcerning information spillovers to and from other local firms. Depending on theresult of such a cost-benefit analysis, MNEs make location decisions affectingregional clustering processes and, therefore, local development. Knowledge flowsare also the focus of the next chapter where John Cantwell and Camilla Noonan,carry out a patent citation analysis in the German context. Specifically, Chapter 5examines knowledge localisation by presenting a descriptive analysis of the tech-nology sourcing activities of foreign firms located in Germany between 1975 and1995. In Chapter 6, Elisa Giluliani and Anabel Marin focus on linkages creationby foreign subsidiaries in a developing economy, such as Argentina by drawing onsecondary data from the Argentinean National Innovation Survey (1998–2001),and primary data from an original survey administred to MNEs’ subsidiaries. Thechapter classifies different types of foreign subsidiaries in terms of global linkagesand investigates the local linkages they are able to establish.
The last section of the volume is dedicated to the relationships between foreignactivities and home competitiveness. Relying on an original database on Italianmultinationals, in Chapter 7 Lucia Piscitello and Larissa Rabbiosi assess whetherMNEs succeed in transferring back knowledge and competencies from foreignsubsidiaries and whether these are successfully incorporated in the parent’s knowl-edge base. Complementary evidence on the positive impact of foreign investmenton the parent’s performance in terms of labour productivity and employment isprovided by Mara Grasseni and Anna Falzoni in Chapter 8. Their analysis aims to test whether the extent of foreign activities helps to explain parents’ perform-ance at home and whether the different characteristics of the parents, in terms ofnumber of employees and labour productivity, matter. Using a panel of Italianfirms investing abroad, the authors allow for different effects of outward FDI onfirms located at different quantiles of the performance distribution as well as forthe geographical area where affiliates are located.
Policy implications are then drawn by Pervez Ghauri in Chapter 9.
2. Empirical Evidence from the Chapters
The empirical evidence and the conceptual discussion carried out in the volumeallow shedding light on specific questions that raise within each of the aims putforward above. In particular, as far as the host country perspective is concerned:
(i) To what extent foreign MNEs represent a crucial source of spillovers fordomestic companies? And which are the “working mechanisms” of these knowledgetransfers? The conceptual discussion developed in Chapter 4 points out that the role
4 Lucia Piscitello and Grazia D. Santangelo
Ch001.qxd 6/29/2007 10:08 AM Page 4
played by MNEs greatly depends on the trade-off between knowledge inflows andknowledge outflows in the local context. Specifically, the opportunities for MNEs tobenefit from inter-firm local information spillovers are rather more limited thanmany other authors (e.g. Saxenian, 1994) assume. The reason is that the ability tobenefit from such spillovers crucially depends on organisational issues. UnlessMNEs are willing and able to decentralise their organisational structures almostto the point of complete hierarchy fragmentation, they will neither benefit from,nor contribute to such local externalities. Focusing on the role of foreign sub-sidiaries in Argentina, Chapter 6 highlights that “globally diversified” and “glob-ally independent” subsidiaries are likelier to diffuse technological knowledgelocally. Conversely, subsidiaries more dependent on the MNE group are lesslikely to develop dense networks at the local level. Likewise, “globally isolated”subsidiaries tend to behave in isolation also at the local level, not representing avaluable source of knowledge for other firms in the host country.
(ii) How can development and growth processes take off? And are there priv-ileged locations and sectors? Chapter 2 argues that the developmental impact ofFDI rests on the dynamics of the transfer of technology, but more importantly onthe extent of integration of MNE affiliates in the host country systems and ofupgrading of local capabilities over time. Indeed it is vital that foreign agents ofdynamic comparative advantage complement rather than substitute local agents.That developing countries can benefit from spillovers accruing from MNE activ-ity is a not disputed fact. However, it remains an assumption that MNE activityis a sine qua non for economic development, and that greater FDI flows will auto-matically result in the dissemination of these technologies and organisationalpractices from developed to developing countries. The sub-national regionalaspects is tackled in Chapter 5, where a descriptive evidence on the German casesuggests that technological activities undertaken in Germany may be categorisedas home base augmenting pursuing new lines of technological search at this loca-tion — rather than building upon prior research of the parent. This underscoresthe importance of physical presence at locations that host cutting edge researchas firms must locate within the appropriate international centre of excellence tobreathe in the air of innovation. The sectoral issue is instead addressed in Chapter3, where the cross-sectional empirical evidence suggests that, as the sectoralcomposition of FDI gets skewed towards the manufacturing sector, there is asignificant and positive effect on economic growth. On the contrary, wheneverthe sectoral composition of FDI gets skewed towards the services or the primarysector, there is a negative and mostly significant effect on economic growth.
Moving to the home country side, the questions raising are the following:(iii) Do MNEs benefit from significant knowledge transfer from their foreign
activities? And what modalities and mechanisms do MNEs adopt to value knowledge
Introduction 5
Ch001.qxd 6/29/2007 10:08 AM Page 5

transfers? Which are the main advantages stemming from them? Chapter 7 shows,empirically, that foreign activities improve the parent company’s innovativeness andthis mainly occurs through reserve knowledge transfer. However, the efficacy of thetransfer is greater when person-based mechanisms (in particular teams, visits andmeetings) are employed, while the parent company’s innovativeness is only partiallyinfluenced by the use of ICT and codified mechanisms.
(iv) Do MNEs’ performances also benefit in terms of labour productivity andemployment? The econometric results obtained in Chapter 8 indicate that the impactof the multinational activity varies across firms in different quantiles of the per-formance distribution and across foreign affiliates’ geographical locations. In partic-ular, firms throughout the productivity distribution do not benefit from FDI in lessdeveloped countries. Differently, parent firms in the upper quantiles of productivityseem to be positively affected by foreign expansion in developed countries. As foremployment, only small firms seem to be negatively influenced by outward FDI.Finally, multinational experience influences positively and significantly parent firmsacross quantiles of productivity and employment.
Overall, these answers may be useful to orient policymakers to address thefollowing question:
(v) Which is the role of policy in order to trigger virtuous circles involvingmultinationals, local development and growth? Chapter 9 concludes that the inter-action between MNEs and governments can be characterised as a sequentialprocess heading from the policies of (developing) countries and regions to theimpact on MNEs and through their strategies to an impact on (developing) markets.However, recursive elements and interactions between international institutions,government policies and strategies of MNEs are main mechanisms that influencedevelopment. The analysis conducted throughout the volume also suggests that thestate’s responsibility has to be based on its capabilities and the relative strength ofthe market and society. In particular, countries with low state capability need tofocus on minimal basic functions, while states with strong capabilities should playa more active role in dealing with problems related to market imperfections. In bothcases, as far as the management of environment, regulation of monopolies and pro-vision of social benefits are concerned, governments can work together with mar-ket and society. Rethinking the role of state also means that it has to explorealternative instruments and ways to enhance the effectiveness of its policies.
References
Aghion, P., Blundell, R., Griffith, R., Howitt, P., & Prantl, S. (2006). The effects of entryon incumbent innovation and productivity. Mimeo, http://www.economics.harvard.edu/faculty/aghion/papers.html.
6 Lucia Piscitello and Grazia D. Santangelo
Ch001.qxd 6/29/2007 10:08 AM Page 6
Aitken, B., & Harrison, A. (1999). Do domestic firms benefit from direct foreign invest-ment? Evidence from Venezuela. American Economic Review, 89(3), 605–618.
Alfaro, L., & Rodríguez-Clare, A. (2004). Multinationals and linkages: An empiricalinvestigation. Economia, 4(2).
Almeida, P. (1996). Knowledge sourcing by foreign multinationals: Patent citation analy-sis in the US semiconductor industry. Strategic Management Journal, 17, 155–165.
Ambos, T. C., Ambos, B., & Schlegelmilch, B. B. (2006). Learning from foreign sub-sidiaries: An empirical investigation of headquarters’ benefit from reverse knowledgetransfers. International Business Review, 15, 294–312.
Barba Navaretti N. G., & Venables, A. J. (2004) Multinational firms in the world economy.Princeton: Princeton University Press.
Blomström, M. (1989). Foreign investment and spillovers: A study of technology transfer.London: Routledge.
Blomström, M. (1991). Host country benefits of foreign direct investment. In:D. G. McFetridge (a cura di) (Ed.), Foreign investment, technology and economicgrowth. Toronto: University of Toronto Press.
Blomström, M. & Kokko, A. (1998). Multinational corporations and spillovers. Journal ofEconomic Surveys, 12, 247–277.
Björkman, I., Barner-Rasmussen, W., & Li, L. (2004). Managing knowledge transfer inMNCs: The impact of headquarters control mechanisms, Journal of InternationalBusiness Studies, 35, 443–455.
Cantwell, J. A. (1989). Technological innovation and multinational corporations. Oxford:Basil Blackwell.
Cantwell, J. A. (1995). The globalisation of technology: What remains of the product cyclemodel? Cambridge Journal of Economics, 19, 155–174.
Cantwell, J. A., & Mudambi, R. (2005). MNE Competence—creating subsidiary man-dates. Strategic Management Journal, 26, 1109–1128.
Cantwell, J. A., & Piscitello, L. (1999). The emergence of corporate international networksfor the accumulation of dispersed technological capabilities. Management InternationalReview, 39, 123–147.
Castellani, D., & Zanfei, A. (2006). Multinational firms, innovation and productivity.Cheltenham: Edward Elgar.
Caves, R. E. (1974). Multinational firms, competition and productivity in host-countrymarkets. Economica, 32, 176–193.
Caves, R. (1996). Multinational enterprise and economic analysis. Cambridge: CambridgeUniversity Press.
Cohen, W., & Lenvinthal, D. (1990). Absorptive capacity: A new perspective on learningand innovation. Admistrative Science Quarterly, 35, 128–152.
Dunning, J. H. (1993). Multinational enterprises and the global economy. Wokingham:Addison-Wesley Publishers Ltd.
Dunning, J. H., & Narula, R. (1995). The R&D activities of foreign firms in the UnitedStates. International Studies of Management and Organisation, 25, 39–73.
Findlay, R. (1978). Relative backwardness, direct foreign investment, and the transfer oftechnology: A simple dynamic model. The Quarterly Journal of Economics, 92, 1–16.
Introduction 7
Ch001.qxd 6/29/2007 10:08 AM Page 7
Fosfuri, A., Motta, M., & Ronde, T. (2001). Foreign direct investment and spilloversthrough workers’ mobility. Journal of International Economics, 53, 205–222.
Frost, T. S. (2001). The geographic sources of foreign subsidiaries’ innovations. StrategicManagement Journal, 22, 101–123.
Ghoshal, S., Korine, H., & Szulanski, G. (1994). Interunit communication in multinationalcorporations. Management Science, 40, 96–110.
Gupta, A. K., & Govindarajan, V. (2000). Knowledge flows within multinational corpora-tions. Strategic Management Journal, 21, 473–496.
Haddad, M., & Harrison, A. (1993). Are there positive spillovers from direct foreigninvestment? Journal of Development Economics, 42, 51–74.
Hirschman, A. O. (1958). The strategy of economic development. New Haven, CT: YaleUniversity.
Iwasa, T., & Odagiri, H. (2004). Overseas R&D, knowledge sourcing, and patenting: An empirical studies of Japanese R&D investment in the US. Research Policy, 33,807–828.
Kogut, B., & Zander, U. (1992). Knowledge of the firm, combinative capabilities, and thereplication of technology. Organization Science, 3, 383–397.
Kokko, A. (1994). Technology, market characteristics and spillovers. Journal of Develop-ment Economics, 43(2), 279–293.
Kuemmerle, W. (1997). Building effective R&D capabilities abroad. Harvard BusinessReview, 75(March–April), 61–70.
Kuemmerle, W. (1999). The drivers of foreign direct investment into research anddevelopment: An empirical investigation. Journal of International Business Studies,30(1), 1–24.
Lall, S. (1978). Transnationals, domestic enterprises, and industrial structure in hostLDCs: a survey. Oxford Economic Papers, 30(2), 217–248.
Lipsey, R. (2002). Home and host country effects of FDI. NBER Working Paper no. 9293.Mansfield, E., & Romeo, A. (1980). Technology transfer to overseas subsidiaries by US
based firms. Quarterly Journal of Economics, 95(4), 737–750.Markusen, J. R., & Venables, A. J. (1999). Foreign direct investment as a catalyst for
industrial development. European Economic Review, 43, pp. 335–356.Pearce, R. D. (1999). Decentralised R&D and strategic competitiveness: globalised
approaches to generation and use of technology in multinational enterprises (MNEs).Research Policy, 28, 157–178.
Rodriguez-Clare, A. (1996). Multinationals, linkages and economic development. AmericanEconomic Review, 86(4), 852–873.
Santangelo, G. D. (2002). The regional geography of corporate patenting in informationand communications technology (ICT): Domestic and foreign dimension. RegionalStudies, 36(5), 495–514.
Saxenian, A. (1994). Regional Advantage. Cambridge MA: Harvard University Press.Smarzynska, J. B. (2004). Does foreign direct investment increase the productivity of
domestic firms? In search of spillovers through backward linkages. American EconomicReview, 94, 605–627.
8 Lucia Piscitello and Grazia D. Santangelo
Ch001.qxd 6/29/2007 10:08 AM Page 8

UNCTAD, (2001). World Investment Report, 2001. Promoting linkages. Geneva: UNCTAD.UNCTAD, (2005), World Investment Report 2005. TNCs and the internationalisation of
R&D. Geneva: UNCTAD.Zanfei, A. (2000). Transnational firms and changing organisation of innovative activities.
Cambridge Journal of Economics, 24, 515–554.
Introduction 9
Ch001.qxd 6/29/2007 10:08 AM Page 9

This page intentionally left blank

Impact on Host Development and Growth
Ch002.qxd 6/29/2007 10:08 AM Page 11

This page intentionally left blank

Chapter 2
Foreign Direct Investment and Economic Development: Opportunitiesand Limitations from a Developing Country Perspective
Rajneesh Narula and Brian Portelli
AbstractForeign Direct Investment has attracted increasing interest from developing coun-tries because of the perceived benefits in terms of the injection of capital, technologyand knowledge. This article analyses the main analytical underpinnings concerningthe inter-relationships between the FDI and host-country economic development. Weundertake a brief review of empirical studies on the issue of FDI-led growth process.We highlight a very basic point emerging from the literature, that FDI is not a sinequa non for development. FDI-led growth is not a process that occurs automaticallyin the host country, and this reflects the complex nature of the interrelationshipsbetween multinational enterprises (MNEs) and host-country economic agents. A vastmajority of the existing empirical studies indicate that the FDI does not always makea positive contribution to either economic growth or factor productivity. This is oftenbecause host countries are not able to capture the bulk of benefits associated with theFDI without a certain threshold level of absorptive capabilities.
1. Introduction
Over the past two decades, the growth of multinational enterprise (MNE) activityhas increasingly been regarded as one of the defining characteristics of the world
Do Multinationals Feed Local Development and Growth?© 2007 by Elsevier Ltd.All rights of reproduction in any form reservedISBN: 978-0-08-045360-6
Ch002.qxd 6/29/2007 10:08 AM Page 13

economy and an engine of economic growth. MNE-related externalities have beenattracting increased interest from developing countries because of the perceivedbenefits in terms of the injection of capital, technology and knowledge, as well asthe potential generation of economic growth in host countries. Key MNE exter-nalities include the knowledge spillovers and linkages from MNEs to domesticfirms in host countries. The nature of these MNE externalities may either arise frompure market transactions (e.g., through MNE vertical linkages) or else throughknowledge spillovers, which take non-market or non-monetary form.
This general warming of attitudes towards the FDI has taken place in the con-text of the promotion of outward-looking economic strategies as envisaged by the‘Washington Consensus’ institutions, namely, the International Monetary Fundand the World Bank. Hence, developing countries have been undertaking policyshifts from inward-looking, import substitution industrialisation models towardsmore outward-looking, export-oriented economic policies (Lall & Narula, 2006).The increased role of MNEs in certain sectors is in part a result of aggressive lib-eralisation of the FDI regimes and privatisation programmes. Indeed, the greatestchange has been the reduction in state ownership and the subsequent privatisationof assets.
The less developed a country is, the greater the need for such MNE externali-ties, as a means to alleviate resource and skill constraints normally associated withunderdevelopment. Developing countries actively seek the FDI to strengthenindustrial competitiveness and enhance their growth prospects.1 As a result, devel-oping countries’ attitudes towards the FDI have changed, with dramatic improve-ments in the FDI policy regimes.2 Governments in developing countries have notonly reduced barriers to the FDI, but have also been offering special incentives toattract foreign firms and foster relationships between MNEs and local firms.3
The debate on the merits and de-merits of the FDI started in the 1960s (Reuberet al., 1973; Lall & Streeten, 1977) and is still far from over. This topic hasassumed greater importance in the context of the anti-globalization movement,which opposes further liberalisation of international trade and investment.
14 Rajneesh Narula and Brian Portelli
1The relevance of the FDI vis-à-vis economic development, stems from a number of potential bene-fits to be realised in the host economy. For example, the FDI is less volatile than other private capitalflows and provides a stable source of finance to meet capital requirements in developing contexts(Reisen & Soto, 2001). 2This is particularly so in the case of those developing countries which until some time ago practisedthe outright barring of the FDI activity (Caves, 1982). 3In 1998, 103 countries offered tax concessions to foreign companies that set up production or admin-istrative facilities within their border (Hanson, 2001).
Ch002.qxd 6/29/2007 10:08 AM Page 14

The FDI and its developmental effects is therefore a topic that attracts consider-able attention and interest from academia and policy makers.
The objective of this article is therefore to look at the key analytical issuesrelated to the topic of the FDI and economic development from the point of viewof host developing countries, specifically focusing on the impact of the FDI oneconomic growth and the mechanisms through which this is achieved. After thisintroduction, Section 2 provides a brief overview of the background of the topic,in terms of the trends in the FDI flows and stocks in developing countries andmain regional trends and performances. Section 3 presents an overview of theempirical evidence on FDI-led growth, principally the mechanisms towards thisend. We finish this article with some concluding remarks.
2. Background and Trends of the FDI in Developing Countries
The growing importance of the FDI represents one of the defining features ofglobalisation and the reshaping of the international business environment andthere are a number of studies that have examined the changing structure of inter-national production and documented the meteoric growth in FDI activities(Dunning & Narula, 2004). This section highlights some of the salient trends andcountry/ regional characteristics in terms of inward FDI.
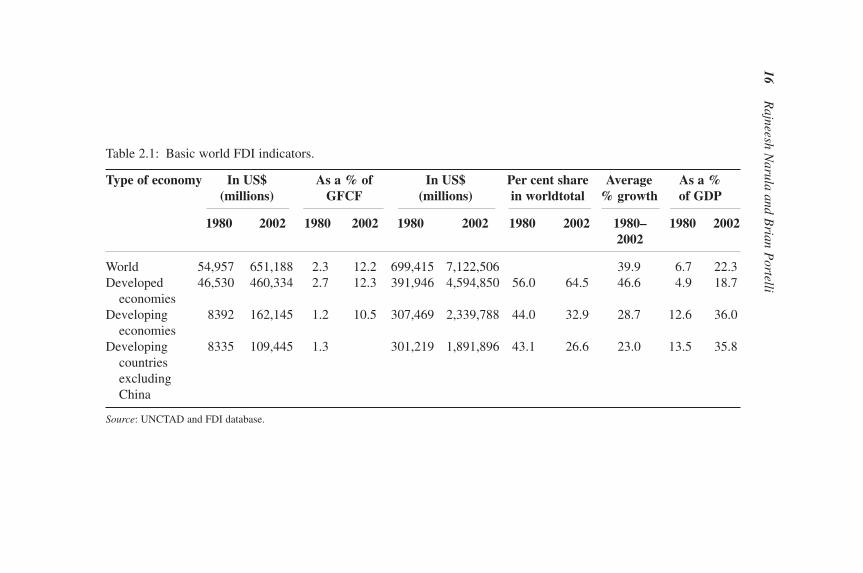
Over the past two decades, world FDI inflows have more than tripled, increas-ing from around US$ 55 billion in the late 1980s and reaching US$ 651 billion in2002. As Table 2.1 illustrates, in 2002 more than 70 per cent of total world FDIinflows have been directed to developed countries, with the remainder beingshared by developing regions. It is noteworthy that an increasingly large propor-tion of aggregate FDI flows takes the form of cross-border mergers and acquisi-tions (M&As) which includes the acquisitions of public enterprises throughvarious national privatisation programmes. In 1999, M&As accounted for around80 per cent of total FDI inflows, corresponding to substantial high shares acrossdeveloping regions (UNCTAD, 2000). The take-over of former parastatal com-panies represented an increasingly important FDI driver in developing economiesas these countries continue to liberalise their economies (Liberatori & Pigato,2000).
Inward FDI stock in developing countries has increased from US$ 307.5 billionin 1980, and has reached US$ 2,340 billion in 2002. This corresponds to around 33 per cent of total world inward FDI stock. The magnitude of inward FDI stockgoing to developed economies, accounting to 65 per cent of world total in 2000,compared to 56 per cent in 1980. For the developing economies, the same share dec-reased from 44 per cent in 1980 to around 35 per cent in 2002. Table 2.1 illustrates
Foreign Direct Investment and Economic Development 15
Ch002.qxd 6/29/2007 10:08 AM Page 15
16R
ajneesh Narula and B
rian Portelli
Table 2.1: Basic world FDI indicators.
Type of economy In US$ As a % of In US$ Per cent share Average As a %(millions) GFCF (millions) in worldtotal % growth of GDP
1980 2002 1980 2002 1980 2002 1980 2002 1980– 1980 20022002
World 54,957 651,188 2.3 12.2 699,415 7,122,506 39.9 6.7 22.3Developed 46,530 460,334 2.7 12.3 391,946 4,594,850 56.0 64.5 46.6 4.9 18.7
economiesDeveloping 8392 162,145 1.2 10.5 307,469 2,339,788 44.0 32.9 28.7 12.6 36.0
economiesDeveloping 8335 109,445 1.3 301,219 1,891,896 43.1 26.6 23.0 13.5 35.8
countriesexcluding China
Source: UNCTAD and FDI database.
Ch002.qxd 6/29/2007 10:08 AM Page 16

these trends. It is noteworthy that within the developing country groupings, there aremarked differences among the developing regions. It is noteworthy to highlight therelative ‘weight’ of China in terms of inward FDI attraction in recent years. Forexample, in 2002, China’s share in total inward FDI stock stood at 6 per cent, com-pared to 0.1 per cent in 1980.
The important role of FDI in host economies is highlighted in specific indica-tors, such as the share of inward FDI flows as a percentage of gross fixed capitalformation (GFCF), as well as the share of inward FDI stock as a percentage ofgross domestic product (GDP). The share of inward FDI inflows as a percentageof GFCF measures the relative weight of the FDI in total aggregate investmenttaking place in the host economy. Total investment includes both public and pri-vate sector investment in the host country. On the other hand, the share of inwardFDI stock as a percentage of GDP provides a tentative measure of the importanceof inward FDI stock in relation to total economic activity taking place in the hostcountry (as measured by the GDP). Table 2.1 illustrates the increased importanceof the FDI flows and stock as evidenced from increasing shares in both indicatorsbetween 1980 and 2002.
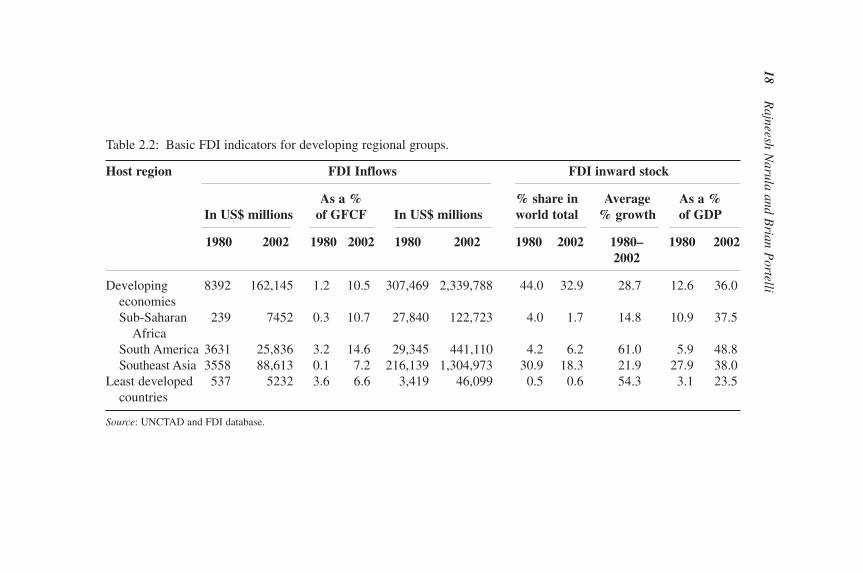
Within the various regional groupings, it is equally evident that not all devel-oping regions have been equally successful in attracting the FDI to their eco-nomies. For example, whereas in 1980, Sub-Saharan Africa and South Americahad almost the same level of inward FDI stock, with a share of world total at 4.0 and 4.2 per cent respectively, their respective shares in 2002 were very dif-ferent. Sub Saharan Africa’s share stood at 1.7 per cent of total inward FDI stockcompared to 6.2 per cent for South American region. Although decreasing itsshares over the 1980–2002 period, Southeast Asia maintained the highest sharefor developing countries. Alternatively, looking at the average growth rates overthe period 1980–2002, it is more evident that inward FDI stock towards devel-oped economies has grown at an average rate of 48 per cent. The highest growthrate is that for South America with 61 per cent and the lowest growth rate is thatfor Sub-Saharan Africa at 14.8 per cent. Table 2.2 illustrates these trends.
A reason behind cross-regional disparities of the FDI in developing countriesmay be due to the concentration of the FDI in few selected countries. Indeed, itis estimated that the five largest host countries in developing world received 62 per cent of total FDI inflows (UNCTAD, 2002a). These handful of countriesprimarily include the newly industrialised Asian countries, particularly China. Asillustrated in Table 2.2, in each of the developing regions, just five countriesaccounted for over 70 per cent of all inward FDI flows.
It is also evident that the onset of globalisation has transformed the modes ofMNE production and trade in both developed and developing countries. This isreflected in changes in the extent of information and technology in economic
Foreign Direct Investment and Economic Development 17
Ch002.qxd 6/29/2007 10:08 AM Page 17
18R
ajneesh Narula and B
rian Portelli
Table 2.2: Basic FDI indicators for developing regional groups.
Host region FDI Inflows FDI inward stock
As a % % share in Average As a %In US$ millions of GFCF In US$ millions world total % growth of GDP
1980 2002 1980 2002 1980 2002 1980 2002 1980– 1980 20022002
Developing 8392 162,145 1.2 10.5 307,469 2,339,788 44.0 32.9 28.7 12.6 36.0economiesSub-Saharan 239 7452 0.3 10.7 27,840 122,723 4.0 1.7 14.8 10.9 37.5
AfricaSouth America 3631 25,836 3.2 14.6 29,345 441,110 4.2 6.2 61.0 5.9 48.8Southeast Asia 3558 88,613 0.1 7.2 216,139 1,304,973 30.9 18.3 21.9 27.9 38.0
Least developed 537 5232 3.6 6.6 3,419 46,099 0.5 0.6 54.3 3.1 23.5countries
Source: UNCTAD and FDI database.
Ch002.qxd 6/29/2007 10:08 AM Page 18

activities, trade intensity and FDI liberalisation policies and the new rules ofinternational trade and investment (Narula, 2003a). In the context of these devel-opments, over the past two decades the sectoral trends (primary, manufacturingand services) in the FDI have also registered substantial changes. An importantdevelopment has been the sharp decline in FDI stock going into primary sectoreconomic activities, the share of which has registered a decrease by more thanhalf between 1988 and 1997 (Table 2.3). On the other hand, the services sectorhas registered a growing share over the same period. It is also noteworthy thatthe greater importance of the services sector has been underpinned by the M&Asboom between 1987 and 2000. It is estimated that the share of the services sec-tor M&As, in 1999 was more than twice the sum of the primary and manu-facturing sector (UNCTAD, 2000). In terms of the level of FDI stock, themanufacturing sector remains the most important economic sector in the devel-oping country group. It is also important to highlight the extensive regional dis-parities in sectoral composition. The African region appears to go against theoverall developing country trends with the share of primary goods remaining
Foreign Direct Investment and Economic Development 19
Table 2.3: FDI to developing regions in relation to total inward FDI stock.
1980 2002
Africa 10.5 7.3North Africa 1.4 2.1Other Africa 9.1 5.2South Africa 5.4 2.2
Concentration ratio in 2002 (5 largest recipients: 70.1South Africa, Nigeria, Egypt, Tunisia, Angola)
Latin America and the Caribbean 16.4 32.6South America 9.5 18.9Other Latin America and the Caribbean 6.8 13.7Brazil 5.7 10.1
Concentration ratio in 2002 (5 largest recipients: 77.6Brazil, Bermuda, Argentina, Mexico, Chile)
Asia and Pacific 73.1 60.1South East Asia 70.3 55.8China 2.0 19.1
Concentration ratio in 2002 (5 largest recipients: 79.4China, Hong Kong, Singapore, Malaysia, Indonesia)
Source: UNCTAD and World Investment Report (various).
Ch002.qxd 6/29/2007 10:08 AM Page 19

substantially high and constant and the share of services sector diminishing. Thisoutcome partly reflects the fact that a large number of MNEs operating in Africaare still attracted by the abundance of natural resources rather than the market orother host-country location–specific advantages (Narula, 1996). This form ofFDI has different implications for growth and development in host economiesthan FDI in manufacturing and services. Hiemenz et al. (1991) found that natu-ral resource oriented FDI in contrast to manufacturing FDI tends to be under-taken independently of macro-economic conditions and other host-countryfactors. The Latin American and the Caribbean regions have registered a largedrop in the share of the manufacturing sector with a corresponding increase inthe share of the services sector (Dunning & Narula, 2004). The Asian region hasexhibited a large and relatively stable share of manufacturing sector activities(see Table 2.4).
These data provide an indication of the trends and importance of FDI in thedeveloping country context, especially with regards to shares in global FDI stocksand flows and the relative ‘weight’ of the FDI with respect to investment and eco-nomic activity in the host country. In addition to highlighting the trends in inwardFDI flows and stocks, it is important to examine actual studies and empirical evi-dence on the potential for leveraging the role of the FDI for economic growth. Itis also relevant to examine and highlight the mechanisms through which FDI-ledgrowth is achieved. Are there any determinant factors that facilitate this process?These questions and corresponding caveats are tackled in the next section.
3. FDI, Economic Growth and MNE Externalities
From the point of view of host developing countries, the central question con-cerning the role of the FDI in development is to what extent do the FDI and MNE
20 Rajneesh Narula and Brian Portelli
Table 2.4: Share of inward FDI stock by sector in developing countries.
Sectors Asia (%) LAC (%) Africa (%) Total (%)
1988 1997 1988 1997 1988 1997 1988 1997
Primary 8.4 3.5 8.8 5.7 51.8 53.4 10.3 3.9Manufacturing 62.1 62.9 67.4 28.8 20.8 26.6 62.3 60.7Services 29.4 33.6 23.8 55.5 27.4 19.8 27.4 35.4Total 100 100 100 100 100 100 100 100
Source: UNCTAD and World Investment Report (1999).
Ch002.qxd 6/29/2007 10:08 AM Page 20

activities contribute to the generation of host-country economic growth throughthe realisation of MNE externalities (Portelli, 2006). This question is linked to therealisation of the necessary preconditions for MNE externalities and FDI-ledgrowth to emerge. In this section, we stress the point that the impact of the FDIon host-country economic growth revolves around the nature and extent of theseexternalities, whether occurring in the same industry of the MNE or else inupstream industries (i.e. supplier firms).4 Irrespective of their nature and form,these externalities have an impact on FDI-led host-country economic growthprospects. Externalities are the mechanism through which productivity gains bylocally-based firms occur, leading to the generation of economic growth in thehost economy. Through these externalities, FDI inflows can potentially break thevicious circle of underdevelopment (as evident in low savings, low investmentand low growth poverty traps) by easing capital, technology and knowledge con-straints in the host economy. For example, MNEs are likely to bring in the host-country capital, technology and knowledge and potentially lead to increasedexports boosting international competitiveness (Blomstrom, 1990). MNE exter-nalities, technology spillovers and vertical linkages are tackled first as the mech-anisms through which the generation of economic growth in the host countryoccurs. In passing, certain determinant factors for technology spillovers andgrowth are highlighted.
3.1. MNE Externalities
MNEs are among the most important actors in the generation and control of newtechnology and they utilise the tangible and intangible resources in different hostcountries to the most productive use.5 The fact that technologies used by foreignaffiliates are not always available at arm’s length for host economies, adds to theimportance attached to the FDI as the most tenable form of technology acquisitionfor industrial upgradation. FDI activity may involve the explicit transfer of tech-nology and in addition, the transfer of complementary resources such as manage-ment expertise and processes to best utilise this technology. For example, Djankovand Hoekman (1999) show that firms receiving the FDI or involved in joint ven-tures tend to acquire new technologies more frequently than those without the FDI
Foreign Direct Investment and Economic Development 21
4In the case of vertical externalities, i.e. those externalities emerging from the links between an MNEin one sector with upstream sectors, can take monetary form (as emerging from pure market transac-tions) as well as non-monetary, in the form of knowledge and technology spillovers.5New technology generation is highly concentrated in a number of advanced industrial countries, tak-ing place in large MNEs. For a discussion on the role of MNEs in the globalisation of innovation, seefor example, Narula (2003a).
Ch002.qxd 6/29/2007 10:08 AM Page 21

and provide training programmes. The rest of this section evaluates the extantempirical evidence.
3.1.1. Technology spillovers It is important to highlight that technologyspillovers are hard to quantify. This is firstly because the various learning andtransfer processes that underlay spillovers are hard to measure. Secondly, in thecase of FDI spillovers, it is difficult to determine the means by which technologytransfer through FDI affects the productivity growth of host-country based firms.Most empirical studies have dealt with these problems by taking the view that thetechnology gap which may exist between local firms and MNE affiliates isreflected in the observed differences in the level of total factor productivity (TFP),i.e., how labour and capital are utilised in host-country firms. The effect of MNEtechnology spillovers can then be captured by changes in the level of TFPobserved at the firm level, after controlling the impact of other variables that mayinfluence the firm’s productivity performance. A considerable number of studieshave focused on the MNE impact on intra-industry TFP, stressing the possibilitythat MNEs exert a positive impact on the productivity levels of local firms.However, these studies examine the productivity externalities without trying tounderstand the mechanism through which these are realised. Such studies havetherefore focused on the indirect evidence of externalities by exploring whetherincreases in the presence of MNEs in a country or sector are associated withincreases in local firms’ productivity in that country or sector or in upstream sec-tors. One robust finding in this regard is that MNEs tend to have higher produc-tivity than domestic firms in the same sector (for example, Haddad & Harrison,1993; Kokko et al., 2001).6 Utilising this methodology, a number of studies indi-cate efficiency gains as a result of technological spillovers from MNE affiliates tolocal firms in the same industry, as for example, Blomstrom and Persson (1983)for Mexico, and Blomstrom and Sjoholm (1999) for Indonesia. Using the samemethodology, other studies indicate negative effects of the FDI on local firms asHaddad and Harrison (1993) in the case of Morocco. This methodology has its pit-falls, since MNEs might be attracted by sectors that are more productive in the firstplace and thus the validity of TFP growth as a measure of MNE spillover effectsstands for some reassessment (Aitken & Harrison, 1999).7 As Aitken and Harrisonnote, cross-sectional studies are subject to a critical identification problem. At themicro level, foreign firms may be located in high productivity industries asopposed to causing productivity externalities. At the macro level, high growthcountries may attract more FDI as opposed to the FDI causing this high growth. If
22 Rajneesh Narula and Brian Portelli
6When they adjust for firm size, Haddad and Harrison do not find differences in productivity betweenforeign and local firms.7This point is stressed by Hanson (2001) in his critique of the method.
Ch002.qxd 6/29/2007 10:08 AM Page 22

this is the case, the coefficients on cross-section estimates are likely to overstatethe positive impact of foreign investment. As a result, one might find evidence ofpositive externalities from foreign investment where no externalities do occur.8
Given this issue, empirical studies of FDI spillovers through panel data areused to deal with this endogeneity problem. For developing countries, these stud-ies find no indication of the existence of positive horizontal externalities. In fact,many studies find evidence of negative horizontal externalities. In a recent reviewof the micro evidence on externalities from foreign owned to domestically ownedfirms which pay particular attention to panel studies, Gorg and Greenaway (2002)conclude that the effects are mostly negative. An explanation for this result mightbe that MNEs minimise technology leakages to competitors, while simultane-ously tend to improve the productivity of suppliers by transferring knowledge tothem (see for example, Portelli & Narula, 2006, Scott-Kennel, 2006). Morerecent studies have examined the notion of positive externalities from the FDItowards local firms in upstream industries; Blalock and Gertler (2003) find evi-dence of positive vertical externalities.9 This argument points to the notion that ifthe FDI were to generate spillovers, they are more likely to be vertical rather thanhorizontal in nature. However, most empirical studies of FDI spillovers haveregressed local firm productivity on FDI activity within the same sector.Although such studies find no horizontal spillovers, the empirical work at theintra-industry level might therefore not be suitable to capture wider spillovereffects on the host economy, such as those created between MNEs and their sup-pliers. It is evident from the empirical literature that it is difficult to find robustevidence of positive externalities from multinationals to local firms in the samesector (horizontal externalities). Indeed, many studies for developing countrieshave paid particular attention to causality problems and have actually found evi-dence of negative horizontal externalities arising from multinational activitywhile confirming the existence of positive externalities from multinationals tolocal firms in upstream industries (vertical externalities).
3.1.2. MNE vertical backward linkages and labour mobility Two ways inwhich the FDI transfers technology to the host-country based firms is via MNEbackward linkages and labour mobility.10 MNEs can benefit the host economy
Foreign Direct Investment and Economic Development 23
8For a more detailed analysis of this method, see for example, Alfaro and Rodriguez Clare (2003).9This new evidence, however, needs to be taken with caution. Methodological issues remain regard-ing estimation techniques and measurement of variables, in particular productivity measures.10In addition to these two mechanisms, the literature identifies horizontal linkages and international tech-nology spillovers as other potential forms of technology transfer modes. However, in the case of countriesin early stages of development and with weak industrial bases, the importance of these may not be so pro-nounced. However, intra-firm transfer technology may occur from the parent firm to the foreign affiliate.
Ch002.qxd 6/29/2007 10:08 AM Page 23

through the backward linkages they generate; i.e. relations with local suppliers ofintermedi-ate inputs in their production process. As a result, MNE affiliates maytransfer technologies to local firms in their value chain; i.e., either to those firmswho supply them with intermediate goods or to local buyers in the host country.Notwithstanding the extensive empirical literature on the FDI and spillovers, thereare hardly any empirical studies that analyse the explicit link between linkages andspillovers (Blomstrom et al., 2000). Whereas the formation of inter-firm linkagesdoes not necessarily mean that technology spillovers to local firms occur, verticalbackward linkages may represent an important medium for technology spillovers(Lim, 2000). It is unlikely that MNEs are able to contain the full value of thisexplicit and implicit transfer of technology to vertically linked firms in the hosteconomy. Therefore, it can be hypothesised that inter-firm linkages represent agood basis for knowledge spillovers and introduction of new technologies to host-based firms (Blomstrom & Kokko, 1998). This is also a point highlighted in theseminal literature on vertical backward linkages (Lall, 1980; Watanabe, 1983;UNCTC, 1981) which has shown that through these inter-industry relations MNEsmay assist local suppliers in the development and upgrading of their technologicalcapabilities.11
Certain determinant factors for MNE backward linkages have been identifiedin the literature. For example, the larger the host market and the more sophisti-cated the technological capabilities of local suppliers, the more pronounced theMNE linkages are expected to be. Local procurement by foreign affiliates tendsto increase over time as a result of the experience from investment, upgrading inthe host-country receptor conditions and possibly lower costs of local sourcing(Driffield & Mohd. Noor, 1999; McAleese & McDonald, 1978; Gorg & Ruane,1998; Scott-Kennel, 2006). Rodriguez Clare (1996) shows that more linkages arecreated when the production process of MNEs involves the intensive utilisationof intermediate goods, when the costs of communication between parent andaffiliate are high, and when the home and host country are not too different interms of variety of intermediate goods produced. McAleese and McDonald(1978) argue that backward linkages tend to increase primarily with the additionof production processing stages over time and in relation to the growth of theindustrial base in the host country. This point is reiterated in various studies suchas in Aitken and Harrison (1991). Blomstrom and Kokko (1997) suggest thatsome host-country characteristics that may influence the extent of linkages are
24 Rajneesh Narula and Brian Portelli
11MNE assistance to suppliers may involve the training in management and organization, assistancein the adoption of superior technology and extending markets and is tantamount to technologyspillovers through vertical linkages.
Ch002.qxd 6/29/2007 10:08 AM Page 24

market size, local content regulations and the size and technological capability oflocal firms. Government policies can play an important role in the creation ofMNE vertical linkages.12 The extent of MNE vertical linkages depends exten-sively on the procurement strategies of foreign affiliates (Chen, 1996) as well asthe manner with which local sourcing increases in intensity over time (Rasiah,1994).13 Given the absorptive capacity structures in developing countries, someauthors find it unrealistic for developing countries to attract the FDI with highlinkage potential (Stewart, 1976; Rodriguez-Clare, 1996). Absorptive capacitiesare dealt with in greater depth in Section 3.3.
Another way in which the FDI transfers technology to the host-country basedfirms is via labour mobility. Workers employed by an MNE affiliate are mostlikely to receive and acquire knowledge of superior technology and managementpractices. Through the switching of employers or even the start-up of new busi-ness enterprises with the help of MNE trained personnel, the knowledge embod-ied in human capital can spill over to other host country-based firms. A number ofstudies have been undertaken to provide insights into the spillovers emerging fromlabour turnover. For example, Katz (1987) finds that many managers of local firmsin Latin America were previously trained in MNE affiliates at the start of theircareers. Gershenberg (1987) shows that MNEs provided more management train-ing than local private firms and that a small percentage of job changes involve amovement from multinationals to domestic firms. Spillovers from labour linkagesare determined according to the type of training given to the labour force as wellas to the labour mobility (Slaughter, 2001; Fosfuri et al., 2001). As we discusslater, absorptive capacity is a determinant factor to the FDI impact at the hostcountry level.
3.2. FDI and Economic Growth
The realisation of MNE externalities potentially leads to the generation of eco-nomic growth at the macroeconomic level. At the macroeconomic level, cross-sectional empirical work by Borensztein et al. (1998), Carkovic and Levine(2002), and Alfaro et al. (2003) find little support that the FDI has an exogenouspositive effect on economic growth. However, their evidence suggests that localconditions, such as the level of education and the development of local finan-cial markets play an important role in allowing the positive effects of the FDI to
Foreign Direct Investment and Economic Development 25
12For further discussion, see UNCTAD (2001).13When analysing MNE linkages, it is important to keep in mind that MNEs benefit host economiesonly if linkages generated are beyond those already generated or displaced.
Ch002.qxd 6/29/2007 10:08 AM Page 25

materialise. In the widely cited paper in the literature, Borensztein et al. (1998),using a dataset of the FDI flows from industrialised countries to 69 developingcountries, find that the FDI is an important vehicle for transferring technologyand higher growth only when the host country has a minimum threshold of humancapital.14 De Mello (1999) finds a positive and significant impact of the FDI onoutput growth in OECD and Asian non-OECD countries. However, the FDI tendsto increase output growth through higher productivity in technologically leadingcountries and through capital accumulation in technological laggards. Elsewhere,Reisen and Soto (2001) find a positive correlation between the FDI and portfolioequity flows on the one hand and GDP growth on the other. Other evidence in theliterature confirms the positive impact of the FDI on growth, but highlight thatdeveloping countries need to have reached a certain threshold level of develop-ment in their location factors, inter alia in the level of human capital and the phys-ical infrastructure prior to be able to internalise the associated benefits of the FDI(Saggi, 2000). De Mello (1997) points out the differences in the growth impact ofthe FDI across countries based on such capabilities. Since host-country techno-logical capabilities are likely to determine the scope for spillovers from foreign todomestic firms, the growth impact of the FDI tends to be limited in technologicallyless advanced countries. The same authors go further to argue that the FDI raisesgrowth only in those countries where the labour force has reached a minimumthreshold of educational attainment. Xu (2000) finds strong evidence of the posi-tive effect of the FDI on total factor productivity growth in host countries,15 butreiterates that the absorption of MNE’s technology may require a certain level ofhuman capital accumulation on the recipient side. In the same vein, Zhang (2001)finds that the impact of FDI growth is country specific and tends to be positivewhere policies favouring free trade and education are adopted to encourage exportoriented FDI.
3.3. Determinant Factors — Absorptive Capacity
The empirical evidence seems to suggest that a number of determinant factorsneed to be in place at the host-country level for MNE externalities to occur andFDI-led growth to be realised. There is consensus in the literature highlighting
26 Rajneesh Narula and Brian Portelli
14Likewise, Xu (2000) using data on U.S. MNEs finds that a country needs to reach a minimumhuman capital threshold in order to benefit from the technology transfer from MNEs, and that mostdeveloping countries do not meet this threshold.15This result pertains to US survey data on manufacturing MNEs and the technology transfer effect issignificant only for developed countries.
Ch002.qxd 6/29/2007 10:08 AM Page 26

these determinant factors, grouped under the concept of absorptive capacity. Therealisation of MNE technology spillovers as well as FDI-led growth are deter-mined by the absorptive capacity of host-country economic agents, be they firms,individuals or institutions. The concept of technological congruence or absorptivecapacity16 is a function of the capability of the country to benefit from techno-logical spillovers from the more industrialised countries and the ability to accu-mulate and best utilise technology and knowledge. Absorptive capacity includesthe ability to search and select the most appropriate technology to be assimilatedfrom existing ones available, as well as the activities associated with creating newknowledge. Absorptive capacity also reflects the ability of economic agents tointegrate the existing and exploitable resources — technological opportunities —into the production chain, and the foresight to anticipate potential and relevanttechnological trajectories (Criscuolo & Narula, 2002). Laggard ‘economic units’(countries or firms) must possess inter alia, the ability to absorb, internalise andutilise the knowledge potentially made available to them. Absorptive capacity ineconomic units corresponds to the appropriate supply of human capital and tech-nological capability to be able to generate new technologies and consequently useproductive resources efficiently. The development and upgrading of capabilitiesis expected to translate into productivity growth for firms as well as countries.17
Absorptive capacity is significant for development because it allows domesticeconomic actors to internalise knowledge that exists elsewhere (either within thedomestic economy or externally) that is made available directly or indirectly tothem. There are several ways in which technology flows occur, either througharms-length means (such as, through licensing) or through trade in intermediategoods, plant and equipment or even products or services (Narula, 2003b). As inthe focus of this article, technology flows may also be made available through themodality of the FDI. Although not the only means available, spillovers from theFDI are indeed regarded as one of the most practical and efficient means bywhich industrial development and upgrading can be promoted (Narula &Dunning, 2000). While the potential for MNE-related spillovers is clear, as arethe opportunities for industrial upgrading therefrom, it is increasingly acknowl-edged that the nature, level and extent of the benefits vary considerably with thelevels of absorptive capacity.
Foreign Direct Investment and Economic Development 27
16Abramovitz (1990, 1995) distinguishes between two elements of social capability and technologicalcongruence or absorptive capacity. Dahlman and Nelson (1995) define national absorptive capacityas the ‘ability to learn and implement the technologies and associated practices of already developedcountries’.17Although one has to highlight that there are other intervening factors in play see e.g., Abramovitz,(1986, 1995; Dahlman & Nelson, 1995).
Ch002.qxd 6/29/2007 10:08 AM Page 27

It should also be stressed that while human capital represents a core aspect ofabsorptive capacity and that a host country should possess a minimum thresholdstock of knowledge that will allow it to absorb MNE externalities, its presence isalso not a sufficient condition for knowledge accumulation (Criscuolo & Narula,2002). Knowledge accumulation requires the simultaneous presence of institu-tions and economic actors that determine the stock of knowledge in a given loca-tion and the efficient use of markets and hierarchies — be they intra-firm,intra-industry or intra-country (Narula, 2003b). This knowledge is not costlessand must be accumulated over time. Hence, while physical and human capital arenecessary conditions for catching-up, the lack of appropriate incentives for pro-duction and investment can compromise the success of the technological upgra-dation (Lall, 1992; Lall & Narula, 2006).18
The contrasting empirical evidence on the impact of the FDI at the host-country level reinforces the claim that MNE externalities and knowledge spillovereffects are not automatic as one would tend to believe, but are affected by severalhost-industry and host-country factors. An important characteristic for the emer-gence of technology spillovers is the technology gap between MNE affiliates andlocal firms in the host country. Kokko (1994) and Kokko et al. (1996) provide evi-dence for the hypothesis that spillovers are easier to identify empirically when thetechnological attributes of local firms match those of the MNE affiliates.Specifically, Kokko et al. (1996) argue that a high technology gap combined withlow competition prevents spillovers to the host economy. The absorptive capabil-ity of host-country firms to absorb foreign technology appears to be an importantdeterminant of the size of FDI spillovers. Kokko et al. (2001) highlight the impor-tance of past experience in industrialisation as a precondition for internationaltransfer of technology and the absence of this experience is concomitant to lack ofabsorptive capacity by the local sector (Radosevic, 1999). For example, in theSub-Saharan African region, host to the majority of least developed countries(LDCs), the conditions that stimulate technological assimilation (such as devel-oped human capital, adequate physical infrastructure and a dynamic business cli-mate) are absent, leading to constraints in mastering foreign, imported technologyas well as to compete in international markets (Mytelka, 1985; Lall & Pietrobelli,2002). The development of capacities and capabilities is key to both potentiallyattracting more FDI inflows as well as increasing the potential for MNE tech-nological spillovers tenable to industrial upgradation of the host economy.
28 Rajneesh Narula and Brian Portelli
18For example, the availability of a large stock of suitably qualified workers does not in itself resultin efficient absorption of knowledge, although the definition of human capital shares some common-ality with the concept of absorptive capacity.
Ch002.qxd 6/29/2007 10:08 AM Page 28

Moreoever, the improvement in location factors is an imperative path for hostcountries to undertake since the competition for the FDI among developing coun-tries is heavily intensifying (see, for example, Mytelka, 1996; Mudambi, 1998).An increasingly significant factor in influencing MNE location decisions is thepresence of sophisticated, created assets (in the form of developed human capitaland domestic firms’ technological capabilities) in host countries (Narula &Dunning, 2000; Noorbakhsh et al., 2001). It is therefore crucial, especially in thecontext of intense competition for the FDI that developing countries formulatepolicies that improve local skills and build human resource capabilities, in orderto be able to benefit most from FDI and MNE activity. For instance, Borenszteinet al. (1998) show that, at country level, a minimum threshold of absorptive capac-ity is necessary for the FDI to contribute to higher productivity growth, whileNarula and Marin (2003) show that only firms with high absorptive capacity arelikely to benefit from FDI spillovers. In other words, possessing educated peopleis a precondition for a country’s increased absorptive capacity, which contributesto enhanced productivity.
4. Conclusions
This article has reviewed and discussed some of the main empirical issues con-cerning the FDI and development, focusing on the emergence of MNE externali-ties and the potential of FDI-led growth. The last two decades have witnessed asurge in global FDI flows and developing countries are more eager than ever toattract such investment flows to their ailing economies. The surge in flows andpolicy fervour to the FDI in general has led to a reinforcement of the role of MNEsin host countries, as well as a renewed interest of policymakers in host developingcountries to maximise the benefits from the FDI towards long-term economicdevelopment. The contribution of the FDI to development is less controversial intheory than in practice, since it is theoretically plausible that the FDI provides achannel for capital injection, technology and knowledge transfer. This belief hasbeen reinforced by the successful industrial upgradation experience of newlyindustrialised countries, and has as a result fuelled the belief that the FDI is a sinequa non for development (Lall & Narula, 2006). However, notwithstanding theevidence that the FDI can have a potential contribution to both income growth andfactor productivity in host countries, it is increasingly evident that it complementsrather than substitute local factors tenable to economic development. It has beenargued that absorptive capabilities inter alia the level of human capital, matter for a positive impact of the FDI on host-country economic growth and MNEspillovers. Host countries cannot capture the full benefits associated with the FDI
Foreign Direct Investment and Economic Development 29
Ch002.qxd 6/29/2007 10:08 AM Page 29

until a threshold level of capabilities is reached. The importance of this thresholdabsorptive capacity level highlights the non-automatic interactions between theFDI and development in the host country. Realistically, countries at early stages ofeconomic development do not have fully developed created assets and hence theirlocation advantages are presumed to be insufficient to attract inward direct invest-ment, with the exception of the FDI arising from the possession of natural assets.Hence, whereas some ‘resource gaps’ in the host economy can be filled immedi-ately by the attracting of FDI flows (investment, production, employment, taxrevenue), other benefits inextricably linked to development such as knowledgeand technology upgrading take time to emerge or possibly never take place.19 Thedevelopmental impact of the FDI rests on the dynamics of the transfer of technol-ogy, but more importantly on the extent of integration of MNE affiliates in thehost-country systems and how much upgrading of local capabilities takes placeover time, since it is vital that foreign agents of dynamic comparative advantagemust complement rather than substitute local agents. The growth of MNEs andtheir dominance of certain sectors are often associated with their pre-eminentposition in the creation and ownership of technological assets. That developingcountries can benefit from spillovers accruing from MNE activity is not a disputedfact. However, it remains an assumption that MNE activity is a sine qua non foreconomic development, and that greater FDI flows will automatically result in thedissemination of these technologies and organisational practices from developedto developing countries.
References
Abramovitz, M. (1986). Catching up, forging ahead, and falling behind. Journal ofEconomic History, 46(2), 385–406.
Abramovitz, M. (1990). The catch-up factor in postwar economic growth. EconomicInquiry, 28, 1–18.
Abramovitz, M. (1995). The elements of social capability. In: D.H. Perkins, & B.H. Koo(Eds), Social capability and long-term growth. Basingstoke: Macmillan Press.
Aitken, B., & Harrison, A. E. (1991). Are there spillovers from foreign direct investment?Evidence from panel data for Venezuela. Mimeo, MIT and the World Bank, November.
Aitken, B., & Harrison, A. E. (1999). Do domestic firms benefit from direct foreign invest-ment? Evidence from Venezuela. American Economic Review, 89, 605–618.
Alfaro, L., & Rodriguez-Clare, A. (2003). Multinationals and linkages: An empiricalinvestigation. Inter-American Development Bank, November.
30 Rajneesh Narula and Brian Portelli
19See, for example, the discussion of static versus dynamic benefits from the FDI in Lall (2000).
Ch002.qxd 6/29/2007 10:08 AM Page 30

Alfaro, L., Areendam, C., Sebnem, K., & Selin, S. (2001). FDI and economic growth: Therole of local financial markets. Working Paper no. 01-083. Harvard Business School,Cambridge, MA.
Blalock, G., & Gertler, P. J. (2003). Technology diffusion and welfare effects from foreigndirect investment through supply chains. Discussion Paper, 7.20. Cornell University,Ithaca, NY.
Blomstrom, M. (1990). Transnational corporations and manufacturing exports fromdeveloping countries. New York: United Nations.
Blomstrom, M., & Kokko, A. (1997). How foreign investment affects host countries, policy research. Working Paper, The World Bank.
Blomstrom, M., & Kokko, A. (1998). Multinational corporations and spillovers. Journalof Economic Surveys, 12(3), 247–277.
Blomstrom, M., Kokko, A., & Zejan, M. (2000). Foreign direct investment: Firm and hostcountry strategies. London: Macmillan Press.
Blomstrom, M., & Persson, H. (1983). Foreign investment and spillover efficiency in anunderdeveloped economy: Evidence from the Mexican manufacturing industry. WorldDevelopment, 11, 493–501.
Blomstrom, M., & Sjoholm, F. (1999). Technology transfer and spillovers. Does local participation with multinationals matter? Department of Economics, Stockholm Schoolof Economics.
Borenzstein, E., De Gregorio, J., & Lee, J. W. (1998). How does foreign direct investmentaffect economic growth? Journal of International Economics, 45, 115–135.
Carkovic, M., & Levine, R. (2002). Does foreign direct investment accelerate economicgrowth? Working Paper Series, National Bureau of Economic Research, June.
Caves, R. E. (1982). Multinational enterprise and economic analysis. Cambridge: CambridgeUniversity Press.
Criscuolo, P., & Narula, R. (2002). A novel approach to national technological accumula-tion and absorptive capacity: Aggregating Cohen and Levinthal. MERIT ResearchMemorandum, 2002-16.
Dahlman, C., & Nelson, C. (1995). Social absorption capability, national innovation systems and economic development. In: Perkins, D & Koo, B. (Eds), Social capabilityand long-term growth. Basingstoke: Macmillan Press.
De Mello, L. R., Jr. (1999). Foreign direct investment-led growth: Evidence from timeseries and panel data, Oxford Economic Papers, 51, 133–151.
De Mello, L. R., Jr. (1997). Foreign direct investment in developing countries and growth:A selective survey. Journal of Development Studies, 34, 1–34.
Djankov, S., & Hoekman, B. (1999). Foreign investment and productivity growth in Czechenterprises, World Bank Economic Review, 14, 49–64.
Driffield, N., & Mohd. Noor, A. H. (1999). Foreign direct investment and local input linkages in Malaysia. Transnational Corporations, 83, 1–24.
Dunning, J., & Narula, R. (2004). Multinational and industrial competitiveness: A newagenda. Cheltenham: Edward Elgar.
Fosfuri, A., Motta, M., & Roende, T. (2001). Foreign direct investment and spilloversthrough workers’ mobility. Journal of International Economics, 53, 205–222.
Foreign Direct Investment and Economic Development 31
Ch002.qxd 6/29/2007 10:08 AM Page 31

Gershenberg, I. (1987). The training and spread of managerial know-how, a comparativeanalysis of multinational and other firms in Kenya. World Development, 15, 931–939.
Görg, H., & Greenaway, D. (2002). Much ado about nothing? Do domestic firms reallybenefit from foreign investment? CEPR Discussion Paper no. 3485.
Gorg, H., & Ruane, F. (1998). Linkages between multinationals and indigenous firms:Evidence for the electronics sector in Ireland. Trinity Economic Paper Series, TechnicalPaper no. 98/13.
Haddad, M., & Harrison, A. (1993). Are there positive spillovers from direct foreigninvestment? Evidence from panel data for Morocco, Journal of Economic Development,42, 51–74.
Hanson, G. (2001). Should countries promote foreign direct investment? Research Paperno. 9, Research Papers for the Intergovernmental Group of Twenty-Four on InternationalMonetary Affairs, UNCTAD, United Nations, New York and Geneva.
Hiemenz, U., Numme, P., & Spinanger, D. (1991). The international competitiveness ofdeveloping countries for risk capital. Tubingen: Kieler Studien, Ch. 8, p. 242.
Katz, J. (1987). Technology generation in Latin American manufacturing industries. NewYork: St. Martins Press.
Kokko, A. (1994). Technology, market characteristics and spillovers. Journal of DevelopmentEconomics, 43, 279–293.
Kokko, A., Zejan, M., & Tansini, R. (2001). Trade regimes and spillover effects of FDI:Evidence from Uruguay. Welwirtschaftliches Archiv, 137, 124–149.
Kokko, A, Tansini, R., & Zejan, M. (1996). Local technology capability and productivityspillovers from FDI in the Uruguayan manufacturing sector. Journal of DevelopmentStudies, 32(4), 602–612.
Lall, S. (1980). Vertical inter-firm linkages in LDCs: An empirical study. Oxford Bulletinof Economics and Statistics, 42, 209–222.
Lall, S. (1992). Technological capabilities and industrialization. World Development, 20,165–186.
Lall, S. (2000). FDI and development: Policy and research issues in the emerging context.Working Paper no. 43, QEH Working Paper Series, Queen Elizabeth House, Universityof Oxford.
Lall, S., & Narula, R. (Eds) (2006). FDI and its role in economic development: Do weneed a new agenda. In: Understanding FDI-assisted economic development. London:Routledge.
Lall, S., & Pietrobelli, C. (2002), Failing to compete. Technology development and technology systems in Africa. Edward Elgar, Cheltenham.
Lall, S., & Streeten, P. (1977). Foreign investment, transnationals and developing countries. London: Macmillan.
Liberatori, M., & Pigato, M. (2000). FDI through privatization in Sub-Saharan Africa.Mimeo, World Bank, Washington, DC.
Lim, E. G. (2000). Determinants of, and the relation between, Foreign Direct Investmentand growth: A summary of the recent literature. IMF Working Paper, Middle EasternDepartment, IMF. Washington DC, November 2001.
32 Rajneesh Narula and Brian Portelli
Ch002.qxd 6/29/2007 10:08 AM Page 32

McAleese, D., & McDonald, D. (1978). Employment growth and the development of link-ages in foreign-owned and domestic manufacturing enterprises. Oxford Bulletin ofEconomics and Statistics, 40, 321–339.
Mudambi, R. (1998). The role of duration in MNE investment attraction strategies.Journal of International Business Studies, 29(2), 239–262.
Mytelka, L. (1996). Locational tournaments, strategic partnerships and the state. Mimeo,Carleton University, Ottawa.
Mytelka, L. K. (1985). Stimulating effective technology transfer: The case of textiles inAfrica. In: Rosenberg, N., & Frischtak, C. (Eds), International technology transfer. NewYork: Praeger.
Narula, R. (1996). Multinational investment and economic structure. London: Routledge.Narula, R. (2003a). Globalisation and technology. Cambridge: Polity Press.Narula, R. (2003b). Understanding absorptive capacities in an innovation systems context:
Consequences for economic and employment growth. MERIT Research Memorandum,2004-003.
Narula, R., & Dunning, J. (2000). Industrial development, globalisation and multinationalenterprises: New realities for developing countries. Oxford Development Studies, 28,141–167.
Narula, R., & Marin, A. (2003). FDI spillovers, absorptive capacities and human capitaldevelopment: Evidence from Argentina. MERIT Research Memorandum, 2003–16.
Noorbaksh, F., Paloni, A., & Youssef, A. (2001). Human capital and FDI inflows to devel-oping countries: New empirical evidence. World Development, 29(9), 1593–1610.
Ozawa, T. (1992). Foreign direct investment and economic development. TransnationalCorporations, 1, 27–54.
Portelli, B. (2006), Foreign direct investment, multinational enterprises and industrialdevelopment. Knowledge transfer and backward linkages in Tanzania. PhD thesis,University of Oslo.
Portelli, B., & Narula, R. (2006). Foreign direct investment though acquisitions and impli-cations for technological upgrading. Case evidence from Tanzania. European Journal ofDevelopment Studies, 18, 59–85.
Radosevic, S. (1999). International technology transfer and catch-up in economic devel-opment. Cheltenham, UK: Edward Elgar.
Reisen, H., & Soto, M. (2001). Which types of capital inflows foster developing-countrygrowth, International Finance, 4(1), 1–14.
Reuber, G. L., Crookell, H., Emerson, M., & Gallais-Hamonno, G. (1973). Private foreigninvestment in development. Oxford: Clarendon Press.
Rodriguez Clare, A. (1996). Multinationals, linkages and economic development.American Economic Review, 86, 852–873.
Saggi, K. (2000). Trade, foreign direct investment and international technology transfer: A survey. World Bank. Policy Research Working Paper no. 2349.
Scott-Kennel, J. (2006). Foreign direct investment: A catalyst for local firm development?In: S., Lall, & R. Narula (Eds), Understanding FDI-assisted economic development.London: Routledge.
Foreign Direct Investment and Economic Development 33
Ch002.qxd 6/29/2007 10:08 AM Page 33

Slaughter, M. J. (2001). Skill upgrading in developing countries: Has inward foreigndirect investment played a role? FDI, Human Capital and Education in DevelopingCountries, Technical Meeting, 13–14 December, OECD, Paris.
Stewart, J. C. (1976). Linkages and foreign direct investment. Regional Studies, 10(2),245–258.
UNCTAD (2000). World investment report 2000 – Cross-border mergers and acquisitionsand development. New York: United Nations.
UNCTAD (2001). World investment report 2001 – Promoting linkages. New York: UnitedNations.
UNCTAD (2003). World investment report 2003 – FDI policies for development. Nationaland international perspectives. New York: United Nations.
UNCTC (1981). Transnational corporations linkages in developing countries: The case ofbackward linkages via subcontracting. New York: UNCTC.
Watanabe, S. (1983). Technology marketing and industrialization: Linkages between smalland large enterprises. New Delhi: Macmillan.
Xu, B. (2000). Multinational enterprises, technological diffusion, and host country productivity growth. Journal of Development Economics, 62, 477–493.
Zang, K. (2001). Does foreign direct investment promote economic growth? Evidencefrom East Asia and Latin America. Contemporary Economic Policy, 19(2), 175–185.
34 Rajneesh Narula and Brian Portelli
Ch002.qxd 6/29/2007 10:08 AM Page 34

Chapter 3
The Role of the Sectoral Composition ofForeign Direct Investment on Growth
Dilek Aykut and Selin Sayek
1. Introduction
Following the rapid increase in the 1990s, foreign direct investment (FDI) hasbecome the most stable and largest component of capital flows into developingcountries (World Bank, 2005). The second half of the 1990s also marked signif-icant changes in the sectoral distribution of FDI flows in many countries. In par-ticular, FDI flows in services rose to overtake FDI in manufacturing in severaldeveloped and developing countries (Figure 3.1). Such countries have made con-siderable progress in their investment and trade policies, opening up the servicessector to foreign participation and provoking a significant shift in the composi-tion of FDI towards services. Most of FDI in services has been directed toinfrastructure and financial sectors, in response to developing country effortsto privatize and liberalize these sectors. In fact, the share of these two sectors inFDI stock has reached to one-third in developed and almost 20 percent in devel-oping countries.
Although there is a significant increase in FDI in services sector globally, thesectoral compositions of FDI still vary significantly among countries dependingon the characteristics of the country and the policies related with the sector. Forexample, in East Asia and the Pacific — mostly led by China — and Canada,manufacturing sector is still the main sector, whereas in many African countriesthe primary sector continues to be the leading sector in the composition of FDI.In other countries, services sector has become the dominant sector.
Do Multinationals Feed Local Development and Growth?© 2007 by Elsevier Ltd.All rights of reproduction in any form reservedISBN: 978-0-08-045360-6
Ch003.qxd 6/29/2007 10:08 AM Page 35
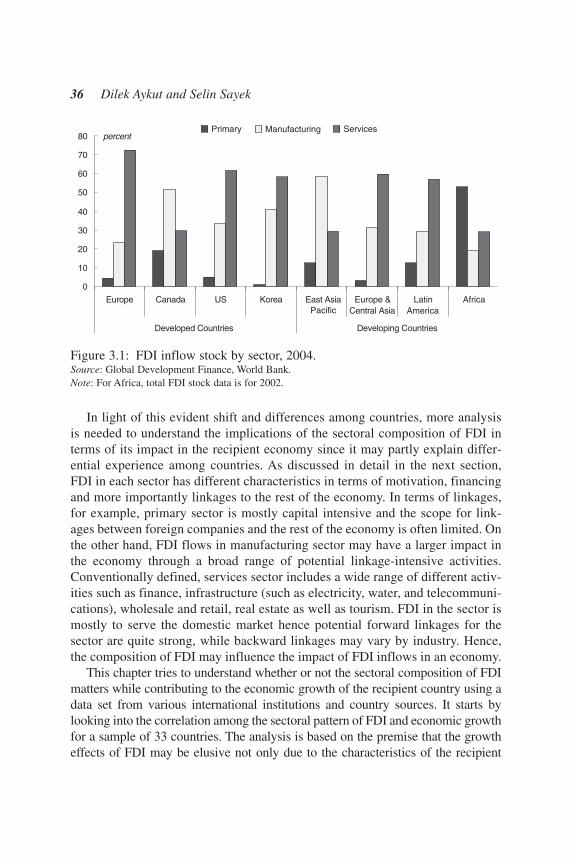
In light of this evident shift and differences among countries, more analysisis needed to understand the implications of the sectoral composition of FDI interms of its impact in the recipient economy since it may partly explain differ-ential experience among countries. As discussed in detail in the next section,FDI in each sector has different characteristics in terms of motivation, financingand more importantly linkages to the rest of the economy. In terms of linkages,for example, primary sector is mostly capital intensive and the scope for link-ages between foreign companies and the rest of the economy is often limited. On the other hand, FDI flows in manufacturing sector may have a larger impact inthe economy through a broad range of potential linkage-intensive activities.Conventionally defined, services sector includes a wide range of different activ-ities such as finance, infrastructure (such as electricity, water, and telecommuni-cations), wholesale and retail, real estate as well as tourism. FDI in the sector ismostly to serve the domestic market hence potential forward linkages for thesector are quite strong, while backward linkages may vary by industry. Hence,the composition of FDI may influence the impact of FDI inflows in an economy.
This chapter tries to understand whether or not the sectoral composition of FDImatters while contributing to the economic growth of the recipient country using adata set from various international institutions and country sources. It starts bylooking into the correlation among the sectoral pattern of FDI and economic growthfor a sample of 33 countries. The analysis is based on the premise that the growtheffects of FDI may be elusive not only due to the characteristics of the recipient
36 Dilek Aykut and Selin Sayek
Figure 3.1: FDI inflow stock by sector, 2004.Source: Global Development Finance, World Bank.Note: For Africa, total FDI stock data is for 2002.
0
10
20
30
40
50
60
70
80
Europe Canada US Korea East AsiaPacific
Europe &Central Asia
LatinAmerica
Africa
Developed Countries Developing Countries
percentPrimary Manufacturing Services
Ch003.qxd 6/29/2007 10:08 AM Page 36

economy, i.e. the absorptive capacity, but also due to the characteristics of the flowsthemselves. The appropriate measure of the sectoral composition of FDI is an openfield, and the chapter also tries to shed light by discussing alternative measurementsregarding the composition, its evolution, and also the absolute trends in the sectoralFDI flows.
The rudimentary correlation analysis we complete suggests that the sectoralcomposition of the FDI flows may play a significant role in influencing economicgrowth. Our empirical evidence also shows that both the level of FDI and the sec-toral composition of these flows are important contributors to economic growth.The results suggest that as the sectoral composition of FDI gets skewed towardsthe manufacturing sector, there is a significant and positive effect on economicgrowth. On the contrary, the results indicate that as the sectoral composition ofFDI gets skewed towards the services or the primary sector, there is a negativeand mostly insignificant effect on economic growth.
The rest of the chapter is organized as follows: the literature survey is providedin Section 2; details about the data and empirical results are presented in Section 3and Section 4 concludes the chapter.
2. The Literature Survey
The vast amount of literature on the impact of FDI on economic growth lacksrobust results, and the shift of the sectoral composition of FDI as well as its vari-ation among countries may partially explain that. The literature shows that thepositive impact of FDI is not immediate but FDI has generated positive spilloversand economic growth in some countries, some industries, and during some peri-ods.1 Although most macroeconomic studies support the positive growth impactof FDI, they only identify the linkage in combination with other factors. Some ofthese factors are related to the ‘absorption’ capacity of the country that receivesthe foreign investment, such as level of development (Blomstrom, Lipsey, &Zejan, 1994), or endowment of human capital (Borensztein, de Gregorio, & Lee,1998). Other studies highlight the importance of supportive business environmentin the country in order to convert the technology and knowledge spillovers fromFDI into economic growth. For example, factors such as trade openness(Balasubramanyam, Salisu, & Sapsford, 1996) or domestic financial marketdevelopment (Alfaro, Chanda, Kalemli-Ozcan, & Sayek, 2004) are shown to be
The Role of the Sectoral Composition of FDI on Growth 37
1See Caves (1996) for an extended discussion on multinational enterprises (1996), their evolution andeffects. Furthermore, see Lipsey (2002) and Lim (2001) for an extended literature survey on the rela-tionship between the FDI and economic growth.
Ch003.qxd 6/29/2007 10:08 AM Page 37

crucial. Although these and many other studies indicate that FDI can generateoverall economic growth when certain conditions are in put, there is also a strandof studies arguing that the effect of FDI on economic growth tends to be weak andmost of these studies suffer from reverse causality (Rodrik, 1999; Carkovic &Levine, 2003). Firm-level studies add more doubt to the dispute since some stud-ies fail to find significant positive effect of foreign presence in the industry (Aitken& Harrison, 1999; Djankov & Hoekman, 2000; Konings, 2001), whereas someothers provide convincing evidence of positive spillovers (Keller & Yeaple, 2003;Javorcik, 2004).2
Theoretically, FDI is expected to contribute to economic growth by providingmuch-needed capital in productive areas of the economy. In addition, FDI isbelieved to generate additional impact through externalities in the form of tech-nology transfers and spillovers. The externalities may lead to improvements inproductivity and efficiency in many ways. When the foreign firm is more effi-cient than the domestic firms, domestic firms can improve their productivity bycopying the technology and management skills of the foreign firm as it penetratesthe market. Even if the foreign firm is not more efficient, domestic firms mightbe forced to improve their efficiency because of the increased competition fromforeign firms — through so-called horizontal spillovers. This said, the increasedmarket share of the foreign company might also crowd out the domestic firms andpush them to less efficient production levels. However, the potential positiveimpact is not limited to the industry that receives the FDI; it may be diffused to the rest of the economy through the interactions with local suppliers and consumers — backward and forward linkages, respectively. When the necessaryconditions are in put, the aggregate positive spillovers may further accelerate theeconomic growth of the country. The impact of FDI may obviously vary greatlydepending on characteristics of the sector and its linkages to the rest of the econ-omy. As discussed earlier, the linkage potential differs across the primary, manu-facturing and services sectors. There are various other sector specific factors thatmay influence the impact of foreign investment, ranging from motivation tofinancing of the investment. In addition, different sectors may require differentconditions to cause positive impact in the economy.
The impact of FDI in primary sector, for example, is not always expected to bepositive. Major part of FDI in primary sector comes as mega-projects with hugeamounts of capital flowing into a country. These projects have limited linkages to
38 Dilek Aykut and Selin Sayek
2Each study uses data for different countries. See Görg and Strobl (2001) for an extended literaturesurvey on firm level studies. Furthermore, while earlier studies concentrated on identifying horizon-tal spillovers, the more recent studies have focused on identifying the vertical spillovers. The differ-ence as such could explain the differential results obtained in the literature.
Ch003.qxd 6/29/2007 10:08 AM Page 38

domestic economy as they usually use few local intermediate goods and aremostly export-oriented. In addition, FDI flows to the sector tend to be morevolatile (World Bank, 2005). Most investments are large and sensitive to worldcommodity prices. Also, in general the financing composition is highly skewedtowards intercompany loans. Domestic ownership requirement (or restriction onforeign ownership) encourages intercompany loans while limiting the equitycomponent of FDI and intercompany loans tend to be as volatile as private debtflows (World Bank, 2004c). In addition, high resource flows to the sector tend toreduce the competitiveness of the country in other sectors (Dutch disease),increase rent-seeking behavior, and could cause deterioration of institutions(Sachs & Warner, 2001; Sala-i-Martin & Subramanian, 2003). This might be par-ticularly problematic for countries with high reliance on the sector. On the otherhand, investment in the sector might be particularly important for many countrieswith insufficient capital and technology. Furthermore, the sector usually bringslarge foreign currency earnings, contributing to balance of payments financing.The overall effect depends on whether the positive or negative effects outweigh.In fact, a negative economic impact is not the inevitable outcome. In the presence of solid institutions, there is anecdotal evidence that FDI in pri-mary sector may generate positive impact in a country.3
Contrary to primary sector, FDI in manufacturing sector has much largerpotential to affect the recipient economy as the linkages to the recipient econ-omy are better defined. Foreign firms in manufacturing sector invest rather thanexport to a country for either efficiency-seeking or market-seeking purposes, ora combination of both. When it is purely efficiency seeking, FDI is more likelyto bring in the technology and know-how that is compatible with the country. It usually generates significant employment and provides training. Foreign firmusually use some level of local intermediate products. Hence, FDI has signifi-cant horizontal and backward linkages. In addition, foreign company exportsincrease the total exports, and in turn the foreign currency receipts of the country.This said, these linkages are less significant when FDI comes through enclavetype of arrangements, such as export-processing zones, and the possibility of thecrowding out effect increases as foreign firms also serve the domestic market. In summary, FDI in manufacturing is expected to have significant impact in the recipient economy, where the direction of effect depends on the conditionsenlisted above.
The Role of the Sectoral Composition of FDI on Growth 39
3With strong policy and right institutional framework, Botswana has become a middle-income coun-try within one generation by the help of large FDI flows into its diamond and other mining industries.Export receipts and government revenues boosted by the FDI were invested wisely to create initialmomentum in economic growth (UNCTAD, 2003; Coolidge & Rose-Ackerman, 1997).
Ch003.qxd 6/29/2007 10:08 AM Page 39

Unlike the primary and manufacturing sectors, where output is tradable, serv-ices are mostly nontradable and require close proximity between producers andconsumers.4 Therefore, much of the FDI in the sector is market-seeking, whereforward linkages of FDI are well defined and potential impact of FDI in the sec-tor is immense. For example, in the highly capital-intensive infrastructure sector,FDI can provide the necessary funding and technology to improve capacity tomeet increasing demand, as well as improve the quality and lower the cost of theservices. In the same vein, FDI in the banking sector can have an importantimpact on both the efficiency and stability of the banking system throughincreased competition and increased access to global financial markets.5 If FDI inthe sector improves these services in a country, almost all other sectors will bepositively affected. However, FDI in the sector may also have notable negativeeffects. It has significant crowding-out potential. Due to less than competitivemarket structure and capital intensity of the main industries in the sector, foreigninvestors command superior market power. Hence, the impact of FDI is highlydependent on the existence of an appropriate and stable regulatory system thatmaintains appropriate incentives for foreign investors to improve the supplycapacity and ensure the provision of services in infrastructure and banking sec-tors. In addition, most of the FDI in the sector come through mergers and acqui-sitions in developed countries and privatization deals in developing countriesboth of which are not necessarily associated with new investments (Klein, 2000).Moreover, with the exception of business services and tourism, FDI in servicesdo not generate foreign currency; instead, companies repatriate their earningsperiodically.
The number of empirical studies that cast the relationship of FDI in differentsectors and its impact on growth is slim due to data limitations. Almost all firm-level studies mentioned above use manufacturing-sector data without conclusiveresults. Existing literature on the impact of services sector FDI usually looks atthe impact of liberalization in the services sector. For instance, privatization andincreased competition in the telecommunications sector has increased the capac-ity and reliability of services in developing countries depending on theirsequence of occurrence (Carsten, Mattoo, & Rathindran, 2002). Country casestudies highlight the importance of an appropriate regulatory system for positive
40 Dilek Aykut and Selin Sayek
4Not all services are nontradable or require physical proximity. For example, some information-technology services (software programming, database, and customer support) and business processservices (call centers) are not location-bound and can be provided without proximity to customers.However, with exceptions in mind, services are conventionally portrayed as intangible, invisible, andperishable, requiring simultaneous production and consumption.5See Goldberg (2004) for a discussion on the FDI in the financial sector.
Ch003.qxd 6/29/2007 10:08 AM Page 40

impact of liberalizations in infrastructure sector.6 Similarly in banking sector, foreign-owned banks are typically found to have better-quality loan portfolios,higher net worth, and a higher ratio of income to costs than domestic banks(Clarke, Cull, D’Amato, & Molinari, 2000) and the efficiency of the sectorincreases by penetration of the foreign companies (Claessens, Demirgüç-Kunt, &Huizinga, 2001). The findings suggest that effective supervision and regulationof domestic financial markets are important to ensure the benefits of foreign entryin financial markets (World Bank, 2001; International Monetary Fund, 2000).The analysis closest to ours in spirit is where Alfaro (2003) studies the differen-tial growth effects of FDI to these broad categories of sectors by analyzing thecontribution of increased FDI to each sector on economic growth. Along theselines Chakraborty and Nunnenkamp (2006) study the role of FDI in generatingincreased economic activity in the sector in which it occurs, as well as the over-all economy using sectoral FDI data for India. As will be discussed below, theapproach followed in this chapter differs from the one explored in both papers,where rather than testing for the role of the level of FDI to each sector we hypoth-esize that it is the composition of FDI flows alongside aggregate FDI inflows thatinfluence the growth prospects of the host country.
3. Data and Empirical Investigation
In this section, we describe the data that will be used in the analysis, specifically themeasures of the sectoral composition of FDI, the levels of FDI, economic growth,and a number of control variables commonly used in the growth regressions. InSection 3.1, alternative ways of measuring the sectoral composition and pattern ofFDI are discussed, whereas in Section 3.2 the variables used in the econometricgrowth analysis are introduced.
3.1. Sectoral Pattern of FDI
Sectoral FDI data is collected from the U.N. Economic Commission for LatinAmerica and the Caribbean, based on country sources for Latin American
The Role of the Sectoral Composition of FDI on Growth 41
6In Peru, lack of such a framework led to increased prices of telecom services as well as uneven pro-vision of services to poorer parts of the country. In Argentina, Mexico, and Venezuela, despite thesharp increase in investments in the telecom sector immediately after privatization, the capacity of thesector subsequently fell below the regional average (UNCTAD, 2004). In the electricity sector, Chilesuffered an energy crisis in 1998 due to weaknesses in their regulatory and institutional frameworks(Gabriele, 2004). In 2004, Argentina also experienced electricity shortages following the problemsthat arose after the government imposed the price freeze in 2002.
Ch003.qxd 6/29/2007 10:08 AM Page 41

countries; National Bureau of Statistics of China; ASEAN for other Asiancountries; and OECD, UNCTAD, and country sources for other countries. Theofficial institutions (International Monetary Fund and OECD) recommendUnited Nations International Standard Industrial Classifications (ISIC) to beused (see the appendix) but in each country classification may vary to someextend. Though the international classification standards are implemented inthe data collection by national authorities, the fact that the analysis givenbelow uses data collected from various sources requires that one keeps thisdrawback in mind when interpreting the results.
Two alternative routes can be taken in depicting the sectoral pattern of FDIflows; one focuses on the magnitude of the absolute level of FDI flows in each sec-tor, while the alternative focuses on the relative level of FDI flows in each sector.In more detail, the former measures depict the extent of FDI flows in a certain sec-tor, scaled by an alternative size measure. For example, one could look at the FDIflows to a sector as a share of the GDP or alternatively as a share of the economicactivities in that specific sector. Given the objective of correlating these alternativemeasures of sectoral FDI patterns with economic growth we start by discussingsimple correlations among these alternative measures.
Studying the relationship between economic growth and these absolute pat-terns of sectoral FDI flows provides insight into the differential contribution ofeach sector’s investment to economic growth.7 Figures 3.2a–3.2c show the simplecorrelation between the FDI in each sector as a share of that sector’s GDP and theoverall economic growth rate. The figures are suggestive of a positive relation-ship between economic growth and all types of FDI, regardless of the sector ofinvestment. However, the correlation coefficients are statistically insignificant,suggesting that in fact, statistically, there is no correlation between FDI and eco-nomic growth, regardless of the sector in which FDI occurs. With no implicationof statistical significance though, one observes a slightly stronger relationshipbetween services sector FDI and economic growth, with the simple correlationsbeing 8%, 10%, and 18% between economic growth and the primary sector FDI,manufacturing sector FDI, and services sector FDI, respectively.8 In an effort toidentify possible directions of relationship, the figures are based on the imputa-tion of the average of FDI flows in each sector between 1996 and 1999 and the
42 Dilek Aykut and Selin Sayek
7Alfaro (2003) undertakes such an analysis, and finds that manufacturing FDI contributes positivelyand significantly to economic growth, whereas FDI in the primary sector contributes negatively toeconomic growth and the FDI in the services sector does not contribute significantly to economicgrowth.8No weight is attached to these magnitudes, given the simple nature of the correlations, where no othercontrolling factor is taken into account.
Ch003.qxd 6/29/2007 10:08 AM Page 42
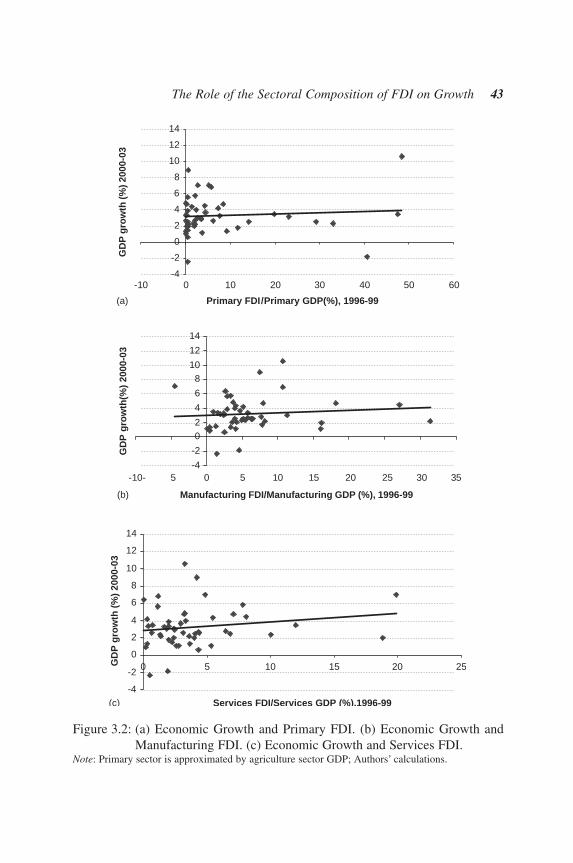
The Role of the Sectoral Composition of FDI on Growth 43
Figure 3.2: (a) Economic Growth and Primary FDI. (b) Economic Growth andManufacturing FDI. (c) Economic Growth and Services FDI.
Note: Primary sector is approximated by agriculture sector GDP; Authors’ calculations.
-4
-2
0
2
4
6
8
10
12
14
-10 0 10 20 30 40 50 60
Primary FDI/Primary GDP(%), 1996-99
GD
P g
row
th (%
) 200
0-03
-4
-2
02
4
6
810
12
14
-10- 5 0 5 10 15 20 25 30 35
Manufacturing FDI/Manufacturing GDP (%), 1996-99
GD
P g
row
th(%
) 20
00-0
3
-4
-2
0
2
4
6
8
10
12
14
0 5 10 15 20 25
Services FDI/Services GDP (%),1996-99
GD
P g
row
th (
%)
2000
-03
(a)
(b)
(c)
Ch003.qxd 6/29/2007 10:08 AM Page 43

averages of economic growth between 2000 and 2003. This allows us to rule outthe possibility of economic growth in a country attracting more FDI in each sec-tor, and is suggestive of a possible causal relationship from the FDI flows to eco-nomic growth.
The correlation between overall economic growth and the FDI flows to eachsector does not differentiate between the possibilities of horizontal or verticalspillovers. Depending on the relative magnitude as well as the sign of these link-ages, FDI can have different impact in the sector that receives the investment andthe overall economy. As discussed earlier, the immediate effect of FDI is expectedto be in the recipient sector through effects such as increased investment andhigher competition for the domestic firms among others. Moreover, through theinteractions with the suppliers and consumers — which vary among sectors, FDIcan affect the rest of the economy. To gauge such differential effects, we comple-ment the above discussion by looking into the correlation between the same meas-ures of FDI flows in each sector with the growth of economic activity in therelevant sector.
The simple correlations in Table 3.1 are suggestive that the positive correlationbetween the sectoral FDI flows and the sectoral economic growth prevails, thecomparative magnitudes of the simple correlations seem to be different from thosewith the overall economic growth. However, similar to the above-reported corre-lation coefficients, none of those in Table 3.1 are statistically significant, whichsuggests a lack of any correlation of either within sector growth and FDI specificto that sector or FDI in any sector and economic growth. As above, though withno statistical significance discussion, the simple correlation between primary sec-tor FDI and growth in the primary sector GDP is 10%, while simple correlationbetween manufacturing sector FDI and growth in the manufacturing sector GDPis 12% and the simple correlation between services sector FDI and growth in theservices sector GDP is the lowest at 7%. Interestingly, however, these correlations
44 Dilek Aykut and Selin Sayek
Table 3.1: Simple correlations between the sectoral FDI inflows and economicgrowth.
Sectoral OverallGDP growth GDP growth(2000–2003) (2000–2003)
Primary FDI/primary sector GDP (1996–99) 0.104 0.084Manufacturing FDI/manufacturing sector GDP
(1996–99) 0.120 0.097Services FDI/services sector GDP (1996–99) 0.068 0.175
Ch003.qxd 6/29/2007 10:08 AM Page 44
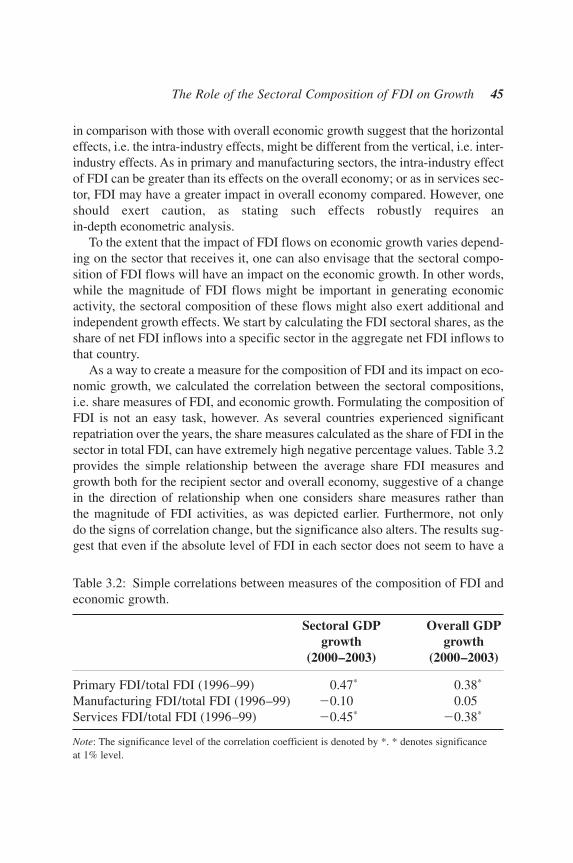
in comparison with those with overall economic growth suggest that the horizontaleffects, i.e. the intra-industry effects, might be different from the vertical, i.e. inter-industry effects. As in primary and manufacturing sectors, the intra-industry effectof FDI can be greater than its effects on the overall economy; or as in services sec-tor, FDI may have a greater impact in overall economy compared. However, oneshould exert caution, as stating such effects robustly requires an in-depth econometric analysis.
To the extent that the impact of FDI flows on economic growth varies depend-ing on the sector that receives it, one can also envisage that the sectoral compo-sition of FDI flows will have an impact on the economic growth. In other words,while the magnitude of FDI flows might be important in generating economicactivity, the sectoral composition of these flows might also exert additional andindependent growth effects. We start by calculating the FDI sectoral shares, as theshare of net FDI inflows into a specific sector in the aggregate net FDI inflows tothat country.
As a way to create a measure for the composition of FDI and its impact on eco-nomic growth, we calculated the correlation between the sectoral compositions,i.e. share measures of FDI, and economic growth. Formulating the composition ofFDI is not an easy task, however. As several countries experienced significantrepatriation over the years, the share measures calculated as the share of FDI in thesector in total FDI, can have extremely high negative percentage values. Table 3.2provides the simple relationship between the average share FDI measures andgrowth both for the recipient sector and overall economy, suggestive of a changein the direction of relationship when one considers share measures rather than the magnitude of FDI activities, as was depicted earlier. Furthermore, not only do the signs of correlation change, but the significance also alters. The results sug-gest that even if the absolute level of FDI in each sector does not seem to have a
The Role of the Sectoral Composition of FDI on Growth 45
Table 3.2: Simple correlations between measures of the composition of FDI andeconomic growth.
Sectoral GDP Overall GDPgrowth growth
(2000–2003) (2000–2003)
Primary FDI/total FDI (1996–99) 0.47* 0.38*
Manufacturing FDI/total FDI (1996–99) �0.10 0.05Services FDI/total FDI (1996–99) �0.45* �0.38*
Note: The significance level of the correlation coefficient is denoted by *. * denotes significance at 1% level.
Ch003.qxd 6/29/2007 10:08 AM Page 45

statistically significant correlation with the economic growth performance of thesector or the overall economy, the sectoral composition of FDI flows might havea statistically significant, and possibly different sign and size of correlation witheconomic performance. These preliminary results are indicative of a positive, zero,and negative correlation between a sectoral composition of FDI skewed towardsmore primary, manufacturing, and services sectors, respectively, and both sectoraland overall economic growth performance.
Another way to eliminate these outliers that are mostly due to high levels ofrepatriation of earnings, is to impute the share of each sector’s net FDI inflowsas a share of the absolute value of net FDI flows. This imputation is based onthe premise that the share of the net inflows in the total value of FDI-relatedtransactions, not whether the flows are net positive or negative inflows, is impor-tant. For example, assume there is a 100 unit net FDI inflows in the manufac-turing sector, no FDI inflows in the primary sector, and �200 units of net FDIinflows (on account of repatriations) in the services sector. The total absolutevalue of net FDI transactions are taken as 300 units, where the share of manu-facturing sector is 33% and the share of services sector is imputed as �66%.Higher absolute values of this sectoral share measure should be interpreted assuggesting increased extent of foreign firm activity, whether it is an inflow in thecurrent period or a repatriation of previous inflow-related economic returns. Thesame observations discussed for Table 3.2 are evident in the analysis using thesealternative sectoral composition measures, as can be seen from Table 3.3, whichreport the correlations among this alternative sectoral composition measure andeconomic growth.
46 Dilek Aykut and Selin Sayek
Table 3.3: Simple correlations between alternative measures of the compositionof FDI and economic growth.
Sectoral GDP Overall GDPgrowth growth
(2000–2003) (2000–2003)
Primary FDI/absolute value of the total 0.48* 0.39*
FDI (1996–99) Manufacturing FDI/absolute value of the �0.10 0.08
total FDI (1996–99)Services FDI/absolute value of the �0.48* �0.42*
total FDI (1996–99)
Note: The significance level of the correlation coefficient is denoted by *. * denotes significance at1% level.
Ch003.qxd 6/29/2007 10:08 AM Page 46
The above exercise highlights the importance of the composition of FDI inorder to understand its impact on growth, but also the importance of the choiceof the measure of this pattern. Both the interpretation and the implications of theanalysis may differ depending on the measure used in the analysis. In Section 4,we limit the econometric analysis to one of these above-discussed measures, andwarn the reader against generalizing these results as they are limited by the choiceof the measure capturing the pattern of the sectoral FDI flows.
3.2. Econometric Specification and Control Variables
The purpose of our empirical analysis is to examine the differential growth effectsof FDI in the three main sectors of investment, namely, primary, manufacturing,and services sector. In other words, we are investigating the effects of not only thelevel of FDI inflows on the economic growth of the host economy, but also the pos-sible effects of the sectoral composition of these FDI flows. In doing so, the exer-cise below is based on a growth regression analysis, where alongside the extent ofFDI and its sectoral composition several control variables are included.
The empirical growth analysis literature is abundant. However, in an influentialpaper, Mankiw, Romer, and Weil (1992) (MRW) derive an empirical specificationbased on the assumption that countries are unlikely to be at their steady states, andtherefore transitional dynamics should be more important. In this vein we followthe same specification. We study the direct effect of the level of FDI flows, as wellas the direct effects of the sectoral composition of these FDI flows on economicgrowth. Therefore, based on MRW, we estimate the following equation:
(1)
The choice of the control variables is based on previous economic growthstudies.9 The growth rate of output is measured as the growth of real per capitaGDP in constant dollars; data are obtained from the World Bank (2004b). FDI isalso taken from the World Bank, World Development Indicators database, meas-ured as the net FDI inflows. The net FDI inflows measure the net inflows ofinvestment to acquire a lasting management interest (10% or more of votingstock) in an enterprise operating in an economy other than that of the investor. Itis the sum of equity capital, reinvestment of earnings, other long-term capital, andshort-term capital as shown in the balance of payments.
Growth InitialGDP FDI FDI comp Controli i i i i i� � � � � �� � � � � �0 1 3 4 5_
The Role of the Sectoral Composition of FDI on Growth 47
9For a detailed overview of the theory and the evidence regarding economic growth, see Barro andSala-i-Martin (1995).
Ch003.qxd 6/29/2007 10:08 AM Page 47

The control variables for the econometric analysis are complied from varioussources. Gross domestic investment measure consists of the outlays on additionsto the fixed assets of the economy plus net changes in the level of inventories.Macroeconomic stability is proxied by inflation, measured as the percentagechange in the GDP deflator. The financial market depth is measured by either theshare of money and quasi-money in GDP (M2 as a share of GDP), as the share ofprivate sector credit of the whole financial sector in GDP, or as a share of privatesector credit extended by only deposit banks as a share of GDP. Openness tointernational trade is measured as the ratio of the sum of exports plus imports tototal output. Government consumption is captured by the ratio of central govern-ment expenditure as a share of GDP. All of these data are obtained from WorldBank’s (2004) World Development Indicators.
The institutional stability and quality in the economies are proxied by usingdata from the International Country Risk Guide (ICRG). The ICRG reports dataon the risk of expropriation, level of corruption, the rule of law, and the bureau-cratic quality in an economy, and is a monthly publication of Political RiskServices.
Finally, human capital is measured as the ‘average years of secondary schooling’,obtained from Barro and Lee (1996). Table 3.4 provides a list of the variables in-cluded in the analysis, for which a detailed description and sources are provided inthe appendix.
48 Dilek Aykut and Selin Sayek
Table 3.4: List of variables.
Dependent variable: ● Real GDP per capita growth rate
Independent variables: ● FDI sectoral composition indicators● Net FDI inflows (as a share of GDP)
Control variables: ● Initial real GDP per capita● Government consumption (as a share of GDP)● Domestic investment (as a share of GDP)● Liquid liabilities (as a share of GDP)● Inflation rate● Human capital● Openness● Corruption● Regional dummy variables
Ch003.qxd 6/29/2007 10:08 AM Page 48
3.3. Empirical Findings: Cross-Sectional Analysis
As discussed above, based on MRW, we estimate equation (1) as stated above:
(1)
Initially a cross-sectional analysis is undertaken, where the analysis is carriedout for the period 1990–2003. As discussed in the previous sections, a priori weexpect the manufacturing sector to play a positive role in generating growth, theprimary sector to play a negative role in generating growth, and are ambiguousabout the effect of the services sector on growth. Since the sum of the three sec-toral share measures constructed adds up to one, only two are included in eachregression. The pair combination choice is driven by the correlation among thethree sectoral shares; given the very high negative correlation among the servicesand manufacturing share measures, we include one or the other in the analysis.Table 3.5a reports the findings when we include manufacturing and primary sec-tor shares, while Table 3.5b reports the findings when we include services andprimary sector shares.
Table 3.5a shows results for a selection of control variables that are widelyused in the empirical growth literature. These controls include, but are not lim-ited to, initial income, financial market depth, level of openness, inflation rate,quality of institutions, and government spending. In column I, we control for the initial level of economic activity and expect to find a negative effect onaccount of conditional convergence. The result is as expected, suggesting thevalidity of a conditional convergence, where the poorer countries grow faster.We also control for the depth of local financial markets and, as discussed in Kingand Levine (1993) and many others, we expect to find a positive effect ongrowth. As expected we find that deeper the local financial markets are, higherthe growth rate is across countries. Furthermore, in column I we find that FDIlevel itself does not have a significant effect on economic growth, whereas thecomposition of these FDI flows are found to be significant. We find a positiveeffect of increased shares of manufacturing FDI in total FDI on economicgrowth and a negative effect of increased shares of the primary sector in FDI ongrowth.
The negative effect of a change in the composition of FDI flows in favor ofthe primary sector suggests that the above-discussed negative effects outweighthe possible positive effects of increased capital stock in capital-deficienteconomies. This result can be interpreted as the negative effect of extractiveindustries on economic growth. Three possible factors that could be driving this
Growth InitialGDP FDI FDI comp Controli i i i i i� � � � � �� � � � � �0 1 3 4 5_
The Role of the Sectoral Composition of FDI on Growth 49
Ch003.qxd 6/29/2007 10:08 AM Page 49

50D
ilek Aykut and Selin Sayek
Table 3.5a: Growth effects of the sectoral composition of FDI inflows Dependent variable: Growth of Real GDP percapita (1990–2002).
Independent variable I II III IV V VI VII
Initial income �0.95 �1.03 �1.13 �1.53 �1.03 �1.36 �0.20�2.21** �2.42** �2.68** �2.64** �2.21** �2.37** �0.48
Share of manufacturing 0.001 0.002 0.002 0.001 0.002 0.001 0.001FDI in total FDI 2.07** 2.03** 2.07** 1.60* 1.68* 1.78* 1.72*
Share of primary sector �0.01 �0.02 �0.02 �0.02 �0.03 �0.02 �0.01FDI in total FDI �1.77* �1.89* �2.27** �2.01** �2.61** �2.05** �0.60
FDI as a share of GDP 0.15 0.27 0.39 0.31 0.42 0.34 0.381.17 1.41 1.82* 1.49 2.01** 1.67* 2.47**
Financial Markets 1.62 0.83 1.33 1.70 1.07 1.91 0.342.01** 2.17** 1.74* 2.56** 1.20 3.13*** 0.57
Openness — �0.84 �1.35 �1.51 �1.02 �1.48 �2.05— �1.23 �1.84* �2.16** �1.18 �2.14** �4.27***
Inflation — — �0.004 �0.004 �0.004 — �0.005— — �3.35*** �2.67** �3.27*** — �4.70***
Institutions — — — 0.47 — 0.72 —— — — 1.53 — 2.28** —
Transition — — — — �1.18 — —— — — — �1.91* — —
Government — — — — — �0.11 0.00— — — — — �1.78* 0.01
Investment — — — — — — 0.28— — — — — — 3.26***
R2 0.34 0.38 0.49 0.56 0.51 0.60 0.68Number of observation 39 39 39 38 39 38 39
Note: This table excludes the services share in the total FDI. We included initial human capital in the regressions and the results remained qualita-tively unchanged. Institutions are measured using the corruption index from the ICRG FDI as a share of GDP and the financial markets indicators arelogged. Liquid liabilities are used as the financial market indicators. The significance level of the correlation coefficients are denoted by *,**, and ***.* denotes significance at 10% level, ** denotes significance at 5% level, and *** denotes significance at 1% level.
Ch003.qxd 6/29/2007 10:08 AM Page 50

The Role of the Sectoral Composition of FDI on Growth 51
negative effect can be discussed. First of all, foreign investment in such industriescould create a crowding out effect for the domestic firms. Such crowding outcould change the market structure of the industry, increasing inefficiencies due tohigh concentration rates of ownership. Furthermore, such market structure alter-ations could increase rent-seeking activity and could cause significant deterio-ration in the institutions of the local economy. This crowding out effect can alsobe interpreted as a Dutch Disease problem, where significant inflows in such natural resource-related industries could alter the real exchange rate and createnegative incentives for production in the tradable goods sectors (Sachs & Warner,2001; Sala-i-Martin & Subramanian, 2003). In addition, the investment usuallycomes in the form of intercompany loans, rather than long-term investmentequity component. This adds to the volatility of the investments, and given thelarge share of such investments in gross capital formation and their influence on exchange rates, volatility may cause further economic difficulties in somecountries.
The positive effect of a change in the composition of FDI flows in favor of themanufacturing sector is as expected. The manufacturing sector investments areexpected to create more backward and forward linkages in the local economy bynature. Production of final goods in the manufacturing industry could createbackward linkages with the local producers via demand for locally supplied inter-mediary inputs, through the turnover in the local labor market, and connectionsbuilt through possible outsourcing activities. Such positive spillover effects arefound in some micro-based analysis of the effect of FDI on the local economy,where most of these studies are limited to the manufacturing sector itself.
In columns II through VII, additional control variables are included in theanalysis. The findings regarding the composition of FDI are robust to the inclu-sion of additional control variables, except for the change in the significance levelof the share of primary sector variable in column VII. The impact of the level ofFDI, parallel to the findings of the literature, although always positive has a sig-nificance level that is not robust across specifications. However, generally speak-ing, the results reported in Table 3.5a suggest a positive and significant effect ofFDI levels on growth, regardless of the composition of the foreign investmentflows. They also suggest that the composition plays a significant role in influ-encing economic growth, with a positive effect of a compositional change favor-ing manufacturing and negative effects of a compositional change favoring theprimary sector.
In column II, we add the level of openness of the economy, measured as theratio of the sum of export and imports to GDP. Although insignificant, we findthat the effect of increased openness on growth is negative. In column III, weinclude the inflation rate, as a proxy for macroeconomic instability. As expected,
Ch003.qxd 6/29/2007 10:08 AM Page 51

52 Dilek Aykut and Selin Sayek
we find a negative and significant effect of inflation on economic growth. Thisfinding is robust across regressions. In column IV, we include a measure of insti-tutional quality, measured as corruption. We expect a positive relationship onaccount of the measurement of the index. As expected, there is a positive effectof less corruption on economic growth, however the significance level is notfound to be robust. In column V, we test for regional differences in the growthpatterns of economies in our sample. Given the increased role of FDI in the tran-sition economies over the past decade we include a dummy to capture theseeconomies. We find that there is a significant regional effect. In column VI, weinclude the government-spending variable, expecting a negative effect. Finally incolumn VII, we control for domestic investment to ensure that the finding of apositive effect of FDI on growth is not driven by the omission of domestic invest-ment from the analysis. We find that the effect of FDI on growth is in fact strength-ened, as well as a positive impact of domestic investment on growth. The onlyresult that changes is the significance of the primary sector share in total FDI,which becomes insignificant but continues to play a negative role. This findingrequires further analysis.
Table 3.5b runs the same regressions with the services and the primary sectorshares variables, replacing the manufacturing sector share with services sectorshare. The finding of the negative effect of primary sector FDI is robust to theinclusion of the manufacturing or services sector in the analysis, as is evident inthe negatively significant coefficient on the primary sector share measure in bothTables 3.5a and 3.5b. As expected from the highly negative correlation betweenthe share of manufacturing and services sectors in FDI, we find that a change inthe composition of FDI flows in favor of the services sector creates a detrimentaleffect on economic growth. This finding is robust across regressions with differ-ent sets of control variables, as is evident from Table 3.5b.
The negative effect of the services sector FDI on economic growth can beexplained by the nature of such investments. Although, investment in the servicessector are dominantly in non-traded goods which seem to have very strong for-ward linkages to the local economy, different sub-sectors within the servicesindustry could play different roles in influencing domestic growth. The FDI activ-ity in infrastructures was mostly driven by privatization-led mergers and acquisi-tions (M&As), which do not necessarily increase the total investment in the localeconomy. Similarly, as discussed above, pricing behavior of multinational enter-prises (MNEs), and the status of the institutional and regulatory environment inthe local economy could generate a dominating negative effect of the servicessector FDI on economic growth. Foreign investments in the banking sector areusually found to exert a positive effect on the efficiency of the financial systembut with no link to the local economic growth.
Ch003.qxd 6/29/2007 10:08 AM Page 52

The Role of the Sectoral Composition of FDI on Growth 53
4. Conclusions
FDI flows have increased significantly over the past decade, especially theinflows to developing countries. This phenomenon is the result of the joint influ-ences of both demand and supply side factors. On the supply side the improvedbusiness cycle conditions among many of the industrialized countries during theearly 1990s have contributed to the increasing FDI inflows worldwide. On thedemand side, local authorities have significantly improved their efforts to attract
Table 3.5b: Growth effects of the sectoral composition of FDI inflows Dependentvariable: Growth of Reel GDP per capita (1990–2002)
Independent variable I II III IV V
Initial income �0.94 �1.02 �1.12 �1.02 �1.37�2.21** �2.42** �2.69** �2.21** �2.37**
Share of services �0.001 �0.002 �0.002 �0.001 �0.001sector FDI in �2.41** �2.16** �2.20** �1.68* �1.85*total FDI
Share of primary �0.01 �0.02 �0.02 �0.03 �0.02sector FDI in �1.83* �1.96** �2.32** �2.64** �2.09**total FDI
FDI as a share of GDP 0.15 0.26 0.39 0.41 0.331.14 1.41 1.83* 2.00* 1.67*
Financial Markets 1.60 1.81 1.32 1.06 0.881.99** 2.16** 1.73* 1.19 3.06***
Openness — �0.86 �1.37 �1.05 �1.50— �1.25 �1.85* �1.18 �2.14**
Inflation — — �0.004 �0.004 �0.003— — �3.36*** �3.29*** �2.33**
Institutions — — — — 0.73— — — — 2.30**
Transition — — — �1.14 —— — — �1.78* —
Government — — — — �0.11— — — — �1.74*
R2 0.34 0.38 0.49 0.51 0.59Number of Observations 39 39 39 39 38
Note: This table excludes the manufacturing share in the total FDI. (See notes for table 5a). The sig-nificance level of the correlation coefficients are denoted by *,**, and ***. * denotes significance at10% level, ** denotes significance at 5% level, and *** denotes significance at 1% level.
Ch003.qxd 6/29/2007 10:08 AM Page 53

54 Dilek Aykut and Selin Sayek
more FDI; these efforts are evident in the many investment promotion agenciesestablished and the number of FDI-favoring laws and regulations introduced eachyear in several economies. These efforts by the local authorities are mostly due to the positive effects of FDI that are envisaged. Despite this belief of positivespillover effects from foreign to local firms, the empirical evidence is not yet con-clusive, other than stating that there are necessary conditions that allow countriesto benefit from the FDI they attract. Our belief is that the lack of a robust findingregarding the positive relationship between FDI and economic growth is mostlyon account of the aggregation of FDI data, that the results will be much strongerif one considers not only the effect of increased quantities of FDI but also the sec-toral composition of these FDI flows.
We believe that the sectoral composition of the FDI flows play a significantrole in influencing economic growth. FDI in the primary sector is expected togenerate mostly negative effects on the local economy through the following factors which are expected to dominate: effect on the market structure, possibleDutch disease effects through influence on the real exchange rate, and low link-ages of the industry with the local economy by nature. Accordingly, it is expectedthat as the share of the primary sector FDI in total FDI flows increases, it will bedetrimental to the local economy’s growth rate. Contrary to the primary sectorFDI, due to its deeper backward and forward linkages, it is expected that FDI inthe manufacturing sector will generate positive growth effects in the local econ-omy. Forming a priori expectation regarding the influence of FDI in the servicessector on economic growth is much less straightforward, given the differentimpacts of sub-sectors such as infrastructure, financial sector, tourism, and real-estate investments.
The cross-sectional empirical evidence discussed in this chapter suggests thatboth the level of FDI and the sectoral composition of these flows are importantcontributors to economic growth. The results suggest that as the sectoral com-position of FDI gets skewed towards the manufacturing sector, there is a signif-icant and positive effect on economic growth. On the contrary, the resultssuggest that as the sectoral composition of FDI gets skewed towards the servicesor the primary sector, there is a negative and mostly significant effect on eco-nomic growth. These results should be taken as strong motivation for furtherstudies of the issue, where the time-series feature of the data is also accountedfor using panel analysis.10 Future studies should furthermore test for the possible
10Using the current dataset, we undertook some preliminary panel analysis, where the Hausman testsuggested the use of fixed effects. Due to data limitations, we were forced to take 3-year averages ofthe series, which allowed for at most four data points. Preliminary results suggested supporting evi-dence to the cross-sectional results presented above. However, a more in-depth analysis is necessary.
Ch003.qxd 6/29/2007 10:08 AM Page 54

The Role of the Sectoral Composition of FDI on Growth 55
endogeneity of the composition of FDI, which could differ along the growth pathof economies. Due to lack of appropriate instruments the robustness of the aboveresults to the possible endogeneity bias is not reported.11 Regardless, the moti-vational cross-sectional evidence on these differential effects of the sectoralcomposition of capital flows provided in the chapter, to the best of our know-ledge, have not been shown before in such a framework. The result of this chap-ter suggests that countries should not only focus on attracting more FDI, butshould look into policies that will allow maximization of benefits through appro-priate composition of the flows.
Much more extensive analysis of the issue is necessary before concluding thisdiscussion. As shown in the chapter, the pattern of the sectoral FDI flows caneither be captured through the magnitude of FDI inflow activities or as the sec-toral composition of these flows. While the above analysis is based on one suchmeasure of the sectoral composition of the flows, robustness checks of theseresults using the alternative share measures as well as flows measures remain tobe done in future work. In addition, industrial structure plays an important role inthe impact of FDI in an economy, and greater disaggregation in sub-sectors mayyield different results.
Acknowledgements
Comments are welcome and may be sent to [email protected]. The authorsthank the editors of this book, Lucia Piscitello and Grazia D. Santangelo, and theparticipants of the 2005 International Workshop on Innovation, Multinationalsand Local Development for their very valuable comments. The views expressedin this paper are the authors’ own, and do not reflect those of the World Bank andits Members. Contact for information: Dilek Aykut, World Bank, 1818 H Street,NW Washington DC, USA, e-mail: [email protected], Fax: 1-202-522-3277 and Selin Sayek, Department of Economics, Bilkent University, Bilkent,Ankara, Turkey, e-mail: [email protected], Fax: 90-312-266-5140.
11In preliminary testings, following the agregate FDI literature, we use the lagged FDI as a share ofGDP and the level of the real exchange rate as instruments (see Wheeler & Mody, 1992; Markusen &Maskus, 2002, regarding evidence that FDI shows very persistent behavior; and Blonigen, 1997, forevidence regarding the relationship between the real exchange rate and the FDI). However, overiden-tification tests suggest that these instruments are not appropriate instruments for the sectoral compo-sition of the FDI. These preliminary results suggest the necessity of future work to further understandthe factors that govern the sectoral composition of the FDI, which will also assist in determination ofappropriate instruments for the composition itself.
Ch003.qxd 6/29/2007 10:08 AM Page 55

56 Dilek Aykut and Selin Sayek
Appendix
A1. Countries in the Samples
Argentina, Australia, Austria, Belgium, Bolivia, Brazil, Bulgaria, Canada, Chile,China, Colombia, Costa Rica, Czech Republic, Denmark, Ecuador, Estonia, Finland,France, Germany, Greece, Honduras, Hungary, Iceland, Indonesia, Ireland, Italy,Japan, Kazakhstan, Korea, Lao PDR, Malaysia, Mexico, Morocco, Netherlands,New Zealand, Nicaragua, Norway, Paraguay, Peru, Philippines, Poland, Portugal,Russia, Slovak Republic, Spain, Sweden, Switzerland, Thailand, Trinidad Tobago,Tunisia, Turkey, United Kingdom, United States, Venezuela, and Vietnam.
A2. Data Sources and Descriptions
Foreign direct investment, sectoral level: The International Monetary FundBalance of Payments Manual (1993) and the OECD’s Benchmark Definition ofFDI recommend countries to identify the sector classification of FDI accordingto United Nations International Standard Industrial Classification (ISIC) of alleconomic activity. ISIC (Rev. 3.1) identifies three main sectors: primary sectorincluding agriculture and mining and quarrying (coal, petroleum and other met-als and minerals); manufacturing sector; and services sector including infrastruc-ture (electricity, gas and water as well as transport and telecommunication),construction, wholesale and retail, financing and insurance, real estate and busi-ness services, education and health.
The FDI data in this study is collected from the U.N. Economic Commissionfor Latin America and the Caribbean, based on country sources for LatinAmerican countries; National Bureau of Statistics of China; ASEAN for otherAsian countries; and OECD, UNCTAD, and country sources for other countries.This classification may vary to some extent in each country.
Foreign Direct Investment: The net FDI inflows measure the net inflows ofinvestment to acquire a lasting management interest (10% or more of voting stock)in an enterprise operating in an economy other than that of the investor. It is the sumof equity capital, reinvestment of earnings, other long-term capital, and short-termcapital, as shown in the balance of payments. Source: World DevelopmentIndicators (WDI), World Bank (2004).
Growth and output levels: Both are imputed from the real GDP per capita, con-stant dollars. Source: WDI, World Bank (2004).
Liquidity (M2/GDP): Money plus quasi-money as a share of GDP. Liquid lia-bilities of the financial system (currency plus demand and interest bearing liabil-ities of the financial intermediaries and non-blank financial intermediaries)
Ch003.qxd 6/29/2007 10:08 AM Page 56

The Role of the Sectoral Composition of FDI on Growth 57
divided by GDP. Source: World Bank Financial Structure Database. (http://www.worldbank.org/research/projects/finstructure/database.htm).
Private sector credit of financial system: The value of credits by financialintermediaries to the private sector divided by GDP. It excludes credits issued bycentral and development banks. Furthermore, it excludes credit to the public sec-tor and cross claims of one group of intermediaries on another. Source: WorldBank Financial Structure Database.
Private sector credit extended by banks: Credit by deposit money banks to theprivate sector as a share of GDP. Source: World Bank Financial Structure Database.
Domestic investment: ‘Gross fixed domestic investment’ measuring the out-lays on additions to the fixed assets of the economy plus net changes in the levelof inventories. Source: World Bank (2004).
Inflation: Annual percentage changes in the GDP deflator. Source: World Bank(2004).
Government consumption: Total expenditure of the central government,including both current and capital (development expenditures and excludinglending minus repayments, as a share of GDP. Source: World Bank (2004).
Openness: Measured as the trade volume, exports plus imports as a share ofGDP. Source: World Bank (2004).
Human capital: Human capital measured as the average years of secondaryschooling in total population. Source: Barro and Lee (1996). Updated versiondownloadable from: http://www.cid.harvard.edu/ciddata/ciddata.html.
Bureaucratic quality: The institutional strength of the economy. High levels ofquality imply that the bureaucracy has the strength and expertize to govern with-out drastic changes in policy, or interruption in public services. Source: ICRG.
Risk of expropriation: The probability that the government may expropriateprivate property. Source: ICRG.
Corruption: This index captures the likelihood that government officials willdemand special payments, and the extent to which illegal payments are expectedthroughout government tiers, and is based on a survey of a panel of internationalexperts. A higher corruption index corresponds to a less corrupt country. Source:ICRG.
Real effective exchange rate: Calculated as the ratio of the local price index tothe multiplication of the US price index and the official exchange rate. Source:International Monetary Fund.
References
Aitken, B. J., & Harrison, A. (1999). Do domestic firms benefit from foreign direct invest-ment? Evidence from Venezuela. American Economic Review, 89, 605–618.
Ch003.qxd 6/29/2007 10:08 AM Page 57

58 Dilek Aykut and Selin Sayek
Alfaro, L. (2003). Foreign direct investment and growth: Does the sector matter? HarvardBusiness School. Mimeo. http://www.people.hbs.edu/lalfaro/fdisectorial.pdf, AccessedJune 2006.
Alfaro, L., Chanda, A., Kalemli-Ozcan, S., & Sayek, S. (2004). FDI and economic growth:The role of local financial markets. Journal of International Economics, 64, 89–112.
Balasubramanyam, V. N., Salisu, M., & Sapsford, D. (1996). Foreign direct investmentand growth in EP and IS countries. Economic Journal, 106(434), 92–105.
Barro, R., & Sala-i-Martin, X. (1995). Economic growth. New York, NY: McGraw-Hill.Barro, R., & Lee, J. W. (1996). International measures of schooling years and schooling
quality. American Economic Review, 86, 218–223.Blomstrom, M., Lipsey, R., & Zejan, M. (1994). What explains developing country growth?
National Bureau of Economic Research, Inc., NBER Working Papers no. 4132.Blonigen, Bruce A. (1997). Firm-specific assets and the link between exchange rates and
foreign direct investment. American Economic Review, June.Borensztein, E., De Gregorio, J., & Lee, J.-W. (1998). How does foreign direct investment
affect economic growth? Journal of International Economics, 45, 115–135.Carkovic, M., & Levine, R. (2003). Does foreign direct investment accelerate economic
growth? University of Minnesota, Working Paper.Carsten, F., Mattoo, A., & Rathindran, R. (2002). An assessment of telecommunications
reform in developing countries. The World Bank, Policy Research Working Paper Seriesno. 2909. Washington, DC.
Caves, R. (1996). Multinational enterprise and economic analysis. Cambridge, UK:Cambridge University Press.
Chakraborty, C. & Nunnenkamp, P. (2006). Economic reforms, foreign direct investmentand its economic effects in India. Kiel Working Paper no. 1272.
Claessens, S., Demirguc-Kunt, A., & Huizinga, H. (2001). How does foreign entry affectdomestic banking markets? Journal of Banking & Finance, 25(5), 891–911.
Clarke, G., Cull, R., D’Amato L., & Molinari, A. (2000). On the kindness of strangers?Impact of foreign entry on domestic banks in Argentina. In: S. Claessens, & M. Jansen(Eds), The internationalization of financial services: Issues and lessons for developingcountries. New York: Kluwer Academic Publishers.
Coolidge, J., & Rose-Ackerman, S. (1997). High-level rent-seeking and corruption inAfrican regimes: Theory and cases. The World Bank, Policy Research Working PaperSeries: 1780. Washington, DC.
Djankov, S., & Hoekman, B. (2000). Foreign investment and productivity growth in CzechEnterprises. World Bank Economic Review, 14(1), 49–64.
Gabriele, A. (2004). Policy alternatives in reforming power utilities in developing coun-tries: a critical survey. UNCTAD Discussion Paper.
Goldberg, L. (2004). Financial-sector FDI and host countries: New and old lessons.National Bureau of Economic Research, Inc, NBER Working Paper no. 10441.
Görg, H., & Strobl, E. (2001). Multinational companies and productivity spillovers: Ameta analysis. The Economic Journal, 111, 723–739.
International Monetary Fund. (1993). Balance of payments manual. (5th ed.).Washington, DC.
Ch003.qxd 6/29/2007 10:08 AM Page 58

The Role of the Sectoral Composition of FDI on Growth 59
International Monetary Fund. (2000). International capital markets: Developments,prospects, and key policy issues. Washington, DC.
Javorcik, B. S. (2004). Does foreign direct investment increase the productivity of domes-tic firms? In search of spillovers through backward linkages. American EconomicReview, 94(3), 605–627.
Keller, W., & Yeaple, S. R. (2003). Multinational enterprises, international trade, and pro-ductivity growth: Firm-level evidence from the United States. National Bureau ofEconomic Research, Inc, NBER Working Papers no. 9504.
King, R., & Levine, R. (1993). Finance and growth: Schumpeter might be right. QuarterlyJournal of Economics, 108, 717–738.
Klein, M. (2000). Foreign direct investment and poverty reduction. Foreign DirectInvestment Service, World Bank Discussion Paper.
Konings, J. (2001). The effects of foreign direct investment on domestic firms: Evidence fromfirm-level panel data in emerging economies. Economics of Transition, 9(3), 619–633.
Lim, E. (2001). Determinants of, and the relation between, FDI and growth: A summaryof the recent literature. International Monetary Fund Working Paper no. 175.
Lipsey, R. E. (2002). Home and host country effects of FDI. National Bureau of EconomicResearch, Inc, NBER Working Papers no. 9293.
Mankiw, G. N., Romer, D., & Weil, D. N. (1992). A contribution to the empirics of eco-nomic growth. Quarterly Journal of Economics, 107(2), 407–437.
Markusen, J., & Maskus, K. (1999). Discrimination among alternative theories of FDI.NBER Working Paper no: 7164.
Markusen, J. R., & Maskus , K. E., (2002). Discriminating among alternative theories ofthe multinational enterprise. Review of International Economics, 10(4), 694–707.
OECD (Organisation for Economic Co-operation and Development). Benchmark defini-tion of foreign direct investment. (3rd ed.). OECD, Paris.
Political Risk Services, International country risk guide (ICRG), New York, various issues.Rodrik, D. (1999). Making openness work: The new global economy and the developing
countries. Overseas Development Council, Washington, DC. Sachs, J. D., & Warner, A. M. (2001). The curse of natural resources. European Economic
Review, 45, 827–838.Sala-i-Martin, X., & Subramanian, A. (2003). Addressing the natural resources curse: An
illustration from Nigeria. NBER Working Paper no. 9804.Temple, J. (1999). The new growth evidence. Journal of Economic Literature, 37, 112–156.UNCTAD (2003). World investment report. United Nations, New York.UNCTAD (2004). World investment report. United Nations, New York.Wheeler, D., & Mody, A. (1992). International investment location decisions: The case of
US firms. Journal of International Economics, 33, 57–76.World Bank (2001). Global development finance report. The World Bank, Washington, DC.World Bank (2004a). World Bank development report. The World Bank, Washington, DC.World Bank (2004b). World development indicators on CD-ROM. The World Bank,
Washington, DC.World Bank (2004c). Global development finance report. The World Bank, Washington, DC.World Bank (2005). Global development finance report. The World Bank, Washington, DC.
Ch003.qxd 6/29/2007 10:08 AM Page 59

This page intentionally left blank

Knowledge Flows in Local Context
Ch004.qxd 6/29/2007 10:09 AM Page 61

This page intentionally left blank

Chapter 4
MNEs’ Location Behaviour andIndustrial Clustering*
Philip McCann and Ram Mudambi
1. Introduction
Economic geographers and urban and regional economists often discuss largelythe same issues from somewhat different perspectives. The different analyticaltechniques adopted and empirical tests employed can sometimes lead to ratherdiffering opinions and conclusions, and often these reflect largely methodologi-cal differences as to how to parsimoniously capture a particular issue. Where thetopics being discussed also overlap with other fields such as international trade orinternational business, the variety of analytical insights arrived at, often simplyreflects the variety of analytical perspectives adopted.
In this paper, we examine one important example of these differences in termsof a topic which is central to the interests of economic geographers and regionaleconomists, namely that of industrial location behaviour. In particular, we exam-ine the case of the location behaviour of the multiplant and multinational firm,specifically because the analysis of this issue is treated differently by economicgeographers, regional economists, international trade economists and the interna-tional business and management schools. The spatial behaviour of the multina-tional enterprise (MNE) has significant implications for regional and localdevelopment, because of the sheer scale of the foreign direct investment (FDI)
Do Multinationals Feed Local Development and Growth?© 2007 by Elsevier Ltd.All rights of reproduction in any form reservedISBN: 978-0-08-045360-6
*This chapter draws heavily on a previously published paper by the authors: McCann, P., &Mudambi, R. (2005). Analytical differences in the economics of geography: The case of the multina-tional firm, Environment and Planning A, 37(10): 1857–1876.
Ch004.qxd 6/29/2007 10:09 AM Page 63

operations undertaken by the MNEs in all industrial and commercial sectors. Yet,the differences in the treatment of this topic by these different schools leads tomajor problems of interpretation and comparison, particularly regarding issues ofindustrial ‘clustering’.
One of the most hotly debated aspects of globalization — the global disaggre-gation of the value chain — provides a critical template against which to view theintertwined issues of geography and the MNE. This disaggregation is the outcomeof firms combining the comparative advantages of geographic locations with theirown resources and competencies to maximize their competitive advantage. Theinterplay of comparative advantage and competitive advantage determines boththe boundaries of the firm (outsourcing decisions) as well as the optimal locationof value chain components (offshoring decisions). There is considerable evidencethat knowledge plays a key role in the relationship between location and value cre-ation (Pyndt & Pedersen, 2006). The ‘smile of value creation’ emerges from con-centrations of high value activities at the two ends of the value chain and illustratesthe crucial role of knowledge (see Figure 4.1). R&D knowledge generates highvalue added at the upstream end of the value chain (development, design,research, strategic planning, etc.). Similarly, marketing knowledge generates highvalue added at the downstream end (advertising, after-sales support, marketresearch, etc.). Over time, dynamic competencies are based on linking the twoends of the ‘smile’ so that marketing knowledge is used to calibrate and focusR&D-based knowledge creation (Leenders & Wierenga, 2002; Winter, 2003).
This paper argues two major points. First, both economic geography andregional economics have much to learn from these other fields concerning the
64 Philip McCann and Ram Mudambi
Figure 4.1: MNEs, knowledge and location.
Ch004.qxd 6/29/2007 10:09 AM Page 64
strategic behaviour of the MNE. Economic geographers and regional economiststend to focus on the explicitly spatial aspects of MNE behaviour, and the result-ing implications of the MNE location behaviour for regional development andregional policy, but do not treat MNE organizational issues, which are entwinedwith MNE locational issues, seriously (Phelps, 1997).
Second, we address the contribution that can be made by economic geographyand regional economics to both the international business literature and interna-tional trade theory.1 An unfortunate outcome of the tentative treatment of infor-mation and organizational issues of the MNEs in economic geography andregional economics, is that most of the seminal work on the explicitly spatialaspects of firms within these fields is largely unknown outside them.2 Yet theexplicitly spatial insights of economic geographers and regional economists havemuch to contribute to the MNE debates in the other fields of international eco-nomics and international business, for two reasons.
(i) Traditional international business and international trade theory approachesinclude no explicit geography within the schema, and cannot deal with locationalissues at sub-national geographical scales.3 (ii) The ignorance of firm locationtheory, outside the fields of economic geography and regional economics, hasallowed the growing debates within the international business literature concern-ing the explicitly spatial behaviour of the MNE to be dominated by the banalnotions of geographical space contained within the vague (Porter, 1990) notion of‘clusters’. Part of the reason for the popularity of the Porter clusters approach isthat it allows commentators to draw selectively on, and to use more or less inter-changeably, the nomenclature, terminology and insights of the fields of economicgeography and regional economics, without any real consideration of the analy-tical assumptions embedded in each of these concepts (Gordon & McCann, 2000).Yet, such a selective approach means that many of the Porter-type contentionsbecome almost entirely untestable (McCann & Sheppard, 2003; Martin & Sunley,2003) and this is unfortunate, because good analysis and policy-making demandsthat our models are clear and testable. This lack of analytical rigour is particularly
MNEs’ Location Behaviour and Industrial Clustering 65
1Our review of the literatures discussed here is not meant to be exhaustive. We have included specificreferences to indicate the type of analyses employed by these different fields and their underlyingassumptions, as they relate to the argument of the paper. 2For example, Markusen’s (2002) seminal Multinationals and the Theory of International Trade,includes multiple references to international economics, international business and management, butno single reference to work by economic geographers or regional economists. This is also the case inbest-selling international business textbooks, such as Ball et al. (2004). 3While new economic geographers (Fujita et al., 1999) have drawn on new international trade models(Helpman & Krugman, 1985), most trade theory dealing with MNEs remains fundamentally aspatial(Markusen, 2002).
Ch004.qxd 6/29/2007 10:09 AM Page 65

problematic when analysing the regional development impacts of the MNEs. Wewill argue, adopting a transactions cost perspective, that the Porter notion of anindustrial cluster implicitly precludes the inter-firm organizational arrangementscharacterizing the MNE. As such, the Porter clustering literature provides few, ifany, grounds for determining whether an MNE should locate in a cluster.
The time is ripe for a clear and consistent analysis of how industrial locationconcepts from economic geography and regional economics relate to those in theinternational business and international economics fields. Such an attempt requiresus to adopt a transactions-costs perspective on the organization, boundaries andlinkages of the firm, a familiar approach in the international business literature butmuch less so in the trade literature (Markusen, 2002) and not at all in economicgeography. Using this approach we can then consider how the location behaviourof the MNE firm influences, and is influenced by its strategic objectives, depend-ing on the nature of the firm’s inter-firm relations, and also depending on how thecosts and opportunity costs of any inward or outward information spillovers affectthe firm.
At this point we emphasize that the strategic logics underlying different‘modes of entry’ used by the MNEs to undertake the FDI are very different. Thus,whether an MNE uses a greenfield or acquisition entry mode is likely to dependupon the entry objective. Greenfield establishments are more likely to be associ-ated with leveraging the MNE’s knowledge and other assets (exploiting the firm’sexisting competencies), while acquisitions are more likely to be associated withcreating or upgrading competencies. Over time, subsidiary responsibilities mayevolve, so that the MNE hierarchy is re-organized.
The paper is organized as follows. In the next section we discuss the rationalefor and the nature of the MNE as perceived by the international business eco-nomics and international trade theory literatures. In Section 3, we discuss andcompare the various approaches employed to describe and analyse the explicitlygeographical location behaviour of the MNE from international business, inter-national trade theory, regional economics and economic geography perspectives.We argue in Section 4 that many of the traditional analytical frameworks fordiscussing MNE location behaviour have recently given way to the Porter notionof a cluster. This is, however, an oversimplification of the complexities of MNElocation behaviour, the analysis of which requires a careful consideration of theinterrelationships between location theory and MNE information and organiza-tional issues. In order to understand the conditions under which an MNE will findit advantageous to locate in a particular type of cluster, it is necessary to considerhow MNE information and organizational issues are related to different inter-firmtypologies of industrial clusters. In Section 5 we therefore present a typology ofthe clusters evident in regional economics and economic geography. By adopting
66 Philip McCann and Ram Mudambi
Ch004.qxd 6/29/2007 10:09 AM Page 66

a transaction-costs perspective on inter-firm relations, this approach coherentlylinks the economic geography and regional economics literatures to the interna-tional business literature. Section 6 then integrates these analytical underpinningsof clusters to the organizational and behavioural logic of the MNE. This allowsus to point to various possible avenues of theoretical and empirical research.
2. The Nature of the Multinational Enterprise
The analysis of the nature and strategic competitive behaviour of the MNE hasbeen undertaken in the two related fields of international business and interna-tional trade theory.
The mainstream of international business theory emerged from the Readingschool and its early development was strongly influenced by its progenitors’ rootsin neoclassical economics (Dunning, 1977; Buckley & Casson, 1976). It soonfound an interested audience of management scholars who applied the theory toa wide variety of issues involving the organization, strategy and impact of theMNE. In the international business and management literature, the explanationfor the existence of MNEs is based on the assumed existence of firm-specificintangible assets, which give the MNE firm major cost advantages over foreignproducers (Caves, 1982). Within this broad theme, the strategic behaviour of theMNE has traditionally been analysed within the framework of Dunning’s (1977)‘eclectic’ or ‘OLI’ paradigm’ which posits that multinational activities are drivenby three sets of advantages, namely ownership (O), location (L) and internaliza-tion (I) advantages. According to this approach, it is the particular configurationof these sets of advantages that either encourage or discourage a firm from under-taking foreign activities and becoming an MNE.
Ownership (O) advantages are perceived to be the firm-specific advantages thatemanate directly from resources or assets owned or controlled by a firm, such aseconomies of scale or product diversification; the management of organizationalexpertize; the ability to acquire and upgrade resources; marketing economies; andaccess to domestic markets and to capital. Location-specific (L) advantages areassumed to be based on the resources, networks and institutional structures that arespecific to a country. Examples here are low wages and the availability of cheapnatural resources; labour productivity; the size and character of markets; transportcosts; and the psychic distance from key markets to the home country of the MNE,the tariff and tax structures, attitudes towards the FDI, and the structure of com-petition. All of these can underpin value chain disaggregation (Figure 4.1).
None of these potential ownership (O) features or advantages are specific toMNE or to international business research, as each of these individual elements
MNEs’ Location Behaviour and Industrial Clustering 67
Ch004.qxd 6/29/2007 10:09 AM Page 67

is already contained within the standard industrial economics literature. Nor areany of the potential location (L) features specific to MNE or to international busi-ness research, as each of these elements is already contained within the standardurban, regional geographical economics literatures. Rather, what is different inthe international business literature from these other fields is the particular wayin which these features are combined with a third hypothesized advantageousfeature of the MNE, namely the internalization (I) advantages.
For international business analysts, the most crucial perceived advantage ofthe MNEs is known as internalization (I) advantages. These are the hypothesizedadvantages that accrue to a firm when it eliminates the transaction costs associ-ated with market interactions, and internalizes these activities by bringing theminside the hierarchy of the firm (Buckley & Casson, 1976). As such, the firm isperceived to gain an advantage from being able to better coordinate a complex setof interrelated activities by moving from a market system, in which the firmwould be forced to rely on imperfect or non-existent markets, to a planned andorganized system of internal markets. In particular, in the case of the MNE, thekey imperfect market which the firm seeks to replace is that of the pricing of cru-cial proprietary knowledge across geographical boundaries. On one hand, knowl-edge can be regarded an asset that is generated by a firm, but at the same timeknowledge also often has many of the attributes of a public good. Therefore, inorder to profit from investment in knowledge development, in some cases it willbe more efficient for the firm to use an internal hierarchy to internalize knowl-edge production and to monitor and control its use in a way that the market isunable to do. In these situations, knowledge is being treated as an intermediateproduct, and the firm accrues profits from the sale of the resulting final productor service produced on the basis of this knowledge. In cases where there areimperfections across international markets, the international business schoolargues that a hierarchically organized MNE can often be the most efficient meansof production. As such, market failure may therefore often be the primary rationalefor the existence of the MNE.
The second field of analysis which discusses the nature of and rationale for theMNE is trade theory. In early neo-classical trade theory there was no MNE assuch, because traditional neo-classical trade theory was based on the twinassumptions of constant returns to scale and perfect competition in production.New trade theory (Helpman & Krugman, 1985; Krugman, 1990) extended theanalysis of international trade by incorporating both economies of scale and prod-uct differentiation into trade models, both of which are features of the MNEs, and new economic geography (Fujita et al., 1999) also included a role foragglomeration and transport costs in determining trade patterns. However, withinboth of these subsequent approaches, each individual differentiated product is
68 Philip McCann and Ram Mudambi
Ch004.qxd 6/29/2007 10:09 AM Page 68

still identified with a single firm at a single location, such that there was still no multiplant or multinational production (Markusen, 2002). It is therefore onlyrelatively recently that the MNE has begun to be incorporated into trade models.
Many of the issues raised by the international business literature are now beingincorporated in general equilibrium trade-IO models. These include issues suchas the internalization and pricing of knowledge assets (Markusen, 1984, 2002),the advantages of horizontal (Horstmann & Markusen, 1992; Markusen &Venables, 2000) and vertical integration (Grossman & Hart, 1986; Aghion &Tirole, 1997) and the advantages of sub-contracting and licensing versus the FDI (Horstmann & Markusen, 1987; Ethier & Markusen, 1996; Helpman &Grossman, 2002; Markusen, 2002). However, even allowing for these recentdevelopments in trade theory, and also allowing for the focus on multi-productfirms in the new industrial economics literature (Tirole, 1988; Laffont & Tirole,1993), Markusen (2002) contends that most trade-IO models are still generally ofa type which assumes a single firm is associated with producing a single good ata single location, thereby excluding a role for the MNEs and multiplant firms.
3. Analysing the Geographical Location Behaviour of the MNE
The work on the MNEs in both international business analysis and trade theoryhas tended to focus on the relationships between the FDI, information and organ-ization. With the exception of a few studies focused on the US (Shaver & Flyer,2000) and Italy (Mariotti & Piscitello, 1995; Mudambi & Navarra, 2003), verylittle work has taken place in these fields concerning the sub-national regionallocation behaviour of the MNE. Geography is defined simply in terms of homecountry versus foreign country. Explicitly spatial work on the MNEs has been pri-marily in the field of economic geography. In this section we contrast these twoapproaches.
3.1. The International Business Approach
Within both the international business literature and the Markusen trade theorywork, the location L decision of the MNE is viewed as being interrelated withboth the O, and I characteristics of the firm. Each of these three aspects ofDunning’s (1977) eclectic paradigm are perceived to interact to explain the loca-tion decision of the MNE. Therefore, while location advantages are only the directcomponent, the ownership and internalization advantages also influence theactual decision that is taken. As such, the location decision is a complex one, sinceit subsumes within it decisions regarding the mode of entry and the industry of
MNEs’ Location Behaviour and Industrial Clustering 69
Ch004.qxd 6/29/2007 10:09 AM Page 69

entry (Mudambi & Mudambi, 2002) as well as the location of entry into a market.Within both the international business literature and the international trade litera-ture, this level of complexity was handled primarily by adopting several stylizedmodels of the geographical behaviour of the MNEs, the most important of whichwas the product cycle model of Vernon (1966), and its subsequent developments(Johanson & Vahlne, 1977; Hood & Young, 1979).
In terms of international geographical issues, these theories imply a clear hier-archical ordering to the MNE’s spatial allocation of activities. Modern and up-to-date activities of recent vintage would tend to take place in the home country ofthe MNE while more mature, standardized and relatively outmoded activitieswould tend to take place in overseas markets. The international geographywould thus be divided into core and periphery locations, distinguished primarilyin terms of the level and complexity of the information locally generated andhandled. Regional or sub-regional locations within individual countries werealmost entirely ignored. Yet, the revival of interest in economic geography andthe development of free trade areas has forced many observers to consider theseissues.
By the 1980s, however, this view of foreign subsidiary management wasargued by some to be potentially misleading (Mowery & Rosenberg, 1979). Theproduct cycle had by that time become so highly compressed that many MNEswere engaged in programs of almost contemporaneous research, developmentand product introduction in many major markets (see Vernon (1979), Cantwell(1995), Dunning (1992), and Howells (1990), with conflicting evidence in Pateland Pavitt (1991)).
The locational analysis of the MNE at the sub-national regional level is nowcoming to be regarded as ever more important by many analysts and policy-makers from the international business school (Mucchieli & Mayer, 2004) as well as by regional economists and economic geographers (Hill & Munday, 1994;Hill & Morgan, 1998). Within individual countries, identifying the conditionsunder which MNEs will locate in large or small urban centres, in central or periph-eral locations, and in specialized or diversified areas, is now regarded as essential.As such, issues such as agglomeration, clustering or dispersion become crucial inevaluating alternative location choices and possibilities within individual coun-tries or within individual areas of integration. Given that there is currently almostno theoretical analysis of the location behaviour of the MNEs at the sub-nationalregional level within either the international business or the international tradetheory literatures, it would appear that there is currently an ideal opportunity forthe explicitly spatial insights of economic geography and regional economicsconcerning firm location behaviour to be better integrated within the internationalbusiness and international trade literatures.
70 Philip McCann and Ram Mudambi
Ch004.qxd 6/29/2007 10:09 AM Page 70

3.2. The Regional Economics and Economic Geography Approaches
Yet, in spite of the current limitations of the international business literature andthe international trade theory for analysing the location behaviour of the MNE atthe sub-national level, it would be wrong to assume that the traditional regionaleconomics and regional science literature has been in any way more advanced inproviding an understanding of the regional geographical behaviour of the MNE.Analytical frameworks currently available are too specific for analysing theMNE in traditional regional economics, and too general in the case of economicgeography.
The existing microeconomic location theory literature within the traditionalregional economics tradition can be argued almost entirely unsuited to dealing withMNE issues on the grounds that the mathematical specifications too narrowly-defined to be meaningful. There are three reasons for this.
Firstly, microeconomic location theory (Eswaran et al., 1981; d’Aspremont et al.,1979) generally analyses the individual firm as a single point in space, and istherefore automatically inappropriate for analyzing many aspects of the MNE.Moreover, where multi-facility location modelling does exist (ReVelle, 1987), itis not constructed in terms that relate to the issues either behind the OLI frame-work or the product-cycle and stage-theory literatures.
Secondly, applying a microeconomic location-production function methodologyto even the most basic notion of the firm in the real world is actually far more com-plex than it appears at first (McCann, 1999) and extending this thinking to an MNEis currently not possible.
Thirdly, as we have already seen, much of the geographical relocation of activ-ities within the MNEs consists of the reallocation of activities and resources withinan existing spatial configuration of establishments, with little or no discernableexternal changes (Healey & Watts, 1987) of a type which can be modelled by micro-economic location theory.
On the other hand, much of the traditional economic geography literature onMNE firm location behaviour can be argued to be far too general for coherentlyanalysing the MNE. The traditional economic geography approach often adoptsstylized geographical versions of the product cycle model which adapt the insightsof the orthodox product cycle model to sub-national regional space. In these eco-nomic geography versions of the product cycle model (Healey & Watts, 1987;Hayter, 1997; Dicken, 2003) the general stylized argument is that multiplant firms(MPFs) will tend to locate their information-intensive activities and facilities inknowledge centres, such as dominant dynamic cities, while locating more routineand standardized activities in more geographically peripheral regions, in order totake account of lower local factor costs. As such, the inter-regional product cycle
MNEs’ Location Behaviour and Industrial Clustering 71
Ch004.qxd 6/29/2007 10:09 AM Page 71

geography of the MPF within an individual country should exhibit a similar pat-tern to the international geography of the MNE. Similarly, in the case of inwardinvestment by foreign-owned MNEs, the simple logic here also suggests thatinvestment locations will be driven by analogous considerations.
A problem with these stylized geographical versions of the product cyclemodel, however, is that they are based on a range of assumptions relating to the nature of the MPF and the MNE, many of which may no longer be tenable. In particular, the modern organizational structure, logic and behaviour of theMNE appears to have changed significantly over the last three decades since the product cycle model was first developed. The MNEs are nowadays acknowl-edged to adopt a much more sophisticated approach to multinational organizationand parent-subsidiary relationships than the simple hierarchical model implied bythe product cycle theory.
There are several possible reasons for these changes. Firstly, on the demandside, increasing wealth has led to a growth in the demand for more customizedproducts. From the perspective of the MNEs, the outcome of this has beendescribed as a movement from mass production to ‘mass customization’ (Kotha,1995), i.e. including a substantial pre-manufacture design function, whereby theMNE firm continues to exploit its home country expertize of exploitingeconomies of scale and scope, while at the same time incorporating the potentialfor considerable country-specific differentiation. Secondly, on the supply side, itis argued that many of the newer information and communication (ICT) techno-logies have greatly reduced the advantages of size, such that many of the previ-ous cross-subsidization based advantages of MNEs are assumed to have beenlargely dissipated. On the other hand, however, the MNE as a network firm mayalso be uniquely positioned to coordinate the activities of different subsidiaries ina manner which gives it dynamic advantages.
The desire to produce a greater variety of products or services within a net-worked system appears to have led to major changes in the role played by sub-sidiaries (Pine et al., 1993) and an increased role for strategic decision making atthe subsidiary level focussed on information-based activities (Cantwell, 1987).Technological advantages created in one location can be used in another, so thatthere may be a multi-directional flow of information and goods between rela-tively autonomous subsidiaries. In order to realize these advantages, the MNEshave to adopt more sophisticated means of coordination so as to continuallymaintain their local and global knowledge advantage, In turn, these changes havegenerally lead to changes in parent-subsidiary relations and the management ofthis process of change can lead to tensions and conflicts within the MNE(Asakawa, 2001). These tensions arise because of the conflicts associated withthe fact that the parent firm and headquarters operations will often wish to retain
72 Philip McCann and Ram Mudambi
Ch004.qxd 6/29/2007 10:09 AM Page 72

the scale advantages of a hierarchical organization while at the same time alsowanting to benefit from the local knowledge gained via the relatively moreautonomous subsidiaries. Under such conditions of conflicting goals and organi-zational stresses (Simon, 1952, 1959) the MNEs may adopt satisficing (Cyert &March, 1963) strategies that may be sub-optimal from the point of view of theMNE as a whole. In other words, subsidiaries embedded in leading technologicalcentres of competence (Cantwell & Janne, 1999) may be sources of potentialcompetitive advantage that actually remain unrealized due to the internal politi-cal structure of the MNE (Mudambi & Navarra, 2004). As such, the nature of thelocation and the nature of the activity located there may not always be optimal.
In addition to this sub-optimal location-matching problem, from the per-spective of the economic geography of the MNE and the MPF, these variousorganizational changes also imply that many of the simple centre-peripheryassumptions of the product-cycle model may no longer be tenable. The fact thatmore subsidiaries may gain a relatively higher level of autonomy does not nec-essarily imply that all establishments will be progressively located in so-calledknowledge centres. The reason for this is that the actual economic geography ofthese organizations will also depend crucially on the emerging organizationalstructure of the firm. For example, the geographical reach and responsibility of asubsidiary may change over time (Birkinshaw, 1996). Initially a subsidiary mayoriginally acquire a regional mandate, where it is responsible for the coordinationof activities with regard to a particular class of products, overseeing other sub-sidiaries in the same region. Eventually, it may obtain a global product mandatewhere its responsibilities become worldwide. Yet, such developments do not necessarily imply observable location changes. Rather, it is often the internallogic and organization of the activities within the network of the MPF or MNEestablishments which is adjusted. The locational logic of any subsequent new‘greenfield’ investments will also depend on this emerged organizational system(e.g., Anand & Delios, 1995).
In order to counter some of these problems, within traditional economic geog-raphy there has been some case-study work describing the various organizational-geographical aspects of the MPF and the MNE (Arita & McCann 2002; Hayter,1997; Bloomfield, 1981; Sheard, 1983). Yet, very little has been generalized fromthis case-study type of work, because the examples analysed tend to be veryheterogeneous both technologically and geographically. Interestingly, however,these case-studies do tend to indicate that these simple geography-product-cyclestylized models can provide very little indication of the actual sub-nationalregional geographical behaviour of MPFs or the MNEs, without a detailed analy-sis of the organizational logic of the firms concerned (Arita & McCann, 2002,2004).
MNEs’ Location Behaviour and Industrial Clustering 73
Ch004.qxd 6/29/2007 10:09 AM Page 73
4. MNEs and Industrial Clustering
Most recent analyses of the location behaviour of the MNEs have moved fromone stylized construct to another alternative stylized construct. The new stylizedconstruct of MNE locational behaviour, regularly employed in the internationalbusiness literature but also in some areas of economic geography (Tallman et al.,2004), is the Porter (1990) concept of a ‘cluster’. Not only has this Porter clusters concept been added to the existing toolkit of stylized product-cycle con-structs, but also it has come to dominate much of the recent literature on this sub-ject. We would argue that in terms of analysing the spatial behaviour of theMNEs, this Porter concept actually creates more analytical problems than itsolves.
Within the management literature, a key aspect of a location’s attractivenessfor a firm is its potential for enhancing competitive advantage (Porter, 1990,1998a, 1998b). The Porter literature argues that a central feature of such com-petitive regions is the presence of an industrial cluster, which provides the indi-vidual firm with valuable local resources, inputs, infrastructure andopportunities for learning from other local firms and institutions through inten-tional and unintentional knowledge inflows. In some situations these potentiallyfavourable aspects of a location can reinforce each other, leading to a virtuouscycle in which there appear to be continuing advantages to investing in particu-lar areas over other alternative locations. The implication of this analysis is thatclusters once formed, have a strong element of irreversibility, and firms there-fore have much to gain from locating in such clusters. This Porter thinking hasrecently pervaded all areas of the international business literature, because itappears to provide a way in which the (L) component of the OLI paradigm canbe discussed at the sub-national level.
As we have already seen, in most of the international business literature thefocus is on the MNE, which is recognized as a complex network spanningnational borders, whereas the industrial cluster is treated rather simplistically asa source of knowledge (Kuemmerle, 1999). On the other hand, in most of the lit-erature in economic geography and regional science, the focus is on the locationof the MNE subsidiary within the industrial cluster, while the MNE is treated asa unitary entity interacting with a local system of innovation (Pinch et al., 2003).
Thus, as we see in Figure 4.2, in the international business literature theanalysis concentrates on the multinational firm (Cantwell & Mudambi, 2004).In the context of knowledge flows, the MNE sees the host location as a sourceof knowledge. The subsidiary is then the ‘pod’ through which this knowl-edge is assessed, filtered and matched to the firm’s requirements. This relatesto what has been termed the firm’s absorptive capacity — the greater thiscapacity, the wider the range of knowledge that that subsidiary can examine.
74 Philip McCann and Ram Mudambi
Ch004.qxd 6/29/2007 10:09 AM Page 74

Therefore, greater absorptive capacity is generally associated with greater knowl-edge flow from subsidiary to parent. Of the knowledge flows in Figure 4.2, theMNE is most interested in the inflow of knowledge. Hence, it is interested inthe extent to which the location can create such inflows. The subsidiaryabsorbs and serves as a conduit for some knowledge inflows (so-calledspillovers). However, it also recombines these inflows to create new knowl-edge using its specific resource base in the location. Thus, in Figure 4.2, theflow from subsidiary to parent (1) is not the same as the inflow into the sub-sidiary from the location (2). The MNE is interested in both the flows (1) and(2), but these have different implications for the role of subsidiary. If flows(1) and (2) are fairly equal, the subsidiary serves mainly as a conduit for the acquisition of cluster knowledge. A large flow (1) and small flow (2)implies that the subsidiary has a substantial local resource base with which itenhances knowledge inflows for use by its parent MNE. A large flow (2) cou-pled with a small flow (2) can imply either that the knowledge is locally‘sticky’ (Szulanski, 1996) or that subsidiary’s knowledge strategy is mis-aligned with that of its MNE parent.
On the other hand, as we see in Figure 4.3, in the economic geography literature,the analysis concentrates on the location (Maskell, 2001). The institutional envi-ronment (rule of law, property rights) governs inter-personal relations and encour-ages the formation of firms. The National System of Innovation (NSI) thatencompasses the public, private and non-profit sectors fosters an open and learningenvironment that encourages the formation of firm networks. Geographic factorsgenerate a munificent location based on the NSI — hi-tech labour and an open andlearning business environment. This open and learning environment is embodied inthe largest firms in the local cluster. These largest firms serve as ‘flagship’ firms and
MNEs’ Location Behaviour and Industrial Clustering 75
Figure 4.2: MNE competence-creating knowledge flows.Source: From Cantwell and Mudambi (2004).
Ch004.qxd 6/29/2007 10:09 AM Page 75

are the hubs of networks made-up of small and medium-sized enterprises (SMEs).The network linkages enhance the innovativeness of these SMEs.
Within the international business literature, the particular way in which thePorter (1990) argument has generally been interpreted is both positive and norma-tive. The positive conclusion is that the MNEs have much to gain from locatingin clusters (Cantwell & Piscitello, 2005). On the basis of this positive conclusion,the additional normative conclusion is that the MNEs should generally locatefacilities where other similar establishments are also located. For example,‘knowledge-intensive’ MNE activities should simply be located in knowledge-intensive regions populated by other similar knowledge-intensive activities andestablishments. On the other hand, rather more routine activities which are notknowledge-intensive should simply locate in lower-wage areas along with othersimilar activities.
The vast majority of the traditional economic geography work on the MNEs hasbeen largely excluded from these discussions. However, there is one particularschool of economic geography research, which has made some limited impact onthe international business and management literature, and this is the Uppsala school(Solvell & Malmberg, 2002; Malmberg & Maskell, 2003; Solvell, 2003). TheUppsala school of international business has been unique, in that it has devel-oped by maintaining a continuous dialogue amongst regional scientists, economicgeographers and management scholars, and it is in this strand of the literature that
76 Philip McCann and Ram Mudambi
Figure 4.3: The cluster system of innovation.
Ch004.qxd 6/29/2007 10:09 AM Page 76

we find a systematic treatment of the linkage between industrial clusters and the MNEs. This is one of the few literatures where both the industrial clusterand the firm are treated as complex evolving entities (Bathelt et al., 2004).
According to the Uppsala school, knowledge flows are the main connectionsbetween cluster dynamics and the organizational and strategic decisions withinthe MNE (Malmberg & Maskell, 2002; Dicken & Malmberg, 2001). Thisapproach recognizes the symbiotic nature of innovation in the cluster and in the MNE. Thus, the internal innovation system of the MNE (Figure 4.2) and thecluster system of innovation (Figure 4.3) each affect the evolution of the other.Following these arguments, it becomes apparent that the MNE knowledgenetwork can therefore be leveraged to generate two unique advantages: (1) transfer,i.e. the use of knowledge created anywhere in the network at all other nodes ofthe network and (2) integration, i.e. the synthesis of knowledge flows from theparent, other subsidiaries and from its host location.
There is a difference, however, between the traditional international businessapproach and the Uppsala school. With its focus on the MNE, the mainstreaminternational business literature places more emphasis on transfer. On the otherhand, influenced as it is by the economic geography literature, the Uppsala schoolplaces more emphasis on integration. While the Uppsala school recognizes theimportance of the parent-subsidiary relationship in the MNE, it primarily analy-ses the cluster network (Figure 4.3) and the subsidiary’s embeddedness in it(Andersson, Forsgren, & Holm, 2002). We would suggest that a complete under-standing of the interactions between the MNE and clusters requires an analysis ofboth knowledge transfer and knowledge integration (Figure 4.4).
MNEs’ Location Behaviour and Industrial Clustering 77
Figure 4.4: The MNE knowledge network.
Ch004.qxd 6/29/2007 10:09 AM Page 77

4.1. Entry Objectives and Location
It has been recognized for some time that the MNEs are differentiated networkswherein subsidiaries differ greatly in terms of their resources, competencies andmandates (Nohria & Ghoshal, 1994). The MNE’s network now contains a diver-sity of subsidiary units undertaking a range of roles. This has been expressed inseveral different ways, e.g., assembly-type versus research-related productionfacilities, market-seeking versus asset-seeking FDI, home-based exploiting ver-sus home-base augmenting FDI, national mandates versus centre of excellencemandates and so on. All of these typologies have been integrated under an over-arching typology distinguishing between competence creation and competenceexploitation (Cantwell & Mudambi, 2005). This substantial literature points tothe fact that, over the past two decades or so, subsidiaries have been evolvingout of their traditional role of being the subservient executors of headquarterscommands. This process has been called ‘subsidiary evolution’ (Birkinshaw &Hood, 1998).
Competence-exploiting subsidiaries are MNE focussed in terms of creatingand maintaining competitive advantage. Hence, they have little to gain and muchto lose from locating in clusters. The knowledge-based assets of their MNE net-work that are the source of their competitive advantage are very valuable and oneof their main location objectives is the protection of this knowledge. Hence, suchsubsidiaries are driven by the private good aspect of knowledge.
Competence-creating subsidiaries, on the other hand, are cluster focussed interms of creating new sources of competitive advantage for their parent MNEs.In this process, they can take on competence-creating roles with progressivelyhigher levels of responsibility.
● Receiver competence: As pods or ‘listening posts’ they assess, filter and processcluster knowledge, enhancing the MNE’s receiver competence (Mudambi &Navarra, 2004).
● Absorptive capacity: In turn, receiver competence is the basis for the creationof absorptive capacity (Cohen & Levinthal, 1990), where the subsidiary adaptsknowledge inflows to fit firm-specific requirements. This knowledge can thenbe transmitted to other parts of the MNE network in a usable form.
● Knowledge integration: Subsidiaries with high levels of absorptive capacity areable to integrate inflows from diverse sources in the creation of new competen-cies (Figures 4.1 and 4.3) and may be better able to absorb tacit knowledge(Cantwell & Santangelo, 1999). This role is often accompanied by strategicresponsibility in the form of a regional or world product mandate for a particu-lar aspect of the MNE’s operations (Birkinshaw, 1996; Mudambi, 1998).
78 Philip McCann and Ram Mudambi
Ch004.qxd 6/29/2007 10:09 AM Page 78

It may be readily seen that the notion of receiver competence is primarily relatedto knowledge transfer, while the notion of absorptive capacity contains elementsof both transfer and integration.
Relating this analysis to the spatial domain, it may be seen that the entry objectiveand entry mode are strongly linked. One would expect the data to be concentrated inthe diagonal boxes in Table 4.1. Ceteris paribus, competence-exploiting subsidiariesare likely to be set up in a greenfield mode, since the MNE possesses the key com-petencies in-house and can obtain most complementary competencies through mar-ket transactions. Similarly, competence-creating subsidiaries are likely to be acquired,since it is precisely the key competencies that are objective of the entry. Over time,however, subsidiary evolution is likely to occur, so that a cross-sectional view of anMNE will see subsidiaries in all four boxes (Cantwell & Mudambi, 2005).
These cluster-type discussions have led to an additional implicit assumption aris-ing within the international business literature. This implicit assumption is thatwhere we observe several MNE firms of apparently similar characteristics locatedrelatively close to one another, then cluster features must be present and informationspillover mechanisms must be operating locally (DTI, 2002). In the fusion betweenthe international business literature and the economic geography literature (Dunning,2002), these approaches and conclusions are highly pervasive. Yet, from an analyt-ical perspective this line of thinking is extremely problematic, for three reasons.
Firstly, even if the distribution of activities across space is random (Ellison &Glaeser, 1997), some activities will appear clustered even though there are no differences in the interactions between firms. Observations of spatial industrialconcentration are thus not necessarily an evidence of Porter-type clusters.
MNEs’ Location Behaviour and Industrial Clustering 79
Table 4.1: Entry objectives and entry modes.
Entry objective Entry mode
Greenfield Acquisition
Competence- ● Forward linkage ● Forward linkages leveragedexploiting creation and enhanced
● Investment in marketing, ● R&D intensity decreaseslogistics, distribution
Competence- ● Backward linkage ● Backward linkages creating creation leveraged and enhanced
● Investment in in-house ● R&D intensity increasesR&D, alliances, univer-sity partnerships
Ch004.qxd 6/29/2007 10:09 AM Page 79

Secondly, in the Porter model, the critical geographical dimension over whichany such (information) competitive advantage is assumed to operate is never spec-ified. This is problematic, because there is much empirical evidence to suggest thatinformation spillovers in the dynamic MNE sectors extend well beyond the dimen-sions of the individual metropolitan areas (Audretsch & Feldman, 1996; Suarez-Villa & Walrod, 1997) and may well extend beyond a state, regional (Arita &McCann, 2000) or even national scale (Cantwell & Iammarino, 2000, 2002).
Thirdly, while certain combinations of resources and features may tend to per-petuate locational advantage, it is not clear which firms this might be relevant for.In particular, it is not clear from the Porter logic, from an MNE viewpoint, whatthe balance is between the costs of locating in a cluster and the opportunity costsof not doing so.
In order to consider these issues, we must first consider the assumptionsimplicit in the various notions of industrial clusters that are evident in the regionaleconomics and economic geography literatures. Whereas the central rationale forthe MNE is to internalize information transactions costs within the individualfirm, a key rationale for industrial clustering is to internalize information trans-actions costs within the group of clustered firms, rather than within an individualfirm. By adopting a transactions-costs approach to understanding the types ofinter-firm relations, which exist within a cluster, it becomes clear that there aremany conditions under which it is not advantageous for an MNE or an MPF firmto locate facilities within a cluster.
5. Analytical Typologies of Clusters
If we adopt a transactions-costs perspective, we can define three distinct types ofindustrial clusters, according to the nature of firms in the clusters, and the natureof their relations and transactions within the cluster (McCann & Gordon, 2000;McCann et al., 2002; McCann & Sheppard, 2003; Simmie & Sennet, 1999).These three distinct types of industrial clusters are the pure agglomeration, theindustrial complex and the social network. The key feature which distinguisheseach of these different ideal types of spatial industrial cluster, is the nature of therelations between the firms within the cluster. The characteristics of each of thecluster types are listed in Table 4.2, and as we see, the three ideal types of clus-ters are all quite different.
In the model of pure agglomeration, inter-firm relations are inherently transient.Firms are essentially monopolistically atomistic, in the sense of having almost nomarket power, and they will continuously change their relations with other firmsand customers in response to market arbitrage opportunities, thereby leading tointense local competition. As such, there is no loyalty between firms, nor are any
80 Philip McCann and Ram Mudambi
Ch004.qxd 6/29/2007 10:09 AM Page 80

particular relations long-term. The external benefits of clustering accrue to alllocal firms simply by reason of their local presence. The cost of membership ofthis cluster is simply the local real estate market rent. There are no free riders,access to the cluster is open and consequently, it is the growth in the local realestate rents which is the indicator of the cluster’s performance. This idealized typeis best represented by the notion of clustering underlying models of new eco-nomic geography (Krugman 1991; Fujita et al., 1999). The notion of space in thesemodels is essentially urban space, in that this type of clustering only exists withinindividual cities.
MNEs’ Location Behaviour and Industrial Clustering 81
Table 4.2. Industrial clusters: A transactions cost perspective.
Characteristics Pure Industrial Social agglomeration complex network
Firm size Atomistic Some firms are Variablelarge
Characteristics Non-identifiable, Identifiable, stable Trust, loyalty, jointof relations fragmented, trading lobbying, joint
unstable ventures, non-opportunistic
Membership Open Closed Partially open
Access to Rental payments Internal investment History experiencecluster location location location necessary,
necessary necessary but not sufficient
Space Rent No effect on rents Partial rental outcomes appreciation capitalization
Notion of Urban Local, but not Local, but not space urban urban
Example of Competitive Steel or chemicals New industrial cluster urban economy production complex areas
Analytical Models of pure Location-production Social network approaches agglomeration theory, input-output theory
analysis (Granovetter, 1973)
Dynamics Stochastic Strategic Mixed
Ch004.qxd 6/29/2007 10:09 AM Page 81

The industrial complex is characterized primarily by long-term stable and pre-dictable relations between the firms in the cluster. This type of cluster is most com-monly observed in industries such as steel and chemicals, and is the type of spatialcluster typically discussed by classical (Weber, 1909) and neo-classical (Moses,1958) location-production models, representing a fusion of locational analysiswith input–output analysis (Isard & Kuenne, 1953). Component firms within thespatial grouping, each undertake significant long-term investments, particularly interms of physical capital and local real estate, in order to become part of the group-ing. Access to the group is therefore severely restricted both by high entry and exitcosts, and the rationale for spatial clustering in these types of industries is thatproximity is required primarily in order to minimize inter-firm transport transac-tions costs. Rental appreciation is not a feature of the cluster, because the landwhich has already been purchased by the firms is not for sale. The notion of spacein the industrial complex is local, but not necessarily urban, in that these types ofcomplexes can exist either within or outside of an individual city. This complexmodel is actually the single explicitly spatial element in the transactions costsapproach of Williamson (1979), where the focus is on the types of flow-processscale economies which firms can realize by being part of vertically -integrated production complexes.
The third type of spatial industrial cluster is the social network model. This isassociated primarily with the work of Granovetter (1973), and is a response to thehierarchies’ model of Williamson (1975). The social network model argues thatmutual trust relations between key decision-making agents in different organiza-tions may be at least as important as decision-making hierarchies within individualorganizations. These trust relations will be manifested by a variety of features, suchas joint lobbying, joint ventures, informal alliances and reciprocal arrangementsregarding trading relationships. However, the key feature of such trust relations isan absence of opportunism, in that individual firms will not fear reprisals after anyreorganization of inter-firm relations. Inter-firm cooperative relations may thereforediffer significantly from the organizational boundaries associated with individualfirms, and these relations may be continually reconstituted. All of these behaviouralfeatures rely on a common culture of mutual trust, the development of whichdepends largely on a shared history and experience of the decision-making agentsand is likely to extend beyond business firms to include employee unions and otherstakeholders. Firms emerging from such clusters are likely to attempt to re-createthis environment when they set up operations in foreign locations (Tüselmann et al.,2003).
This social network model is essentially aspatial, but from the point of view ofgeography, it can be argued that spatial proximity will tend to foster such trust rela-tions, thereby leading to a local business environment of confidence, risk-taking
82 Philip McCann and Ram Mudambi
Ch004.qxd 6/29/2007 10:09 AM Page 82

and cooperation. Spatial proximity is necessary but not sufficient to acquire accessto the network. As such, membership of the network is only partially open, in thatlocal rental payments will not guarantee access, although they will improve thechances of access.4 The geographical manifestation of the social network is the so-called ‘new industrial areas’ model (Scott, 1988), which has been used to describethe characteristics and performance of areas such as Silicon Valley and the Emilia-Romagna region of Italy (Piore & Sabel, 1984; Scott, 1988; Storper, 1997; Castells &Hall, 1995). In this model space is once again local, but not necessarily urban.
In reality, all spatial clusters will contain characteristics of one or more ofthese ideal types, although one type will tend to be dominant in each cluster. Yet,as we see there are some elements of each of these particular cluster frameworkswhich are mutually exclusive of the other cluster typologies. Therefore, in orderto understand the advantages to the firm of being located in any particular clus-ter, it is first necessary to determine which of the ideal types of industrial cluster,described in Table 4.2, most accurately reflects the overall characteristics andbehaviour of the firms in the cluster. Clearly, the major problem with the simplePorter clusters model is that in addition to the Porter emphasis on the role playedby local information in acting as a spur to competitiveness, the various elementsof all three of the above cluster typologies are all repeated in the Porter frame-work without any particular ordering, ranking or discrimination. Unfortunately,this lack of discrimination fundamentally weakens the whole basis of the Portercluster argument.
A key distinguishing feature of our typology of clusters relates to the underly-ing inter-temporal dynamics. In pure agglomeration clusters, the dynamics arepurely stochastic, driven by the open membership and consequent low entry bar-riers. Entry is based on the munificence of factor availability (supply side factors)and perceived industry profitability (demand side factors). Intra-cluster competi-tion ensures that this dynamic process aids cluster survival. Failure and exit weedout weaker ideas and firms. This is the Porter argument in favour of encouragingcompetitive forces to promote competitiveness.
In industrial complex clusters, on the other hand, membership is virtuallyclosed. Entry and exit is closely regulated by the major cluster participants. Inmany cases (e.g., Toyota City — Aichi Prefecture, BASF-city — Ludwigshafen)the cluster is controlled by a ‘flagship firm’. The dynamic evolution of the cluster
MNEs’ Location Behaviour and Industrial Clustering 83
4The work of Scott (1988) also draws on the transactions cost institutional economics framework ofWilliamson. Our inclusion of Scott’s work in this third category reflects the fact that the new indus-trial spaces model generates a semi-fragmented grouping of firms with semi-flexible inter-firm trans-actions, rather than a system of tightly integrated, hierarchically organized, stable, predictable andidentifiable inter-firm transactions, of the sort which exists in the industrial complex model.
Ch004.qxd 6/29/2007 10:09 AM Page 83

is therefore controlled by the strategic goals and objectives of the dominant firmor firms. Cluster survival is closely connected to the survival of the major clusterparticipants. Thus, intra-cluster competition is virtually absent, while inter-clustercompetition provides the dynamic of survival.
Social network clusters contain elements of both stochastic and strategicdynamics. Given the dependence on trust and shared history, entry processes areslower than that in pure agglomeration clusters. However, intra-cluster variationcan be quite significant, so that over time such a cluster is likely to evolve moreflexibly than an industry complex cluster that must always serve the interests ofat the most a few major players.
For our purposes, it is important to understand how transactions cost descrip-tions of clusters inform our discussion of the attractiveness of clusters for MNEs.As we have already seen, the central rationale for the MNE is as a means of inter-nalizing information transactions costs within the individual firm, whereas therationale for industrial clustering is to internalize information transactions costswithin the group of clustered firms. It is thus necessary to consider how the orga-nizational characteristics and objectives of the MNE and the MPF relate to thecosts and benefits of the information spillover characteristics and inter-firmbehaviour of the other clustered firms.
6. Information Spillovers and MNE Location Behaviour
There is some evidence to suggest that beneficial information spillovers may oper-ate in certain locations. For example, it is well known that R&D-intensive indus-tries tend to be highly spatially concentrated (Almeida & Kogut, 1997; Castells &Hall, 1994; Saxenian, 1994), and this spatial concentration has tended to persisteven in the face of rising local labour, land and other local input costs. However,the involvement of the MNEs in clusters is not ubiquitous. There is evidence thatthis involvement is very sensitive to the nature of the industry structure in whichthe firm operates (Cantwell & Kosmopoulou, 2002). This finding can be shown to be consistent with the arguments outlined in the previous section, but in orderto see this we must reconsider the firm’s perceptions of the benefits of informa-tion spillovers. In particular, we must distinguish between information spilloverswhich result in knowledge inflows from those which result in knowledge outflows, and also we must distinguish between unintentional and intentionalknowledge flows.
While we may safely assume that all firms regard knowledge inflows posi-tively, irrespective of whether they are intentional or unintentional, a firm’s per-ceptions of the benefits of knowledge outflows will depend on the structure of the
84 Philip McCann and Ram Mudambi
Ch004.qxd 6/29/2007 10:09 AM Page 84

industry in which the firm competes. This is because unintentional knowledge out-flows have both a positive and a negative effect on the individual firm. The privateeffect of an unintentional knowledge outflow on the owner-originator firm is aleakage of its valuable intellectual capital, which would be viewed negatively by the firm (Grindley & Teece, 1997). The potential positive effect of an uninten-tional knowledge outflow, however, is the public good aspect of knowledge(d’Aspremont et al., 1998), contributing to a virtuous cycle by strengthening theknowledge base of the region and making it a more attractive location for otherknowledge-bearing firms. This, in turn, should generate larger future knowledgeinflows to all the firms in the group.
In a competitive market structure characterized by a large number of firms,each with a relatively small market share and profits, such firms probably havelittle to lose from unintentional knowledge outflows and more to gain frominflows stemming from a strong clustered location. The public good aspect ofknowledge would appear to dominate here, with the local knowledge outflowsbeing viewed as generally positive both for the firms themselves and for the localregion (Jaffe et al., 1993; Saxenian, 1994).
In an oligopolistic industrial structure, firms realize that unintentional knowl-edge outflows to industry rivals can be extremely costly in terms of lost compet-itive advantage, because the private good aspect of knowledge is their dominantconsideration. Any unintentional information outflows from a firm are morevaluable to its competitors than any potential information outflows from thesecompetitors to the firm, so the overall effect of the knowledge outflows is per-ceived to be negative.
If the clustering of oligopolistic firms appears to jeopardize their proprietaryknowledge assets by exposing themselves to the possibility of unintentional out-ward knowledge spillovers, such firms will decide not to locate in clusters, unlessthey can find a way of avoiding unintentional knowledge outflows. These prob-lems of information revelation and opportunism, and the impacts on locationbehaviour, are similar in nature to the moral hazard issues in the contracting-versus-FDI dilemmas faced by the MNEs (Markusen, 2002). We can thereforeuse this argument concerning the avoidance of unintentional knowledge out-flows, to reconsider the attractiveness of a cluster for an MNE firm, most ofwhich are oligopolistic.
In terms of our cluster typologies in the previous section, the possibility ofunintentional knowledge outflows is associated most obviously with the model of pure agglomeration. Tacit knowledge can be shared between two parties, butif there is little or no inter-firm loyalty within the system, this knowledge can alsobe passed on to third parties who are beyond the control of the originator of theinformation. As such, pure agglomerations will create information problems for
MNEs’ Location Behaviour and Industrial Clustering 85
Ch004.qxd 6/29/2007 10:09 AM Page 85

an oligopolistic MNE establishment. Similarly, in the case of a social network,where non-opportunistic relations between the firms are built upon longstandingmutual trust and shared experience, an immigrant oligopoly MNE firm will ben-efit little, as these trust systems are based primarily on networks of small firmsaiming to help one another. It is very difficult to conceive of such two-way rela-tions developing between a major MNE source of the FDI and local small firms,because the dominance in any such relationships will be skewed according to thesize of the firms. Although our knowledge of the relationship between businessnetworks and the FDI is currently very limited (Rauch, 2001), it is very difficultto conceive of a large MNE investor benefiting in any way from locating withina region characterized by such social network features, wherever they may exist.
Applying Akerlof’s (1970) market-for-lemons model, many industrial clusterswhich include large oligopolistic competitors will generally be plagued byadverse selection and should either fail to form, or become concentrations ofmediocrity. This will be particularly so in the case of clusters characterized bypure agglomeration or social network relations. The information internalizationlogic favouring the MNE is largely inconsistent with either the externality argu-ment, favouring the pure agglomeration, or the inter-personal relations of thesocial network. Similarly, the clear organizational boundaries of large firms of anoligopoly are inconsistent with the organizational forms assumed by either pureagglomeration or social networks.
This provides a powerful counter-argument to the simple Porter or Saxenian(1994) logic of industrial clustering, and appears to explain the empirical obser-vation that many of the largest firms do not co-locate their knowledge creationactivities with those of their competitive rivals (Cantwell & Santangelo, 2002;Simmie, 1998). Moreover, in situations where they do so, the organizationalaspects of the firms are designed specifically to avoid the sharing of knowledge(Arita & McCann, 2002; McCann et al., 1993). As yet, the Porter school hasfailed to address or even acknowledge these counter-arguments (Martin &Sunley, 2003).
On the other hand, the industrial clusters form of industrial organization isconsistent with oligopolistic MNEs. In some situations, inward investing MNEfirms will find it optimal to locate facilities close to similar firms, in order toeffect particular types of long-term inter-firm transactions. In these cases, theintentional sharing of information between the firms is a mutually plannedprocess with knowledge inflows and outflows being carefully managed within asystem of bilateral monopoly frameworks. This type of clustering is commonlyobserved in industries such as chemicals and automobile manufacturing, as wellas in high technology manufacturing sectors, such as the Scottish Electronicsindustry (McCann, 1997). Yet, the inter-firm relations embedded within thus type
86 Philip McCann and Ram Mudambi
Ch004.qxd 6/29/2007 10:09 AM Page 86

of system are entirely different from the types of relations assumed to operate inthe clusters models based on information spillovers.
A further analytical problem raised by this issue is that these industrial com-plex-types of organizational arrangements can exist across much wider geograph-ical scales than individual metropolitan areas. Given the lack of geographicalspecificity and definition in the simple Porter clusters literature, observations of MNE clustering of a type consistent with an industrial complex model mayoften be misinterpreted as a cluster, based on an agglomeration-informationspillovers model. Recent apparently more sophisticated work (Devereux &Griffiths, 1998; Barrell & Pain, 1999) has fallen into this trap, by simply assum-ing that groupings of FDI investments by the MNEs within an individual countrymust be clear evidence of agglomeration economies, irrespective of the geo-graphical location and spatial scale of either the country or its internal urbansystem. It appears we are repeating many of the mistakes of the original interna-tional business literature.
7. Conclusions
The reasons why MNE firms locate particular facilities in other countries can beanalysed initially by employing orthodox international business methodologiesand international trade theories. However, at the more disaggregated spatial scaleof the sub-national regional level, the location of the individual plant must beanalysed by discussing more explicitly spatial and organizational issues, whiletaking account of the characteristics of the region itself (Hood & Young, 1979;Phelps, 1997). Our analysis here has not been on issues of location and laboursupply, but rather on the question of the importance of inter-firm knowledgespillovers. In terms of our clustering typologies described in Table 4.2, the spatialorganization of many MNEs is primarily characterized by the ‘industrial com-plex’ model. In other words, although social networks exist within the firm(Rauch, 2001), primarily stable and predictable relations exist between both thevarious parent and subsidiary plants of the MNE group, and also between the sub-sidiary and local suppliers and customers. Informal and external informationspillovers between local firms are not the primary rationale for such clusteringbehaviour. Although it may be argued that trust relations of the ‘social network’type may be enhanced by proximity between plants, the clustering logic of manyMNEs is primarily a function of hierarchy organization and information internal-ization. The observed information internalization behaviour of the MNEs acrossa range of locations (McCann, 1997) and sectors (Simmie, 1998) implies that thegeographical behaviour of these vertically-integrated MNE firms often has much
MNEs’ Location Behaviour and Industrial Clustering 87
Ch004.qxd 6/29/2007 10:09 AM Page 87
more in common with the industrial complex model of organization and locationthan with a pure agglomeration or social network type of cluster. Our observationstherefore suggest that the opportunities for MNE firms to benefit from inter-firmlocal information spillovers are also rather more limited than many other authorsassume (Saxenian, 1994). The reason is that the ability to benefit from suchspillovers also depends on organizational issues. Unless the MNE is willing and isable to decentralize its organizational structures, almost to the point of completehierarchy fragmentation, the MNE will neither benefit from, nor contribute to,such local externalities. The hierarchical MNE and the pure agglomeration orsocial network, are to a large extent mutually exclusive phenomena.
References
Aghion, P., & Tirole, J. (1997). Formal and real authority in organizations. Journal ofPolitical Economy, 105, 1–29.
Akerlof, G. A. (1970). The market for lemons: Quality uncertainty and the market mecha-nism. Quarterly Journal of Economics, 84(3), 488–500.
Almeida, P., & Kogut, B. (1997). The exploration of technological diversity and the geographic localization of innovation. Small Business Economics, 9, 21–31.
Anand, J., & Delios, A. (1995). Location specificity and the transferability of downstreamassets to foreign subsidiaries. Journal of International Business Studies, 28(3),579–603.
Andersson, U., & Forsgren, M. (2000). In search of centre of excellence: Network embed-dedness and subsidiary roles in multinational corporations. Management InternationalReview, 40(4), 329–350.
Andersson, U., Forsgren, M., & Holm, U. (2002). The strategic impact of external networks: Subsidiary performance and competence development in the multinationalcorporation. Strategic Management Journal, 23, 979–996.
Arita, T., & McCann, P. (2000). Industrial alliances and firm location behaviour: Some evidence from the US semiconductor industry. Applied Economics, 32, 1391–1403.
Arita, T., & McCann, P. (2002). The relationship between the spatial and hierarchicalorganization of multiplant firms: Observations from the global semiconductor industry.Journal of International Management, 8(1), 121–139.
Asakawa, K. (2001). Organizational tension in international R&D management: The caseof Japanese firms. Research Policy, 30, 735–757.
Audrestch, D., & Feldman, M. P. (1996). R&D spillovers and the geography of innovationand production. American Economic Review, 86(3), 630–640.
Ball, D. A., McCulloch, W. H. Jr., Frantz, P. L., Geringer, J. M., & Minor, M. S. (2004).International business: The challenge of global competition. New York: McGraw-Hill.
Barrell, R., & Pain, N. (Eds). (1999). Innovation, investment and the diffusion of technol-ogy in Europe. Cambridge: Cambridge University Press.
88 Philip McCann and Ram Mudambi
Ch004.qxd 6/29/2007 10:09 AM Page 88

Bathelt, H., Malmberg, A., & Maskell, P. (2004). Clusters and knowledge: Local buzz,global pipelines and the process of knowledge creation. Progress in Human Geography,28(1), 31–56.
Birkinshaw, J. (1996). How multinational subsidiary mandates are gained and lost. Journalof International Business Studies, 27(3), 467–498.
Birkinshaw, J. M., & Hood, N. (1998). Multinational subsidiary evolution: Capability andcharter change in foreign-owned subsidiary companies. Academy of ManagementReview, 23(4), 773–795.
Bloomfield, G. T. (1981). The changing spatial organisation of multinational corporationsin the world automotive industry. In: F. E. I. Hamilton, & G. J. R., Linge (Eds) Spatialanalysis, industry and industrial environment Vol. II: International industrial systems.London: Wiley.
Buckley, P. J., & Casson, M. C. (1976). The future of multinational enterprise. London:Macmillan.
Buckley, P. J. (1993). The role of management in internalization theory. ManagementInternational Review, 33(3), 198.
Cantwell, J. A. (1987). The reorganisation of European industries after integration:Selected evidence on the role of transnational enterprise activities. Journal of CommonMarket Studies, 26, 127–151.
Cantwell, J. A. (1995). The globalisation of technology: What remains of the product cyclemodel? Cambridge Journal of Economics, 19, 155–174.
Cantwell, J. A., & Iammarino, S. (2002). The technological relationships between indige-nous firms and foreign-owned MNCs in the European regions. In: P. McCann (Ed.)Industrial location economics. Cheltenham: Edward Elgar.
Cantwell, J. A., & Janne, O. E. M. (1999). Technological globalization and innovative cen-ters: The role of corporate technological leadership and locational hierarchy. ResearchPolicy, 28(2–3), 119–144.
Cantwell, J. A., & Kosmopoulou, E. (2002). What determines the internationalization of corporate technology? In: M. Forsgren, H. Håkanson, & V. Havila (Eds), Critical perspectives on internationalisation. (pp. 305–334). London: Pergamon.
Cantwell, J. A., & Mudambi, R. (2004). Multinational enterprises and competence-creatingknowledge flows: A theoretical analysis. In: V. Mahnke & T. Pedersen (Eds) Knowledgeflows, governance and multinational enterprise (pp. 38–57). London: Palgrave Macmillan.
Cantwell, J. A., & Mudambi, R. (2005). MNE competence-creating subsidiary mandates.Strategic Management Journal, 26(12), 1109–1128.
Cantwell, J. A., & Piscitello, L. (2005). Recent location of foreign-owned research anddevelopment activities by large multinational corporations in the European regions: Therole of spillovers and externalities. Regional Studies, 39(1), 1–16.
Cantwell, J. A., & Santangelo, G. D. (1999). The frontier of international technology networks: Sourcing abroad the most highly tacit capabilities. Information Economicsand Policy, 11, 101–123.
Cantwell, J. A., & Santangelo, G. D. (2002). The new geography of corporate research inInformation and Communications Technology (ICT). Journal of EvolutionaryEconomics, 12(1/2), 163–197.
MNEs’ Location Behaviour and Industrial Clustering 89
Ch004.qxd 6/29/2007 10:09 AM Page 89

Casson, M. C. (1987). The firm and the market. Oxford: Basil Blackwell.Caves, R. E. (1982). Multinational enterprise and economic analysis. Cambridge:
Cambridge University Press.Castells, M., & Hall, P. (1994). Technopoles of the world: The making of 21st century
industrial complexes. New York: Routledge.Clement, N. C., del Castillo Vera, G., Gerder, J., Kerr, W. A., MacFadyen, A. J., Shedd, S.,
Zepeda, E., & Alercon, D. (1999). North American economic integration: Theory andpractice. Cheltenham: Edward Elgar.
Cohen, B. J. (1998). The geography of money. Ithaca, NY: Cornell University Press.Cohen, W. M., & Levinthal, D. A. (1990). Absorptive capacity: A new perspective on
learning and innovation. Administrative Science Quarterly, 35(1), 128–152.Coleman, W. D. (1996). Financial services, globalization and domestic policy change.
Basingstoke: Macmillan.Cyert, R. M., & March, J. G. (1963). A behavioral theory of the firm. Englewood-Cliffs,
NJ: Prentice-Hall.d’Aspremont, C., Bhattacharya, S., & Gerard-Varet, L-A. (1998). Knowledge as a public
good: Efficient sharing and incentives for development effort. Journal of MathematicalEconomics, 30(4), 389–404.
Devereux, M. P, & Griffiths, R. (1998). Taxes and the location of production: Evidencefrom a panel of US multinationals. Journal of Public Economics, 68(3), 335–367.
Dicken, P., & Malmberg, A. (2001). Firms in territories: A relational perspective.Economic Geography, 77(4), 345–363.
Dunning, J. H. (1977). Trade, location of economic activity and the multinational enterprise:A search for an eclectic approach. In: B. Ohlin, P. O. Hesselborn, & P. M. Wijkman (Eds),The international allocation of economic activity, (pp. 395–418). London: Macmillan.
Dunning, J. H. (1992). Multinational enterprises and the globalization of innovatorycapacity. In: O. Granstrand, L. Hakanson, & S. Sjolander (Eds) Technology man-agement and international business: Internationalization of R&D and technology,(pp. 19–51). Chichester: Wiley.
Eswaran, M., Kanemoto, Y., & Ryan, D. (1981). A dual approach to the location decisionof the firm. Journal of Regional Science, 21(4), 469–489.
Ethier, W., & Markusen, J. R. (1996). Multinational firms, technology diffusion and trade.Journal of International Economics, 41, 1–28.
Forsgren, M., & Pedersen, T. (2000). Subsidiary influence and corporate learning: Centersof excellence in Danish foreign-owned firms. In: U. Holm, & T. Pedersen (Eds), Theemergence and impact of MNE centers of excellence (pp. 68–78). London: Macmillan.
Fujita, M., Krugman, P., & Venables, A. J. (1999). The spatial economy. Cambridge, MA:MIT Press.
Gordon, I. R., & McCann, P. (2000). Industrial clusters: Complexes, agglomeration and/orsocial networks? Urban Studies, 37(3), 513–532.
Granovetter M. (1973). The strength of weak ties. American Journal of Sociology, 78(6),1360–1380.
Grindley, P. C. & Teece, D. J. (1997). Managing intellectual capital: Licensing and cross-licensing in semiconductors and electronics. California Management Review, 39(2): 8–41.
90 Philip McCann and Ram Mudambi
Ch004.qxd 6/29/2007 10:09 AM Page 90

Grossman, G. M., & Hart, O. (1986). Costs and benefits of ownership: A theory of verti-cal and lateral integration. Journal of Political Economy, 94, 691–719.
Hayter, R. (1997). The dynamics of industrial location: The factory, the firm and the pro-duction system. Chichester: Wiley.
Healey, M., & Watts, H. D. (1987). The multiplant enterprise. In: W. F. Lever (Ed.),Industrial change in the United Kingdom. Longman: Harlow.
Helpman, E., & Krugman, P. R. (1985). Market structure and foreign trade. Cambridge,MA: MIT Press.
Helpman, E., & Grossman, G. E. (2002). Integration versus outsourcing in industry equi-librium. Quarterly Journal of Economics, 117, 85–120.
Hood, N., & Young, S. (1979). The economics of multinational enterprise. London:Longman.
Horstmann, I. J. & Markusen, J. R. (1987). Strategic investments and the development ofmultinationals. International Economic Review, 28, 109–121.
Horstmann, I. J., & Markusen, J. R. (1992). Endogenous market structure in internationaltrade (natura facit saltum). Journal of International Economics, 32, 109–129.
Howells, J. (1990). The internationalization of R&D and the development of globalresearch networks. Regional Studies, 24, 495–512.
Isard, W. (1956). Location and space-economy. New York: Wiley.Jaffe, A., Trajtenberg, M., & Henderson, R. (1993). Geographic localization of knowledge
spillovers as evidenced by patent citations. Quarterly Journal of Economics, 108(3), 577.Johanson, J., & Vahlne, J. (1977). The internationalization process of the firm: A model of
knowledge development and increasing foreign market commitments. Journal ofInternational Business Studies, 7, 22–32.
Kotha, S. (1995). Mass customization: Implementing the emerging paradigm for compet-itive advantage. Strategic Management Journal, 16, 21–42.
Kuemmerle, W. (1999). The drivers of foreign direct investment into research and devel-opment: An empirical investigation. Journal of International Business Studies, 30(1),1–24.
Krugman, P. R. (1990). Rethinking international trade. Cambridge MA: MIT Press.Laffont, J. J., & Tirole, J. (1993). A theory of incentives in procurement and regulation.
Cambridge, MA: MIT Press.Leenders, M., & Wierenga, B. (2002). The effectiveness of different mechanisms for inte-
grating marketing and R&D. Journal of Product Innovation Management, 19(4),305–317.
Leyshon, A., & Thrift, N. (1997). Money space. Routledge: London.Malmberg, A. (2003). Beyond the cluster: Local milieux and global connections. In:
J. Peck, & H. Yeung (Eds), Remaking the global economy. London: Sage.Malmberg, A., & Maskell, P. (2002). The elusive concept of localisation economies:
Towards a knowledge-based theory of spatial clustering. Environment and Planning A,34(3), 429–450.
Malmberg, A., & Maskell, P. (2003). Localised capabilities and industrial competitiveness.In: K. Simonsen & J. Ohman (Eds), Voices from the North: New trends in Nordic humangeography. London: Ashgate.
MNEs’ Location Behaviour and Industrial Clustering 91
Ch004.qxd 6/29/2007 10:09 AM Page 91

Mariotti, S., & Piscitello, L. (1995). Information costs and the location of FDI within thehost country: Empirical evidence from Italy. Journal of International Business Studies,26(4), 815–841.
Markusen, J. (1984). Multinationals, multi-plant economies, and the gains from trade.Journal of International Economics, 11, 531–356.
Markusen, J. (2002). Multinational firms and the theory of international trade.Cambridge, MA: MIT Press.
Markusen, J. R., & Venables, A. J. (2000). The theory of endowment, intra-industry andmultinational trade. Journal of International Economics, 52, 209–235.
Marshall, A. (1920). Principles of economics (8th ed.). London: Macmillan.Martin, R., & Sunley, P. (2003). Deconstructing clusters: Chaotic concept or policy
panacea? Journal of Economic Geography, 3(1), 5–35.Maskell, P. (2001). Towards a knowledge-based theory of the geographical cluster.
Industrial and Corporate Change, 10(4), 921–943.McCann, P. (1997). How deeply embedded is Silicon Glen? A cautionary note. Regional
Studies, 31(7), 697–705.McCann, P. (1999). A note on the meaning of neo-classical location theory and its useful-
ness as a basis of applied research. Papers in Regional Science, 78(3), 323–331.McCann, P., Arita, T., & Gordon, I. R. (2002). Industrial clusters, transactions costs and
the institutional determinants of MNE behaviour. International Business Review, 11(6),647–663.
McCann, P., & Sheppard, S. C. (2003). The rise, fall and rise again of industrial locationtheory. Regional Studies, 37(6–7), 649–663.
Moses, L. (1958). Location and the theory of production. Quarterly Journal of Economics,78, 259–272.
Mowery, D. C., & Rosenberg, N. (1979). The influence of market demand upon innova-tion: A critical review of some recent studies. Research Policy, 8, 103–153.
Mucchieli, J. L., & Mayer, T. (Eds) (2004). Multinational firms’ location and the NewEconomic Geography. Cheltenham: Edward Elgar.
Mudambi, R. (2002). Knowledge management in multinational firms. Journal ofInternational Management, 8, 1–9.
Mudambi, R., & Mudambi, S. M. (2002). Diversification and market entry choices in thecontext of foreign direct investment. International Business Review, 11(1), 35–55.
Mudambi, R., & Navarra, P. (2003). Political tradition, political risk and foreign directinvestment in Italy. Management International Review, 43(3), 247–265.
Mudambi, R., & Navarra, P. (2004). Is knowledge power? Knowledge flows, subsidiarypower and rent-seeking within MNCs. Journal of International Business Studies, 35(5),385–406.
Nohria, N., & Ghoshal, S. (1994). Differentiated fit and shared values: Alternatives for man-aging headquarters-subsidiary relations. Strategic Management Journal, 15(6), 491–502.
OECD. (1999). Boosting innovation: The cluster approach. Paris: OECD Proceedings.Patel, P., & Pavitt, K. (1991). Large firms in the production of the world’s technology: An
important case of ‘non-globalization’. Journal of International Business Studies, 22(1),1–22.
92 Philip McCann and Ram Mudambi
Ch004.qxd 6/29/2007 10:09 AM Page 92

Phelps, N. A. (1997). Multinationals and European integration: Trade, investment andregional development. London: Jessica Kingsley.
Piggot, J., & Cook, M. (Eds), (1999). International business economics: A European per-spective. London: Longman.
Pinch, S., Henry, N., Jenkins, M., & Tallman, S. (2003). From ‘industrial districts’ to‘knowledge clusters’: A model of knowledge dissemination and competitive advantagein industrial agglomerations. Journal of Economic Geography, 3(4): 373–388.
Pine, B., Victor, B., & Boynton, A. C. (1993). Making mass customization work. HarvardBusiness Review, 71, 108–119.
Porter, M. E. (1990). The competitive advantage of nations. New York: The Free Press.Porter, M. E. (1998a). Clusters and the new economics of competition. Harvard Business
Review, 76(6), 77–90.Porter, M. E. (1998b). Competing across locations. In: M. E. Porter (Ed.), On competition.
Cambridge, MA: Harvard Business School Press.Pyndt, J., & Pedersen, T. (2006). Managing global offshoring strategies: A case approach.
Copenhagen: Copenhagen Business School Press.Rauch, J. E. (2001). Business and social networks. Journal of Economic Literature, 39(4),
1177–1203.ReVelle, C. (1987). Urban public facility location. In: Handbook of urban and regional
economics, Vol. 2: Urban economics. Amsterdam: North-Holland.Saxenian, A. (1994). Regional advantage: Culture and competition in Silicon Valley and
Route 128. Cambridge, MA: Harvard University Press.Shaver, J. M. & Flyer, F. (2000). Agglomeration economies, firm heterogeneity and for-
eign direct investment in the United States. Strategic Management Journal, 21(12),1175–1193.
Simmie, J. (1998). Reasons for the development of ‘Islands of Innovation’: Evidence fromHertfordshire. Urban Studies, 35(8), 1261–1289.
Simon, H. A. (1952). A behavioral model of rational choice. Quarterly Journal ofEconomics, 52, 99–118.
Simon, H. A. (1959). Theories of decision-making in economics and behavioral science.American Economic Review, 49, 253–283.
Solvell, O. (2003). The multi-home based multinational: Combining global competitivenessand local innobativeness. In: J. Birkinshaw, S. Ghoshal, C. Markides, J. Stopford, & G. Yip (Eds), The future of the multinational company, (pp. 34–44). Hoboken: Wiley.
Solvell, O., & Malmberg, A. (2002). Does foreign ownership matter? Subsidiary impacton local clusters. In: V. Javila, M. Forsgren, & H. Hakansson (Eds), CriticalPerspectives on Internationalisation (pp. 59–79). Oxford: Elsevier.
Suarez-Villa, L., & Walrod, W. (1997). Operational strategy, R&D and intrametopolitanclustering in a polycentric structure: The advanced electronics industries of the LosAngeles Basin. Urban Studies, 34(9), 1343–1380.
Szulanski, G. (1996). Exploring internal stickiness: Impediments to the transfer of bestpractice within the firm. Strategic Management Journal, 17, 27–43.
Tallman, S., Jenkins, M., Henry, N., & Pinch, S. (2004). Knowledge, clusters and com-petitive advantage. Academy of Management Review, 29(2), 258–271.
MNEs’ Location Behaviour and Industrial Clustering 93
Ch004.qxd 6/29/2007 10:09 AM Page 93

Tirole, J. (1988). The theory of industrial organization. Cambridge, MA: MIT Press.Tüselmann, H., McDonald, F., & Heise, A. (2003). Employee relations in German multi-
nationals in an Anglo-Saxon setting: Toward a Germanic version of the Anglo-Saxonapproach? European Journal of Industrial Relations, 9(3), 327–350.
Vernon, R. (1960). Metropolis 1985. Cambridge, MA: Harvard University Press.Vernon, R. (1966). International investment and international trade in the product cycle.
Quarterly Journal of Economics, 80, 190–207.Vernon, R. (1979). The product cycle hypothesis in a new international environment.
Oxford Bulletin of Economics and Statistics, 41, 255–267.Williamson, O. E. (1975). Markets and hierarchies: Analysis and antitrust implications.
New York: The Free Press.Winter, S. (2003). Understanding dynamic capabilities. Strategic Management Journal,
24(10), 991–995.
94 Philip McCann and Ram Mudambi
Ch004.qxd 6/29/2007 10:09 AM Page 94

Chapter 5
Exploring the Characteristics ofTechnology Spillovers Using PatentCitation Data
John Cantwell and Camilla Noonan
1. Introduction
This chapter examines the geography of technology spillovers in the context ofGermany. We use patent citation data and present a descriptive analysis of thetechnological activities between 1975 and 1995 of foreign-owned firms locatedin Germany. In addition to examining whether spillovers are localized within thislocation, we investigate the importance of indigenous German firms (i.e. a majorcomponent of the local infrastructure) as owners of this localized knowledge.Germany provides a particularly useful testing bed for examining this issue,because unlike prior studies that use the US as the unit of analysis for example,Germany boasts a very long tradition of technological activity in a relativelysmall geographic area. This renders it a very interesting context within which toinvestigate knowledge localization and the role of regional borders in inter-firminteractions within technology space.
Although the role of spillovers in economic growth has been the subject ofempirical testing for quite some time (Romer, 1986, 1990; Grossman & Helpman,1991), more recent work has been centred on more micro-based examinations ofthis phenomenon with a shift in focus to where these spillovers actually go. Thecentral assumption in the growth literature is that knowledge spills over to otherfirms and individuals within a nation but not to potential recipients located
Do Multinationals Feed Local Development and Growth?© 2007 by Elsevier Ltd.All rights of reproduction in any form reservedISBN: 978-0-08-045360-6
Ch005.qxd 6/29/2007 10:11 AM Page 95

elsewhere. Many scholars have questioned this wisdom and using patent citationdata have examined the degree to which spillovers are indeed localized.Following the paper trail that enables the tracking of these spillovers, Jaffe,Trajtenberg, and Henderson (1993) presented the first statistically significantfinding of geographic localization. Their results confirmed that citations weremore likely to come from the same metropolitan area, the same state and the samecountry as the originating citing patent but that this localization fades over time.Further citation-based studies confirmed this initial finding (Jaffe & Trajtenberg,1998; Almeida & Kogut, 1999; Maurseth & Verspagen, 2001), adding that pub-lic research bodies play an important role (Jaffe, Fogarty, & Banks, 1998) andtechnological proximity is of moderate importance in localization processes(Jaffe & Trajtenberg, 1999).
2. Technology Spillovers and the Multinational Enterprise
International Business scholars have examined localized knowledge spillovers asconstituting an important centrifugal supply side force that attracts corporateR&D activities to foreign locations. Up until the mid-1980s, most R&D washighly centralized and took place in the headquarters of the parent firm. Theadvantages of maintaining R&D at the centre have been well-rehearsed in termsof inter alia, economies of scale in the R&D effort, indivisibilities and corporatesecrecy. Since the mid-1980s (and earlier in the case of European MNEs(Cantwell, 1995)), large firms have been increasingly decentralizing variousaspects of the R&D function to an ever-expanding network of globally dispersedsubsidiaries and external agencies. This has been referred to as the move fromasset (or home base)-exploiting activity to asset (or home base)-creating activityat subsidiary level (Dunning & Narula, 1995; Kummerle, 1996). It has beenunderpinned inter alia, by an increased pressure on firms to understand and buildcapabilities across a growing range of technologies (Granstrand et al., 1997). Ascountries have become more technologically specialized and differentiated fromeach other through time (Cantwell, 1989; Archibugi & Pianta, 1992; Patel &Vega, 1999), MNEs decentralize their R&D function in an attempt to breathe inthe air of (foreign) invention (Marshall, 1890/1920) and access this highly local-ized (or embedded) technological knowledge from various regions internation-ally (Cantwell, 1989, 1992, 1993). Subsidiaries have become the interfacebetween the multinational network and indigenous infrastructures within theseinternational centres of technological excellence.
Much of the early research that supports this asset-seeking thesis has beenbased on case studies (oftentimes of Japanese MNEs in the US). Notwithstanding
96 John Cantwell and Camilla Noonan
Ch005.qxd 6/29/2007 10:11 AM Page 96

the consequent problems of generalizability and sample selection bias, resultsgenerally confirm that the activities of foreign-owned subsidiaries are increas-ingly associated with gaining access to research intensive activities within thishost. Larger sample studies reported mixed results (Cantwell, 1992; Zander,1999; Dunning & Narula, 1995). Studies that use patent citation data have beenmore conclusive around these issues confirming that foreign-owned subsidiariesdraw from the knowledge pool of the host country/region in fields of local tech-nological strength (Almeida, 1996; Frost, 2001; Criscuolo et al., 2005) but thesesubsidiaries also contribute to this local pool depending on the expertize availablein the host economy (Singh, forthcoming). This chapter offers a more granularanalysis of some of these issues.
3. Data
A sample of 12,721 citing patents granted by the United States Patent and TrademarkOffice (USPTO) to the research facilities of large foreign-owned firms located inGermany was collected between the years 1975 and 1995. All references to prior artwas extracted from these patents and used as a proxy for (potential) knowledge flowsbetween these firms and their local environment. These foreign-owned patents cited67,142 technologies that were developed by firms (or inventors) that resided bothwithin and outside Germany.
Each of the 12,721 citing and 67,142 cited patents were coded by technology,location and institutional affiliation.
(i) Technology. Each patent and patent citation was classified using the Universityof Reading classification scheme. This disaggregates the 401 US patent classes into56 more workable technology fields.
(ii) Location. Each patent and patent citation is coded according to the resi-dence of the first named inventor (or the location of the research facility respon-sible). To facilitate a sub-national analysis of German level citation activity, aNUTS code was attributed to each citing and cited patent.1 In the cases of inven-tors located outside of Germany, we differentiate between:
(a) those located in the home country of the parent firm and(b) those located in another foreign country.
Exploring the Characteristics of Technology Spillovers 97
1NUTS or Nomenclature of Territorial Units for Statistics. This classification system was establishedby Eurostat to provide a uniform breakdown of territorial units for the production of regional statis-tics for the European Community in 1988. Under this system, Germany consists of 16 NUTS, 1 region(Bundeslaender); 38 NUTS, 2 regions; (Regierungsbezirke) and 445 NUTS, 3 regions (Kreise). Forthe purposes of this study, each patent and patent citation was given a NUTS 3 code.
Ch005.qxd 6/29/2007 10:11 AM Page 97

(iii) Institution (or assignee). In addition to the technology and location code,each citation is also classified according its assignee (or owner). Here, we differ-entiate cases where:
(a) the assignor is the same firm as that of the citing patent (i.e. self cites),2
(b) the assignor is another large firm in the same industry,3
(c) the assignor is another large firm in a different industry, and(d) the assignor is a ‘smaller firm’ i.e. a firm not listed in the large firm data set.
Patents that result from collaborative research activity are assigned to the firstnamed assignor.
4. Using Citation Data
The reliability of using citations as an indicator of technology spillovers betweenagents has been questioned. For example, in addition to the citations added by theinventor, additional citations may be included by the patent examiner and thismay result in biased results. A number of researchers have explored this issue indepth and conclude that although citations might be added by these agents andthat the data is a noisy but valid measure of spillovers (Jaffe et al., 1998, 2000).In a further examination of this issue, Alcacer and Gittelman (2006) note thatadditional citations may not be of concern depending upon the hypotheses beingexamined. In terms of issues pertaining to geography for example, they note howthere is a close tracking in geographic space between these two citation streamswhich suggests that inventors and examiners have similar citation patterns at aspatial level (ibid., p. 778).
Regardless of who was responsible for actually adding the references to priorart, one might also take the view that these additional citations actually add objec-tivity to the process since the patent document now includes all knowledge flows
98 John Cantwell and Camilla Noonan
2The firm refers here to the corporate group and not to any individual affiliate in isolation.3In total, there are 867 firms in the database. These have been consolidated into one of 284 corporategroups. Births, deaths, mergers and acquisitions as well as movement of firms between corporate +groups (sometimes associated with historical changes in ownership) have been accounted for in thedatabase. Adopting an approach similar to Scherer (1965), each corporate group has been allocated toan industry on the basis of its primary field of production. These industries were then classified intofour major industrial groups based on the types of technologies that have been most characteristicallydeveloped by the firms in question. The database has been therefore constructed in recognition of thefact that while firms may be separated into broadly defined and distinct industrial areas, the range oftechnologies these firms are active in, may be far more diverse.
Ch005.qxd 6/29/2007 10:11 AM Page 98

(conscious or otherwise) that have influenced the inventor. This is the positiontaken in this study. Since we are primarily concerned with analysing the overallspatial characteristics of technological development, it is important to identify allinfluential sources of knowledge, regardless of whether these were consciously(or otherwise) tapped into by the inventor in question.
As noted above, by now, a number of studies have used patent citations toexamine technology spillovers. In general, these studies have taken particulargroups of frequently ‘cited’ patents (usually within a particular technology family)and analysed the citation patterns to these inventions. In adopting this approach,authors have encountered what is referred to as a truncation bias. This refers todifficulties encountered when deciding upon the appropriate cut off points forthe citation window. Stated simply, in undertaking such analyses, the researcheris confronted with the difficulty of trying to ascertain the correct time framewithin which inventions receive their maximum number of citations. In terms ofinvention, identifying the window within which maximum citation activity islikely to occur is extremely challenging. It is virtually impossible to be totallyconfident that what may be perceived to be relatively unimportant inventionstoday (i.e. as evidenced by low citation activity) will not become hugely impor-tant in the future.4 Hall et al. (1998) highlight the skewed nature of the distribu-tion of patent citations. Examining the citations made to the inventions of 4800publicly traded manufacturing firms 1975–1995, the authors draw attention tothe fact that citations are often made more than 10 years after the original patentis granted.
In marked contrast to the aforementioned traditional citations literature, thisanalysis adopts a distinctly different approach. This analysis commences with the‘citing’ patent, which means that this approach is backward-looking and histori-cal. This is useful because it means that the number of citations is fixed and defin-itive at the point of issue rather than being forward-looking and open-ended, aswas the case in previous studies.
As can be seen from Figure 5.1, the distribution of these ‘citing’ patents is muchless skewed than the distribution of ‘cited’ patents (evidenced in Hall et al.,1998). The modal values are 3 and 4, which is in marked contrast to the equiva-lent for cited patents (where the modal value is 0).
Exploring the Characteristics of Technology Spillovers 99
4Consider Coases’s 1937 article for example. This was almost never cited before 1975, but then citedmassively after that date. If one was to fix the citation window at 20 years, one might be tempted to conclude that this seminal piece of work really had little impact upon the academic work that followed. Of course, we know that this was not the case — it just took the academic world a littlelonger to recognize the significance of this piece of work.
Ch005.qxd 6/29/2007 10:11 AM Page 99

5Comparing this result against population and industrial employment statistics, we find that whilepatenting activity is far more concentrated than population across these regions, it is relatively close
5. The Regional Characteristics of Technology Sourcing
Germany is composed of 16 states or regions (Bundesländer). Table 5.1 reports theregional origin of the patent citations. By examining the location code of the orig-inal invention (citing patent), and the citations contained therein, we can examinehow many citations are associated with originating patents in each region. Thefourth column in this table provides information on the regional distribution ofpatents granted to foreign-owned firms in Germany from the year 1969 to 1995.The second column takes each of the 67,142 citations associated with patentsgranted to foreign facilities (1975–95) and links them back to the regional originof the patent that cited them.
From the fourth column, it is clear that technological activity is highly con-centrated in this country. Between 1969 and 1995, approximately 78% of total USpatents granted to large firms based in Germany resulted from research located injust four regions. These core regions within Germany are the two southern statesof Bayern and Baden Württemberg, the more centrally located Hessen andNordrhein-Westfalen to the west.5
100 John Cantwell and Camilla Noonan
108.0052.00
44.0035.00
31.0028.00
25.0022.00
19.0016.00
13.0010.00
7.001.00
Fre
quen
cy2000
1000
0
4.00
Figure 5.1: Distribution of patent citations.
Ch005.qxd 6/29/2007 10:11 AM Page 100

Reflecting the regional distribution of total (citing) patents, it is unsurprisingto find that approximately 53% of citations are made by originating patents fromtwo regions of Baden Württemberg (31.8%) and Nordrhein-Westfalen (20.9%). Itis interesting to note that Nordrhein-Westfalen and Hessen are associated withmore citations than their overall distribution of patents might suggest. While theformer hosts 19.1% of total foreign-owned patents and these patents are associ-ated with 20.9% of all citations, the latter hosts 13.9% and is associated with14.7% of all citations. In other words, given that the distribution of citing andcited patents mirror each other across the other regions, the types of technologiesbeing developed in these regions — because they are associated with more cita-tions — are associated with more cumulative types of research or are relativelymore relevant to other fields of search.
6. Sourcing of Technological Knowledge
As noted above, analysis in the international business (IB) field has emphasizedthe central role played by the parent company in the development of technologi-cal know-how. If this thesis were correct, one would expect to see technologicalexpertize disseminating in an outward direction from the parent company to alloverseas subsidiaries. Using the patent citation activity of foreign firms located
Exploring the Characteristics of Technology Spillovers 101
Table 5.1: The regional origin of foreign firm patent citing patents 1975–1995.
Region Cited patents % Cited patents %(1975–1995) (1969–1995)
Baden Württemberg 21,351 31.8 4828 31.1Bayern 9058 13.5 2158 13.9Hessen 9843 14.7 2158 13.9Niedersachsen 3371 5.0 792 5.1Nordrhein-Westfalen 14,064 20.9 2965 19.1Rheinland-Pfalz 3594 5.4 745 4.8Others 5861 8.7 1878 12.1
Total 67,142 100.0 15,523 100.0
to the regional concentrations of industrial employment in the cases of Nordrhein-Westfalen andBaden Württemberg. In contrast, innovative activity is far more concentrated than industrial employ-ment in Bayern and Hessen (Noonan, 2002).
Ch005.qxd 6/29/2007 10:11 AM Page 101

in Germany as a proxy for technology communication between these subsidiariesand their parents, one would therefore expect to observe that the majority of thecitations lead us back to the parent firm. If overseas technological activity ismerely exploiting what has been developed within the research labs of the parentfirm, the majority of citations should reference the prior technological activitiesof the parent. The results of this examination are reported in Table 5.2.
It is apparent from these findings that over the 1975–1995 period, foreign firmslocated in Germany sourced approximately 29% of their technological knowledgefrom the home country of the parent firm. This suggests that the technologicalactivities of foreign subsidiaries located in Germany are not heavily concentratedin home base exploiting (HBE)-type activities. In line with the more contemporaryIB literature that relegates the role of the parent firm in the technological activitiesof overseas subsidiaries, it is interesting to note the proportion of knowledgesourced at local level (19%) and the high proportion sourced from other foreigncountries (~52%).6 This suggests that the technological endeavours of these firmsmay be more accurately referred to as strategic asset seeking (Dunning & Narula,1995) or home base augmenting (HBA) (Kummerle, 1996) — type activities.Rather than merely adapting the extant technologies of the parent firm (or acting
102 John Cantwell and Camilla Noonan
6Controlling for the global distribution of patenting, of course one might expect this proportion to beless striking. Given the central location of Germany within Europe, one might expect extensive inter-national citation across bordering European countries. This would support Jaffe and Trajtenberg’s(1996) study of citations to US-based invention. They found that the extent to which patents grantedto foreign residents were likely to cite US patents depended upon geographic and cultural proximity.
Table 5.2: Knowledge sources for foreign firms located in Germany, 1975–1995.
Knowledge source Citation frequency % of total
Home country of the parent firm 19,391 28.9Another foreign country 34,687 51.7Germany 12,580 18.7
Baden Württemberg 2698 4.0Nordrhein Westfalen 2363 3.5Bavaria 2103 3.1Hessen 1277 1.9
No location code 484 0.7
Totala 67,142 100.0
aThis represents the total citations that emanate the 16 German regions.
Ch005.qxd 6/29/2007 10:11 AM Page 102

as a substitute for activities the MNE may have wished to undertake at home(Zander, 1999), these subsidiaries seek to enhance the technological base of theparent firm by developing completely new (though complementary) lines ofsearch. In addition to drawing from the highly developed local German knowledgebase, foreign subsidiaries located in this country also build upon technologies thathave been developed at a variety of other international locations.
Although self-citations are a vital element in any analysis of regional devel-opment or technological embeddedness across space, it is important to differen-tiate this type of citation activity when studying potential knowledge interactionswithin versus between firms (intra versus inter-firm activity). In their study ofinternational knowledge flows, Jaffe and Trajtenberg (1998, p. 11) emphasize thispoint noting that since self-citations come more quickly on average and are moregeographically localized, they bias the study of knowledge localization in anupward direction.
By extracting the proportion of self cites (i.e. cases in which the assignor (orowner) of the cited patent is the same as the citing patent), we arrive at a proxy fortechnological communication between the subsidiary and the parent (Table 5.3).7
In doing this, we find that just 29% of total citations to the home country weremade to inventions undertaken by members of the corporate group located there.This finding clearly questions the historic importance attributed to the parent firmand confirms the appropriateness of reinvestigating the role played by the parentfirm in the technological activities of overseas subsidiaries.
Results from this investigation suggest that while 23% of citations are made toother large firms within the same industry, that the majority of citations (48%) tothe home country reference the technological activities of other large firms in dif-ferent industries.
By once again examining the proportion of self-citations (within the overallcitations to the knowledge infrastructures of other foreign locations), we find that4% of total citations reference the technological activities of the multinationalgroup in foreign locations. This suggests that the majority of the technologiesunder development in Germany do not build upon the technological activities ofother parts of the international corporate network. This may however reflectactivities undertaken by means of external networks (constituting the virtualorganization) at other locations. In referencing to the prior inventions of other for-eign countries, these firms cite the technological activities of other large firms
Exploring the Characteristics of Technology Spillovers 103
7Self-citations capture all references to prior technological activity undertaken by the entire corporategroup. This is not a strict measure of citations to the parent firm but rather to members of the corpo-rate group that are located in the home country of the parent firm.
Ch005.qxd 6/29/2007 10:11 AM Page 103

from the same industry (45%) and other large firms from different industries mostfrequently (51%).
In terms of the local knowledge infrastructure, it is apparent from these resultsthat foreign firms source almost 19% of their knowledge (i.e. 12,580 citations)from the local sources. Considering that the total share of US patents granted toGermany-based technological activity was 8.5% between 1975 and 1995 (and7.8% between 1963 and 1995), this is a significant finding. It demonstrates thatthe propensity of foreign firms to use local sourcing is far greater than what mightbe expected if one were to follow a random distribution of technological activity.It highlights the importance of the host economy and suggests that (at least acrosscertain technologies) foreign firms are aware of the difficulty of learning fromafar and therefore use their subsidiaries to upgrade their technological abilitywithin certain fields of exploration (Almeida, 1996).
104 John Cantwell and Camilla Noonan
Table 5.3: Knowledge sources for foreign firms (by patent assignee).
Assignor Cites to home Cites to other Cites to local country of foreign knowledge
parent firm countries
Frequency % of Frequency % of Frequency % of total total total
(i) Is the same 3078 29.0 785 4.2 4380 42.0for citing andcited patent
(ii) Is another 2459 23.2 8368 44.5 1788 17.1large firm in the same industry
(iii) Is another 5073 47.8 9625 51.2 1831 17.5large firm in adifferent industry
(iv) To another 2 0.0 2 0.0 1648 15.8(smaller) firm
(v) Other 0 0.0 5 0.0 788 7.6
Total sample 10,612 100.0 18,785 100.0 10,435 100.0
Missing 8779 15,902 2145observations
Total cites 19,391 34,687 12,580
Ch005.qxd 6/29/2007 10:11 AM Page 104

A high proportion of self-citations to local invention are apparent in Table 5.3.This is unsurprising since knowledge creation is a cumulative process, and sobuilds up within each local context (even if what is being done is largely of anadaptive kind). Care should be taken, however, when interpreting results whereself-citations might constitute almost 50% of a sample, i.e. it is important to dif-ferentiate between inter- and intra-firm activity. Therefore, throughout this study,we make it clear whether self-citations have been included or excluded from theanalysis.8
It is unsurprising to note that the majority of patents citing local knowledgesources reference prior art that is attributed to the efforts of inventors in the BadenWürttemberg region (4.2%). This region not only hosts the greatest concentrationof patenting activity by foreign firms in Germany, but is also an important loca-tion for indigenous firms, particularly within the transportation technologies. Thenext most frequently cited region by foreign firms is Nordrhein-Westfalen — thehub of the German chemical industry and the favoured location for indigenousfirm technological activity. Foreign firms that locate in this region are highly spe-cialized across the mechanical technologies.
7. Age Distribution of Technology Sourcing
It has been suggested that geographical proximity may be the most important forabsorption of recently developed technologies. By ‘recent’ technologies, we meanfurther development of both extant fields of research as well as the creation ofwhole new areas through fusion or novel combination. The more novel (or new)is the technology, the more likely it is that the tacit component constitutes a sig-nificant barrier to further development from afar. Knowledge takes time to dif-fuse due to the difficulties of communicating its inherent characteristics that arefrequently quite intimately bound up with context. Cultural barriers to transmis-sion may also impede this. Co-location therefore becomes a crucial prerequisiteto the development of these highly tacit technologies. The importance of the tacitcomponent in technological activities is believed to have escalated in recenttimes, due mainly to the growing relatedness of technologies, which has beenlargely fuelled by the pervasive qualities of the science based technologies (Dosi,1982; Freeman & Perez, 1988; Cantwell & Fai, 1999; Von Tunzelmann & Wang,1999; Cantwell & Santangelo, 2000). Firms that wish to research at the techno-logical frontier in fields/sectors that are non-core to their business must co-locate
Exploring the Characteristics of Technology Spillovers 105
8While other analysts of citation data also make this distinction, the proportion of self-citations gen-erally goes unreported.
Ch005.qxd 6/29/2007 10:11 AM Page 105

alongside the international leaders within that particular technological field/sec-tor or in other words, within that appropriate international centre of excellence.
In marked contrast, geographical proximity is not seen to be as important aconsideration in the case of older inventions (Jaffe et al., 1998). Through time,codification of early inventions takes place, which serves to reduce the tacitdimension involved in such activities. This in turn means that these older inven-tions (or the basis for contemporary invention) can be drawn or built upon, with-out any need to co-locate.
Following this discussion, we investigate the age profile of the technologiescited at local level. By subtracting the issue date of the cited patent from that ofthe citing patent, one can ascertain the ‘age’ of the knowledge being acquiredfrom the various locations. A large difference between the two means that thetechnological know-how upon which the current inventor builds, was created ata much earlier point in time. In contrast, a smaller age difference signals thatmore contemporary knowledge is being drawn upon.
Figure 5.2 reports the results from this exercise. The three location categories areagain examined. Part (i) of the chart reports the age distribution for the citations thatreference inventions undertaken in the home country of the parent firm. While aconsiderable proportion of the citations references relatively recent inventions(�29% of the citation data reference inventions that were between 1 and 6 yearsold — modal values equalling 3 and 4 years), the rather skewed nature of this agedistribution is nonetheless apparent. It suggests that quite a large proportion of thecitations made by foreign firms to home country inventions refer to older innova-tions and as such supports the thesis that older inventions are more easily diffusedacross space.
Lower modal values (2 and 3 years) are found for references to inventionsoccurring in other foreign countries and approximately 40% of citations to inven-tions originating from these locations fall within the 6-year window (see part (ii)of the chart). Relative to the home country therefore, we can conclude that knowl-edge accessed by these subsidiaries from overseas locations is more recent.
Finally, part (iii) of the chart reports the age distribution of the knowledgebeing sourced by these subsidiaries from local (Germany-based) sources. Theresult is quite dramatic. While the modal value drops to 2 years, the proportion ofcitations that reference prior art within the 6-year window rises to over 50%. Incontrast to the results in parts (i) and (ii), the distribution is a lot more skewed forlocal sourcing of knowledge with the vast proportion of citations referencingwork that was invented within a 12-year window. This lends further support tothe suggestion that Germany is a centre of technological excellence for large foreign-owned firms who are attracted to this location to access and absorb cut-ting-edge knowledge within certain technological areas.
106 John Cantwell and Camilla Noonan
Ch005.qxd 6/29/2007 10:11 AM Page 106

Exploring the Characteristics of Technology Spillovers 107
(i) DATEDIF
92.0085.00
80.0075.00
70.0065.00
60.0055.00
50.0045.00
40.0035.00
30.0025.00
20.0015.00
10.005.00
.00
8
6
4
2
0
Per
cent
6
4
(ii)
(iii)
96.00
90.00
85.00
80.0070.00
65.00
60.00
55.00
50.00
45.00
40.00
35.00
30.0020.0015.005.00
0.00
10
8
6
4
2
0
75.0025.00
10.00
0
102.00
96.00
90.00
84.00
78.00
72.00
66.00
60.00
54.00
48.00
42.00
36.00
30.00
24.00
18.00
12.00
6.00
.00
14
12
10
8
6
4
2
0
Per
cent
Per
cent
DATEDIF
DATEDIF
Figure 5.2: Age distribution of technology sourcing. Citations to (i) home coun-try; (ii) other foreign countries; (iii) local knowledge sources.
Ch005.qxd 6/29/2007 10:11 AM Page 107

The increase in citation activity that takes place around inventions that areapproximately 45–60 years old is also interesting and deserves comment. Althoughthe percentage of citations that fall into this category is quite small, taken together,they exert a significant impact on the overall distribution. These citations, which aremuch older inventions, highlight the strong historic research base in Germany andpoints to the path-dependent nature of technological development at this location.9
In other words, although foreign firms primarily locate their R&D at this locationto access recent (or frontier-type) inventions, in doing so, they also draw from thecountry’s historic pool of technological expertise.10
In what follows, we focus solely upon the local sourcing of technologicalknow-how by foreign-owned firms.
8. The Regional Characteristics of Local Sourcing of Technological Knowledge
Table 5.4 reports the regional distribution of all references to the local knowledgebase in Germany. As noted above, total citations to local knowledge correspondsto approximately 19% (or 12,580) of the total citations sample. Taking the regionaldistribution of total citations as an indicator of the relative attractiveness of eachregion’s pool of technological expertize, it is clear that Baden Württemberg andNordrhein-Westfalen emerge as the most popular regions (accounting for 26% and23% (respectively) of total citations). The type of technological activities takingplace at these locations could of course bias this finding. To control for the highincidence of patenting that takes place across certain technologies, the proportionof citations made to each region’s technological infrastructure is divided by eachregion’s share of total corporate patents. Allowing for this regional specificity oftechnological specialization, it is clear that while two of the six regions attract anexpected proportion of total citations (following the distribution of foreign-ownedpatenting activity), Bayern and Nordrhein-Westfalen receive 50% and 20% morecitations than one might expect.
108 John Cantwell and Camilla Noonan
9This also highlights continued importance or relevance of older inventions that emanated from thislocation. In their examination of international knowledge flows, Jaffe and Trajtenberg (1998, p. 4)draw attention to the diffusion and obsolescence processes at play in knowledge-flow processes. Theauthors note that ‘while the probability that the inventor will know of a given antecedent increases(...) the probability that the antecedent will actually be helpful declines on an average’.10The ‘older’ technologies (i.e. >40 years) sourced by foreign subsidiaries are concentrated in mechan-ical technologies — particularly, miscellaneous metal products (14), other general industrial equipment(29), metal working equipment (17), other specialized machinery (28), chemical and allied equipment(16), other instruments and controls (53) and assembly and material handling equipment (20).
Ch005.qxd 6/29/2007 10:11 AM Page 108

In previous work (Cantwell & Noonan, 2000), we examined the technologyprofiles of foreign and indigenous firms at regional level and suggested that thepotential for intra-regional technological flows across similar lines of technolog-ical search was quite low. Since foreign and indigenous firms tended to special-ize across different technology sectors at regional level, our regression analysisrejected the hypothesis that regionally bound inter-firm flows involved interac-tions within particular sectors of technological development.11 Evidence pointedto the fact that such forms of technological exchange were more likely to befound at the inter-regional level. Of course, this analysis failed to acknowledgethe fact that inter-firm exchange might well occur across different technologiesthat are somehow complementary to one another.
Using the citation data set, we explore this issue. By examining the proportionof citations that reference ‘within region’ research (i.e. the proportion of citingand cited patents that have been attributed the same NUTS regional code), we can
Exploring the Characteristics of Technology Spillovers 109
11Since this analysis was done at an aggregate level, there was still the possibility that exchange mayhave occurred across certain technology fields. For example, both foreign and indigenous firms arespecialized in other transport equipment (47) in Baden Württemberg and Niedersachsen, other gen-eral industrial equipment, (29) in Nordrhein-Westfalen and Niedersachsen, metal working equipment,(17) in Nordrhein-Westfalen, and printing and publishing, (26) in Hessen.
Table 5.4: Ratio of citations to patents, by region.
Region Total citations % of Total % of Ratio to local Total Foreign Total (citations/innovation patents patents)1975–1995a 1969–1995b
Baden Württemberg 2698 26.3 4828 31.1 0.8Bayern 2103 20.5 2158 13.9 1.5Hessen 1277 12.4 2158 13.9 0.9Niedersachsen 493 4.8 792 5.1 0.9Nordrhein-Westfalen 2363 23.0 2965 19.1 1.2Rheinl and-Pfalz 508 5.0 745 4.8 1.0Others 816 8.0 1878 12.1 0.7
Total 10,258 100.0 15,523 100.0 1.0
aThis column details total patents granted to the research facilities of large foreign-owned firmsbased in Germany 1969–1995.bA total of 12,580 citations are made to local invention. Of this, location codes for 2322 citationsare missing from the sample.
Ch005.qxd 6/29/2007 10:11 AM Page 109

ascertain the relative importance of regionally-bound knowledge exchange. Theresults from this investigation are reported in Table 5.5.
The regional locations of the ‘citing’ patents are listed vertically in this table.It is from these regions that references to the knowledge pools of other (‘cited’)regions emanate. Because the firms located within these regions reference theprior invention that occurred elsewhere, they may be considered to be the bene-factors of technologies developed outside of their region. Other authors havereferred to these ‘citing’ regions as spillover recipients (Maurseth & Verspagen,2002, p. 536). The generators of corporate technological expertise are representedalong the horizontal of this table (the ‘cited patents’). In addition to the six mainregions, this list aggregates the remaining 10 regions into ‘other’ to facilitate anexamination of technology sourcing by foreign firms located in these regions. Itis clear, for example, that foreign firms located in these ‘other’ regions source thegreatest proportion of technology from the southern region of Bayern (34.4%).Closer examination of the data reveals that it was foreign firms located in thenorthern regions of Hamburg and Schleswig Holstein that lay behind this figure.
In terms of the absolute number of citations to the knowledge pool of the host economy, it is clear that foreign firms located in Baden Württemberg andNordrhein-Westfalen hold the leading position — they account for 2896 (30%)and 2098 (22%) respectively, of the total references to the knowledge infrastruc-ture in Germany.
The diagonal of this table refers to the proportion of total patent citations thatreference activity that takes place within the region. It is clear from these resultsthat a large proportion of knowledge sourcing is regionally bound. For example, ifwe consider the citation patterns of foreign-owned firms located in Hessen, it isapparent that approximately 42% of the local knowledge is sourced from withinthe region. A further 25% is sourced from Baden Württemberg. Indeed, with oneexception (Nordrhein-Westfalen), it is striking how important Baden Württembergis as a source of knowledge for foreign firms located across Germany. Next to themore proximate intra-regional knowledge sources, Baden Württemberg hosts themost important pool of knowledge for foreign-owned firms located in Germany.One possible explanation is that congestion effects in this core region may haveforced firms to relocate elsewhere and tap into the region’s knowledge pool froma distance.
The results suggest that in relative terms, knowledge is most regionally boundin the cases of Nordrhein-Westfalen (62%) and Bayern (59%) and less so in thecase of Rheinland Pfalz (21%). By dividing the proportion of intra-regionalknowledge sourcing by the proportion of total patents attributed to the researchactivities of each region, we can ascertain the degree to which ‘own region’ sourc-ing coincides with what might be termed a random geographic draw. This is
110 John Cantwell and Camilla Noonan
Ch005.qxd 6/29/2007 10:11 AM Page 110

Exploring the C
haracteristics of Technology Spillovers111
Table 5.5: Percentage of citations to regional versus outside knowledge.
Regional location of ‘cited’ patents
Regional Baden Bayern Hessen Nieder- Nordrhein Rheinland- Total Absolute numberlocation of Württemberg sachsen Westfalen Pfalz (%) of citations to ‘citing’ patents local knowledgea
Baden 53.1 17.5 7.8 2.4 15.1 4.1 100 2896WürttembergBayern 16.4 59.4 6.8 1.5 12.7 3.3 100 1416Hessen 20.5 13.5 41.5 3.3 14.2 7.0 100Niedersachsen 24.5 10.3 8.4 41.7 11.6 3.4 100 549Nordrhein- 11.2 13.1 6.5 3.0 62.0 4.2 100 2098WestfalenRheinland-Pfalz 24.2 12.4 20.0 6.7 16.2 20.5 100 524(Others) 27.2 34.4 9.4 5.8 18.5 4.7 100 447
aSince we are interested in investigating the degree to which knowledge sourcing might be considered regionally bound, these figures correspond tothe 9442 citations that reference the knowledge bases of the 6 core regions.
Ch005.qxd 6/29/2007 10:11 AM Page 111

reported in Figure 5.3. It is quite evident that in all cases, the ‘within region’sourcing is far greater than what might be expected if one were to follow a ran-dom distribution of corporate technological activity. This is most noticeable in thecase of Niedersachsen where regionally bound citations are far greater than whatone might have expected, given the proportion of technological activity takingplace in this region.
Focusing solely upon inter-firm technology flows i.e. extracting all self citations(Table 5.6), it is unsurprising to find that the proportion of regionally-bound knowl-edge sourcing declines in all cases — by 18% in Baden Württemberg; 33% inBayern; 21% in Hessen; 23% in Nordrhein-Westfalen; and 18% in Rheinland Pfalzand the ranking of the regions alters. While Nordrhein-Westfalen continues to hostthe greatest proportion of inter-firm technological activity, Baden Württembergnow replaces Bayern as hosting the second highest degree of inter-firm activity. A dramatic decline is recorded in the case of Niedersachsen (35%) and together withthe low relative degree of intra-regional sourcing in Rheinland-Pfalz, these regionsmay be described as having an above average reliance on the technologies beingdeveloped extra-regionally.
Regions that record relatively low degrees of locally bound sourcing may bereferred to as satellite locations for foreign firms, i.e. firms locate their R&D inthese regions but source the requisite technological know-how from the knowledgepools of other German regions. Although firms located in Baden Württemberg andNordrhein-Westfalen source more than 30% of their knowledge from within theregion, as a general observation, one might conclude that the vast majority ofknowledge sourcing by foreign-firms is not regionally bound.12
112 John Cantwell and Camilla Noonan
12Given that the greatest distance in Germany (from Northeast to Southwest) is approximately 600 milesand this country boasts a highly developed research infrastructure, this result is perhaps unsurprising.
Figure 5.3: Patterns of intra-regional of technology sourcing.
02468
10
Baden
W.
Bayer
n
Hesse
n
Nieder
s.
Nordr
hein-
W.
Rld-Pfa
lz
%
Ch005.qxd 6/29/2007 10:11 AM Page 112

Exploring the C
haracteristics of Technology Spillovers113
Table 5.6: Percentage of citations to regional versus outside knowledge (no self cites).
Regional location of ‘cited’ patents
Regional Baden Bayern Hessen Niedersachsen Nordrhein- Rheinland- (%) Absolute Numberlocation of Württemberg Westfalen Pfalz Total of self citations‘cited’ (% of total citationspatents to local knowledge)
Baden 34.8 17.0 14.3 4.9 24.3 4.6 100.0 1332 (46)WürttembergBayern 28.2 26.9 15.4 3.9 22.2 3.4 100.0 560 (40)Hessen 32.9 13.8 20.3 7.3 18.5 7.1 100.0 666 (44)Niedersachsen 43.3 10.4 18.6 6.7 18.0 3.1 100.0 264 (48)Nordrhein- 23.5 14.5 12.1 7.0 38.6 4.3 100.0 866 (41)WestfalenRheinland- 31.5 9.7 28.9 8.6 19.0 2.3 100.0 302 (58)Pfalz
(Others) 0.0 0.0 0.0 0.0 0.0 0.0 0.0 0
Ch005.qxd 6/29/2007 10:11 AM Page 113

The relatively strong reliance on intra-regional technology sourcing withinNordrhein-Westfalen persists when intra-firm activity is controlled for.Approximately 39% of inter-firm activity is localized, which suggests that thisregion might be classified (at least in relative terms) as being technologicallyself-contained within the German context. Firms located in Nordrhein-Westfalenextract additional sources of knowledge from Baden Württemberg (24%). Takentogether, approximately 63% of the inter-firm knowledge sourced by firmslocated in Nordrhein-Westfalen is accounted for flows occurring within theregion and between this region and Baden Württemberg. Indeed, the importanceof Baden Württemberg becomes even more striking when focusing solely uponthese inter-firm technological activities. With the exception of Nordrhein-Westfalen (and Baden Württemberg) itself, it is apparent that firms located in allother regions source a greater percentage of technological know-how from theBaden Württemberg region than they do from their ‘home’ regions – Bayern,28%; Hessen, 33%; Niedersachsen, 43% and Rheinland Pfalz, 32%. As such,the knowledge reservoir embedded within the firms and infrastructures of BadenWürttemberg may be viewed as an important centripetal force for attractinginward investment in R&D in Germany.13 Substantial reliance (i.e. >20%) onextra-regional sources is also apparent in the cases of Baden Württemberg andBayern (whose firms’ access a significant amount of knowledge from firmslocated in Nordrhein-Westfalen) and Rheinland-Pfalz, where firms interact withtheir counterparts in Hessen when sourcing knowledge.
9. Characteristics of Intra- versus Inter-Regional Sourcing of Knowledge
This section investigates the degree to which the regionally bound sources oftechnology for foreign firms are related to local areas of strength. A CitationsRevealed Technological Advantage index (RTA*) is calculated as
P P
P Pij iw
j wii
* *
* *∑∑
114 John Cantwell and Camilla Noonan
13Since Baden Württemberg is the source of much technological knowledge for foreign-owned firmswithin Germany, they may be seen to be forging common architectural conceptions of knowledgebetween this region and their regional homes in Germany (Henderson & Clarke, 1990).
Ch005.qxd 6/29/2007 10:11 AM Page 114

where i�Technology 1, . . ., 56j�Region 1, . . ., 6P* �Cited patentPw
* �Global citations14
Two different ‘Citations RTA’ indices are calculated. The first captures the tech-nology sources tapped into by foreign-owned firms located within a region (i.e.intra-regional sources or in other words, the activities undertaken by ‘insiders’).The second captures the technology sources availed of by foreign-owned firmslocated outside of any particular region (i.e. that undertaken by ‘outsiders’). Thisdifferentiation is made as a prerequisite to examining the characteristics of intra-versus inter-regional communication within technological space. Results from thisexercise are reported in Table 5.7.15
Looking at the results of the Pearson correlation, it is clear that little relation-ship exists between the profiles of intra-versus inter- regional technology sourc-ing. In other words, the technologies being accessed by firms located within aregion are in different fields to those being accessed by firms located outside theregion. The one exception is Hessen, which is located in the centre of Germanyand borders the five other regions. Regardless of location, firms seem to tap intosimilar lines of technological expertise embedded in this region. Technologiesaccessed by both ‘insiders’ and ‘outsiders’ are spread across all macro groups —mechanical technologies (14, 29, 27 and 31), chemical technologies (6 and 9),transport technology (43) and electronic technology (36).16
To ascertain whether the technology sourcing profiles of these ‘insiders’ and‘outsiders’ are related to technology specialization profiles of foreign and indige-nous firms located in each region, a regression analysis is undertaken:
wherej�Region 1, ..., 6i�Technology 1, ..., 56
Exploring the Characteristics of Technology Spillovers 115
14Global citations are represented here by those emanating from the technological activity of foreign-owned firms in Germany.15As noted above, the proxy for ‘world’ citations in this formula is generated by the citation activityof foreign firms in Germany only. This ‘Citations RTA’ therefore captures each region’s relativeattractiveness within the German context (and not within the global context, which is what the RTAusually captures).16Examples where both ‘insiders’ and ‘outsiders’ tap into the same fields of technology are of courseevident from Table 5.7. In the case of Baden Württemberg, for example, although the sourcing indicesare in general uncorrelated for these two groups of firms, they both source know-how within elec-tronic technologies 35, 36 and 39 from this region.
Ch005.qxd 6/29/2007 10:11 AM Page 115
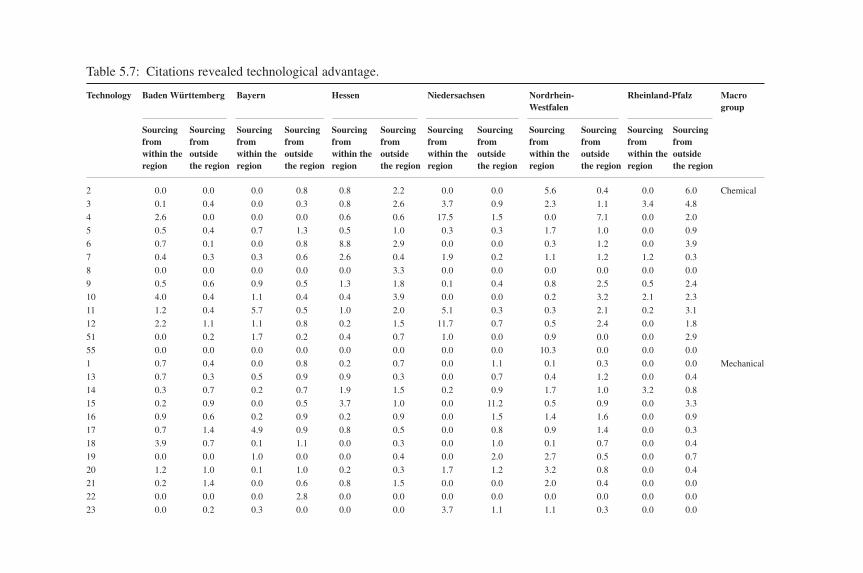
Table 5.7: Citations revealed technological advantage.
Technology Baden Württemberg Bayern Hessen Niedersachsen Nordrhein- Rheinland-Pfalz MacroWestfalen group
Sourcing Sourcing Sourcing Sourcing Sourcing Sourcing Sourcing Sourcing Sourcing Sourcing Sourcing Sourcingfrom from from from from from from from from from from fromwithin the outside within the outside within the outside within the outside within the outside within the outsideregion the region region the region region the region region the region region the region region the region
2 0.0 0.0 0.0 0.8 0.8 2.2 0.0 0.0 5.6 0.4 0.0 6.0 Chemical
3 0.1 0.4 0.0 0.3 0.8 2.6 3.7 0.9 2.3 1.1 3.4 4.8
4 2.6 0.0 0.0 0.0 0.6 0.6 17.5 1.5 0.0 7.1 0.0 2.0
5 0.5 0.4 0.7 1.3 0.5 1.0 0.3 0.3 1.7 1.0 0.0 0.9
6 0.7 0.1 0.0 0.8 8.8 2.9 0.0 0.0 0.3 1.2 0.0 3.9
7 0.4 0.3 0.3 0.6 2.6 0.4 1.9 0.2 1.1 1.2 1.2 0.3
8 0.0 0.0 0.0 0.0 0.0 3.3 0.0 0.0 0.0 0.0 0.0 0.0
9 0.5 0.6 0.9 0.5 1.3 1.8 0.1 0.4 0.8 2.5 0.5 2.4
10 4.0 0.4 1.1 0.4 0.4 3.9 0.0 0.0 0.2 3.2 2.1 2.3
11 1.2 0.4 5.7 0.5 1.0 2.0 5.1 0.3 0.3 2.1 0.2 3.1
12 2.2 1.1 1.1 0.8 0.2 1.5 11.7 0.7 0.5 2.4 0.0 1.8
51 0.0 0.2 1.7 0.2 0.4 0.7 1.0 0.0 0.9 0.0 0.0 2.9
55 0.0 0.0 0.0 0.0 0.0 0.0 0.0 0.0 10.3 0.0 0.0 0.0
1 0.7 0.4 0.0 0.8 0.2 0.7 0.0 1.1 0.1 0.3 0.0 0.0 Mechanical
13 0.7 0.3 0.5 0.9 0.9 0.3 0.0 0.7 0.4 1.2 0.0 0.4
14 0.3 0.7 0.2 0.7 1.9 1.5 0.2 0.9 1.7 1.0 3.2 0.8
15 0.2 0.9 0.0 0.5 3.7 1.0 0.0 11.2 0.5 0.9 0.0 3.3
16 0.9 0.6 0.2 0.9 0.2 0.9 0.0 1.5 1.4 1.6 0.0 0.9
17 0.7 1.4 4.9 0.9 0.8 0.5 0.0 0.8 0.9 1.4 0.0 0.3
18 3.9 0.7 0.1 1.1 0.0 0.3 0.0 1.0 0.1 0.7 0.0 0.4
19 0.0 0.0 1.0 0.0 0.0 0.4 0.0 2.0 2.7 0.5 0.0 0.7
20 1.2 1.0 0.1 1.0 0.2 0.3 1.7 1.2 3.2 0.8 0.0 0.4
21 0.2 1.4 0.0 0.6 0.8 1.5 0.0 0.0 2.0 0.4 0.0 0.0
22 0.0 0.0 0.0 2.8 0.0 0.0 0.0 0.0 0.0 0.0 0.0 0.0
23 0.0 0.2 0.3 0.0 0.0 0.0 3.7 1.1 1.1 0.3 0.0 0.0
Ch005.qxd 6/29/2007 10:11 AM Page 116

24 1.0 0.0 0.0 2.4 0.0 0.0 0.0 0.0 0.0 0.0 0.0 0.0
25 1.9 1.1 0.3 1.6 0.9 0.8 0.0 0.5 4.1 0.7 0.4 1.9
26 0.7 0.0 0.0 0.3 3.9 0.0 0.0 1.3 0.1 0.2 0.0 0.0
27 0.8 0.0 0.0 0.0 2.0 2.0 0.0 0.0 0.0 3.6 0.0 6.4
28 1.4 0.5 0.3 0.5 1.4 0.6 0.5 0.9 1.0 2.2 2.6 0.4
29 0.8 2.7 1.2 0.7 1.8 1.8 2.7 1.6 0.8 0.7 5.1 1.5
31 1.2 3.4 0.0 0.1 2.5 2.9 0.0 0.0 0.0 0.1 2.7 2.1
50 0.5 0.5 0.9 0.7 0.2 0.7 0.1 0.9 3.0 0.8 0.2 1.2
53 1.4 1.0 0.4 1.8 0.2 0.8 0.4 0.6 0.6 0.5 0.3 0.5
30 0.3 0.9 0.7 3.5 0.0 0.6 0.0 3.2 0.5 0.4 0.0 0.5 Electronic
33 0.9 0.7 1.8 0.8 0.1 0.1 0.0 1.9 0.1 0.3 0.0 0.3
34 0.7 0.3 0.2 0.6 0.1 0.0 0.0 0.3 0.0 0.1 0.0 0.4
35 1.2 1.9 10.2 2.1 0.0 0.0 0.0 0.0 0.5 0.1 0.0 0.0
36 1.4 1.2 0.4 0.8 1.3 1.5 1.5 3.0 0.0 0.1 0.0 0.0
7 0.9 0.6 0.1 1.7 0.3 0.1 0.0 0.9 2.2 0.9 0.0 0.0
38 0.7 0.7 0.9 1.3 0.4 0.4 0.1 0.8 0.3 0.5 0.3 0.1
39 1.4 1.1 0.2 0.9 0.6 0.7 0.0 0.1 0.8 0.6 0.2 0.6
40 1.5 0.6 0.6 1.5 0.3 0.2 0.0 0.3 0.1 0.0 0.0 0.2
41 1.1 0.4 0.3 0.8 1.1 0.8 0.9 1.5 0.1 0.1 0.0 0.2
52 1.0 0.2 0.0 2.2 1.2 0.4 0.0 2.9 0.0 0.2 0.0 0.0
42 0.6 5.2 1.0 0.8 0.7 0.0 0.0 0.0 0.2 0.4 0.0 0.5 Transport
43 0.4 2.8 0.7 4.7 6.0 1.6 0.4 1.8 1.7 0.7 1.8 1.7
44 0.7 0.0 0.0 2.5 0.0 0.0 0.0 0.0 0.0 0.0 0.0 0.0
45 0.0 0.9 0.0 0.0 0.0 0.0 0.0 0.0 0.0 1.0 0.0 0.0
46 0.7 0.9 0.6 1.6 0.0 0.8 0.0 0.0 2.4 1.4 0.0 0.0
47 2.8 0.0 0.3 1.2 0.4 1.2 0.0 1.7 0.4 0.9 0.0 0.8
49 0.1 0.4 0.2 0.8 0.9 0.5 0.0 4.3 0.9 1.7 0.6 2.0
32 3.2 0.0 0.0 2.2 0.3 2.3 0.0 0.4 0.2 6.9 3.0 2.4
48 0.0 0.0 0.0 0.0 0.0 0.0 0.0 0.0 0.0 0.0 0.0 0.0 Other
54 2.6 3.5 0.0 2.3 1.8 0.0 0.0 10.9 0.0 1.6 0.0 1.4
56 0.2 0.5 0.0 1.4 0.9 0.0 0.0 0.0 0.7 0.9 1.8 0.0
Total 1.0 1.0 1.0 1.0 1.0 1.0 1.0 1.0 1.0 1.0 1.0 1.0
Pearson 0.083 0.077 0.339* �0.014 �0.138 0.217
correlation
Ch005.qxd 6/29/2007 10:11 AM Page 117

�, � and � are the regression coefficients�i = a residualRTAf = Technology specialization of foreign firms (1969–1995)17
RTAg = Technology specialization of indigenous firms (1969–1995)RTAj
* �Technology sourcing profile for firms located in region j(1975–1995)
RTA*jo �Technology sourcing profile for firms located outside region j
that source technologies from region j (1975–1995)
The following hypotheses are then tested for each of the six regions:
RTA*j ���� RTAfj �� RTAgj � �i (1)
RTA*jo���� RTAfj� � RTAgj � �i (2)
The results from these regressions are reported in Table 5.8. These results sug-gest that while intra-regional sourcing by foreign-owned firms tends to follow thelocal technology specialization patterns of foreign-owned firms, sourcing byfirms located outside the region tends to emulate the specialization profiles ofindigenous German firms within each region. This former result may be unsur-prising, given the fact that a large percentage of intra-regional citations are selfcites.18 However, even if all incidences of self-citation are omitting from the sam-ple and the regressions re run, it is clear that (with the exception of RheinlandPfalz) these relationships continue to hold (see Table 5.9).19
The patterns of local-technology sourcing that emerge from this analysis arerepresented in Figure 5.4.
118 John Cantwell and Camilla Noonan
17This was calculated using total patents granted to foreign-owned (RTAf) and indigenous Germanfirms (RTAg) 1969–1995.18Approximately 43% of the 9442 citations under study are self cites and of these, approximately 78%are regionally bound.19As can be seen in Table 5.9, there are a number of exceptions to this overall finding. While the former result (i.e. intra-regional citations are correlated to the technology specialization of foreign-owned firms at regional level) holds in all regions but Nordrhein-Westfalen and Rheinland-Pfalz, exceptions to the latter result (i.e. that citation from outside the region are correlated to the technological specialization of indigenous firms) are found in the Niedersachsen and Bayernregions.
Ch005.qxd 6/29/2007 10:11 AM Page 118
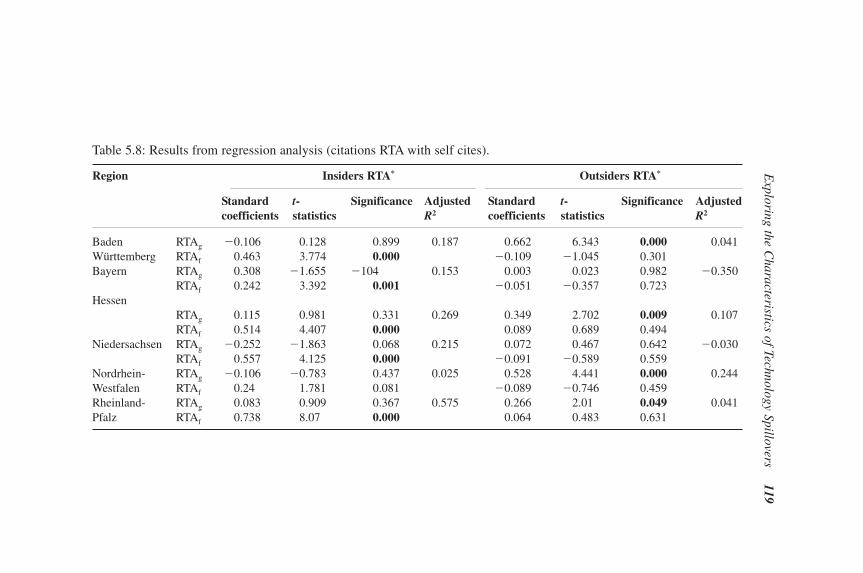
Exploring the C
haracteristics of Technology Spillovers119
Table 5.8: Results from regression analysis (citations RTA with self cites).
Region Insiders RTA* Outsiders RTA*
Standard t- Significance Adjusted Standard t- Significance Adjustedcoefficients statistics R2 coefficients statistics R2
Baden RTAg �0.106 0.128 0.899 0.187 0.662 6.343 0.000 0.041Württemberg RTAf 0.463 3.774 0.000 �0.109 �1.045 0.301Bayern RTAg 0.308 �1.655 �104 0.153 0.003 0.023 0.982 �0.350
RTAf 0.242 3.392 0.001 �0.051 �0.357 0.723Hessen
RTAg 0.115 0.981 0.331 0.269 0.349 2.702 0.009 0.107RTAf 0.514 4.407 0.000 0.089 0.689 0.494
Niedersachsen RTAg �0.252 �1.863 0.068 0.215 0.072 0.467 0.642 �0.030RTAf 0.557 4.125 0.000 �0.091 �0.589 0.559
Nordrhein- RTAg �0.106 �0.783 0.437 0.025 0.528 4.441 0.000 0.244Westfalen RTAf 0.24 1.781 0.081 �0.089 �0.746 0.459Rheinland- RTAg 0.083 0.909 0.367 0.575 0.266 2.01 0.049 0.041Pfalz RTAf 0.738 8.07 0.000 0.064 0.483 0.631
Ch005.qxd 6/29/2007 10:11 AM Page 119
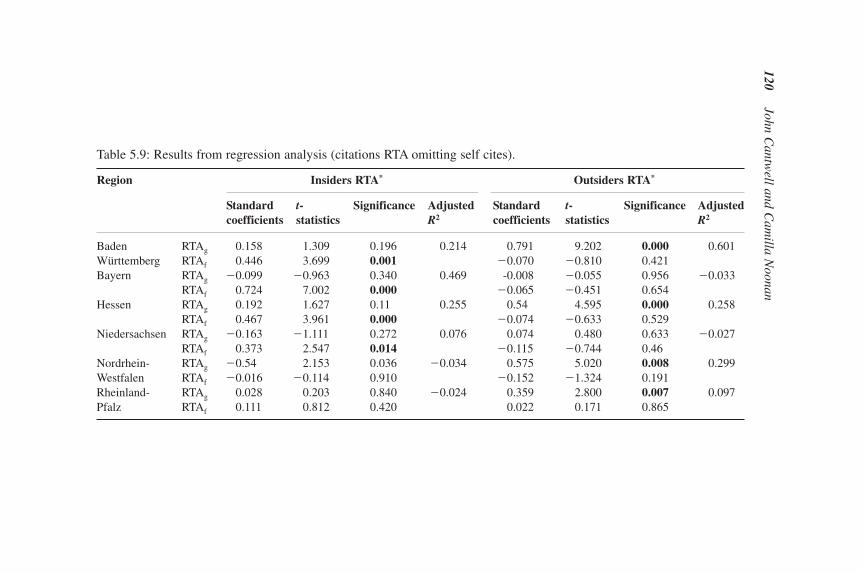
120John C
antwell and C
amilla N
oonan
Table 5.9: Results from regression analysis (citations RTA omitting self cites).
Region Insiders RTA* Outsiders RTA*
Standard t- Significance Adjusted Standard t- Significance Adjustedcoefficients statistics R2 coefficients statistics R2
Baden RTAg 0.158 1.309 0.196 0.214 0.791 9.202 0.000 0.601Württemberg RTAf 0.446 3.699 0.001 �0.070 �0.810 0.421Bayern RTAg �0.099 �0.963 0.340 0.469 -0.008 �0.055 0.956 �0.033
RTAf 0.724 7.002 0.000 �0.065 �0.451 0.654Hessen RTAg 0.192 1.627 0.11 0.255 0.54 4.595 0.000 0.258
RTAf 0.467 3.961 0.000 �0.074 �0.633 0.529Niedersachsen RTAg �0.163 �1.111 0.272 0.076 0.074 0.480 0.633 �0.027
RTAf 0.373 2.547 0.014 �0.115 �0.744 0.46Nordrhein- RTAg �0.54 2.153 0.036 �0.034 0.575 5.020 0.008 0.299Westfalen RTAf �0.016 �0.114 0.910 �0.152 �1.324 0.191Rheinland- RTAg 0.028 0.203 0.840 �0.024 0.359 2.800 0.007 0.097Pfalz RTAf 0.111 0.812 0.420 0.022 0.171 0.865
Ch005.qxd 6/29/2007 10:11 AM Page 120

10. Conclusions
This chapter presented a descriptive analysis of the technology sourcing activitiesbetween 1975 and 1995 of foreign firms located in Germany. From this initialexamination of the citation activity of foreign-owned firms, a number of issuesemerge. First, relative to a random distribution of international patenting activity, itis clear that foreign firms source a high proportion of knowledge from this hostcountry (�19%). This highlights the importance of Germany as an internationalsource of technological know-how. Further, support is found when one considersthe nature of technological activity undertaken at this location. Since relatively fewcitations lead back to the knowledge pool of the parent firm, the technologicalactivities undertaken in Germany may be categorized as home base augmenting —rather than building upon prior research of the parent, new lines of technologicalsearch are pursued at this location. The age profile of the knowledge sourced fromthis location provides further evidence. In contrast to that sourced from the homelocation and indeed from other foreign locations, technologies accessed locally inGermany may be classified as ‘younger’. This underscores the importance of phys-ical presence at locations that host cutting edge research — because the tacit com-ponent is likely to be higher across recently developed technologies, firms mustlocate within the appropriate international centre of excellence to breathe in the airof innovation.
Exploring the Characteristics of Technology Spillovers 121
Foreign Foreign
Foreign Foreign
Indigenous
Indigenous
REGION A
REGION B
Figure 5.4: Patterns of inter-/intra-regional technology sourcing.
Ch005.qxd 6/29/2007 10:11 AM Page 121

While a high degree of regionally bound sourcing was found, this was essentiallydue to the inclusion of self-citations. Removing these from the analysis reduced theoverall degree of knowledge localization at regional level (as expected) and the regional rankings changed. While intra-region sourcing continues to be relativelystrong within Nordrhein-Westfalen, Baden Württemberg replaces Bayern as the second most important location for regionally bound inter-firm activity. Attention was also drawn to Baden Württemberg since firms located in Bayern, Hessen,Niedersachsen and Rheinland-Pfalz source a greater proportion of technology fromtheir counterparts in this region than they do locally. A very low reliance on intra-regional sources of inter-firm technology exchange occurs in Niedersachsen andRheinland Pfalz, which seems to support the suggestion that firms use these locationsas satellite positions from which to access knowledge elsewhere in Germany.
Examining the nature of technology sourcing by foreign firms, the regressionanalysis suggests that while indigenous firms provide knowledge that can beaccessed from any part of Germany, knowledge provided by the foreign firmsthemselves seems to be more regionally bound. A number of potential explana-tions lie behind this finding. For example, it is possible that indigenous firms per-ceive the foreign-owned firms located within the same region as a competitivethreat and are therefore slow (or unwilling) to allow them access to their in-houseknowledge infrastructures. In contrast, foreign-firms that seek to tap into indige-nous knowledge from afar (i.e. outside the region) are not seen to pose as large athreat. This focuses attention upon the emitting capacity of indigenous firmswithin their regions and highlights how this can be used to weaken (or indeed pre-vent) technology flows between firms.20
While the degree of inter-firm knowledge spillovers (or technology interac-tion) depends upon both the nature of the technology and the absorptive capac-ity of recipient firms, the importance of the emitting capacity in such contexts hasnot received much attention in this literature (Amesse & Cohendet, 2001). Thislatter concept relates to the producers of knowledge and their ability to success-fully communicate this knowledge to the outside world. The quality of the knowl-edge transfer process is seen to be highly dependent upon such considerations.Just as firms display high variation in their absorptive capabilities, they alsorecord substantial differences in their ability to communicate with agents lying outside their organization.21 Cohendet and Meyer-Krahmer (2001, p. 1575)
122 John Cantwell and Camilla Noonan
20This is consistent with the fact that one of the major weaknesses within the German system is therelatively poor linkages, that exist between indigenous industries (Temple, 1998, p. 275).21Of course, the codified element of the newly created knowledge that is reported within the patentdocument is publicly available, but successful replication (and understanding) of this knowledgerequires the replicating firm to establish contact with the highly complementary tacit component ofthis knowledge. His ability to do this is first and foremost determined by the emitting capability of thepatentee (or owner of the knowledge).
Ch005.qxd 6/29/2007 10:11 AM Page 122

further explain how this emitting capacity may be associated with intentionalselectivity on the part of the firm:
The producer of knowledge has emitting capacities. An agent pro-ducing new knowledge will generally operate a selection betweencommunities: on the one side, he will consider to which commu-nities the new knowledge is addressed, and on the other side,whose communities that he chooses to exclude.
The authors (ibid. p. 1584) explain how firms that provide assistance to theirstrategic partners (through investment in knowledge-sharing routines, for exam-ple) are thereby engaged in a process of deliberately enhancing the absorptive andemitting capacities of their partners:
In other words, the management of the technology process isessentially bi-directional. What matters is more the co-evolutionof the mutual absorptive and emitting capacities between partners,than the mere observation of the technology flow between anemitter and a receiver.
Results from the citation analysis may be interpreted in the context of this contribution. Since the technologies drawn on by foreign firms do not reflectlocal technological expertise of indigenous firms, one might conclude that a co-evolution of the mutual absorptive and emitting capacities between large foreign-and German-owned firms has simply failed to be developed at regional level inGermany.
In marked contrast, these capabilities appear to have successfully amassedbetween the large foreign-owned firms. While it is beyond the remit of this studyto adequately examine this issue in further detail, one might suggest that itreflects the mature stage of regional technology clusters within Germany. Ratherthan attributing the dynamism of regional technology clusters to the expertise oflarge indigenous firms (as has tended traditionally to be the case in the literature),one might reassess this idea and acknowledge the role played by the foreign-owned firms in such considerations. At least within the German context, theresults from this analysis suggest that the knowledge embedded within foreign-owned firms is what drives the regionally-bounded technology activity of foreign-owned firms within these clusters.
In addition to the possibility that indigenous firms view foreign firms as con-stituting a threat within the region, perhaps foreign-owned firms manage to com-municate more effectively with one another since they are faced with similar setsof issues. Operating as subsidiaries of larger companies and being located in a
Exploring the Characteristics of Technology Spillovers 123
Ch005.qxd 6/29/2007 10:11 AM Page 123

(relatively) unfamiliar environment, it is likely that they are confronted with(broadly) similar sets of concerns — how to deal with local laws and legislation;challenges — how to access the local networks and infrastructures and opportu-nities. They share the common goal of knowledge-seeking activity and may beseen to employ a common framework that enables them to operate within theGerman environment. They therefore manage to simultaneously build both theirabsorptive and emitting capacities at local level. In a similar vein (and drawingon Henderson and Clarke (1990)), Phene and Tallman (2002) refer to the impor-tance of cluster specific architectural knowledge that:
(...) develops through common experiences, regular formal andinformal interaction, exchange of personnel, alliances, buyer andsupplier relationships, personal friendships and a variety of othereconomic and social relationships. By providing similar conceptsof ‘how the world works’ to firms in a region, shared architecturalknowledge makes the exchange and interpretation of componentor technical knowledge easier.
While the authors emphasize the varying nature of this architectural knowl-edge across different national clusters (owing to language differences, culturaland ideological concerns (ibid., p. 6), we suggest that such variations may alsoexist within a national context — but between the foreign and indigenous firmgroupings at regional level. Although these German-owned firms are multina-tional enterprises and have exposure to international business, their activities aregreatly influenced by their common domestic business culture/infrastructure. Inother words, through time, these firms are likely to have developed shared mean-ings about business; technology and the indigenous/foreign divide within thelocal market.
Because they are less likely to have developed similar sets of shared meaningswith their foreign counterparts from an early stage (and accepting that this con-stitutes a foundation stone for deeper inter-firm interaction), one might suggestthat indigenous firms thereby reduce the possibility of creating networks thatfacilitate intra-regional exchange.22 In doing so, they (intentionally?) fail to co-develop the capabilities needed to interface with their foreign neighbours acrossthe more tacit dimensions of technological activity that exhibit a distinctlyregional character.
124 John Cantwell and Camilla Noonan
22Sternberg (2000, p. 111) reports a similar finding in the case of regional research institutes inGermany. In his survey of intra- and inter-regional linkages between these institutes and foreign firms,the author finds that cooperation with foreign enterprises is on an average quite rare.
Ch005.qxd 6/29/2007 10:11 AM Page 124

These results may also be consistent with the notion that foreign firms locatewithin particular regions to facilitate interaction within the indigenousMittelstand sector. Many authors have highlighted the importance of these small-and medium-sized firms within the technology/innovation domain in Germany.Rather than seeking explanations through foreign firm interaction with their(large firm) German counterparts, perhaps interaction with indigenous firmstakes place at this level (data in Table 5.3 show that approximately 16% of localcitations are to another (smaller) firm).
One final point — while the intra-regional picture suggests that large firminteraction is dominated by technology flows between foreign-owned firmsthemselves, the analysis at inter-regional level points to the potential for inter-firm flows between foreign and indigenous multinational firms. This is consis-tent with the recent conceptualization of the learning region presented byBoekema et al. (2000). The authors conclude that the learning region refers toplural ‘regions’ rather than to any singular region and emphasize that a high levelof mutual learning between regional agents (i.e. inter regional exchange) is whatcharacterises economically successful regions. Following this, it is clear thatwhile large indigenous firms do not constitute the most proximate source of tech-nological know-how for foreign-owned firms within the regions, their technolog-ical expertise is nonetheless an extremely important input into the knowledgeactivities of these firms. Perhaps these technologies are older and more easilysourced from afar?
A more micro examination of the nature of these localized and more dispersedinter-firm technology flows is an important path for future research.
References
Alcacer, J. & Gittelman, M. (2006). Patent citations as a measure of knowledge flows: Theinfluence of examiner citations. Review of Economics and Statistics, 88(4), 774–779.
Almeida, P. (1996). Knowledge sourcing by foreign multinationals: Patent citation analy-sis in the U.S. semiconductor industry. Strategic Management Journal, 17, 155–165.
Almeida, P., & Kogut, B. (1999). Localization of knowledge and the mobility of engineersin regional networks. Management Science, 45, 905–917.
Amasse, F., & Cohendet, P. (2001). Technology transfer revisited from the perspective ofthe knowledge-based economy. Research Policy, 30, 1459–1478.
Archibugi, D. & Pianta, M. (1992). The technological specialization of advanced coun-tries: A report to the EEC on international science and technology activities. Dordrecht,The Netherlands: Kluwer.
Boekema, F., Morgan, K., Bakkers, S. & Rutten, R. (2000). Knowledge, innovation and eco-nomic growth: The theory and practice of learning regions. Edward Elgar: Cheltenham.
Exploring the Characteristics of Technology Spillovers 125
Ch005.qxd 6/29/2007 10:11 AM Page 125

Cantwell, J. A. (1989). Technological innovation and multinational corporations. Oxford:Blackwell.
Cantwell, J. A., (1992). Innovation and technological competitiveness. In: P. Buckley, &M. Casson (Eds) Multinational enterprises in the world economy. Essays in honour ofJohn Dunning. Aldershot, UK: Edward Elgar.
Cantwell, J. A. (1993). Corporate technological specialisation in international industries.In: M. C. Casson, & J. Creedy (Eds), Economic inequality and industrial concentration.Aldershot: Elgar.
Cantwell, J. A. (1995). The globalisation of technology: What remains of the product lifecycle model? Cambridge Journal of Economics, 19, 155–174.
Cantwell, J & Fai, F. (1999). Firms as the source of innovation and growth: The evolutionof technological competence. Journal of Evolutionary Economics, 9, 331–366.
Cantwell, J. A., & Noonan, C. A. (2000). The regional distribution of technological devel-opment by foreign-owned firms in Germany. In: M. Feldman, & N. Massard (Eds),Knowledge spillovers and the geography of innovation: Institutions and systems ofinnovation. Boston: Kluwer Academic Publishers.
Cantwell, J. A., & Santangelo, G. (2000). Capitalism, profits and innovation in the newtechno-economic paradigm. Journal of Evolutionary Economics, 10, 131–157.
Cohendet, P., & Meyer-Krahmer, F. (2001). The theoretical and policy implications ofknowledge codification. Research Policy, 30, 1563–1591.
Criscuolo, P., Narula, R. & Verspagen, B. (2005). Role of home and host country innova-tion systems in R&D internationalisation: A patent citation analysis. Economics ofInnovation and New Technology, 14(5), 417–433.
Dosi, G. (1982). Technological paradigms and technological trajectories. A suggestedinterpretation of the determinants and directions of technical change. Research Policy,11, 147–162.
Dunning, J. H., & Narula, R. (1995). The R&D activities of foreign firms in the UnitedStates. International Studies of Management and Organization, 25, 39–73.
Freeman, C., & Perez, C. (1988). Structural crises of adjustment, business cycles andinvestment behaviour. In: G. Dosi, C. Freeman, R. R. Nelson, G. Silverberg, & L. L. G.Soete (Eds), Technical change and economic theory. London: Pinter.
Frost, T. S. (2001). The geographic sourcing of foreign subsidiaries’ innovations. StrategicManagement Journal, 22, 101–124.
Granstrand, O., Patel, P. & Pavitt, K. (1997). Multi-technology corporations: Why theyhave ‘distributed’ rather than ‘distinctive core’ competencies. California ManagementReview, 39, 8–25.
Grossman, G., & Helpman, E. (1991) Innovation and growth in the global economy.Cambridge, MA: MIT Press.
Henderson, R., & Clarke, K. B. (1990). Architectural innovation: The reconfiguration ofexisting product technologies and the failure of established firms. AdministrativeSciences Quarterly, 35, 9–30.
Jaffe, A., Trajtenberg, M., & Henderson, R. (1993). Geographical localization of knowl-edge spillovers as evidenced by patent citations. Quarterly Journal of Economics, 63,577–598.
126 John Cantwell and Camilla Noonan
Ch005.qxd 6/29/2007 10:11 AM Page 126

Jaffe, A. & Trajtenberg, M. (1996). Flows of knowledge from universities and federal labs:Modelling the flow of patent citations over time and across institutional and geographicboundaries. Proceedings of the US National Academy of Sciences, November, pp. 12671–12677.
Jaffe, A. & Trajtenberg, M. (1998). International knowledge flows: Evidence from patentcitations. National Bureau for Economic Research Working Paper no. 6507.
Jaffe, A., & Trajtenberg, M. (1999). International knowledge flows: Evidence from patentcitations. Economics of Innovation and New Technology, 8, 105–136.
Jaffe, A., Fogarty, M. & Banks, B. (1998). Evidence from patents and patent citations onthe impact of NASA and other federal labs on commercial innovation. Journal ofIndustrial Economics, XLVI, 183–205.
Jaffe, A., Fogarty, M. S., & Trajtenberg, M. (2000). Knowledge spillovers and patent cita-tions: Evidence from a survey of inventors. American Economic Review, 90, 215–218.
Kummerle, W. (1996). Home base and foreign direct investment in R&D. Ph.D. Thesis,Harvard Business School, MA, USA.
Kummerle, W. (1997). Building effective R&D capacity abroad. Harvard BusinessReview, March–April, 61–70.
Marshall, A. (1890/1920). Principles of economics (8th ed.). London: Macmillan.Maurseth P. B., & Verspagen B. (2002). Knowledge spillovers in Europe: A patent cita-
tions analysis. Scandanavian Journal of Economics, 104(4), 531–545.Noonan, C. A. (2002). The regional dynamics of technology sourcing by MNEs – the case
of Germany. Ph.D. Thesis, University of Reading, UK (unpublished).Patel, P., & Vega, M. (1999). Patterns of internationalisation of corporate technology:
Location vs. home country advantages. Research Policy, 28, 145–155.Phene, A., & Tallmann, S. (2002). The effects of regional clusters on knowledge stocks and
flows: Evidence from the biotechnology industry. Mimeo, University of Utah.Romer, P. (1986). Increasing returns and long run growth. Journal of Political Economy,
XCIV, 1002–1037.Romer, P. (1990) Endogenous technological change. Journal of Political Economy,
XCVIII, S71–S102.Singh, J. (2007) Asymmetry of knowledge spillovers between MNCs and host country
firms. Journal of International Business Studies, forthcoming.Sternberg, R. (2000). University-industry relationships in Germany and their regional con-
sequences. In: Z. Acs (Ed.), Regional innovation, knowledge and global change.London: Pinter.
Temple, P. (1998). Clusters and competitiveness. In: G. M. P. Swann, M. Prevezar, & D.Stout (Eds), The dynamics of industrial clustering. International comparisons in com-puting and biotechnology. UK: Oxford University Press.
Von Tunzelman, N., & Wang, Q. (1999). Complexity and the functions of the firm:Breadth and depth. Research Policy, 29, 805–818.
Zander, I. (1999). Whereto the multinational? Evolution of technological capabilities inthe multinational network. International Business Review, 8, 261–291.
Exploring the Characteristics of Technology Spillovers 127
Ch005.qxd 6/29/2007 10:11 AM Page 127

This page intentionally left blank

Chapter 6
Global and local knowledge linkages:The case of MNE subsidiaries inArgentina
Elisa Giuliani* and Anabel Marin
1. Introduction
This paper is about the role of MNE subsidiaries in the generation of knowledgelinkages in industrialising countries. It contributes to the understanding of theprocess of knowledge creation and diffusion in association with MNE operationsin these types of country. The literature has recently suggested that subsidiaries arenot ‘leaky containers’ of knowledge, but that they may play a more active role inthe process of generating externalities. This is related with the fact that subsidiariesare heterogeneous in their internal capabilities and in the extent to which they useresources from global and local sources (Marin & Bell, 2005). In previous contri-butions the authors have shown the importance of intra-firm/-subsidiary capabili-ties for the generation of relevant knowledge flows to other firms, both at thehorizontal and vertical levels (Giuliani & Bell, 2005; Marin & Bell, 2006). Thispaper instead discusses and explores empirically how linkages at the global level —with both corporate and non-corporate sources — relate to the subsidiary capa-bilities and the generation of knowledge interactions in the host country.
Do Multinationals Feed Local Development and Growth?© 2007 by Elsevier Ltd.All rights of reproduction in any form reservedISBN: 978-0-08-045360-6
*The order of the authors is interchangeable. They have both contributed equally to this paper.
Ch006.qxd 6/29/2007 10:12 AM Page 129

We use both secondary data from the Argentinean National Innovation Survey(1998–2001), and primary data from an original survey of MNE subsidiaries, car-ried out in Argentina during the period August–October 2005. The data areanalysed using a combination of multivariate statistics and network visualisationtechniques.
The empirical analysis suggests that MNE subsidiaries engage in very diversetypes of global networking. This is especially relevant in the context of industri-alising countries, since ‘conventional theories’ presume that subsidiaries are pas-sive recipients of knowledge generated at the ‘headquarter’ location. Morespecifically, we find that the nature of such diverse global networks affects theaccumulation of intra-subsidiary capabilities and their formation of knowledgelinkages at the domestic level.
The chapter is organised as follows. Section 2 deals with the conceptualframework of this study. First, it sets out the background by examining the grow-ing body of research, focusing on the role of active and heterogeneous subsidiariesfor knowledge creation and diffusion within and outside MNEs (Section 2.1).Second, it develops an original typology of MNE subsidiaries based on the differ-ent nature of their global knowledge linkages (Section 2.2) and third, it discussesa set of propositions relating the typology with local learning and diffusion(Section 2.3). Section 3 describes the methodology. Section 4 analyses the empir-ical evidence, and finally, Section 5 concludes.
2. Conceptual Discussion
2.1. Background: The Importance of Heterogeneous Subsidiaries forKnowledge Diffusion
There is a relatively widespread view about the way and the reasons why MNEscan contribute to technological development in industrialising countries, a con-tribution that is supposed to occur mainly via spillover effects. This view rests onthree main assumptions about how MNEs operate: first, that MNEs possess andexploit technological assets — an ownership advantage seen as the main reasonfor the MNE’s existence; second, that knowledge is a kind of ‘public good’ withinMNEs, i.e. mobile, and with a joint character within firms;1 and third, that theMNE is a tightly integrated organisation, with the behaviour of subsidiaries
130 Elisa Giuliani and Anabel Marin
1It means that can be supplied to additional production facilities at very low cost (Markusen, 1995, p. 174).
Ch006.qxd 6/29/2007 10:12 AM Page 130

closely shaped by central strategies and decisions. The combination of centrallyaccumulated technological assets, knowledge that is easily transferable betweenunits of the MNE, and tightly integrated organisational behaviour provides thebasis for a ‘pipeline’ that delivers spillovers of superior technology from the par-ent MNEs to domestic firms, without the active intervention of local MNE sub-sidiaries (Caves, 1974; Blomstrom & Kokko, 2003; Gorg & Greenaway, 2004;Haskel et al., 2002). Such effects are presumed to follow-on almost inevitablyfrom the centrally driven technological advantage of the MNE.
One important limitation of the research based on this view is that the empir-ical evidence has not demonstrated the widespread and significant technologicaleffects one might expect from the underlying model (Lipsey, 2002; Gorg &Greenaway, 2004). As pointed out by Rodrik (1999): although “today’s policy lit-erature is filled with extravagant claims about positive spillovers from FDI … theevidence is sobering” (p. 605). In our view, this reflects two important shortcom-ings characterising this type of research. The first is methodological and the sec-ond conceptual. The first one is that, by and large, technological effects are neverdirectly measured, but they are implicitly assumed as a result of domestic firms’increased productivity. The second refers to the fact that it is often the case thatsubsidiaries are conceived as ‘leaky containers’ of international knowledge,acquired from headquarters via the international pipeline (for a discussion, seeMarin & Bell, 2006). As such, they are seen as local passive branches, involvedin dyadic links with the headquarters (HQs).
Nowadays, however, this view seems inappropriate. Several studies, mostlyreferring to advanced countries’ contexts, have in fact shown that global MNEsare no longer following an ethnocentric organisational model (Perlmutter, 1969;Barlett & Ghoshal, 1989). Instead, they are following more flexible organisa-tional models. In the words of Hedlund (1986), international business is nowabout “actively seeking advantages originating in the global spread of the firm”(rather than just exploiting centrally created technological assets). The early mod-els of the MNE, as a centrally directed and closely integrated organisation, there-fore, have lost relevance. Instead, much more flexible approaches have gainedimportance. These recognise wide-ranging heterogeneity between MNEs, alongwith varying forms of organisational flexibility and internal heterogeneity in theroles of subsidiaries and their relationships with parents and other subsidiaries.
Alongside these changes a number of studies within the business literaturestarted to focus on subsidiaries as a separate unit of analysis, and emphasised sev-eral types of heterogeneities in their capacities and roles. Thus, they developed sev-eral typologies emphasising different aspects related with this heterogeneity. Themost well-known of these typologies is that developed by White and Poynter(1984), who identified five types of subsidiaries according to the “scope” of three
Global and Local Knowledge Linkages 131
Ch006.qxd 6/29/2007 10:12 AM Page 131
dimensions characterising their activity in the host economy: product (productscope is the breadth of the subsidiary’s product line); market (market scope is thesubsidiary spread of markets); and value-added (added-value scope is the capacityof the subsidiary to add value to its products or services in the host economy): (a)The marketing satellite is a subsidiary that merely markets locally, products manu-factured elsewhere; (b) The miniature replica is a subsidiary that produces and mar-kets locally, some of the parent’s product lines for the local country; (c) Therationalised manufacturer is a subsidiary that produces a designated set of compo-nent parts or products (inputs) for a multi-country or global strategy; (d) The prod-uct specialist is a subsidiary responsible for developing, producing and marketinga limited range of products for the global market and (e) The strategic independentis a subsidiary free to develop lines of business for either local or global markets.
More recently, other scholars have advanced in the direction of identifyingtypologies of subsidiaries (e.g. Barlett & Ghoshal, 1989; Jarillo & Martinez,1990; Gupta & Govindarajan, 1991; Roth & Morrison, 1992; Taggart, 1996;Birkinshaw & Morrison, 1998; Papanastassiou & Pearce, 1998, 1999). For thepurpose of this study, an interesting classification is the one developed by Guptaand Govindarajan (1994), who emphasise the importance of an operational aspectof the MNE, which is the intra-group flows of knowledge. These authors classifysubsidiaries in four ways, along intra-group flows of knowledge: (a) globalinnovators, when they are responsible for high outflows of knowledge but receivelow inflows from the group; (b) integrated players, when they both send andreceive high flows of knowledge; (c) implementers, when they have low outflowsof knowledge but receive high inflows; and finally, (d) local innovators, whenthey both receive and send low flows of knowledge.
Regardless of whether the typologies focus more on the strategic motives forestablishing the MNE subsidiaries (cf. White & Poynter, 1984) or on the opera-tional aspects, most of them tend to confine their attention to the implications ofsubsidiaries’ differences for the MNE as a whole, rather than to the host economy.Furthermore, the few that have explored the implications of subsidiaries hetero-geneity on the host economy have focused almost exclusively on how the behav-iour of subsidiaries themselves were affected, rather than on other aspects of thedomestic economy (see e.g. Jarillo & Martinez, 1990; Taggart, 1996).
In our study here, we are interested in the impact on host economies of diversetypes of subsidiaries. Our work is different from previous works in two respects.First, we go one step further in the analysis, in that we do not only analyse theeffect of the different types/roles of subsidiaries on their own technological activ-ities, i.e. the activities within subsidiaries. We also analyse the association betweendifferent types/roles of subsidiaries and the extent to which they establish knowl-edge linkages with domestic agents — one of the main channels for knowledgediffusion in the host economy. Second, we base our typology of subsidiaries on
132 Elisa Giuliani and Anabel Marin
Ch006.qxd 6/29/2007 10:12 AM Page 132

one particular aspect, characterising the local activity of subsidiaries: the extentand nature of their global linkages. In this respect, our typology can be related tothe one developed by Gupta and Govindarajan (1994), discussed above. However,in contrast with Gupta and Govindarajan’s typology, we distinguish between intra-corporative and extra-corporative linkages, a distinction that, as it will be seenlater, is very meaningful in our analysis.
2.2. An Original Classification of MNE Subsidiaries for DevelopingCountries
The different types of linkages (networks) in which subsidiaries are embedded canbe considered a very important resource for the subsidiary. This is in line with net-work theories (e.g. White, 1970; Granovetter, 1985, 1992), which have argued thatfirms’ performance is tied to the positioning of firms in the networks in which theyare embedded. This is due to the fact that the structural position of a subsidiary in anetwork may affect the way knowledge is accessed and therefore potentiallyexploited. For example, a position that is considered to significantly influence theinternal capabilities and the success of a firm is centrality (Freeman, 1979), whichdepends on the number of direct linkages formed by a firm with the rest of the firmsin its network. Ahuja’s (2000) study on the innovativeness of firms in the chemicalindustry found that the number of direct collaboration linkages a firm maintains,affects its innovative output positively. The positive effect of direct linkages isrelated to the fact that, first, they enable the sharing of knowledge among firms,without the risk that knowledge is downgraded by a third firm. Second, a high num-ber of direct ties enable a firm to have access to a vast array of differentiated andcomplementary skills from different firms. In this way, a central firm is able to com-pare knowledge coming from these different sources, and this may enhance its inno-vation potential and performance (Bell, 2005). This can be applied to MNEsubsidiaries: the extent to which they are centrally positioned in a global knowledgenetwork, which may or may not include the MNE headquarters and the other sub-sidiaries, is likely to be positively related with the subsidiary’s process of accumu-lation of knowledge and technology, and therefore with its internal capabilities.
As mentioned above, the global knowledge network need not be restricted tothe MNE. In fact, on one hand, the ‘network based view’ of the MNE (Hedlundd,1986; Prahalad & Doz, 1987; Barlett & Ghoshal, 1990) emphasises the impor-tance of knowledge interactions and knowledge flows between the different unitswithin the MNE for the processes of knowledge development (on this, see alsoKogut & Zander, 1993); on the other hand, subsidiaries can also use linkages withother international firms as a way of accessing externally developed technologi-cal knowledge. Moreover, these two types of linkages can be used as alternativeways of knowledge ‘sourcing’ or they can be used in a complementary way.
Global and Local Knowledge Linkages 133
Ch006.qxd 6/29/2007 10:12 AM Page 133

In principle, therefore, four types of subsidiaries can be identified:
1. Globally Diversified (GDiv) are the subsidiaries that use both linkages withthe MNE headquarters and other subsidiaries, and linkages with other inter-national firms or institutions.
2. Globally Dependent (GDep) are the subsidiaries engaged in linkages onlywith the MNE headquarters or other subsidiaries of the corporation.
3. Globally Independent (GInd) are the subsidiaries that have developed link-ages with other agents in international markets, independent of the MNEgroup.
4. Globally Isolated (GIso) are the subsidiaries that do not use global linkageseither with the MNE or with other agents.
We interpret subsidiaries’ development of global linkages as an importantmeans by which those subsidiaries can acquire externally developed technologi-cal knowledge and resources. Furthermore, when these linkages are strong withinthe MNE (i.e. with HQs or other affiliates) they can be interpreted as reflectinggood channels for accessing the common technological resources from the MNE,or as reflecting the operation of a ‘common resource model’ within the MNE. Inthis chapter, we explore whether there is a relationship between the typology ofsubsidiaries identified above and (i) the innovative activity of subsidiaries and (ii) their likelihood of generating knowledge linkages in the host economy. Weexplore these relations more in detail in the following section.
2.3. Global Networks, Innovative Activities and Local Knowledge Linkages:Some Exploratory Propositions
2.3.1. Globally diversified subsidiaries Globally Diversified (GDiv) are sub-sidiaries that use both linkages with the MNE headquarters and other subsidiaries,and linkages with other international firms or institutions. Our exploratory idea isthat GDiv subsidiaries may have established a more horizontal relationship withthe MNE, which means that the MNE has moved from an ethnocentric to a poly-centric organisational model (Perlmutter, 1969). They source knowledge from avast array of external actors (suppliers, clients, etc.), and when they acquire knowl-edge resources from the MNE, they tend to establish horizontal and cooperativelinkages with both headquarters and the rest of the subsidiaries.
We argue that this combination of knowledge sources should be associated withan active innovative behaviour on the side of subsidiaries for two reasons. First,because the high intensity of interactions with the MNE, reflects a situation wheresubsidiaries have privileged access to the resources and support from the MNE.Second, the fact that this type of subsidiary is also looking for other external
134 Elisa Giuliani and Anabel Marin
Ch006.qxd 6/29/2007 10:12 AM Page 134

sources of knowledge reflects a high intra-subsidiary absorptive capacity (Cohen& Levinthal, 1990). This leads us to advance the following proposition: GDiv sub-sidiaries can be associated with strong innovative activity.
In order to maintain such a highly diversified array of global knowledge link-ages, this type of subsidiary needs to be very entrepreneurial and it is thereforeconceivable that it would seek to exploit any knowledge resource available, evenat close geographical proximity in the host country. Accordingly, we argue thatthis type of subsidiary is more likely to develop dense knowledge networks withlocal actors.
This leads us to advance the following proposition: GDiv subsidiaries arehighly likely to develop knowledge linkages at the local level.
The propositions advanced in this section suggest that the GDiv subsidiary hasa high potential for generating local knowledge spillovers. This is connected tothe fact that this subsidiary has strong innovative capabilities and access to diver-sified sources of external knowledge. Therefore, knowledge, which is potentiallytransferred through local linkages, is likely to be of valuable content.
2.3.2. Globally dependent subsidiaries The GDep subsidiaries are engaged inlinkages only with the MNE headquarters or other subsidiaries of the enterprise,whereas they show strikingly low levels of interactions with other internationalagents. While the first aspect can be expected to have a positive effect on theinnovative activity of the subsidiary, the second one can be interpreted as a reflec-tion of poor absorptive capacity and low innovative activity. In consequence, this type of subsidiary is expected to have lower innovative capability than GDivsubsidiaries. This is explained more in detail below.
On the one hand, by using strong linkages with the MNE headquarters andother affiliates, the GDep subsidiaries can draw on the common technologicalresources of the MNC and therefore they can benefit from the privileged accessto frontier/international knowledge typically owned by the MNE. In other words,they can utilise the global resources of the MNE to access various forms of sup-port for innovation, such as the access of frontier technologies and methods ofproduction. This is particularly important for subsidiaries in developing/industri-alising countries, which operate in environments that provide limited technolog-ical resources for subsidiaries. Moreover, as suggested by Kogut and Zander(1993), it is especially knowledge that is difficult to codify and understand theone that is transferred within the MNE, which indicates that the transfer of knowl-edge within the MNE in this way has merits in terms of quality as well.
On the other hand, however, the strong links with the MNE in the context ofa lack of links with other firms outside the corporation can be interpreted asreflecting a situation of tight integration within the MNE, which implies high levels
Global and Local Knowledge Linkages 135
Ch006.qxd 6/29/2007 10:12 AM Page 135

of control by the MNE headquarters. It is probable, therefore, that GDep sub-sidiaries have both low absorptive capacity and less opportunity for learning, andwill therefore have a more limited innovative activity than it is observed in theGDiv subsidiary.
This leads us to advance the following proposition: GDep subsidiaries can beassociated with relatively strong innovative activities, which are neverthelessmore limited than those observed for the GDiv subsidiaries.
Furthermore, because of the existence of privileged access to the MNE’sknowledge, and of a tight control and dependence on the HQ, this type of sub-sidiary is unlikely to establish knowledge linkages with third parties in the hosteconomy. This is particularly so in developing countries, where the local actorsare often believed to suffer from a certain technological backwardness from theMNEs. This means that the subsidiary’s behaviour will be shaped by the head-quarters’ home culture and practices, minimising knowledge interactions with‘dissimilar’ or ‘cognitively distant’ agents, such as other host country enterprises.
This leads us to advance the following proposition: GDep subsidiaries areunlikely to develop knowledge linkages at the local level.
What follows from these propositions is that this type of subsidiary couldpotentially generate knowledge spillovers in the host country — because of theirprivileged access to MNE technological resources — but fail to do so due to itsstrong dependence on the HQ, which inhibits the formation of local knowledgelinkages.
2.3.3. Globally independent subsidiaries The GInd are the subsidiaries thathave developed knowledge linkages with other agents in the international markets,but not with the MNE group.2 This reflects a situation of strong independence fromthe headquarters. We argue that MNE subsidiaries interacting with international part-ners, quite autonomously from the headquarters, need to have a significant degree of initiativeness and dynamism in looking for external sources of knowledge — e.g. rather than passively acquiring knowledge from the headquarters.
In our conceptual model, GInd subsidiaries are characterised by a rather activeinnovative behaviour at the local level, because, as suggested by Cohen andLevinthal (1990), the activity of looking for external sources of knowledgerequires that the subsidiary has accumulated a certain degree of knowledge (i.e.absorptive capacity) in order to be able to search and exploit commercially the
136 Elisa Giuliani and Anabel Marin
2The existence of this type of subsidiary can be associated with the case in which the headquarter isa financial holding and its subsidiaries operate in very diversified industries, as diverse as metal-working and food production. In this case in fact, the headquarters may not possess any technologi-cal capabilities in the specific sector of operation of its subsidiaries.
Ch006.qxd 6/29/2007 10:12 AM Page 136

absorbed knowledge. However, unlike the GDep subsidiary, the GInd subsidiarylacks the access to the MNE’s tacit and complex knowledge, which means that itsinnovative activity may be based solely on the access of codified knowledgeavailable in the market (Kogut & Zander, 1993). For this reason, we can plausi-bly argue that the GInd subsidiary has weaker innovative capabilities than theGDiv subsidiary, although we cannot predict a difference with the GDep sub-sidiary. The latter certainly has access to a more tacit and complex form of knowl-edge coming from the MNE, but the GInd subsidiary has access to a more variedarray of knowledge sources, which is also important for the innovative activity ofthe subsidiary.
Therefore, in principle, it is conceivable that: GInd subsidiaries can be asso-ciated with relatively strong internal innovative activities, which are more limitedthan those observed for the GDiv subsidiary but not necessarily different fromthose of the GDep subsidiary.
The key difference with the GDep subsidiary becomes visible when we lookat the formation of local linkages. Given the openness of GInd subsidiary toglobal sources of knowledge other than the MNE, it is conceivable that it oper-ates under a certain degree of autonomy from the HQ, and has the freedom toestablish knowledge linkages in the host country, especially with domestic firms,which are geographically and/or cognitively proximate to the subsidiary.
This leads us to advance the following proposition: GInd subsidiaries are likelyto develop knowledge linkages at the local level, similarly to GDiv subsidiaries.
The propositions advanced in this section, therefore, suggest that the GIndsubsidiaries have some potential in generating local knowledge spillovers. Morespecifically, they might not reach the level of GDiv subsidiaries, due to their morelimited innovative activities, but they certainly offer a much higher potential thanGDep subsidiaries, which are unlikely to establish local linkages at the domesticlevel.
2.3.4. Globally isolated subsidiaries The GIso are the subsidiaries that do notuse global linkages with either the MNE or with other agents. As such, they rep-resent the laggard benchmark of our MNE typology. Since these subsidiariesoccupy a position of low integration into the global MNE, their technologicalbehaviour is unlikely to be affected by the MNE: neither constrained by a tightcontrol of the headquarters nor supported by corporate resources. At the sametime the limited interaction with other international firms reflects that they are notentrepreneurial enough to compensate this isolation from the MNE by using othersources of ‘support’.
Consequently, it seems reasonable to expect that: GIso subsidiaries are likelyto demonstrate low levels of local innovative activity.
Global and Local Knowledge Linkages 137
Ch006.qxd 6/29/2007 10:12 AM Page 137

This type of subsidiary, totally isolated from the MNE and showing no partic-ular interest in networking with other sources of knowledge — both domestic andforeign, is likely to behave in isolation from the local context.
Hence, we expect that: GIso subsidiaries are highly unlikely to develop knowl-edge linkages at the local level.
It is therefore plausible that the GIso subsidiaries have hardly any potential forgenerating knowledge spillovers in the host country.
3. Methodology
The empirical analysis is based on two different types of data and methodology.First, we use secondary data from the Argentinean National Innovation Survey(1998–2001) and apply standard statistical inference. Second, we use primarydata from an original survey to MNE subsidiaries, carried out in Argentina dur-ing the period August–October 2005, and this allows us to run a qualitative analy-sis and apply network visualisation techniques.
3.1. Analysis Based on Innovation Survey Data
This section first describes general features of the data used in this analysis. Itthen goes on to discuss the indicators developed to measure the different natureof global and local linkages, and the innovative activity of subsidiaries. Finally,it describes the tests used to explore the association between our typology and thedifferent intensities of innovative activity and local linkages of subsidiaries.
3.1.1. The innovation survey data The Innovation Survey is a novel source ofinformation for this type of study of spillovers and MNE subsidiaries, providingboth detailed information about subsidiary and domestic firm behaviour, and alarge number of observations (around 1600 industrial firms — 20% of which aresubsidiaries).
The survey was carried out by the National Statistical Office and is represen-tative of the population of manufacturing firms in the country. It interviewed 333subsidiaries. The representative manufacturing subsidiary has been established inArgentina for 35 years. However, 25% of the subsidiaries have been in the coun-try less than 7 years whilst a substantial 10% were established more than 100 yearsago. These subsidiaries employed, on an average, 400 personnel (range, 16–6000personnel); average annual sales amounted to approximately 125 millionArgentinean Pesos (in 1998, when one Argentinean Peso was equivalent to US$1)(range, 694 thousand to 4400 million), of which 9% was exported (range, 0–99%).Europe is the home country of 46% of subsidiaries, 25% were owned in USA and
138 Elisa Giuliani and Anabel Marin
Ch006.qxd 6/29/2007 10:12 AM Page 138
25% in other Latin American countries. The remaining 3% have home countriesspread around other parts of the world. Two industries account for 39% of sub-sidiaries: chemicals and allied products (21%) and food kindred products(17.5%). Motor vehicles and equipment have 9% of the subsidiaries and the restdistribute fairly evenly across the remaining industries.
The survey, following the broad framework of the Oslo Manual, providesinformation about a wide range of technological activities at the firm level. Weuse this data to construct a range of indicators of knowledge linkages and inno-vative activity of MNE subsidiaries and domestic firms. These two types of indi-cators are discussed below.
3.1.2. Indicators3.1.2.1. Indicator of global linkages — An indicator capturing differences in thestructure of global linkages of the subsidiaries was calculated by combining twotypes of information about the subsidiaries’ behaviour: (a) their use of knowledgeinteractions with international agents and (b) the importance attributed by thesubsidiaries to these agents as possible sources of information for innovationactivities.3 A more detailed explanation of how this indicator was constructed isreported in the Appendix.
On these bases, four types of subsidiaries were identified:
● Globally Diversified: when the subsidiary uses and highly values linkages withHQ, other subsidiaries and all the other sources.
● Globally Dependent: when the subsidiary uses and highly values linkages onlywith the headquarters (HQ) and other subsidiaries (Subs) of the MNE.
● Globally Independent: when the subsidiary uses and values linkages only withother sources but not with the HQ and Subs.
● Globally Isolated: when the subsidiary does not use and does not value anylinkage at the international level.
3.1.2.2. Indicator of local linkages — In order to capture the general intensitywith which subsidiaries establish linkages with domestic agents — firms and insti-tutions — an indicator was calculated simply as the sum of all knowledge interac-tions of the subsidiary at the local, regional and national level. Accordingly, thisindicator ranges from a minimum of 0, when the subsidiary has no knowledgeinteractions in the host country, to a maximum of 33. A more detailed explanationof how this indicator was constructed is reported in the Appendix.
Global and Local Knowledge Linkages 139
3The possible agents for which we have information about their importance as external sources ofknowledge are seven: (a) Public institutions such as: universities, research centres, and laboratories; (b) Suppliers; (c) Clients; (d) Headquarters; (e) Other subsidiaries; (f ) Other companies; (g) Consultants;and (h) Public agencies.
Ch006.qxd 6/29/2007 10:12 AM Page 139

3.1.2.3. Indicators of technological activity — In line with most studies of firm-level innovation in industrialising economies, we take a broad view of innova-tion. This encompasses both the activities performed (not merely R&D, but alsoa wide array of design and engineering activities), and the outputs they generate(not just innovations that are globally novel and reflected in patents but, muchmore common, a wide range of major and incremental changes that are novelwith respect to the local industry or firm itself). Moreover, such locally innova-tive activities and outputs may encompass much more than new kinds of productsand process hardware, but also new forms of organisation and procedure.
We use 15 indicators to evaluate different intensities of technological activi-ties of subsidiaries. These can be grouped into four categories: (a) investments indisembodied knowledge, (b) investments in embodied technology, (c) humancapital and (d) outputs. These are explained below.
(a) Investments in disembodied knowledge: These measures indicate differentefforts carried out by firms in order to acquire and/or develop (new) techno-logical knowledge, which is not embodied in any kind of equipment, instruments,manual, patent, etc. In principle, these could be potentially the most importantsources of locally-driven knowledge spillovers from subsidiaries to domesticfirms, since they cover the kinds of knowledge that are potentially most mobileand most likely to ‘leak’ from subsidiaries. Five measures are used:
I Intensity of expenditures on R&DII Intensity of expenditures on innovation-related industrial designIII Intensity of expenditures on innovation-related managementIV Intensity of expenditures on innovation-related consultancyV Intensity of payments for technology transfer contracts and licence.
(b) Investment in capital-embodied technology: These measures indicate theefforts carried out by firms to introduce new technological knowledge embodiedin equipment, machinery, or licences. Although this kind of investment is likelyto be a very important source of productivity growth in the investing firms, it doesnot seem likely to be a significant driver of ‘genuine’ spillovers to other firms.Although information about the introduction of capital embodied assets in onefirm may leak to another, the knowledge actually embodied in those assets isprobably much more ‘sticky’. Three measures are included:
VI Intensity of expenditures on capital goods for innovationsVII Intensity of expenditures on IT hardware and software for innovation tasksVIII Intensity of imports of capital goods
140 Elisa Giuliani and Anabel Marin
Ch006.qxd 6/29/2007 10:12 AM Page 140

(c) Human capital: These indicators measure the intensity of human resourcesemployed by firms, which, in principle, are capable of being oriented to monitor,incorporate and develop new technological knowledge. The measures are comple-mentary to R&D expenditures, because they capture resources potentially capableof being destined to innovative activities, in the same way as the expenditures onR&D activities. Nevertheless, they may be more useful for evaluating firms inindustrialising countries, since, as stated before, firms in these types of countriescarry out much of their technological efforts outside formalised R&D units.
IX Skill intensity, measured as the number of engineers, other professionals andtechnicians employed in production as a proportion of total employment
X ‘Specialised’ Innovative Labour, measured as the proportion of employeesexclusively dedicated to innovation tasks: R&D, design tasks, etc.
XI Intensity of expenditures on innovation-related training.
(d) Results of innovative efforts: All the indicators discussed before have onecommon problem: they reflect the efforts made by the firm to create knowledge,but they are not showing effectiveness in the creation, the knowledge effectivelycreated and the use of the knowledge created externally. R&D expenditures, aswell as the expenditures on licences or technology transfer or machinery, proba-bly underestimate technological activities related to production, and technologyrelated to information processing (Patel, 2000). Technical employees, and theeducational background of employees, to some extent solve these problems, butagain, it reflects resources capable of being oriented to exploration activities oractivities of knowledge creation, but they may be oriented to other activities, andeven when they are doing these kinds of activities, it is not possible to know theireffectiveness.
It is interesting, therefore, to use some indicators of results of technologicalefforts in a complementary way. The indicators used here are imperfect since,with the exception of patents, all of them are either subjective or lack qualifica-tion in relation to the degree of novelty involved. Nevertheless, they still provideadditional elements to distinguish firms according to their technological activity,so they will be used in some of the applications. Four indicators are calculated:
XII Number of patents: number of patents granted by each firmXIII Product innovations accomplished during the period4
Global and Local Knowledge Linkages 141
4The Innovation Survey asked the firms about the type of product innovations achieved during theperiod, giving the firms five different options. To calculate an indicator of intensity of product inno-vation, we simply added the ‘yes’ answer to each option.
Ch006.qxd 6/29/2007 10:12 AM Page 141

5The Innovation Survey asked the firms about the type of process innovations introduced during theperiod, giving the firms different four different options. To calculate an indicator of intensity ofprocess innovation, we simply added the ‘yes’ answer to each option.6This indicator only used data of the second Innovation Survey (1998–2001).
142 Elisa Giuliani and Anabel Marin
XIV Process innovations accomplished during the period5
XV Percentage of total sales — to local and/or external markets — explainedby innovative products.6
Tables 6.1 and 6.2 report basic summary statistics of our data set with respect tothese indicators.
3.1.3. Testing the relevance of the typology In order to test the significance ofour typology in explaining different innovative behaviours and local linkages,two types of tests were carried out. First, the significance of differences in behav-iour across the whole range of subsidiary types was assessed either by ANOVAor Chi2. ANOVA was used to test the association with types of behaviours mea-sured in continuous variables (e.g. R&D expenditure or training intensity) andChi2 when the variable to be explained is categorical or non-continuous (e.g. theage of the products, or the indicators of interaction with other organisations).Second, a post hoc test (a Bonferroni test) was carried out to detect the signifi-cance of differences in behaviour of particular pairs of subsidiary types.
3.2. Analysis Based on the Original Survey to MNE Subsidiaries in Argentina
The original survey was carried out during the period August–October 2005 andit was directed to a number of MNE subsidiaries operating in Argentina. Thetotality of MNE subsidiaries operating in Gran Buenos Aires was contacted byphone to schedule an interview and the response rate was of about 20%.Accordingly, a total of 38 subsidiaries were involved in the study, represent-ing all industrial sectors (from high-tech to low-tech). The survey was carriedout through in-depth, face-to-face interviews and they were based on a semi-structured questionnaire. The interviewees were the chief production managersof the subsidiary plants. The interviews were designed to obtain information infour key areas: (1) the subsidiary knowledge linkages with international actors,including the headquarters and the MNE as a whole; (2) the formation of knowl-edge linkages with domestic or foreign firms located in Argentina; (3) the typeof relationship/organisation structure existing between the subsidiary and theMNE (i.e. headquarters and other subsidiaries); and (4) the internal knowledgegeneration efforts.
Ch006.qxd 6/29/2007 10:12 AM Page 142

Global and L
ocal Know
ledge Linkages
143Table 6.1: Indicators of technological activity: Basic statistics.
Indicator a Type of indicator Mean Standard Minimum Maximumdeviation
Indicators of inputAggregated indicators
Investments in embodied technologiesb Continuous (%) 2.41 5.9 0 32Investments in disembodied technologiesc Continuous (%) 0.74 1.7 0 22
Selected individual indicatorsInvestments in capital goods Continuous (%) 0.06 0.2 0 1.9R&D expenditures Continuous (%) 0.27 0.8 0 9.2Labour in innovation activity Continuous (%) 4.1 6.9 0 78Skills intensity Continuous (%) 30 63 0 80
Indicators of outputPatents Continuous 0.27 1.9 0 33Percentage of truly innovative products sold by the company
To internal market Continuous (%) 12 24 0 100To external markets Continuous (%) 7 21 0 100
Indicator of local linkagesLinkages with local agents Continuous 3.3 3.3 0 15Linkages with local suppliers and clients Continuous 1.4 0.5 0 2
aAll the continuous measures are intensities, over total sales or total employment.bCalculated as the sum of the items under category (b) in Section 4.1.2.cCalculated as the sum of the items under category (a) in Section 4.1.2.
Ch006.qxd 6/29/2007 10:12 AM Page 143
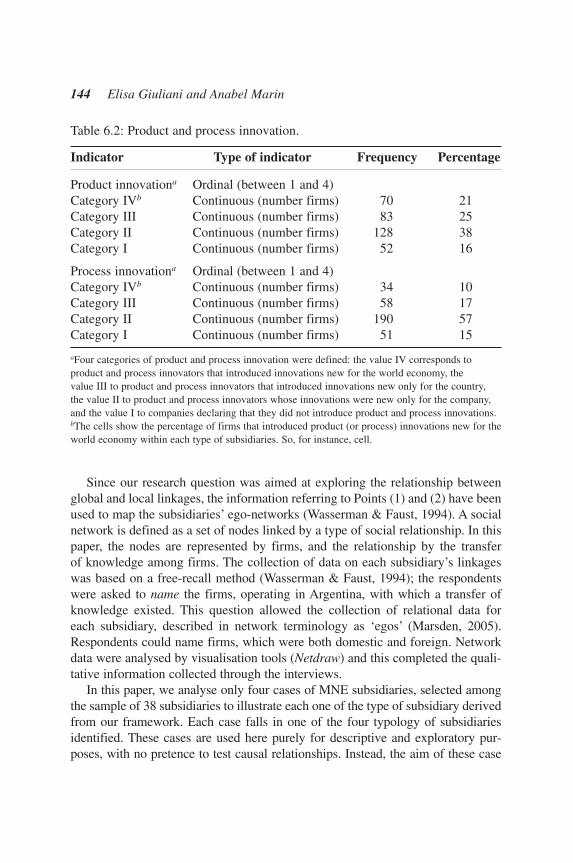
Since our research question was aimed at exploring the relationship betweenglobal and local linkages, the information referring to Points (1) and (2) have beenused to map the subsidiaries’ ego-networks (Wasserman & Faust, 1994). A socialnetwork is defined as a set of nodes linked by a type of social relationship. In thispaper, the nodes are represented by firms, and the relationship by the transfer of knowledge among firms. The collection of data on each subsidiary’s linkageswas based on a free-recall method (Wasserman & Faust, 1994); the respondentswere asked to name the firms, operating in Argentina, with which a transfer ofknowledge existed. This question allowed the collection of relational data for each subsidiary, described in network terminology as ‘egos’ (Marsden, 2005).Respondents could name firms, which were both domestic and foreign. Networkdata were analysed by visualisation tools (Netdraw) and this completed the quali-tative information collected through the interviews.
In this paper, we analyse only four cases of MNE subsidiaries, selected amongthe sample of 38 subsidiaries to illustrate each one of the type of subsidiary derivedfrom our framework. Each case falls in one of the four typology of subsidiariesidentified. These cases are used here purely for descriptive and exploratory pur-poses, with no pretence to test causal relationships. Instead, the aim of these case
144 Elisa Giuliani and Anabel Marin
Table 6.2: Product and process innovation.
Indicator Type of indicator Frequency Percentage
Product innovationa Ordinal (between 1 and 4)Category IVb Continuous (number firms) 70 21Category III Continuous (number firms) 83 25Category II Continuous (number firms) 128 38Category I Continuous (number firms) 52 16
Process innovationa Ordinal (between 1 and 4)Category IVb Continuous (number firms) 34 10Category III Continuous (number firms) 58 17Category II Continuous (number firms) 190 57Category I Continuous (number firms) 51 15
aFour categories of product and process innovation were defined: the value IV corresponds toproduct and process innovators that introduced innovations new for the world economy, the value III to product and process innovators that introduced innovations new only for the country,the value II to product and process innovators whose innovations were new only for the company,and the value I to companies declaring that they did not introduce product and process innovations.bThe cells show the percentage of firms that introduced product (or process) innovations new for theworld economy within each type of subsidiaries. So, for instance, cell.
Ch006.qxd 6/29/2007 10:12 AM Page 144

studies is to provide qualitative insights to understand what underpins the rela-tionship between global and local linkages, in a complementary way with respectto the Innovation Survey’s data (Section 3.1). The selected subsidiaries operate inmature industries such as: the bakery oven, the tubes and pipes, the food and pressindustry. According to OECD classification, these industries fall into different cat-egories of technological intensity, being medium high-tech (oven industry),medium low-tech (tubes and pipes) and low-tech (food and press industry). As previously mentioned, these cases are illustrative and do not pretend to have anystatistical representativeness of the Argentinean industry.
4. EMPIRICAL RESULTS
4.1. Analysis Based on the Data from the Innovation Survey in Argentina(1998–2001)
4.1.1. The typology: some general features of each type of subsidiary Table 6.3shows the distribution of subsidiaries according to the type of global linkagesthey maintain. The distribution is not significantly biased. However, the two moreimportant groups are GDiv (34%) and GIso (31%), and a relatively smaller num-ber of subsidiaries engaged in international linkages independently from theMNE group (12%). Finally, there are 22% of subsidiaries that rely exclusively onthe MNE group for their international interactions.
Global and Local Knowledge Linkages 145
Table 6.3: General features of each type of subsidiary.
GDiv GDep GInd GIso(I) (II) (III) (IV)
Number of subsidiaries 115 74 41 103Percentage 34 22 12 31Sales/employee — 000 Pesos Sales/employee — 000 Pesos (mean) 506 383 425 271Export intensity — (%) (mean) 10 8.04 11 7Import intensity — (%) (mean) 11 12 7 7Market sharea— (%) (mean) 3.03 3.07 3.04 3.03Age 32 41 32 35FDI % 92 92 67 83
aCalculated as the ratio between a firm’s total sales and the aggregate sales of all firms in its 5-digit industry.
Ch006.qxd 6/29/2007 10:12 AM Page 145

Table 6.3 also shows some general features of the different types of subsidiaries.The distribution of the types of subsidiaries in terms of firm size (number ofemployees) is roughly what one might expect. GDiv and GInd subsidiaries, the twomore entrepreneurial groups, are, not surprisingly, the largest firms. They alsohave, on an average, the highest export-intensity within the sample. Conversely,the GDep and the GIso are the smallest. GDep subsidiaries have on an average thehighest domestic market share, import intensity, age and FDI participation.However, with respect to the last indicator, they do not differ from GDiv. It is notsurprising either that GInd subsidiaries have the smallest FDI participation.
Finally, Table 6.4 shows the distribution of the different types of subsidiariesacross categories of industries with different technological intensity — groupedaccording to the OECD classification of industries.
In the table, we have highlighted the cells where the percentage of a particu-lar type of subsidiary in a determined OECD type of industry is higher than thatfor the average — i.e. when the type is overrepresented in the industry. So forinstance, we have highlighted the cell combining GIso and low-tech, becausethere are 41% of GIso subsidiaries operating in low-tech industries, while for thewhole sample it is 34%. The same happens with the GInd, but in this case theover-representation is even larger. In fact, more than half of the GInd subsidiariesare in low-tech sectors. GDep subsidiaries are overrepresented in medium high-tech industries, and GDiv in medium low. Nevertheless, the last group does nothave a distribution across the type of industry that differs substantially from oneout of the whole sample.
4.1.2. Global linkages and innovative activities of subsidiaries In this sec-tion, we explore the relevance of these different types of MNE subsidiaries forthe patterns of innovative activity of the subsidiaries in the host economy. We areinterested in how the diverse structure of the subsidiaries’ global linkages relatesto their effective technological activities in the host countries. Table 6.5 shows the
146 Elisa Giuliani and Anabel Marin
Table 6.4: Distribution of types of subsidiaries across industry OECD.
GDiv GDep GInd GIso Total(I) (II) (III) (IV)
Low-tech 32 (28%) 17 (23%) 22 (54%) 42 (41%) 113 (34%)Medium low-tech 27 (23%) 16 (22%) 8 (20%) 14 (14%) 65 (20%)Medium high-tech 46 (40%) 35 (47%) 8 (20%) 37 (36%) 126 (38%)High-tech 10 (9%) 6 (11%) 3 (7%) 10 (10%) 29 (9%)
Ch006.qxd 6/29/2007 10:12 AM Page 146

Global and L
ocal Know
ledge Linkages
147Table 6.5: Types of subsidiary and innovative activity: Inputs.a
Indicators Type of subsidiary ANOVA test Post-hoc teste
GDiv GDep GInd GIso(I) (II) (III) (IV)
(Mean value per type)
Aggregated indicatorsInvestments in embodied technologiesb 2.7 3.5 2.6 0.9 Significant*** II � IV***Investments in disembodied technologiesc 0.9 0.8 0.8 0.4 Significant*** I � IV***
Selected individual indicatorsd
Investments in capital goods 0.06 0.09 0.09 0.01 Significant*** II, III � IV ***R&D expenditures 0.26 0.31 0.35 0.18 Not significantLabour in innovation activity 5.9 3.9 3.9 2.4 Significant*** I � IV, II ***Skills intensity 39 34 13 24 Significant*** I � IV, III***
aAll the measures are intensities, so the tests of differences are controlled by size.bCalculated as the sum of the items under category (b) in Section 4.1.2.cCalculated as the sum of the items under category (a) in Section 4.1.2.dThe test identifies the pairs that differ significantly. In this table we only include the comparisons that differ significantly relative to the type withthe highest values. eFor simplicity, only some of the indicators discussed in Section 4.1.2 — the more conventional — are included separately here. However, all ofthem show a similar pattern.
Ch006.qxd 6/29/2007 10:12 AM Page 147

results of the analysis obtained when indicators of inputs of the innovative activ-ity are analysed and Table 6.6 shows the results of the analysis of differences ininnovative outputs.
The differences across the four groups are mostly significant, and it strikes that GIso subsidiaries have by far the lowest scores among all the indicators.Consistent with our discussion in Section 2.1, this latter type of subsidiary hassignificantly weaker internal resources than those observed for the other types ofsubsidiaries. In contrast, GDiv subsidiaries have significantly higher internalresources than the other subsidiaries in three indicators (Investment in disembod-ied technologies, Labour in innovation activities and Skills intensity), whileGDep subsidiaries are higher in two. In particular, they have invested quite inten-sively in the acquisition of machine-embodied technologies, scoring quite high intwo indicators (Investment in embodied technologies and in Capital goods).Finally, GInd subsidiaries perform well with respect to investment in capitalgoods, and show a quite high investment in R&D intensity, though not signifi-cantly different from other types of subsidiaries.
Table 6.6 shows a similar pattern, but with a clearer superiority of GDiv sub-sidiaries. In effect they are by far the most innovative ones, having granted morepatents by firm, and launched more innovative products to domestic and foreignmarkets (16% and 11% respectively). They have also introduced more significantproduct and process innovations, i.e. of the type that are novel for the world econ-omy or the country. GInd subsidiaries and GDep subsidiaries also perform wellin some particular indicators. The former, especially with respect to patents andthe introduction of significant product and process innovations — novel for theworld economy — and the latter, with respect to the percentage of truly innova-tive products sold in internal and external markets. Finally, GIso subsidiarieshave very poor innovative outputs: the average number of patents granted by eachfirm is strikingly low (0.06), especially if compared with GDiv subsidiaries(0.54). Similarly, the percentage of truly innovative products sold by GIso sub-sidiaries is quite low, even when one considers only the products sold in the inter-nal market (6%).
In sum, two common observations cut across the results in Tables 6.5 and 6.6.First, the analysis of the data clearly supports the exploratory propositions dis-
cussed in Section 2.3. On the one hand, it seems clear that GIso subsidiaries per-form significantly more poorly than the other three groups with respect to allindicators of innovative behaviour. On the other hand, GDiv subsidiaries performbetter with respect to almost all indicators.
Second, however, the analysis does not allow us to draw clear conclusionsabout the relative innovative activity of the other two types of subsidiary: namelythe GDep and GInd groups. In other words, the analysis done here does not allow
148 Elisa Giuliani and Anabel Marin
Ch006.qxd 6/29/2007 10:12 AM Page 148

Global and L
ocal Know
ledge Linkages
149
Table 6.6: Types of subsidiary and innovative activity: Outputs.
Indicators GDiv GDep GInd GIso ANOVA test/Chi2 Post-hoc testc
(I) (II) (III) (IV)
Patents 0.54 0.18 0.21 0.06 Significant*** I � IV, III***Product innovationa
Category IVb 27 22 27 12 Significant****Category III 33 24 22 17Category II 31 41 34 47Category I 9 13 17 24
Process innovationa
Category IVb 14 12 15 3 Significant***Category III 24 15 15 13Category II 51 61 59 60Category I 10 12 12 24
Percentage of truly innovative (I, II � IV, III)***products sold by the company (I, II � IV)***(I � III)***To internal market 16% 15% 7% 6% SignificantTo external markets 11% 10% 6% 2% Significant
aFour categories of product and process innovation were defined: The value IV corresponds to product and process innovators that introducedinnovations new for the world economy, the value III to product and process innovators that introduced innovations new only for the country, thevalue II to product and process innovators whose innovations were new only for the company, and the value I to companies declaring that they didnot introduce product and process innovations.bThe cells show the percentage of firms that introduced product (or process) innovations new for the world economy within each type of sub-sidiaries. So, for instance, cell. cThe test identifies the pairs that differ significantly. In this table we only include the comparisons that differ significantly relative to the type withthe highest values.
Ch006.qxd 6/29/2007 10:12 AM Page 149

us to disentangle the contradictory effects of dependence on the innovative activ-ity of the subsidiaries. In effect, on the one hand GDep subsidiaries ranked sec-ond (a better position than GInd subsidiaries), in several indicators of innovativeactivity — e.g. total investments in embodied and disembodied technologies andthe percentage of truly innovative product. This result could be interpreted asreflecting the advantages associated with better access to the technologicalresources of the MNE. On the other hand, with respect to some indicators, suchas patents, introduction of significant innovations or R&D, the group of GIndsubsidiaries is the one that performed better, immediately following the GDivgroup. In some cases, therefore, it seems to be more important for the innovativeactivity of a subsidiary to be independent from headquarters and to have an activeentrepreneurial attitude, rather than to be fully supported by the MNE. Therefore,the question about the circumstances in which dependency provokes a positiveeffect on the innovative activity of the subsidiaries, or alternatively, the circum-stances in which the independence or an entrepreneurial attitude in subsidiariescan compensate for the lack of access to the technological resources of the MNE,remains open.
4.1.3. Global and local linkages In this section, we explore the relationshipexisting between our typology and the intensity of local knowledge linkages. Weanalyse two types of local linkages: linkages with local agents in general andlinkages with local suppliers and clients. The results suggest that an importantassociation may exist between the typology of MNE subsidiaries and their likeli-hood to generate local linkages, as predicted in Section 2.3.
With respect to the patterns discussed, Table 6.7 shows that, not surprisingly,the GIso subsidiaries are also locally isolated. They have developed linkages with
150 Elisa Giuliani and Anabel Marin
Table 6.7: Global and local linkages.
Indicators GDiv GDep GInd GIso ANOVA test Post-hoc (I) (II) (III) (IV) testa
Linkages with 6 2.4 4 1.2 Significant*** I, III, II � IVlocal agents I, III � II
I�IVLinkages with 1.64 1.28 1.46 1.13 Significant*** I, III, II � IVlocal suppliers I, III � IIand clients I � III
aThe test identifies the pairs that differ significantly. In this table we only include the comparisonsthat differ significantly relative to the type with the highest values.
Ch006.qxd 6/29/2007 10:12 AM Page 150

local agents much less intensively than the other types (linkages with local agentsis 1.2, while linkages with local suppliers and clients is 1.13). At the same time,in line with the results from the previous section, and also with the discussion ofSection 2.3, GDiv subsidiaries are again the group that use local linkages moreintensively (6 and 1.64). In principle, these results are consistent with theexploratory propositions discussed in Section 2.3.
It is interesting to note as well that, in contrast to the analysis in the previoussections, here the relationship between types of subsidiary and types of locallinkages seems clearer. In effect, in line with our arguments in Section 2.3, GIndsubsidiaries tend to establish local linkages quite intensively — i.e. they are sec-ond only to the GDiv subsidiaries. This also means that GInd subsidiaries are sig-nificantly more capable of generating linkages than GDep subsidiaries (2.4 and1.28), consistent with our expectations in Section 2.3.
4.1.4. Summary of results A particularly interesting result regards GDiv sub-sidiaries, which (i) rely on a highly differentiated set of international knowledgesources, (ii) have strong internal knowledge resources and innovative capabilitiesand (iii) have developed substantial knowledge linkages at the domestic level.This may be due to two concurrent factors. First, as shown in Section 4.1.1, thistype of subsidiary has strong internal resources and high innovative capabilities,an aspect that also suggests that the knowledge that they are likely to transfer isof valuable content. Second, as explained in Section 2.3.1 and corroborated inSections 4.1.2 and 4.1.3, GDiv subsidiaries may be characterised by a prominententrepreneurial attitude that leads its managers to be willing to construct knowl-edge networks not only internationally, as demonstrated by their diversifiedglobal sourcing, but also with firms — both foreign and domestic — operating inArgentina. According to our data, GDiv subsidiaries are valuable channels ofinternational knowledge into the host economy.
GDep subsidiaries are characterised by (i) strong linkages with the headquar-ters or the MNE group more generally, (ii) moderate (to high) internal knowledgeresources and innovative capabilities and (iii) but limited local linkages. GDepsubsidiaries have established comparatively less domestic knowledge linkagesthan GDiv and GInd subsidiaries (see below). This may be due to the fact that thestrong dependence on the MNE knowledge resources may generate little incentiveto establish dense networks at the domestic level. Hence, in spite of the fact thatthis subsidiary has internal resources and innovative capabilities, its organisationmodel may inhibit the significant creation of domestic knowledge linkages.
GInd subsidiaries are characterised by (i) the development of linkages withother agents in international markets, which are independent from the MNEgroup, (ii) moderate (to high) internal resources and innovative capabilities and
Global and Local Knowledge Linkages 151
Ch006.qxd 6/29/2007 10:12 AM Page 151
(iii) quite intensive local knowledge linkages. The formation of linkages may bedue to the entrepreneurial and dynamic behaviour of this type of subsidiary,which may actively seek collaborations, both at the international and domesticlevel. However, because it does not benefit from technology transfer by the MNEheadquarters, GInd subsidiaries’ internal capabilities are slightly less advancedthan in the cases of GDiv, as indicated in Section 4.1.2. In consequence, althoughthe formation of linkages is high, the value of the knowledge transferred may notbe as high as in the case of the GDiv subsidiary.
Finally, as predicted, GIso subsidiaries are in a condition in which they (i) donot establish significant international linkages, (ii) have weak internal knowledgeresources and innovative capabilities and (iii) have formed poor domestic knowl-edge linkages. This case, quite consistent with our conceptual discussion inSection 2.3.4, highlights the fact that subsidiaries with poor internal resources areless likely to establish knowledge linkages (Giuliani & Bell, 2005). This isbecause they are either unable to generate valuable knowledge to transfer orbecause they have poor absorptive capacities (Cohen & Levinthal, 1990).
The Innovation Survey data, however, do not allow us to throw more light onthe reasons underpinning these different behaviours. These are therefore exploredin-depth using four illustrative cases in the section that follows.
4.2. Linking Global to Local: Four Illustrative Cases of MNE Subsidiaries
This section presents four cases of MNE subsidiaries, which were each selectedto provide anecdotal evidence for each type of subsidiary derived from our frame-work. The first case is that of a subsidiary operating in the tubes and pipes’ indus-try that is connected to a highly diversified array of international sources ofknowledge, including the subsidiary’s headquarters and the MNE’s other sub-sidiaries, as well as a number of foreign suppliers and/or clients (GDiv). The sec-ond case is about a subsidiary specialising in the production of bakery ovens,whose only source of knowledge is represented by the headquarters (GDep). Thethird case is about a firm operating in the food industry, which acquires knowl-edge from several international sources but not from the headquarters or theMNE’s subsidiaries (GInd). Finally, we leave the GIso subsidiary as the lastcase, which is about a subsidiary operating in the press industry, which has notestablished any relevant linkages with external sources of knowledge at the inter-national level. We give here a detailed account of each of these cases and addressthe issue of the formation of linkages at the domestic level.
4.2.1. The case of a globally diversified subsidiary in the tubes and pipes’industry (‘A’) This is an informing case about an MNE characterised by hori-zontal and collaborative relationships between subsidiaries and the headquarters.
152 Elisa Giuliani and Anabel Marin
Ch006.qxd 6/29/2007 10:12 AM Page 152

The group operates in the production of tubes and pipes for agriculture and civilinfrastructures and, since 2003, the property has become fully Latin Americanwith subsidiaries in several Latin American countries, including Brazil, Chile,Mexico, Costa Rica, Venezuela, Colombia and most of the Central Americancountries.7 The salient characteristics of this MNE is that it has adopted an organ-isation model such that the headquarters is ‘shared’, that is, it is rotating over timeacross the different countries (and subsidiaries) according to the specific require-ments of the MNE. For example, our respondent in the Argentinean subsidiary‘A’ declared that “at the beginning the headquarters was in Costa Rica because ithad a more ‘foreign style’ in doing business, now it is moving downwards (i.e. tothe Southern Cone), closer to where most of the production is done”. Very inter-estingly, the respondent describes this process in the following way: “it is like afather who has sons living in different countries and moves to live with each ofthem, changing over time”. And then he adds, “what we want to achieve is theelimination of a legal boundary, where what matters is the Latin American regionas a whole, not a particular country”. Each subsidiary is thus highly participativein the strategic decision making of the whole MNE.
The Argentinean subsidiary ‘A’ carries out both design and manufacturingprocesses. The design is aimed at the development of specific types of tubes andthe improvement of watering methods. The process and product development,however, is aimed at the development of products that are suitable for theArgentinean and the broader Latin American markets. The interesting aspect here is that other subsidiaries carry out intense design and product developmentactivities — such as, for example, in Ecuador and Mexico — and that these activ-ities are shared across the whole MNE. As noted above, the subsidiaries activ-ely cooperate among each other and executives travel intensively across allsubsidiaries — keeping them all always in contact. They get feedback, observe,learn and transfer this information to the other subsidiaries. As the respondent putit “there is an atomisation of the information”. In order to achieve higherintegration and to facilitate cross-subsidiary interactions, the MNE is currentlymaking an attempt to codify the knowledge, in order to improve their coordina-tion. For example, “each country specialises in something and the others knowthe codes, so if they need that something they can apply it. Anyway, this is inprocess and still there is a great bulk of production which will persist being pro-duced in all countries since they provide the domestic market mainly”. ‘A’ claimsto interact particularly strongly with the subsidiaries in Ecuador and Mexico, butthe respondents highlight, “this is for technical reasons but, broadly speaking, thisis a very horizontal group and no dominant position is purposefully searched byany of the subsidiary”.
Global and Local Knowledge Linkages 153
7The group has 24 plants in 13 Latin American and Central American countries.
Ch006.qxd 6/29/2007 10:12 AM Page 153

In addition to the MNE’s knowledge resources, ‘A’ searches for a wider array ofinternational sources of knowledge. A critical source in this case is represented bya North American leading company in the production of tubes and pipes. They basi-cally adapt and imitate this company’s product because, during the convertibilityperiod, they had a licensing agreement with this company to sell its products inArgentina. Although this type of activity is no longer sustainable (this product inArgentinean Pesos is unaffordable for the local market), they still have a strongrelationship with the US company and they are allowed to visit their plants.
Three other international suppliers are particularly important for the transferof knowledge and technology in ‘A’. All of them are producers of machinery fromItaly, the Netherlands and China. As we can see, this is a very dynamic subsidiary,very actively sharing knowledge with the rest of the MNE and also very entre-preneurial in establishing other international linkages — which eventually bene-fit the whole MNE.
At the domestic level, ‘A’ collaborates intensively with several local supp-liers (raw materials, metalworking) (see Figure 6.1). More interestingly, ‘A’ has
154 Elisa Giuliani and Anabel Marin
Figure 6.1: The case of a globally diversified subsidiary.Source: Own data. Graph based on Netdraw.
Ch006.qxd 6/29/2007 10:12 AM Page 154

established numerous linkages with domestic firms aimed also at the developmentof new materials for tubes and pipes (e.g. materials that comply with environmen-tal standards and mechanic standards for the final product to be resistant). Thisbehaviour is in line with the subsidiary’s dynamic and entrepreneurial attitude, andit is likely to have a much higher developmental impact than the other subsidiariespresented in the rest of this section (‘B’, ‘C’ and ‘D’). Domestic linkages formedby ‘A’ are much higher and also of a higher quality (interactive, oriented todevelop new products, very highly innovative), than that in the other cases.
4.2.2. The case of a globally dependent subsidiary in the bakery ovenindustry (‘B’) The Argentinean subsidiary ‘B’ has a long history in the pro-duction of industrial ovens. It was set up through a licensing agreement with anItalian company in the 1950s. In 1990, after circumstances led the original Italianlicensor to exit the market, subsidiary ‘B’ was taken over by another Europeancompany that is among the leaders in the production of bakery ovens worldwide.The two established an agreement by which ‘B’ sold a considerable part of itsproperty to the European counterpart, in exchange obtaining unlimited access tofrontier technologies. This is achieved through the transfer of updated designs ofnew machines and plants as well as through the visits of engineers to assist thechanges in the production processes.
Our respondent in ‘B’ quite frankly admitted that the subsidiary’s technologi-cal inputs came almost entirely from the headquarters and he described ‘B’ as apurely ‘technology taker’ subsidiary, with very limited R&D being carried outwithin the subsidiary. As the respondent put it “in this field the best technologiesare produced by industrialised countries and Argentina is isolated from the rest ofthe world”. More specifically, the respondent claimed that the headquarters oper-ate on the technological frontier and therefore ‘B’ “is not able to invent anything”because the technological gap is considered to be too wide. ‘B’ does indeed havea technical laboratory, but it is used just to adapt the imported designs to theArgentinean market and the respondent claims that adaptations are very minor. Inthe case of ‘B’, the dependence on the headquarters is very high and the rela-tionship is strongly hierarchical and unidirectional.
At the intra-subsidiary level, therefore, ‘B’ accesses frontier technologies andoperates with a high technological sophistication, but this is entirely due to thehigh dependence from the headquarters rather than to its internal effort. In fact,‘B’ follows a quite passive learning behaviour with no initiative to undertake aninnovative path different from what has been transferred by the headquarters.
In line with our argument in Section 2.3 and with the results of the ArgentineanInnovation Survey (Section 4.1), we find that this subsidiary develops very lim-ited linkages at the domestic level (see Figure 6.2). The only linkages that are
Global and Local Knowledge Linkages 155
Ch006.qxd 6/29/2007 10:12 AM Page 155

156 Elisa Giuliani and Anabel Marin
Figure 6.2: The case of a globally dependent subsidiary.Source: Own data. Graph based on Netdraw.
formed are with a few, very small artisan firms, which do some metalworking for ‘B’. ‘B’ transfers some technical knowledge through the interaction, but theimpact of this type of linkage in terms of generation of technological externali-ties in the host economy is likely to be limited because: (i) the relationshipbetween ‘B’ and the artisans is unidirectional, and no process of interacting andlearning is promoted through these types of linkage; and (ii) the artisans havethemselves very limited potential to amplify the knowledge that they havereceived from ‘B’ and diffuse it to other firms in the country. In contrast, theincoming knowledge is much more likely to run into the ‘dead-end’ of firms thatdiffuse little to other firms in their economic context (Giuliani & Bell, 2005).
4.2.3. The case of a globally independent subsidiary in the food industry (‘C’)Thirty-five years ago, ‘C’ started as a national firm for the production of bakeryproducts and grew in a market where the only competitor offered products for thelower-end of the bread market. It entered the market by targeting a very specificmarket-niche, oriented towards production of high quality and fresh products.
Ch006.qxd 6/29/2007 10:12 AM Page 156

Today, the firm is the leader in the domestic market, retaining more than 50% ofthe market share. It became part of a multinational group in 1997, when it wasacquired by a foreign investor. However, the foreign property has only a financialinterest in the firm and no specific expertise or tradition in the production of bak-ery products.
Innovation is central to this firm. Its challenge is to differentiate a product thatis normally considered as a commodity, such as bread. Accordingly, it has madea huge effort to diversify and customise the product, very similar to other indus-tries (e.g. the diary industry). In order to customise its products, ‘C’ has differen-tiated the offer into several product lines, an activity that has required substantialproduct development at the local level. Besides product development, manufac-turing and marketing are carried out entirely at the domestic level. In effect, ‘C’is completely autonomous from the headquarters. In this respect, the respondentmentions that “the property does not know whether we are developing a newproduct or not, we have total freedom in our choices, all they are interested in isour balance-sheet at the end of the financial year”. Interestingly, as the respon-dent put it “to be independent from the headquarters is more difficult but muchmore challenging and interesting (nicer)” (mas lindo in original).
Because of this, they have a number of international sources of knowledge thatfeed the active process of innovation, but none of them comes from the MNE.The fundamental source is represented by the American Institute of Baking,which is a private institute in the US, supported by the four or five largest bakingcompanies in the US, and they are those that generate knowledge worldwide inthis industry. This institution organises master courses and carries out substantialR&D, both of which are important sources of knowledge for ‘C’ — e.g. many ofthe employees have gone to go to attend master courses there. Other sources ofinternational knowledge come from literature and from fairs and congresses.Moreover, interactive and mutual learning is considered to occur with some oftheir international suppliers.
In Argentina, ‘C’ has formed relationships with a number of domestic suppli-ers (wheat, yeast, sunflower juice, etc.) and these relationships are also based on joint product development (Figure 6.3). It is interesting to note that ‘C’ hasestablished particularly strong linkages with three large suppliers, one of whichis Argentinean. Being connected to large suppliers is important as it may gen-erate a multiplying effect in the generation of externalities, and the impact ofthese linkages on other firms in the economy may be more important than that of linkages with other smaller domestic firms (i.e. the dead-ends observedin the case of subsidiary ‘B’). This is because, large suppliers may amplify theknowledge received from ‘C’ and transfer it to a wider array of other domesticfirms.
Global and Local Knowledge Linkages 157
Ch006.qxd 6/29/2007 10:12 AM Page 157

4.2.4. The case of a globally isolated subsidiary in the press industry (‘D’)Finally, the example of an isolated subsidiary proposed here is that of a companyworking in the press industry (‘D’) (see Figure 6.4). This choice may seem quitebizarre, as firms operating in the press industry need necessarily to be connectedto international press agencies (e.g. Reuters). However, our focus here was notdirected to this type of codified knowledge (i.e. news), but to the acquisition ofknowledge in the way business is run and the journal is managed and produced.For example, knowledge about how to develop a new format, how to change thenewspaper’s marketing strategies, how to target new market niches, etc. In this
158 Elisa Giuliani and Anabel Marin
Figure 6.3: The case of a globally independent subsidiary.Source: Own data. Graph based on Netdraw.
Figure 6.4: The case of a globally isolated subsidiary.Source: Own data. Graph based on Netdraw.
Ch006.qxd 6/29/2007 10:12 AM Page 158

respect, this company is determined as GIso because it is totally independentfrom international sources of knowledge. It was set up some 130 years ago andmore recently has been acquired by a North American press agency. Also, thenewspaper is managed and the decision-making process is carried out exclusivelyin Argentina and, as said, the subsidiary is completely independent from the head-quarters. It is only during severe financial crises that the headquarters intervenein supporting the journal but only from a financial side, never from a knowledge-centred one. The subsidiary managers seemed to be quite independent and tooperate in isolation from the domestic and international context. For this reason,we considered this subsidiary to have absolutely no impact on the generation ofknowledge spillovers in the host country.
5. CONCLUSIONS
This study was about the role of MNE subsidiaries in the generation of knowl-edge linkages in industrialising countries. It departs from the widely acknowl-edged view that subsidiaries are ‘leaky containers’ of knowledge and it stressesthat it might be important to consider a different model, one in which subsidiariesmay play a more active role in the process of generating externalities. This isrelated with the fact that subsidiaries are heterogeneous in their internal capabil-ities and in the extent to which they use resources from global sources and localsources (Marin & Bell, 2005).
The paper has discussed and empirically explored the relationship betweenthree important dimensions characterising the MNE subsidiaries’ potential forknowledge spillover effects in host countries: (i) the nature of subsidiaries’ globallinkages, (ii) their local innovative activities and (iii) their knowledge linkageswith local firms. In order to explore these relationships, we have discussed howsubsidiaries, which differ in terms of their global linkages, do also differ in termsof their innovative activities and of their propensity to establish local knowledgelinkages.
In order to explore this issue, we used both secondary data from theArgentinean National Innovation Survey (1998–2001), and the anecdotal evi-dence on MNE subsidiaries in Argentina. The empirical analysis has suggestedthat MNE subsidiaries engage in very diverse types of global networking, andthat, in connection with these networking activities, they develop different inter-nal capabilities and have different potentials for establishing knowledge linkageslocally. This is especially relevant in the context of industrialising countries,since, as said, ‘conventional theories’ presume that subsidiaries are passive recip-ients of headquarters’ generated knowledge. More specifically, we have identified
Global and Local Knowledge Linkages 159
Ch006.qxd 6/29/2007 10:12 AM Page 159

four different types of subsidiaries, characterised by distinct behaviours in termsof their innovative activity and of formation of knowledge linkages in the hosteconomy.
In our analysis, we find that only a certain typology of MNE subsidiary is ina condition to transfer valuable knowledge into the host country. This occurs inthe case of GDiv and GInd subsidiaries. In contrast, when subsidiaries aredependent on the MNE group, they seem less likely to develop dense networks atthe local level, leading these types of subsidiaries to be considered as dead-endsin the global knowledge pipeline. Finally, GIso subsidiaries tend to behave in iso-lation also at the local level, not representing a valuable source of knowledge forother firms in the host country.
The findings of this work also have several interesting implications, more ingeneral, on the issue of innovation in MNEs subsidiaries. More specifically, wehave provided arguments and empirical evidence that contribute to understandingreasons that could explain the underlying heterogeneity of innovative activity bythe MNE subsidiaries in host industrialising countries. First, we have shown thatthe intensity and nature of global linkages is associated with the intensity of inno-vative activity of subsidiaries. This is a very well-known fact in the industrialisedworld (e.g. Ahuja, 2000). However, it has been less studied in the case of firmsoperating in industrialising countries and even less in the case of subsidiaries ofMNEs in these types of countries. Second, we have raised a set of new interest-ing questions about the influence of different MNEs’ typologies on the formationof local knowledge linkages — an issue that remains open for investigation, butthat may provide an important contribution to the literature on the FDI andknowledge spillovers.
Finally, this analysis was set within specific empirical and methodologicallimits. The first is that, this study has not directly tested the relationship betweenthe four different types of subsidiaries and the generation of spillovers. Instead, ithas looked at the factors that are associated with the presence of knowledgespillovers: the innovative activities of the subsidiaries and their knowledge link-ages in the host country. This is an issue that we are going to explore in futureresearch. The second limitation is related with the qualitative analysis, and refersto the fact that the four case studies used in this analysis were selected among anumber of MNE subsidiaries on the basis of the quality of the information col-lected, which allowed the behaviour of each type of subsidiary to be illustrated indetail and in a complementary way to the statistical analysis. For this reason, theselection was done ad hoc and only provides anecdotal evidence to illustrate howMNE subsidiaries may differ in terms of their internal operations, and in this spe-cific case, in terms of the key variables explored: global linkages, innovativeactivity and local linkages. Finally, in relation with the quantitative part, it should
160 Elisa Giuliani and Anabel Marin
Ch006.qxd 6/29/2007 10:12 AM Page 160

be borne in mind that our analysis has not explored in detail the influence of indus-try effects on the behaviour of MNE subsidiaries. This relationship, as shown inTable 6.2 of this chapter, is not so strong as to affect our results. Nevertheless,there is some kind of weak association between our typology of subsidiaries andthe type of industry present in the data. In consequence, this is an aspect that couldbe analysed in more detail in future research.
Acknowledgements
The authors would like to thank the Editors of this book for their valuable sug-gestions on a previous version of this chapter. Thanks also go to Patrick vanZwanenberg and Ed Steinmueller for their valuable comments and to LilianaVarela and Paula Prados for their help during the fieldwork. Financial support by the UK Economic Social Research Council (ESRC) (PTA-026270644) and by the UNGS “Fondo semilla de estímulo para la investigación” is gratefullyacknowledged.
Appendix: Indicators of Global and Local Linkages
Global and local linkages are indicators of the extent to which subsidiaries utilise and value interactions with others international and/or local agents. TheInnovation Survey asked subsidiaries a number of linked questions about theirinteractions with other organisations in connection with innovation and problemsolving. We used the responses from two of these questions to develop indicatorsmeasuring different intensities of innovative-related linkages with internationaland local agents.
● Question (1): Main sources of information for innovation activitiesThe survey asked firms about the importance of alternative sources of infor-mation for innovation activities. They had to rank each source according to itsimportance for the firms. The possible importance varies from 1 (no impor-tance) to 4 (very important source). Headquarters and other subsidiaries were2 options among 11 possible sources offered by the survey. Others included:internal sources, public institutions, competitors, suppliers, consultants, jour-nals, conferences, etc.
● Question (2): Knowledge Interactions with other agentsFirms were asked: first, whether they used knowledge interactions with any of the 11 types of organisations for their current activities: (a) Universities,
Global and Local Knowledge Linkages 161
Ch006.qxd 6/29/2007 10:12 AM Page 161

(b) Technology Research Centres, (c) Laboratories, (d) Institutions ofTechnological Co-operation, (e) Suppliers, (f ) Clients, (g) Headquarters, (h) Other subsidiaries, (i) Competitors, (j) Consultants and (k) Public Agencies.Second, they were asked to indicate the geographic area where the identifiedorganisations were located. They were given the following options: (1) Local,(2) Regional, (3) National, (4) Latin-America, (5) The European Union, (6) USA or Canada, (7) Asia and (8) Others.
On the basis of these two questions, two indicators of innovation-related interac-tion were constructed. The first intends to capture different intensities and typesof global linkages and the second too the same, but focuses on local linkages.These are explained below.
Indicator of Global Linkages
The indicator of global linkages was calculated by combining the informationfrom Questions (1) and (2) in the following way.
First, we selected those sources/agents from Questions (1) and (2) that coin-cide. In this way we combine the information contained in Question (1),about the importance of the source/linkage, and the information contained inQuestion (2), about the localisation of the linkage/interaction. So we end upworking only with seven possible agents/sources: (1) Headquarters, (2) Othersubsidiaries, (3) Clients, (4) Competitors, (5) Suppliers, (6) Consultants, (7) Public agencies.Second, we eliminated those sources that did not come from foreign countriesin Question (2) (i.e. the ones that have not indicated this specific source tocome from either the Region, Latin America, European Union, USA orCanada, Asia, Others).Third, we created (var A) by adding up, by subsidiary, the number of inter-national linkages/sources mentioned in Questions (1) and (2).Finally, we calculated the indicator of ‘Global Linkages’ as the product of thenumber of international linkages/sources (var A) and the importance of eachpossible source/linkage, which according to Question (1) could vary from 1 to 4. Accordingly, the value of ‘Global Linkages’ of firm x ranges from 0 to(7 � 4) � 28 (seven, is the maximum number of global linkages that the sub-sidiaries might have.
Then, we classified the firms into four groups.
● Globally Isolated: When the subsidiary does not use and does not value anylinkage at the international level;
162 Elisa Giuliani and Anabel Marin
Ch006.qxd 6/29/2007 10:12 AM Page 162

● Globally Dependent: when the subsidiary uses and values highly linkages onlywith the headquarters (HQ) and other subsidiaries (Subs) of the MNE;
● Globally Diversified: when the subsidiary uses and highly values linkages withHQ, other subsidiaries and all the other sources;
● Globally Independent: when the subsidiary uses and values linkages only withother sources but not with the HQ and Subs.
Indicator of Local Linkages
In order to capture the general intensity with which subsidiaries establish linkageswith domestic agents — firms and institutions an indicator was calculated simplyas the sum of all the ‘Yes’ answers to the Question (2) above, but only when theinteractions of Question (2) are at Local, Regional and National Level.
References
Ahuja, G. (2000). Collaboration networks, structural holes, and innovation: A longitudinalstudy. Administrative Science Quarterly, 45, 425–455.
Barlett, C. A. (1986). Building and managing the transnational: The new organizationalchallenge. In: M. E. Porter (Ed.), Competition in global industries. Cambridge, MA:Harvard Business School Press.
Bartlett, C. A. & Ghoshal, S. (1989). Managing across borders: The transnational solu-tion. Boston: Harvard Business School.
Barlett, C. A., & Ghoshal, S. (1997). Managing innovation in the transnational corpora-tion. In: T. Tushman, & P. Anderson (Eds), Managing strategic change and innovation:A collection of Readings. New York: Oxford University Press.
Birkinshaw, J. & Morrison, A. (1995). Configurations of strategy and structure in sub-sidiaries of multinational corporations. Journal of International Business Studies, 26(4),63–74.
Blomtrom, M., & Kokko, A. (2003). Human capital and inward FDI. EIJS WorkingPapers Series 167, The European Institute of Japanese Studies, Stockholm.
Caves, R. (1974). Multinational firms, competition and productivity in host-country mar-kets. Economica, 41(May), 176–193.
Cohen, W. M., & Levinthal, D. A. (1990). Absorptive-capacity – a new perspective onlearning and innovation. Administrative Science Quarterly, 35(1), 128–152.
Ghoshal, S., & Barlett, C. (1990). The multinational corporation as an inter-organizationalnetwork. Academy of Management Review, 51, 603–625.
Giuliani, E., & Bell, M. (2005). The micro-determinants of meso-level learning and inno-vation: Evidence from a Chilean wine cluster. Research Policy, 34(1), 47–68.
Gorg, H., & Greenaway, D. (2004). Much ado about nothing? Do domestic firms reallybenefit from foreign direct investment? World Bank Research Observer, 19, 171–197.
Global and Local Knowledge Linkages 163
Ch006.qxd 6/29/2007 10:12 AM Page 163

Granovetter, M. (1985). Economic action and social structure: The problem of embedded-ness. American Journal of Sociology, 91, 481–510.
Granovetter, M. (1992). Problems of explanation in economic sociology. In: N. Nohria &R. G. Eccles (Eds), Networks and organizations: Structure, form, and action (pp. 25–56).Boston, MA: Harvard Business School Press.
Gupta, A., & Govindarajan, V. (1991). Knowledge and the structure of control withinmultinational corporations. Academy of Management Review, 16(4), 786–792.
Haskel, J., Pereira, S., & Slaughter, M. (2002). Does inward foreign direct investmentboost the productivity of domestic firms. NBER Working Paper No. 8724, NationalBureau of Economic Research, Cambridge, MA.
Hedlund, G. (1986). The hypermodern MNC: A heterarchy? Human ResourceManagement, 25, 9–36.
Jarrillo, J., & Martinez, J. (1990). Different roles for subsidiaries: The case of multina-tional corporations in Spain. Strategic Management Journal 11(7), 501–512.
Kogut, B., & Zander, U. (1993). Knowledge of the firm and the evolutionary theory of themultinational corporation. Journal of International Business Studies, 24(4), 625–645.
Lipsey, R. (2002). Home and host country effects of FDI. NBER Working Paper No. 9293,National Bureau of Economic Research, Cambridge, MA.
Marin, A., & Bell, M. (2005). The local/global integration of MNC subsidiaries, their tech-nological behaviour and FDI-related spillovers: Argentina in the late 1990s. Paper pre-sented at the international workshop on innovation, multinationals and localdevelopment, University of Catania, Sicily, 30 September–1 October.
Marin, A., & Bell, M. (2006). Technology spillovers from foreign direct investment (FDI):The active role of MNC subsidiaries in Argentina in the 1990s. Journal of DevelopmentStudies, 42(4): 678–697.
Markusen, J. (1995). The boundaries of multinational enterprises and the theory of inter-national trade. Journal of Economic Perspectives, 9, 169–189.
Marsden, P. V. (2005). Recent developments in network measurement. In: P. J. Carrington,J. Scott, S. Wasserman, (Eds). Models and methods in social network analysis.Cambridge: Cambridge University Press.
Papanastassiou, M., & Pearce, R. (1999). Individualism and interdependency in the tech-nological development of MNE: The strategic positioning of R&D in overseas sub-sidiaries. In: J. Birkinshaw & N. Hood (Eds), Multinational corporate evolution andsubsidiary development, (pp. 55–75). New York: St Martins Press. .
Perlmutter, H. V. (1969). The tortuous evolution of the multinational corporation.Columbia Journal of World Business, (Jan–Feb), 8–18.
Prahalad, C. K., & Doz, Y. (1987). The multinational mission: balancing local demandsand global vision. Free Press: New York.
Rodrik, D. (1999). The new global economy and developing countries: Making opennesswork. MD Policy Essay No.24. Overseas Development Council, Baltimore.
Roth, K., & Morrison, A. (1992). Implementing global strategy: Characteristics of globalsubsidiary mandates. Journal of International Business Studies, 23(4), 715–735.
Taggart, J. (1996). Multinational manufacturing subsidiaries in Scotland: Strategic rolesand economic impact. International Business Review, 5(5), 447–468.
164 Elisa Giuliani and Anabel Marin
Ch006.qxd 6/29/2007 10:12 AM Page 164

Wasserman, S., & Faust, K. (1994). Social network analysis. Methods and applications.Cambridge: Cambridge University Press.
White, H. C. (1970). Chains of opportunity. Cambridge, MA: Harvard University Press.White, R., & Poynter, T. (1984). Strategies for foreign-owned subsidiaries in Canada.
Business Quarterly, 48(4), 59–69.
Global and Local Knowledge Linkages 165
Ch006.qxd 6/29/2007 10:12 AM Page 165

This page intentionally left blank

Impact on Home Competitiveness
Ch007.qxd 6/29/2007 10:12 AM Page 167

This page intentionally left blank

Chapter 7
The Impact of Knowledge Transfer onMNEs’ Parent Companies. Evidence fromthe Italian Case
Lucia Piscitello and Larissa Rabbiosi
AbstractThis paper investigates the following research questions: (i) does the occurrence ofknowledge transfer from foreign subsidiaries to parent companies (RKT) affect thereceiving units’ innovativeness? (ii) How and to what extent does the use of differ-ent knowledge transfer mechanisms affect the receiving units’ innovativeness? Weresort to econometric analyses of 84 Italian multinational corporations and their rel-evant 307 foreign subsidiaries. Empirical findings confirm that RKT positivelyaffects the parent company’s innovativeness. Moreover, subsidiary’s knowledgetransferred through person-based mechanisms exhibits a stronger positive impacton the parent company’s innovativeness than knowledge transferred through ICTand written mechanisms.
1. Introduction
Over the last decades, there has been an upsurge of interest in the importance ofknowledge management in multinational enterprises (MNEs) as a crucial sourceof strategic competitive advantage. This is reflected in the conceptualization ofthe modern MNE within the ‘geocentric’ (Perlmutter, 1969), ‘heterarchical’(Hedlund, 1986), and ‘transnational’ (Bartlett & Ghoshal, 1989) models. Indeed,the very reason why MNEs exist and succeed is that they are efficient vehicles
Do Multinationals Feed Local Development and Growth?© 2007 by Elsevier Ltd.All rights of reproduction in any form reservedISBN: 978-0-08-045360-6
Ch007.qxd 6/29/2007 10:12 AM Page 169

for creating and transferring knowledge across borders (Birkinshaw, Hood, &Jonsson, 1998; Gupta & Govindarajan, 1991; Kogut & Zander, 1992).
Increasing work has been devoted to the analysis of changes in the MNEs’structure, and to the relevant changes in knowledge flows direction (Gupta &Govindarajan, 2000; Pearce, 1999): MNEs undertake foreign direct investments (FDIs) not only to exploit their ownership advantages abroad, but also to tapinto local sources of excellence, thus augmenting their existing stock of knowl-edge (Cantwell, 1995; Fors, 1997; Kuemmerle, 1999). Therefore, although theparent company continues to serve as the most active creator and diffuser ofknowledge within the corporation, foreign subsidiaries may also engage inknowledge transfer (KT) with both their internal and external networks (Frost,1998; Håkanson & Nobel, 2000, 2001). Empirical research has investigated manyaspects of such a process, namely: (i) how KT occurs within the MNEs, gener-ally looking at control and communication mechanisms (Criscuolo & Narula,2005; Egelhoff, 1988; Gupta & Govindarajan, 1991, 2000; Nobel & Birkinshaw,1998); (ii) how KT depends on the characteristics of knowledge, knowledgesources, knowledge senders, knowledge receivers, their relationships, etc. (for anexhaustive survey, see Minbaeva, 2005); and (iii) how KT affects the MNE’s per-formance and innovativeness (Ambos, Ambos, & Schlegelmilch, 2006; Frost,1998; Iwasa & Odagiri, 2004; Persaud, 2005; Subramaniam & Venkatraman,2001; Yamin & Otto. 2004). However, we still have a limited understanding ofthe following.
● How and to what extent the use of different mechanisms for transferringknowledge affects the receiving unit’s innovativeness?
● How MNEs transfer and integrate foreign competences within their knowledgebase in order to improve their innovativeness?
Within this context, the paper aims at investigating the role of KT from for-eign subsidiaries to their parent companies (reverse knowledge transfer — RKT),and the ability of the parent company to integrate and convert such knowledge ininnovativeness. Specifically, the purpose is twofold:
(1) to detect whether the occurrence of RKT affects the parent company’s innovativeness;
(2) to evaluate if and how the use of different mechanisms for transferringknowledge differently, influences the parent company’s innovativeness.
In order to fulfill these objectives, we developed an empirical analysis basedon 307 parent company-foreign subsidiary pairs. Data collection was based onface-to-face structured interviews with 84 Italian MNEs, and the key respondentsto the questionnaire were the parent company’s top managers.
170 Lucia Piscitello and Larissa Rabbiosi
Ch007.qxd 6/29/2007 10:12 AM Page 170

It might not be out of place here to specify that (a) according to Amit (1993,p. 35), we mean knowledge as a set of know-how and capabilities that “refer toa firm’s capacity to deploy resources, usually in combination, using organiza-tional processes, to effect a desired end. They are information-based, tangible orintangible processes that are firm specific and are developed over time throughcomplex interactions among the firm’s resources”; therefore, we identify knowl-edge that exists in the subsidiary in the form of know-how, such as productdesign, business practices, quality issues, distribution expertize, customer han-dling, and so on; (b) according to Szulanski (1996, p. 28), the concept of knowl-edge transfer “connotes the firm’s replication of an internal practice that isperformed in a superior way in some part of the organization and is deemedsuperior to internal alternate practices and known alternatives outside the com-pany”; (c) the word ‘transfer’ emphasizes the movement of knowledge withinthe organization, and this movement may take place through the MNE in at leastfive different forms (Gupta & Govindarajan, 2000): (i) flows from parent com-pany to subsidiaries, (ii) flows from subsidiaries to parent company, (iii) flowsfrom local environment to subsidiary, (iv) flows from subsidiary to local envi-ronment, and (v) flows to peer subsidiaries. It is therefore worth highlighting thatwe focus on case (ii) and following previous approaches (Foss & Pedersen,2002; Gupta & Govindarajan, 2000), we mean RKT as the use of the foreignsubsidiary’s knowledge by the parent company.
The rest of the chapter is organized as follows. In the next section, we reviewprior literature on KT and competitive advantage, and we put forward ourhypotheses. Section 3 describes the database RITMO (Research on Innovationand Technology in Multinational Organizations), and discusses the econometricanalysis. Section 4 concludes the chapter.
2. The Changing Role of Subsidiary, Knowledge Transfer andInnovativeness: The Hypotheses
2.1. Subsidiary Knowledge, Knowledge Transfer and Innovativeness
Within the traditional approaches to the firm’s multinational growth (Buckley &Casson, 1976; Caves, 1974; Dunning, 1992; Hymer, 1960; Vernon, 1966), firmsgoing abroad must possess ownership advantages (like technological knowledge,brand name, capital and organizational capabilities) allowing them to overcometheir “liability of foreignness”. MNEs undertake the FDIs to exploit abroad theirknowledge-based assets developed at home. However, most recent approacheshighlight that the firms’ international growth might be considered not only as a
The Impact of Knowledge Transfer on MNEs’ Parent Companies 171
Ch007.qxd 6/29/2007 10:12 AM Page 171

consequence of their endowment of exclusive advantages exploitable also onforeign markets, but also as a means to access new competitive resources andcompetences. In other words, as clearly explained by the seminal work of Bartlettand Ghoshal (1989), innovations can be developed on a joint basis, at both head-quarters and subsidiary level, thanks to the integration of resources and capabili-ties of diverse worldwide units within the MNE. The re-assessment of the roleplayed by foreign subsidiaries emphasize their ability to create an interfacebetween the major localized knowledge and the internal network (Birkinshaw,1996; Enright, 2000; Sölvell & Birkinshaw, 2000; Sölvell & Zander, 1998).Accordingly, foreign subsidiaries can themselves enhance the innovativeness oftheir corporate group. In particular, qualitative differences in the characteristicsof the foreign subsidiary might have different implications in the MNE creationand development of new knowledge (Cantwell & Mudambi, 2005).
The idea that MNEs might enjoy the important advantage of accessing country- and firm-specific knowledge available in multiple locations, has stimu-lated research on the process through which knowledge is managed by and within the MNE, and how this affects its innovativeness, productivity, and com-petitive advantage (Chakravarthy, McEvily, Doz, & Rau, 2003; Grant, 1996). In particular, several studies have addressed the impact of the access to newknowledge developed by other units on the changes observed in performance ofthe receiving unit.1 From a theoretical point of view, the literature on KT inMNEs has implicitly (positively) related it to the ability to integrate new geo-graphic dispersed competences and knowledge in the existing knowledge base,that consequently fosters technological and managerial innovation and createssynergies that can significantly leverage the MNE’s competitive advantage(Bartlett & Ghoshal, 1989; Cantwell, 1995; Gupta & Govindarajan, 2000;Hedlund, 1986; Kogut & Zander, 1992).
Accordingly, empirical evidence has variously shown that the impact of KTon specific MNEs’ activities is strictly connected to their ability to perform well.Generally, relying on the patent citations analysis, where citations are inter-preted as knowledge flowing from the inventor/applicant of the cited documentto the inventor/applicant of the citing one (Jaffe, Trajtenberg, & Henderson,1993), these studies show that MNEs appear to be more innovative, thanks tothe subsidiaries’ access to a larger stock of ideas and to the extent that they are
172 Lucia Piscitello and Larissa Rabbiosi
1See for example, Darr, Argote, and Epple’s (1995) findings on changes in productivity of fast foodstores due to the experience of the other stores in their franchise, the study of Baum and Ingram(1998) on effects on hotels’ survival due to the experience of other hotels in their chain, Mansfield(1984) that highlighted changes in manufacturing productivity due to the used of technologies utilizedby other connected plants.
Ch007.qxd 6/29/2007 10:12 AM Page 172

able to draw upon knowledge pool in their local environment (Almeida, 1996;Almeida & Kogut, 1999; Frost, 1998). Foreign affiliates, transferring knowl-edge to their parent companies and sister units, become a conduit for techno-logical diffusion of localized knowledge (Håkanson & Nobel, 2000, 2001), thuscontributing to the receiving unit’s innovativeness (Ambos et al., 2006; Frost,1998; Iwasa & Odagiri, 2004; Persaud, 2005; Subramaniam & Venkatraman,2001; Tsai, 2001; Yamin & Otto, 2004). The following hypotheses can thus beformulated:
HP1: Knowledge transfer from the foreign subsidiary to the parent company(RKT) is positively related to the parent company’s innovativeness.
2.2. Mechanisms for Transferring Knowledge and Innovativeness
Organizational theory suggests that the effectiveness of KT relies on mechanismsthrough which knowledge is managed and transferred within the organization(Argote, 1999). With reference to the MNE, the literature has variously empha-sized the role of formal organizational structures generally based on controlmechanisms (Nohria & Ghoshal, 1994; O’Donnell, 2000) as well as the role ofcommunication and coordination mechanisms (Gupta & Govindarajan, 2000;Pedersen, Peterson, & Sharma, 2003). However, although these studies give us aclear picture of which organizational design can enhance the transfer of knowl-edge within MNEs, they do not conclusively address which mechanisms (or com-binations of them) could strengthen the impact of KT on the receiving unit’sinnovativeness.
The social capital theory suggests that MNE integration needs inter-firm andintra-firm linkages that facilitate knowledge sharing and transfer (Nahapiet &Ghoshal, 1998). Specifically, person-based mechanisms, such as inter-unit trips and visits, international committees, teams, task forces, and training involv-ing participants from multiple units, facilitate the development of interper-sonal ties in the MNE, thus favoring KT (Björkman, Barner-Rasmussen, & Li, 2004; Bresman, Birkinshaw, & Nobel, 1999; Edwards & Ferner, 2004;Ghoshal, Korine, & Szulanski, 1994; Gupta & Govindarajan, 2000; Håkanson &Nobel, 2001; Pedersen et al., 2003; Persson, 2006). The efficient sharing of tacitknowledge is typically characterized by tight coupling between people from dif-ferent MNE’s units, and to enhance this transfer it is important that each personinvolved know each other beforehand (Bresman et al., 1999). Moving membersis generally seen as a powerful mechanism for facilitating the transfer of bothtacit and codified knowledge within organizations. The transfer of knowledgethrough moving technology has been shown to be more effective when it is
The Impact of Knowledge Transfer on MNEs’ Parent Companies 173
Ch007.qxd 6/29/2007 10:12 AM Page 173

accompanied by moving personnel (Galbraith, 1990; Zander & Kogut, 1995).Therefore, the movements of people, routines or technologies become predomi-nantly complementary rather than substitutes (Argote & Ingram, 2000).
Knowledge can be transferred also by written media as reports, publications,written instructions, and blueprints (Pedersen et al., 2003), as well as by ICT-basedmechanisms (Howells, 1995; Persaud, 2005; Sambharya, Kumaraswamy, &Banerjee, 2005). The role of ICT and effects of ICT in KT has also been celebratedas fundamental in the international transfer of knowledge (Almeida, Song, &Grant, 2002). Likewise, the use of ICT-based mechanisms, enabling communica-tion among managers from different countries, and assisting the integration ofdiverse insights in the MNE, across time and space, enhances knowledge creationand positively affects the MNE’s performance (Andersen & Foss, 2005).Nevertheless, recent empirical evidence indicates that ‘codified communication’based on impersonal source such as publications and reports, database or firm’sextensive intranet, is a much less effective way of transferring knowledge than the ‘personal communication’ (Buckley & Carter, 2004; Cross & Sproull, 2004,Haas & Hansen, 2005). The transfer of knowledge through ICT and documentsworks only when supplemented by more complex mechanisms that allow for theexchange of qualitative, indefinite, and uncertain knowledge, such as frequentdirect contacts between people belonging to the different MNE’s units (Almeida,Anupama, & Grant, 2003).
Mechanisms such as intranet, e-mail, file transfer, database, and reports, canefficiently transfer codified knowledge about products, operations, tangibleassets, and so on (Daum, 2003). The transfer of such knowledge mainly stimu-lates exploitation processes, increasing the overall efficiency in the receiving unit(Nonaka, Reinmöller, & Toyama, 2001). However, ICT and written mechanismsdo not allow for the additional transfer of tacit and experience-based knowledgecritical to enhance new knowledge combinations. The ‘rich’ communicationmedia2 may overcome the limits of electronic media (Daft & Lengel, 1986).Thus, the following hypotheses can be formulated:
HP2: The effect of RKT on the parent company’s innovativeness is greaterwhen it occurs through person-based mechanisms than through ICT-writtenmechanisms.
174 Lucia Piscitello and Larissa Rabbiosi
2“Information richness is defined as the ability of information to change understanding within a timeinterval. Communication transactions that can overcome different frames of references or clarifyambiguous issues to change understanding in a timely manner are considered rich. Communicationsthat require a long time to enable understanding or that cannot overcome different perspectives arelower in richness. In a sense, richness pertains to the learning capacity of a communication.Communication media vary in the capacity to process rich information” (Daft & Lengel, 1986, p. 560).
Ch007.qxd 6/29/2007 10:12 AM Page 174

3. Empirical Analysis
3.1. The RITMO Dataset
Data has been gathered through face-to-face structured interviews. The keyinformants were the parent company’s top managers, variously titled as president,managing director, or general manager.
The following steps guided the development of the questionnaire submittedduring the interview. First, in order to understand and clarify the phenomenon ofinterest, we chose to use a case-study methodology; accordingly, we conductedinterviews with top managers in four Italian MNEs.3 Second, we reviewed pre-vious research to sharpen our research questions and to choose, wherever possible,measures that would appropriately capture the constructs under study. Finally, wepre-tested the questionnaire for clarity and relevance with academics and throughface-to-face interviews with some parent companies’ top managers. These inter-views helped to refine the research instrument and to realize how managersunderstand the concept of knowledge transfer, what is knowledge for them, andthe meaning to them of different mechanisms utilized for transferring knowledge.The diverse answers allowed us to develop some examples that we used for thepurpose of illustration during the interviews to foster a better understanding of therespondents.
In December 2004, we began the data-collection process by contacting parentcompanies’ top managers through telephone and by sending them a personalized let-ter with the description of the project, the assurances regarding the confidentiality ofcollected data and a formal request for a face-to-face interview. The sample of par-ent companies to address was drawn from the Database Reprint4 that provides thepicture of foreign activities of the Italian firms as at the beginning of 2004. Then, outof the population of 2343 Italian MNEs operating into manufacturing industry, we
The Impact of Knowledge Transfer on MNEs’ Parent Companies 175
3These firms operate in medium- and high-technology-intensive-sectors (such as chemical, biomed-ical, synthetic fiber, and automotive components) and they have production and R&D facilities in sev-eral countries all over the world. The reason to start the process with these firms had to do with thefact that we had strong a priori expectations of them being involved in RKT. Accordingly, we foundthat these firms would serve as a good benchmark in the subsequent analysis of the wider sample.4The Dataset Reprint is developed and updated annually at Politecnico di Milano (Mariotti & Mutinelli,2005). It provides a census of the Italian firms with foreign activities from the beginning of 1986 to thebeginning of 2004, and the information available are the following: (i) corporate name and address of thehead office, for both the Italian parent companies and their foreign affiliates; (ii) the code of the industrialactivity, and other relevant economic variables (the dimensional class in terms of employees and turnover)for the Italian parent companies; and (iii) the year and the type of participation in each foreign affiliateparticipated by Italian firms (e.g. greenfield vs. acquisition, wholly/control/minority ownership).
Ch007.qxd 6/29/2007 10:12 AM Page 175

contacted only those with at least one majority-owned subsidiary located in advancedcountries and involved in “primary upstream activities” such as R&D and/or manu-facturing. Additionally, we excluded the very small Italian MNEs (those with lessthan 50 employees). Therefore, our population consisted of 358 Italian MNEs.
The interviews, which lasted 120–180 min each, were conducted inFebruary–June 2005. During the interviews, the respondents went through a pre-tested questionnaire and notes were taken by two interviewers to ensure accuraterecording of the responses. While the structured questionnaire was important formaking comparisons across the parent company-foreign subsidiary pairs, a signifi-cant strength of the ‘face-to-face survey’ was that each questionnaire’s answer wasclarified by the respondent with detailed information and examples. In order tominimize response bias, the participants were interviewed at their office, whereverlocalized in Italy.5 Such a process allowed the construction of the RITMO database,the first dataset that provides primary information on Italian MNEs, their foreignsubsidiaries’ technologies and competences, organizational mechanisms employedin RKT, and the effects of RKT on the parent company’s innovativeness.
Our final sample consisted of 84 Italian MNEs (corresponding to a responserate of about 24 percent), and their relevant 350 foreign subsidiaries located inabout 48 countries.
The sampled firms operate in diverse industries (food products, industrialmachinery, computers, telecommunications, pharmaceuticals, auto vehicles,chemicals, electronics, consumer durables, consumer nondurables, etc.); theyvary also by size, stage of internationalization, growth strategies, and so on.Concerning non-response bias, we compared the two subsets of respondents andnon-respondents in terms of size (class of number of employees), sectors, and areaof location of the parent company in Italy (see Table 7.A.1, in Appendix).Regarding size and parent company’s location area, no statistically significant differences between respondents and non-respondents were found, with theexception of firms with 500–5000 employees that are overrepresented in our sam-ple and parent companies located in central regions that are underrepresented. Thetwo groups differ in terms of sector: our sample is overrepresented by science-based and specialized supplier firms and underrepresented by traditional firms (or ‘supplier dominated’, see Pavitt, 1984). One reason for the small number offirms in the supplier dominated sector could be that most of the MNEs investingabroad in that sector, do not consider the possibility to transfer back knowledgefrom their subsidiaries, an important issue. This consideration could have
176 Lucia Piscitello and Larissa Rabbiosi
5Instead of running the interviews at the University, we chose to directly visit firms’ top managers totheir offices in order to avoid a greater likelihood of the participation of those located closer to theUniversity in the project.
Ch007.qxd 6/29/2007 10:12 AM Page 176

prevented their interest in participating in the RITMO project. Indeed, during thefirst phone conversations with firms in the traditional sectors this reason for notwanting to participate was confirmed.
3.2. Econometric Model
The empirical analysis is organized on two levels. First, through a simple probitanalysis, we investigate whether specific typologies of foreign subsidiaries arelikely to affect the parent companies’ innovativeness. In particular, we test if theoccurrence of RKT enhances the subsidiaries impact on their parent companies’ability to innovate. In the second step, through an ordered probit model run on thesubset of the parent company–foreign subsidiary dyads where RKT occurred, weanalyse how different mechanisms utilized for transferring knowledge, act to fos-ter the parent companies’ innovativeness.
The data are drawn from the 350 parent company–foreign subsidiary dyadssampled in the RITMO database. Specifically, in order to estimate the economet-ric models6 properly, we had to drop all the observations with missing values;7
thus, the final usable sample consists of 307 observations (parent company–foreignsubsidiary dyads).
In order to test our first hypothesis, we define the dependent variable INNOVA-TIVENESS. For each parent company–foreign subsidiary pairs, INNOVATIVENESS
equals 1 if the respondent has indicated that the foreign subsidiary induced somekind of positive effect on the parent company R&D activities, and zero if the par-ent company’s R&D has not been influenced at all by the subsidiary. In our data,49.2% of the foreign subsidiaries participated at the improvement of their parentcompanies’ innovative activities, while 156 subsidiaries out of 307 did not impactthe parent companies’ INNOVATIVENESS.
In the second step of the analysis, focussing on the subset of parent company–foreign subsidiary dyads where RKT occurred,8 we define the dependent variableINNOVATIVENESS-DEGREE. Specifically, we asked the respondent to rate — on a 7-pointLikert scale, where 1=‘no impact at all’; 7=‘a very high positive impact’ — theextent to which the knowledge transferred from the subsidiary to the parent firmaffected the latter’s innovative activities. In order to reduce complexity in the
The Impact of Knowledge Transfer on MNEs’ Parent Companies 177
6STATA8 has been used as econometric software package.7In some cases the respondents did not answer to one or two single questions, usually due to the impos-sibility of disclosing precise information. This lack of data has generated about 43 missing values.8It might be useful to clarify that we found that some kind of knowledge was actually transferred from88 subsidiaries (corresponding to about the 29% of the total number of foreign subsidiaries) to theirrelevant 45 Italian parent companies (54%).
Ch007.qxd 6/29/2007 10:12 AM Page 177
interpretation of results, we moved from a 7-point scale to a 3-point scale; namely,if the parent company does not acknowledge any effects due to the knowledgetransferred, the variable takes the value 0; when the RKT’s impact on the parentcompany’s ability to innovate is low or medium-low (scores from 2 to 4), the vari-able takes the value 1; when that impact is medium-high or high (scores from 5 to7), our dependent variable equals 2.
As far as the occurrence of RKT is concerned, following previous approaches(e.g. Gupta & Govindarajan, 2000), we consider the use of a foreign subsidiary’sset of know-how and capabilities by the parent company. In particular, the dummyvariable RKT equals 1 if any subsidiary’s knowledge/competence (in R&D, manu-facturing, marketing and sales, logistic and distribution, purchasing, humanresource management, general management, and quality management), has beenused by the parent company.
In order to disentangle whether other specific foreign subsidiary’s characteris-tics affect the parent company’s innovativeness, we define the following vari-ables. First, to account for the fact that the traditional subsidiary role of adoptingtechnology transferred from the parent company could actually be displaced bythe creation and development of local technological competences complementaryto the rest of the MNE (Bartlett & Ghoshal, 1989; Birkinshaw, 1996; Gupta &Govindarajan, 1991; Kuemmerle, 1997), we build the dummy variable COMPE-TENCE CREATING. This variable equals 1, if the parent company acknowledgedsuch a role to the subsidiary and 0, when the subsidiary had a competence-exploiting role. Specifically, the respondents were asked to indicate (1 = yes,0 = no) whether ‘the foreign subsidiary j has introduced to the MNE new and/orbetter technology and/or technological competence’ (product know-how, processknow-how, etc.). This measure achieves our intention of recording those sub-sidiaries that were competence-creating and recognized by the parent company.9
As far as firm size is concerned, it has been widely recognized as an importantfactor in explaining innovative performance (e.g., Geroski, 1990). Therefore, wecontrol for the RELATIVE SIZE as measured by the difference between the naturallogarithm of the subsidiary’s number of employees and the natural logarithm ofthe MNE’s number of employees, as in 2004.
The literature has shown that the level of the MNE integration in terms of trustas well as of system embeddedness is likely to increase significantly over time;consequently, we control for the foreign investment’s age. Specifically, FDI_AGE
is calculated as the difference between the current year (2004) and the year when
178 Lucia Piscitello and Larissa Rabbiosi
9Researchers have also measured the subsidiary’s role comparing the overall knowledge inflow andoutflow from subsidiaries (e.g. Chini, 2004). However, this operationalization is not applicable here,because we consider only the subset of parent company–foreign subsidiary pairs where RKT occurred.
Ch007.qxd 6/29/2007 10:12 AM Page 178

the subsidiary became a part of the Italian MNE. We also control for the entrymode: although acquisitions and joint ventures have been traditionally seen as acommon way the MNE may adopt to access local competencies and skills(Bresman et al., 1999; Kogut & Zander, 1993; Lane, Salk, & Lyles, 2001;Simonin, 1999), empirical studies also found that the incidence of technologytransfer from subsidiaries to parent companies is higher for greenfield sub-sidiaries than for acquisitions (Frost, 1998; Zhou, 2002). Therefore, we built thefollowing dummy variables: ACQUISITION, GREENFIELD, and JV.
As far as mechanisms for transferring knowledge — KT mechanisms — are con-cerned, we include eight dummy variables, each pertaining to a different mechanismthrough which knowledge can be transferred. Specifically, they refer to: FORMAL
COMMITTEES, VISITS/MEETINGS, TEAM WORK, MANAGERS’ TRANSFER, PROFESSIONALS’TRANSFER, REPORTING SYSTEM, MANUAL/DATABASE EXCHANGE, and corporateINTRANET. The less utilized was instead the use of corporate intranets (13.6%).Further, we considered also the use of ICT and written media as KT mechanisms(see, Persaud, 2005 and Haas & Hansen, 2005), while researchers interested in study-ing KT in MNEs, do not usually take them into account, although researchers haverecognized electronic media as a crucial topic (e.g. Gupta & Govindarajan, 2000).
Finally, to avoid picking up spurious effects it is important to control for otherlikely predictors of the parent company’s innovativeness. In particular, we con-trol for the industry, as foreign subsidiaries operating in different industries maybe facing different technological opportunities to enhance knowledge creationand development. Therefore, using the taxonomy developed by Pavitt (1984), we define the dummy HIGH-TECH that equals 1 if the subsidiary operates either in science-based or specialized suppliers sectors. In order to control for region-specific effects, we inserted the dummy variable ADVAREA that equals 1 if theforeign subsidiary is located in an OECD10 country, and 0 otherwise.
Table 7.1 shows descriptive statistics for all the explanatory variables.
4. Empirical Findings and Discussion
Results from the econometric estimations are reported in Tables 7.2 and 7.3,while — for the sake of space — the relevant marginal effects11 are reported in
The Impact of Knowledge Transfer on MNEs’ Parent Companies 179
10Unfortunately, our sample census only one FDI located in Japan.11The marginal effect for dummy variable is calculated by comparing the probabilities that result whenthe variable takes its two different values with those that occur with the other variables held at theirsample means (see, for details, Greene, 2000).
Ch007.qxd 6/29/2007 10:12 AM Page 179

the appendix, Table 7.A.2 and 7.A.3. Numbers in parentheses represent standarderrors. In order to obtain robust variance estimates, the Huber/White/sandwichestimator of variance is used in place of the traditional calculation. Likewise, wecorrect the estimated standard errors and the variance–covariance matrix of theestimators for the fact that the observations are independent across MNEs, but not necessarily within the MNE. In other words, we control for observations ofparent–subsidiary dyads belonging to the same MNE that are not expected to beindependent, although they must be independent between different MNEs.12
180 Lucia Piscitello and Larissa Rabbiosi
12This correlation is due to unobserved MNE-specific effects that influence the overall occurrence ofRKT in the parent–subsidiary dyad.
Table 7.1: Descriptive statistics.
Variable Observations Mean Standard Variabledeviation typology
Reverse knowledge transferRKT 307 0.287 0.453 Binary variable
Subsidiary’s characteristicsCompetence-creating 307 0.345 0.476 Binary variableRelative size 307 �3.116 1.330 Continuous variableFDI-age 307 9.531 6.949 Discrete variableAcquisition 307 0.557 0.498 Binary variablejv 307 0.104 0.306 Binary variable
KT mechanismsa
Formal committees 88 0.398 0.492 Binary variableVisits/meetings 88 0.875 0.333 Binary variableTeam work 88 0.659 0.477 Binary variableManagers’ transfer 88 0.545 0.501 Binary variableProfessionals’ transfer 88 0.284 0.454 Binary variableManual/database 88 0.341 0.477 Binary variableReport system 88 0.295 0.459 Binary variableCorporate intranet 88 0.341 0.477 Binary variable
Industry and geographic characteristicsHigh-tech 307 0.365 0.482 Binary variableAdvarea 307 0.687 0.464 Binary variable
aDescriptive statistics calculated on the subset of parent company–foreign subsidiary pairs, whereKT occurred.
Ch007.qxd 6/29/2007 10:12 AM Page 180

Our hypotheses, put forward in Section 2, seem to be generally confirmed. Inparticular, as far as Hypothesis 1 is concerned, the estimated coefficient inModel 1 strongly supports it: the variable RKT is positive and significant atp � 0.05. It is also worth observing that the estimation obtained for coefficientsof the other variables (Model 1) identify specific characteristics of foreign sub-sidiaries that mediate their impact on parent companies’ innovativeness. In par-ticular, the impact induced by the foreign subsidiary on the dependent variableINNOVATIVENESS is stronger when the subsidiary operates in high-technology sec-tors, as shown by the coefficient of the variable HIGH-TECH that is positive andstatistically significant at the conventional level ( p� 0.1). As captured by thevariable FDI-AGE ( p � 0.05), a longer experience of the parent company withthe foreign subsidiary enables the parent to learn the availability of subsidiary’sknowledge and technological resources, and to establish mechanisms generallybased on trust and personal reciprocity that help the exploitation of that knowl-edge. The negative and significant ( p � 0.05) coefficient of the dummy ACQUI-SITION suggests that newly established foreign subsidiaries appear to be morerelevant in affecting their parent companies’ innovativeness compared to the
The Impact of Knowledge Transfer on MNEs’ Parent Companies 181
Table 7.2: Subsidiary effect on parent company’s innovativeness: The role ofRKT.
Variable Model 1
Reverse knowledge transferRKT 0.832 (0.384)**
Subsidiary’s characteristicsCompetence-creating subsidiary 0.711 (0.279)**
Relative size �0.057 (0.101)FDI-age 0.044 (0.017)**
Acquisition �0.535 (0.244)**
Jv �0.106 (0.340)
Industry and geographic characteristicsHigh-tech 0.594 (0.323)*
Advarea �0.272 (0.226)
Observations 307Wald �2 35.05***
Log pseudo-likelihood �169.753
*p � 0.10; **p � 0.05; ***p � 0.01. Probit regressions, heterogeneity robust, and cluster estimation.
Ch007.qxd 6/29/2007 10:12 AM Page 181

acquired subsidiaries.13 Although the acquisition may provide new technologicalcapabilities for the MNE, the parent company might not be willing, or able, to usethem. Additionally, communication and integration between parent company andacquired subsidiaries may be less dense than that between parent and green-field subsidiary. RKT from greenfield subsidiaries may be easier than that from acquired subsidiaries, also due to the cumulativeness and the path depend-ency characteristics of knowledge (Nelson & Winter, 1982). In fact, as existing
182 Lucia Piscitello and Larissa Rabbiosi
Table 7.3: KT mechanisms and parent company’s innovativeness.a
Variable Model 2 Model 3
KT mechanismsFormal committees �1.112 (0.383)***
Visits/meetings 0.677 (0.341)** 0.815 (0.332)**
Team work 1.126 (0.459)** 1.123 (0.439)**
Managers’ transfer 0.388 (0.357) 0.491 (0.357)Professionals’ transfer �0.073 (0.484) �0.306 (0.446)Manual/database exchange �0.198 (0.475) �0.212 (0.466)Reporting system �0.938 (0.541)*
Corporate intranet 0.843 (0.443)* 1.087 (0.568)*
Subsidiary’s characteristicsCompetence-creating subsidiary 1.220 (0.501)** 1.057 (0.520)**
Relative size �0.114 (0.141) 0.011 (0.145)FDI-age 0.057 (0.027)** 0.035 (0.026)Acquisition �0.244 (0.406) �0.587 (0.439)Jv 0.384 (0.955) �0.205 (0.916)
Industry and geographic characteristicsHigh-tech 0.820 (0.396)** 0.886 (0.465)*
Advarea �0.311 (0.421) �0.099 (0.429)
Observations 88 88Wald �2 59.82*** 60.37***
Log pseudo-likelihood �55.354 �57.816
*p � 0.10; ** p � 0.05; *** p � 0.01. Ordered probit regressions, heterogeneity robust and clusterestimation.aEstimates calculated on the subset of parent company–foreign subsidiary pairs, where KT occurred.
13Using a patent citation analysis on U.S. patent data, Zhou (2002) finds similar results on the effectof acquisition on knowledge flows from foreign subsidiary to parent firms.
Ch007.qxd 6/29/2007 10:12 AM Page 182

knowledge is the base to develop new ideas, and as new knowledge depends uponknowledge available in the previous period, parent firms may face difficulties tounderstand and transfer knowledge of their acquired subsidiary.
It has been suggested that there is qualitative difference in the nature ofcompetence-creating and competence-exploiting subsidiaries (Cantwell &Mudambi, 2005), and accordingly they are expected to affect differently theeffect induced by the foreign subsidiary on the parent company’s innovativeness.The coefficient of COMPETENCE-CREATING is positive and statistically significant( p � 0.05), supporting the idea that competence-creating subsidiaries are likely topossess high–quality, knowledge-based resources, and they contribute to intro-duce distinctive knowledge, which is new to the parent company.
We do not find any support for the parent company’s innovativeness from theother control variables.
In order to test Hypothesis 2, i.e. to what extent the use of different KT mech-anisms affects the impact of RKT on the parent company’s innovativeness, themodels have been run only on the subset of foreign subsidiaries (88 out of 307)responsible for any sort of RKT, and the dependent variable is INNOVATIVENESS-DEGREE.
As the correlation matrix (see Table 7.A.4, in the appendix) shows, the two vari-ables FORMAL COMMITTEE and REPORTING SYSTEM are highly correlated (0.54, p � 0.01), and further investigations revealed that they suffer from multi-collinearity problems.14 Therefore, following a classic approach for dealing withproblems of multicollinearity (Kennedy, 1998), we present the Models 2 and 3(Table 7.3) in which: (i) FORMAL COMMITTEE is included, but REPORTING STSTEM isnot and (ii) REPORTING SYSTEM is included, but FORMAL COMMITTEE is not.
The results show that only selected KT mechanisms, such as TEAM WORK
( p � 0.05), VISITS/MEETINGS ( p � 0.05), and CORPORATE INTRANET ( p � 0.1) areindividually effective channels to transfer knowledge. They are effective in thesense that knowledge transferred through these mechanisms induce a greater pos-itive impact on the parent company’s innovativeness. In fact, the use of unsuit-able transfer mechanisms may cause loss of knowledge in the transmissionprocess or may induce high communication costs (Pedersen et al., 2003) that con-sequently reduce the possible exploitation of knowledge transferred.
We found a partial support for Hypothesis 2. The results show that the transferof knowledge through visits/meetings and teamwork has a stronger positive effecton the parent company’s ability to improve its innovative activities. However, the transfer of knowledge through formal committees appears inefficiently: the
The Impact of Knowledge Transfer on MNEs’ Parent Companies 183
14Although REPORTING SYSTEM and CORPORATE INTRANET are fairly correlated (0.59), further investi-gations do not reveal any problems of multicollinearity.
Ch007.qxd 6/29/2007 10:12 AM Page 183

coefficient of FORMAL COMMITTEES is negative and statistically significant atp � 0.01. The coefficients of the other person-based mechanisms come out to benot statistically significant at any conventional level.
Concerning the use of written media for transferring knowledge, the coeffi-cient of MANUAL/DATABASE EXCHANGE comes out being not statistically significantat any conventional level. On the contrary, the results seem to suggest that whenRKT occurs through ICT-based mechanisms, it has some effect on the parentcompany’s innovativeness. The variable REPORTING SYSTEM ( p � 0.01) presents anegative and significant coefficient, meaning that it is ineffective as a means fortransferring knowledge.
The above results suggest further considerations. First of all, the use ofperson-based mechanisms appear to be more likely to affect the parent company’sinnovativeness than the use of ICT-written mechanisms. However, it is impor-tant to recognize that a selective use of KT mechanisms can be observed. As far as the person-based mechanisms are concerned, competences transferredthrough face-to-face visits are valuable sources of innovation, teamwork appearsto be a crucial way of combining in a new manner different skills and knowledgethat hitherto existed separately, allowing the creation of unique resources thatenhance innovativeness. Instead, too formal structures could slacken and har-ness the opportunity of the parent and the subsidiary company to learn from eachother. With respect to this, it is interesting to note a similar negative effect ofRKT through formal committee and reporting systems on the parent company’sinnovativeness.
On the other hand, subsidiary’s knowledge transferred through corporateintranet is likely to be used by the parent company to improve and develop itsinnovative activities; nevertheless, the exchange of manuals, blueprints, and data-bases does not directly affect the parent company’s innovativeness.
5. Concluding Comments
This study contributes to the research on the relationship between knowledgetransfer and MNE’s innovativeness. As far as we know, it is among the first stud-ies attempting to explore empirically, the consequences upon the parent com-pany’s innovativeness of the transfer of subsidiary’s knowledge. Specifically,our aim was threefold: to detect whether the foreign subsidiaries play a positiverole affecting the parent company’s innovativeness; to detect whether that posi-tive relationship is associated to the occurrence of RKT (knowledge transferfrom the foreign subsidiary to the parent company); to evaluate if and how theuse of different mechanisms for transferring knowledge differently affects theparent company’s R&D activities.
184 Lucia Piscitello and Larissa Rabbiosi
Ch007.qxd 6/29/2007 10:12 AM Page 184

We argued that the multinationality improves the parent company’s innova-tiveness and that mainly occurs through RKT. This provides further evidence onrecent developments in the IB field, where the creative role of foreign subsidiariesis increasingly taken into account when assessing the competitive advantage of theMNE as a whole.
Moreover, we argue that how the knowledge transferred affects the parent com-pany’s innovativeness could be expected to depend on the means applied to trans-fer the subsidiary’s knowledge. Our findings confirm that parent companiesinnovate their activities drawing on their subsidiaries’ knowledge. When that RKToccurs through person-based mechanisms, in particular through teamwork, visitsand meetings, it is more effective, i.e. it induces a greater impact on parent com-pany’s innovativeness. The results also indicate that the parent company’s innova-tiveness is partially influenced by the use of ICT and written mechanisms. While theRKT effect on the parent company’s innovativeness is negatively related to the useof formal KT mechanisms such as formal committees and reporting systems.
The hypotheses developed in this paper have been tested with a unique data setcreated to personally interview the top managers of 84 Italian MNEs with regardto their 307 relevant FDIs located in more than 48 countries. Our choice to collectdata through personal interviews helped us ascertain that each question was per-fectly understood by the respondents and that they did their best to provide us withhigh-quality information. Still, the study remains subject to certain limitations thatneed to be considered. First, the use of perceptual instruments to measure theextent of RKT and its effects on parent companies’ innovativeness, and the factthat the same person provided all the answers to the questionnaire, are aspects thatmay entail potential general common method bias. We reduced this risk throughthe face-to-face interviews. In fact, a significant strength of the face-to-face con-tact is that each questionnaire’s answer has been clarified through interactionbetween the respondent and the interviewer, while using detailed information andexamples. This approach is expected to reduce similar pattern of answers — madeby the same individual — when similar scales are used for many of the items.Moreover, the Harman’s single-factor test (Harman, 1967; Podsakoff & Organ,1986) was performed. If common-method bias exists in the data, a single factorwill emerge from a factor analysis of all measurement items included in the study,or one general factor that accounts for most of the variance, will result. The factoranalyses reported good properties, supporting the validity of the results. Precisely,considering the sample of the parent company–foreign subsidiary dyads, the testfound eight factors, where the maximum variance explained by a single factor was14%. However, given the limitation of self-reported data, the complexity, andmulti-dimensional nature of the phenomenon under consideration, future researchshould observe not only the parent companies’ point of view, but also the percep-tion of the same phenomenon from the subsidiaries’ side.
The Impact of Knowledge Transfer on MNEs’ Parent Companies 185
Ch007.qxd 6/29/2007 10:12 AM Page 185

Although this study analyzed RKT at the dyadic level, that is recognized to bebetter than the nodal one (e.g. Gupta & Govindarajan, 2000), a superior approachwould be an analysis at the ‘systemic’ level. This approach would allow the study ofthe occurrence of KT and its effect on the receiving unit within all the multinationalnetwork relationships. It can also be noted that, like most social science models,some potentially important factors may be excluded. For instance, among the poten-tial other forces that might be at work in our analyses, corporate control mechanismsmay have an effect on RKT. Likewise, the subsidiary’s access to diverse sources ofknowledge, in the local context, might affect both the availability of new knowledgeand — when it is transferred — its effect on the receiving unit. Therefore, futureresearch should investigate how parent companies can influence the occurrence andthe effectiveness of RKT by implementing different combinations of control mech-anisms with integrative mechanisms, taking into account the subsidiary’s autonomy.Likewise, it can be fruitful to analyze whether transferred knowledge, developedthrough external relationships, affect the parent companies’ innovativeness.
Appendix
186 Lucia Piscitello and Larissa Rabbiosi
Table 7.A.1: Sample’s representativeness.
MNEs Non- Respondent ��2 testrespondent
SectorsScience based 44 29 15 0.0757*Specialized suppliers 65 42 23 0.0122**Scale intensive 163 125 38 0.9765Supplier dominated 86 78 8 0.0003***
Size50–249 98 80 18 0.1624250–499 81 66 15 0.2325500–5000 145 102 43 0.0225**�5000 34 26 8 0.9924
Parent company’s location areaNorth West 202 149 53 0.1587North East 109 82 27 0.6994Centre 40 36 4 0.0330**South–Island 7 7 0 0.1390
*p � 0.10; **p � 0.05; ***p � 0.01
Ch007.qxd 6/29/2007 10:12 AM Page 186

The Impact of Knowledge Transfer on MNEs’ Parent Companies 187
Table 7.A.2: Marginal effects from Table 3, models 2 and 3.
Variable Model 2 Model 3
Y = 0 Y = 1 Y = 2 Y = 0 Y = 1 Y = 2
KT mechanismsFormal committees 0.178 0.179 �0.357Visits/meetings �0.135 �0.099 0.235 �0.206 �0.096 0.302Team work �0.213 �0.176 0.388 �0.252 �0.167 0.419Managers’ transfer �0.067 �0.089 0.156 �0.092 �0.102 0.194Professionals’ transfer 0.019 0.025 �0.044 0.060 0.061 �0.121Report system 0.040 0.044 �0.084Manual/database
exchange 0.089 0.097 �0.186 0.213 0.141 �0.354Corporate intranet �0.133 �0.229 0.362 �0.163 �0.245 0.408
Subsidiary’s characteristicsCompetence-creating
subsidiary �0.235 �0.169 0.404 �0.243 �0.152 0.394Relative size 0.018 0.025 �0.044 �0.002 �0.002 0.005FDI-age �0.008 �0.011 0.019 �0.006 �0.008 0.014Acquisition 0.035 0.049 �0.084 0.103 0.127 �0.231Jv �0.036 �0.064 0.100 0.041 0.040 �0.081
Industry and geographic characteristicsHigh-tech �0.127 �0.223 0.350 �0.135 �0.204 0.339Advarea 0.051 0.084 �0.135 0.017 0.022 �0.039
Table 7.A.3: Correlations matrix.
(1) (2) (3) (4) (5) (6) (7) (8)
(1) RKT 1.000(2) Competence
creating 0.464 1.000(3) Relative size 0.118 0.084 1.000(4) FDI-age 0.037 �0.120 0.089 1.000(5) Acquisition �0.015 0.193 0.124 �0.191 1.000(6) Jv �0.075 �0.113 �0.042 �0.063 �0.383 1.000(7) High-tech �0.047 �0.038 0.028 0.039 �0.073 �0.059 1.000(8) Advarea 0.055 0.180 0.153 0.173 0.304 �0.253 �0.014 1.000
Ch007.qxd 6/29/2007 10:12 AM Page 187

188L
ucia Piscitello and L
arissa Rabbiosi
Table 7.A.4: Correlations matrix, subset of parent company–foreign subsidiary pairs, where KT occurred.
(1) (2) (3) (4) (5) (6) (7) (8) (9) (10) (11) (12) (13) (14) (15)
(1) Formal committees 1.000(2) Visits/meetings �0.184 1.000(3) Team work �0.150 0.163 1.000(4) Managers’ transfer �0.098 0.138 0.066 1.000(5) Professionals’ transfer 0.209 �0.143 0.294 0.069 1.000(6) Manual/database �0.291 0.272 0.366 0.368 �0.081 1.000(7) Report system 0.542 �0.132 �0.322 0.091 �0.021 �0.151 1.000(8) Corporate intranet �0.144 �0.018 0.264 0.368 �0.240 0.595 0.060 1.000(9) Competence creating �0.164 �0.028 0.613 �0.014 0.146 0.219 �0.379 0.271 1.000
(10) Relative size �0.040 �0.112 �0.159 �0.289 0.180 �0.289 0.066 �0.309 �0.251 1.000(11) Fdi-age �0.021 �0.156 �0.243 �0.176 0.011 �0.163 �0.155 �0.057 �0.046 0.171 1.000(12) Acquisition 0.276 �0.138 0.258 �0.238 0.423 �0.403 0.041 �0.355 0.234 0.292 �0.129 1.000(13) Jv �0.036 0.102 0.004 �0.115 �0.170 0.186 �0.076 0.091 �0.113 0.049 �0.040 �0.296 1.000(14) High-tech 0.171 �0.247 0.045 �0.331 0.041 �0.198 0.235 �0.096 0.152 0.205 0.065 0.349 �0.190 1.000(15) Advarea 0.028 �0.154 0.044 �0.457 0.159 �0.206 �0.051 �0.259 0.035 0.418 0.220 0.466 �0.037 0.321 1.000
Ch007.qxd 6/29/2007 10:12 AM Page 188

References
Almeida, P. (1996). Knowledge sourcing by foreign multinationals: Patent citation analysisin the US semiconductor industry. Strategic Management Journal, 17, 155–165.
Almeida, P., Anupama, P., & Grant, R., M. (2003). Innovation and knowledge manage-ment: Scanning, sourcing, and integration. In: M. Easterby-Smith & M. A. Lyles (Eds),Handbook of organizational learning and knowledge management (pp. 356–371).Padstow, Cornwall, UK: Blackwell Publishing Ltd.
Almeida, P., & Kogut, B. (1999). Localization of knowledge and the mobility of engineersin regional networks. Management Science, 45, 905–917.
Almeida, P., Song, J., & Grant, R. M. (2002). Are firms superior to alliances and markets?An empirical test of cross-border knowledge building. Organization Science, 13,147–161.
Ambos, T. C., Ambos, B., & Schlegelmilch, B. B. (2006). Learning from foreign sub-sidiaries: An empirical investigation of headquarters’ benefit from reverse knowledgetransfers. International Business Review, 15, 294–312.
Amit, R., & Schoemaker, P. J. H. (1993). Strategic assets and organizational rent. StrategicManagement Journal, 14, 33–46.
Andersen, T. J., & Foss, N. J. (2005). Strategic opportunity and economic performance inmultinational enterprises: The role and effects of information and communication tech-nology. Journal of International Management, 11, 293–310.
Argote, L. (1999). Organizational learning: Creating, retaining, and transferring knowl-edge. Norwell, MA: Kluver.
Argote, L., & Ingram, P. (2000). Knowledge transfer: A basis for competitive advantage infirms. Organizational Behavior and Human Decision Processes, 82, 150–169.
Bartlett, C. A., & Ghoshal, S. (1989). Managing across borders: The transnational solution.Boston: Harvard Business School Press.
Baum, J. A. C., & Ingram, P. (1998). Survival-enhancing learning in the Manhattan hotelindustry. Management Science, 44, 996–1016.
Birkinshaw, J. (1996). How multinational subsidiary mandates are gained and lost. Journalof International Business Studies, 27, 467–496.
Birkinshaw, J., Hood, N., & Jonsson, S. (1998). Building firm-specific advantages inmultinational corporations: The role of subsidiary initiative. Strategic ManagementJournal, 9, 221–241.
Björkman, I., Barner-Rasmussen, W., & Li, L. (2004). Managing knowledge transfer inMNCs: The impact of headquarters control mechanisms. Journal of InternationalBusiness Studies, 35, 443–455.
Bresman, H., Birkinshaw, J., & Nobel, R. (1999). Knowledge transfer in internationalacquisitions. Journal of International Business Studies, 30, 439–462.
Buckley, P. J., & Carter, M. J. (2004). A formal analysis of knowledge combination inmultinational enterprises. Journal of International Business Studies, 35, 371–384.
Buckley, P. J., & Casson, M. (1976). The future of multinational enterprise. London:MacMillan.
The Impact of Knowledge Transfer on MNEs’ Parent Companies 189
Ch007.qxd 6/29/2007 10:12 AM Page 189

Cantwell, J. A. (1995). The globalisation of technology: What remains of the product cyclemodel? Cambridge Journal of Economics, 19, 155–174.
Cantwell, J. A., & Mudambi, R. (2005). MNE competence-creating subsidiary mandates.Strategic Management Journal, 26, 1109–1128.
Caves, R. E. (1974). Multinational firms, competition and productivity in host-countrymarkets. Economica, 32, 176–193.
Chakravarthy, B., McEvily, S., Doz, Y., & Rau, D. (2003). Knowledge management andcompetitive advantage. In: M. Easterby-Smith & M. A. Lyles (Eds), Handbook of orga-nizational learning and knowledge management (pp. 305–323). Padstow, Cornwall,UK: Blackwell Publishing Ltd.
Chini, T. C. (2004). Effective knowledge transfer in multinational corporations. New York:Palgrave Macmillan.
Criscuolo, P., & Narula, R. (2005). Using multi-hub structures for international R&D:organizational inertia and the challenges of implementation. MERIT-InfonomicsResearch Memorandum Series 025.
Cross, R., & Sproull, L. (2004). More than an answer: Information relationships for action-able knowledge. Organization Science, 15, 446–462.
Daft, R. L., & Lengel, R. H. (1986). Organizational information requirements, media rich-ness and structural design. Management Science, 32, 554–571.
Darr, E. D., Argote, L., & Epple, D. (1995). The acquisition, transfer and depreciation ofknowledge in service organizations: Productivity in franchises. Management Science,41, 1750–1762.
Daum, J. H. (2003). Intangible assets and value creation. Chichester: Wiley.Dunning, J. H. (1992). Multinational enterprise and the global economy. Wokingham:
Addison-Wesley.Edwards, T., & Ferner, A. (2004). Multinational, reverse diffusion and national business
systems. Management International Review, 1, 49–79.Egelhoff, W. G. (1988). Organizing the multinational enterprise: An information-processing
perspective. Cambridge, MA: Ballinger.Enright, M. (2000). Regional clusters and multinational enterprises: Independence, depend-
ence or interdependence? International Studies of Management and Organization, 30,114–138.
Fors, G. (1997). Utilization of R&D results in the home and foreign plants of multinationals.Journal of Industrial Economics, 45, 341–358.
Foss, N. J., & Pedersen, T. (2002). Transferring knowledge in MNCs: The role of sourcesof subsidiary knowledge and organization context. Journal of InternationalManagement, 8, 49–67.
Frost, T. (1998). The geographic sources of innovation in the multinational enterprise:U.S. subsidiaries and host country spillovers 1980–1990. Unpublished doctoral disser-tation, Massachusetts Institute of Technology, Boston.
Galbraith, C. S. (1990). Transferring core manufacturing technologies in high technologyfirms. California Management Review, 32, 56–70.
Geroski, P. A. (1990). Innovation, technological opportunity, and market structure. OxfordEconomic Papers, 42, 586–602.
190 Lucia Piscitello and Larissa Rabbiosi
Ch007.qxd 6/29/2007 10:12 AM Page 190
Ghoshal, S., Korine, H., & Szulanski, G. (1994). Interunit communication in multinationalcorporations. Management Science, 40, 96–110.
Grant, R. M. (1996). Toward a knowledge-based theory of the firm. Strategic ManagementJournal, 17, 109–122.
Greene, W. H. (2000). Econometric analysis. Upple Saddle River, NJ: Prentice-Hall, Inc.Gupta, A. K., & Govindarajan, V. (1991). Knowledge flows and the structure of control
within multinational corporations. Academy of Management Review, 16, 768–792.Gupta, A. K., & Govindarajan, V. (2000). Knowledge flows within multinational corpora-
tions. Strategic Management Journal, 21, 473–496.Haas, M. R., & Hansen, M. I. (2005). When using knowledge can hurt performance: The
value of organisational capabilities in a management consulting company. StrategicManagement Journal, 26, 1–24.
Håkanson, L., & Nobel, R. (2000). Technology characteristics and reverse technologytransfer. Management International Review, 40, 29–48.
Håkanson, L., & Nobel, R. (2001). Organization characteristics and reverse technologytransfer. Management International Review, 41, 392–420.
Harman, H. H. (1967). Modern factor analysis. Chicago, IL: University of Chicago Press.Hedlund, G. (1986). The hypermodern MNC – A heterarchy? Human Resource
Management, 25, 9–25.Howells, J. R. (1995). Going global: The use of ICT networks in research and develop-
ment. Research Policy, 24, 169–184.Hymer, S. H. (1960). The international operations of national firms: A study of direct
investment. Unpublished doctoral dissertation, MIT, Cambridge (MIT Press under sametitle in 1976).
Iwasa, T., & Odagiri, H. (2004). Overseas R&D, knowledge sourcing, and patenting: An empirical studies of Japanese R&D investment in the US. Research Policy, 33,807–828.
Jaffe, A. B., Trajtenberg, M., & Henderson, R. (1993). Geographic localisation of knowledgespillovers as evidenced by patent citations. Quarterly Journal of Economics August, 577–598.
Kennedy, P. (1998). A guide of econometrics. Cambridge, MA: MIT Press.Kogut, B., & Zander, U. (1992). Knowledge of the firm, combinative capabilities, and the
replication of technology. Organization Science, 3, 383–397.Kogut, B., & Zander, U. (1993). Knowledge of the firm and the evolutionary-theory of the
multinational-corporation. Journal of International Business Studies, 24, 625–645.Kuemmerle, W. T. J. (1997). Building effective R&D capabilities abroad. Harvard
Business Review, 75, 61–70.Kuemmerle, W. T. J. (1999). The drivers of foreign direct investment into research and devel-
opment: An empirical investigation. Journal of International Business Studies, 30, 1–24.Lane, P. J., Salk, J. E., & Lyles, M. A. (2001). Absorptive capacity, learning, and perform-
ance in international joint ventures. Strategic Management Journal, 22, 1139–1161.Mansfield, E. (1984). R&D and innovation: Some empirical findings. In: Z. Griliches
(Ed.), R&D, patents and productivity. Chicago: The University of Chicago Press.Mariotti, S., & Mutinelli, M. (2005). Italia multinazionale 2004. La partecipazioni italiane
all’estero e estere in Italia. Soveria Mannelli: Rubbettino Editore.
The Impact of Knowledge Transfer on MNEs’ Parent Companies 191
Ch007.qxd 6/29/2007 10:12 AM Page 191

Minbaeva, D. B. (2005). HRM practices and MNC knowledge transfer. Personnel Review,34, 125–144.
Nahapiet, J., & Ghoshal, S. (1998). Social capital, intellectual capital, and the organizationaladvantage. Academy of Management Review, 23, 242–266.
Nelson, R., & Winter, S. (1982). An evolutionary theory of economic change. Cambridge,MA: Harvard University Press.
Nobel, R., & Birkinshaw, J. (1998). Innovation in multinational corporations: Control andcommunication patterns in international R&D operations. Strategic Management Journal,19, 479–496.
Nohria, N., & Ghoshal, S. (1994). Differentiated fit and shared values: Alternatives for man-aging headquarters-subsidiary relations. Strategic Management Journal, 15, 491–502.
Nonaka, I., Reinmöller, P., & Toyama, R. (2001). Integrated information technology systemsfor knowledge creation. In: M. Dierkes, A. Berthoin-Antal, J. Child, & I. Nonaka (Eds),Handbook of organizational learning and knowledge. Oxford: Oxford University Press.
O’Donnell, S. W. (2000). Managing foreign subsidiaries: Agents of headquarters, or aninterdependent network? Strategic Management Journal, 21, 525–548.
Pavitt, K. L. R. (1984). Sectoral patterns of technical change: Towards a taxonomy and atheory. Research Policy, 13, 343–373.
Pearce, R. D. (1999). The evolution of technology in multinational enterprises: The role ofcreative subsidiaries. International Business Review, 8, 125–148.
Pedersen, T., Petersen, B., & Sharma, D. D. (2003). Knowledge transfer performance ofmultinational companies. Management International Review, 43, 69–90.
Perlmutter, H. (1969). The tortuous evolution of the multinational corporation. ColumbiaJournal of World Business, 4, 9–18.
Persaud, A. (2005). Enhancing synergistic innovative capability in multinational corporations:An empirical investigation. The Journal of Product Innovation Management, 22, 412–429.
Persson, M. (2006). The impact of operational structure, lateral integrative mechanisms andcontrol mechanisms on intra-MNE knowledge transfer. International Business Review,15, 547–569.
Podsakoff, P. M., & Organ, D. W. (1986). Self-reports in organizational research: Problemsand prospects. Journal of Management, 12, 531–544.
Sambharya, R. B., Kumaraswamy, A., & Banerjee, S. (2005). Information technologies andthe future of the multinational enterprise. Journal of International Management, 11,143–161.
Simonin, B. L. (1999). Transfer of marketing know-how in international strategic alliances:An empirical investigation of the role and antecedents of knowledge ambiguity. Journalof International Business Studies, 30, 463–490.
Sölvell, Ö., & Birkinshaw, J. (2000). Leading edge multinationals and leading edge clus-ters. International Studies of Management and Organization, 30, 3–10.
Sölvell, Ö., & Zander, I. (1998). International diffusion of knowledge: Isolating mecha-nisms and the role of MNE. In: A. D. Chandler, P. Hagström, & Ö. Sölvell (Eds), Thedynamic firm. The role of technology, strategy, organization, and regions. Oxford:Oxford University Press.
192 Lucia Piscitello and Larissa Rabbiosi
Ch007.qxd 6/29/2007 10:12 AM Page 192
Subramaniam, M., Venkatraman, V. N. (2001). Determinants of transnational new productdevelopment capability: Testing the influence of transferring and deploying tacit knowl-edge. Strategic Management Journal, 22, 359–378.
Szulanski, G. (1996). Exploring internal stickiness: Impediments to the transfer of bestpractice within the firm. Strategic Management Journal, 17, 27–43.
Tsai, W. (2001). Knowledge transfer in interorganizational networks: Effects of networkposition and absorptive capacity on business unit innovation and performance. Academyof Management Journal, 44, 996–1004.
Vernon, R. (1966). International investment and international trade in the product cycle.Quarterly Journal of Economics, 80, 190–207.
Yamin, M., & Otto, J. (2004). Patterns of knowledge flows and MNE innovative perform-ance. Journal of International Management, 10, 239–258.
Zander, I., & Kogut, B. (1995). Knowledge and the speed of the transfer and imitation oforganizational capabilities: An empirical test. Organization Science, 6, 76–92.
Zhou, C. (2002). Transnational flows of knowledge in multinational corporations: R&Dco-practice as an integrating force. Unpublished doctoral dissertation, The Universityof Western Ontario, Faculty of Graduate Studies, London, Ontario.
The Impact of Knowledge Transfer on MNEs’ Parent Companies 193
Ch007.qxd 6/29/2007 10:12 AM Page 193

This page intentionally left blank

Chapter 8
Home Country Effects of InvestingAbroad: Evidence from Italy
Anna Maria Falzoni and Mara Grasseni
AbstractFollowing the recent literature on firm heterogeneity, we investigate whether theimpact of investing abroad on the performance of parent firms might differ accord-ing to their level of productivity or their size. Using quantile regressions and a dataset for Italian multinationals, this chapter shows that the impact of internationalexpansion on parents’ performance (measured in terms of labour productivity andof employment) varies across firms in different quantiles of the performance distri-bution and across foreign affiliates’ geographical locations.
1. Introduction
In the past years, home country effects of domestic firms investing abroad havebeen a highly debated issue. A number of empirical studies have tried to investi-gate whether it is justified the concern that outward FDI causes production andemployment that would have taken place in the home country to instead takeplace abroad, reducing home economic activities. Overall, the results seem not tosupport the fear that MNEs are exporting domestic production and/or jobs; how-ever, the issue should be examined more deeply. Following the recent literatureon firms’ heterogeneity, an important point to be investigated is whether theimpact of outward FDI on the performance of parent firms might differ accord-ing to their level of productivity or their size.
Do Multinationals Feed Local Development and Growth?© 2007 by Elsevier Ltd.All rights of reproduction in any form reservedISBN: 978-0-08-045360-6
Ch008.qxd 6/29/2007 10:13 AM Page 195

196 Anna Maria Falzoni and Mara Grasseni
1See Barba Navaretti, Venables et al. (2004), Chapter 9, for a survey on home country effects of FDI.2On the labour intensity of home activities see, among others, Blomstrom, Fors, and Lipsey (1997)and Lipsey (1999). On the skill intensity, see Slaughter (2000), Hansson (2005) and Head and Ries(2002). 3Differently from inward FDI, the empirical literature on the relationship between productivity and out-ward FDI is not so large. On one hand, the studies focus on whether outward FDI may channel tech-nological spillovers to parent firms (Van Pottelsberghe de la Potterie & Lichtenberg, 2001; Braconier,Ekholm, & Midelfart-Knarvik, 2001); on the other hand, the attention is on whether investing abroadenhances the productivity of investing firms compared to domestic ones (Barba Navaretti & Castellani,2004; Barba Navaretti, Castellani, & Disdier, 2006).
The empirical research on the effects of outward FDI on home activities hasprimarily addressed the issue of whether employment or production abroad com-plement or substitute for employment in parent companies.1 Using industry orfirm level data, these studies do not find evidence of the fear that MNEs are sub-stituting foreign jobs for domestic jobs, particularly to low-wage countries; theactivities in these areas broadly seem to be complements to the activities carriedout at home (Braconier & Ekholm, 2000; Brainard & Riker, 1997a, b; Bruno &Falzoni, 2003; Konings & Murphy, 2006; among others). However, internationaldelocation of production is not simply a matter of substitution of foreign activi-ties for home activities, but it may induce a reorganisation of the different opera-tions within the MNE. The labour and the skill intensity of domestic activitiesmay change depending on the relative factor intensity of the activities transferredabroad and on the factor endowments of the home and foreign countries.2 Also,domestic productivity may rise or decline, depending on whether foreign opera-tions strengthen or deplete domestic ones.3
A different strand of theoretical and empirical research has recently arguedthat firm heterogeneity leads to self-selection in the strategies to serve domesticand foreign markets. Within the same industry, only the most productive firmsfind it profitable to expand abroad through FDI, while the less productive firmschoose to reach the foreign markets through exports or decide to serve onlydomestic markets (Helpman, Melitz, & Yeaple, 2004; Head & Ries, 2003; Girma,Kneller, & Pisu, 2005). Firm heterogeneity may be an interesting issue to beinvestigated also from a different perspective: within the same internationaliza-tion strategy, i.e. outward FDI, the impact of the international expansion on theperformance of the parent firm might be different depending on the level of pro-ductivity or the size of the firm. We might expect that the opportunities to exploitfirm and plant level economies of scale or to adjust factors of production at homewill vary according to the characteristics of the parent in terms of performance.
The main aim of this chapter is to investigate whether the extent of foreignactivities help to explain parents’ performance at home and whether the different
Ch008.qxd 6/29/2007 10:13 AM Page 196

Home Country Effects of Investing Abroad 197
characteristics of the parents, in terms of number of employees and labour pro-ductivity, matter when we consider the impact of these foreign operations. Usinga panel of Italian firms investing abroad, we allow for different effects of outwardFDI on firms located at different quantiles of the performance distribution byusing conditional quantile regressions. Moreover, we take into account an addi-tional source of diversification of the effects of the international expansion: thegeographical area where affiliates are located.
Knowledge of whether and how the extent of the international production dif-ferently affects the performance of parent firms belonging to different quantilesis particularly interesting in the case of Italy. In fact, in comparison with otherleading industrial countries, Italian FDI is characterised by the presence of a highshare of “small and medium MNEs”, it shows a bias towards traditional sectors,and towards less developed countries (LDCs) (in particular Eastern EuropeanCountries) (Mariotti & Mutinelli, 2003).
Our results indicate that the impact of the multinational activity, measured asthe share of employment in foreign affiliates on MNE’s total employment, variesacross firms in different quantiles of the performance distribution and across for-eign affiliates’ geographical locations. In particular, quantile regressions seem toshow that firms throughout the productivity distribution do not benefit from theFDI in LDCs. Differently, parent firms in the upper quantiles of productivityseem to be positively affected by foreign expansion in developed countries(DCs). As for employment, only small firms seem to be negatively influenced byoutward FDI. Finally, measures of multinational experience influence positivelyand significantly parent firms across quantiles of productivity and employment.
The chapter is structured as follows. In the next section we present the empir-ical framework; Section 3 illustrates the data set and some descriptive statistics.Section 4 presents the estimation method. Section 5 discusses the empiricalresults and the final section concludes.
2. Empirical Framework
In order to investigate the impact of the multinational activity on the performanceof the parent firms, we will regress firm-level labour productivity and employ-ment on covariates, including the share of employment in foreign affiliates onMNE’s total employment used as a proxy of multinational operations. Our empir-ical model will then be tested adopting a quantile regression approach thatenables the estimation of the model coefficients at different quantiles rather thanat the conditional mean, allowing the impact of the foreign activity to vary acrossfirms according to their labour productivity or their size. In addition, the quantile
Ch008.qxd 6/29/2007 10:13 AM Page 197

regression method allows us to take into account any potential bias due to unob-served heterogeneity among firms.
2.1. Labour Productivity
To test whether investing abroad influences parent firms’ labour productivity, weassume that the production function of Italian multinationals can be approximatedby a Cobb–Douglas specification:
(1)
where Yit is the output of parent i at time t, Kit and Lit are capital and labourrespectively. Taking logarithms and subtracting lnLit from both sides, we obtainthe following expression for labour productivity:
(2)
where �2 � � � 1 allows for non-constant returns to scale in the production function.4
To incorporate the effect of investing abroad in such a framework, we add toequation (2) a variable measuring the extent of multinational activity. As a proxy,we construct the variable, FDIijt, computed as the share of employees in foreignaffiliates, FA, located in area j at time t, over total employment of the MNE i,LFAijt � LFAijt � Lit. In this way, we are able to take into account the impact of out-ward FDI on parent productivity according to the different locations of the invest-ment. In particular, we distinguish foreign affiliates located in: Europe, NorthAmerica, Eastern Europe, Asia (Asia, New Zealand and Australia) and otherscountries (Africa, Middle East and South America).
One of the potential problems that may arise in our estimations regards theendogeneity of the FDI variable. For instance, it may be the case that the mostproductive firms are also more likely to expand the activities of their foreign affil-iates. In order to take into account this issue, an instrumental variable estimationshould be implemented. However, in our database we do not have good instru-ments, because the variables that could be used as instruments are correlated withproductivity too. Therefore, the issue of endogeneity is addressed by includingthe FDI term at time t � 1.
In the empirical estimation we should deal with another issue: the presence ofheterogeneity across parent firms. There are several sources of heterogeneity, andthe literature suggests allowing some factors that determine them to be explicitly
ln ln ln( / ) 0 1 2Y L K Lit it it it� � �� � �
Y K Lit it it� � �
198 Anna Maria Falzoni and Mara Grasseni
4In our econometric analysis, we reject the null hypothesis of constant returns to scale.
Ch008.qxd 6/29/2007 10:13 AM Page 198

included in the regression as exogenous shocks. Thus, we include in the empiricalmodel two other variables: the number of foreign affiliates of parent i at time t,NFAit, and since how many years the firm is an MNE, Ageit. Both these measuresattempt to capture the relationship between the experience of the firm in invest-ing abroad and its labour productivity. Moreover, to better isolate the impact ofthe multinational activity on the firm performance, we introduce a variable thatpicks up the R&D effort. The proxy adopted is the ratio of R&D expenditures andpatents over total assets of the parent, R&Dit; we expect a positive relationshipbetween technological effort and firm’s productivity. Finally, time dummies,Timet, and sector dummies, Sectorsz, are included to capture macroeconomicshocks and sector-specific time-invariant effects.
The estimated equation is the following:
(3)
where eit is the error term. The production inputs are included at time t � 1 in orderto reduce the problems related to endogeneity in the choice of factors of production.
Estimation of equation (3) allows us to investigate the role of foreign activitieson the level of labour productivity. In particular, we are interested in evaluating thecoefficient �3, as we expect that the extent of delocalisation of production abroadmight affect firm’s productivity at home.
2.2. Parent Employment
The existing theoretical and empirical literature does not provide clear evidenceconcerning the effect on home employment of outward FDI. We try to add someevidence on this issue. Our contribution is specifically given by the adoption of adifferent econometric method, the quantile regressions technique, allowing fordifferent effects of the multinational activities on firms of different size.
As for the empirical model, we will follow a specification similar to the pre-vious one on productivity. The estimated equation is the following:
(4)
where all the variables are defined as in equation (3) and Wit�1 is the averagewage of parent i.
ln ln ln lnL W Y K FDI Ageit it it it ijtj
� � � � � �� � � �� � � � � �0 1 1 2 1 3 1 4 1 5 ∑ iit FAit
t z it
N
Time Sectors e
�
� � �
��
� �
6 1
7 8
ln( ) ln ln &Y L K L FDI R Dit it it it ijt it/ � � � � � �� � � �� � � � �0 1 1 2 1 3 1 4 1j
∑ ��
� � �
5
6 1 7 8
Age
N Time Sectors e
it
FAit t z it
� � � �−
Home Country Effects of Investing Abroad 199
Ch008.qxd 6/29/2007 10:13 AM Page 199

If the value of the coefficient related to foreign activities in a given location isnegative, we interpret it as the presence of a substitution effect between parentand foreign affiliates employment. If the coefficient is positive, it means that anincrease in the share of employment in foreign affiliates is associated with anincrease in parent employment.
3. Data Description
The data used in this chapter come from the “Centro Studi Luca D’Agliano-Reprint” database (DAR henceforth), which provides information on Italianmultinational firms and their foreign affiliates. The database is the result of themerging of the Reprint database of Politecnico of Milan, which contains infor-mation on Italian MNEs (and foreign owned firms operating in Italy) and theAIDA database of Bureau Van Dijck, which contains balance sheets and othereconomic data of Italian companies.
To perform our analysis, we use data for all the manufacturing firms that ownat least one foreign affiliate for at least one year during the 1994–1998 period. Wehave identified and linked each parent to each of its foreign affiliates. Doing so,we are able to aggregate the data of foreign affiliates distinguishing among thevarious geographical areas in which they are localised. For each foreign affiliatewe have information on employment, sales, localisation, industry of activity,starting date of the foreign participation and type of control. Unfortunately thesedata are collected only once every two years. Therefore, in our analysis, we usethe data on Italian parent firms for the years from 1994 to 1998, and we relate thisinformation with those of foreign affiliates in 1995 and 1997.
The structure of the final sample is an unbalanced panel with a number of par-ent firms varying between 582 and 588.5 The variables used are: value added,total tangible assets (used as a proxy of capital), wages6 and number of employ-ees. All these variables are deflated with the appropriate three-digit productionprice index provided by ISTAT (the Italian Institute of Statistics). Moreover,from the DAR database, we collect information to construct two other variables:the number of years in which each firm is an MNE and the number of foreignaffiliates each parent owns. Both variables are used to control for heterogeneityamong MNEs in terms of multinational experience.
200 Anna Maria Falzoni and Mara Grasseni
5In our estimations the total number of observations is further reduced because there are missing values in the employment of foreign affiliates. 6The wage variable includes wage and salary payments to employees as well as the contributions toGovernment funds.
Ch008.qxd 6/29/2007 10:13 AM Page 200

Tables 8.1 and 8.2 present descriptive statistics of the variables used in theregression analysis.
Table 8.1 refers to our dependent variables, labour productivity and number ofemployees, showing that the log of labour productivity has a skewness value of approximately zero as a normal distribution, while the log of the number ofemployees exhibits a right-skewed distribution. Regarding the kurtosis, all thetwo variables seem to be leptokurtic, especially the productivity measure, whosedistributions are “peaked” and have fat tails.
Looking at Table 8.2, we find that in 1998 about 38% of parent firms belongto the high returns to scale sectors, followed by the traditional ones. Only 5.8%of the parents belong to the high-tech sectors, confirming the weak role of Italianfirms in these industries. Focusing on foreign affiliates, Table 8.2 shows that in1997 employment in foreign affiliates accounts for almost 39% of MNE’s totalemployment and this percentage is higher than that in 1995. Looking at the geo-graphical distribution of foreign affiliates’ employment, we find a higher andgrowing share in LDCs with respect to DCs. Among DCs, the largest share ofemployment is concentrated in European countries, followed by the EasternEuropean countries, which account for the widest increase in outward FDI for theperiod 1995–1997. This finding is not surprising and reflects the growing impor-tance of the Transition Economies as destination of Italian FDI.
Home Country Effects of Investing Abroad 201
Table 8.1: Descriptive Statistics — Years: 1996–1998.
Labour productivity Number of employees(in log) (in log)
Mean 4.636 5.041Standard deviation 0.679 1.65410% 4.095 2.99625% 4.338 4.00750% 4.603 5.01175% 4.898 5.92490% 5.232 7.108Observations 1170 1170Skewness �0.086 0.322Kurtosis 24.678 3.779Test 1 p-value 0.000 0.000Test 2 p-value 0.000 0.000
Test 1: Skewness and kurtosis test for normality.Test 2: Shapiro and Francia test for normality.
Ch008.qxd 6/29/2007 10:13 AM Page 201

Instead of just examining the average share of employment in foreign affili-ates by geographical destination, one may be interested in evaluating whether thechoice of the areas in which foreign activities are localised is different by parent’ssize, productivity or sector of activity. Additional information on this point isgiven in Figures 8.1 and 8.2.7
Figure 8.1 shows the relationship between the share of employees in foreignaffiliates, parent size and the localisation of FDI. Small and medium parent firmshave a higher average share of employees in foreign affiliates localised in LDCs,
202 Anna Maria Falzoni and Mara Grasseni
Table 8.2: Descriptive Statistics.
Mean Mean(standard (standarddeviation) deviation)
1996 1998
Number of parent firms 582 588Number of parent firms in traditional sectors 187 187Number of parent firms in specialised sectors 134 144Number of parent firms in high returns to scale 229 223
sectorsNumber of parent firms in high-tech sectors 32 34Age 4.90 (4.36) 6.94 (4.41)
1995 1997
FDIt 0.333 (0.297) 0.392 (0.29)FDI_DCt 0.155 (0.231) 0.165 (0.236)FDI_LDCt 0.179 (0.275) 0.227 (0.293)FDI_Europet 0.130 (0.22) 0.137 (0.222)FDI_North Americat 0.025 (0.093) 0.028 (0.097)FDI_Eastern Europet 0.089 (0.213) 0.12 (0.245)FDI_Asiat 0.034 (0.134) 0.049 (0.155)FDI_Otherst 0.055 (0.158) 0.058 (0.161)Number of foreign affiliatest 2.02 (4.365) 2.247 (4.009)R&Dt 0.005 (0.034) 0.028 (0.071)
7In Figures 8.1 and 8.2, parent firms are divided into intervals according to the quantiles of their num-ber of employees and labour productivity distributions.
Ch008.qxd 6/29/2007 10:13 AM Page 202

Home Country Effects of Investing Abroad 203
Figure 8.1: Average share of employees in foreign affiliates by parent size anddestination.
FDI_DC: employment in foreign affiliates, localised in DCs, over total employment of MNEs.FDI_LDC: employment in foreign affiliates, localised in LDCs, over total employment of MNEs.Number of employees of parent firm at home*:1: � 39 (Number of parents: 120)2: 40–101 (Number of parents: 110)3: 102–198 (Number of parents: 116)4: 199–426 (Number of parents: 117)5: � 427 (Number of parents: 123)*The intervals are built according to the quintiles of the number of employees distribution.
0
0.1
0.2
0.3
0.4
1 3 4 5 1 3 4 5
1995 1997
mean of FDI_DC mean of FDI_LDC
2 2
than in DCs. On the contrary, the largest parent firms exhibit a higher averageshare of employees in foreign affiliates localised in DCs. Figure 8.2 shows theshare of foreign employment by productivity of parent firms and the localisationof the FDI. The figure reveals that the least productive parent firms have a higheraverage share of employees in foreign affiliates localised in LDCs, whereas forthe most productive firms the average share is higher in DCs. This evidence, con-firmed in both years, seem to suggest the necessity to use an estimation methodthat takes into account the existence of a different impact of foreign activities onthe performance of parent firms according to their different characteristics. At thesame time, this evidence confirms the existence of heterogeneity among firmsthat have chosen the same internationalisation strategy.
Finally, Figure 8.3(a, b) gives a picture of the average share of employees inforeign affiliates by NACE2 sectors and destination.
Ch008.qxd 6/29/2007 10:13 AM Page 203

204 Anna Maria Falzoni and Mara Grasseni
Figure 8.2: Average share of employees in foreign affiliates by labour produc-tivity of parent firms and destination.
FDI_DC: employment in foreign affiliates, localised in DCs, over total employment of MNEs.FDI_LDC: employment in foreign affiliates, localised in LDCs, over total employment of MNEs.The numbers 1, 2, 3, 4, 5 refer to the quintiles of the labour productivity distribution.
0.1
0.2
0.3
10
3 4 5 1 3 4 5
1995 1997
mean of FDI_DC mean of FDI_LDC
2 2
As one might expect, the traditional sectors have the highest average sharecompared with other industries. In addition, comparing the years 1995 and 1997,it is worth noting that the average share of employees in foreign affiliateslocalised in LDCs increases in all sectors, confirming the growing role of thesecountries as destination of Italian FDI.
4. Estimation Method
Most previous studies based on micro-level data employ standard ordinary leastsquare (OLS) or generalized method of moments (GMM) techniques that con-centrate on the conditional mean function of the dependent variable. However,these methods may not be adequate if the unobserved heterogeneity across firmsviolates the assumption of normality for the performance measures. This isexactly what occurs with our data. As reported in Table 8.1, the assumption ofnormality is formally rejected for all our variables by the Shapiro–Francia testand the tests based on skewness and kurtosis. Hence, we may have some doubtsthat OLS estimators would be appropriate to examine the impact of outward FDI
Ch008.qxd 6/29/2007 10:13 AM Page 204

Home Country Effects of Investing Abroad 205
Figure 8.3: (a) Average share of employees in foreign affiliates by parent sectorand destination — year 1995. (b) Average share of employees in for-eign affiliates by parent sector and destination — year 1997.
FDI_DC: employment in foreign affiliates, localised in DCs, over total employment of MNEs.FDI_LDC: employment in foreign affiliates, localised in LDCs, over total employment of MNEs.Sectors:15. Food & Drink 22. Printing & Publishing 30. Office machinery & Computers16. Tobacco 23. Coke & Petroleum 31. Electrical machines17. Textile 24. Basic & Other Chemicals 32. Radio, TV & Communication18. Apparel products 25. Rubber & Plastic Products Equipment19. Luggage, Leatherwear 26. Non metallic mineral products 33. Precision instruments
& Footwear 27. Metal production 34. Motor vehicles20. Wood & Cork 28. Metal products 35. Other transport21. Paper & Pulp 29. Non electrical machinery 36. Other manufacturing
37. Recycling
15 17 18 19 20 21 22 23 24 25 26 27 28 29 30 31 32 33 34 35 36 37
15 17 18 19 20 21 22 23 24 25 26 27 28 29 30 31 32 33 34 35 36 37
mean of FDI_DC mean of FDI_LDC
0
0.1
0.2
0.3
0.4
0.5
mean of FDI_DC mean of FDI_LDC
0
0.1
0.2
0.3
0.4
0.5
(a)
(b)
Ch008.qxd 6/29/2007 10:13 AM Page 205

on productivity and on employment. In addition, as mentioned in the introduc-tion, we are specifically interested to study whether the different characteristicsof the parents, in terms of performance, matter when we consider the impact ofmultinational operations. To address these issues we apply a quantile regressionapproach (QR). In presence of heterogeneity, this approach seems more interest-ing as well as more appropriate, because we are able to give a more precise pic-ture of the dynamics of the dependent variable at different points of the distributionrather than at the conditional mean.8 In our analysis we use both OLS and QRmethods to provide a comparison.
Let yt{t � 1 . . . T} be a random sample of a random variable Y having distribu-tion F. Then, for denote the �th quantile of the distribution of y, given a vector x of covariates. We model the conditional quantile by
, where is a vector of quantile reg-ression coefficients.
Koenker and Basset (1978), introducing this technique, show that can beestimated by
In this way, the estimation of quantiles is conducted giving different weights topositive and negative residuals. The median case, , is equivalent to min-imising the sum of absolute value of the residual.9
One of the advantages of the QR approach is that it enables us not to concen-trate only on a single central tendency measure, but to estimate different slopecoefficients at different quantiles of the conditional distribution of the dependentvariable. Therefore, these coefficients may be interpreted as differences in theresponse of the dependent variable to changes in the regressors at several pointsof the conditional distribution of y. Also, the QR approach is more robust thanOLS to modest deviations of the residuals from normality, such as outliers or longtail situations. In addition, the QR approach is equivalent to monotonic linear andnon-linear transformations of the dependent variable and finally, even if the resi-duals are independent and identically distributed (i.i.d.) and the estimates of theconditional mean give the same information, the QR estimates of the interceptsgive a picture of the asymmetry of the conditional distribution.10
��1 2
Min y x y xtt y x
tt y xt t t
� �� � � �
� � � � � �( ) ( ) (
( ) ( ) ( )∑ � � � � � �� � � �
t: :
1 t
t ))∑
� �( )
� �( )Q y x y F y x x� � � �( | ) inf{ | ( | ) }≡ � � � ( )
� ∈( , )0 1Q� ( |y x)
206 Anna Maria Falzoni and Mara Grasseni
8Recently, a few papers have applied this technique to analyse the productivity spillovers effects ofinward FDI. See, in particular, Dimelis and Louri (2002), Girma and Gorg (2002) and Ito (2004).
9The estimation of the linear conditional mean function is solved by .
10For more details on the advantages of QR estimation see, among others, Mata and Machado (1996).
Min yt
xt t�
� �β( )∑2
E y x x| | | � ��
Ch008.qxd 6/29/2007 10:13 AM Page 206

Using this method in our regression analysis, we estimated the effect of theforeign operations localised in different countries on labour productivity and em-ployment of parent firms at the bottom of the distribution (e.g., at the 10th per-centile), at the median and at the top of the distribution (e.g., at the 90th percentile).In this way, we can evaluate whether the impact of investing abroad is differentthroughout the performance distribution, in terms of labour productivity. In thesame way, the QR approach enables us to control whether outward FDI affects the parent’s employment and if this effect is different depending on the size of theparent.
5. Results
5.1. Labour productivity
Tables 8.3 and 8.4 report the estimates of equation (3), in which our dependentvariable is the labour productivity of the parent firm.
In specification (1) of Table 8.3, we introduce the aggregate proxy measuringthe effect of multinational operations on the dependent variable: the share ofemployment in foreign affiliates on MNE’s total employment. In this case, weimplicitly assume that the effect of covariates on labour productivity is the sameacross foreign locations. In specification (2), we distinguish between FDI locatedin the DCs and the FDI located in the LDCs, as we want to investigate whetherthe impact of outward FDI varies according to the different geographical areas inwhich Italian multinationals invest. Table 8.4 shows the results allowing for theFDI located in Europe, North America, Eastern Europe, Asia and Other countries.We use the quantile regression estimator, QR and we report results for 10 per-centiles of the labour productivity.11 In addition, we present the correspondingestimated coefficients from OLS regressions for comparison. Overall, the QRestimator gives a more precise picture of the importance of our independent vari-ables in explaining the performance of the parents.
Looking at specification (1) in Table 8.3, we find that the share of employmentin foreign affiliates is not significant at each percentile, except for the 90th, wherethe coefficient is positive and significant. The OLS estimation confirms the not-significant results found using the QR approach.
A different pattern seems to be suggested by estimates reported in specification(2), in which we are able to analyse the effect of outward FDI located in DCs andLDCs. The results give evidence of a positive relationship between the FDI located
Home Country Effects of Investing Abroad 207
11The models are estimated as simultaneous equations across quantiles, using boostrapped standarderrors.
Ch008.qxd 6/29/2007 10:13 AM Page 207

208A
nna Maria F
alzoni and Mara G
rasseni
Table 8.3: Effect of investing abroad on parents’ labour productivity.
QR OLS
10 20 30 40 50 60 70 80 90 Mean(Median)
Specification (1)lnKt�1 0.100** 0.168*** 0.191*** 0.205*** 0.186*** 0.197*** 0.205*** 0.224*** 0.236*** 0.225***
(0.042) (0.029) (0.028) (0.023) (0.020) (0.020) (0.026) (0.031) (0.050) (0.036)lnLt�1 �0.104** �0.168*** �0.205*** �0.228*** �0.217*** �0.241*** �0.258*** �0.286*** �0.312*** �0.263***
(0.047) (0.035) (0.036) (0.027) (0.025) (0.027) (0.034) (0.036) (0.064) (0.048)FDIt�1 �0.101 �0.043 �0.025 �0.065 �0.039 �0.107 �0.026 0.139 0.312** 0.067
(0.105) (0.077) (0.065) (0.052) (0.065) (0.078) (0.088) (0.111) (0.156) (0.093)R&Dt�1 0.182 0.379 0.413 0.398 0.585* 0.548** 0.416 0.824* 0.527 0.277
(1.054) (0.3660) (0.295) (0.347) (0.304) (0.271) (0.405) (0.430) (0.455) (0.282)Aget 0.005 0.010*** 0.010*** 0.010*** 0.010*** 0.013*** 0.012*** 0.010* 0.003 0.013***
(0.005) (0.004) (0.004) (0.003) (0.003) (0.004) (0.004) (0.006) (0.008) (0.005)NFAt�1 �0.010 �0.006 0.003 0.002 0.006 0.009 0.007 0.009 0.020 �0.002
(0.010) (0.011) (0.008) (0.007) (0.008) (0.009) (0.010) (0.011) (0.019) (0.012)F(�i�0) 2.79*** 7.21*** 10.48*** 23.38*** 16.58*** 13.86*** 9.55*** 7.82*** 5.78*** 6.01***
Ch008.qxd 6/29/2007 10:13 AM Page 208

Hom
e Country E
ffects of Investing Abroad
209
Specification (2)lnKt�1 0.105*** 0.163*** 0.188*** 0.192*** 0.181*** 0.198*** 0.197*** 0.231*** 0.279*** 0.220***
(0.042) (0.028) (0.028) (0.025) (0.021) (0.018) (0.024) (0.029) (0.052) (0.035)lnLt�1 �0.108** �0.167*** �0.200*** �0.213*** �0.208*** �0.238*** �0.243*** �0.291*** �0.363*** �0.256***
(0.047) (0.034) (0.036) (0.030) (0.026) (0.024) (0.033) (0.035) (0.066) (0.046)FDI_DCt�1 0.014 0.065 0.132 0.143 0.215** 0.220* 0.289** 0.477*** 0.520*** 0.336**
(0.123) (0.110) (0.107) (0.090) (0.101) (0.118) (0.142) (0.145) (0.182) (0.138)FDI_LDCt�1 �0.120 �0.123 �0.074 �0.108** �0.115** �0.167*** �0.210*** �0.101 8.72e-07 �0.063
(0.127) (0.086) (0.072) (0.051) (0.059) (0.063) (0.081) (0.115) (0.174) (0.086)R&Dt�1 �0.445 0.318 0.426 0.460 0.642** 0.687*** 0.705** 0.777** 0.346 0.356
(1.059) (0.390) (0.313) (0.351) (0.329) (0.263) (0.315) (0.339) (0.396) (0.262)Aget 0.003 0.007** 0.009** 0.009*** 0.007** 0.010*** 0.006 0.004 0.006 0.009**
(0.006) (0.004) (0.004) (0.003) (0.003) (0.004) (0.005) (0.006) (0.008) (0.005)NFAt�1 �0.010 �0.006 �0.0007 0.001 0.003 0.003 0.004 0.003 0.019 �0.003
(0.010) (0.010) (0.008) (0.006) (0.007) (0.008) (0.010) (0.013) (0.018) (0.011)F(�i�0) 3.15*** 6.45*** 9.64*** 18.35*** 17.76*** 19.85*** 8.49*** 9.62*** 4.99*** 5.88***Observations 1028 1028 1028 1028 1028 1028 1028 1028 1028 1028
Bootstrapped standard error in parentheses. Robust standard error for the OLS method. The dependent variable is ln(value added/employees).Unreported regressors include constant, sector dummies and time dummies. *’s denote statistical significance at *10%, **5%, and ***1% levels.
Ch008.qxd 6/29/2007 10:13 AM Page 209

in DCs and labour productivity for the most productive firms, from 50th upto the90th percentile. For the least productive firms the coefficients are not significant. Inaddition, we test whether these coefficients are statistically different across quantilesusing an F-test of equality. The results are reported in Table 8.1.A in the appendixand confirm that the magnitude of the coefficients is the same at the lower quantiles,but we reject the null hypothesis of equality between the lower and the higher quan-tiles, and between the median and the higher quantiles of the labour productivity dis-tribution. As for the FDI located in LDCs, the results seem to show that an increasein the employment share of foreign affiliates located in this area decreases the labourproductivity of parent firms. The related coefficients are significant and negativeonly in 4 out of 9 quantiles, from 40th upto the 70th percentile. The test of equalitydoes not show differences among coefficients across quantiles.
To sum up, these results give evidence of a different impact of outward FDIaccording to the various levels of productivity that the firm exhibits. In particu-lar, in the case of FDI localised in the DCs, it seems that this kind of investmentbenefits firms with higher productivity. The OLS estimations report a positiveand statistically significant impact of the FDI located in DCs, while the coeffi-cient on FDI_LDCt�1 is not significant, confirming, as mentioned above, that thetraditional OLS regressions are not able to give a precise picture of the relation-ship between FDI and firm productivity.
In Table 8.4, we investigate the impact of outward FDI across the several geo-graphical areas in which foreign affiliates are localised to study whether the roleof foreign investments in explaining our measure of productivity is related to the different characteristics of the host countries. As can be seen, the positiveimpact of FDI located in DCs on the performance of the most productive firmsseems due to foreign investment in Europe rather than in North America. Thecoefficients of FDI_Europet�1 are positive but significant only for firms withmedium-high labour productivity, from the 50th to the 90th percentiles, while the coefficients on FDI_ NorthAmericat�1 are positive and significant only at the40th and the 50th percentile. The negative impact of the FDI localised in the LDCs seems to be driven only by investment in Eastern Europe: the coeffi-cients on the FDI in the LD areas are not significant except for the case ofFDI_EasternEuropet�1, where the coefficient is significant and negative in manyquantiles.
The OLS estimation reports the same results in terms of statistical significancebut only for investments in Europe and North America. However, in terms of themagnitude of the coefficients we find some differences. For instance, if we lookat the coefficient on FDI_Europet�1, the OLS regression reports a significant andpositive coefficient equal to 0.32, but in the QR estimation the same coefficientvaries from 0.04 to 0.55. An interesting point is that, using OLS, outward FDI in
210 Anna Maria Falzoni and Mara Grasseni
Ch008.qxd 6/29/2007 10:13 AM Page 210

Hom
e Country E
ffects of Investing Abroad
211Table 8.4: Effect of investing abroad on parents’ labour productivity.
QR OLS
10 20 30 40 50 60 70 80 90 Mean(Median)
FDI_Europet�1 0.078 0.039 0.066 0.127 0.185* 0.220* 0.376** 0.555*** 0.479*** 0.320**(0.146) (0.111) (0.111) (0.091) (0.099) (0.131) (0.162) (0.150) (0.177) (0.146)
FDI_North �0.044 0.262 0.349 0.337** 0.331** 0.201 0.183 0.216 0.861 0.483*Americat�1 (0.298) (0.347) (0.220) (0.159) (0.138) (0.155) (0.177) (0.346) (0.813) (0.277)
FDI_Eastern �0.265* �0.181* �0.094 �0.123* �0.117* �0.195*** �0.191* �0.116 �0.174 �0.113Europet�1 (0.160) (0.111) (0.103) (0.071) (0.065) (0.072) (0.103) (0.138) (0.194) (0.099)
FDI_Asiat�1 0.180 �0.030 �0.065 �0.131 �0.167* �0.160 �0.062 �0.054 0.018 0.016(0.173) (0.111) (0.110) (0.088) (0.103) (0.134) (0.197) (0.283) (0.443) (0.156)
FDI_Otherst�1 �0.432 �0.001 �0.014 0.066 �0.104 �0.168* �0.204 �0.034 0.056 �0.013(0.342) (0.122) (0.086) (0.073) (0.085) (0.090) (0.142) (0.181) (0.366) (0.133)
R&Dt�1 �0.837 0.182 0.377 0.484 0.620** 0.685** 0.672** 0.663** 0.460 0.346(1.074) (0.417) (0.360) (0.350) (0.310) (0.284) (0.308) (0.337) (0.384) (0.268)
Aget 0.005 0.008** 0.008** 0.007* 0.006* 0.010*** 0.006 0.004 0.003 0.008*(0.006) (0.004) (0.004) (0.003) (0.003) (0.004) (0.005) (0.006) (0.008) (0.004)
NFAt�1 �0.005 �0.007 �0.003 0.002 0.003 0.004 0.002 0.001 0.018 �0.003(0.010) (0.011) (0.008) (0.006) (0.006) (0.008) (0.010) (0.012) (0.017) (0.011)
F(�i�0) 2.88*** 5.04*** 8.63*** 14.63*** 16.40*** 15.62*** 8.71*** 7.08*** 3.93*** 5.01***Observations 1028 1028 1028 1028 1028 1028 1028 1028 1028 1028
Bootstrapped standard error in parentheses. Robust standard error for the OLS method. The dependent variable is ln(value added/employees).Unreported regressors include constant, ln(capital), ln(employment), sector dummies and time dummies. *’s denote statistical significance at *10%,**5%, and ***1% levels.
Ch008.qxd 6/29/2007 10:13 AM Page 211

Eastern Europe are not significantly correlated to labour productivity, while QRestimations report significant and negative coefficients in many percentiles.
Regarding the other explanatory variables, age and number of foreign affiliates,we find significant and positive coefficients but only for Aget, suggesting that themore international experience the firms have, the higher is the probability ofimproving their performance at home. As for the R&D effort, the coefficient ispositive and significant only for the most productive firms, from the median uptothe 80th percentile.
5.2. Employment
Table 8.5 shows the estimates of equation (4) in which the dependent variable isthe level of employment of the parent firm.
Overall, while the results in terms of the sign of the coefficients seem to besimilar across quantiles, there seems to be heterogeneity in the magnitude of thecoefficients. In fact, the coefficients on FDIt�1, in specification (1), are negativeand statistically significant only at the bottom and in the middle of the distribu-tion. Moreover, their magnitude decreases from the lowest to the highest quan-tiles, and the null hypothesis of equality between coefficients can be rejected in many cases, as shown in Table 8.2.A in the appendix. These results suggest adifferent impact of foreign activities on parent employment between small andmedium firms as well as between small and large ones.
Examining specification (2), we find a negative effect of investing abroad onhome employment for the FDI localised in DCs but only at the bottom of the dis-tribution, from the 10th upto the 50th percentile, while for the FDI localised inLDCs the coefficients are statistically significant in 3 out of 9 quantiles, the 10th,20th and the 30th percentile. This seems in line with previous results of theempirical literature on the subject, according to which the substitution effect onparent employment comes from the decision to allocate production to affiliateslocated in DCs (Bloomstrom, Fors, & Lipsey, 1997; Brainard & Riker, 1997a).However, our findings seem to show that there exists a substitution effect onlybetween outward FDI, especially localised in DCs, and small parent firms. We donot find evidence of a negative relationship between foreign activities and parentemployment for the large parents. The different impact on the dependent variableis confirmed by the tests of equality across percentiles reported in Table 8.2.A inthe appendix. Finally, the estimated coefficients appear to be decreasing as wemove up in the conditional distribution.
The results found in these regressions provide a more detail picture of theimpact of foreign operations on parent employment as suggested also by the com-parison with the OLS estimation. OLS tends to enhance the negative impact of
212 Anna Maria Falzoni and Mara Grasseni
Ch008.qxd 6/29/2007 10:13 AM Page 212

Hom
e Country E
ffects of Investing Abroad
213
Table 8.5: Effect of investing abroad on parents’ employment.
QR OLS
10 20 30 40 50 60 70 80 90 Mean(Median)
Specification (1)lnWt�1 �0.990*** �1.033*** �1.064*** �1.006*** �0.977*** �0.962*** �0.852*** �0.734*** �0.388** �0.655***
(0.077) (0.074) (0.068) (0.067) (0.069) (0.081) (0.102) (0.127) (0.166) (0.146)lnKt�1 0.010 0.005 0.001 0.002 �0.010 �0.023 �0.0009 0.033 0.069** 0.036
(0.035) (0.030) (0.021) (0.016) (0.017) (0.019) (0.022) (0.023) (0.029) (0.023)lnYt�1 0.954*** 0.954*** 0.961*** 0.967*** 0.979*** 0.982*** 0.955*** 0.896*** 0.832*** 0.861***
(0.045) (0.040) (0.029) (0.022) (0.023) (0.026) (0.033) (0.034) (0.037) (0.039)FDIt�1 �0.447*** �0.294*** �0.194*** �0.112** �0.080 �0.100** �0.036 �0.003 �0.003 �0.285***
(0.152) (0.097) (0.073) (0.058) (0.055) (0.050) (0.054) (0.078) (0.112) (0.111)Aget 0.011 0.010** 0.010*** 0.006* 0.004 0.005* 0.002 �0.0007 �0.006 0.0008
(0.007) (0.005) (0.003) (0.003) (0.003) (0.003) (0.003) (0.004) (0.006) (0.004)NFAt�1 0.012* 0.009* 0.006 0.006 0.007 0.009 0.008 0.012 0.037 0.038**
(0.007) (0.005) (0.006) (0.005) (0.005) (0.006) (0.010) (0.020) (0.024) (0.016)F(�i�0) 297.05*** 647.17*** 833.29*** 1621.59*** 2039.73*** 1735.63*** 1304.17*** 866.64*** 497.83*** 616.60***
Continued
Ch008.qxd 6/29/2007 10:13 AM Page 213

214A
nna Maria F
alzoni and Mara G
rasseni
Table 8.5: Continued
QR OLS
10 20 30 40 50 60 70 80 90 Mean(Median)
Specification (2)lnWt�1 �0.996*** �1.005*** �1.045*** �1.002*** �0.961*** �0.948*** �0.848*** �0.713*** �0.346** �0.646***
(0.073) (0.073) (0.065) (0.069) (0.072) (0.083) (0.101) (0.131) (0.168) (0.146)lnKt�1 0.018 0.002 0.002 0.002 �0.002 �0.016 �0.006 0.033 0.073*** 0.036
(0.036) (0.031) (0.021) (0.019) (0.017) (0.019) (0.022) (0.024) (0.029) (0.023)lnYt�1 0.946*** 0.953*** 0.963*** 0.967*** 0.969*** 0.975*** 0.956*** 0.899*** 0.818*** 0.861***
(0.046) (0.041) (0.029) (0.025) (0.024) (0.026) (0.034) (0.036) (0.039) (0.039)FDI_DCt�1 �0.540*** �0.450*** �0.348*** �0.194** �0.186** �0.141 �0.076 �0.076 �0.170 �0.390**
(0.159) (0.135) (0.110) (0.097) (0.079) (0.088) (0.093) (0.109) (0.156) (0.161)FDI_LDCt�1 �0.436** �0.240** �0.151** �0.078 �0.056 �0.051 �0.008 0.015 0.008 �0.233**
(0.180) (0.102) (0.073) (0.062) (0.053) (0.055) (0.057) (0.084) (0.118) (0.100)Aget 0.015** 0.013*** 0.012*** 0.008** 0.004* 0.004* 0.004 0.0004 �0.006 0.002
(0.007) (0.005) (0.003) (0.004) (0.003) (0.002) (0.003) (0.004) (0.006) (0.004)NFAt �1 0.010 0.010** 0.007 0.006 0.007 0.010 0.009 0.012 0.041* 0.038**
(0.007) (0.005) (0.005) (0.005) (0.005) (0.007) (0.012) (0.020) (0.023) (0.016)F(�i�0) 290.06*** 536.72*** 777.18*** 1342.69*** 1833.76*** 1543.99*** 1076.37*** 867.47*** 482.76*** 557.38***Observations 1026 1026 1026 1026 1026 1026 1026 1026 1026 1026
Bootstrapped standard error in parentheses. Robust standard error for the OLS method. The dependent variable is ln(number of employees).Unreported regressors include constant, sector dummies and time dummies. *’s denote statistical significance at *10%, **5%, and ***1% levels.
Ch008.qxd 6/29/2007 10:13 AM Page 214

Home Country Effects of Investing Abroad 215
outward FDI on parent employment, especially for the FDI localised in the LDCs.Differently, the QR approach shows that the negative impact is only related to the smaller firms, up to the median, while the larger firms are not affected by theextent of foreign activities.
Focusing on the several geographical areas in which the FDI are localised, theQR estimations reported in Table 8.6 confirm the substitution effect between for-eign affiliates’ employment and parent employment, especially for small andmedium firms.
The negative impact of the FDI located in the DCs seems due to investmentsin Europe and in North America. The substitution effect on parent employment inthe case of the FDI located in the LDCs seems essentially given by the invest-ments in Eastern Europe and in Asia, even if the coefficients on FDI_Asiat�1 aresignificant also for the larger firms.12
To sum up, our QR results imply that, up to the median, there exists a substitu-tion effect between foreign employment and parent employment for outward FDIlocated in the DCs. For the largest firms the substitution effect is given only byinvestment localised in Asia. Differently, the OLS estimations show a negativeimpact of foreign affiliates’ activities on parent employment across all differentlocations.
Finally, we find a significant role of the foreign experience of the firm inincreasing parent employment, confirmed especially for small and medium firms.
6. Conclusions
The empirical analysis presented in this chapter focuses on the relationshipbetween investing abroad and different measures of performance of Italian par-ents. In particular, we have considered the impact of foreign activity on labourproductivity and employment of the parent firm. The econometric method used,the quantile regression, allows us to examine the whole distribution of firmsrather than a single measure of the central tendency of the performance distribu-tion. Consequently, we are able to evaluate the relative importance of explanatoryvariables at different points of the distribution of parents’ performance.
Our results indicate that the extent of the international production, measuredas the share of employment in foreign affiliates on MNE’s total employment, hasa significant impact on the explanatory variables, but this effect varies depending
12Table 8.2.A in the appendix shows the t-statistics for the hypothesis of equality of coefficients acrossquantiles. We reject the null hypothesis of equality of the coefficients for the FDI localised especiallyin Eastern Europe and in a few cases also for the FDI localised in Europe and North America.
Ch008.qxd 6/29/2007 10:13 AM Page 215

216A
nna Maria F
alzoni and Mara G
rasseni
Table 8.6: Effect of investing abroad on parents’ employment.
QR OLS
10 20 30 40 50 60 70 80 90 Mean(Median)
FDI_Europet�1 �0.457*** �0.331** �0.282*** �0.163* �0.161* �0.156 �0.055 �0.058 �0.142 �0.317*(0.175) (0.154) (0.110) (0.100) (0.084) (0.098) (0.109) (0.111) (0.173) (0.167)
FDI_North �0.502 �0.611*** �0.545*** �0.503*** �0.365** �0.365* �0.238 �0.187 �0.154 �0.763***Americat�1 (0.547) (0.205) (0.161) (0.163) (0.181) (0.198) (0.185) (0.201) (0.410) (0.276)
FDI_Eastern �0.472** �0.292** �0.193* �0.055 �0.055 �0.042 0.011 0.029 0.049 �0.230**Europet�1 (0.244) (0.128) (0.105) (0.085) (0.070) (0.071) (0.078) (0.101) (0.152) (0.112)
FDI_Asiat�1 �0.664 �0.349 �0.211 �0.172 �0.191* �0.196* �0.136 �0.210** �0.209 �0.454***(0.463) (0.280) (0.152) (0.107) (0.104) (0.105) (0.094) (0.086) (0.159) (0.166)
FDI_Otherst�1 �0.032 �0.062 0.038 0.023 �0.018 0.028 0.081 0.191 0.095 �0.024(0.158) (0.123) (0.106) (0.095) (0.096) (0.123) (0.136) (0.144) (0.215) (0.123)
Aget 0.008 0.010** 0.013*** 0.009*** 0.004 0.005* 0.004 0.001 �0.004 0.002(0.007) (0.005) (0.004) (0.004) (0.003) (0.003) (0.003) (0.004) (0.006) (0.004)
NFAt�1 0.007 0.008 0.007 0.006 0.006 0.010 0.009 0.014 0.041* 0.037**(0.007) (0.005) (0.006) (0.006) (0.006) (0.008) (0.013) (0.020) (0.025) (0.016)
F(�i�0) 240.92*** 388.85*** 590.22*** 1078.05*** 1241.88*** 1066.55*** 857.41*** 612.65*** 322.07*** 460.32***Observations 1026 1026 1026 1026 1026 1026 1026 1026 1026 1026
Bootstrapped standard error in parentheses. Robust standard error for the OLS method. The dependent variable is ln(number of employees).Unreported regressors include constant, ln(capital), ln(value added), ln(average wage), sector dummies and time dummies. *’s denote statisticalsignificance at *10%, **5%, and ***1% levels.
Ch008.qxd 6/29/2007 10:13 AM Page 216

on two factors: the location of foreign affiliates and the different point of the firmperformance distribution.
Quantile regressions seem to show that firms throughout the productivity dis-tribution do not benefit from the FDI in the LDCs. Differently, parent firms in theupper quantiles of productivity seem to be positively affected by foreign expan-sion in DCs. These results might depend on the different nature of the FDI inthese two areas. According to the theory, vertical FDI — principally driven bydifferences in factor endowments and factor costs — takes place when the multi-national re-deploys only part of its production process. Shifting part of the valuechain to foreign economies may reduce the productivity of the MNE when it isnot able to perfect adjust its factors of production, at least in the short run(Hanson, Mataloni, & Slaughter, 2002; Yeaple, 2003). Horizontal investmentsreplicate in a foreign country the production structure of the home country andare explained by the need to overcome trade barriers and transport costs. Theseinvestments are usually realised in order to gain some advantage in final markets(Markusen & Maskus, 2002); however, our results seem to show that are the mostproductive firms who benefit from this strategy.
As for employment, only small firms seem to be negatively influenced by out-ward FDI. Finally, measures of multinational experience influence positively andsignificantly parent firms across quantiles of productivity and employment.
Home Country Effects of Investing Abroad 217
Ch008.qxd 6/29/2007 10:13 AM Page 217

218A
nna Maria F
alzoni and Mara G
rasseni
Appendix
Table 8.1.A: Tests of equality between coefficients at different quantiles of Table 8.3 and Table 8.4.
Dependent variable: QuantilesLabour Productivity
Variables 10–50 20–50 30–50 10–90 20–70 20–80 20–90 50–70 50–80 50–90FDIt�1 0.55 0.96 0.81 0.018** 0.86 0.12 0.026** 0.86 0.07* 0.018**FDI_DCt�1 0.12 0.14 0.33 0.011*** 0.12 0.006*** 0.016** 0.48 0.038** 0.085*FDI_LDCt�1 0.96 0.92 0.51 0.54 0.35 0.86 0.50 0.15 0.90 0.49FDI_Europet�1 0.48 0.17 0.19 0.066* 0.035** 0.001*** 0.05** 0.11 0.003*** 0.081*FDI_NorthAmericat�1 0.19 0.82 0.92 0.29 0.81 0.91 0.48 0.30 0.72 0.51FDI_EasternEuropet�1 0.34 0.52 0.78 0.70 0.94 0.67 0.97 0.38 0.99 0.75FDI_Asiat�1 0.054** 0.23 0.30 0.72 0.87 0.93 0.91 0.50 0.65 0.66FDI_Otherst�1 0.33 0.41 0.27 0.30 0.24 0.87 0.88 0.40 0.67 0.65
P-value of F tests. *’s denote statistical significance at *10%, **5%, and ***1% levels.
Ch008.qxd 6/29/2007 10:13 AM Page 218

Hom
e Country E
ffects of Investing Abroad
219
Table 8.2.A: Tests of equality between coefficients at different quantiles of Table 8.5 and Table 8.6.
Dependent variable: Quantilesnumber of employees
Variables 10–50 20–50 30–50 10–90 20–70 20–80 20–90 50–70 50–80 50–90FDIt�1 0.003*** 0.012** 0.051** 0.013** 0.007*** 0.008*** 0.030** 0.35 0.27 0.47FDI_DCt�1 0.016** 0.05** 0.043** 0.078* 0.004*** 0.011*** 0.13 0.12 0.24 0.91FDI_LDCt�1 0.026** 0.035** 0.098* 0.029** 0.020** 0.025** 0.079* 0.33 0.35 0.57FDI_Europet�1 0.070* 0.20 0.14 0.18 0.077* 0.093* 0.37 0.19 0.26 0.91FDI_NorthAmericat�1 0.80 0.25 0.25 0.60 0.100* 0.092* 0.29 0.39 0.36 0.59FDI_EasternEuropet�1 0.071* 0.036** 0.094* 0.057* 0.019** 0.026** 0.059* 0.31 0.35 0.47FDI_Asiat�1 0.28 0.52 0.86 0.33 0.41 0.61 0.63 0.52 0.84 0.91FDI_Otherst�1 0.75 0.72 0.84 0.81 0.34 0.12 0.50 0.33 0.093* 0.58
P-value of F tests. *’s denote statistical significance at *10%, **5%, and ***1% levels.
Ch008.qxd 6/29/2007 10:13 AM Page 219

References
Barba Navaretti, G. & Castellani, D. (2004). Investment abroad and performance at home.Evidence from Italian multinationals. CEPR Discussion Paper no. 4284.
Barba Navaretti, G., Castellani, D., & Disdier, A. (2006). How does investing in cheaplabour countries affect performance at home? France and Italy. CEPR DiscussionPaper no. 5765.
Barba Navaretti, G., & Falzoni, A. M. (2004). Home country effects. In: G. Barba Navaretti,A. J. Venables with F. Barry, K. Ekholm, A. M. Falzoni, J. Haaland, K.-H. Midelfart,A. Turrini. Multinational firms in the world economy (pp. 217–240). Princeton NJ:Princeton University Press.
Barry, F., Ekholm, K., Falzoni, A. M., Haaland, J., Midelfart, K.-H., Turrini, A. (2004).Multinational firms in the world economy. Princeton NJ: Princeton University Press.
Blomstrom, M., Fors, G., & Lipsey, R. E. (1997). Foreign direct investment and employ-ment: Home country experience in the United States and Sweden. The Economic Journal,107, 1787–1797.
Braconier, H., & Ekholm, K. (2000). Swedish multinationals and competition from high-and low-wage locations. Review of International Economic, 8, 448–461.
Braconier, H., Ekholm, K., & Midelfart-Knarvik, K. H. (2001). In search of FDI transmit-ted R&D spillovers: A study based on Swedish data. Weltwirtschfliches Archiv, 137,644–665.
Brainard, S. L., & Riker, D. (1997a). Are U.S. multinationals exporting U.S. jobs? NBERWorking Paper no. 5958.
Brainard, S. L., & Riker, D. (1997b). U.S. multinationals and competition from low wagecountries. NBER Working Paper no. 5959.
Bruno, G., & Falzoni, A. M. (2003). Multinational corporations, wages and employment:Do adjustment costs matter? Applied Economics, 35, 1277–1290.
Buchinsky, M. (1998). Recent advances in quantile regression models. Journal of HumanResources, 33, 88–126.
Dimelis, S., & Louri, H. (2002). Foreign ownership and production efficiency: A quantileregression analysis. Oxford Economic Papers, 54, 449–469.
Girma, S., & Gorg, H. (2002). Foreign direct investment, spillovers and absorptive capac-ity: Evidence from quantile regressions. University of Nottingham, GEP Research Paper2002/14.
Girma, S., Kneller, R., & Pisu, M. (2005). Exports versus FDI: An empirical test. Reviewof World Economics, 141(2), 193–218.
Hanson, G., Mataloni, R. J., & Slaughter, M. (2002). Expansion strategies of U.S. multina-tional firms. In: D. Rodrik & S. Collins (Eds). Brooking Trade Forum 2001 (pp. 245–282).Washington DC: Brookings Institution Press.
Hansson P. (2005). Skill upgrading and production transfer within Swedish multinationals.Scandinavian Journal of Economics, 107(4), 673–692.
Head K., & Ries J. (2002). Offshore production and skill upgrading by Japanese manu-facturing firms. Journal of International Economics, 58, 81–105.
220 Anna Maria Falzoni and Mara Grasseni
Ch008.qxd 6/29/2007 10:13 AM Page 220

Head, K., & Ries, J. (2003). Heterogeneity and the FDI versus export decision of Japanesemanufacturers. Journal of the Japanese and International Economics, 17, 448–467.
Helpman, E., Melitz, M. J., & Yeaple, S. R. (2004). Export versus FDI with heterogeneousfirms. American Economic Review, 94, 300–316.
Ito, K. (2004). Foreign ownership and plant productivity in the Thai automobile industryin 1996 and 1998: A conditional quantile analysis. Journal of Asian Economics, 15,321–353.
Koenker, Y., & Basset, G. (1978). Regression quantiles. Econometrica, 50, 43–61.Konings, J., & Murphy, A. (2006). Do multinational enterprises relocate employment to low
wage regions? Evidence from European multinationals. Review of World Economics,142(2), 267–286.
Lipsey, R. E. (1999). Foreign production by U.S. firms and patent firm employment.NBER Working Paper No. 7357.
Mariotti, S., & Mulinelli, M. (2003). Italia Multinazionale 2003. Roma: ICE.Markusen, J. R., & Maskus, K. (2002). Discrimination among alternative theories of the
multinational enterprises. Review of International Economics. 10, 694–707.Mata, J., & Machado, J. A. F. (1996). Firm start-up size: A conditional quantile approach.
European Economic Review, 40, 1305–1323.Slaughter, M. J. (2000). Production transfer within multinational enterprises and American
wages. Journal of International Economics, 50, 449–471.Van Pottelsberghe de la Potterie, B., & Lichtenberg, F. (2001). Does foreign direct invest-
ment transfer technology across borders? The Review of Economics and Statistics,83(3), 490–497.
Wooldridge, J. M. (2002). Econometric analysis of cross section and panel data.Cambridge, MA: The MIT Press.
Yeaple, S. (2003). The role of skill endowments in the structure of US outward foreigninvestments. Review of Economics and Statistics, 85, 734–736.
Home Country Effects of Investing Abroad 221
Ch008.qxd 6/29/2007 10:13 AM Page 221

This page intentionally left blank

Chapter 9
Globalization and Its Impact onDevelopment: Policy Issues
Pervez N. Ghauri
1. Introduction
Over the past couple of decades, governments have been persuaded that adoptionof liberal and pro-multinational enterprises (MNEs) policies are generally bene-ficial for their local economies. In addition, globalization of the world economy,pressures from international institutions such as World Trade Organisation (WTO)and the World Bank and increasing bargaining power of MNEs have had a weak-ening effect on the bargaining power of governments (Yamin & Ghauri, 2004;Ghauri & Buckley, 2002; Dunnning, 2000; Dunning & Narula, 1999). On the otherhand, Buckley and Casson (1998) and Ghauri (1999) suggest that internal andexternal pressures on multinational enterprises in the 1990s are causing new chal-lenges for the MNEs and are producing a new strategic imperative — flexibility.The search for flexibility is a reaction to external volatility (e.g. due to globaliza-tion) and to attempts to reduce monopolistic ‘pinch-points’ (e.g. single supplysources, tie-in to particular locations).
The search for flexibility leads to (vertical) disintegration and foreign directinvestments (FDI) being seen as ‘real options’. This results in a new owner-ship strategy with networks of loose relationships on the one extreme and a new locational strategy based on mergers and acquisitions (M&As) on theother. In most cases however, operations where central activities (e.g. R & Dand marketing) are augmented by decentralized activities (e.g. manufacturingand distribution) is becoming the name of the game. These two strategies can
Do Multinationals Feed Local Development and Growth?© 2007 by Elsevier Ltd.All rights of reproduction in any form reservedISBN: 978-0-08-045360-6
Ch009.qxd 6/29/2007 10:13 AM Page 223

be combined, so that wholly owned central facilities such as finance, marketingand R & D at head offices are combined with dispersed market-based activi-ties such as manufacturing, distribution and warehousing that are performed at dif-ferent but optimal locations. The concept of ‘global factory’ suggested by Buckelyand Ghauri (2004), is already a reality, where some locations specialise in pro-duction of a particular product and can manufacture goods for all or most of the producers in that sector. Even in this case however, activities with high value-added industries/segments are finding their place in the developed world/regions,such as automobiles in Austria, while activities in low value-added industries arebeing located in the developing world/regions, such as shoes and textiles in Indiaand China.
The ability of multinational firms to appropriate rent by adjusting their loca-tion and foreign market servicing strategies, partly in response to globalizationand partly in response to national governmental policies, enhances their flexibil-ity and their bargaining power (Ghauri & Buckley, 2002). Buckley (1996) showsthat the range of policies open to multinational firms make broad-brush policiesuntenable, because in each policy cell (exporting, licensing, FDI), governmentpolicies will have both positive and negative effects. Targeted policies, moreover,are difficult to design, given the dynamics of the firm’s evolving foreign marketservicing strategies and the links between the different elements in the firm’sglobal value chains.
The result of these strategies is to create uncertainty for the host countries.Locational policies create difficulties; in that, multinationals are becoming more‘footloose’ and are liable to move ‘offshore plants’ in response to changing incen-tives, demand and supply conditions. The search for flexibility also means thatmultinationals may engineer internal competition between competing plantswithin the same firm with weaker plants being winnowed out by failures in inter-nal tendering.
The arguments for policy intervention are weakening. Krugman (1987), inreviewing the arguments for interventionist policies based on externalities andstrategic trade considerations, concluded that the optimal policy set is so sensi-tive to technological and behavioural parameters that the results of interventionare uncertain, even in areas where externality and monopoly arguments arestrong. Further, the information available to government policy makers is likelyto be partial, out-of-date and biased (not in the least by representations on thepart of the rent-seekers). These extreme forms of liberalization with their advo-cacy for a minimal state are creating disenchantment with globalization andgiving birth to a movement for global civil rights demanding state as well as cor-porate social responsibility (Yamin & Ghauri, 2004; Stiglitz, 2002).
224 Pervez N. Ghauri
Ch009.qxd 6/29/2007 10:13 AM Page 224

2. MNE — Government Relationship
Privatization (the transfer of productive assets from public to private ownership)has been part of most structural adjustment policies in developed as well as indeveloping countries since the 1980s. It has been undertaken to achieve a varietyof objectives, such as enhanced economic efficiency, reduction of financialdeficits and reducing the role of the state. If we summarize experiences with pri-vatization strategies showing that there is now a sufficient body of evidence toreview its progress made and to assess what works and what does not, we end upwith the cautionary point that privatization alone is unlikely to ease significantly,the burden of the state owned sector in many countries.
We are in a state where MNE–host country relations in middle-income coun-tries have fully emerged onto the world stage, leaving behind a group of largelyinert less developed countries which have so far been bypassed by globalization.Increasing location ‘tournaments’, to attract the FDI may have reduced the bene-fits to the host countries as have the increasing skill of the managers of the MNEsin making their investments more ‘footloose’. Corresponding skills on the part ofhost countries to make the FDI sticky are not developing at the same rate(Oxelheim & Ghauri, 2004).
In both the advanced and less developed countries, the period from the mid-1970s to the millennium has generally been one where the activist functions ofthe state have declined. This has been more true in equity-related policies than inaddressing market failure. Indeed, the role of the state should at the turn of themillennium be related to market-enhancing policies than heretofore. The prevail-ing fashion for ‘competitiveness’ has led to increasing attempts to go further thanthis in fostering ‘dynamic comparative advantage’ by subsidizing and otherwiseencouraging clustering of industry (often in a fashion which is competitive withother states — even within a customs unions (the EU is a prime example) andencouragement of ‘indigenous’ research and development (Ghauri & Buckley,2002; Cantwell, 1989). The MNE–government interaction and its impact on eachother is illustrated in Table 9.1.
These market-enhancing state policies, fuelled by the rhetoric of competitiveness(Oxelheim & Ghauri, 2004; Porter, 1990) have encouraged competitive bidding forinward FDI and have led to escalation in the effective locational subsidy for multi-national firms. To make things worse, there has been no effective international con-trol, governance or even coordination of the process. As a result, internationalinstitutions (IMF, World Bank and WTO) are not capable of exercising global gov-ernance. Instead, they are perceived to be guarding the interest of the developedcountries, “global governance without global government” (Stiglitz, 2002, p. 21).
Globalization and Its Impact on Development 225
Ch009.qxd 6/29/2007 10:13 AM Page 225

Following the collapse of the state-dominated and centrally planned eco-nomies, firms are increasingly gaining monopoly powers; there is a general feel-ing that the functions of state require reformulating and refocussing. The mainproblem in redefining the state’s role is that the basic conditions are constantlychanging. Market failure and the concern for equality provide for economicrationale for government intervention. However, there is no guarantee that anysuch intervention will benefit the society. As we have seen in the Asian crisis,government failure is equally possible as is market failure (Ghauri, 1999). Thus,the challenge is to see that the political process and institutional structures get theincentives right, so that their interventions actually improve social welfare andeconomic development (Ghauri & Buckley, 2002; IBRD, 1997).
226 Pervez N. Ghauri
Table 9.1: MNE/government interaction.
Government policies Impact on MNE strategies● Subsidizing industries ● Increased local competition● Educational improvements ● Potential to recruit managers,● Markets scientists and develop new● Stronger markets and poverty technologies in developing
countriesreduction ● Development of new products
● Developing export processing specifically targeted at zones developing markets
● Regionalization ● Export platform opportunities● Decreased opportunities for
investment tournaments
Strategies of MNEs Impact on government policies● Multiple sourcing ● Increased competition between● Reduced unskilled labour different host countries
component in production and ● Reduce FDI in developingservices markets
● Risk management (shift away ● Need to encourage local from political to financial risk) industries
● “Flexibility” ● Variable impact depending on● Local sourcing financial “soundness”
● Insourcing, create incentives● Danger of increasing “footloose”
investments● Increased spillovers and linkages
Ch009.qxd 6/29/2007 10:13 AM Page 226

The task of the state is first to match the state’s role to its existing capability —to establish the institutional rules and norms that will enable the state to provide col-lective goods and services efficiently — and secondly, to reinvigorate the state’scapability through rules, partnerships and competitive pressures from outside andwithin the state. According to IBRD, the functions of the state can be representedas a continuum from activities that should not be undertaken without state inter-vention, to activities in which the state plays an activist role in coordinating themarket or redistribution of assets, as illustrated in Table 9.2.
Firstly, countries with low state capability need to focus on minimal basicfunctions such as provision of public goods, property rights, macroeconomic sta-bility and basic infrastructure. Secondly, there are intermediate functions such asthe management of environment, regulation of monopolies and provision ofsocial benefits. Again, in these functions, it is not a question of whether the gov-ernment should or should not intervene, but rather how best to intervene. In thiscase, government can work together with market and society. Thirdly, states withstrong capabilities should play a more active role in dealing with problems relatedto market imperfections. Due to excessive and imposed liberalization and priva-tization (e.g. in basic services such as railways, post offices, health care and edu-cation), the state is loosing power and is unable to address externalities such asregulating monopolies, providing social insurance, redistribution of assets andattempting to redress information imperfections.
Rethinking the role of state also means that it has to explore alternative instru-ments and ways to enhance the effectiveness of its policies. The regulatory role ofthe state has become broader and more complex than before. The regulatory actionneeds to fit with the capabilities of state regulatory agencies and the sophisticationof the market. The state’s responsibility for providing basic services — education,
Globalization and Its Impact on Development 227
Table 9.2: Reinvigorating functions of state.
State capabilities Handling market failure Improving equality
Minimal functions Providing basic public Protecting the poorestgoods and services
Intermediate functions Management of environment; Providing socialregulating monopolies; insuranceproviding social benefits
Activist function Coordinating markets and Redistribution ofprivate activities assets
Source: Based on IBRD (1997, p. 27).
Ch009.qxd 6/29/2007 10:13 AM Page 227

health, etc. — has become doubtful. The state’s responsibility has to be based onits capabilities and the relative strength of the market and society. To protect theweaker part of society and to improve equality, it has to differentiate betweeninsurance against the unexpected (unemployment, etc.) and provision of a mini-mum level of living conditions for the poorest.
3. Developed versus Developing Countries
In the discussion on developed versus developing countries, governments ofdeveloping countries are the most vulnerable. The role of the governments andgovernment bodies of developing countries is relatively more crucial than the roleplayed by these bodies in developed countries. The government bodies in devel-oping countries regulate their economies not only to secure the best interest oftheir population, but also to safeguard local firms. Governments aim to plan theireconomies to seek goals which they believe a purely market outcome will notsecure. Globalization and the imposed liberalization based on assumptions thatmarket forces, free from government control, will automatically generate eco-nomic development has proven to be highly questionable. The disparity in thebenefits of globalization is much greater now than 50 or 100 years ago. Almosthalf of the world population, 2.8 billions out of 6 billions, lives below povertylevel, less than $2 per day. The distribution of prosperity and benefits of global-ization and development are extraordinarily unequal (Ghauri & Buckley, 2006;Stiglitz, 2002).
In spite of all the hype about China and India, China with almost 21 per centof the world population, has a share of less than 6 per cent of world exports(goods and services). While India, with more than 17 per cent of the world pop-ulation, has only 1 per cent of the world exports (The Economist, 2005). On theother hand, United States and Germany have been the biggest exporters in theworld for several decades without causing any worries or concerns for the advo-cates of globalization (The Financial Times, 2006). These facts thus take thestance of developing countries versus developed countries, or governments fromdeveloping countries versus MNEs to another level and shed a different light onthe imbalances and discussion on development versus underdevelopment. Itseems to be inherent in the present situation that we see an inharmonious con-junction of the strategies of MNEs and government policies, particularly in thedeveloping world. For MNEs — government relationship in general, however, weneed to consider the fact that markets are not perfect and both firms and govern-ments are attempting to appropriate rents in a world of imperfect markets(Buckley & Ghauri, 2004). This opens up the possibility of collusion between
228 Pervez N. Ghauri
Ch009.qxd 6/29/2007 10:13 AM Page 228

governments and MNEs in dividing rents and mitigating conflicts between them,contrary to the needs of the society or development.
It is a fact that as a result of globalization, however, government-inducedmarket imperfections are declining in most developing markets and now thereare some strong and competitive local firms that can beat off the entry of foreignfirms. In the last decade, due to the changing conditions in the world economydiscussed above, macro-economic determinants rather than the micro-economicdeterminants have become more important. Factors such as; the investments orcapital flow to countries where it can achieve highest returns, the market size or potential for local sales and benefits which can be achieved through localsourcing, have become more important (Ghauri & Buckley, 2002; Brewer, 1993;Pfefferman & Madarassy, 1992; Contractor, 1991). In addition, it has been sug-gested that due to agglomeration effects the investments flow to the marketswhere a certain level of FDI is already in existence. This means that firms invest-ing abroad go to countries with a good quality infrastructure, communication,transport, energy and a certain degree of industrialization, in other words, torelatively developed countries and regions.
The emergence of China and India as major players in the world economy hasalready had an impact equal to that of Japan in earlier decades of the Post WarWorld. An initial, almost blanket acceptance of the FDI has now become moretargeted in terms of priority sectors and regions. China and India are also devel-oping their own brands and are quite active in investing in the developedeconomies; Lenova and Corus are just some examples of western firms that havebeen taken over by firms from these countries.
4. Conclusions
The dynamic process of globalization can be characterized by a sequentialprocess running from macro developments in the world economy to MNE/policyinteractions at regional and national levels which has a major impact on localdevelopment (see Figure 9.1).
The interaction between MNEs and national and regional governments can besimilarly characterized as a sequential process heading from the policies of (devel-oping) countries and regions to the impact on MNEs and through their strategiesto an impact on (developing) markets. From the “black box” of MNE/Governmentinteraction, we observe outcomes which impact on economic development, par-ticularly in developing countries. Recursive elements and interaction between,international institutions, government policies and strategies of MNEs are mainmechanisms to factors that influence development. Our analysis suggests that
Globalization and Its Impact on Development 229
Ch009.qxd 6/29/2007 10:13 AM Page 229

external impact of MNE strategies as they consolidate their control on the globaleconomy through scarce knowledge and resources needs to be investigated. Theimpact of these strategies, combined with the state losing control, on developmentand society in general is rather detrimental. Moreover, in the age of abundance andprosperity in one half of the world is creating poverty, inequality, political insta-bility and moral decay in the other half that need to be addressed.
References
Brewer, T. L. (1993). Trends in international business, thought and literature: The past andfuture of political analysis for international business. The International Executive,35(6), 539–548.
Buckley, P. J. (1996). Government policy responses to strategic rent-seeking transnationalcorporations. Transnational Corporations, 5(2), 1–17.
Buckley, P. J., & Casson, M. (1998) Analysing foreign market entry strategies: Extendingthe internalisation approach. Journal of International Business Studies, 29(3), 539–561.
Buckley, P. J., & Ghauri, P. N. (2004). Globalisation, economic geography and the strategyof multinational enterprises. Journal of International Business Studies, 35(2), 81–98.
Cantwell, J. A. (1989). Technological innovation and multinational corporations. Oxford:Basil Blackwell.
Contractor, F. J. (1991). Government policies and foreign direct investment. New York:UN Centre on Transnational Corporations.
Dunning, J. H. (2000). The eclectic paradigm as an envelope for economic and businesstheories of MNE activity. International Business Review, 9(2), 163–190.
Dunning, J., & Narula, R. (1999). Developing countries versus multinationals in a global-ising world: The dangers of falling behind., Forum for Development Studies, Forum no.2, pp. 261–287.
Ghauri, P. N. (1999). Relationship games: Creating competitive advantage through coop-eration. In: S. Urban (Ed.). Relations of complex organizational systems: A key to globalcompetitivity: Problems – strategies – visions (pp. 59–84). Wiesbaden: Gabler.
230 Pervez N. Ghauri
Figure 9.1: Globalization as a sequential process.
Macro changesin the worldeconomy
MNE/Governmentalinteraction
Impact onLocaldevelopment
Feedback
Ch009.qxd 6/29/2007 10:13 AM Page 230

Ghauri, P. N., & Buckley, P. J. (2002). Globalization and the end of competition: A criti-cal review of rent-seeking multinationals. In: V. Havila, M. Forsgren, & H. Håkansson(Eds), Critical research on multinational corporations. Oxford: Pergamon Press.
Ghauri, P. N., & P. J. Buckley (2006). Globalization, multinational enterprises and worldpoverty. In: S. C. Jain & S. Vachani (Eds), Multinational corporations and global povertyreduction (pp. 204–232). Cheltenham, UK: Edward Elgar Publishing.
IBRD (1997). World Development Report 1997 — The state in a changing world.Washington, DC: International Bank for Reconstruction and Development.
Oxelheim, L. & Ghauri, P. N. (2004). European Union and the race for foreign directinvestment in Europe. Oxford: Pergamon.
Krugman, P. (1987). Is Free Trade Passé? Journal of Economic Perspectives, 1(2), 131–144.Pfefferman, G. P., & Madarassy, A. (1992). Trends in private investments in developing
countries, International Finance Corporation. Washington, DC: The World Bank,Discussion Paper no. 14.
Stiglitz, J. (2002). Globalization and its discontents. New York: W.W. Norton & Company.The Economist, (2005). Emerging-market indicators, The Economist, 2 June, p. 12.The Financial Times, (2006). Leading exporters, The Financial Times, 11 December, p. 17.Yamin, M., & Ghauri, P. N. (2004). Rethinking the relationship between emerging
economies and multinational enterprises: The relevance of the East Asian experience.In: B. Prasad & P. N. Ghauri (Eds), Global firms and emerging markets in the age ofanxiety (pp. 251–266). Westport, Connecticut: Praeger.
Globalization and Its Impact on Development 231
Ch009.qxd 6/29/2007 10:13 AM Page 231

This page intentionally left blank

Author Index
Abramovitz, M., 27Aghion, P., 2, 69Ahuja, G., 160Aitken, B., 2, 22, 24Akerlof, G.A., 86Alfaro, L., 37, 41Almeida, P., 2, 84, 96–97, 104, 173–174Ambos, B., 3, 170, 173Ambos, T. C., 3, 170, 173Anand, J., 73Andersson, U., 77Archibugi, D., 96Argote, L., 172–174Arita, T., 73, 80, 86Asakawa, K., 72Aykut, D., 3, 35, 55
Bakkers, S., 125Balasubramanyam, V. N., 37Ball, D. A., 65Banerjee, S., 174Banks, B., 96, 98, 106Barba Navaretti, G., 196Barner-Rasmussen, W., 3, 173Barrell, R., 87Barro, R., 47–48, 57Bartlett, C. A., 169, 172, 178Basset, G., 206Bathelt, H., 77Bell, M., 129, 131, 152, 156, 159Bhattacharya, S., 85Birkinshaw, J., 73, 78, 170, 172–173,
178–179Björkman, I., 3, 173
Blalock, G., 23Blomstrom, M., 21–22, 24, 37, 196Bloomfield, G. T., 73Blundell, R., 2Boekema, F., 125Borensztein, E., 37Boynton, A. C., 72Braconier, H., 196Brainard, S. L., 196, 212Brewer, T. L., 229Bruno, G., 196Buckley, P. J., 67–68, 171, 174,
223–226, 228–229
Cantwell, J. A., 1–3, 70, 72–76,78–80, 84, 86, 96–97, 105, 109,170, 172, 183, 225
Carkovic, M., 25, 38Carsten, F., 40Carter, M. J., 174Casson, M. C., 67–68Castellani, D., 2, 196Castells, M., 84Caves, R., 2, 37, 131Caves, R. E., 2, 14, 67, 171Chakraborty, C., 41Chakravarthy, B., 172Chanda, A., 37Chini, T. C., 178Claessens, S., 41Clarke, G., 41Clarke, K. B., 114, 124Cohen, W.M., 78, 135–136, 152Cohendet, P., 122
Author Index.qxd 6/29/2007 9:42 AM Page 233

Contractor, F. J., 229Coolidge, J., 39Criscuolo, P., 27–28, 97, 170Crookell, H., 14Cross, R., 174Cull, R., 41Cyert, R. M., 73
D’Amato L., 41D’Aspremont, C., 85Daft, R. L., 174Dahlman, C., 27Darr, E. D., 172Daum, J. H., 174De Gregorio, J., 37De Mello, L. R. Jr., 26Delios, A., 73Dicken, P., 77Dimelis, S., 206Disdier, A., 196Djankov, S., 21, 38Dosi, G., 105Doz, Y., 133, 172Driffield, N., 24Dunning, J. H., 2, 67, 70, 96–97,
102, 171
Edwards, T., 173Egelhoff, W. G., 170Ekholm, K., 196Emerson, M., 14Enright, M., 172Epple, D., 172Eswaran, M., 71Ethier, W., 69
Fai, F., 105Falzoni, A. M., 196Faust, K., 144Feldman, M. P., 80
Ferner, A., 173Findlay, R., 1Flyer, F., 69Fors, G., 170, 196Forsgren, M., 77Fosfuri, A., 2, 25Foss, N. J., 171, 174Frantz, P. L., 65Freeman, C., 105Frost, T. S., 2, 97Fujita, M., 65, 68, 81
Gabriele, A., 41Galbraith, C. S., 174Gallais-Hamonno, G., 14Geringer, J. M., 65Geroski, P. A., 178Gershenberg, I., 25Gertler, P. J., 23Ghauri, P. N., 223–226, 228–229Ghoshal, S., 78, 169, 172–173, 178Girma, S., 196, 206Giuliani, E., 129, 152, 156Goldberg, L., 40Gordon, I. R., 65, 80Görg, H., 23, 24, 38, 131, 206Govindarajan, V., 3, 132, 170–173,
178–179, 186Granovetter, M., 133Granstrand, O., 96Grant, R. M., 172, 174Grasseni, M., 4Greenaway, D., 131Greene, W. H., 179Griffith, R., 2Grindley, P. C., 85Grossman, G., 95Grossman, G. M., 69Gupta, A. K., 3, 170–173, 178–179,
186
234 Author Index
Author Index.qxd 6/29/2007 9:42 AM Page 234

Haddad, M., 2, 22Håkanson, L., 170, 173Hall, P., 84Hanson, G., 14, 22, 217Hansson P., 2, 196Harman, H. H., 185Harrison, A. E., 22, 24Harrison, A., 2, 22, 38Hart, O., 69Haskel, J., 131Head, K., 196Hedlund, G., 131, 169, 172Heise, A., 82Helpman, E., 65, 68–69, 95, 196Henderson, R., 85, 96, 114, 124, 172Henry, N., 74Hiemenz, U., 20Hirschman, A. O., 2Hoekman, B., 21, 38Holm, U., 77Horstmann, I. J., 69Howells, J. R., 174Howells, J., 70Howitt, P., 2Hymer, S. H., 171
Iammarino, S., 80Isard, W., 82Ito, K., 206Iwasa, T., 3, 170, 173
Jaffe, A. B., 172Jaffe, A., 85, 96, 98, 102–103, 106, 108Janne, O. E. M., 73Javorcik, B. S., 38Jenkins, M., 74Johanson, J., 70
Kalemli-Ozcan, S., 37Kanemoto, Y., 71
Katz, J., 25Keller, W., 38Kennedy, P., 183King, R., 49Klein, M., 40Kneller, R., 196Koenker, Y., 206Kogut, B., 3, 84, 96, 133, 135, 137,
170, 172–174, 179Kokko, A., 1–2, 22, 24, 28Konings, J., 38, 196Korine, H., 173Kosmopoulou, E., 84Kotha, S., 72Krugman, P. R., 65, 68Krugman, P., 65, 68, 81, 224Kuemmerle, W. T. J., 170, 178Kuemmerle, W., 74Kumaraswamy, A., 174
Laffont, J. J., 69Lall, S., 2, 14, 24, 28–29Lane, P. J., 179Lee, J. W., 48, 57Leenders, M., 64Lengel, R. H., 174Levine, R., 25, 38, 49Levinthal, D. A., 78, 135–136, 152Li, L., 3, 173Liberatori, M., 15Lichtenberg, F., 196Lim, E. G., 24Lim, E., 37Lipsey, R. E., 37, 196Louri, H., 206Lyles, M. A., 179
Machado, J. A. F., 206Madarassy, A., 229Malmberg, A., 76–77
Author Index 235
Author Index.qxd 6/29/2007 9:42 AM Page 235

Mankiw, G. N., 47Mansfield, E., 2, 172March, J. G., 73Marin, A., 29, 129, 131, 159Mariotti, S., 69, 175Markusen, J. R., 2, 55, 69, 217Marsden, P. V., 144Marshall, A., 96Martin, R., 65, 86Martinez, J., 132Maskell, P., 75–77Maskus, K., 217Mata, J., 206Mataloni, R. J., 217Mattoo, A., 40Maurseth P. B., 110Mayer, T., 70McAleese, D., 24McCann, P., 65, 71, 73, 80,
86–87McCulloch, W. H. Jr., 65McDonald, D., 24McDonald, F., 82McEvily, S., 172Melitz, M. J., 196Meyer-Krahmer, F., 122Midelfart-Knarvik, K. H., 196Minbaeva, D. B., 170Minor, M. S., 65Mody, A., 55Mohd. Noor, A. H., 24Molinari, A., 41Morgan, K., 125Moses, L., 82Motta, M., 2, 25Mowery, D. C., 70Mucchieli, J. L., 70Mudambi, R., 3, 29, 69–70, 73–75,
78–79, 172, 183Mudambi, S. M., 70
Murphy, A., 196Mutinelli, M., 175Mytelka, L., 29
Nahapiet, J., 173Narula, R., 2, 14–15, 19–21, 23,
27–29, 96–97, 102, 170, 223Navarra, P., 69, 73, 78Nelson, C., 27Nelson, R., 182Nobel, R., 170, 173, 179Nohria, N., 78, 173Nonaka, I., 174Noonan, C. A., 101, 109Numme, P., 20Nunnenkamp, P., 41
O’Donnell, S. W., 173Odagiri, H., 3, 170, 173Organ, D. W., 185Otto, J., 170, 173Oxelheim, L., 225
Pain, N., 87Papanastassiou, M., 132Patel, P., 70, 96Pavitt, K. L. R., 176, 179Pavitt, K., 70, 96Pearce, R. D., 3, 170Pearce, R., 132Pedersen, T., 64, 171, 173–174,
183Pereira, S., 131Perez, C., 105Perlmutter, H. V., 131, 134Perlmutter, H., 169Persaud, A., 170, 173–174, 179Persson, H., 22Persson, M., 173Petersen, B., 173–174, 183
236 Author Index
Author Index.qxd 6/29/2007 9:42 AM Page 236

Pfefferman, G. P., 229Phelps, N. A., 65, 87Phene, A., 124Pianta, M., 96Pietrobelli, C., 28Pigato, M., 15Pinch, S., 74Pine, B., 72Piscitello, L., 2, 69, 76Pisu, M., 196Podsakoff, P. M., 185Portelli, B., 21, 23Porter, M. E., 65, 74, 76Poynter, T., 131–132Prahalad, C. K., 133Prantl, S., 2Pyndt, J., 64
Rabbiosi, L., 4, 169Radosevic, S., 28Rathindran, R., 40Rau, D., 172Rauch, J. E., 86–87Reinmöller, P., 174Reisen, H., 14, 26Reuber, G. L., 14ReVelle, C., 71Ries, J., 196Riker, D., 196, 212Rodriguez Clare, A., 24Rodriguez-Clare, A., 2Rodrik, D., 38, 131Roende, T., 25Romeo, A., 2Romer, D., 47Romer, P., 95Ronde, T., 2Rose-Ackerman, S., 39Rosenberg, N., 70Ruane, F., 24
Rutten, R., 125Ryan, D., 71
Sachs, J. D., 39, 51Saggi, K., 26Sala-i-Martin, X., 39, 47, 51Salisu, M., 37Salk, J. E., 179Sambharya, R. B., 174Santangelo, G. D., 2, 78, 86Santangelo, G., 105Sapsford, D., 37Saxenian, A., 5, 84–86, 88Sayek, S., 37Schlegelmilch, B. B., 3, 170, 173Scott-Kennel, J., 23–24Sharma, D. D., 173–174, 183Shaver, J. M., 69Simmie, J., 86–87Simon, H. A., 73Simonin, B. L., 179Singh, J., 97Sjoholm, F., 22Slaughter, M. J., 25, 196Smarzynska, J. B., 1Solvell, O., 76Sölvell, Ö., 76, 172sasSoto, M., 14, 26Spinanger, D., 20Sproull, L., 174Sternberg, R., 124Stewart, J. C., 25Stiglitz, J., 224–225, 228Streeten, P., 14Strobl, E., 38Suarez-Villa, L., 80Subramaniam, M., 170, 173Subramanian, A., 39, 51Sunley, P., 65, 86Szulanski, G., 75, 171, 173
Author Index 237
Author Index.qxd 6/29/2007 9:42 AM Page 237

Taggart, J., 132Tallman, S., 74Tansini, R., 22, 28Teece, D. J., 85Temple, P., 122The Economist 228The Financial Times 228Tirole, J., 69Toyama, R., 174Trajtenberg, M., 85, 96, 102–103,
108, 172Tsai, W., 173Tüselmann, H., 82
Vahlne, J., 70Van Pottelsberghe
de la Potterie, B., 196Vega, M., 96Venables, A. J., 2, 65, 68–69, 81Vernon, R., 70, 171Verspagen B., 110Verspagen, B., 96, 110Victor, B., 72Von Tunzelman, N., 105
Walrod, W., 80Wang, Q., 105Warner, A. M., 39, 51Wasserman, S., 144Watanabe, S., 24Weil, D. N., 47Wheeler, D., 55White, H. C., 133White, R., 131–132Wierenga, B., 64Williamson, O. E., 82Winter, S., 64, 182
Xu, B., 26
Yamin, M., 170, 173, 223–224Yeaple, S. R., 38, 196
Zander, I., 97, 103, 174Zander, U., 3, 133, 135, 137, 170,
172, 179Zanfei, A., 2Zejan, M., 22, 24, 28, 37Zhou, C., 179, 182
238 Author Index
Author Index.qxd 6/29/2007 9:42 AM Page 238

Subject Index
Absorptive capacity, 1, 2, 3, 26–29,74–75, 78, 135
Activitiesforeign vs. domestic, 196labour intensive vs skill
intensive, 2, 196Accumulation, 26, 28, 130, 133Advantages
comparative, 64 competitive, 64, 74, 78, 85cost, 67dynamic, 72internalization, 69location, 3, 30, 69ownership, 67–68, 130, 171
Affiliates, 22, 24, 28foreign, 21, 24, 173, 195, 197,
198–205, 207, 212, 215Africa, 17, 19–20, 35, 36, 198Agglomeration, 70, 80, 81, 83, 84,
85–86, 229economies of, 87
AIDA database, 200ANOVA, 142Argentina, 41, 129–159
national innovation survey, 130, 138ASEAN, 42Asia, 17, 19, 20, 35, 36, 198, 215Assets, 29, 30
firm-specific, 67intangible, 67knowledge, 69, 85, 171
Australia, 198
Austria, 224Authorities
local, 53–54national, 42
Backwardnesstechnological, 136
Baden Wütteberg, 100–101, 102,105, 108, 109, 110, 112,114, 122
Bakery oven industry, 155–156Banks, 40, 52
domestic, 41foreign, 41
Bayern, 100, 101, 108, 110, 112, 113,114, 119, 120,122
Behaviourgeographical, 70, 71, 73, 87–88locational, 69–74spatial, 63–64, 65, 74strategic, 65, 67
Brazil, 19, 153Bundesländer, 97, 100
Canada, 35, 36Capabilities
emitting, 122–124state, 6, 27
Centrecentre-periphery, 73centre of technological excellence,
96, 106Chemical industry, 133
Subject Index.qxd 6/29/2007 10:16 AM Page 239

China, 16, 17, 19, 35, 154, 224, 228,229
Chile, 19, 41, 153Cluster
access to, 81industrial clustering, 66,
74–84, 86industrial complex, 80, 82,
83–84, 87membership, 81, 83pure agglomeration, 80, 83, 84,
85–86social network, 80, 81, 82–83,
84, 86typologies of clusters, 80–84
Colombia, 153Communication, 24, 170, 173,
174, 182Company, 38, 39
parent company, 101, 169–186Companies
domestic companies, 4foreign companies, 36, 38, 39, 41host country, 1, 22local companies, 2parent companies, 169–184
Competenciesdynamic, 64organisational, 78technological, 73, 178
Competence-exploiting, 78, 79Competence-creating, 78, 79, 183Competition, 28, 29, 38, 80
structure 40, 67Competitive advantage, 64,
74, 78, 85Competitiveness, 2, 14, 83, 225Control, 47–49, 51, 170, 173, 186
type of, 200Corporate strategy, 65, 67, 226
Corruption, 52, 57level, 48
CountryAsian, 17, 26developed country, 36, 40, 225,
228–229developing country, 13–29, 35, 36,
40, 133–134, 225, 228–229Eastern European, 201fast growing countries, 2home country, 69, 72, 102, 106,
195–215host country, 3, 13, 17, 20, 21, 22,
24, 28, 30, 135, 137, 138Latin American, 139, 153less developed, 6, 14, 225low-wage countries, 196origin, 100poorer, 49recipient country, 3, 36
Costa Rica, 153Crowding out, 40
effect, 39, 51
DAR database, 200Demand, 2, 40, 51Determinants, 25, 26
microeconomic vs. macroeconomic,229
Developmentlocal, 4, 6regional, 65, 66, 103
Distancegeographical, 68psychic, 67
Dutch desease, 39, 51, 54
East Asia, 35, 36Eastern Europe, 197, 198, 201, 107,
212, 215
240 Subject Index
Subject Index.qxd 6/29/2007 10:16 AM Page 240

Eclectic paradigmadvantages, 69oli paradigm, 67
Economies of scale, 67, 68, 72Economies of scope, 72Ecuador, 153Effects
competition effect, 85, 183demonstration effect, 131imitation effect, 2
Embeddedness, 77, 103Employment, 6, 198, 212–215Endogeneity, 23, 55, 198, 199Energy, 229Enterprises
multinational enterprises (MNEs),2, 4, 5, 6, 13, 14, 20–25, 26,27, 28, 29, 30, 52, 63–87,96–97, 124, 129–159, 169–184,197, 200, 201, 207, 217, 223,225–228
small and medium enterprises(SMEs), 76
Entry modeacquisition, 79, 80Greenfield, 79
Europe, 36, 138, 198, 207, 210, 215Exogenous shocks, 199Exporting, 195, 224Externalities, 14, 21–25
negative, 23positive, 23
Factor endowment, 196, 217Firm
domestically-owned, 23foreign-owned 1, 95, 97heterogeneity, 195–196, 198, 203indigenous, 105, 109, 115, 122,
123–125
inter-firm relations, 4, 66–67, 80,82, 86–87
multiplant, 63, 69, 71multinational, 63, 74, 125, 200,
224, 225performance, 22, 133, 195, 196,
197, 199size, 146, 176, 178, 196, 199
Flexibility, 223, 224Food industry, 152, 156–157Foreign direct investment (FDI)
absolute vs relative level, 42acquisition, 15, 66balance of payments, 39efficiency seeking, 39equity capital, 47Greenfield, 66market seeking, 39–40, 78reinvestment of earnings, 47sectoral composition, 35–53short-term vs. long-term
capital, 47vertical vs. horizontal, 23
Foreign participation, 35
Geographical area, 197, 200, 207,211, 215
Geography, 69, 70, 82economic, 64–67, 70, 71–73,
77, 81Germany, 95, 97–98, 100–115Global factory, 224Globalisation, 64, 223–229Goods
capital, 140, 143, 147, 148intermediate, 24, 27public, 130tradable vs. non tradable, 40, 51, 52
Governanceglobal, 225
Subject Index 241
Subject Index.qxd 6/29/2007 10:16 AM Page 241

Government, 14consumption, 48, 57control, 228global, 225policy, 25, 224, 226, 228
Gross domestic product (GDP), 17,48, 50, 53
Growtheconomic, 13, 14, 15, 20, 21,
25–26, 38, 42– 46, 49, 51–52local, 13–29national, 171–173rate, 17, 47, 54
Hessen, 100–101, 102, 109, 110,111, 112, 113, 114, 115, 116, 119,120, 122
Hierarchy, 66, 68, 87Home base augmenting (HBA), 5,
78, 102Home base exploiting (HBE), 102Human capital, 48, 57
IBRD, 227India, 224, 228, 229Incentive, 14, 28, 40, 51, 151, 224,
226Industrial districts, 61–87Inflation, 48, 57
rate, 48, 49, 51–52Information and communication
technologies (ICTs), 72, 179mechanisms, 174, 184
Infrastructure, 26, 28, 35, 36, 40,41, 52, 54, 56, 74, 96, 103, 104,108, 110, 114, 122, 124, 153,227, 229
Innovationinnovation system, 74, 75, 76, 77 managerial, 172
process, 142, 144, 148, 157product, 141, 144, 148survey data, 130, 138–139, 142,
145–152technological, 140
Innovativeness, 133, 170, 171–174,177–178, 181–184
Input, 2, 24, 51, 74, 81, 82, 84, 125,132, 143, 147, 148, 155, 199
Institutions, 27, 28, 51, 74,139, 225
quality, 49Integration, 77, 79, 153International Monetary Fund (IMF),
14, 42, 225International economics, 65–66International trade
export, 48, import, 48openness, 48, 57
International country risk guide(ICRG), 48
International business, 63, 65–67,69–70, 71, 76, 77, 101
International trade theory, 65–68, 69,70, 71
Invention, 99, 103, 105, 106, 108 Investment
competence creating, 78, 79competence exploiting, 78, 79export oriented, 39foreign, 23, 37, 38, 51, 52,
178–179, 210Greenfield, 73home base augmenting, 78home base exploiting, 96horizontal, 23market oriented, 25market seeking, 39, 40motivation, 2, 38
242 Subject Index
Subject Index.qxd 6/29/2007 10:16 AM Page 242

resource oriented, 20vertical, 23
Investment promotion agencies, 54ISTAT, 200Italy, 69, 176, 195
Japan, 179, 229Jobs
domestic, 195–196foreign, 196
Joint venture, 21, 82, 179
Knowledgearchitectural, 124base, 85, 108, 172center, 71, 73characteristics of, 182codified, 137, 158, 173, 174complementary, 133country-specific, 172creation, 86, 105, 129, 141, 174,
179development, 68, 133firm-specific, 172flows, 75, 77, 84–85, 97, 98–99integration, 77, 78production, 68receiver vs. sender, 170sharing, 86, 133, 154, 173sourcing, 110, 112stock, 28, 170tacit, 85, 137, 173, 174 transfer, 79, 122, 169–184
Knowledge flowsinflows, 74, 75, 78, 84–85intentional vs. unintentional, 74, 84from local environment to
subsidiary, 171from parent company to
subsidiaries, 171
from subsidiaries to parentcompany, 171
from subsidiary to localenvironment, 171
outflows, 84–85to peer subsidiaries, 171
Knowledge transfermechanisms, 173–174, 175, 179,
180, 182, 183–184, 185reverse knowledge transfer (RKT),
170, 171, 176, 178, 180, 181,182, 185, 186
technology, 22, 23, 26, 179Know how, 171
technological, 101, 106, 112, 114
Laboratoryforeign, 100R&D, 141, 175
Labour, 23–25, 26, 196, 197,198–199, 207–212
skilled vs. unskilled, 226Liability of foreignness, 171Liberalisation, 14, 40–41, 224, 227,
228Licensing, 27
agreement, 154Linkages
creation of, 24, 25customers, 38forward vs. backward, 2, 36, 38,
51, 54global vs. local, 129–159horizontal vs vertical, 44inter-firm vs. intra-firm, 173suppliers, 38, 150, 151
Local context, 5, 105, 138, 186development, 4economy, 51, 52, 54
Subject Index 243
Subject Index.qxd 6/29/2007 10:16 AM Page 243

Locationmatching problem, 73optimal, 64, 224theory, 65
Managementhuman resources, 178general, 178quality, 178theory, 67
Market domestic, 36, 39, 67, 146, 153, 157,
196entry, 70failures, 68, 225, 226, 227financial, 37, 40, 41, 48, 49,
50, 53foreign, 148, 172, 196, 224imperfections, 6, 68, 227,
228, 229interaction, 68structure, 54, 85
Mechanismsbased on ICTs, 6, 169, 174, 179,
184, 185communication, 170, 173, 174control, 170, 173, 186coordination, 173for transferring knowledge, 169,
175, 183person-based, 6, 169, 173, 174,
184, 185written, 169, 174, 184, 185
Mergers and acquistions (M&As)acquisition, 15, 40, 52, 66, 79, 98,
175, 179, 180, 181, 182, 187,188, 223
cross border, 15, 102Mexico, 19, 22, 41, 56, 153Middle East, 198
ModelEthnocentric organisational
model, 131Multinational
experience, 6, 197, 200, 217footloose, 224, 225, 226headquarters, 72–73, 96, 133, 134,
135, 136, 137, 139, 142, 150,151, 152, 153, 155, 157, 159,163, 172
multinational enterprises (MNEs),2, 4, 5, 6, 13, 14, 20–25, 26, 27,28, 29, 30, 52, 63–87, 96–97,124, 129–159, 169–184, 197,200, 201, 207, 217, 223,225–228
strategy, 67, 75, 132, 196, 203, 217,223
NACE 2 sectors, 203National Bureau of Statistics, 42, 56
China, 42, 56National system of innovation, 75Neo-classical location production
model, 71, 81, 82Network
external, 103, 170externalities, 14, 20–29, 129, 156,
157, 224, 227internal, 26, 27, 67, 68, 69, 73, 77,
80, 81, 84, 86, 87, 129, 131, 133,137, 142, 143, 148, 149, 151,152, 155, 159, 161, 170, 171,172, 223, 224
international corporate network,103
network based view, 133social, 80, 81, 82, 83, 84, 86, 87,
88, 144New Zealand, 56, 198
244 Subject Index
Subject Index.qxd 6/29/2007 10:16 AM Page 244

Niedersachsein, 101, 109, 111, 112,113, 114, 116, 118, 119, 120, 122
Nordrhein-Westfalen, 100, 101, 105,108, 109, 110, 112, 118, 122
North America, 154, 159, 198, 202,207, 210, 215
NUTS, 97, 109
OECD, 26, 42, 56, 145, 146, 179Offshore plants, 224Organisation, 130, 131, 140, 142, 151,
153, 161, 162organisational structure, 5
Outsourcing, 51, 64Ownership, 14, 30, 51, 67, 69, 98,
130, 170, 171, 175, 223, 225domestic, 39foreign, 39
Parent company, 3, 170, 186employment, 196innovativeness, 6, 169, 174, 178,
179, 181–185parent-subsidiary relationships, 170,
171, 173, 176, 177, 178, 180, 188Patents, 95–121, 143, 148, 149
assignee vs. assignor, 98citing vs. cited, 99, 100, 101,
103, 106global citation, 115patent citation analysis, 4, 182self-citation, 103, 105, 118, 122
Performanceeconomic, 46firm, 199, 217growth, 46
Physical proximity, 40Policy
equity-related, 225developed countries, 228–229
developing countries,228–229
investment, 19, 35locational, 224makers, 15, 224market-enhancing, 225national governmental, 224regional, 65trade, 35
Press industry, 145, 152, 158Privatisation, 14, 15Product
differentiation, 68final, 68, 155intermediate, 2, 24, 27, 39, 68
Product cycle model, 70, 71, 72, 73Production
domestic vs. foreign, 14, 41, 138, 142
factors of, 196, 199, 217international, 15, 197, 215
Production function, 71Cobb-Douglas, 198non costant return to scale, 198
Productivitylabour productivity, 4, 67, 195,
197, 198–199, 201, 204,207–212, 218
total factor productivity, 22, 26Property rights, 75, 227
Random geographic draw, 110Reading school, 67Reallocation, 71Regional economy, 65, 66, 67, 70,
71–73, 80Regionalisation, 226Regions, 17, 19–20, 28, 83, 101, 105,
109, 110, 114, 153learning, 125
Subject Index 245
Subject Index.qxd 6/29/2007 10:16 AM Page 245

Regression, 109, 115, 118, 119, 120,198, 199, 207
cross sectional, 49–53growth, 41, 47ordinary Least Square, 207, 210panel, 23, 197quantile, 195, 197, 199, 206, 207,
215, 217Regulation
regulatory action, 227regulatory agencies, 227regulatory role, 227
Relationshipscollaborative, 152–153horizontal, 134parent-subsidiary, 72, 77
Reprint database, 200Research and development (R&D),
64, 79, 84, 96, 108, 112, 114,140, 141, 142, 143, 147, 148,150, 155, 157, 176, 177, 178,199, 202, 208, 209, 212
expenditures, 140, 141indigenous, 225laboratories, 139, 155, 162
Revealed technological advantage(RTA), 114, 116
Rheinland-Pfalz, 101, 111, 112, 114,116, 118, 122
Risk, 48, 57financial risk, 226risk management, 226
RITMO dataset, 175–177
Schleswig Holstein, 110Sectoral composition, 5, 19, 35–53Sector
banking, 40, 52capital-intensive, 40commercial, 64
distribution, 35financial, 35, 48, 54industrial, 142infrastructure, 40, 41labour-intensive, 2manufacturing, 19, 20, 36, 37, 39,
40, 42, 44, 45, 46, 49, 51, 52, 54,56, 86
primary, 5, 19, 35, 36, 37, 38, 39,42, 44, 46, 49, 50, 51, 52, 54
private, 17, 48, 57scale intensive, 186science based, 179, 186services, 19, 20, 35, 36, 38, 40, 42,
44, 45, 46, 47, 49, 52, 54, 56specialised supplier, 176, 179, 186supplier dominated, 176, 186
Sector-specific time invariant effects, 199
Skill upgrading, 29Skills
intensity, 141, 143, 147, 148, 196management, 38technology, 38
South America, 17, 18, 19, 198Specialisation
pattern, 118profile, 109, 115, 118
Spilloverschannels, 1information, 4, 5, 66, 79, 80, 84–87mechanisms, 79negative, 39, 51positive, 37, 38, 51, 131recipient, 110
Stabilityinstitutional, 48macroeconomic, 48, 227
Strategy, 67, 75, 132, 196, 203, 217foreign market servicing, 224
246 Subject Index
Subject Index.qxd 6/29/2007 10:16 AM Page 246

Subsidiariescompetence creating, 78, 79, 183competence exploiting, 2–3, 78, 79,
183control, 136, 137, 178, 179, 180evolution, 78, 79global innovator, 132globally dependent, 134, 135–136,
139, 155–156, 163globally diversified, 134, 139,
152–153, 154, 163globally independent, 5, 134,
136–137, 139, 156–157, 163globally isolated, 5, 134, 137–138,
139, 158, 158–159, 162implementers, 132integrated players, 132local innovators, 132market satellite, 132miniature replica, 132minority, 175–176parent-subsidiary relationships, 77product specialist, 132rationalised manufacturer, 132roles, 130–133strategically independent, 132types, 133–138wholly-owned, 224
Sub-contracting, 69
Technological frontier, 105, 155Technology
domestic, 29embodied vs disembodied, 140,
143, 147, 148, 150
fees, 140foreign, 28, 114path dependent nature, 108sourcing, 109, 112, 114, 115, 118,
124, 125intra-regional vs. inter-regional, 121
The Netherlands, 154Transaction costs, 67, 68Transport, 56, 67, 68, 82, 105, 115,
117, 217, 229Truncation bias, 99Transition economies, 52, 201Tubes and Pipes industry, 152
U.N. Economic Commission for LatinAmerica and the Caribbean,41–42, 56
UNCTAD, 1, 2, 15, 16, 17, 18, 19, 20,41, 42, 56
World Investment Report, 19, 20United Nations, 42, 56Universities, 2, 79, 97, 139, 161, 176Uppsala School, 76, 77Urban economy, 81
Vertical integration, 69Virtuous/vicious circles, 6, 74, 85Volatility, 51, 223
World Bank, 14, 36, 39, 41, 47, 48,57, 223, 225
World Development Indicators, 47,48, 56
World Investment Report, 19, 20WTO, 223, 225
Subject Index 247
Subject Index.qxd 6/29/2007 10:16 AM Page 247

This page intentionally left blank