Embed Size (px)
Citation preview
ECONOMIC VIEWPOINT
François Dupuis, Vice-President and Chief Economist • Hélène Bégin, Senior Economist
Desjardins, Economic Studies: 418-835-2450 or 1 866-835-8444, ext. 5562450 • [email protected] • desjardins.com/economics
NOTE TO READERS: The letters k, M and B are used in texts and tables to refer to thousands, millions and billions respectively.IMPORTANT: This document is based on public information and may under no circumstances be used or construed as a commitment by Desjardins Group. While the information provided has been determined on the basis of data obtained from sources that are deemed to be reliable, Desjardins Group in no way warrants that the information is accurate or complete. The document is provided solely for information purposes and does not constitute an offer or solicitation for purchase or sale. Desjardins Group takes no responsibility for the consequences of any decision whatsoever made on the basis of the data contained herein and does not hereby undertake to provide any advice, notably in the area of investment services. The data on prices or margins are provided for information purposes and may be modified at any time, based on such factors as market conditions. The past performances and projections expressed herein are no guarantee of future performance. The opinions and forecasts contained herein are, unless otherwise indicated, those of the document’s authors and do not represent the opinions of any other person or the official position of Desjardins Group. Copyright © 2018, Desjardins Group. All rights reserved.
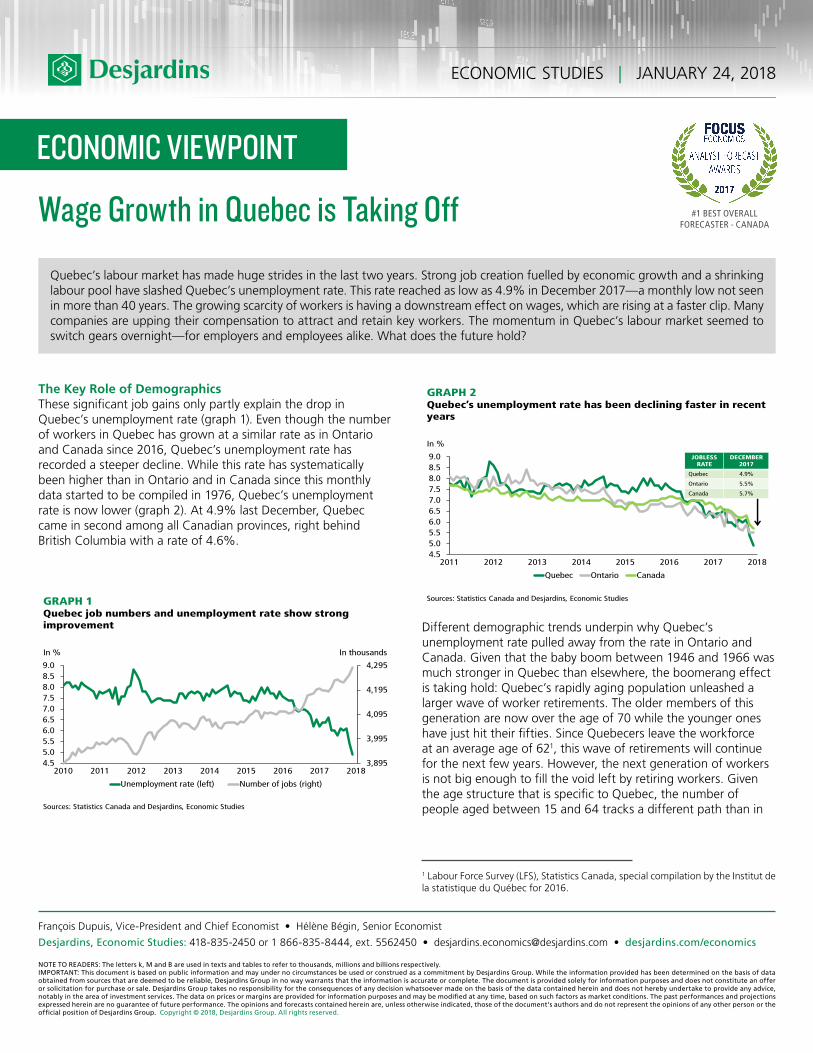
The Key Role of Demographics These significant job gains only partly explain the drop in Quebec’s unemployment rate (graph 1). Even though the number of workers in Quebec has grown at a similar rate as in Ontario and Canada since 2016, Quebec’s unemployment rate has recorded a steeper decline. While this rate has systematically been higher than in Ontario and in Canada since this monthly data started to be compiled in 1976, Quebec’s unemployment rate is now lower (graph 2). At 4.9% last December, Quebec came in second among all Canadian provinces, right behind British Columbia with a rate of 4.6%.
Different demographic trends underpin why Quebec’s unemployment rate pulled away from the rate in Ontario and Canada. Given that the baby boom between 1946 and 1966 was much stronger in Quebec than elsewhere, the boomerang effect is taking hold: Quebec’s rapidly aging population unleashed a larger wave of worker retirements. The older members of this generation are now over the age of 70 while the younger ones have just hit their fifties. Since Quebecers leave the workforce at an average age of 621, this wave of retirements will continue for the next few years. However, the next generation of workers is not big enough to fill the void left by retiring workers. Given the age structure that is specific to Quebec, the number of people aged between 15 and 64 tracks a different path than in
Wage Growth in Quebec is Taking Off
ECONOMIC STUDIES | JANUARY 24, 2018
Quebec’s labour market has made huge strides in the last two years. Strong job creation fuelled by economic growth and a shrinking labour pool have slashed Quebec’s unemployment rate. This rate reached as low as 4.9% in December 2017—a monthly low not seen in more than 40 years. The growing scarcity of workers is having a downstream effect on wages, which are rising at a faster clip. Many companies are upping their compensation to attract and retain key workers. The momentum in Quebec’s labour market seemed to switch gears overnight—for employers and employees alike. What does the future hold?
#1 BEST OVERALLFORECASTER - CANADA
GRAPH 1 Quebec job numbers and unemployment rate show strong improvement
Sources: Statistics Canada and Desjardins, Economic Studies
In %
3,895
3,995
4,095
4,195
4,295
4.55.05.56.06.57.07.58.08.59.0
2010 2011 2012 2013 2014 2015 2016 2017 2018
Unemployment rate (left) Number of jobs (right)
In thousands
Sources: Statistics Canada and Desjardins, Economic Studies
In %
4.55.05.56.06.57.07.58.08.59.0
2011 2012 2013 2014 2015 2016 2017 2018
Quebec Ontario Canada
GRAPH 2 Quebec’s unemployment rate has been declining faster in recent years
JOBLESS RATE
DECEMBER 2017
Quebec 4.9%
Ontario 5.5%
Canada 5.7%
1 Labour Force Survey (LFS), Statistics Canada, special compilation by the Institut de la statistique du Québec for 2016.
ECONOMIC STUDIES
2JANUARY 24, 2018 | ECONOMIC VIEWPOINT
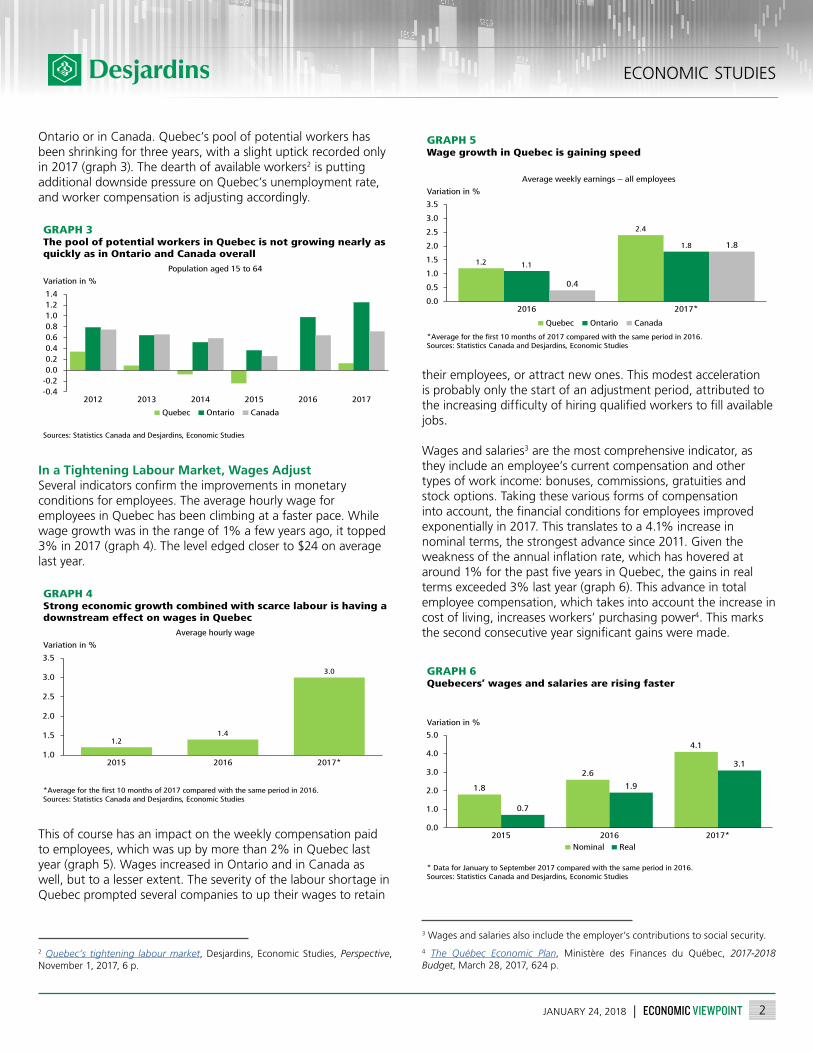
Ontario or in Canada. Quebec’s pool of potential workers has been shrinking for three years, with a slight uptick recorded only in 2017 (graph 3). The dearth of available workers2 is putting additional downside pressure on Quebec’s unemployment rate, and worker compensation is adjusting accordingly.
In a Tightening Labour Market, Wages AdjustSeveral indicators confirm the improvements in monetary conditions for employees. The average hourly wage for employees in Quebec has been climbing at a faster pace. While wage growth was in the range of 1% a few years ago, it topped 3% in 2017 (graph 4). The level edged closer to $24 on average last year.
This of course has an impact on the weekly compensation paid to employees, which was up by more than 2% in Quebec last year (graph 5). Wages increased in Ontario and in Canada as well, but to a lesser extent. The severity of the labour shortage in Quebec prompted several companies to up their wages to retain
their employees, or attract new ones. This modest acceleration is probably only the start of an adjustment period, attributed to the increasing difficulty of hiring qualified workers to fill available jobs.
Wages and salaries3 are the most comprehensive indicator, as they include an employee’s current compensation and other types of work income: bonuses, commissions, gratuities and stock options. Taking these various forms of compensation into account, the financial conditions for employees improved exponentially in 2017. This translates to a 4.1% increase in nominal terms, the strongest advance since 2011. Given the weakness of the annual inflation rate, which has hovered at around 1% for the past five years in Quebec, the gains in real terms exceeded 3% last year (graph 6). This advance in total employee compensation, which takes into account the increase in cost of living, increases workers’ purchasing power4. This marks the second consecutive year significant gains were made.
GRAPH 4 Strong economic growth combined with scarce labour is having a downstream effect on wages in Quebec
*Average for the first 10 months of 2017 compared with the same period in 2016. Sources: Statistics Canada and Desjardins, Economic Studies
Average hourly wage
Variation in %
1.2 1.4
3.0
1.0
1.5
2.0
2.5
3.0
3.5
2015 2016 2017*
GRAPH 3 The pool of potential workers in Quebec is not growing nearly as quickly as in Ontario and Canada overall
Sources: Statistics Canada and Desjardins, Economic Studies
Population aged 15 to 64
Variation in %
-0.4-0.20.00.20.40.60.81.01.21.4
2012 2013 2014 2015 2016 2017
Quebec Ontario Canada
GRAPH 5 Wage growth in Quebec is gaining speed
*Average for the first 10 months of 2017 compared with the same period in 2016. Sources: Statistics Canada and Desjardins, Economic Studies
Average weekly earnings – all employees
Variation in %
1.2
2.4
1.1
1.8
0.4
1.8
0.0
0.5
1.0
1.5
2.0
2.5
3.0
3.5
2016 2017*
Quebec Ontario Canada
2 Quebec’s tightening labour market, Desjardins, Economic Studies, Perspective, November 1, 2017, 6 p.
3 Wages and salaries also include the employer’s contributions to social security.
4 The Québec Economic Plan, Ministère des Finances du Québec, 2017-2018 Budget, March 28, 2017, 624 p.
GRAPH 6 Quebecers’ wages and salaries are rising faster
* Data for January to September 2017 compared with the same period in 2016. Sources: Statistics Canada and Desjardins, Economic Studies
Variation in %
1.8
2.6
4.1
0.7
1.9
3.1
0.0
1.0
2.0
3.0
4.0
5.0
2015 2016 2017*Nominal Real
3JANUARY 24, 2018 | ECONOMIC VIEWPOINT
ECONOMIC STUDIES
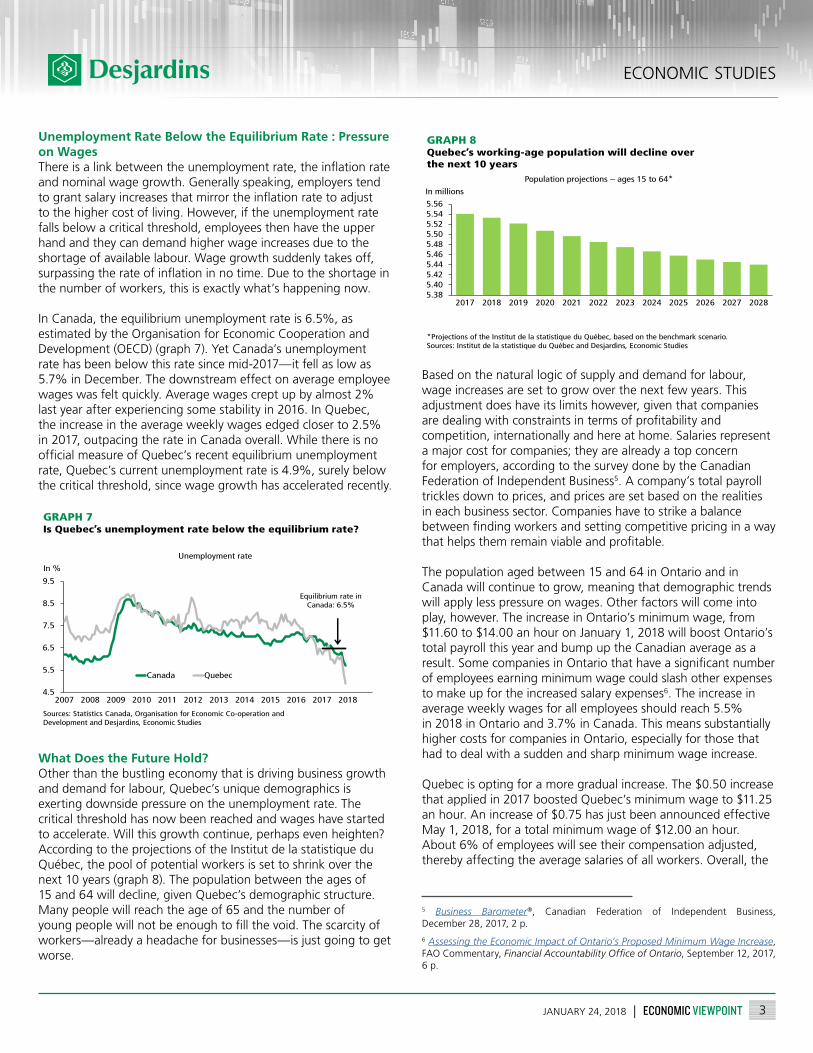
Unemployment Rate Below the Equilibrium Rate : Pressure on Wages There is a link between the unemployment rate, the inflation rate and nominal wage growth. Generally speaking, employers tend to grant salary increases that mirror the inflation rate to adjust to the higher cost of living. However, if the unemployment rate falls below a critical threshold, employees then have the upper hand and they can demand higher wage increases due to the shortage of available labour. Wage growth suddenly takes off, surpassing the rate of inflation in no time. Due to the shortage in the number of workers, this is exactly what’s happening now.
In Canada, the equilibrium unemployment rate is 6.5%, as estimated by the Organisation for Economic Cooperation and Development (OECD) (graph 7). Yet Canada’s unemployment rate has been below this rate since mid-2017—it fell as low as 5.7% in December. The downstream effect on average employee wages was felt quickly. Average wages crept up by almost 2% last year after experiencing some stability in 2016. In Quebec, the increase in the average weekly wages edged closer to 2.5% in 2017, outpacing the rate in Canada overall. While there is no official measure of Quebec’s recent equilibrium unemployment rate, Quebec’s current unemployment rate is 4.9%, surely below the critical threshold, since wage growth has accelerated recently.
What Does the Future Hold? Other than the bustling economy that is driving business growth and demand for labour, Quebec’s unique demographics is exerting downside pressure on the unemployment rate. The critical threshold has now been reached and wages have started to accelerate. Will this growth continue, perhaps even heighten? According to the projections of the Institut de la statistique du Québec, the pool of potential workers is set to shrink over the next 10 years (graph 8). The population between the ages of 15 and 64 will decline, given Quebec’s demographic structure. Many people will reach the age of 65 and the number of young people will not be enough to fill the void. The scarcity of workers—already a headache for businesses—is just going to get worse.
Based on the natural logic of supply and demand for labour, wage increases are set to grow over the next few years. This adjustment does have its limits however, given that companies are dealing with constraints in terms of profitability and competition, internationally and here at home. Salaries represent a major cost for companies; they are already a top concern for employers, according to the survey done by the Canadian Federation of Independent Business5. A company’s total payroll trickles down to prices, and prices are set based on the realities in each business sector. Companies have to strike a balance between finding workers and setting competitive pricing in a way that helps them remain viable and profitable.
The population aged between 15 and 64 in Ontario and in Canada will continue to grow, meaning that demographic trends will apply less pressure on wages. Other factors will come into play, however. The increase in Ontario’s minimum wage, from $11.60 to $14.00 an hour on January 1, 2018 will boost Ontario’s total payroll this year and bump up the Canadian average as a result. Some companies in Ontario that have a significant number of employees earning minimum wage could slash other expenses to make up for the increased salary expenses6. The increase in average weekly wages for all employees should reach 5.5% in 2018 in Ontario and 3.7% in Canada. This means substantially higher costs for companies in Ontario, especially for those that had to deal with a sudden and sharp minimum wage increase.
Quebec is opting for a more gradual increase. The $0.50 increase that applied in 2017 boosted Quebec’s minimum wage to $11.25 an hour. An increase of $0.75 has just been announced effective May 1, 2018, for a total minimum wage of $12.00 an hour. About 6% of employees will see their compensation adjusted, thereby affecting the average salaries of all workers. Overall, the
GRAPH 7 Is Quebec’s unemployment rate below the equilibrium rate?
Sources: Statistics Canada, Organisation for Economic Co-operation and Development and Desjardins, Economic Studies
Unemployment rate
In %
4.5
5.5
6.5
7.5
8.5
9.5
2007 2008 2009 2010 2011 2012 2013 2014 2015 2016 2017 2018
Canada Quebec
Equilibrium rate in Canada: 6.5%
5 Business Barometer®, Canadian Federation of Independent Business, December 28, 2017, 2 p.
6 Assessing the Economic Impact of Ontario’s Proposed Minimum Wage Increase, FAO Commentary, Financial Accountability Office of Ontario, September 12, 2017, 6 p.
GRAPH 8 Quebec’s working-age population will decline over the next 10 years
*Projections of the Institut de la statistique du Québec, based on the benchmark scenario. Sources: Institut de la statistique du Québec and Desjardins, Economic Studies
Population projections – ages 15 to 64*
In millions
5.385.405.425.445.465.485.505.525.545.56
2017 2018 2019 2020 2021 2022 2023 2024 2025 2026 2027 2028
Mill
ions
ECONOMIC STUDIES
4JANUARY 24, 2018 | ECONOMIC VIEWPOINT
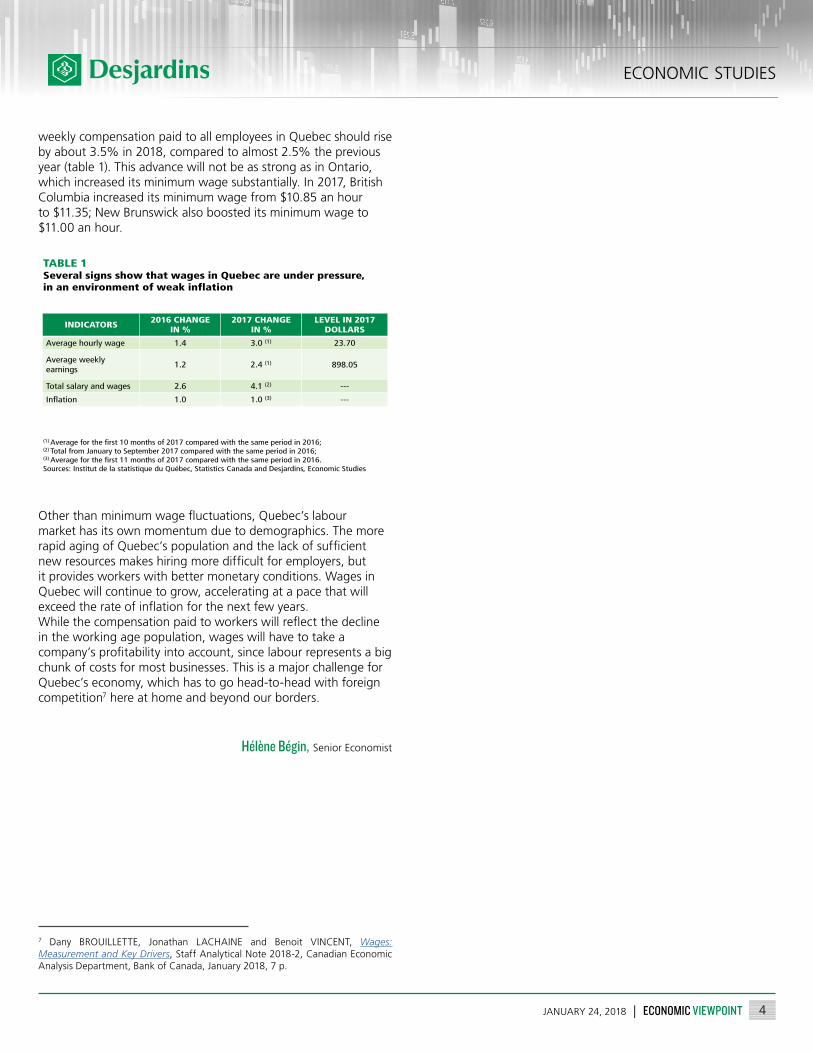
weekly compensation paid to all employees in Quebec should rise by about 3.5% in 2018, compared to almost 2.5% the previous year (table 1). This advance will not be as strong as in Ontario, which increased its minimum wage substantially. In 2017, British Columbia increased its minimum wage from $10.85 an hour to $11.35; New Brunswick also boosted its minimum wage to $11.00 an hour.
Other than minimum wage fluctuations, Quebec’s labour market has its own momentum due to demographics. The more rapid aging of Quebec’s population and the lack of sufficient new resources makes hiring more difficult for employers, but it provides workers with better monetary conditions. Wages in Quebec will continue to grow, accelerating at a pace that will exceed the rate of inflation for the next few years. While the compensation paid to workers will reflect the decline in the working age population, wages will have to take a company’s profitability into account, since labour represents a big chunk of costs for most businesses. This is a major challenge for Quebec’s economy, which has to go head-to-head with foreign competition7 here at home and beyond our borders.
Hélène Bégin, Senior Economist
TABLE 1 Several signs show that wages in Quebec are under pressure, in an environment of weak inflation
(1) Average for the first 10 months of 2017 compared with the same period in 2016; (2) Total from January to September 2017 compared with the same period in 2016; (3) Average for the first 11 months of 2017 compared with the same period in 2016. Sources: Institut de la statistique du Québec, Statistics Canada and Desjardins, Economic Studies
INDICATORS 2016 CHANGE IN %
2017 CHANGE IN %
LEVEL IN 2017 DOLLARS
Average hourly wage 1.4 3.0 (1) 23.70
Average weekly earnings
1.2 2.4 (1)
898.05
Total salary and wages 2.6 4.1 (2) ---
Inflation 1.0 1.0 (3) ---
7 Dany BROUILLETTE, Jonathan LACHAINE and Benoit VINCENT, Wages: Measurement and Key Drivers, Staff Analytical Note 2018-2, Canadian Economic Analysis Department, Bank of Canada, January 2018, 7 p.