Embed Size (px)
Citation preview
Munich Personal RePEc Archive
Wage Flexibility in Chinese Labor
Market 1989-2009
Peng, Fei and Kang, Lili
10 April 2013
Online at https://mpra.ub.uni-muenchen.de/46651/
MPRA Paper No. 46651, posted 02 May 2013 09:29 UTC

1
Wage Flexibility in Chinese Labor Market 1989-2009
Fei Peng a, b,
* Lili Kang c
a
Capital University of Economics and Business (CUEB), Jintaili #2, Hongmiao, Chaoyang District,
Beijing, 100026, P. R. China. Tel.: +86 15910863257; fax: +86 010 85996300. b
Centre for Research on the Economy and the Workplace (CREW), Birmingham Business School,
University House, Edgbaston Park Road, Birmingham, B15 2TY, UK. c Institute of Economics, School of Social Sciences, Tsinghua University, Tsinghua Yuan No. 1, Ming-Zhai,
Beijing, 100084, P. R. China. E-mail address: [email protected]
* Corresponding author. E-mail address: [email protected]
Abstract
This paper analyses wage flexibility in Chinese labor market using the China Health and
Nutrition Survey (CHNS) for the period 1989-2009. China has highly coordinated wage-
setting institutions which might contribute to higher wage sensitivity of the coordinated
workers, but lower sensitivity in the workers with coordination failures. Using micro-data
matched to local unemployment rates, we find the reaction of wages to local
unemployment varies significantly across different employee groups, suggesting
disparate wage setting institutions within China. The highly coordinated big firms and
public sector show more significant wage flexibility than the lagging small/medium firms
and private sector. Workers with characteristics of weak bargaining power also have less
flexible wages. The major wage flexibility occurred in the 1990s when the labor market
moved from a centrally-planned system to a market-oriented system. After the public
sector retrenchment, the labor market seems recover the rigidity in the 2000s. Moreover,
sensitivity test using Heckman selection model really shows significant selectivity effects,
but the Heckman adjusted results would not change our basic conclusions.
Keywords: Wage flexibility; Local unemployment; Panel data
JEL classification: J31; J64; E32; C33
Acknowledgements
The authors thank Shi Li, Janos Kollo, Mary O’Mahony, Stan Siebert, Paul Edwards, Lucy Stokes, John
Forth, Georgios Efthyvoulou, Priit Vahter and numerous seminar participants in the 3rd Annual IE-SEBA
Workshop 2012 in Beijing Normal University, the National Institute of Economics and Social Research
Workshop 2012 in London and the Management Department Seminar in the Birmingham Business School
2012 for helpful comments. Fei Peng thanks the Higher Education Funding Council for England (grant no.
ORSAS-2004005004) and Birmingham Business School (grant no. Sch437348). Lili Kang thanks the
Tsinghua Postdoctoral Supporting Plan for financial support. This research uses data from China Health
and Nutrition Survey (CHNS). We thank the National Institute of Nutrition and Food Safety, China Center
for Disease Control and Prevention, Carolina Population Center, the University of North Carolina at Chapel
Hill, the NIH (R01-HD30880, DK056350, and R01-HD38700) and the Fogarty International Center, NIH
for financial support for the CHNS data collection and analysis files from 1989 to 2006 and both parties
plus the China-Japan Friendship Hospital, Ministry of Health for support for CHNS 2009 and future
surveys. Neither the original collectors of the data nor distributors bear any responsibility for the analyses
or interpretations presented here. All remaining errors are our own.
2
Wage Flexibility in Chinese Labor Market 1989-2009
1. Introduction
The past three decades have seen an unprecedented economic growth in China. Since
the 1990s, China has dramatically switched from a centrally-planned to a market-oriented
economic system and embarked on public sector and rural-urban migration reforms. To
assess directly the extent to which China has moved towards a competitive labor market,
we need information on how workers’ wages respond to labor market conditions
(Appleton et al., 2005; Moore and Pentecost, 2006). The flexibility of the real wage rate
is considered to be an important element of labor market flexibility to adapt structural
changes of this magnitude in China. Hence, exploring the wage flexibility in Chinese
labor market has become an important issue for understanding the Chinese transition
experiences.
This paper endeavors to estimate and analyze the wage flexibility in the Chinese labor
market over the period of 1989-2009. Although how the price of labor is affected by the
market condition may be the oldest empirical question in economics, wage flexibility is
still a big challenge and an ambiguous area for academia and policy makers, especially in
a transition economy like China (Freeman, 2007). We apply the real wage adjustment
over the business cycle as proxy of wage flexibility and investigate the functioning of
local labor markets in China. Real wages being flexible to business cycle means adverse
shocks result in wage adjustments rather than unemployment hereafter. Thus, the
efficient functioning of a labor market with flexible wages can help the economy recover
from adverse shocks faster than a labor market with rigid wages (Moore and Pentecost,
2006).
China has a highly regulated and coordinated labor market which are in a volatile
marketization process and forms an instructive contrast with the more developed
economies such as the US (Devereux, 2001; Shin and Solon, 2007), the UK (Devereux
and Hart, 2006) and Germany (Peng and Siebert, 2012). In practice, China’s wage-setting
institutions are regarded as a dual system (Peng, 1992; Song, 1990). On the one hand,
employment and wage issues in China can only be correctly understood in the context of
the reform accompanied by the transition from a planned economy to a market
economy(Cai and Wang, 2010; Nee, 1996). Under the planned economic regime before
the reform, wages of all urban workers were centrally controlled by the Bureau of Labor
and Personnel through a national wage grid system, designed to reduce labor costs during
the rapid industrialization. As a result of the government control, nearly all workers were
hired by the state or collective sectors with rigid wages (Kang and Peng, 2012b) . The
official aggregated statistics show that up until the end of 1980s, the state and collective
sector hired more than 95% of the urban workers, and rural-urban migration was almost
non-existent. Neither job mobility nor wage determination had changed much from the
planned economic regime during the 1980s (Meng, 2000; Meng et al., 2013).
After the “socialist market economy” was authorized in the early 1990s, the
acceleration of marketization in the goods market brings an increase in the dispersion of
profitability within the state sector. Government granted state owned enterprises (SOEs)
an increasing degree of autonomy and a partial claim to newly generated profit as the
non-public-owned enterprises was expanded to create a competitive environment. SOEs
had the right to retain a proportion of their profits to pay bonuses to workers (Cai and
Wang, 2010). Hence, the rigid wage system in China has been gradually replaced by a
flexible wage system, as the labor market began to determine wages and employment
(Freeman, 2007; Meng and Kidd, 1997). This paper aims to shed new light on the wage
3
flexibility problem in Chinese labor market under the background of these transitional
changes.
On the other hand, wage setting institutions are highly command and market
coordinated in China (Lin, 1995), which may result in wages being more responsive to
macroeconomic shocks. It took the financial collapse of many SOEs to initiate the ice-
breaking of wage rigidity in the urban labor market. In the mid-1990s, more than 40% of
the SOEs were making losses. To vitalize the economy, the government finally made it
legal for the SOEs to adjust their wage policies and to fire unwanted workers. In 1997,
the premier Zhu Rongji’s government implemented the “zhuadafangxiao” (retain the
large, release the small) policy to keep the large SOEs and let go the small and medium
loss-making firms. The dramatic marketization transformation provided greater
autonomy to SOEs and resulted in a radical program of retrenchment within SOEs. In
1997–1998 around 12 million urban state sector workers were laid off, as more and more
workers shifted to private sector employment. By 2009, employment in the state or
collective sectors had dropped to 54%, while around 140 million rural labor force
(accounting for one-third of the urban labor force) moved to cities to work (Meng, et al.,
2013).
The survived large SOEs are much fewer in number and would be more easily to be
monitored and coordinated by the command of (central) government and more responsive
to macroeconomic shocks. The private small and medium enterprises which used to also
be state and collectively owned, would rather imitate the wage setting mechanism of their
“big brothers” than search in the market by themselves. Hence, the lagging private enterprises can follow wage adjustment of large SOEs over the business cycle. In other
words, the parties’ gains to changing wages are higher if all change, so that there is a “strategic complementarity” of wage flexibility, indicating that wage rigidity may be a result of coordination failure in wage adjustments (Ball and Romer, 1991; Peng and
Siebert, 2008).
However, during the 2000s, the new-elected Premier Wen Jiabao’s government changed the tone of marketization policy and strengthened the monopoly status of large
SOEs in the pillar industries of the national economy such as steel, petroleum, aviation,
coal and finance (“guojingmintui”, The State Advances as the Private Sector Retreats).
Large SOEs have controlled so much resource that they are trapped in the inertia of easy
money and insensitive to market changes. The private small and medium enterprises
which used to move in the tandem may fail in the coordination. The two different policy
periods may cause a structure break of wage flexibility. Meng et al. (2013) also argue that
the major changes of wage structure occurred in the 1990s when the labor market moved
from a centrally-planned system to a market-oriented system. Therefore, we provide a
factual basis for inquiry on how command and market coordination makes real wages
responsive to macroeconomic shocks over last two decades in China.
In addition, this paper stresses the heterogeneity of the wage flexibility for different
employee groups by examining the impact of labor restructuring on the wage responses
to the business cycle. Besides above labor restructuring by public-private ownership and
firm sizes, the rural–urban migration has soared in the urban China with the loosening of
administrative controls over population movements. For decades since the late 1950s, the
overall distribution of the Chinese population had been shaped by the strict policy of the
household registration (hukou) system. Liberalization of restrictions on rural–urban
migration raises the possibility of local workers with urban hukou having to compete for
work with migration workers from rural region. It will naturally arouse the questions
about and how migrants’ wages respond to the labor market condition, and whether they
are discriminated for less job chances through a rigid wage setting mechanism. The
4
impact of rural–urban migration on wage flexibility is also the contribution of this paper.
The remainder of this paper is organized as follows. In section 2, we present our
estimation methods, and in Section 3, we describe the data. Section 4 presents empirical
results by workers’ and firms’ characteristics. We also test the robustness of results by
considering selection biases. The final section concludes.
2. Estimation methods
In the empirical literature the wage flexibility has often been specified (and estimated)
as a reduced form assuming the labor market shocks (for simplicity, the changes of local
unemployment) as exogenous variables. However, if the wage flexibility is interpreted as
a structural relation, it is necessary to introduce some assumptions concerning how the
long-run market equilibrium is determined. Hence, a relation in terms of a wage equation
and a labor demand equation is necessary. Following Ammermuller et al. (2010), the
model can be written as follows:
[ ( ) ] (1a)
[ ] (1b)
where l indexes the province (R), Rl is the provincial fixed effect; W is the wage level; U
is the provincial unemployment; Z is a demand shock; and X and Y are two vectors of
control variables, that is, respectively, for the wage equation (1a) and the labor demand
equation (1b). The identification of equation (1a) can be obtained either by assuming that
only variations in Z occur (that is, idiosyncratic shocks affect only the demand), or by
using instrumental variables (IV) techniques to instrument regional unemployment.
Nijkamp and Poot (2005) summarize that less than 10% of the studies use instrumental
variables (IV) to control for endogeneity of the unemployment rate and employ OLS
directly as the estimation technique instead. In this paper, we follow the tradition of Bils
(1985) and Solon et al. (1994) to use the unemployment change of current year as the
proxy of business cycle.
Therefore, the standard decomposition of total wage growth (Devereux and Hart,
2006; Solon et al., 1997) for three provinces (l =1, 2 and 3) is:
( ) ( ) ( ) ( ) ( ) ( )
where P2 and P3 denotes the proportion of workers are in province 2 and 3, and E(ΔlnW1),
E(ΔlnW2), and E(ΔlnW3) is the expected wage growth of workers in province1, 2 and 3.
Differentiating equation (2) with respect to the change in the unemployment rate, Δu, provides a decomposition of total wage responses:
( ) ( ) ( ) ( ) ( ) ( ) ( ) ( ) ( )
( ) ( ) ( ) ( ) ( )
The first three terms are the weighted average wage response of workers in three
provinces. The last two terms represent the cyclicality of the working probability in the
provinces weighted by the wage growth of workers in province 2 and 3 relative to
5
workers in province 1 (i.e. regional wage differentials). Since the last two working
probability terms are very small, we focus on the weighted average wage responses. This
decomposition process can be extended to more than three provinces.
The traditional approach to examine labor market flexibility is to estimate a Phillips
curve as in Pentecost and Sessions (2002), or a wage curve (Blanchflower and Oswald,
1990; Card, 1995). Studies using aggregated data have concluded that real wages are at
best weakly flexible in China (Sabin, 1999; Wu, 2004). However, estimations of wage
flexibility using aggregated wage are counter-cyclically biased because changing
composition partially offsets measured wage flexibility (Bils, 1985; Solon, et al., 1994).
Low-wage persons drop out of the workforce in recessions, and they return to it in booms,
which may bring downwards biases of the estimation of wage flexibility (Heckman, 2001;
Heckman and Sedlacek, 1985). For example, more unskilled workers become employed
in expansion and pull the aggregate average wage downwards. The converse occurs in
recession. Thus, traditional aggregated statistics may exhibit “too little variability” over the business cycle.
Unfortunately, this problem has been ignored in most research on Chinese wage
behavior except only a few cases such as Appleton et al. (2005). In order to remove the
compositional biases from the wage measure, Solon et al. (1994) uses wage differencing
approach for micro panel data. Following the same vein, we specify wage equations and
empirically estimate the links between individual wages and provincial unemployment
rates. Our estimations use a micro panel data and consider the composition biases of
measures of wage adjustment over the business cycle. Hence, we use the differencing
approach on each panel workers’ wages to remove the composition biases of aggregated
data of wages.
Moreover, we match the micro panel data of real wage movements in the China Health
and Nutrition Survey (CHNS) to local unemployment rates. Blanchflower and Oswald
(2005) argue that with segmented local labor markets, economic shocks to one province
mainly have an impact on the level of local wages, leading to a negative relationship
between wages and unemployment “within” provinces. Empirical estimates are usually
based on highly disaggregated data in order to control for heterogeneity in provincial
labor markets both in terms of workers’ (that is, gender, age, education, marital status etc.)
and firms’ characteristics (that is, firm size, sector, location in urban and rural regions
etc.). However, the unemployment rate usually refers to the region where individuals
work (or firms are located). The use of variables at different levels of disaggregation may
lead to biased estimates if all the individuals who work in the same province share some
common factors. Moulton (1986) shows that individuals in the same year/province will
share some common component of variance that is not entirely attributable either to their
measured characteristics (e.g., age) or to the local unemployment rate in that year.
Therefore, the standard error of the coefficient of the unemployment variable would be
underestimated in an Ordinary Least Square (OLS) regression (Shin, 1994). From a
statistical point of view, this can overestimate the importance of provincial
unemployment in influencing individual wages (Moulton, 1986; Moulton, 1990).
To tackle this Moulton problem, a two-step procedure has been used by Solon et al.
(1994) and Blanchard and Katz (1997). In the first step, individual wages are regressed
on personal characteristics and on province*year fixed effects, which are used as proxies
for the wages at province level. Once these are estimated, they are regressed against
provincial unemployment over time, as well as province and year fixed effects. The latter
variables are needed in order to seize all permanent components of the relationship
between wages and unemployment and leave only the transitory components to the
unemployment coefficients (García-Mainar and Montuenga-Gómez, 2003). In step 1, we
6
estimate a wage difference equation using individual data. This equation is given by:
∑ ∑
( )
where wilt is real hourly wages of individual i in province l (l= Guangxi, ..., Shandong)
and year t (t = 1991, ..., 2009), and s equals 2, 3 or 4 according to whether the most recent
interview before the year t interview was two, three or four years earlier. Ageilt is a cubic
in age, Rl denotes province dummy variables, Yt denotes year dummy variables and ilt is
a random error term. This step gives us a panel data of wage changes for the workers in
province l and between t and t-s, that is, αlt.
In step 2, we derive estimates of the wage flexibility of workers by regressing αlt on
the unemployment change variable at provincial level (ΔUlt), with provincial fixed effects
(Rl) and time dummies (Yt). This equation is given by:
( )
In this step, we only have time series variation for each province, reducing the number of
observations – in our case 7 waves of 9 provinces (actually only 58 observations in the
step 2 as the wage data of Liaoning are missing in 1997, Heilongjiang missing in 1989,
1991 and 1993). We use weighted least squares where the weights are the numbers of
individuals observed in each province and year as we described in equation (3). Our data
cover more than one full business cycle in China and can reflect the wage flexibility
situations over the last two decades of labor market reform.
3. Data Description
The main data used in this paper are the eight waves (1989, 1991, 1993, 1997, 2000,
2004, 2006 and 2009) of the China Health and Nutrition Survey (CHNS), which employ
a multistage random-cluster sampling process to draw households from nine provinces
(Guangxi, Guizhou, Heilongjiang, Henan, Hubei, Hunan, Jiangsu, Liaoning, and
Shandong). We have two samples of micro data at individual level:
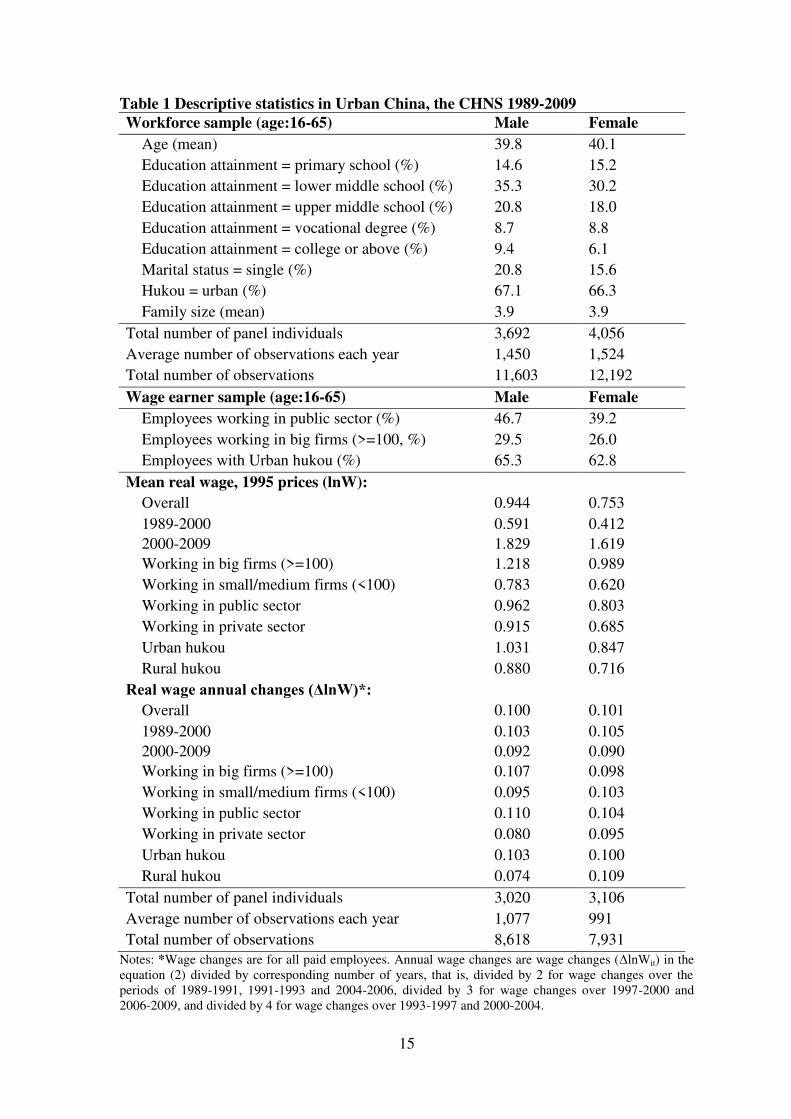
1) Work force sample, including all people aged 16-65 residing in the urban region1.
Descriptive statistics of an unbalanced panel of 7,748 individuals (3,692 males and 4,056
females) are presented in the top panel of Table 1. Total observation number is 23,795
including 11, 603 males and 12,192 females. The average length of time series of panel
unit is about 3 waves. Females in the urban workforce are a little older (40.1 years) than
males (39.8 years), while males have higher educational attainment than females. 20.8%
males and 15.6% females have never been married in the workforce sample. About 66-67%
residents in the urban region have the urban hukou, so one third urban residents are
migrants from the rural region which is consistent with the findings in Meng et al. (2013).
The average family size is 4 persons in urban region which may be a typical Chinese
household including two parents and two children;
1 In this paper, we focus on the non-agricultural residents in the urban region because the official
unemployment rates in the rural region are not available. Residential region is different from the household
registration (hukou). Since the early 1950s, China implemented a household registration (hukou) system
connected with the social welfare system, whereby individuals born in a city are given an urban hukou, and
those who were born in countryside are given a rural hukou. Individuals with rural hukou cannot benefit
from the urban welfare system, even though they might work and reside in cities (Meng, et al., 2013).
7
2) Wagers sample, including all wage earning employees in the urban region. We
exclude self-employed workers and owners of private or individual enterprises because it
is difficult to separate their wages from profit income. Descriptive statistics of an
unbalanced panel of 6,126 individuals (3,020 males and 3,106 females) are presented in
the bottom panel of Table 1. Total observation number is 16,549 including 8,618 males
and 7,931 females. The average length of time series of panel unit is about 2.7 waves.
Male employees have more chances to work in public sector and big firms (100
employees+) than females2. Both male and female wage earners have lower proportions
of urban hukou than the work force, suggesting higher labor market participation of rural-
urban migrants than local people.
(Table 1 around here)
The wage variable used here is the real hourly wage in 1995 prices, which is real
annual earnings divided by annual total working hours. Nominal annual earnings,
including regular wages, subsidies and bonuses from the employer3, are converted into
real annual earnings using corresponding deflators of provincial urban Consumer Price
Index (CPI), provided by the National Bureau of Statistics of China (NBSC). Male
employees earn about 19% (=0.944-0.753) more than females over the entire period.
Actually, the wages grow so fast that the wage levels of both males and females in the
2000s are about 120% higher than 10 years ago, which brings larger gender gap in the
2000s than in the 1990s. The gender gap, however, is narrower in the small/medium
firms than in the big firms, as well as narrower in the public sector than in the private
sector. We find that the wage premium of working in big firms is larger for males
(43.5%=1.218-0.783) than for females (36.9%=0.989-0.62). Situation flips in the firms
with different ownership, as the wage premium of working in the public sector is larger
for females (11.8%=0.803-0.685) than for males (only 4.7%=0.962-0.915). Urban hukou
also brings about 15% wage premiums for both males and females. Therefore, a job in a
large firm is more important for males in urban China, while a job in the public sector is
more important for females. Urban hukou is equally important for both males and females.
The dramatic changing wage structure suggests a segmented labor market and strong
selection of jobs.
When it comes to the annual growth rates of wages (defined as wage changes between
two consecutive waves divided by corresponding number of years), most groups shows
very similar growth rate of wages (about 10% per year) over the last two decades, during
which the 2000s years saw a little slower speed of wage growth than that in the 1990s.
Wages of males in the public sector (11% per year) grow much faster than males working
in private sector (only 8% per year) and males without urban hukou (the least growth rate
7.4% per year). However, we do not find the similar disadvantages of working in the
private sector or migration status for females. The privatization and urbanization reform
seems to favor females rather than males. Thus, in both sense of level and growth rate
there is great wage disparity among employee groups by gender, firm ownership, firm
size and urban/rural regions. The wage structure and its evolution over the period 1989-
2009 need further exploration on the wage responses to labor market conditions.
2 The public sector includes all civil servants and employees in the SOEs, as the private sector includes all
employees in the private and collective enterprises. Since 1990, China appears to be evolving towards a
standard mixed economy with a sizeable public sector and a vibrant private sector (Appleton, et al., 2005). 3 Kang and Peng (2012a) find the wage cyclicality in urban China is mainly from the bonus and subsidy
components of gross wages. We focus on the average hourly rate including all basic salary, bonus and
subsidy components in this paper.
8
For the macro data of business cycle, we splice the Chinese National Labor Statistics
Yearbook 1994-2009 and Chinese National Statistics Yearbook 1993-2009 to develop an
unemployment dataset corresponding to the CHNS at provincial level. This urban
registered unemployment rates may be the only official information sources of
unemployment data at the provincial level over the period 1989-2009. Hence, they are
used as our cyclical indicator of local labor market. The geographic location of the
provinces covered by the CHNS can be broadly categorized into four regions for
simplicity: Northeast (Heilongjiang and Liaoning), Coastal (Jiangsu and Shandong),
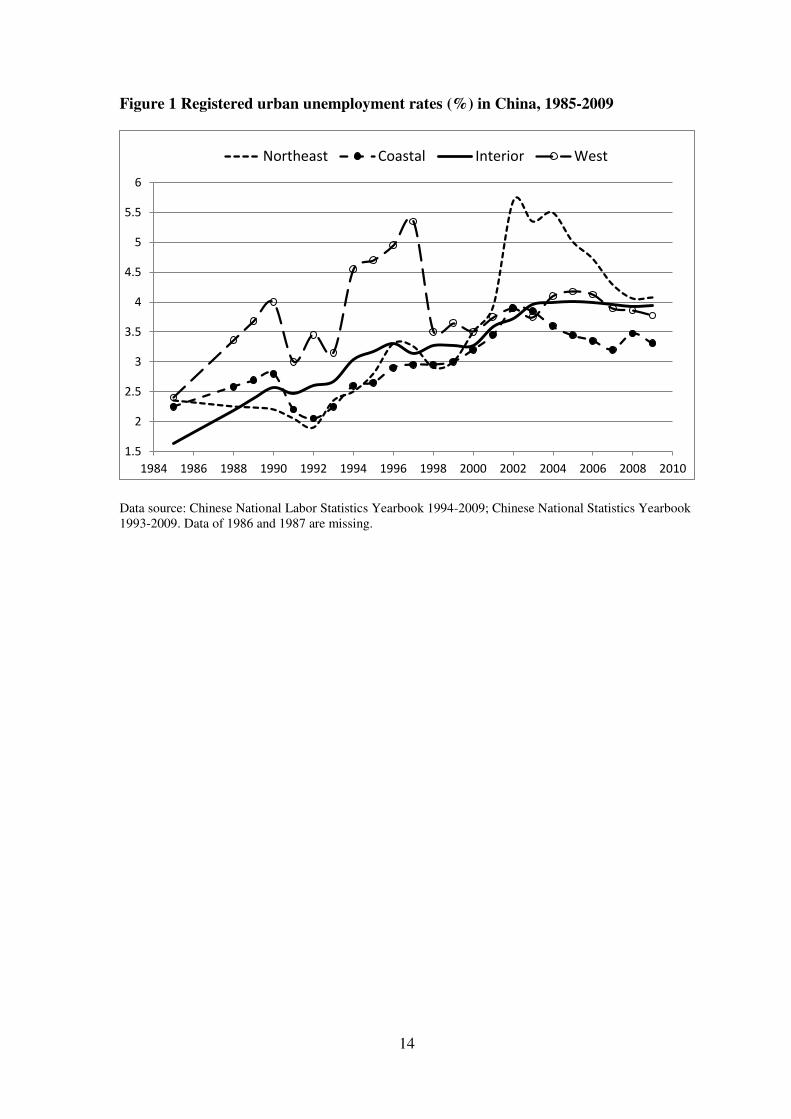
Interior (Henan, Hubei and Hunan) and West (Guangxi and Guizhou). Figure 1 presents
the regional unemployment rates since 1985. We can find the unemployment rates were
as low as around 2% at the middle of the 1980s for all four regions. After that, the
unemployment rates have been increasing over the entire period and doubled to around 4%
in 2009, reflecting the transition process of a labor market after the 1970s.
Moreover, there are very different variation patterns across regions. The less
developed Western provinces (Guangxi and Guizhou) have much higher and more
volatile unemployment rates than other regions before the 2000s, which arrive at the
summit of 5.4% in 1997. However, the unemployment of the Northeast (Heilongjiang
and Liaoning) dramatically increased after 1992 and peaked 5.7% in 2002. It is consistent
with the reform of the SOEs and the shift in industrial structure out of heavy industry
over the period of 1992-2002 (Appleton, et al., 2005), which affected the old
industrialized provinces in the Northeast more than others. As expected, the most
developed Coastal provinces (Jiangsu and Shandong) have the lowest unemployment
rates after 2002.
(Figure 1 around here)
Cai and Wang (2010) argue that the Chinese reform, without a clear blueprint from the
beginning, was initiated and carried out to solve urgent problems in the economic system
and to seek instant welfare gain. Hence, the reform progress is characterized by the
gradual approach of “crossing the river by feeling the stones” (Appleton, et al., 2005).
Meanwhile, while the reform, by and large, advances in a gradual and incremental
manner, it also takes relatively radical measures in certain regions and at certain stages
from time to time. The choices of forms and measures in the reform process depend on
adaptability of different components of the economic system and on how much the
society is capable of adapting itself to the reform.
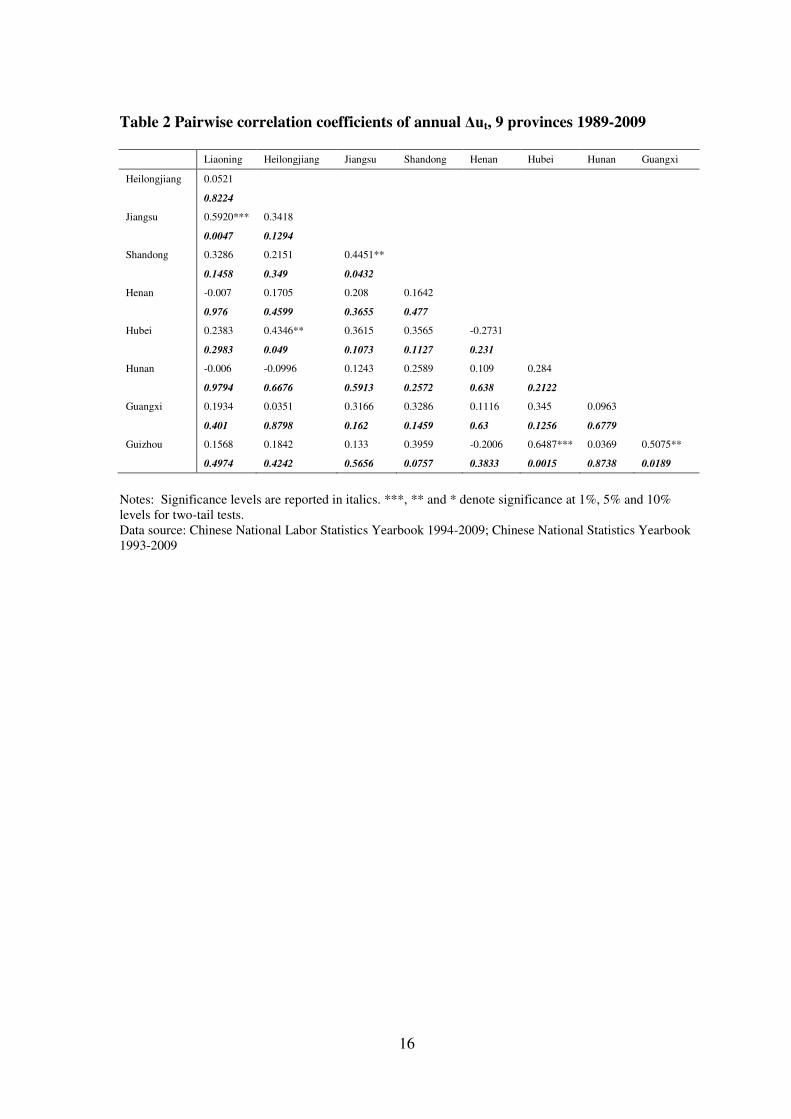
In order to test the gradual and spontaneous characteristics of labor market reform,
Table 2 displays the pairwise correlation coefficients of annual unemployment changes at
provincial level. Except a few cases, for example, within the Coastal (Jiangsu and
Shandong, 0.4451**) and the West (Guangxi and Guizhou, 0.5075**), there is no
significant correlation between provincial unemployment changes. The local labor
markets seem quite segmented and isolated each other. The provincial governments could
have taken different experiments for economic development according to their
comparative advantages and disadvantages over last two decades. Hence, local labor
markets may experience different reform paths as the changes of provincial
unemployment are not coordinated or controlled by central government. These disparate
patterns of unemployment alleviate our concern on that the unemployment volatility in
China could have been “damped” by active labor market policies of central or provincial
governments (Nickell, 1997). Therefore, the changes of unemployment are likely to
reflect true volatility of Chinese local labor markets.
9
(Table 2 around here)
4. Empirical results
4.1 Basic results
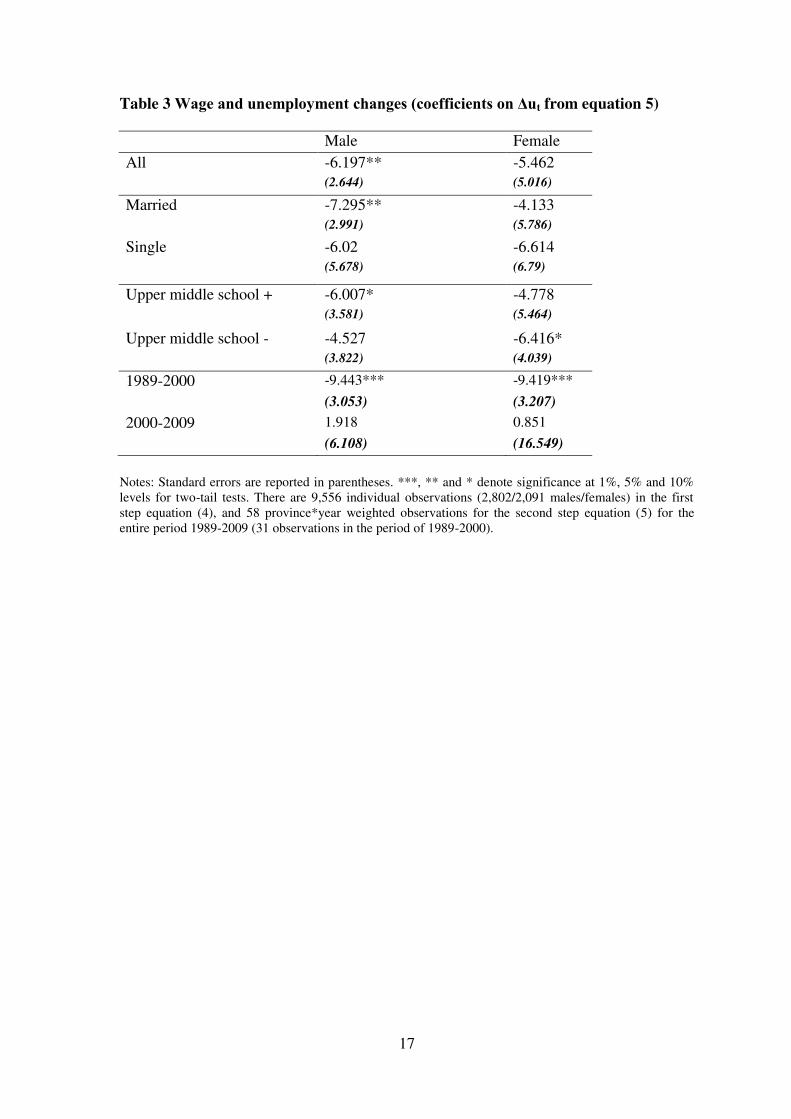
The OLS two step results for the unemployment change coefficients from equation (5)
are reported in Table 3. The estimated wage response to unemployment is significantly
negative for urban males. One point increase of the local unemployment rate could
decrease the real wages of males by 6.197%. Wage response to unemployment is also
negative for females, but not significant. A flexible wage setting mechanism can drop
wages as the labor market become worse, vice versa, which show a negative association
between wage and unemployment and is regarded as a good institutional arrangement for
economic growth and stability. Our results are consistent with a flexible labor market in
the transition process.
Moreover, we differentiate estimation by employees’ marital status (married and single) and education levels (upper middle school and above, and below higher school),
and find markedly difference among sub-labor markets. Married and higher educated
male workers still show significant wage flexibility. One point increase of the local
unemployment rate could decrease the real wages of married (high educated) males by
7.295% (6.007%). Marriage and higher education mean better bargaining strategy and
market information, so that easier to be coordinated to flexible wages by government and
keep their jobs over the bad time.
A little surprising result is that urban female workers with lower education level
(under Upper middle school) rather than higher education have flexible wages. One point
increase of the local unemployment rate could decrease the real wages of unskilled
females by 6.416%, but insignificant for high skilled females. O’Mahony and Peng (2008)
find similar results in European countries that unskilled females in services are
complementary to information and communication technology (ICT) hence have
advantages in wage bargaining as a whole. If we consider those female-dominant
industries such as hospitality, nurses, primary education, community caring and other
services, unskilled females may have better bargaining strategy on jobs and wages as an
industry or professional organization. Thus, it is highly possible for unskilled females to
have flexible wages and try to keep their jobs over the business cycle. On the contrary,
skilled females may be vulnerable as the time is bad because they could not change their
wages.
(Table 3 around here)
For other groups of workers, we cannot find wage flexibility maybe because of their
weak bargaining power and coordination failures. Time period division shows the wage
flexibility is mainly from the dramatic reforms of labor market in the 1990s for both
males and females. However, in the 2000s, the labor market recovers the rigidity which is
consistent with the renationalization process of the Premier Wen Jiabao’s government.
4.2 Labor Restructuring
4.2.1 Firm size
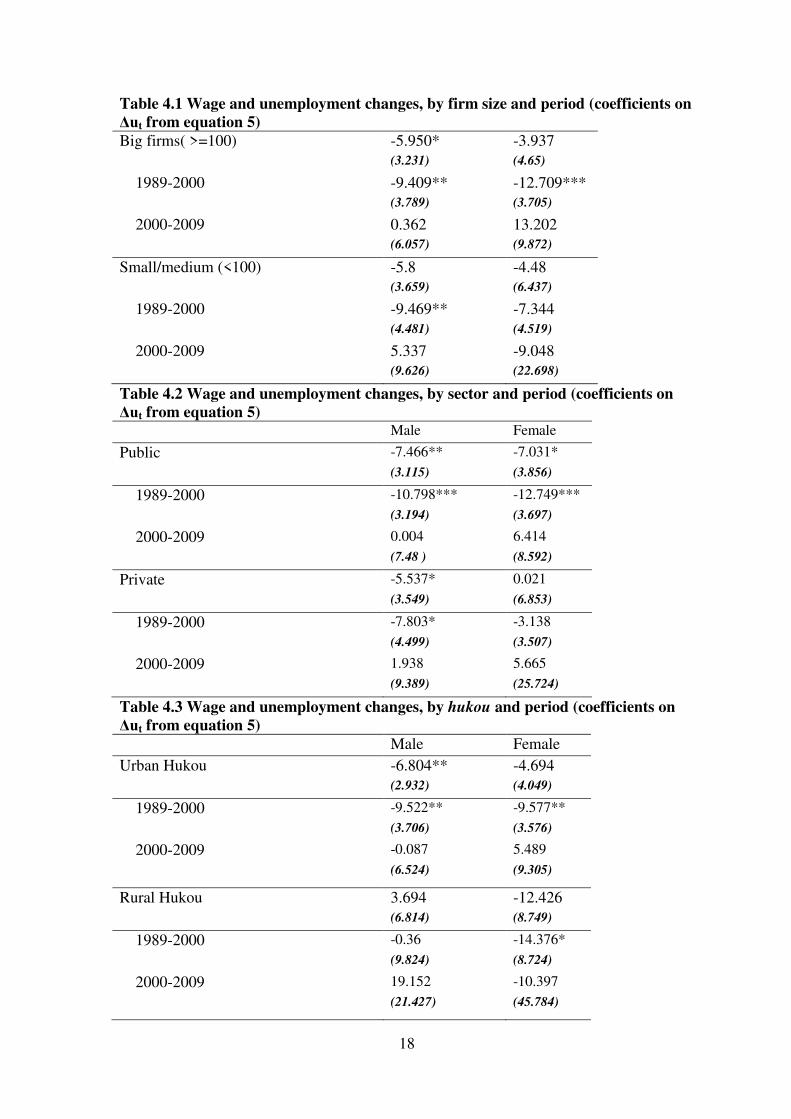
We estimate the wage flexibility by firm size and time period in Table 4.1. Males in
big firms have flexible wage. One point increase of the local unemployment rate could
10
decrease the real wages of males in big firms by 5.95%. Males in small/medium firms
also have right sign and are close to be significant. Females have no flexible wages in
either big or small/medium firms. When we come to the two-period division, wage
responses of both males and females to local unemployment are negative and significant
during the 1990s, except the females in small/medium firms (-7.344%) being very close
to be significant. For the 2000s, no one is significant. It is consistent with a coordinated
labor market in the transition process.
First of all, most big firms are public-owned before the 1990s and only have rigid
wages. While various reform measures had been introduced to increase labor flexibility,
the dismissal of state employees remained an exception up until the early 1990s. The
retrenchment of during the 1990s enforces the big firms wage to be flexible to keep their
jobs. The highly coordinated big firms may show sensitive wages to the labor market
conditions. Second, in the mid-1990s, a radical ownership reform program was launched,
under which state ownership was to be maintained only among large SOEs; small- and
medium-sized SOEs were to be restructured through privatization, mergers, and
bankruptcies (Xu et al., 2005). In late 1997, the “zhuadafangxiao” policy strengthens the
central control and command coordination of the big firms, but let the small/medium
firms operate in a market coordination process. The large-scale labor retrenchment
program attempts to reverse the money-losing trends of the SOE sector. Our results show
this policy has been once very successful to get the wage flexibility for all workers. The
wages in the 1990s are very sensitive to labor market conditions. However, during the
2000s, the “guojingmintui” policy allows more space for big firms to maintain and
strengthen their monopoly position and keep their rigid wages. Thereafter, the command
coordination of big firms and market coordination of small/medium firms just
dysfunction.
4.2.2 Ownership restructuring
Given China’s unique experience in labor restructuring, an analysis of China’s wage flexibility in the public sector downsizing process should generate valuable insights for
the ongoing policy debates over how to best restructure public enterprises. We
differentiate estimation by firm ownership and time periods in Table 4.2. The wage
flexibility in Chinese labor market is mainly from the public sector. For males in the
public sector, one point increase of the local unemployment rate could decrease the real
wages by 7.466% (and very significant), but only 5.537% (and less significant) in the
private sector. Females in the public sector also show significantly flexible wages (-
7.031%) but not in the private sector, which is very strong evidence of coordination.
Similarly, we find wage flexibility for both males and females in the 1990s, except the
females in the private sector which have the right sign but insignificant.
The reform program termed “activating the system of permanent employment” initiated in 1987 touched upon the core system of the “iron rice bowl” and began revising
the legacy of traditional labor policies under the planning system (Cai and Wang, 2010).
The retrenchment of public sector employment is one of the most important reform
programs, especially when the rigid wage setting under central planning had created
severe labor redundancy and skill mismatch. The removal of wage rigidity in the
developing labor market is imperative for Chinese economic restructuring. Hence, the
reform aiming at ‘‘breaking up the iron-rice-bowl” has been quite successful in the public
sector during the 1990s and made good progress in developing a flexible wage setting
mechanism. However, the renationalization in the 2000s recovers the rigidity of wage
setting mechanism in the labor markets. Both males and females in the public or private
11
sector lose their wage flexibility in recent years, which may bring more systematic risk
for employment and decrease the efficiency of the whole labor market.
(Table 4 around here)
4.2.3 Rural-Urban migration
Rural-urban migrants are regarded as second-class workers in urban China (Démurger
et al., 2009). The main institutional barrier to mobility was the household registration
(hukou) system excluding the workers without urban hukou from the urban welfare
system, which provided residents with urban hukou with food ration, housing, medical
care, education, childcare, and pension, and also has access to desirable positions in the
labor market (Wang and Moffatt, 2008). This system made it practically very difficult, if
not impossible for rural hukou holders to survive in cities. The reform of SOEs makes
competition between urban unemployed and rural migrants harder, which was further
reinforced by administrative regulations against rural migrants. Several city governments
had implemented local regulations to restrict rural migrants’ employment and even forced enterprises to lay off migrant workers in favor of urban local workers. Hence, hukou
policy which causes employment and wage distortions is regarded as an inefficient
institutional factor in Chinese labor market (Chan and Zhang, 1999).
In Table 4.3, we find evidence of disadvantages of rural hukou in flexible wage setting.
One point increase of the local unemployment rate could decrease the real hourly wage of
local males (with urban hukou) by 6.804%. For those male migrants (working in the
urban region but without urban hukou), however, their wages are totally rigid. Workers
with urban hukou obviously have more power to bargain their wages and jobs, and more
easily to be coordinated for flexible wages. Hence, these incumbent male workers are
more likely to retain their jobs in face of adverse shock of business cycle. For local
females, the wage responses to local labor market have right signs, but insignificant. As
the dramatic reform of the 1990s is concerned, both local males (-9.522) and females (-
9.577) with urban hukou can have very flexible wage during this period, while only
female migrants have flexible wages. During the 2000s, everyone’s wage becomes rigid
and easily to be fired.
Therefore, hukou status does matter in workers’ wage flexibility, and then whether they can retain their jobs in the time of bad. That is, urban hukou leads to better
bargaining position for their contract on job and wages. They may have pro-cyclical and
flexible wages to help their employers, so they can survive the recession of business
cycle and benefit in the prosperity. Male migrants have rigid wages over the two periods,
obviously the most vulnerable group to be fired in time of bad.
4.3 Selectivity
We consider the possible selection biases in above wage differencing approach of real
wage flexibility using micro panel data. Hence, we examine the relation between workers’ characteristics (age, education and marital status etc.), province*year dummies and the
probability of employment in two consecutive waves by testing vector of coefficients γ in
the probit estimates of the selection equation:
( ) ( ) (6)
12
Probability of employed in two consecutive waves is given by cubic age, 5 education
dummies, marital status, urban/rural hukou, family size and all province*year dummies
(Xit). Residual errors of two equations (4) and (6) follow normal distribution with mean 0
and standard deviations of σ and 1, and are correlated each other: u1 ~ N(0; σ); u2 ~ N(0; 1); corr(u1; u2) = ρ. When ρ ≠ 0, standard regression techniques applied to equation (4)
yield biased results.
From these estimates, the non-selection hazard—what Heckman (1979) referred to as
the inverse of the Mills’ ratio, mit —for each observation is computed as ( ) ( ), where φ is the normal density. The parameter estimates of equation (2) are obtained by
augmenting the regression equation with the non-selection hazard mit, and we obtain the
additional parameter estimate on the variable containing the non-selection hazard. And
then, we test regression estimates using the non-selection hazard (Heckman, 1979).
Selectivity effect λ (=ρσ) is tested to justify the Heckman selection model.
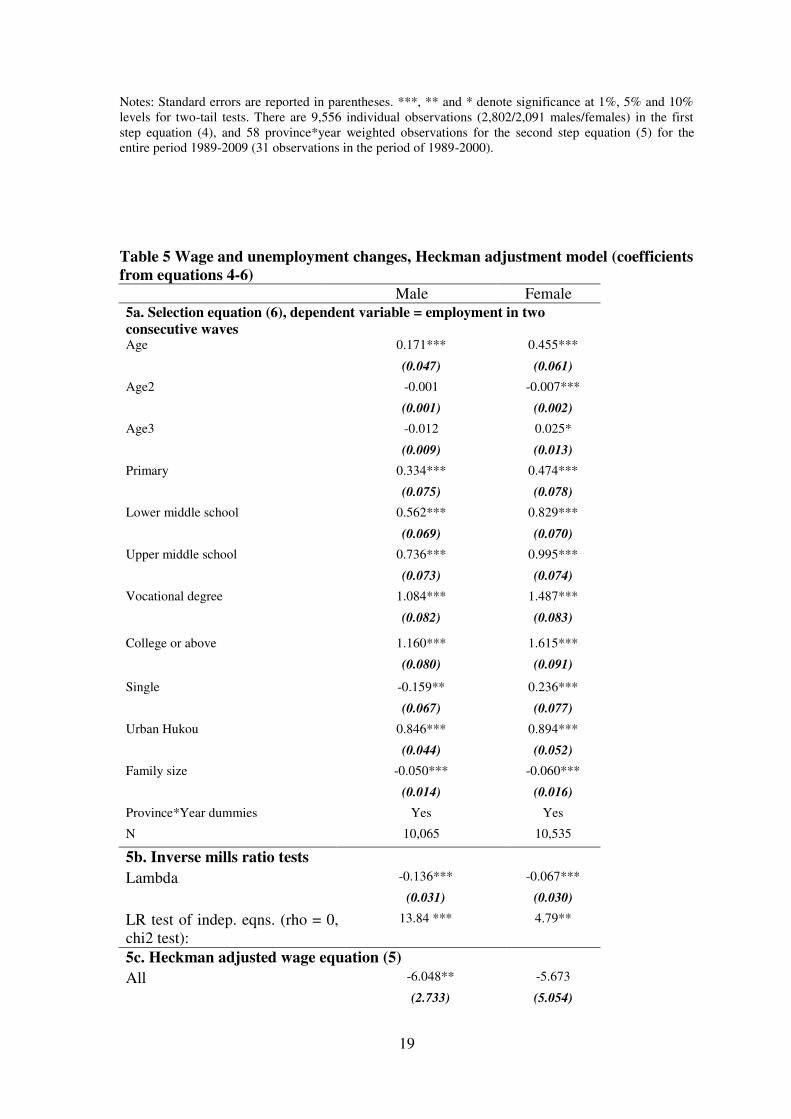
Table 5 shows a sensitivity test on wage and unemployment changes after the
Heckman adjustment. The top panel presents the results of selection equation (6). We can
see that elder workers are more likely to be employed in two consecutive waves,
especially for females. Workers with higher education have more possibility to be
employed for longer time. As for age, education levels have more prominent effects on
female workers’ working chances. Married males and single females are more likely to
be employed. Urban hukou can increase the employment chance dramatically. Hence, as
many authors such as Wang and Moffatt (2008) points out, urban hukou reflects the
advantages on social welfare and better job chances. Finally, the larger is family, the
lower possibility to be hired. It may just reflect the family background is bad for
education and jobs, as poor family is more likely to have more children and large family
size.
The middle panel is the test for selectivity effect. From the inverse mills ratio tests, the
selection biases exist for both males and females. Likelihood-ratio (LR) chi2 test for
independence of selection and wage equation show similar results that these two
equations are significantly correlated. Hence, the Heckman adjustment is necessary for
males and females. The bottom panel of Table 5 presents the Heckman adjusted results,
in which wage flexibility does not change its pattern. Only male workers in the urban
region have flexible wages. One point increase of the local unemployment rate could
decrease the real hourly wage by 6.048% which is a little less than the OLS results in
Table 3. Wage flexibility for females is still insignificant. These insignificant results are
also a little smaller than OLS results. After we divide the sample into two periods, both
males and females have flexible wages during the 1990s while they recover the rigid
system during the 2000s. Hence, we find selection biases of OLS results, but would not
change our basic results. We can conclude our results are robust after Heckman
adjustment.
5. Conclusions
In this paper we examine the wage flexibility in Chinese labor market during a period
of unprecedented economic growth and significant institutional changes. Rigid wages can
neither help workers keep their jobs as the local labor market is tight, nor get more
benefit of economic growth as the local labor market is loose. The rising share of workers
employed in the private sector and competition from the rural-urban migration increase
the extent to which pay is determined by market-based economic returns. With the
13
emergence of a mixed economy and dramatic urbanization process, China’s urban labor market is supposed to be evolving towards a competitive market similar to those found in
OECD countries. Actually, from our study, wage flexibility in Chinese labor market
distinguish itself from the Engel-American model based on the individual bargaining, and
the European continent model based on the collective bargaining.
Wage flexibility could be achieved by efficient bargaining on wage and job at either
individual or collective level. Based on the privatization and urbanization reform of the
last two decades, we estimate the effects of labor restructuring on wage flexibility. We
find flexible wages are associated with the firm and employee characteristics of
coordination and bargaining power in wage setting mechanism. Real wages are flexible
in the public sector with a successful process of command and market coordination, while
the lagging private sector is unable to catch up with the changes. Employee groups with
disadvantageous bargaining positions and coordination failures have rigid wages and
easily to be laid off. These findings reveal a highly coordinated labor market in a
transitional economy. Thus, wage flexibility in Chinese labor market is different from the
individual bargaining paradigm of the USA and UK, in which private sector and small
firms are closer to the market and have more flexible wages (Devereux, 2001; Devereux
and Hart, 2006; Shin and Solon, 2007).
On the other hand, without independent and centralized trade union, wage flexibility
in Chinese labor market is not completely same as corporatism countries such as
Germany and Italy either, even though the more flexible wages are also found in the
highly coordinated public section in these countries (Peng and Siebert, 2008; Peng and
Siebert, 2012). Our analysis indicates that as the economy transformed from a system
where wages were administratively determined to a market-based system, the highly
command and market coordination can achieve a flexible labor market for a short term, if
we neglect those female, young, unskilled, migration workers with weak bargaining
power and coordination failure. However, the success of command and market
coordination in China is actually from the powerful privatization policy during the 1990s,
which cannot last without a formal collective bargaining and coordination system.
When the wind changes the direction, the renationalization process recovers the wage
rigidity sooner than we thought. Thereafter, the command coordination of big and public
firms and market coordination of small/medium and private firms just become loose in
recent years. As the gradual and incremental characters of reform are concerned, China
seems still in the middle of river leading to a competitive and efficient labor market
similar to the OECD countries. Studies based on more accurate industry and employment
movement analysis (Devereux and Hart, 2006; Heckman and Sedlacek, 1985) is
demanded for the future research on the wage flexibility in Chinese labor market.
14
Figure 1 Registered urban unemployment rates (%) in China, 1985-2009
Data source: Chinese National Labor Statistics Yearbook 1994-2009; Chinese National Statistics Yearbook
1993-2009. Data of 1986 and 1987 are missing.
1.5
2
2.5
3
3.5
4
4.5
5
5.5
6
1984 1986 1988 1990 1992 1994 1996 1998 2000 2002 2004 2006 2008 2010
Northeast Coastal Interior West
15
Table 1 Descriptive statistics in Urban China, the CHNS 1989-2009
Workforce sample (age:16-65) Male Female
Age (mean) 39.8 40.1
Education attainment = primary school (%) 14.6 15.2
Education attainment = lower middle school (%) 35.3 30.2
Education attainment = upper middle school (%) 20.8 18.0
Education attainment = vocational degree (%) 8.7 8.8
Education attainment = college or above (%) 9.4 6.1
Marital status = single (%) 20.8 15.6
Hukou = urban (%) 67.1 66.3
Family size (mean) 3.9 3.9
Total number of panel individuals 3,692 4,056
Average number of observations each year 1,450 1,524
Total number of observations 11,603 12,192
Wage earner sample (age:16-65) Male Female
Employees working in public sector (%) 46.7 39.2
Employees working in big firms (>=100, %) 29.5 26.0
Employees with Urban hukou (%) 65.3 62.8
Mean real wage, 1995 prices (lnW):
Overall 0.944 0.753
1989-2000 0.591 0.412
2000-2009 1.829 1.619
Working in big firms (>=100) 1.218 0.989
Working in small/medium firms (<100) 0.783 0.620
Working in public sector 0.962 0.803
Working in private sector 0.915 0.685
Urban hukou 1.031 0.847
Rural hukou 0.880 0.716
Real wage annual changes (ΔlnW)*:
Overall 0.100 0.101
1989-2000 0.103 0.105
2000-2009 0.092 0.090
Working in big firms (>=100) 0.107 0.098
Working in small/medium firms (<100) 0.095 0.103
Working in public sector 0.110 0.104
Working in private sector 0.080 0.095
Urban hukou 0.103 0.100
Rural hukou 0.074 0.109
Total number of panel individuals 3,020 3,106
Average number of observations each year 1,077 991
Total number of observations 8,618 7,931
Notes: *Wage changes are for all paid employees. Annual wage changes are wage changes (ΔlnWit) in the
equation (2) divided by corresponding number of years, that is, divided by 2 for wage changes over the
periods of 1989-1991, 1991-1993 and 2004-2006, divided by 3 for wage changes over 1997-2000 and
2006-2009, and divided by 4 for wage changes over 1993-1997 and 2000-2004.
16
Table 2 Pairwise correlation coefficients of annual Δut, 9 provinces 1989-2009
Liaoning Heilongjiang Jiangsu Shandong Henan Hubei Hunan Guangxi
Heilongjiang 0.0521
0.8224
Jiangsu 0.5920*** 0.3418
0.0047 0.1294
Shandong 0.3286 0.2151 0.4451**
0.1458 0.349 0.0432
Henan -0.007 0.1705 0.208 0.1642
0.976 0.4599 0.3655 0.477
Hubei 0.2383 0.4346** 0.3615 0.3565 -0.2731
0.2983 0.049 0.1073 0.1127 0.231
Hunan -0.006 -0.0996 0.1243 0.2589 0.109 0.284
0.9794 0.6676 0.5913 0.2572 0.638 0.2122
Guangxi 0.1934 0.0351 0.3166 0.3286 0.1116 0.345 0.0963
0.401 0.8798 0.162 0.1459 0.63 0.1256 0.6779
Guizhou 0.1568 0.1842 0.133 0.3959 -0.2006 0.6487*** 0.0369 0.5075**
0.4974 0.4242 0.5656 0.0757 0.3833 0.0015 0.8738 0.0189
Notes: Significance levels are reported in italics. ***, ** and * denote significance at 1%, 5% and 10%
levels for two-tail tests.
Data source: Chinese National Labor Statistics Yearbook 1994-2009; Chinese National Statistics Yearbook
1993-2009
17
Table 3 Wage and unemployment changes (coefficients on Δut from equation 5)
Male Female
All -6.197** -5.462
(2.644) (5.016)
Married -7.295** -4.133
(2.991) (5.786)
Single -6.02 -6.614
(5.678) (6.79)
Upper middle school + -6.007* -4.778
(3.581) (5.464)
Upper middle school - -4.527 -6.416*
(3.822) (4.039)
1989-2000 -9.443*** -9.419***
(3.053) (3.207)
2000-2009 1.918 0.851
(6.108) (16.549)
Notes: Standard errors are reported in parentheses. ***, ** and * denote significance at 1%, 5% and 10%
levels for two-tail tests. There are 9,556 individual observations (2,802/2,091 males/females) in the first
step equation (4), and 58 province*year weighted observations for the second step equation (5) for the
entire period 1989-2009 (31 observations in the period of 1989-2000).
18
Table 4.1 Wage and unemployment changes, by firm size and period (coefficients on
Δut from equation 5)
Big firms( >=100) -5.950* -3.937
(3.231) (4.65)
1989-2000 -9.409** -12.709***
(3.789) (3.705)
2000-2009 0.362 13.202
(6.057) (9.872)
Small/medium (<100) -5.8 -4.48
(3.659) (6.437)
1989-2000 -9.469** -7.344
(4.481) (4.519)
2000-2009 5.337 -9.048
(9.626) (22.698)
Table 4.2 Wage and unemployment changes, by sector and period (coefficients on
Δut from equation 5) Male Female
Public -7.466** -7.031*
(3.115) (3.856)
1989-2000 -10.798*** -12.749***
(3.194) (3.697)
2000-2009 0.004 6.414
(7.48 ) (8.592)
Private -5.537* 0.021
(3.549) (6.853)
1989-2000 -7.803* -3.138
(4.499) (3.507)
2000-2009 1.938 5.665
(9.389) (25.724)
Table 4.3 Wage and unemployment changes, by hukou and period (coefficients on
Δut from equation 5)
Male Female
Urban Hukou -6.804** -4.694
(2.932) (4.049)
1989-2000 -9.522** -9.577**
(3.706) (3.576)
2000-2009 -0.087 5.489
(6.524) (9.305)
Rural Hukou 3.694 -12.426
(6.814) (8.749)
1989-2000 -0.36 -14.376*
(9.824) (8.724)
2000-2009 19.152 -10.397
(21.427) (45.784)
19
Notes: Standard errors are reported in parentheses. ***, ** and * denote significance at 1%, 5% and 10%
levels for two-tail tests. There are 9,556 individual observations (2,802/2,091 males/females) in the first
step equation (4), and 58 province*year weighted observations for the second step equation (5) for the
entire period 1989-2009 (31 observations in the period of 1989-2000).
Table 5 Wage and unemployment changes, Heckman adjustment model (coefficients
from equations 4-6)
Male Female
5a. Selection equation (6), dependent variable = employment in two
consecutive waves Age 0.171*** 0.455***
(0.047) (0.061)
Age2 -0.001 -0.007***
(0.001) (0.002)
Age3 -0.012 0.025*
(0.009) (0.013)
Primary 0.334*** 0.474***
(0.075) (0.078)
Lower middle school 0.562*** 0.829***
(0.069) (0.070)
Upper middle school 0.736*** 0.995***
(0.073) (0.074)
Vocational degree 1.084*** 1.487***
(0.082) (0.083)
College or above 1.160*** 1.615***
(0.080) (0.091)
Single -0.159** 0.236***
(0.067) (0.077)
Urban Hukou 0.846*** 0.894***
(0.044) (0.052)
Family size -0.050*** -0.060***
(0.014) (0.016)
Province*Year dummies Yes Yes
N 10,065 10,535
5b. Inverse mills ratio tests
Lambda -0.136*** -0.067***
(0.031) (0.030)
LR test of indep. eqns. (rho = 0,
chi2 test):
13.84 *** 4.79**
5c. Heckman adjusted wage equation (5)
All -6.048** -5.673
(2.733) (5.054)
20
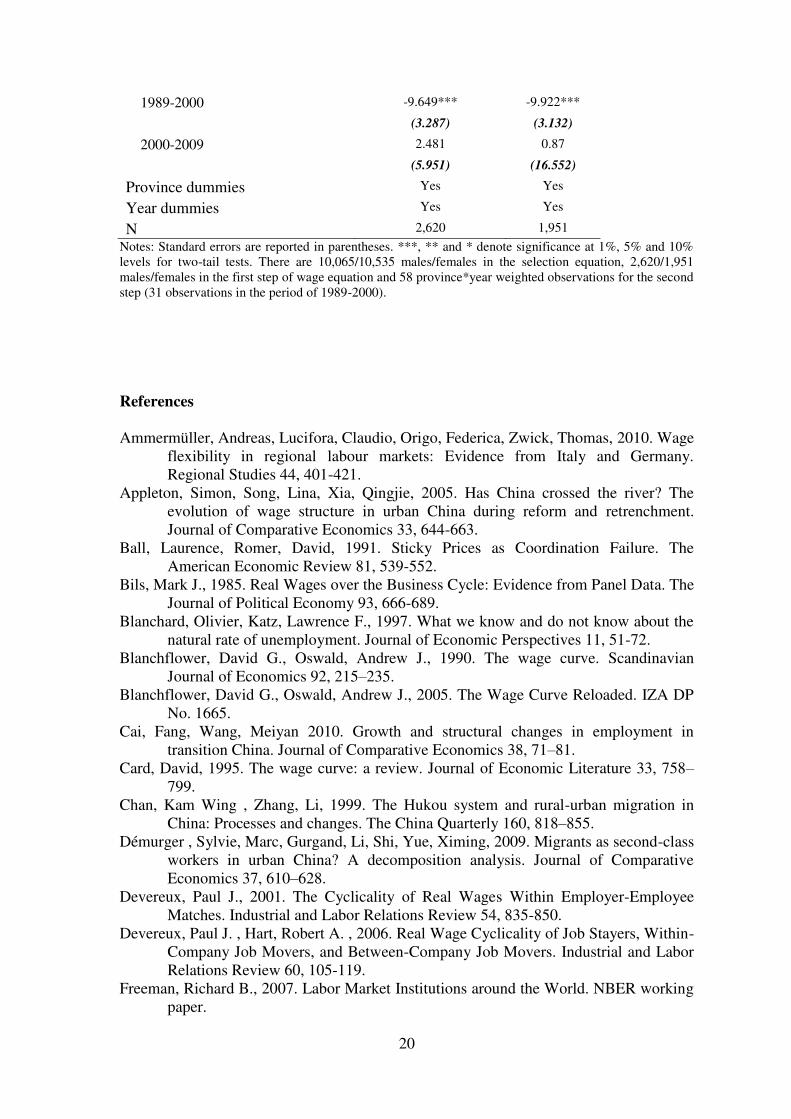
1989-2000 -9.649*** -9.922***
(3.287) (3.132)
2000-2009 2.481 0.87
(5.951) (16.552)
Province dummies Yes Yes
Year dummies Yes Yes
N 2,620 1,951
Notes: Standard errors are reported in parentheses. ***, ** and * denote significance at 1%, 5% and 10%
levels for two-tail tests. There are 10,065/10,535 males/females in the selection equation, 2,620/1,951
males/females in the first step of wage equation and 58 province*year weighted observations for the second
step (31 observations in the period of 1989-2000).
References
Ammermüller, Andreas, Lucifora, Claudio, Origo, Federica, Zwick, Thomas, 2010. Wage
flexibility in regional labour markets: Evidence from Italy and Germany.
Regional Studies 44, 401-421.
Appleton, Simon, Song, Lina, Xia, Qingjie, 2005. Has China crossed the river? The
evolution of wage structure in urban China during reform and retrenchment.
Journal of Comparative Economics 33, 644-663.
Ball, Laurence, Romer, David, 1991. Sticky Prices as Coordination Failure. The
American Economic Review 81, 539-552.
Bils, Mark J., 1985. Real Wages over the Business Cycle: Evidence from Panel Data. The
Journal of Political Economy 93, 666-689.
Blanchard, Olivier, Katz, Lawrence F., 1997. What we know and do not know about the
natural rate of unemployment. Journal of Economic Perspectives 11, 51-72.
Blanchflower, David G., Oswald, Andrew J., 1990. The wage curve. Scandinavian
Journal of Economics 92, 215–235.
Blanchflower, David G., Oswald, Andrew J., 2005. The Wage Curve Reloaded. IZA DP
No. 1665.
Cai, Fang, Wang, Meiyan 2010. Growth and structural changes in employment in
transition China. Journal of Comparative Economics 38, 71–81.
Card, David, 1995. The wage curve: a review. Journal of Economic Literature 33, 758–799.
Chan, Kam Wing , Zhang, Li, 1999. The Hukou system and rural-urban migration in
China: Processes and changes. The China Quarterly 160, 818–855.
Démurger , Sylvie, Marc, Gurgand, Li, Shi, Yue, Ximing, 2009. Migrants as second-class
workers in urban China? A decomposition analysis. Journal of Comparative
Economics 37, 610–628.
Devereux, Paul J., 2001. The Cyclicality of Real Wages Within Employer-Employee
Matches. Industrial and Labor Relations Review 54, 835-850.
Devereux, Paul J. , Hart, Robert A. , 2006. Real Wage Cyclicality of Job Stayers, Within-
Company Job Movers, and Between-Company Job Movers. Industrial and Labor
Relations Review 60, 105-119.
Freeman, Richard B., 2007. Labor Market Institutions around the World. NBER working
paper.
21
García-Mainar, Inmaculada , Montuenga-Gómez, Víctor, 2003. The Spanish wage curve:
1994-1996. Regional Studies 37, 929-945.
Heckman, James J., 1979. Sample Selection Bias as a Specification Error. Econometrica
47, 153-161.
Heckman, James J., 2001. Micro data, heterogeneity, and the evaluation of public policy:
Nobel Lecture. Journal of Political Economy 109, 673– 748.
Heckman, James J., Sedlacek, Guilherme, 1985. Heterogeneity, Aggregation, and Market
Wage Functions: An Empirical Model of Self-selection in the Labor Market.
Journal of Political Economy 93, 1077-1125.
Kang, Lili, Peng, Fei, 2012a. Real Wage Cyclicality in Urban China. Economics Letters
115, 141-143.
Kang, Lili, Peng, Fei, 2012b. A Selection Analysis on Education Returns in China. Post-
Communist Economies 24, 535-554.
Lin, Nan, 1995. Local Market Socialism: Rural Reform in China. Theory and Society 24,
301-354.
Meng, Xin, 2000. Labour Market Reform in China. Cambridge University Press.
Meng, Xin, Kidd, Michael P., 1997. Labor Market Reform and the Changing Structure of
Wage Determination in China’s State Sector during the 1980s. Journal of Comparative Economics 25, 403-421.
Meng, Xin, Shen, Kailing, Xue, Sen, 2013. Economic Reform, Education Expansion, and
Earnings Inequality for Urban Males in China, 1988-2007. Journal of
Comparative Economics 41, 227-244.
Moore, Tomoe, Pentecost, Eric J. , 2006. An investigation into the sources of fluctuation
in real and nominal wage rates in eight EU countries: A structural VAR approach.
Journal of Comparative Economics 34, 357–376.
Moulton, Brent R., 1986. Random Group Effects and the Precision of Regression
Estimates. Journal of Econometrics 32, 385-397.
Moulton, Brent R., 1990. An illustration of a pitfall in estimating the effects of aggregate
variables on micro units. Review of Economics and Statistics 72, 334-338.
Nee, Victor, 1996. The Emergence of a Market Society: Changing Mechanisms of
Stratification in China. The American Journal of Sociology 101, 908-949.
Nickell, Stephen, 1997. Unemployment and Labor Market Rigidities: Europe versus
North America. Journal of Economic Perspectives 11, 55-74.
Nijkamp, Peter, Poot, Jacques 2005. The Last Word on the Wage Curve? Journal of
Economic Surveys 19, 421-450.
O'Mahony, Mary, Peng, Fei, 2008. Skill Bias, Age and Organisational Change. Paper
presented at the EUKLEMS final conference.
Peng, Fei, Siebert, W. Stanley, 2008. Real Wage Cyclicality in Italy. LABOUR 22.
Peng, Fei, Siebert, W. Stanley, 2012. Real Wage Cyclicality in Germany and the UK:
New Results Using Panel Data. Discussion Paper 2688, Institute for the Study of
Labor (IZA), Bonn.
Peng, Yusheng, 1992. Wage Determination in Rural and Urban China: A Comparison of
Public and Private Industrial Sectors. American Sociological Review 57, 198-213.
Pentecost, Eric J., Sessions, John G., 2002. Changing labor market flexibility in the
European Union. Review of World Economics 138, 148–160.
Sabin, Lora, 1999. The development of urban labour markets: China's urban wage curve,
1980-92. Journal of Development Studies 35, 134-152.
Shin, D, Solon, Gary, 2007. New Evidence on Real Wage Cyclicality Within Employer-
Employee Matches. Scottish Journal of Political Economy 54, 648-660.
22
Shin, Donggyun, 1994. Cyclicality of real wages among young men. Economics Letters
46, 137-142.
Solon, Gary, Barsky, Robert, Parker, Jonathan A., 1994. Measuring the Cyclicality of
Real Wages: How Important Is Composition Bias? Quarterly Journal of
Economics 109, 1-26.
Solon, Gary, Whatley, Warren, Stevens, Ann Huff, 1997. Wage Changes and
Intracompany Job Mobility over the Business Cycle: Two Case Studies. Industrial
and Labor Relations Review 50, 402-415.
Song, Lina, 1990. Convergence: A Comparison of Township Firms and Local State
Enterprises. in China's Rural Industry: Structure, Development, and Reform,
edited by W. A. Byrd and Q. Lin. London, England: Oxford University Press.,
392-412.
Wang, Wen, Moffatt, Peter G., 2008. Hukou and Graduates’ Job Search in China. Asian Economic Journal 22, 1-23.
Wu, Zhongmin, 2004. Wage curve for urban China: A panel data approach. Applied
Economics Letters 11, 425-428.
Xu, Lixin Colin, Zhu, Tian, Lin, Yi-min, 2005. Political control, agency problems, and
ownership reform: Evidence from China. Economics of Transition 13, 1–24.