Embed Size (px)
Citation preview
USAID STRATEGIC ECONOMIC RESEARCH AND ANALYSIS – ZIMBABWE (SERA) PROGRAM
WAGE STRUCTURE AND LABOUR COSTS IN ZIMBABWE: AN ANALYSIS OF FLEXIBILITY, COMPETITIVENESS AND EQUITY
CONTRACT NO. AID-613-C-11-00001
This report was produced by Nathan Associates Inc. for review by the United States Agency for International Development (USAID).
FEBRUARY 2016
USAID STRATEGIC ECONOMIC RESEARCH AND
ANALYSIS – ZIMBABWE (SERA) PROGRAM
WAGE STRUCTURE AND LABOUR COSTS IN ZIMBABWE: AN ANALYSIS OF FLEXIBILITY, COMPETITIVENESS AND EQUITY
DRAFT
CONTRACT NO. AID-613-C-11-00001
Program Title: USAID Strategic Economic Research & Analysis – Zimbabwe (SERA)
Sponsoring USAID Office: USAID/Zimbabwe
Contract Number: AID-613-C-11-00001
Contractor: Nathan Associates Inc.
Date of Publication: February 2016
Author: Labour and Economic Development Research Institute of Zimbabwe (LEDRIZ)
DISCLAIMER
This document is made possible by the support of the American people through USAID. Its contents are the sole responsibility of the author or authors and do not necessarily reflect the views of USAID or the United States government.

4
Table of Contents
Executive Summary .............................................................................................................. 7
1. Introduction……………… .............................................................................................. 9
2. Current Macroeconomic Context ................................................................................... 10
3. Overview of the Labour Market..................................................................................... 12
4. Labour Market Institutions and Labour Market Outcomes: A Review of Literature ....... 14
5. Institutions and Legal Framework for Wage Determination in Zimbabwe ...................... 16
Key Institutions for Wage Setting and Negotiations in the Public Sector .................. 17
Legal Framework for Wage Setting and Negotiations in the Public Sector ............... 20
Wage Setting and Negotiations in the Public Sector ................................................. 21
Institutions for Wage Setting and Negotiations in the Private Sector ........................ 23
Legal Framework for Wage Setting and Negotiations in the Private Sector .............. 24
6. Analysis of the Poverty Datum Line (PDL) in the Wage Setting in Zimbabwe............... 26
7. Public Sector Wage Bill and its Implications ................................................................. 27
8. Private/Public Wage Structures and Differentials........................................................... 31
Wage differentials between Management and Ordinary Workers ............................. 34
9. Unit Labour Costs and Competitiveness ........................................................................ 35
10. Summary and Conclusion .............................................................................................. 40
11. Policy Recommendations .............................................................................................. 41
Policy Area 1: Addressing the Wage Bill ................................................................. 41
Policy Area 2: Addressing the Institutional Framework for Wage Settings ............... 44
Policy Area 3: Reforming the Legal Framework ...................................................... 45
12. References ........................................ ……………………………………………………46
5
List of Figures Figure 1: Analysis of Government Revenues and Expenditures (Zimbabwe, Zambia and Kenya) ................................................................................................................................ 29 Figure 2: Sub-Saharan Africa: Civil Servant Wages in 2013 (% of government expenditures) ........................................................................................................................................... 30 Figure 3: Elements of total compensation in the public sector.............................................. 31 Figure 4: Basic Salaries (per month), selected parastatals .................................................... 34 Figure 5: Current Account Balance / GDP (%) .................................................................... 38 Figure 6: The 1945-80 Virtuous circle growth model .......................................................... 40
List of Tables Table 1: Selected Macroeconomic Indicators ...................................................................... 11 Table 2: Contribution to GDP by Sector .............................................................................. 11 Table 3: Employment by Sector .......................................................................................... 13 Table 4: Unemployment Rates (2004, 2011 and 2014) ........................................................ 14 Table 5: Analysis of Government Revenues and Expenditures in Zimbabwe ....................... 28 Table 6: Analysis of Government Expenditure in Zimbabwe (2009-2014) ........................... 28 Table 7: Public Service Package .......................................................................................... 32 Table 8: Average Monthly Earnings, Poverty Lines and Per Capita Income ........................ 33 Table 9: Real Average Earnings Index (2009-2014) ............................................................ 33 Table 10: Unit Labour Costs ............................................................................................... 35 Table 11: Evolution in Employment and Labour Costs for Selected Infrastructure Parastatals ........................................................................................................................................... 36 Table 12: Competitiveness and Ease of Doing Business Rankings (2008-2015) .................. 37 Table 13: Comparative Analysis of Power Outage (Infrastructure) Indicators ...................... 37 Table 14: Results from World Bank Enterprises Surveys ..................................................... 39 Table 15: Most Binding Factors to Doing Business in Zimbabwe ........................................ 39 Table 16: Integrative Bargaining - External Versus Internal Factors .................................... 43
6
List of Acronyms AfDB African Development Bank CBAs Collective Bargaining Agreements COLAZ College Lecturers Association of Zimbabwe CSC Civil Service Commission CSEA Civil Service Employees Association CZI Confederation of Zimbabwe Industries EPL Employment Protection Legislation GDP Gross Domestic Product GWA Government Workers’ Association HRMIS Human Resources Management Information System ILO International Labour Organisation JNC Joint Negotiating Council KIPPRA Kenya Institute for Public Policy Research and Analysis NECs National Employment Councils PDL Poverty Datum Line PSC Public Service Commission PTOA Professional and Technical Officers’ Association PTUZ Progressive Teachers’ Union of Zimbabwe SADC Southern African Development Community SSA Sub-Saharan Africa SSB Salary Services Bureau TUZ Teachers’ Union of Zimbabwe WB World Bank WEF World Economic Forum ZimCode Zimbabwe Corporate Governance Code ZIMSTAT Zimbabwe National Statistics Agency ZIMTA Zimbabwe Teachers’ Association ZIPAR Zambia Institute for Policy Analysis and Research
7
Executive Summary
The calls for the liberalisation of the labour markets to make them more flexible and competitive have become quite dominant among policy makers, employers and academics. A key element in labour market liberalisation is the wage since wages play a central role in that they facilitate the allocation of labour into its most productive and efficient use. Wage developments can have an impact on employment, prices and competitiveness. An explanation often given as a cause of inadequate employment growth is that excessive labour costs are discouraging businesses from hiring more workers. It is argued that excessive labour costs arise when total compensation for workers is out of line with productivity. The excessive labour costs can also be as a result of rigidities in the legal and institutional environment which prevent compensation and productivity from matching.
On the other hand, wages play a fundamental role in the distribution of income and reduction of poverty and economic growth. Falling labour earnings produce a host of problems: growing inequality, social exclusion, a rise in crime or even social and political unrest. The central role of wages makes them an important policy tool. The knowledge of wage developments is therefore important for successfully selecting, designing and implementing polices that aim at raising national income, achieving its equitable distribution and reducing poverty. The knowledge of forces behind wage developments, wage trends, or wage differences, for example, is pivotal in assessing which policies to target towards particular groups. Wages are also one channel through which major internal and external shocks are transmitted to the economy or the population. Recent debate on wages has focused around public-private sector wage differentials. The different institutions and wage setting processes within the public and private sectors may give rise to these wage differentials (Hyder and Reilly, 2005; Mizala, et al., 2011; Ramoni-Perazzi and Bellante, 2007). While evidence from developed countries has revealed that public sector wages are on average higher than those in the private sector, evidence from developing countries is however scant. Public-private sector wage differentials are likely to introduce wage distortions and disparities in public-private sector wage employment, while leading to low morale and output in the affected sector. This Study analyzes the wage structure and its determinants in both the public and private sectors and its impact on the economy over the period 2009-2015. The paper reviews the public sector wage structure, public-private wage differentials and the institutions governing the determination of wages. The analysis has shown that the public sector wage bill poses a serious threat to fiscal and macroeconomic stability as the country has one of the highest public employment costs in Sub-Saharan Africa (SSA). In particular, the public sector wage bill has far outstripped growth in real GDP. The high public sector wage bill has crowded out necessary public investment in capital projects and the social services. There is also a high public wage premium, with average public sector wages outstripping those prevailing in the private sector. There is also a huge differential between the wages of management and those of ordinary workers. The analysis has also shown that there has been a general decline in real average earnings for the whole economy. The analysis on unit labour costs has shown that labour costs are generally high in Zimbabwe relative to the rest of Africa and Asia. There are huge income disparities between top

8
management and middle management, top management and ordinary workers, and between middle management and ordinary workers within enterprises. An analysis of the wage differentials between the public and private sectors shows a high public wage premium. Compared to Sub-Saharan African countries, Zimbabwe has one of the highest public employment costs to total government expenditure and gross domestic product ratios. This is now compromising fiscal and debt sustainability, and jeopardizing growth by generating excessive deficits and crowding out growth-enhancing public investments. We argue that the best and most sustainable way of reducing unit labour costs by firms should be by raising productivity. Productivity growth should drive wage growth, which should in turn fuel demand growth and transition the economy towards higher employment. Public and private capital accumulation are important ingredients to improve productivity and labour market conditions in the country. Arestis and Biefang-Frisancho Mariscal (2000) show that capital formation is an important variable in the determination of unemployment and wages. Rules and regulations emanating from the various Acts and legislations governing the operations within the labour market are usually poorly implemented and most often ineffective. Regulations partly cover the entire market with the large informal segment being uncovered. In the covered segment, regulations are only effective to a limited extent, in terms of compliance, in the public sector; whereas, in the private sector the compliance level is low, due to poor monitoring and implementation. The existing system for public sector empoloyees allows worker groups and organized professional cadres to lobby for wage hikes in the absence of a formal process that accounts for cost of living growth and changes in the labor market in a haphazard manner. This has resulted in the public wage bill growth outstripping growth in economic growth which is not sustainable. Some of the policy implications and recommendations arising from the analysis include: instituting fiscal rules to put a cap on the public sector wage bill; use of biometric payroll registration of public sector employees to strengthen payroll administration; pass a Statutory Instrument (SI) limiting parastatal and municipal wages; resuscitating the National Productivity Institute (NPI) as a basis of coming up with national and sectoral scientific benchmarks to guide productivity bargaining; adopting an integrative collective bargaining process; alignment of the public service salary negotiations with the national budget process; restructuring the role of National Employment Councils (NECs), strengthening coordination among institutions dealing with wage setting and negotiations in the Public Sector and labour legislation harmonisation; curbing informality by encouraging the transition to formality and adopting growth-friendly tax reforms.
9
1. Introduction
This Study is an analysis of the wage structure and its determinants in both the public and private sectors and its impact on the economy. The paper reviews the public sector wage structure, public-private wage differentials and the institutions governing the determination of wages over the period 2009-2015. The Study contains key policy recommendations on how to achieve a sustainable and equitable wage structure both in the public and private sectors in Zimbabwe. The Study uses primary and secondary data to consider the following issues and areas of analysis:
• Review the public sector wage structure in the context of regional comparisons with a
view to assessing its reasonableness and viability or otherwise. This review will take into account non-wage benefits being received by civil servants to assess whether they are based on fiscal sustainability and productivity norms.
• Review the wage structure in the parastatal sector with a view to assessing whether this is based on norms of financial viability of enterprises, productivity, considerations of equity, and parity with private sector wage and salary levels.
• Consider the wage structure in 2 or 3 key private industries such as manufacturing industry, mining and financial services, using data collection and sampling as considered necessary, to assess whether these are comparable in regional terms and affect the competitiveness and viability of these industries or not.
• Consider the manner in which wage negotiations are conducted and wage setting occurs, and assess whether the existing labour laws impede productivity based wage agreements or not.
• Assess the manner in which the Poverty Datum Line (PDL) is used in wage negotiations and wage setting in Zimbabwe, whether this conforms to regional or international best practice, and recommend the optimum manner in which wage negotiations should be conducted and the role of the PDL, if any.
• Briefly outline the laws, regulations and practices (based on precedent or otherwise) which are impeding labour market flexibility, the inability of businesses to adjust their workforces in an equitable manner when faced with recessionary conditions, and propose policy reform and administrative amendments, to enhance labour market flexibility.
The view that the labour market in Zimbabwe is rigid has become topical agenda among policy makers, employers and academics. This view has led to calls for the liberalisation of the labour markets. A key element in labour market analysis is the wage. Wages play a central role in that they facilitate the allocation of labour inputs to their most productive and efficient uses. Wage developments can have an impact on employment, prices and competitiveness. An explanation often proffered as a cause of inadequate employment growth is that excessive labour costs are discouraging businesses from hiring more workers. In simple terms, excessive labour costs would result when total compensation for workers is out of line with productivity. Excessive labour costs can also arise when rigidities in the legal and institutional environment prevent compensation and productivity from matching. On the other hand, wages play a fundamental role in the distribution of income and reduction of poverty. Falling labour earnings spawn a host of problems: growing inequality, social exclusion, a rise in crime or even social and political unrest. The benefits of increased labour earnings include: higher levels of economic growth, poverty reduction, and greater equity.

10
The central role of wages makes them an important policy tool. The knowledge of wage developments is important for successfully selecting, designing and implementing polices that aim at raising national income, achieving its equitable distribution and reducing poverty. The knowledge of forces behind wage developments, wage trends, or wage differences, for example, is pivotal in assessing which policies to target towards particular groups. Wages are also one channel through which major internal and external shocks are transmitted to the economy or the population. Recent debate on wages has focused around public-private sector wage differentials. The different institutions and wage setting processes within the public and private sectors may give rise to these wage differentials (Hyder and Reilly, 2005; Mizala, et al., 2011; Ramoni-Perazzi and Bellante, 2007). While evidence from developed countries has revealed that public sector wages are on average higher than those in the private sector, evidence from developing countries is however scant. Public-private sector wage differentials are likely to introduce wage distortions and disparities in public-private sector wage employment, while leading to low morale and output in the affected sector. This paper analyses developments in the wage system in Zimbabwe in both the public and private sectors and institutions governing wage determination. The paper is organised as follows. Following this introduction, we review the current macroeconomic context (section 2.0). This is followed by an overview of the labour market (section 3.0). The next section (4.0) reviews the literature relating to labour market institutions and labour market outcomes. Section 5.0 reviews the institutional and legal framework governing wage determination. Section 6.0 is an analysis of the PDL in the wage setting processes. Section 7.0 is an analysis of the public sector wage bill and its implications. Section 8.0 is an analysis of the public/private wage structures and differentials. Section 9.0 analyses unit labour costs and competitiveness. The conclusion and recommendations are provided in Sections 10.0 and 11.0 respectively.
2. Current Macroeconomic Context
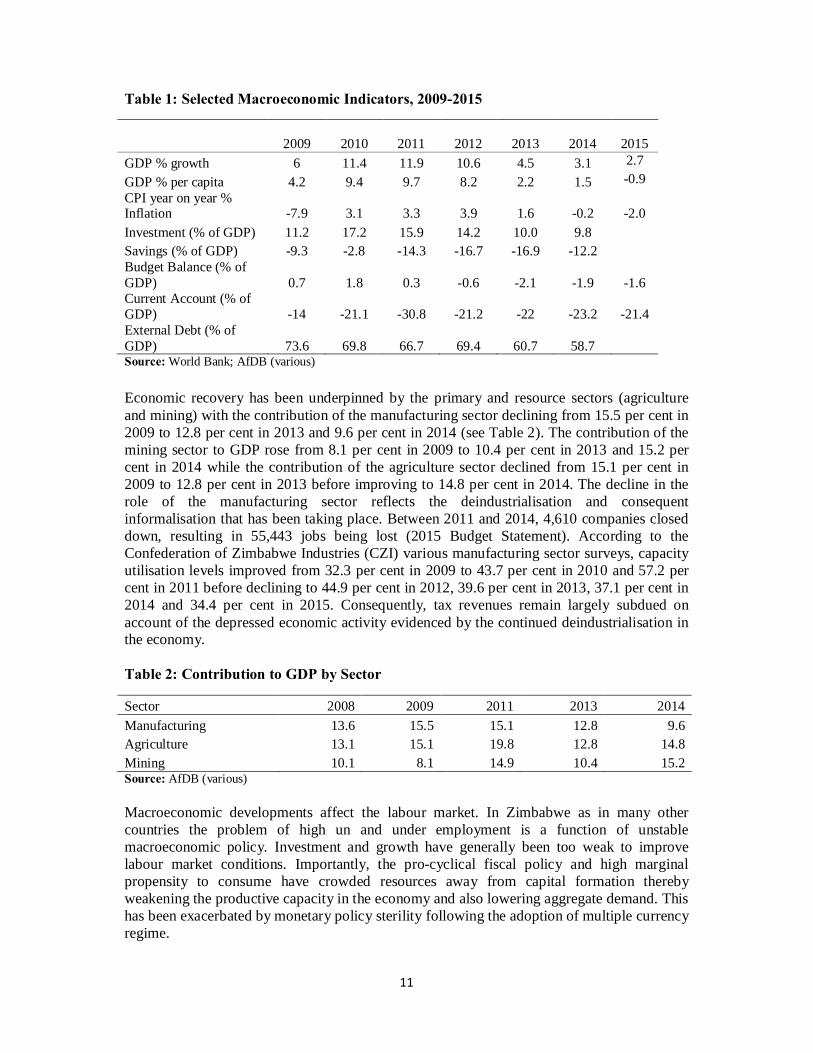
The economic rebound recorded during the period 2009-2012 has moderated with growth declining from 11.9 per cent in 2011 to 4.5 per cent in 2013 and 2.7 per cent in 2015. This slowdown can be attributed to a number of factors which include: high cost of doing business, fiscal revenue underperformance associated with declining commodity prices, policy uncertainty and inconsistency, poor infrastructure and institutional quality among others. The economy is in debt distress with an unsustainably high external debt which is estimated at US$8.396 billion as at December 2014. The country has struggled to service its debt obligations and consequently has accumulated external payment arrears since 1999. Table 1 below shows selected macroeconomic indicators over the period 2009-2015. While inflation remains low and stable, the fiscal and external positions remain unsustainable. The budget balance deteriorated from a surplus of 1.8 per cent of GDP in 2010 to a deficit of -0.6 per cent in 2012 and -1.6 per cent in 2015. The current account deficit on the other hand deteriorated from 14 per cent in 2009 to 21.1 per cent in 2010 and 30.8 per cent in 2011 before slightly improving to 21.4 per cent in 2015. The external debt as a percentage of GDP improved from 73.6 per cent in 2009 to 66.7 per cent in 2012 and to 58.7 per cent in 2015. The World Bank and SADC sustainability threshold is 60 per cent.
11
Table 1: Selected Macroeconomic Indicators, 2009-2015
2009 2010 2011 2012 2013 2014
2015
GDP % growth 6 11.4 11.9 10.6 4.5 3.1 2.7 GDP % per capita 4.2 9.4 9.7 8.2 2.2 1.5 -0.9 CPI year on year % Inflation -7.9 3.1 3.3 3.9 1.6 -0.2
-2.0
Investment (% of GDP) 11.2 17.2 15.9 14.2 10.0 9.8 Savings (% of GDP) -9.3 -2.8 -14.3 -16.7 -16.9 -12.2 Budget Balance (% of GDP) 0.7 1.8 0.3 -0.6 -2.1 -1.9
-1.6
Current Account (% of GDP) -14 -21.1 -30.8 -21.2 -22 -23.2
-21.4
External Debt (% of GDP) 73.6 69.8 66.7 69.4 60.7 58.7
Source: World Bank; AfDB (various) Economic recovery has been underpinned by the primary and resource sectors (agriculture and mining) with the contribution of the manufacturing sector declining from 15.5 per cent in 2009 to 12.8 per cent in 2013 and 9.6 per cent in 2014 (see Table 2). The contribution of the mining sector to GDP rose from 8.1 per cent in 2009 to 10.4 per cent in 2013 and 15.2 per cent in 2014 while the contribution of the agriculture sector declined from 15.1 per cent in 2009 to 12.8 per cent in 2013 before improving to 14.8 per cent in 2014. The decline in the role of the manufacturing sector reflects the deindustrialisation and consequent informalisation that has been taking place. Between 2011 and 2014, 4,610 companies closed down, resulting in 55,443 jobs being lost (2015 Budget Statement). According to the Confederation of Zimbabwe Industries (CZI) various manufacturing sector surveys, capacity utilisation levels improved from 32.3 per cent in 2009 to 43.7 per cent in 2010 and 57.2 per cent in 2011 before declining to 44.9 per cent in 2012, 39.6 per cent in 2013, 37.1 per cent in 2014 and 34.4 per cent in 2015. Consequently, tax revenues remain largely subdued on account of the depressed economic activity evidenced by the continued deindustrialisation in the economy. Table 2: Contribution to GDP by Sector
Sector 2008 2009 2011 2013 2014 Manufacturing 13.6 15.5 15.1 12.8 9.6 Agriculture 13.1 15.1 19.8 12.8 14.8 Mining 10.1 8.1 14.9 10.4 15.2 Source: AfDB (various) Macroeconomic developments affect the labour market. In Zimbabwe as in many other countries the problem of high un and under employment is a function of unstable macroeconomic policy. Investment and growth have generally been too weak to improve labour market conditions. Importantly, the pro-cyclical fiscal policy and high marginal propensity to consume have crowded resources away from capital formation thereby weakening the productive capacity in the economy and also lowering aggregate demand. This has been exacerbated by monetary policy sterility following the adoption of multiple currency regime.
12
In the neoclassical approach wages are treated as a cost item and it is expected that flexibility in the labour market (i.e. the elimination of regulations) should bring down unemployment. It is therefore, assumed that that the demand for labour is no different from the demand for other commodities and that when wages fall the demand for labour should rise. However, as well as being a cost item, the wage bill is an important determinant of the level of domestic demand in the goods market (overall economy). A decline in the purchasing power of workers’ incomes results in a decline in aggregate demand, bringing output down and raising unemployment. For this reason, in order to solve the problem of un and under employment, it is imperative to consider the goods market rather than the labour market and in particular investment spending. A number of scholars have found that increasing investment is an important factor in reducing unemployment (Rowthorn 1995, Arestis et al. 2007, Akyüz 2006). This is because investment both acts to create income as an element of effective demand and also makes it possible to increase production capacity. The determinant of investment, then, becomes important. However, expansionary macroeconomic policies aiming at full employment without regard to the wage-productivity nexus cannot provide for a sustainable improvement and may end up creating a fiscal crisis. For that reason upward adjustments in wages ought to be linked to corresponding improvements in labour productivity. This can be attained through equitable distribution of productivity gains to both labour and capital in a manner that will not reduce the share of wages in total income. In this case, domestic demand will increase in line with the increase in productivity, promoting additional employment and more investment (UNCTAD 2010, Palley 2007, 2011, Ghosh 2011).
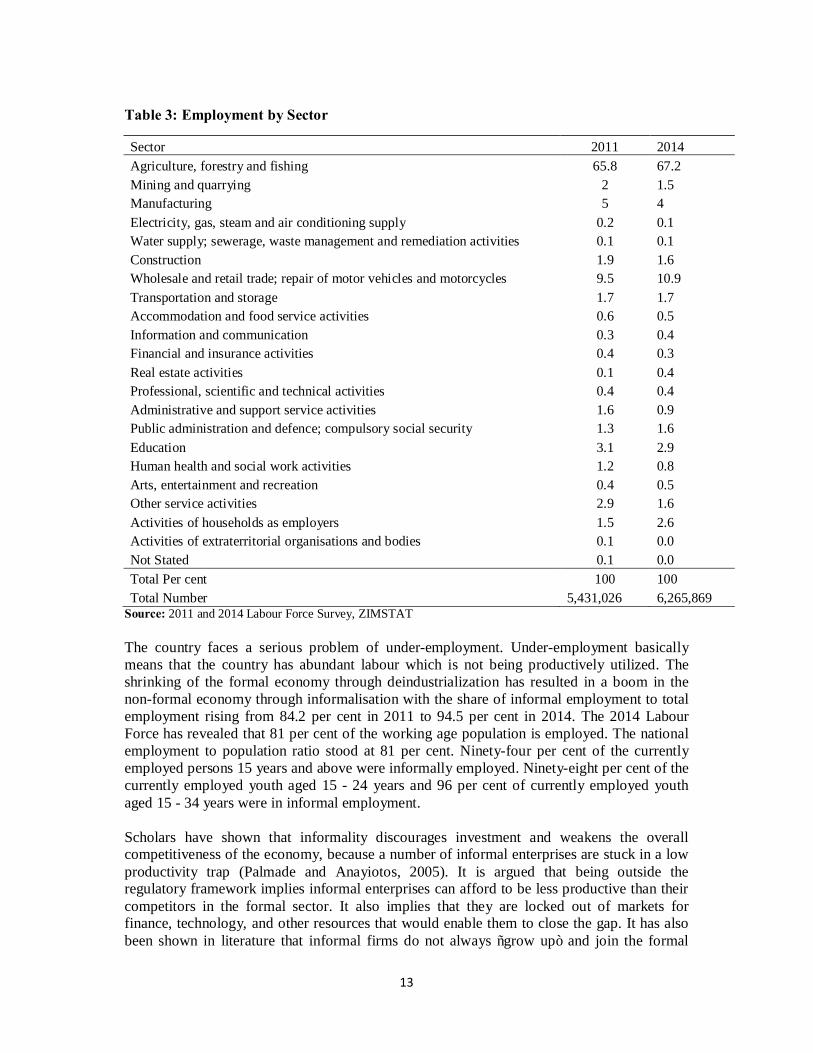
3. Overview of the Labour Market The structure of employment in most African countries is characterized by a relatively small share of private industrial employment, a dominance of agricultural employment, and widespread self-employment in informal, non-agricultural enterprises. In Zimbabwe the economy has undergone wrenching structural changes typified by deindustrialisation and the informalisation of the economy. Table 3 shows the share of employment by sector in Zimbabwe for the periods 2011 and 2014. The share of employment from the agricultural sector has steadily increased from 65.8 per cent in 2011 to 67.2 per cent in 2014. The mining sector contribution declined from 2 per cent in 2011 to 1.5 per cent in 2014. The manufacturing sector contribution also declined from 5 per cent in 2011 and 4 per cent in 2014.
13
Table 3: Employment by Sector
Sector 2011 2014 Agriculture, forestry and fishing 65.8 67.2 Mining and quarrying 2 1.5 Manufacturing 5 4 Electricity, gas, steam and air conditioning supply 0.2 0.1 Water supply; sewerage, waste management and remediation activities 0.1 0.1 Construction 1.9 1.6 Wholesale and retail trade; repair of motor vehicles and motorcycles 9.5 10.9 Transportation and storage 1.7 1.7 Accommodation and food service activities 0.6 0.5 Information and communication 0.3 0.4 Financial and insurance activities 0.4 0.3 Real estate activities 0.1 0.4 Professional, scientific and technical activities 0.4 0.4 Administrative and support service activities 1.6 0.9 Public administration and defence; compulsory social security 1.3 1.6 Education 3.1 2.9 Human health and social work activities 1.2 0.8 Arts, entertainment and recreation 0.4 0.5 Other service activities 2.9 1.6 Activities of households as employers 1.5 2.6 Activities of extraterritorial organisations and bodies 0.1 0.0 Not Stated 0.1 0.0 Total Per cent 100 100 Total Number 5,431,026 6,265,869
Source: 2011 and 2014 Labour Force Survey, ZIMSTAT The country faces a serious problem of under-employment. Under-employment basically means that the country has abundant labour which is not being productively utilized. The shrinking of the formal economy through deindustrialization has resulted in a boom in the non-formal economy through informalisation with the share of informal employment to total employment rising from 84.2 per cent in 2011 to 94.5 per cent in 2014. The 2014 Labour Force has revealed that 81 per cent of the working age population is employed. The national employment to population ratio stood at 81 per cent. Ninety-four per cent of the currently employed persons 15 years and above were informally employed. Ninety-eight per cent of the currently employed youth aged 15 - 24 years and 96 per cent of currently employed youth aged 15 - 34 years were in informal employment. Scholars have shown that informality discourages investment and weakens the overall competitiveness of the economy, because a number of informal enterprises are stuck in a low productivity trap (Palmade and Anayiotos, 2005). It is argued that being outside the regulatory framework implies informal enterprises can afford to be less productive than their competitors in the formal sector. It also implies that they are locked out of markets for finance, technology, and other resources that would enable them to close the gap. It has also been shown in literature that informal firms do not always “grow up” and join the formal
14
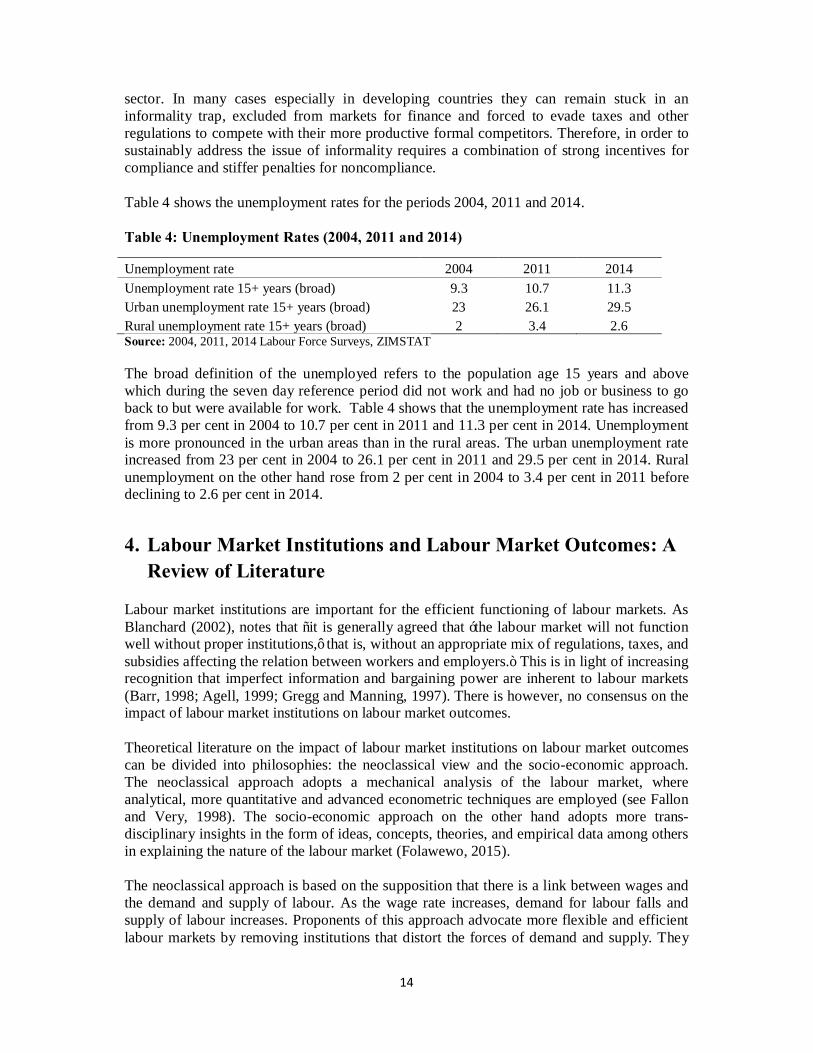
sector. In many cases especially in developing countries they can remain stuck in an informality trap, excluded from markets for finance and forced to evade taxes and other regulations to compete with their more productive formal competitors. Therefore, in order to sustainably address the issue of informality requires a combination of strong incentives for compliance and stiffer penalties for noncompliance. Table 4 shows the unemployment rates for the periods 2004, 2011 and 2014. Table 4: Unemployment Rates (2004, 2011 and 2014)
Unemployment rate 2004 2011 2014 Unemployment rate 15+ years (broad) 9.3 10.7 11.3 Urban unemployment rate 15+ years (broad) 23 26.1 29.5 Rural unemployment rate 15+ years (broad) 2 3.4 2.6 Source: 2004, 2011, 2014 Labour Force Surveys, ZIMSTAT The broad definition of the unemployed refers to the population age 15 years and above which during the seven day reference period did not work and had no job or business to go back to but were available for work. Table 4 shows that the unemployment rate has increased from 9.3 per cent in 2004 to 10.7 per cent in 2011 and 11.3 per cent in 2014. Unemployment is more pronounced in the urban areas than in the rural areas. The urban unemployment rate increased from 23 per cent in 2004 to 26.1 per cent in 2011 and 29.5 per cent in 2014. Rural unemployment on the other hand rose from 2 per cent in 2004 to 3.4 per cent in 2011 before declining to 2.6 per cent in 2014.
4. Labour Market Institutions and Labour Market Outcomes: A Review of Literature
Labour market institutions are important for the efficient functioning of labour markets. As Blanchard (2002), notes that “it is generally agreed that ‘the labour market will not function well without proper institutions,’ that is, without an appropriate mix of regulations, taxes, and subsidies affecting the relation between workers and employers.” This is in light of increasing recognition that imperfect information and bargaining power are inherent to labour markets (Barr, 1998; Agell, 1999; Gregg and Manning, 1997). There is however, no consensus on the impact of labour market institutions on labour market outcomes. Theoretical literature on the impact of labour market institutions on labour market outcomes can be divided into philosophies: the neoclassical view and the socio-economic approach. The neoclassical approach adopts a mechanical analysis of the labour market, where analytical, more quantitative and advanced econometric techniques are employed (see Fallon and Very, 1998). The socio-economic approach on the other hand adopts more trans-disciplinary insights in the form of ideas, concepts, theories, and empirical data among others in explaining the nature of the labour market (Folawewo, 2015). The neoclassical approach is based on the supposition that there is a link between wages and the demand and supply of labour. As the wage rate increases, demand for labour falls and supply of labour increases. Proponents of this approach advocate more flexible and efficient labour markets by removing institutions that distort the forces of demand and supply. They
15
argue that any distortion of the market mechanism will impede growth and employment for a number of reasons: First, most institutional interventions create incentives for market participants to behave differently than they otherwise would. This distorts the labour market’s efficiency through the transmission wrong market signals, thus compromising the predictability of wage levels and their linkages to marginal productivity. Such a scenario leads to inefficiency in the allocation of productive resources. Second, regulations such as minimum wages make adjustment of labour markets to different types of economic changes in a dynamic setting difficult. Finally, regulations that redistribute economic ‘rents’ from capital to labour (for instance, collective bargaining schemes, and expansionary fiscal programmes to fund public employment and so on.) reduce investors’ profits. This consequently discourages investment and the prospects of economic growth (Cesar and Chong, 2003). On the other hand, proponents of the socio-economic approach view labour markets differently from the neoclassical. The main argument in this approach is that the labour market only exists because different sets of agents interact with different sets of social, economic, cultural, political, ideological and social-psychological factors, in different spatio-temporal locations (Fleetwood, 2008). These factors are crucial to the analysis of labour markets. As a result, labour market institutions are considered important determinants of the dynamics in the labour market. It is argued that labour market institutions can fulfil important redistributive roles, particularly to benefit the vulnerable categories of workers. In addition, provisions such as labour standards may create desirable pressures on the employers to focus on the enhancement of their labour productivity whether it is through training or technical innovations (Freeman, 1993). Ultimately, standards on mandated benefits may help to solve the moral hazard issues and all the workers will benefit (Summers, 1998). According to Akerlof (1984), by reinforcing job security, employment protection legislation (EPL) may enhance productivity performance, as workers will be more willing to cooperate with employers in the development of the production process. By this, EPL can be expected to reduce labour turnover. Because EPL ensures long-term labour contract, it creates an incentive for employers to invest in the training and well-being of workers, thus, increasing human capital and labour productivity. Several empirical studies have been carried out to investigate the link between institutional regulations and labour market outcomes in relation to the two theoretical stands. Empirical support for the mainstream view is relatively limited and not clear cut. For example, Scarpetta and Tressel (2004) find, in an econometric analysis based on data for 17 manufacturing industries in 18 OECD countries (1980-2000), that differences in labour market regulation per se do not (in a statistically significant manner) affect multifactor productivity growth (see also OECD 2002). Likewise, Bartelsman et al. (2003:5) conclude that the “effect of high hiring and firing costs (proxied by the strictness of employment protection legislation) on productivity and innovation is less clear cut, and largely depends on the institutional system in which firms operate and the type of technology used in the sector” (for a similar conclusion, see Bassanini and Ernst, 2002). In a study on India, Besley and Burgess (2004) found that pro-worker regulations are associated with low investment, employment, productivity, output and high urban poverty. The study further revealed that this type of regulation facilitated the existence and growth of a very large informal sector. The findings of the study have been criticised on several grounds, for example, Bhattarcharjea (2007) opined that the use of state-level labour

16
regulation might be inappropriate. In addition, it was argued that scoring of several individual measures was erroneous, and that combination of scores as in Besley and Burgess was not comparable across states. Petrin and Sivadasan (2006) studied the effect of EPL on Chilean manufacturing firms for the periods 1979-1996 using plant-level production data. Results of the study showed little evidence of a negative impact of EPL on labour demand; however, it found that EPL introduced economically and statistically significant costs to the economy. They argued that firing costs drove a wedge between the marginal revenue product and its marginal cost. The result showed a large and significant increase in both the mean and the variance of the within-firm gap between the marginal product of labour and wage, for both white and blue collar workers. In a comprehensive cross country study, Botero et al (2003) investigated the economic effect of labour market regulations such as employment laws, industrial and collective bargaining laws and social security laws for 85 countries. They found out that richer countries regulate labour less often that the poor ones, instead they provide more social securities. A study by Belot and Van Ours (2004) showed that EPL lowered unemployment rate. Tvrdon (2013) found two main institutional factors significantly influencing labour market performance and these are tax wedge on labour activities and active labour market polices. It shows that higher tax has positive correlation with unemployment, but active labour market polices have the tendency to offset the negative effect of high taxation. In conclusion, on the basis of evidence from both the theoretical and empirical review, it is clear that the literature is inconclusive on the impact of institutions and regulatory framework on labour market outcomes. Most of the studies pay more attention to employment effects, but less on productivity and wage or income effect. In addition, very few studies to the knowledge of the writer focus on Africa. More importantly, the outcome depends on whether the focus is on the short or long-term.
5. Institutions and Legal Framework for Wage Determination in Zimbabwe
Labour market institutions governing hiring, firing and collective bargaining processes and other labour market activities have implications on employment and wage determination as well as productivity. Similarly, the nature and structure of the labour market in a particular economy, such as the extent of formality and informality, do not only affect the functioning of such market but also the effectiveness of its institutional and regulatory framework (Chen, 2007; Sanchez-Puerta, 2010). Several reasons have been advanced for the existence of labour market institutions. A key reason is due to market failure which does not give room for optimal resource allocation and ultimately affects market outcomes. Hence, institutions are needed to not only ensure optimality, but also protect workers. However, several empirical evidence have shown that while institutions and regulations are put in place to enhance the performance of labour market, they often have unintended negative impact on market outcomes such as employment (unemployment), productivity and earnings (Rama, 1995; Heckman and Pagés, 2000; Downes et al, 2000; Schindler, 2009; Betcherman, 2013).

17
The Zimbabwean labour market has a very large informal sector, larger than the formal, which affects the efficacy of the labour market institutions. The extent to which all these have impacted on labour market outcomes such as employment, unemployment, wages and productivity however, remains unclear. Hiring and firing as well as compensation of employees and other employer-employee relations within the formal segment are governed by official (legal) institutional rules and regulations; while activities within the informal segment of the market are outside of the coverage of official rules and regulations. Consequently, the existing labour market institutions and regulations reviewed in this paper are those related to the employment, compensation and other market issues within the formal segment which comprises of large privately owned firms and public organisations. Zimbabwe is a member of the International Labour Organisation (ILO) and has also ratified a number of ILO conventions. The institutional and regulatory framework existing in the country is largely in line with ILO and fall within international standards; however their functioning is often below the acceptable international benchmarks. There are differences in terms of employment and wage determination processes between the public sector, parastatals and the private sector. Wage determination in the public sector differs from standard bargaining in the private sector. In the public sector wage determination is often a non-market process which is a prerogative of the government while in the private sector wages are determined by a process of collective bargaining. Public servants are grouped into associations and government consults with these associations, without necessarily being bound by the outcomes. It is now generally agreed that labor market policies should avoid the extremes of excessive regulations on the one hand and the other extreme of disregard for labor conditions. Labor market rules that are very weak or programs that are nonexistent can leave problems of poor information, unequal power, and inadequate risk management untreated, penalizing the poor and the middle class (World Bank, 2012). In contrast, excessively stringent regulations can compound market imperfections with institutional failures, and weigh on job creation and efficiency (Dabla-Norris et al, 2015). Restrictive labor regulations rank at the top of the list of the most problematic factors for doing business in Zimbabwe. However, in reality the Labour Act provides room for negotiation between employers and employees on conditions of services as the country does not have minimum wage legislation. The Labour Act provides for two weeks’ pay for every year served as a minimum retrenchment package. In South Africa the minimum retrenchment package is at least one week pay for every year served and in Zambia it is not less than two months' basic pay.
Key Institutions for Wage Setting and Negotiations in the Public Sector
Civil Service Commission (CSC) The Civil Service Commission (CSC) administers the civil service sector. It was formerly called the Public Service Commission (PSC) prior to the new Constitution in 2013. According to Section 203 of the Constitution, members of the CSC are appointed by the President. Section 203 details the functions of the CSC as follows: 1. To appoint qualified and competent persons to hold posts in the civil service; 2. To fix and regulate conditions of service including salaries, allowances and other
benefits;

18
3. To exercise control and disciplinary powers over members of the civil service; 4. To investigate grievances and to remedy the grievances of members; 5. To implement measures to ensure effective and efficient performance within and the
general well-being of the civil service; 6. To ensure that members of the civil service carry out their duties efficiently and
impartially; 7. To advise the President and the Minister on any matter relating to the civil service; 8. To promote throughout the civil service the values and principles set out in the new
Constitution; 9. To exercise any other function that is conferred or imposed on the commission by the
constitution or an Act of Parliament.
Salary Services Bureau (SSB) The Salary Services Bureau (SSB) is an agency of the Civil Service Commission. It is responsible for maintaining the establishment register, hiring against the established positions, implementing the terms of the employment contract, and maintaining the Human Resources Management Information System (HRMIS). Administratively, the SSB reports to the Civil Service Commission.
The Apex Council According to (Uzhenyu, 2015), the Apex Council is a coalition of nine (9) civil service staff associations whose main functions include: 1. To bring all civil servants under one umbrella as one family employed by the Civil
Service Commission ( CSC); 2. To discuss issues of conditions of service and their welfare with the employer; 3. To lobby for better working conditions particularly salary increments paid in line with the
Poverty datum line for the least paid worker as well as other benefits; 4. To speak as one voice through their representatives in the National Joint Negotiating
Council; 5. To recommend action to force the employer (government through CSC) to accede to their
demands although they are severely handicapped by the fact that they are not allowed to go on industrial action since they provide essential services as enshrined in the Labour Act Chapter 28:04;
6. To establish synergies, strategic alliances with industry and commerce and other regional and international civil service unions (associations).
The National Joint Negotiating Council (NJNC) This Council consists of 9 members from the Apex Council and 9 members drawn from Ministries and Government Departments. The Ministries or Government departments include: 1. CSC (Chair of Government Team); 2. Salaries Services Bureau; 3. Ministry of Public Service, Labour and Social Welfare; 4. Ministry of Finance; 5. Ministry of Health and Child Welfare; 6. Ministry of Higher and Tertiary Education; 7. Ministry of Primary and Secondary Education.
19
The role of the NJNC is to represent the Apex Council members and the representatives from the Ministries and Departments, review and negotiate salaries, allowances and conditions of service in the Public Service. Once an agreement is reached, the NJNC submits to the Minister of Public Service, Labour and Social Welfare for his/her considerations. The Health Service Board (HSB) The Board serves government workers in the health sector. It is governed by the Health Services Act. The Chair of NJNC currently chairs HSB. The Board works in consultation with the Minister of Health and its functions include: 1. Appointing persons to offices, posts and grades in the Health Service; 2. Creating grades in the Health Service and fix conditions of service for its members; 3. Supervising and monitoring health policy planning and public health; 4. Inquiring into, and dealing with, complaints made by members of the Health Service; 5. Supervising, advising and monitoring the technical performance of hospital management
boards and State-aided hospitals; 6. Setting financial objectives and framework for hospital management boards and State-
aided hospitals; 7. Handling appeals in relation to disciplinary powers exercised by hospital management
boards, over members of the Health Service; 8. Assisting in resource mobilization for the Health Service; and, 9. Exercising any other functions that may be imposed or conferred upon the Board in terms
of the Act or any other enactment. The wages and conditions of services negotiations in the health sector are determined by the Health Service Board Negotiation Panel (HSBNP). This Panel also has a structure with representatives from the Government and workers associations, also known as Apex. The Apex is made up of the various professional associations in the health sector. This bipartite structure is a duplication of the NJNC. Ministry of Finance and Economic Development (MOFED) The Ministry of Finance and Economic Planning (MOFED) budgets and manages the total wage bill (including pensions) as a part of the annual budget. MOFED is responsible for managing the macroeconomic implications of the wage bill. Challenges exist within the institutional framework The following challenges exist within the institutional framework:
1. There is lack of effective coordination among the key institutions being Ministry of Public Service Labour and Social Welfare, CSC, NJNC and the HSB;
2. Divergence of views within the Apex Council leading to lack of clarity on common positions and divisions thereof;
3. There is duplication of negotiating structures for the health sector and other public service workers, that is, HSBNP and NJNC, respectively;
4. There is no proper collective bargaining for civil service employees as compared with the private sector. For example, the output of the NJNC goes to the Minister as a recommendation; and,
5. There is no coordination between the timing for salary consultations and the Budget process, thereby leading to anomalies in salary and conditions of service

20
determination and outcomes (World Bank, 2013 and Uzhenyu, 2015). The salary consultations should inform the budget inputs.
Overall, to address the institutional challenges, there is need to first harmonise the two negotiation structures HSBNP and NJNC on issues related to basic pay structure which includes basic salary, housing, transport and rural allowance, whilst the specifics related to each sector can be dealt with at sector level. This eliminates duplication of negotiations and assists in creating synergies among the public sector workers. In addition, this will save institutional costs related with planning and administering a negotiation process. Secondly, there is need to improve coordination of timing of salary consultations and the budget process by establishing and effectively implementing a framework that allows synergy between the timeframe for salary consultations and budget inputting.
Legal Framework for Wage Setting and Negotiations in the Public Sector The Constitution of Zimbabwe The Constitution of Zimbabwe is the supreme law in Zimbabwe governing labour relations. Zimbabwe adopted a new constitution on 22 May 2013 (Constitution of Zimbabwe Amendment (No. 20) Act, 2013). The new Constitution now provides for the right to strike except for members of the security services. Section 65 provides for Labour Rights as follows: 1. Except for members of the security services, every person has the right to form and join
trade unions and employee or employers’ organisations of their choice, and to participate in the lawful activities of those unions and organisations.
2. Except for members of the security services, every employee has the right to participate in collective job action, including the right to strike, sit in, and withdraw their labour and to take other similar concerted action, but a law may restrict the exercise of this right in order to maintain essential services.
3. Every employee is entitled to just, equitable and satisfactory conditions of work. 4. Except for members of the security services, every employee, employer, trade union, and
employee or employer’s organisation has the right to – 1. engage in collective bargaining; 2. organize and 3. form and to join federations of such unions and organisations.’ The new Constitution marks a great departure from the old Constitution that did not directly provide for the right to collective bargaining and to strike. Public sector labour legislations Zimbabwe’s public sector labour legislation is fragmented. It is divided into seven segments with the majority of the employees falling under the Public Service Act Chapter 16:04 and the Public Service Regulations Statutory Instrument 1 of 2000. Other groups of employees are regulated by the Labour Relations Act Chapter 28:01, the Health Services Act Chapter 15:16, the Police Act Chapter 11:10, the Defence Force Act Chapter 11:-02, the Prisons Act Chapter 7:11 and the Judicial Service Act Chapter 7:18. These legislations combine both administrative functions and labour relations. Public sector workers are not covered by the Labour Act [Chapter 28:01].
21
The Public Service Act Chapter 16:04 refers to employees as ‘members’. This Act covers members who render direct services to government except the security services, the judiciary, Parliament and intelligence services. The Act establishes the Public Service Commission (now Civil Service Commission) which is the employer representative of Government. The Act provides for the recognition of employees’ associations or organisations (s24). The Act provides for consultations with the recognised associations (s20). The Health Services Act Chapter 15:16 covers (members) employees in the Health Sector. The Act establishes the Health Service Board and recognises the right of employees to form associations or organisation and engage in consultations with the Board if so recognised by the Minister. The Board in consultation with the Minister has power to fix conditions of service for the health service employees (s13). The right to strike is not recognised in terms of this Act or service regulations as the Health sector is classified as an essential service. The Judicial Service Act Chapter 7:18 applies to members (employees) in the administration of justice. The Act establishes the Judicial Service Commission, responsible among others for fixing conditions of service for its members (s5). The Act recognises the employees’ right to freedom of association (s13) and consultations with regard to conditions of service (s11). The Act does not recognise the right to strike nor prohibit strike action and employees can use their constitutional right to strike. The Defence Act, Prison Service Act and the Police Act govern members of the defence forces, prison service and police service. These members do not have the right to form trade unions or staff associations. The Conditions of service are imposed by the Defence Force Service Commission, Prison and Correctional Service Commission, Police Service Commission in consultation with the Minister responsible for Defence, Justice and Home Affairs respectively. Section 65 (2) (3) of the constitution of Zimbabwe prohibit these groups from enjoying the right to freedom of association and to strike. Challenges with the legal framework for wage setting in the public sector The main challenge is the fragmentation of the legal framework within the public sector. This challenge can be addressed by harmonising these Acts with the main Labour Act to ensure that all workers in Zimbabwe governed by one Act. This Act should allow the establishment of two negotiating structures, that is, one negotiating structure in the public sector and one in the private sector. For the public sector, it means combining the HSBNP and NJNC (see conclusion in section 5.1.7), whilst for the private sector the NECs can remain in place.
Wage Setting and Negotiations in the Public Sector According to Section 20 (1) of the Public Service Act, the Commission, in this case the CSC shall be engaged in regular consultations with recognized Public Service Associations in regards to the conditions of service. The Public Service Act states that: Subject to this Act and the Constitution, conditions of service, applicable to members of the Public Service (with the exception of the Army, Police, Prisons and Central Intelligence Organisations which have separate arrangements) including their remuneration, benefits, leave of absence, hours of work and discipline, shall be determined by the Commission in consultation with the Minister (responsible for Public Service), provided that, to the extent
22
that such conditions may result in an increase in expenditure chargeable on the Consolidated Revenue Fund the concurrence of the Minister responsible for Finance shall be obtained. This clearly means that the role of the associations ends with consultation alone and they do not have the final say in terms of the final outcome of salaries and allowances. The final say on salaries, allowances and benefits, according to Section 203 (4) of the Constitution rests in the President. Section 203 (4) states that in fixing the salaries, allowances and other benefits of the civil service, the CSC must act with approval of the President given on the recommendation of the responsible Minister for Finance in consultation with the Minister responsible for Civil Service. Following the directive of the President, the CSC can then enter into any agreement with the employees. The following is the list of the associations that represent the Public Service: 1. Zimbabwe Teachers’ Association (ZIMTA); 2. Progressive Teachers’ Union of Zimbabwe (PTUZ); 3. Teachers’ Union of Zimbabwe (TUZ); 4. College Lecturers Association of Zimbabwe (COLAZ); 5. The Public Service Association (PSA) made up of 4 other unions which are; 1. Government Workers’ Association (GWA); 2. Professional and Technical Officers’ Association (PTOA); 3. Administrative and Executive Officers Association; and 4. Civil Service Employees Association (CSEA).
Challenges with wage setting and negotiations in the Public Sector Challenges with wage setting and negotiations in the Public Sector include: 1. The Public Services Act Chapter 16:04 only gives the CSC the right to consult. Thus,
civil service employees are only “consulted” over their terms and conditions of employment, with the real determination being done by the employer, represented by the CSC.
2. Section 19 and 20 of the Public Service Act is not aligned to the Constitution and thus should be amended to provide for collective bargaining processes as provided for in section 65 (5).
In addressing these challenges, the government needs to align the Public Service Act with the Constitution and provide for collective bargaining for the respective civil service workers. The Ministry of Finance and Economic Development should strengthen its role in terms of timeous provision of yearly budget projections to parties involved in salary negotiations so that consultations are undertaken in a transparent manner, as compared to the current scenario where negotiations and consultations are in most cases conducted in a vacuum. Moreover, the existing system allows worker groups and organized professional cadres to lobby for wage hikes in the absence of a formal process that accounts for cost of living growth and changes in the labor market in a haphazard manner. This has resulted in the public wage bill growth outstripping growth in economic growth which is not sustainable. Government could consider introducing an annual inflation adjustment. Periodic pay reviews should also be introduced whereby the Civil Service Commission (CSC) and the worker groups would negotiate adjustments to the pay scales in accordance with specific budgetary

23
guidelines from the government. This process would allow authorities to make needed adjustments to the pay scales to accommodate changes in labor market conditions.
Institutions for Wage Setting and Negotiations in the Private Sector
Wage determination in the formal private sector has been the outcome of the activities of three key players – labour, employers and government, all with divergent and at times antagonistic objectives. Unions want to maximise wages, employers seek to minimize costs, while the government has often been viewed with suspicion by both sides, as its position has always been unpredictable. When Zimbabwe gained independence, minimum wages were unilaterally set by government from 1982 until 1988. The minimum wage structure was based on a two-tier system (domestic and agriculture, and industry and commerce) and was announced at the Workers’ Day Rally on 1 May every year. However, in 1989, government allowed National Employment Councils (NECs) to negotiate within the range 5-16 per cent and in 1990, the negotiations started at 10 per cent, with the ‘sky’ as the limit. With the adoption of Economic Structural Adjustment Programme (ESAP) in 1991, the collective bargaining arena was liberalized and NECs could negotiate any level of wage improvements according to what they had agreed on. Collective bargaining is done mainly at industrial level through National Employment Councils. In a way, the end result through this form of collective bargaining is negotiated industrial minimums. Different industries tend to follow wage adjustments recommended by National Employment Councils. In Zimbabwe collective bargaining has mainly centred on wages. Bargaining over employment has never been a major issue as employment decisions are often the prerogative of managers. However, the recent scale of layoffs has led to an additional dimension in bargaining. Cross country evidence has shown that collective bargaining can help enterprises adapt to economic volatility and downturns through short-term adjustments and concessions on wages and other working conditions, while permitting a more expeditious alignment of wages with productivity gains when the economy recovers. In Germany for instance strong industry-wide collective bargaining underpinned by close cooperation between the employers and employees made the timing of wage increases contingent on economic recovery explaining the low number of job losses during the crisis, in spite of a sharp economic contraction. As a result of the strong employer-employee cooperation employers kept their long term commitments to core workers and in return trade unions and works councils agreed to make concessions in terms of pay and working conditions.
National Employment Councils (NECs) National Employment Councils are a form of bipartite social dialogue platform at the industrial level. Section 57 of the Labour Act, states that the Minister of Public Service, Labour and Social Welfare may request any registered trade union and any registered employer’s organisation to form an employment council and apply for registration (Madhuku, 2015). It comprises of equal representatives of employers drawn from a registered employers’ organization or federation of employers’ on one hand, and representatives of employees drawn from a registered trade union or federation of trade unions. The NECs play a critical role in Zimbabwe’s industrial relations and social dialogue.
24
NECs are registered with the Registrar of Labour Relations in the Ministry of Public Service Labour and Social Welfare. By 2015 there were 45 registered NECs in Zimbabwe. The NECs receive their income through a statutory levy contributed by both employers and employees which is directly paid to the NEC. Some NECs also administer their own medical and pension schemes for their specific sector. The major function of NECs is to negotiate, bargain and dialogue on labour market and welfare issues of a particular industry with a legal and registered Collective Bargaining Agreement (CBA) being the outcome (Nyamukapa, 2008). The CBA is a legally binding document, binding to all employers and employees falling within the scope of the industry, irrespective of whether the employers or employees belong to the respective trade union or employers’ association. To enhance efficiency in the collective bargaining structure it is imperative to allow decentralized wage setting while keeping coordination to help the macroeconomic adjustment. A combination of national and firm-level bargaining helps to meet the twin objectives of achieving flexibility and coordination. Firm-level agreements can adjust wages to the specific conditions faced by firms. Industry-level agreements can set floors and, when needed, help the adjustment of wages and prices in response to major macroeconomic shocks.
Wages and Salary Advisory Board The Wages and Salaries Advisory Board is chaired by the Director of Labour Administration in the Ministry of Public Service, Labour and Social Welfare. Its role is to make recommendations specifically for the domestic and unclassified sectors. As the name suggests, its role is purely advisory.
Challenges with Wage Setting in the Private Sector Whilst the institutional arrangements in the private sector are clear and sound, lately, it has been the CBA processes that have faced a number of challenges in relation to the legislation. These include: 1. Registration of a CBA takes long, which results in an impasse in implementation of
agreed sectoral wages; 2. Ministerial interference with the bargaining process where the Minister can solely give a
directive for the CBA not to be registered; 3. Some employers sometimes deliberately ignore directives from the NECs. For example
the Net One Court vs. Ministry of Labour and Public Services and NEC case where the High Court made a decision pronouncing that an employer is not compelled to belong to an employment council;
4. Lack of trust among the employers and the employees; 5. The economic impasse resulting in a number of deadlocks and reference of cases for
arbitration whose process takes forever long; 6. Limited scope of NECs to wage negotiations only. NECs should also focus on dealing
with the state of the economy and sectors, human resource development, issues of productivity and competitiveness.
Legal Framework for Wage Setting and Negotiations in the Private Sector The Labour Act (Chapter 28:01) governs collective bargaining for all workers in the private sector and State Enterprises (Parastatals). Wage setting and negotiations are included in the

25
list of issues for negotiations. Section 74 (2) indicates that trade unions and employers and employers’ organisation may negotiate CBAs on any conditions of employment which are of mutual interest to the parties. Section 74 (3) (a) makes a provision for negotiating rates of remuneration and minimum wages for the different grades and types of occupations. This means that the workers and the employers can negotiate and agree on any issue as long as it relates to conditions of employment. Sections 80 (2) and 82 (1) (a) state that a CBA is considered legally binding when it first gets registered by the Registrar of Labour Relations and secondly when it is published by the Minister as a statutory instrument. However, there are some four limitations related to the provisions in the Labour Act (Madhuku, 2015). These are:
1. the workers and employers cannot agree on terms or standards that are lower than those provided in the Labour Act;
2. the Minister has the power to direct the Registrar to refuse registering of a CBA. The Minister can direct the Registrar not to register the CBA until his/her concerns are addressed;
3. renewed negotiations should be undertaken within a period not exceeding 12 months; 4. collective bargaining on any issue does not necessarily mean an increase in wages as
the agreement may end with an agreement to maintain the “status quo”.
In addition, employees intending to go on strike must have a dispute of interest. The dispute must have been referred to conciliation and a certificate of no settlement must be issued by the conciliator (s93). Once the certificate is issued, employees must choose either to refer the dispute to arbitration or engage in a strike action provided they are not in an essential service. An essential service is described as ‘any service the interruption of which endangers immediately the life, personal safety or health of the whole or any part of the public’ and must have been declared so by the Minister in the government gazette. Employees must give 14 days’ written notice to the employer and the employment council and the trade union in the industry if any. Overall, rules and regulations emanating from the various legislations governing the operations within the labour market are usually poorly implemented and most often impotent. As noted earlier, regulations partly cover the entire market with the large informal segment being uncovered. In the covered segment, regulations are only effective to a limited extent, in terms of compliance, in the public sector; whereas, in the private sector the compliance level is low, due to poor monitoring and implementation. A noticeable practice across sectors in Zimbabwe is the phenomenon of contract employment, whereby firms are not engaging on permanent employment with remuneration that is below industry standards. In addition, contract workers lack access to benefits accruable to permanent and/or core workers. The overall effects of these have been lack of motivation for improved productivity among workers and widening of inequality gap in the country.

26
6. Analysis of the Poverty Datum Line (PDL) in the Wage Setting in Zimbabwe
The Riddell Commission of Inquiry and Wage Setting and Negotiations Following the attainment of independence in 1980, workers had high expectations that the new government would address the distortions in the labour market. As a result, there was a spate of strikes by workers and the government responded by promulgating the Minimum Wage Act in 1980 with the aim of promoting security of employment and raising the standards of living of workers (LEDRIZ, 2011). The employers however, responded by retrenching workers. In line with its policy of protecting workers, the government adopted an Employment Act which ordered stoppage of retrenchments and that no retrenchment would take place without the Minister’s approval. Again, as a way of circumventing Government’s move, employers responded by employing casuals. Hence, in order to deal with the wider issues of incomes, prices and conditions of service, and addressing the inherited anomalies, the government established the Riddell Commission of Inquiry in 1980 under the chairmanship of Roger Riddell. On the minimum wages issue, the Commission recommended that the basis for determining minimum wages should be solely on the needs of the workers and their families and not on the place of work or the type of the work performed. Therefore, whether the person is a domestic or a factory worker, the criterion of need should determine minimum wages. In this light, the criterion of need was embedded in the concept of the PDL. The PDL referred to that income required to satisfy the minimum needs of a family given the size and composition within a defined environment in a condition of basic physical health and social wellbeing. In the case of Zimbabwe, the PDL was based on an average family of six, a father, mother and four children. Based on the above, the Commission recommended targeted income paths for both urban and rural workers1. The Commission also worked on a set of 4 assumptions which included that: 1. Attaining PDL was based on the remarkable economic performance of the first one and a
half years of independence; 2. The Commission assumed a real rate of growth of 10 per cent which would enable a 40
per cent per annum increase in the living standards of the lowest paid sectors of the workforce;
3. The PDL was based on a sustainable redistributive policy focusing on both reduction in internal inequalities and redirection of the productive focus of the economy;
4. Wage targeting was based on: i. an inward looking development strategy with less focus of resolving balance of
payments disequilibrium in the short term; ii. a land reform programme that would reduce rural urban migration and boost
agriculture production and viability. The Commission also recommended that by mid-1984 (three and a half years later), that the minimum wage would be 90 per cent of the PDL and the remaining 10 per cent would be a flexible element to permit rewarding human capital investment (LEDRIZ, 2011). It also
1 The PDL for urban areas was fixed at Z$128 (at December 1980 prices) and the minimum wage was US$85 in 1981. For commercial farms the PDL was pegged at US$77 (60 per cent of the urban PDL).

27
stipulated that the top salaries be frozen (in real terms) until the minimum wage targets were achieved. Unfortunately, the propositions by the Commission could not last due to the poor performance of the economy as a result of a three year consecutive drought period of 1982-84 coupled with the global economic recession. All this hampered the success of Riddell’s wage targeting. Consequently, the government retracted from the “target wage” path and based on the general findings and recommendations of the Riddell Commission adopted a sliding scale mechanism, whereby those at the bottom of the earnings structure received higher percentage increases, and vice versa. Maximum ceilings beyond which no increase was granted were also fixed by government. From this period until 1988, minimum wages were unilaterally set by government, on a two-tier system (domestic and agriculture, and industry and commerce) and were announced at the Workers’ Day rally on May 1 every year. In 1989, government allowed National Employment Boards and National Employment Councils to negotiate within the range 5-16 per cent and in 1990, the negotiations started at 10 per cent, with the ‘sky’ as the limit (Kanyenze, 1993). Overall, the assumptions by the Riddell Commission show that the use of the PDL solely to determine minimum wages does not work as other factors have to be taken into consideration, for example redistribution of wealth and productive resources and levels of economic growth. In fact, lately, most employers in the private sector now tend to take a cue from the public sector. If the government does not increase civil service employees’ salaries, then they also follow the same during NEC bargaining meetings. However, in order to achieve long term sustainability of wages both in the public and private sectors it is it is critical for the parties to look at all the factors that are relevant to negotiations. There are two sets of factors that allow an “integrative” approach to collective bargaining, namely external or push factors; and internal or permissive factors. It is however, the internal factors (the permissive factors – ability-to-pay variables) that should define the final outcome of collective-bargaining processes. This will help achieve sustainable outcomes that do not exacerbate unemployment.
7. Public Sector Wage Bill and its Implications
General government employment accounts for a significant share of the labour force. Trends and developments in public sector wages have an impact on the labour market, competitiveness, public finances and the overall economy. A good understanding of the interactions between government wages and the labour market is of importance in the current context where the country is consolidating its public finances through the implementation of a Staff Monitored Programme (SMP). High public wages may induce a shift of resources out of the private sector into the public sector. Furthermore, a high public wage premium may crowd out private sector employment, inflate labour cost conditions, and lead to competitiveness losses (see Alesina and Perotti, 1997; Alesina et al., 2002; Ardagna, 2004). In most countries, both developed and developing, the public sector wage premia is seen as a manifestation of rents accruing to unions and politicians concerned by electoral motives (Gelb et al., 1991; Holmlund, 1993; Agenor, 1995; Rodrik, 2000, Matschke, 2003). Only recently, the persistence of public sector wage premia has been rationalised on the basis of

28
imperfect labour matching (justifying limited labour mobility between the private and the public sector) and unilateral wage posting in the government sector as opposed to bargaining in the private sector (e.g., Quadrini and Trigari, 2008; Gomes, 2010). As shown in Table 5, government revenue including grants as well as total government revenue as a percentage of GDP increased from 12.6 per cent in 2009 to 26.7 per cent in 2015. Total expenditure as a percentage of GDP increased from 12.1 per cent in 2009 to 28.3 per cent in 2015. Total recurrent spending was 9.9 per cent of GDP in 2009 and 29.2 in 2014. The wage bill as a percentage of GDP was 6.4 per cent in 2009 and 25.8 per cent in 2015. The wage bill as a percentage of GDP ratio provides a measure of the share of the total measured domestic output that goes to covering the cost of engaging Public Service employees. Central government employment costs as a percentage of total expenditures was 51.5 per cent in 2009 and 64.5 per cent in 2014 (Table 6). The employment costs as a percentage of total expenditure ratio provides an indication of the burden of engaging public service employees poses to the budget and ultimately to taxpayers. Table 5: Analysis of Government Revenues and Expenditures in Zimbabwe
Zimbabwe 2009 2010 2011 2012 2013 2014 2015
Revenues and Grants (% of GDP) 12.6 27.1 29.5 28.2 27.7 26.5
26.7
Total Revenue (% of GDP) 12.6 27.1 29.5 26.5 25.3 24.8 24.9 Total Government Expenditure (% of GDP) 12.1 24.6 29.2 29.5 30.2 28.4
28.3
Recurrent Expenditure (% of GDP) 9.9 17.6 24.6 26.7 26.6 25.8
25.8
Capital Expenditure (% of GDP) 0.6 4.6 3.5 2.9 3.6 2.6
2.4
Public Wage Bill (% of GDP) 6.4 9.7 15.1 20.2 20.5 21.4
21.5
Growth in Public Wage Bill (%) - 68.8 75.2 9 32.8 16.5
Average Employee Compensation 3,338 4,177 5,227 6,388 7,091 7,044
Real GDP Growth rate (%) 6 11.4 11.9 10.6 4.5 3.1 Source: ZIMSTAT (various); AfDB Table 5 also shows that growth in the public wage bill in Zimbabwe has far outstripped growth in real GDP and this is not sustainable. For instance, in 2014, the growth in the public wage bill was 16.5 per cent compared to the real GDP growth rate of 3.1 per cent for the same year. Table 6: Analysis of Government Expenditure in Zimbabwe (2009-2014)
2009 2010 2011 2012 2013 2014 Recurrent Expenditure (% of Total Expenditure) 81.5 71.6 84.1 86.8 86.7 89.1 Capital Expenditure (% of Total Expenditure) 4.6 18.5 11.9 8.2 9.4 8.8 Employment Costs (% of Total Expenditure) 51.5 42.3 51.9 58.3 56.9 64.5
Source: Calculations from ZIMSTAT data.

29
Figure 1 shows an analysis of government revenues and expenditures in Zimbabwe, Zambia and Kenya. Figure 1: Analysis of Government Revenues and Expenditures (Zimbabwe, Zambia and Kenya)
Source: ZIMSTAT (various); *ZIPAR; **KIPPRA As indicated in Figure 1, a wage bill of 21.5 per cent of GDP in 2015 is higher for Zimbabwe than for some comparator countries. For instance, Zambia has a public wage bill of 10.1 per cent of GDP in 2014 while in Kenya it is 10.2 per cent of GDP as at 2011. An international comparison shows that Malaysia (5 per cent), Egypt (7.1 per cent) and Mauritius (5 per cent) have wage bill to GDP ratios below 10 per cent (IMF database, 2010). Clearly therefore, the public sector wage bill is now compromising fiscal and debt sustainability, and jeopardizing growth by generating excessive deficits and crowding out growth-enhancing public investments. There is urgent need to stimulate economic growth and similarly reduce the wage bill. In the short to medium term the government should implement a wage policy that is fiscally sustainable. Compared to Sub-Saharan African countries Zimbabwe has one of the highest public employment costs to total government expenditure ratios. Zimbabwe in 2013 had the highest wage bill as a share of government expenditures amongst its neighbours, at 56.9 per cent. The average wage bill to government expenditure ratio in the region is 26.5 per cent. The comparative figures for the selected countries of the region are presented in Figure 2.
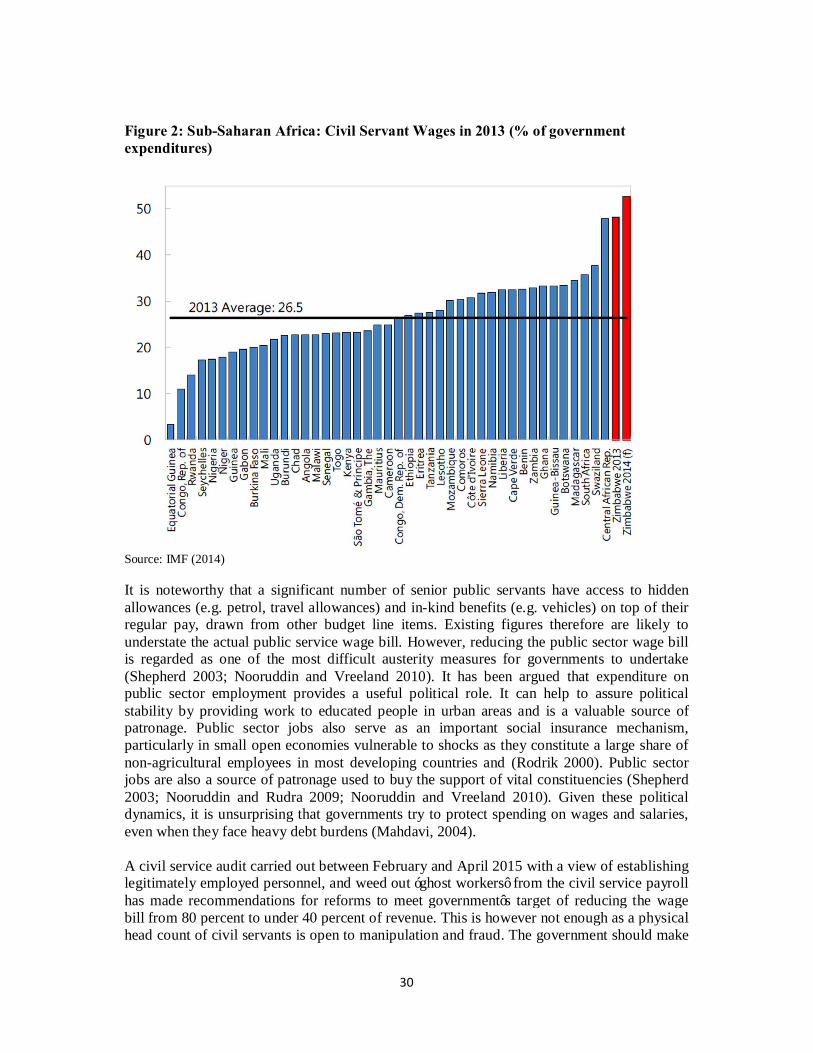
30
Figure 2: Sub-Saharan Africa: Civil Servant Wages in 2013 (% of government expenditures)
Source: IMF (2014) It is noteworthy that a significant number of senior public servants have access to hidden allowances (e.g. petrol, travel allowances) and in-kind benefits (e.g. vehicles) on top of their regular pay, drawn from other budget line items. Existing figures therefore are likely to understate the actual public service wage bill. However, reducing the public sector wage bill is regarded as one of the most difficult austerity measures for governments to undertake (Shepherd 2003; Nooruddin and Vreeland 2010). It has been argued that expenditure on public sector employment provides a useful political role. It can help to assure political stability by providing work to educated people in urban areas and is a valuable source of patronage. Public sector jobs also serve as an important social insurance mechanism, particularly in small open economies vulnerable to shocks as they constitute a large share of non-agricultural employees in most developing countries and (Rodrik 2000). Public sector jobs are also a source of patronage used to buy the support of vital constituencies (Shepherd 2003; Nooruddin and Rudra 2009; Nooruddin and Vreeland 2010). Given these political dynamics, it is unsurprising that governments try to protect spending on wages and salaries, even when they face heavy debt burdens (Mahdavi, 2004). A civil service audit carried out between February and April 2015 with a view of establishing legitimately employed personnel, and weed out ‘ghost workers’ from the civil service payroll has made recommendations for reforms to meet government’s target of reducing the wage bill from 80 percent to under 40 percent of revenue. This is however not enough as a physical head count of civil servants is open to manipulation and fraud. The government should make

31
use of modern identification technologies which captures biometric data to improve payroll administration and weed out ‘ghost employees.’
8. Private/Public Wage Structures and Differentials Public service compensation consists of monetary benefits (basic pay and allowances) and non-monetary benefits (in-kind benefits, job security, status, etc.). Beyond pay, public servants may enjoy other employment rewards. Figure 3 provides an overview of the total reward matrix.
Figure 3: Elements of total compensation in the public sector
Contractually-provided Non-contractual/ intangible Monetary In-kind
Current rewards
Base rewards
1. Base wage/salary. 2. Government contributions to pension and medical schemes.
3. Job security, prestige, social privileges
Allowances 4. Salary supplements, applicable employment allowances.
5. Transportation, housing, meals, travel
6. Trips abroad, training
Future expectations 7. Pension 8. Housing, land, etc. 9.Reputation,re-
employment after retirement
Source: World Bank (2012), Wage Bill and Pay Compression Summary Note Following the inauguration of the Inclusive Government in February 2009, the Minister of Finance announced that all civil servants would receive an allowance of US$100 in hard currency effective from end of February 2009. As a result of these measures, ‘dormant’ civil servants started returning to work such that hospitals that had closed re-opened. In an effort to improve working conditions, the Mid-Term Fiscal Review of July 2009 introduced a modest pay structure for civil servants, recognizing grades initially only across limited differentiated bands, effective from end of July 2009. As a consequence, the allowance was increased by 50 per cent, with the average baseline salary at US$150. A further 35 per cent salary adjustment was made in January 2010, raising the average basic baseline salary to US$204. Further adjustments were made in 2010, January and July 2011. On account of shrinking fiscal space, and especially in 2012, only the allowances (transport and housing) were reviewed in January 2012, with further adjustments being made in January 2014 (see Table 7). Table 7 shows the breakdown of the total civil service package (basic salary, transport and housing allowances) for the period 2011 and 2012. Taking Grade B1 as an example, the allowances constitute 37.2 per cent of the total package in 2011, rising to 46.3 per cent after the January 2012 adjustments, and declining to 42 per cent in 2014. The compression ratio is defined as the ratio of the highest salary to the lowest on the government’s main salary scale. It is a useful indicator of the adequacy of pay. The compression ratio has declined from 1.77 in 2011 to 1.72 in 2012 and 1.59 in 2014. Low ratios suggest that highly skilled workers are underpaid, while unskilled workers are overpaid. Low compression ratios are associated with corruption (Abed and Gupta, 2002; Van Rijckeghem and Weder, 2001).
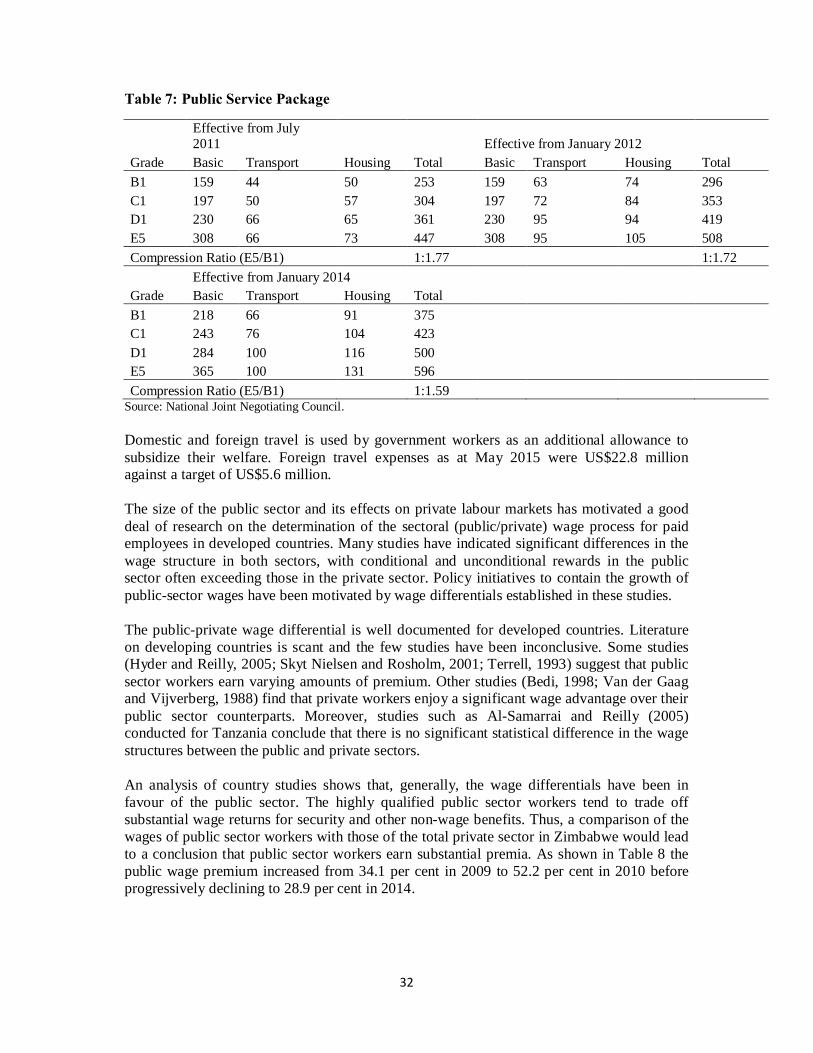
32
Table 7: Public Service Package
Effective from July 2011
Effective from January 2012
Grade Basic Transport Housing Total Basic Transport Housing Total B1 159 44 50 253 159 63 74 296 C1 197 50 57 304 197 72 84 353 D1 230 66 65 361 230 95 94 419 E5 308 66 73 447 308 95 105 508 Compression Ratio (E5/B1)
1:1.77
1:1.72
Effective from January 2014 Grade Basic Transport Housing Total B1 218 66 91 375 C1 243 76 104 423
D1 284 100 116 500 E5 365 100 131 596
Compression Ratio (E5/B1) 1:1.59 Source: National Joint Negotiating Council. Domestic and foreign travel is used by government workers as an additional allowance to subsidize their welfare. Foreign travel expenses as at May 2015 were US$22.8 million against a target of US$5.6 million. The size of the public sector and its effects on private labour markets has motivated a good deal of research on the determination of the sectoral (public/private) wage process for paid employees in developed countries. Many studies have indicated significant differences in the wage structure in both sectors, with conditional and unconditional rewards in the public sector often exceeding those in the private sector. Policy initiatives to contain the growth of public-sector wages have been motivated by wage differentials established in these studies. The public-private wage differential is well documented for developed countries. Literature on developing countries is scant and the few studies have been inconclusive. Some studies (Hyder and Reilly, 2005; Skyt Nielsen and Rosholm, 2001; Terrell, 1993) suggest that public sector workers earn varying amounts of premium. Other studies (Bedi, 1998; Van der Gaag and Vijverberg, 1988) find that private workers enjoy a significant wage advantage over their public sector counterparts. Moreover, studies such as Al-Samarrai and Reilly (2005) conducted for Tanzania conclude that there is no significant statistical difference in the wage structures between the public and private sectors. An analysis of country studies shows that, generally, the wage differentials have been in favour of the public sector. The highly qualified public sector workers tend to trade off substantial wage returns for security and other non-wage benefits. Thus, a comparison of the wages of public sector workers with those of the total private sector in Zimbabwe would lead to a conclusion that public sector workers earn substantial premia. As shown in Table 8 the public wage premium increased from 34.1 per cent in 2009 to 52.2 per cent in 2010 before progressively declining to 28.9 per cent in 2014.

33
Table 8: Average Monthly Earnings, Poverty Lines and Per Capita Income
2009 2010 2011 2012 2013 2014 Private Wage 120 146 200 250 280 340 Public Wage 182 306 342 394 446 478 Municipal Wage 240 315 468 500 560 620 Parastatal Wage 280 346 415 478 535 600 NGOs Wage 420 466 500 544 638 735 Public Wage Premium (%) 34.1 52.3 41.5 36.5 37.2 28.9 Food Poverty Line (FPL) 136.9 145.07 148.56 167.64 159.62 157.49 PDL 453.38 476.37 485.75 543.3 503.81 505.99 Per Capita GDP (US$) 667 764 879 949 1005 1030 Private Wage/PDL (%) 26.5 30.6 41.2 46 55.6 67.2 Public Wage/PDL (%) 40.1 64.2 70.4 72.5 88.5 94.5 Municipal Wage/PDL (%) 52.9 66.1 96.3 92 111.2 122.5 Parastatal Wage/PDL (%) 61.8 72.6 85.4 88 106.2 118.6 NGOs Wage/PDL (%) 92.6 97.8 102.9 100.1 126.6 145.3
Source: calculations from ZIMSTAT data. Wages are in US$. Table 9 reports the trend in real average earnings index for the period 2009 to 2014. The earnings data includes all costs related to employing workers beyond the wage. The average real earnings index for the whole economy has markedly declined from 159 in 2010 to 95.7 in 2014. This seems to confirm that real average earnings in Zimbabwe have been more downwardly flexible than previously thought and have been surprisingly responsive to unemployment rates and the weakening economy in general. Table 9: Real Average Earnings Index (2009-2014)
Sector 2009 2010 2011 2012 2013 2014 Agriculture 100 106.7 96.7 95.3 113.3 126.7 Mining 100 270.8 112.5 114.8 107.8 114.5 Manufacturing 100 130.7 108.3 112 104.9 105.3 Electricity & Water 100 98.7 171.7 107.3 121.8 98.9 Construction 100 182.5 98.6 128.1 131 66.9 Financial Services & Real Estate 100 223.2 111.1 124.7 131.7 78.5 Distribution 100 211.3 106.6 109.7 95.1 94 Transport & Communication 100 149.5 119.2 147 95.2 104.3 Public Administration 100 143.6 171.4 106 123.5 98.2 Education 100 142.6 157 98.9 100 100 Health 100 414.3 146 185.9 105.1 77.5 Private Domestic Services 100 435.8 12 135.2 105.9 104.8 Other 100 53.2 139 123.8 139.9 76.5 Total 100 159 119.7 113 111.5 95.7
Source: ZIMSTAT
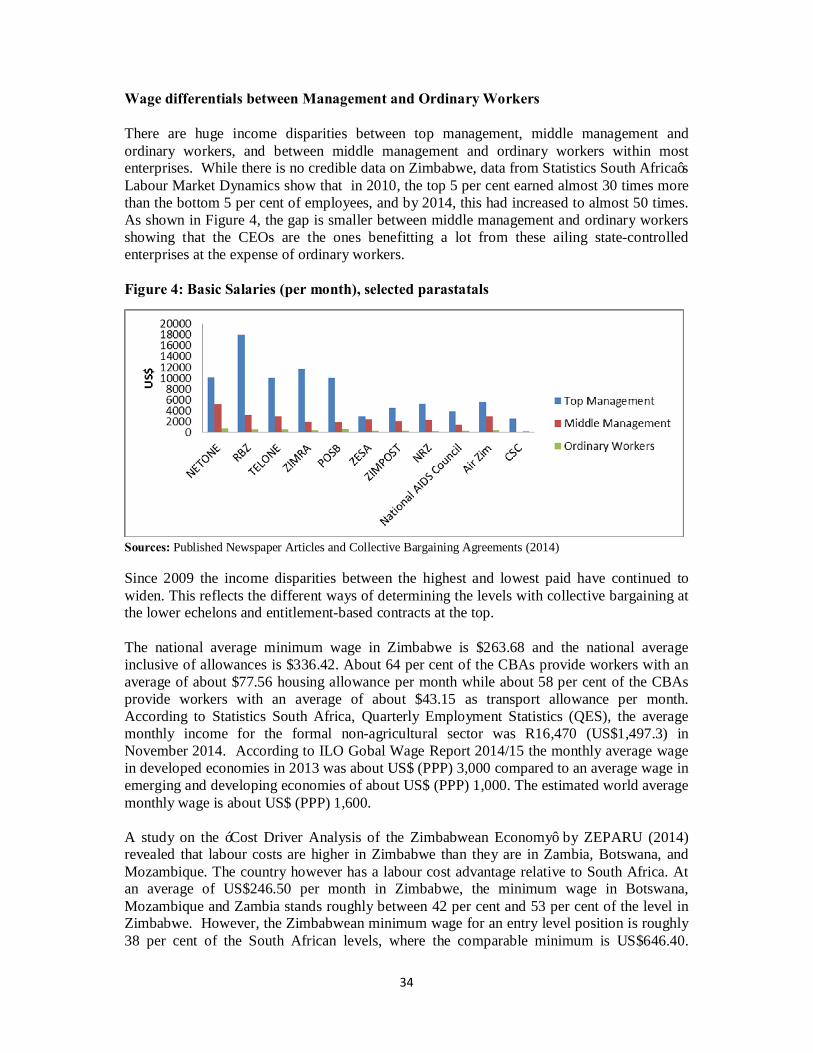
34
Wage differentials between Management and Ordinary Workers
There are huge income disparities between top management, middle management and ordinary workers, and between middle management and ordinary workers within most enterprises. While there is no credible data on Zimbabwe, data from Statistics South Africa’s Labour Market Dynamics show that in 2010, the top 5 per cent earned almost 30 times more than the bottom 5 per cent of employees, and by 2014, this had increased to almost 50 times. As shown in Figure 4, the gap is smaller between middle management and ordinary workers showing that the CEOs are the ones benefitting a lot from these ailing state-controlled enterprises at the expense of ordinary workers. Figure 4: Basic Salaries (per month), selected parastatals
Sources: Published Newspaper Articles and Collective Bargaining Agreements (2014)
Since 2009 the income disparities between the highest and lowest paid have continued to widen. This reflects the different ways of determining the levels with collective bargaining at the lower echelons and entitlement-based contracts at the top. The national average minimum wage in Zimbabwe is $263.68 and the national average inclusive of allowances is $336.42. About 64 per cent of the CBAs provide workers with an average of about $77.56 housing allowance per month while about 58 per cent of the CBAs provide workers with an average of about $43.15 as transport allowance per month. According to Statistics South Africa, Quarterly Employment Statistics (QES), the average monthly income for the formal non-agricultural sector was R16,470 (US$1,497.3) in November 2014. According to ILO Gobal Wage Report 2014/15 the monthly average wage in developed economies in 2013 was about US$ (PPP) 3,000 compared to an average wage in emerging and developing economies of about US$ (PPP) 1,000. The estimated world average monthly wage is about US$ (PPP) 1,600. A study on the ‘Cost Driver Analysis of the Zimbabwean Economy’ by ZEPARU (2014) revealed that labour costs are higher in Zimbabwe than they are in Zambia, Botswana, and Mozambique. The country however has a labour cost advantage relative to South Africa. At an average of US$246.50 per month in Zimbabwe, the minimum wage in Botswana, Mozambique and Zambia stands roughly between 42 per cent and 53 per cent of the level in Zimbabwe. However, the Zimbabwean minimum wage for an entry level position is roughly 38 per cent of the South African levels, where the comparable minimum is US$646.40.
35
Furthermore, the ZEPARU study showed that from 2009 to 2013, the minimum wage in Zimbabwe (in US dollar terms) increased from US$90 to the current US$246.50 level (representing a 173.84 per cent increase) which translates into an average annual growth of 28.6 per cent. On the other hand, the minimum wage levels in the rest of the region only increased by a far less per cent than in Zimbabwe: Zambia (19 per cent), South Africa (6.3 per cent), Mozambique (5.9 per cent) and Botswana (2 per cent) over the same period.
9. Unit Labour Costs and Competitiveness The high cost of doing business in Zimbabwe has seriously eroded the country’s internal and external competitiveness. A major cost driver in Zimbabwe is the general liquidity crunch that is prevailing in the economy. The effect of the liquidity crunch is to increase the cost of borrowing. The high debt overhang has also limited the capacity and ability of the country to borrow on the international capital markets. Another major cost driver is utility charges. This is worsened by the erratic and unreliable supply in the provision of utilities such as energy and water. As shown in Tables 10 and 11 unit labour costs are generally high in Zimbabwe relative to the rest of Africa and Asia. According to 2015 CZI Manufacturing Sector survey the percentage of labour costs to direct costs is 22 per cent while total employee cost as a percentage of total input costs is 28 per cent. While wages and salaries constitute a significant proportion of the total expenditure in many organizations, a closer analysis of these organizations’ balance sheets will reveal that it is actually directors’ emoluments (and benefits) that are accounting for the lion’s share of the total expenditure for salaries and wages. The preferred ways of reducing unit labour costs by firms should be by raising productivity. Capital investment and technological innovation are the best ways to improve productivity. This should be coupled with an overall policy framework focused on increased public infrastructure investments, expanding support for private businesses, and a growing domestic market. Table 10: Unit Labour Costs
2012 2013 2014 Africa East Asia South Asia Mining 0.24 0.29 0.33
Manufacturing 0.28 0.35 0.38 0.33 0.28 0.37 Electricity and water 0.36 0.39 0.39 Construction 0.36 0.48 0.35 Finance, insurance & real estate 0.45 0.42 0.33
Distribution, restaurants and hotels 0.32 0.29 0.27
Transport & communications 0.2 0.25 0.23
Source: Calculations from ZIMSTAT This is particularly more pronounced and stark in parastatals (see Figure 4). This calls for the rationalization of the wage structure.
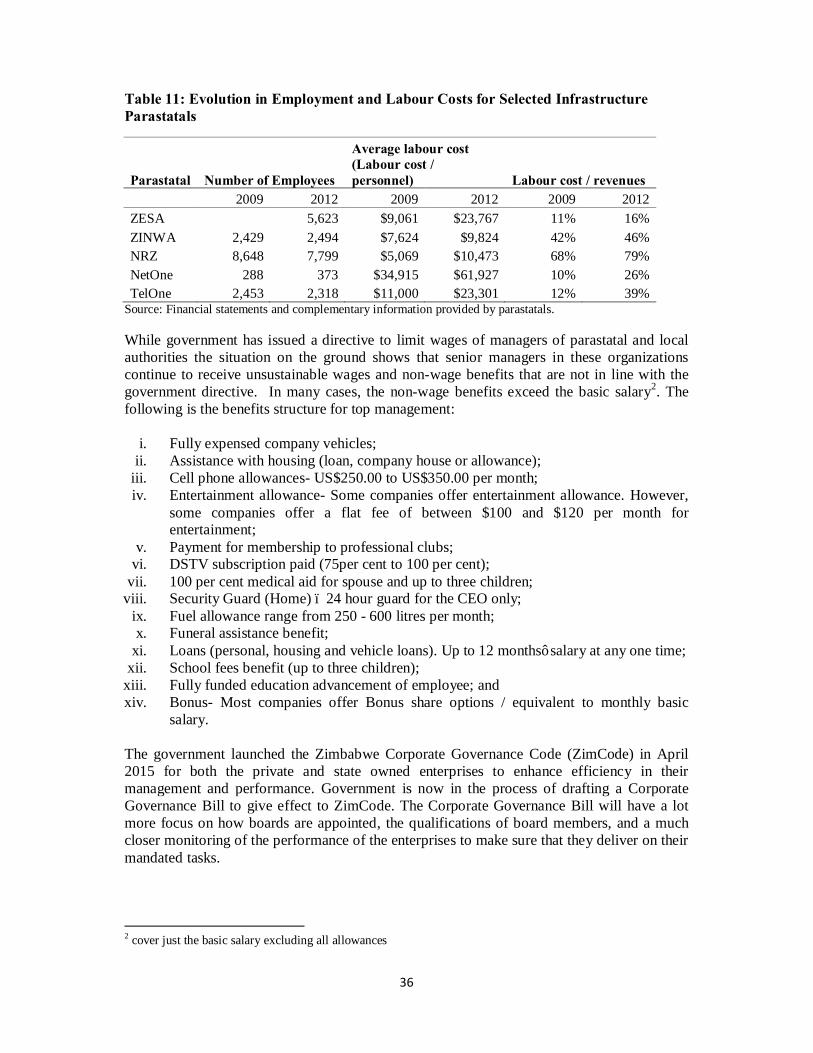
36
Table 11: Evolution in Employment and Labour Costs for Selected Infrastructure Parastatals
Average labour cost
Parastatal Number of Employees (Labour cost / personnel) Labour cost / revenues
2009 2012 2009 2012 2009 2012
ZESA
5,623 $9,061 $23,767 11% 16% ZINWA 2,429 2,494 $7,624 $9,824 42% 46% NRZ 8,648 7,799 $5,069 $10,473 68% 79% NetOne 288 373 $34,915 $61,927 10% 26% TelOne 2,453 2,318 $11,000 $23,301 12% 39%
Source: Financial statements and complementary information provided by parastatals. While government has issued a directive to limit wages of managers of parastatal and local authorities the situation on the ground shows that senior managers in these organizations continue to receive unsustainable wages and non-wage benefits that are not in line with the government directive. In many cases, the non-wage benefits exceed the basic salary2. The following is the benefits structure for top management:
i. Fully expensed company vehicles; ii. Assistance with housing (loan, company house or allowance);
iii. Cell phone allowances- US$250.00 to US$350.00 per month; iv. Entertainment allowance- Some companies offer entertainment allowance. However,
some companies offer a flat fee of between $100 and $120 per month for entertainment;
v. Payment for membership to professional clubs; vi. DSTV subscription paid (75per cent to 100 per cent);
vii. 100 per cent medical aid for spouse and up to three children; viii. Security Guard (Home) – 24 hour guard for the CEO only;
ix. Fuel allowance range from 250 - 600 litres per month; x. Funeral assistance benefit;
xi. Loans (personal, housing and vehicle loans). Up to 12 months’ salary at any one time; xii. School fees benefit (up to three children);
xiii. Fully funded education advancement of employee; and xiv. Bonus- Most companies offer Bonus share options / equivalent to monthly basic
salary. The government launched the Zimbabwe Corporate Governance Code (ZimCode) in April 2015 for both the private and state owned enterprises to enhance efficiency in their management and performance. Government is now in the process of drafting a Corporate Governance Bill to give effect to ZimCode. The Corporate Governance Bill will have a lot more focus on how boards are appointed, the qualifications of board members, and a much closer monitoring of the performance of the enterprises to make sure that they deliver on their mandated tasks.
2 cover just the basic salary excluding all allowances

37
The country scores very badly on the major business competitiveness indices. This is shown in Table 12. Table 12: Competitiveness and Ease of Doing Business Rankings (2008-2015)
Year World Economic Forum (WEF) Global
Competitiveness Rankings World Bank (WB) Ease of Doing Business
Rankings 2008 129/131 154/183 2009 118/121 160/183 2010 132/134 156/183 2011 136/139 157/183 2012 132/142 170/183 2013 132/144 172/185 2014 131/148 170/189 2015 124/144 171/189 2016 125/140 155/189 Sound infrastructure is necessary for competitiveness as it helps to reduce the cost of doing business. Zimbabwe used to have some of the best infrastructure in sub-Saharan Africa (SSA), but the quality has been deteriorating owing to lack of investment, compounding other disincentives to investment. Table 13 comparative analysis of power outage indicators for Zimbabwe (2011), Zambia (2013), Mozambique (2007) and Botswana (2010). Table 13: Comparative Analysis of Power Outage (Infrastructure) Indicators
Zimbabwe (2011)
Zambia (2013)
Mozambique (2007)
Botswana (2010)
Number of electrical outages in a typical month 6.7 5.2 1.6 4.1 Duration of a typical electrical outage (hours) 5 2.1 2.2 2.5 Average duration of a typical electrical outage (hours) 5.9 2.8 4.3 2.7 Losses due to electrical outages (% of annual sales) 6.9 5.5 1.2 2.9 Average losses due to electrical outages (% of annual sales) 8.8 7.5 2.4 3.7 Per cent of firms owning or sharing a generator 53 27.3 12.6 34.5 Proportion of electricity from a generator (%) 5.4 1 1.3 0.6 Average proportion of electricity from a generator (%) 10.4 15.4 10.8 6.5 Days to obtain an electrical connection (upon application) 30 18.9 12.7 39.2 % of firms identifying electricity as a major constraint 46.8 27.1 24.8 34.8 Source: World Bank Enterprise Surveys The country’s external sector position remains precarious reflecting the loss of competitiveness in the overall economy. Figure 5 shows the current account balance as a percentage of GDP. The contraction in economic activity, rising domestic costs and an
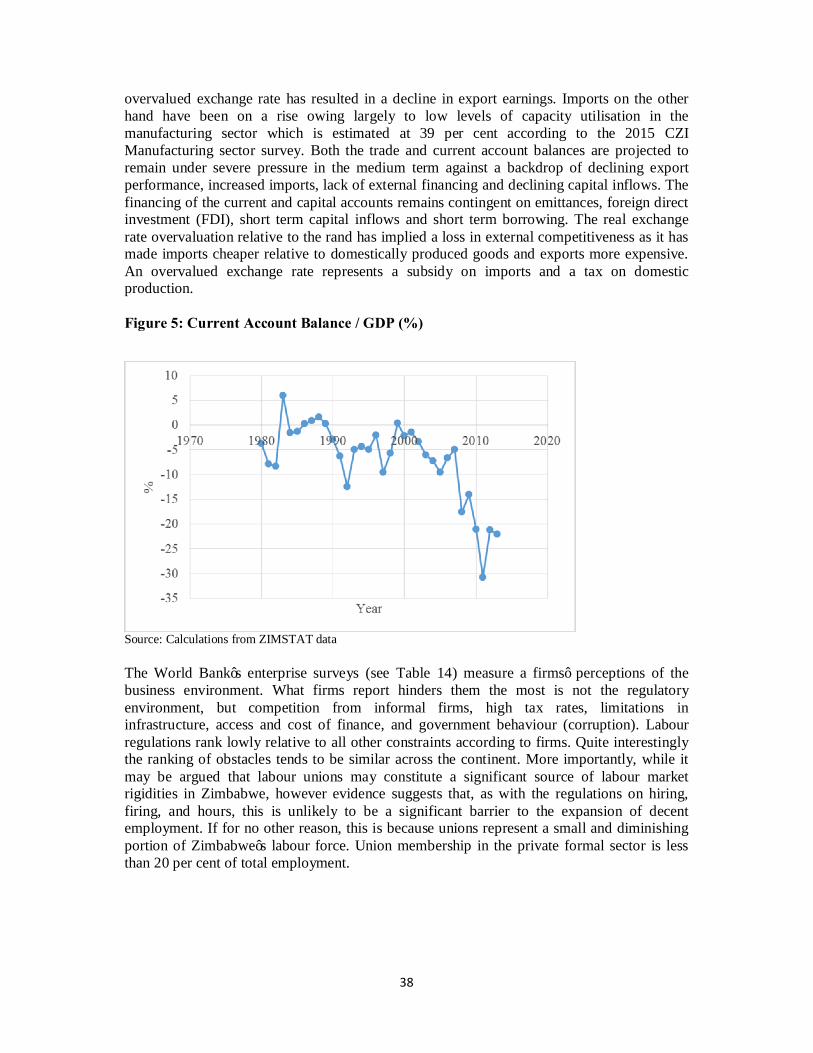
38
overvalued exchange rate has resulted in a decline in export earnings. Imports on the other hand have been on a rise owing largely to low levels of capacity utilisation in the manufacturing sector which is estimated at 39 per cent according to the 2015 CZI Manufacturing sector survey. Both the trade and current account balances are projected to remain under severe pressure in the medium term against a backdrop of declining export performance, increased imports, lack of external financing and declining capital inflows. The financing of the current and capital accounts remains contingent on emittances, foreign direct investment (FDI), short term capital inflows and short term borrowing. The real exchange rate overvaluation relative to the rand has implied a loss in external competitiveness as it has made imports cheaper relative to domestically produced goods and exports more expensive. An overvalued exchange rate represents a subsidy on imports and a tax on domestic production. Figure 5: Current Account Balance / GDP (%)
Source: Calculations from ZIMSTAT data The World Bank’s enterprise surveys (see Table 14) measure a firms’ perceptions of the business environment. What firms report hinders them the most is not the regulatory environment, but competition from informal firms, high tax rates, limitations in infrastructure, access and cost of finance, and government behaviour (corruption). Labour regulations rank lowly relative to all other constraints according to firms. Quite interestingly the ranking of obstacles tends to be similar across the continent. More importantly, while it may be argued that labour unions may constitute a significant source of labour market rigidities in Zimbabwe, however evidence suggests that, as with the regulations on hiring, firing, and hours, this is unlikely to be a significant barrier to the expansion of decent employment. If for no other reason, this is because unions represent a small and diminishing portion of Zimbabwe’s labour force. Union membership in the private formal sector is less than 20 per cent of total employment.
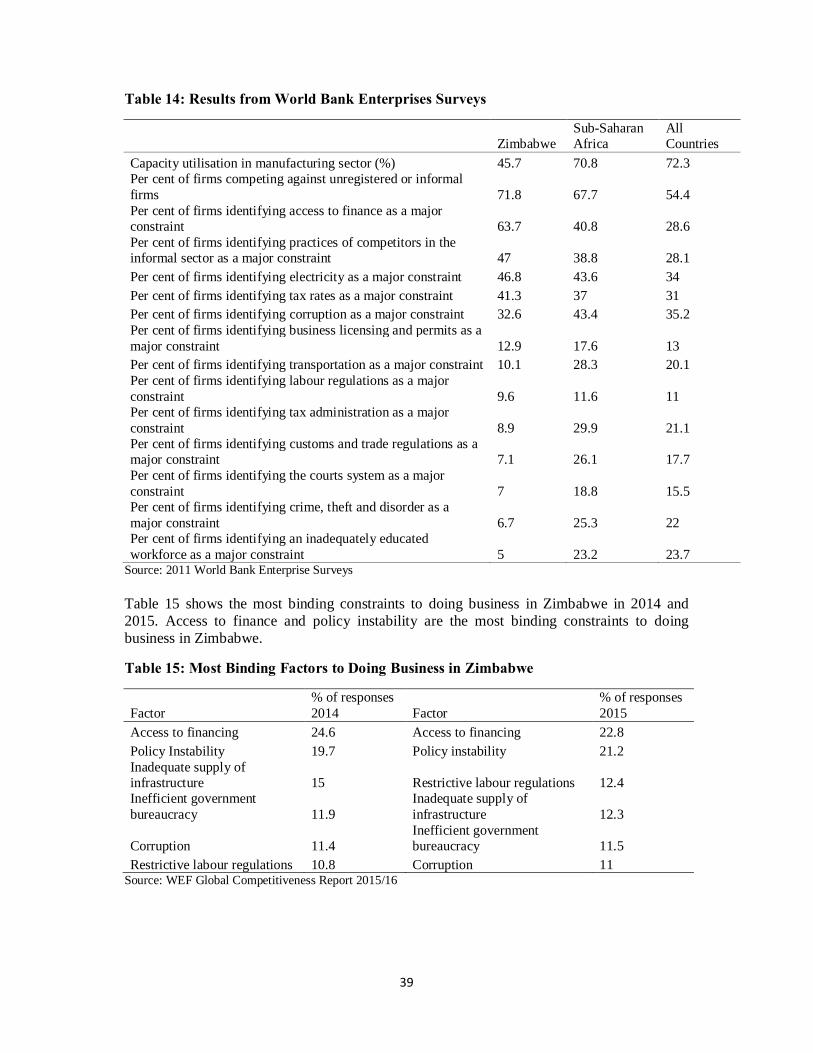
39
Table 14: Results from World Bank Enterprises Surveys
Zimbabwe
Sub-Saharan Africa
All Countries
Capacity utilisation in manufacturing sector (%) 45.7 70.8 72.3 Per cent of firms competing against unregistered or informal firms 71.8 67.7 54.4 Per cent of firms identifying access to finance as a major constraint 63.7 40.8 28.6 Per cent of firms identifying practices of competitors in the informal sector as a major constraint 47 38.8 28.1 Per cent of firms identifying electricity as a major constraint 46.8 43.6 34 Per cent of firms identifying tax rates as a major constraint 41.3 37 31 Per cent of firms identifying corruption as a major constraint 32.6 43.4 35.2 Per cent of firms identifying business licensing and permits as a major constraint 12.9 17.6 13 Per cent of firms identifying transportation as a major constraint 10.1 28.3 20.1 Per cent of firms identifying labour regulations as a major constraint 9.6 11.6 11 Per cent of firms identifying tax administration as a major constraint 8.9 29.9 21.1 Per cent of firms identifying customs and trade regulations as a major constraint 7.1 26.1 17.7 Per cent of firms identifying the courts system as a major constraint 7 18.8 15.5 Per cent of firms identifying crime, theft and disorder as a major constraint 6.7 25.3 22 Per cent of firms identifying an inadequately educated workforce as a major constraint 5 23.2 23.7
Source: 2011 World Bank Enterprise Surveys Table 15 shows the most binding constraints to doing business in Zimbabwe in 2014 and 2015. Access to finance and policy instability are the most binding constraints to doing business in Zimbabwe.
Table 15: Most Binding Factors to Doing Business in Zimbabwe
Factor % of responses 2014 Factor
% of responses 2015
Access to financing 24.6 Access to financing 22.8 Policy Instability 19.7 Policy instability 21.2 Inadequate supply of infrastructure 15 Restrictive labour regulations 12.4 Inefficient government bureaucracy 11.9
Inadequate supply of infrastructure 12.3
Corruption 11.4 Inefficient government bureaucracy 11.5
Restrictive labour regulations 10.8 Corruption 11 Source: WEF Global Competitiveness Report 2015/16
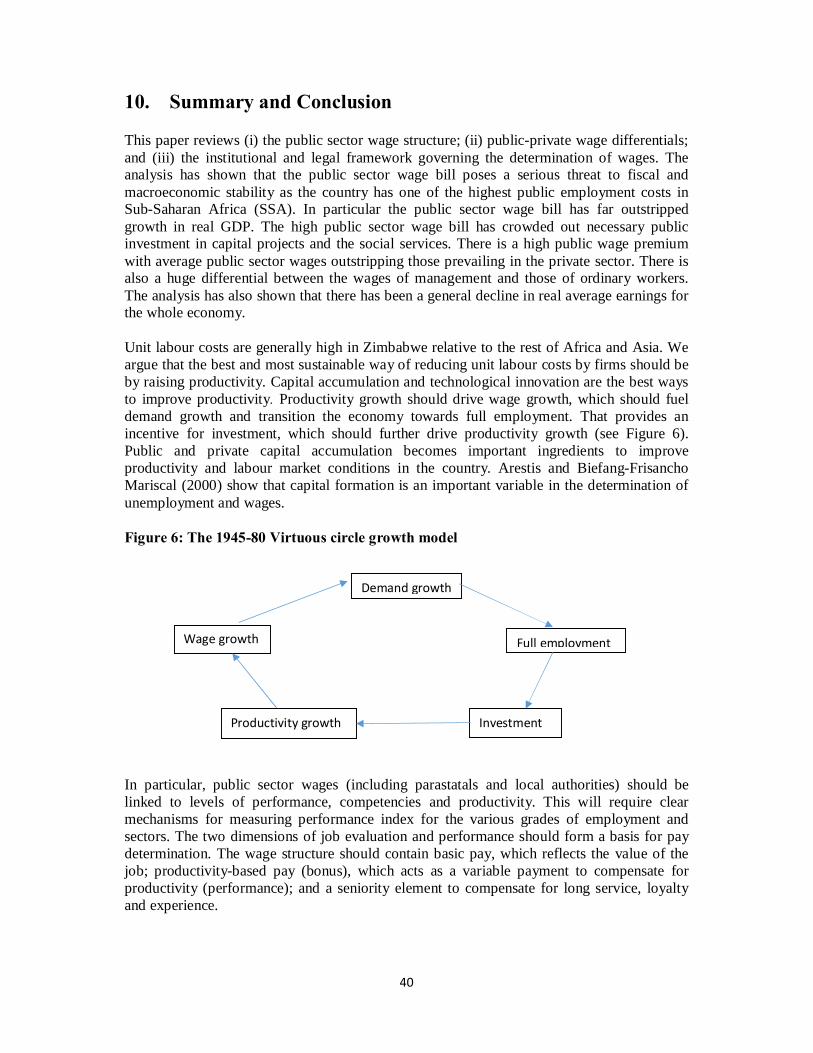
40
10. Summary and Conclusion
This paper reviews (i) the public sector wage structure; (ii) public-private wage differentials; and (iii) the institutional and legal framework governing the determination of wages. The analysis has shown that the public sector wage bill poses a serious threat to fiscal and macroeconomic stability as the country has one of the highest public employment costs in Sub-Saharan Africa (SSA). In particular the public sector wage bill has far outstripped growth in real GDP. The high public sector wage bill has crowded out necessary public investment in capital projects and the social services. There is a high public wage premium with average public sector wages outstripping those prevailing in the private sector. There is also a huge differential between the wages of management and those of ordinary workers. The analysis has also shown that there has been a general decline in real average earnings for the whole economy. Unit labour costs are generally high in Zimbabwe relative to the rest of Africa and Asia. We argue that the best and most sustainable way of reducing unit labour costs by firms should be by raising productivity. Capital accumulation and technological innovation are the best ways to improve productivity. Productivity growth should drive wage growth, which should fuel demand growth and transition the economy towards full employment. That provides an incentive for investment, which should further drive productivity growth (see Figure 6). Public and private capital accumulation becomes important ingredients to improve productivity and labour market conditions in the country. Arestis and Biefang-Frisancho Mariscal (2000) show that capital formation is an important variable in the determination of unemployment and wages. Figure 6: The 1945-80 Virtuous circle growth model
In particular, public sector wages (including parastatals and local authorities) should be linked to levels of performance, competencies and productivity. This will require clear mechanisms for measuring performance index for the various grades of employment and sectors. The two dimensions of job evaluation and performance should form a basis for pay determination. The wage structure should contain basic pay, which reflects the value of the job; productivity-based pay (bonus), which acts as a variable payment to compensate for productivity (performance); and a seniority element to compensate for long service, loyalty and experience.
Productivity growth
Wage growth
Investment
Full employment
Demand growth
41
Institutions originating from the various legislations governing the operations within the labour market are usually poorly implemented and most often ineffective. Regulations partly cover the entire market with the large informal segment being uncovered. In the covered segment, regulations are only effective to a limited extent, in terms of compliance, in the public sector; whereas, in the private sector the compliance level is low, due to poor monitoring and implementation. Improving labour market outcomes also entails dealing the high levels of informalisation. The government should reduce informal employment by lowering the cost of transitions to formality through the creation of an enabling policy and regulatory environment that reduces barriers to formalization, while protecting workers’ rights and increasing the benefits of being formal by promoting a greater awareness of the advantages and protection that come with formalization (business development services for MSMEs, access to the market, productive resources, credit programmes, and training and promotional programmes to upgrade informal economy units). Zimbabwe can learn from countries such as Colombia and Brazil that have successfully reduced the levels of informalisation significantly through well-coordinated policies. According to the ILO (2013), in Colombia, for instance, Act No. 1429 provides MSMEs with incentives to formalize their structures through tax reductions and to create new employment, particularly for vulnerable groups such as young workers under the age of 28. Measures to increase productivity include modernizing the institutional framework for MSMEs, improving their access to financial markets and providing assistance for technological development. In 2010, the General Act on SMEs in Brazil created the legal concept of ‘individual micro-entrepreneur’ and simplified registration, with a single contribution giving access to social security, medical care and maternity leave. A certificate issued to formal individual micro-entrepreneurs facilitates their access to markets and credit. It is estimated that 3 million workers have been formalized in this way. In Chile, the 2006 SME Act constitutes an important step towards a more enabling environment for the formalization of MSEs and introduces a series of changes in the regulatory framework and in SME support services.
11. Policy Recommendations A number of policy implications can be distilled from the analysis. These include:
Policy Area 1: Addressing the Wage Bill
Establish Fiscal Rules to Put a Ceiling on the Public Sector Wage Bill Given the unsustainable public wage structure there is need to institute a cap on the public sector wage bill. The Public Finance Management (PFM) Act should be amended to ensure that the government pursues fiscal responsibility. In line with regional and international best practice government should: 1. Allocate a minimum of 30 per cent of the Budget to development expenditure implying
that recurrent expenditure (including the wage bill) should not exceed 70 per cent of the Budget.
42
2. Ensure that expenditure on wages and benefits do not exceed 35 per cent of taxes and not more than 10 per cent of GDP.
This should be clearly specified as a rule in the Public Finance Management Act. Implementing a fiscal rule to determine the public sector wages also help to reduce the scope of government to use wages for electoral purposes. Biometric Payroll Registration of Public Sector Workers and Pensioners In 2015, the Civil Service Commission successfully completed the physical head count for all civil servants as part of the staff audit. This however is not enough as the process is open to human manipulation and fraud. As a result, the government may not succeed in effectively dealing with the problem of ghost workers and removing them from the payroll system. What is needed is the use of modern identification technologies which captures biometric data. Therefore, as part of the process of cleaning the payroll database of the public sector workers and pensioners and improving the payroll administration the government through the Civil Service Commission should undertake a process of biometric payroll registration of all public sector workers and pensioners. This has been successfully implemented in a number of African countries such as Ghana, Nigeria and Kenya as part of their payroll audits. The biometric payroll data will then be used to effect salary payments. This process is aimed at capturing among others every public sector employee’s national identity, completed biometric data, academic and professional certificates, letters of appointment and current payslip. Through the use of biometrics public service employees and pensioners can be accurately identified and remove ghost workers from the payroll. Pass a Statutory Instrument (SI) Limiting Parastatal and Municipal Wages In light of the prevailing high and unsustainable salaries in the parastatals sector, government has capped salaries and allowances for managers in state-owned companies and municipalities at a maximum of US$6,000 per month. However, to ensure compliance with this directive, government should pass a Statutory Instrument (SI) to give legal effect to this noble directive. In addition, wages in the parastatals should be compressed in order to reduce the difference between highest and lowest paid. Lansley and Reed (2013) report a variety of examples where private firms or cooperatives voluntarily implemented top-to-bottom ratios between 6:1 to 19:1. France has imposed a maximum 20:1 pay ratio in public sector firms in 2012, which has put a downward pressure on executive pay in some major private companies as well (Lansley and Reed, 2013). In 2013, in a referendum in Switzerland, 35 percent of the voters voted for legally capping the top-to-bottom pay ratio in all firms at 12:1. Alignment of the Public Service salary negotiations with the National Budget Process The fact that the Public Service wage bill is part of the expenditure component of the national budget, outputs from the salary consultations should inform the national budget expenditures. Thus, there is need to institute a framework to set the time frames for wage setting that allows inputs from consultations to be incorporated in the national budget. This institutionalised framework should be respected by all parties and it ensures transparency during the salary consultations. It further limits distortions in salary determination and keeps wage bill expenditure in line with national income. Adopt Integrative Collective Bargaining in both Public and Private Sectors In order to achieve long term sustainability of wages both in the public and private sectors it is it is critical for the parties to look at all the factors that are relevant to negotiations. There
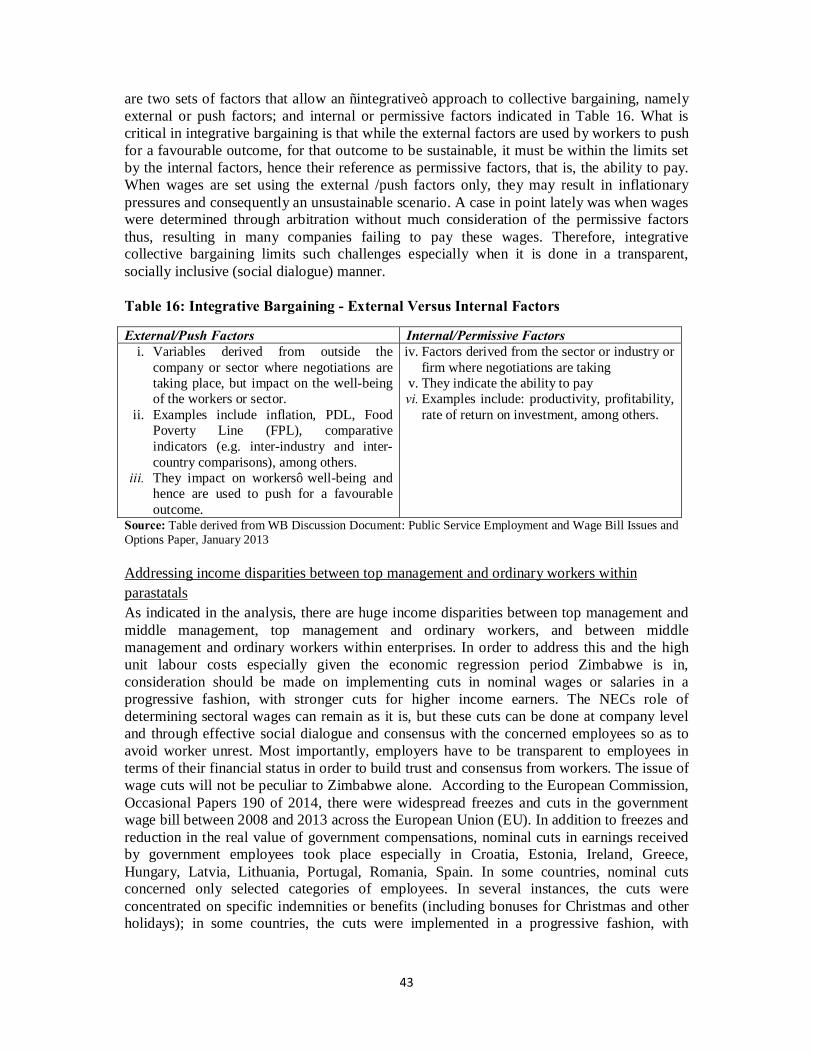
43
are two sets of factors that allow an “integrative” approach to collective bargaining, namely external or push factors; and internal or permissive factors indicated in Table 16. What is critical in integrative bargaining is that while the external factors are used by workers to push for a favourable outcome, for that outcome to be sustainable, it must be within the limits set by the internal factors, hence their reference as permissive factors, that is, the ability to pay. When wages are set using the external /push factors only, they may result in inflationary pressures and consequently an unsustainable scenario. A case in point lately was when wages were determined through arbitration without much consideration of the permissive factors thus, resulting in many companies failing to pay these wages. Therefore, integrative collective bargaining limits such challenges especially when it is done in a transparent, socially inclusive (social dialogue) manner. Table 16: Integrative Bargaining - External Versus Internal Factors
External/Push Factors Internal/Permissive Factors i. Variables derived from outside the
company or sector where negotiations are taking place, but impact on the well-being of the workers or sector.
ii. Examples include inflation, PDL, Food Poverty Line (FPL), comparative indicators (e.g. inter-industry and inter-country comparisons), among others.
iii. They impact on workers’ well-being and hence are used to push for a favourable outcome.
iv. Factors derived from the sector or industry or firm where negotiations are taking
v. They indicate the ability to pay vi. Examples include: productivity, profitability,
rate of return on investment, among others.
Source: Table derived from WB Discussion Document: Public Service Employment and Wage Bill Issues and Options Paper, January 2013 Addressing income disparities between top management and ordinary workers within parastatals As indicated in the analysis, there are huge income disparities between top management and middle management, top management and ordinary workers, and between middle management and ordinary workers within enterprises. In order to address this and the high unit labour costs especially given the economic regression period Zimbabwe is in, consideration should be made on implementing cuts in nominal wages or salaries in a progressive fashion, with stronger cuts for higher income earners. The NECs role of determining sectoral wages can remain as it is, but these cuts can be done at company level and through effective social dialogue and consensus with the concerned employees so as to avoid worker unrest. Most importantly, employers have to be transparent to employees in terms of their financial status in order to build trust and consensus from workers. The issue of wage cuts will not be peculiar to Zimbabwe alone. According to the European Commission, Occasional Papers 190 of 2014, there were widespread freezes and cuts in the government wage bill between 2008 and 2013 across the European Union (EU). In addition to freezes and reduction in the real value of government compensations, nominal cuts in earnings received by government employees took place especially in Croatia, Estonia, Ireland, Greece, Hungary, Latvia, Lithuania, Portugal, Romania, Spain. In some countries, nominal cuts concerned only selected categories of employees. In several instances, the cuts were concentrated on specific indemnities or benefits (including bonuses for Christmas and other holidays); in some countries, the cuts were implemented in a progressive fashion, with
44
stronger cuts for higher income employees. Thus, Zimbabweans can consider tailor-making such strategies alongside the ones above.
Policy Area 2: Addressing the Institutional Framework for Wage Settings
Resuscitate the National Productivity Institute (NPI) To ensure that wages are linked to productivity, the government should resuscitate the National Productivity Institute (NPI). The NPI is a tripartite organisation with representation from the government, employers’ and employees’ organisations established to promote a productivity culture and consciousness in Zimbabwe by coming up with national and sectoral scientific benchmarks to guide productivity bargaining. The NPI develops, disseminates knowledge and experience in productivity, for promoting consciousness and improvement in productivity, with the objective of strengthening the performance and competitiveness of the economy as well as of improving the working conditions and quality of life. A fully functional NPI should provide a reliable and credible database for decision making including collective bargaining purposes. Other objectives of the NPI include: to improve the productivity and economic performance of the economy; to promote the development of efficient and internationally competitive Zimbabwean industries; to facilitate adjustment to structural change; and to promote productive employment of resources. For effectiveness and national ownership of the NPI and its outcomes, there is need to inculcate social dialogue and inclusiveness principles. Restructuring the role of NECs to focus on non-wage issues The institutional wage negotiation setting in the private sector (NECs) are overall good, their role has been relegated to wage negotiations only. It is critical that the role of the NECs be realigned so that they do not just focus on wages but also consider issues of human resources development, productivity and competitiveness (permissive factors) at both the sectoral and national levels. The current wages-setting framework and trends were set during the transition to multi-currency and were based on the rebound effects of the economy in 2009. Given that the economy is in a regression mode, there is need to realign wage setting with permissive factors. Each sectoral NEC should facilitate its parties to discuss in a transparent manner the sectoral permissive factors in determining wage outcomes. Therefore, research and analysis on these factors by the NECs contributes to the foundations of sustainable wage settings. In addition, NECs should: 1. Facilitate the development of social plans through social dialogue. Social plans
incorporates re-training, re-skilling and re-deployment programmes of retrenched workers. This will ensure employment security and integration of retrenched workers into the mainstream economy. Lessons can be drawn from the South African experiences on social plans.
2. Strengthen monitoring and compliance mechanisms of sectoral agreements.
Moreover, to enhance efficiency in the collective bargaining structure it is imperative to allow decentralized wage setting while keeping coordination to help the macroeconomic adjustment. A combination of industry-level and firm-level bargaining can help to achieve flexibility and coordination. Firm-level agreements can adjust wages to the specific
45
conditions faced by firms. Industry-level agreements can set floors and, when needed, help the adjustment of wages and prices in response to major macroeconomic shocks.
Harmonisation and effective coordination of institutions dealing with wage setting and negotiations in the Public Sector The various institutional frameworks for wage consultations and bargaining for various sub-sectors in the civil service are noble and should be maintained since each sub-sector has peculiar needs and interests. However, what is required is to ensure effective coordination between the Ministry of Public Service Labour and Social Welfare, CSC, NJNC and HSBNP. This will limit divergence of views and ensures clarity of purpose. In order to do this, the NJNC and the HSBNP should be merged as the centre voice for workers in the public sector on common issues of basic salaries and allowances since the two institutions have similar bipartite structures. Specific sectoral interests can be dealt with by the sectoral associations. There is also need for the harmonisation and coordination of labour legislation for public sector workers in Zimbabwe in order to create uniform standards and provide worker rights for both private sector and public sector workers. Therefore, the various public sector Acts should be collapsed into one main Act for the nation.
Policy Area 3: Reforming the Legal Framework Reforming Labour Legislation in the Public Sector Given the plethora of Acts governing the public sector which are also source of lack of coordination within the public sector, there is need to harmonise these Acts with the main Labour Act. This process was once spearheaded by the tripartite social partners in 2010 but was abandoned. There is need for the social partners to revisit this process. Harmonisation of these Acts should also inform harmonisation of the institutions dealing with salary negotiations which are NJNC and HSBNP (see point 11.9 above). Adopt growth-friendly tax reforms High taxes on labour income depress labour supply and can reduce firms’ labour demand by driving up the cost of labour (due to high employers’ contributions or payroll taxes). Tax reforms can impact economic growth also via private investment and productivity (Arnold et al., 2011; Bouis et al., 2012). A more growth-friendly tax system can be achieved by shifting the tax burden away from direct income toward consumption, immovable property and the environment. Personal and corporate income taxes, as well as social security contributions, are the most distortive taxes as they have sizable adverse effects on labour use, productivity and capital accumulation. Shifting the tax mix away from such taxes and towards recurrent taxes on immovable property (the least distortive to the labour market) and consumption taxes should thus raise living standards (Johansson et al., 2008).

46
12. References Abed, G., and S. Gupta, (2002). Governance, Corruption & Economic Performance
(Washington: International Monetary Fund). Agell, J. (1999). On the Benefits from Rigid Labor Markets: Norms, Market Failures and
Social Insurance, Economic Journal 109, pp. 143-164. Agenor, P.R., (1995). The labour market and economic adjustment, IMF Working Paper,
95/125. Alesina, A. and R. Perotti, (1997). The welfare state and competitiveness, American
Economic Review, 87, 921-939. Alesina A., Ardagna S., Perotti R. and Schiantarelli F. (2002). Fiscal policy, profits, and
investment, American Economic Review, 92/3, 571-589. Al-Samarrai, S. and Reilly, B. (2005). Education, Employment and Earnings of Secondary
School-Leavers in Tanzania: Evidence from a Tracer Study, PRUS Working Paper No. 31. Brighton: Poverty Research Unit at Sussex, University of Sussex.
Akerlof, G. (1984). An Economist’s Book of Tales, Cambridge University Press, Cambridge. Arnold, J., B. Brys, Ch. Heady, Å. Johansson, C. Schwellnus and L. Vartia, (2011). Tax
Policy For Economic Recovery and Growth. The Economic Journal, 121, pp. F59-F80.
Ardagna, S., (2004). Fiscal stabilizations: when do they work and why, European Economic Review 48, 1047-1074.
Arestis, P., Baddeley, M. & Sawyer, M. (2007). The relationship between capital stock, unemployment and wages in nine EMU countries. Bulletin of Economic Research 59(2), 125-148.
Arestis, P. and I. Biefang-Frisancho Mariscal (2000): “Capital Stock, Unemployment and Wages in the UK and Germany,” Scottish Journal of Political Economy, 47 (5), pp. 487—503.
Barr, N. (1998). The Economics of the Welfare State, 3rd ed., Oxford University Press. Bartelsman, E., A. Bassanini, J. Haltiwanger, R. Jarmin, S. Scarpetta & T. Schank (2003).
The spread of ICT and productivity growth. Is Europe really lagging behind in the new economy, in D. Cohen, P. Garibaldi and S. Scarpetta (eds.), The ICT Revolution: Productivity Differences and the Digital Divide, Oxford University Press.
Bassanini, A. and E. Ernst (2002). Labour market regulation, industrial relations and technological regimes, Industrial and Corporate Change 11 (3), 391-426.
Bedi, A. S. (1998). Sector Choice, Multiple Job Holding and Wage Differentials: Evidence from Poland, The Journal of Development Studies, 35, pp. 162-79.
Belot, M. and J. Van Ours (2004). Does the Recent Success of Some OECD Countries in Lowering their Unemployment Rates Lie in the Clever Design of their Labor Market Reforms?, Oxford Economic Papers Vol. 56, pp.621-42.
Besley, T. and R. Burgess (2004). Can Labour Regulation Hinder Economic Performance? Evidence from India, The Quarterly Journal of Economics, Vol. 119, No. 1, pp. 91-134.
Betcherman, G. (2013). Labour Market Institutions: A Review of the Literature, The World Development Report 2013.
Blanchard, O. (2002). Designing Labour Market Institutions (unpublished; Cambridge, Massachusetts: MIT). Available via the Internet: http://econwww.mit.edu/faculty/blanchar/papers.htm
Botero, J., S. Djankov, R. La Porta, F. Lopez de Silanes, and A. Shleifer (2003). The Regulation of Labour, NBER Working Paper 9756.
47
Bouis, R., O. Causa, L. Demmou R. Duval and A. Zdzienicka (2012). The short-term effects of structural reforms: an empirical analysis. OECD Economics Department Working Papers, forthcoming, OECD, Paris.
Cesar, C. and A. Chong (2003). Are Labour Market Regulations an Obstacle for Long-Term Growth? Presented at Seventh Annual Conference of the Central Bank of Chile on “Labour Markets and Institutions
Chen, M. (2007). Rethinking the Informal Economy: Linkages with Formal Economy and the Formal Regulatory Environment, DESA Working Paper No. 46.
CZI (2015). 2015 Manufacturing Sector Survey Report. European Commission, (2014). European Economy: Government wages and labour market
outcomes, Occasional Papers 190 of 2014, Brussels, Belgium. Das, S.K. (1998). Civil Service Reform and Structural Adjustment. Delhi, Oxford University
Press. Dabla-Norris, E., K. Kochhar, F. Ricka, N. Suphaphiphat and E. Tsounta (2015). Causes and
consequences of income inequality: A global perspective, IMF Staff Discussion Note 15/13.
Downes, A. S., N. Mamingi and R. B. Antoine (2000). Labour Market Regulation and Employment in the Caribbean, Inter-American Development, Research Network Working Paper #R-3888.
Fallon, P. and D. Very. (1988). The Economics of Labour Markets. Oxford, Phillip Allen. Fleetwood, S. (2008). A Trans-disciplinary (Proto) Model of Labour Markets, Centre for
Employment Studies Research, Bristol Business School University of the West of England, Working Paper 12.
Folawewo, A. (2015). Institutions, Regulatory Framework and Labour Market Outcomes in Nigeria. Paper prepared for 10th IZA/World Bank Conference on Employment and Development: Technological Change and Jobs, 4 – 6 June, 2015, Bonn, Germany
Gelb, A., J.B. Knight and R.H. Sabot. (1991). Public Sector Employment, Rent Seeking and Economic Growth. The Economic Journal 101(408): 1186-1199.
Ghosh, J.(2011).The challenge of ensuring full employment in the twenty-first century. The Indian Journal of Labour Economics, 54(1), 51-68.
Goldsmith, A. A. (1999). Africa's Overgrown State Reconsidered: Bureaucracy and Economic Growth. World Politics 51(4): 520-546.
Gomes, P., (2010). Fiscal policy and the labour market: the effects of public sector employment and wages, IZA Discussion Paper 5312.
Gregg, P. and A. Manning (1997). Labour market regulation and unemployment In: Snower, Dennis J. and de la Dehesa, Guillermo, (eds.) Unemployment Policy. Cambridge University Press, Cambridge, UK, 395-419. ISBN 9780521599214
Heckman J.J. and P. Carmen, (2000). The Cost of Job Security Regulation: Evidence from Latin American Labor Markets, NBER Working Papers 7773, National Bureau of Economic Research, Inc.
Hyder, A. and Reilly, B. (2005). The Public Sector Pay Gap in Pakistan: A Quintile Regression Analysis, in PRUS Working Paper No. 33.
ILO 2005. Report of the Southern Africa Sub-Regional Conference on Youth Employment: The Youth Employment Challenge in Southern Africa: Policy Responses and Programmes Targeting Young Women and Men at National and Sub-Regional Level, 17-19 October, ILO-SRO. <http://www.ilo.org/wcmsp5/groups/public/---ed_emp/---emp_policy/---invest/documents/meetingdocument/wcms_asist_8055.pdf>.
ILO (2013). Transitioning from the informal to the formal economy. Report V(1) to the International Labour Conference 103rd Session 2014.
48
ILO (2014). (Unpublished). Poverty Datum Line and Productivity for Minimum Wage Fixing: Issues at Stake, Harare, Zimbabwe.
ILO (2015). Gobal Wage Report 2014/15. Geneva. Kanyenze, G (1993). The Impact of Economic Stabilisation on the wage structure in
Zimbabwe: 1980-1990, PhD Thesis, University of Sussex, UK Lansley S. and H. Reed (2013). How to Boost the Wage Share. London: Trades Union
Congress. LEDRIZ, (2011). Beyond the Enclave: Towards a Pro-Poor and Inclusive Development
Strategy for Zimbabwe, Weaver Press, Harare, Zimbabwe Madhuku, L (2015). Labour Law in Zimbabwe, Weaver Press, Harare, Zimbabwe Mahdavi, S., (2004). Shifts in the Composition of Government Spending in Response to
External Debt Burden. World Development 32(7): 1139-1157. Mizala, A., Romaguera, P. and S. Gallegos (2011). Public-Private Wage Gap in Latin
America (1992-2007): A Matching Approach, Labour Economics18, pp. S115-S31. Nooruddin, I. and N. Rudra. (2009). Are Developing Countries Really Defying the
Embedded Liberalism Compact? (Manuscript). Nooruddin, I. and J. R. Vreeland. (2010). The Effect of IMF Programs on Public Wages and
Salaries. In Global Governance, Poverty and Inequality, edited by Jennifer Clapp and Rorden Wilkinson. London, Routledge.
Nyamukapa, D (2008). Social Dialogue in Zimbabwe (Unpublished), Harare, Zimbabwe. Palley, T. (2011).The economics of wage-led recovery: analysis and policy
recommendations. International Journal of Labour Research, 3(2), 219-243. Palley, T. (2007).Seeking full employment again: Challenging the Wall Street paradigm.
Challenge, 50(6), 1-37. Palmade, V. and A. Anayiotos. 2005. Rising Informality: Reversing the Tide. Viewpoint
series, Note 298. World Bank Group, Private Sector Development Vice Presidency, Washington, D.C
Petrin A. and J. Sivadasan (2006). Job Security Does Affect Economic Efficiency: Theory, A New Statistic, and Evidence from Chile, NBER Working Paper No. 12757.
Quadrini, V. and A. Trigari, (2008). Public employment and the business cycle, Scandinavian Journal of Economics, 109/4, 723-742.
Rama, M. (1995). Do Labour Market Policies and Institutions Matter? The Adjustment Experience in Latin America and the Caribbean. Labour (Special Issue): S243-268.
Ramoni-Perazzi, J. and D. Bellante (2007). Wage Differentials between the Public and the Private Sector: How Comparable are the Workers?, Journal of Labour Research, XXVIII, pp. 117-33.
Rodrik, D. (2000). What Drives Public Employment in Developing Countries? Review of Development Economics 4(3): 229-243.
Rowthorn, R. E. (1995). Capital formation and unemployment. Oxford Review of Economic Policy, 11(1), 26–39.
Sanchez-Puerta, M.L.S. (2010). Labour Market Policy Research for Developing Countries: Recent Examples from the Literature. What do we know and what should we know? Social Protection and Labour, the World Bank, SP Discussion Paper No. 1001.
Scarpetta, S. and T. Tressel (2004). Boosting productivity via innovation and adoption of new technologies: any role for labour market institutions? World Bank Research Working Paper 3273, World Bank, Washington, DC.
Schindler, M. (2009). The Italian Labor Market: Recent Trends, Institutions and Reform Options, IMF Working Paper, WP/09/47.
Shepherd, G. (2003). Civil Service Reform in Developing Countries: Why Is It Going Badly? 11th International Anti-Corruption Conference. Seoul.
49
Skyt Nielsen, H. and M. Rosholm, (2001). The Public-Private Sector Wage Gap in Zambia in the 1990s: A Quantile Regression Approach, Empirical Economics 26, pp. 169-82.
South Africa (Republic). 2014. Labour Market Dynamics in South Africa 2014. Statistics South Africa. Pretoria.
South Africa (Republic). (2014). Quarterly Employment Statistics (QES). Statistics South Africa. Pretoria.
Stockhammer, E. & Klär, E. (2011). Capital accumulation, labour market institutions and unemployment in the medium run. Cambridge Journal of Economics, 35, 437–457.
Summers, L.H. (1998). Some Simple Economics of Mandated Benefits, American Economic Review Vol. 78, No. 2, pp. 177-183.
Terrell, K. (1993). Public-Private Wage Differentials in Haiti: Do Public Servants Earn a Rent? Journal of Development Economics 42, pp. 293-314.
UNCTAD (2010) Trade and Development Report. Geneva. Uzhenyu, D (2015). Collective Bargaining in the Public Sector, A Panacea to Perpetual
Conflicts and Labour Unrest (Strikes): A Study of Zimbabwe Experiences. Paper Presented at the 17th IRELA World Congress, Cape Town, South Africa.
Van Rijckeghem, C., and B. Weder, (2001). Bureaucratic Corruption and the Rate of Temptation: Do Wages in the Civil Service Affect Corruption, and by How Much? Journal of Development Economics, Vol. 65, pp. 307–31.
van de Walle, Nicolas. (2001). African Economies and the Politics of Permanent Crisis, 1979-1999. New York, Cambridge University Press.
World Bank, (2013). Public Service Employment and Wage Bill: Issues and Options Paper, Harare, Zimbabwe.
World Bank, (2012). World Development Report. World Bank: Washington. Zimbabwe, (2013). Constitution of Zimbabwe Amendment (No. 20), Harare, Zimbabwe.