Embed Size (px)
Citation preview

WA13. Sig SYSTEMS ARCHITECTS INC RANDOLPHe MASS F,16 Q/2COMPUTER SYSTEMS ACQUISITION mTRICS K ,AtOoR. VOLUME 1. INTROD-- ETC(AY 82 P19|26-6O-C-0207IMJ¢ LASSZFIE | [0Z-TR.B2 R311) NLEi/E/I/I/IllI*lmllllllmllluIIIIIIIIIIIIIuflllflf/lfllffllf

ESD-TR- 82-143(I)
JNTRODUCTION AND GENERAL INSTRUCTIONS' ORCOMPUTER SYSTEMS ACQUISITION METRICS0 HANDBOOK. VOLUME L
Systems Architects, Inc.50 Thomas Patten DriveRandolph, MA 02368
May 1982
Approved for public release;Distribution unlimited.
K Prepared for
ELECTRONIC SYSTEMS DIVISIONAIR FORCE SYSTEMS COMMANDDEPUTY FOR TECHNICAL OPERATIONS ANDPRODUCT ASSURANCEHANSCOM AIR FORCE BASE, MASSACHUSETTS 01731
82 10 18 0 2
______________________ . ~ ~ ,' .m.
-. it . . .

LEGAL NOTICE
When U. So Government drawings, specifications or other data are used for anypurpose other than a definitely related government procurement operation, thegovernment thereby incurs no responsibility nor any obligation whatsoever; andthe fact that the government may have formulated, funished, or in any way sup-plied the said drawings, specifications, or other data is not to be regarded byimplication or otherwise as in any manner licensing the holder or any other personor conveying any rights or permission to manufacture, use, or sell any patentedinvention that may in any way be related thereto.
OTHER NOTICES
Do not return this copy. Retain or destroy.
REVIW AND APPROVAL
This technical report has been reviewed and is approved for publication.
ROBERT V. VIERAITIS, Jr., iLt, USAF INW. YELY, Jr., Lt Col, USAFProject Officer Chief, Computer Engineering
Applications Division
FOR THE COXWDER
LTER V. TURG8(tActing Director, Enineering and TestDeputy for hchnical Operations
and Product Assurance

UnclassifiedSECURITY CLASSIFICATION OF THIS PAGE n Dot .neo, , ,
READ INSTRUCTIONSREPORT DOCUMENTAXION PAGE BEFORE COMPLETING FORMI. REPORT NUMBER 2. GOVT ACCESSION NO 3. RECIPIENT'S CATALOG NUMBER
ESD-TR-82-143(I) 1iA- Amo 57_0 - _ _"
_
4. 7iTLE (and Subtitle) S. TYPE OF REPORT & PERIOD COVERED
t troduction and General InstructionslforComputer Systems Acquisition MetricsHandbook. Volume I. 6. PERFORMING OIG. REPORT NUMBER
7. AUTNOR(s) a. CONTRACT OR GRANT NUMBER(a)
Systems Architect, Inc.F19628-80-C-0207
S. PERFORMING ORGANILAION NAME.ANO AfnnRFtS 10. PROGRAM ELEMENT. PROJECT. TASK
Systems Architects, Inc. AREA a WORK UNIT NUMBERS
50 Thomas Patten DriveRandolph, MA 02368
II. CONTROLLING OFFICE NAME AND ADDRESS 12. REPORT DATE
Electronic Systems Division (TOEE) May 1982Hanscom AFB 13. NUM!;R OF PAGES
Massachusetts 01731 __
14. MONITORING AGENCY NAME & ADDRESS('l different from Controlling Office) 1. SECURITY CLASS. (of this report)
UnclassifiedIS. DECL ASSI FICATION/DOWNGRADING
SCHEDULE
16. DISTRIBUTION STATEMENT (of this Report)
Approved for public release; distribution unlimited.
17. DISTRIBUTION STATEMENT (of the abetract entered in Block 20, It different from Report)
I. SUPPLEMENTARY NOTES
It. KEY WORDS (Coanee an re'tee side It n*aeeay mnd Ioeftl by bock nmber)
Computer systemsMetricsQuality assurnceSoftware
LASSTRAC' (Continue an reverse sid it nom an,,, I dentif by block mrbeorV%
is volume provides an overview to a standard set of procedures forqualitatively specifying and measuring the quality of a computer softwaresystem during its acquisition life cycle
D A N 1473 EOR ON , 1ov *l OBSoLTE UnclassifiedSCURITY CLASSIFICATION OF THIS PAGE (Nta, wet. bNe
iii _ _ _ _.. . ._

TABLE OF CONTENTS
Section Title Page
I INTRODUCTION TO SOFTWARE METRICS
1.1 OVERVIEW. .. .................. I-11.2 SOFTWARE METRICS FRAMEWORK .. .......... I-1
-1.Z.1 Quality Factors. .. ........... 1-31.2.2 Criteria .. ............... 1-31.2.3 Metrics. .. ............... 1-91.2.4 Data Elements. .. ............ 1-9
II SOFTWARE DEVELOPMENT LIFE CYCLE MODEL
2.1 INTRODUCTION..... .. .. .. .. . . . .......2.2 THE SOFTWARE DEVELOPMENT LIFE CYCLE MODEL FOR
METRICS .. .....................- 12.3 THE SOFTWARE DEVELOPMENT LIFE CYCLE MODEL FROM
ESD GUIDEBOOK SERIES. . . .............- 12.4 SOFTWARE DEVELOPMENT PRODUCTS. ......... 11-3
2.4.1 First Metric Application InformationRequirements .. ............. 11-4
2.4.2 Update Information Requirements .. .....11-82.4.3 Documentation Considerations. .......11-12
2.4.3.1 Contents of Documents. ......11-122.4.3.2 Product Mappin*-. I.~ . . . . . 11-122.4.3.3 Appropriate Leyels of A '~~
Metrics . . . . ... .. '~l2.4.3.4 Sequencing of *fetric Appfi*i. hitl
tion . .. -,16
2.5 APPLICABILITY OF SOFTWARE METW(:CS JM1G~iLIFE CYCLE .I . ........ 11k16
III HANDBOOK FRAMEWORK t ?,tot
3.1 COMPONENTS OF COMPUTER SYSTEM* ACQUJ.6,TO~32METRICS HANDBOOK........ 111-132INTERRELATIONSHIP OF*S6FTWARiEMETRiC'A!fr
HANDBOOK'S FRAMEWORKS . . . 4.. .. . . . . . .IV HOW THE HANDBOOK WORKS
4.1 INTRODUCTION. .. ................. V-l4.2 STEPS FOR USING THE! SOiTWRI3MPThICS IIAND)ISOOK .V-
4.3 IDENTIFICATION OF WORKSHEETS .. ......... IV-24.4 DATA ELEMENT DICTIONARY (flED) . .. .. .. . .IV-4

TABLE OF CONTENTS (Cont'd)
Section Title Page
V QUALITY FACTOR SELECTION
5.1 INTRODUCTION .. ................. V-15.2 QUALITY FACTOR TRADE OFFS . . .. V-15.3 SIGNIFICANCE OF QUALTTY FACTORS IN C SYSTEMS . V-3
VI QUALITY FACTOR EVALUATION
6.1 POST DATA COLLECTION .. .. ........... VI-1
6.2 EVALUATION .. .................. VI-1
A011 *d#%? 4
iv.v6.

SECTION I
INTRODUCTION TO SOFTWARE METRICS
1.1 OVERVIEW
This Handbook contains a standard set of procedures to quanti-
tatively specify and measure the quality of a computer software
system during its acquisition life cycle. These quantitative
measures, or metrics, provide the user with a tool to better as-
sess the system's development and potential performance throughout
the acquisition phases.
The metrics are calculated from the answers to questions,
called data elements in this Handbook, which also serve as a check-
list to aid Software Quality Assurance. These metrics are a tool
for current Software Quality Assurance practices. They are an
added feature to current tools and techniques utilized in Software
Quality _-urance practices.
The Handbook is tailored specifically to address embedded Com-
mand Control and Communications (C ) computer systems. Efforts to
apply the procedures to other than C3 systems may require reworking
by the user of the materials contained in the Handbook.
1.2 SOFTWARE METRICS FRAMEWORK
Software Metrics are a set of measurements for measuring es-
sential aspects of software systems. Realistic assessments and
ratings are based on the measurements so that the overall quality
of a system's software can be made visible.
There are four levels in the Software Metrics Framework pre-
sented in this Handbook: (1) Factors, (2) Criteria, (3) Metrics,
and (4) Data Elements. This Framework is illustrated in Figure I-1.
Each level of the Framework is defined in the following sub-sections. Conflicting or different definitions outside of this
Handbook are not applicable to Software Metrics, and conversely,
I-I

1-2I

the definitions found within this Handbook are not necessarily ap-
plicable to other concepts.
1.2.1 Quality Factors
Quality Factors are management-oriented terms which
define desirable characteristics of the software systems
under development from a management perspective. Presenceof these Quality Factors improve the probability of producing
the desired softwsre system. A quantitativei/analysis of the
Quality Factors will indicate areas of weakness and strength
in the system. Maintainability and Integrity are two ex-amples of Quality Factors. Maintainability refers to the
effort required to locate and fix an error in an operational
program. Integrity refers to the extent to which access to
software or data by unauthorized persons can be controlled.
Eleven (11) Quality Factors have been selected for
this Handbook. TABLE I-A contains a complete list of the
Quality Factors and their definition. A discussion of se-
lecting appropriate Quality Factors for a specific system is
found in Section V, "Quality Factor Selection".
1.2.2 Criteria
Criteria form the next level of the Framework underthe Quality Factors. Criteria are software-oriented terms
that describe software attributes. Each Quality Factor has
two or more Criteria related to it in a hierarchy. Consis-
tency and Simplicity are two examples of Criteria related to
the Quality Factor "Maintainability". Consistency and Sim-
plicity are two examples of Criteria related to the QualityFactor "Maintainability". Consistency refers to those attri-
butes of the software that provide implementation of function
* in the most understandable manner.
Twenty-two (22) Criteria have been included in this
Handbook. TABLE I-B contains a complete list of the Criteria
and a definition for each. Figure 1-2 shows the relationship
of the Criteria to the Quality Factors.
I
. . . . .. . . . . . . . . . . . .. . . . .

FACTOR DEFINITION
Extent to which a program satisfies itsCorrectness (Co) specifications And fulfills the user's missionobj ectives.
Reliability (Re.) Extent to which a program can be expected toperform its intended function with requiredprecision.
Efficiency (Ef) The amount of computing resources and coderequired by a program to perform a function.
Integrity (It) Extent to which access to software or data byunauthorized persons can be controlled.
Usability (US) Effort required to learn, operate, prepareinput, and interpret output of a program.
Maintiainability Effort required to locate and fix an error in(Ma) an operational program.
Testability (To) Effort required to test a program to insure itperforms its intended function.
Flexibility (x) Effort requited to modify an operationalprogram.
Portability (PE) Effort required to transfer a program from onehardware eonfiguration and/or software system.................. environment to another.
Reusabilit7 (Ru) Exteat to which a program can be used in other9"liCations - relatoedto the packaging anddSpe of the functions that programs perform.
Interoperability Effort requiredto couple one system with(Ip) aelther.
TABLE .- A
QUALITY FACTOR TABLE
1-4
-_I
CRITERION DEFINITION
Those attributes of the software that providea thread from the requirements to the imple-
Traceability mentation with respect to the specific develop-ment and operational environment.
Those attributes of the software that provideCompleteness full implementation of the functions required.
Those attributes of the software that provideuniform design and implementation techniques
Consistency and notation.
Those attributes of the software that provideAccuracy the required precision in calculation andoutputs.
Those attributes of the software that providecontinuity of operation under nonnominalError Tolerance conditions.
Those attributes of the software that provideSimplicity implementation of functions in the most under-standable manner. (Usually avoidance of prac-
,________tices which increase complexit v).Those attributes of the software that provide
odularity a structure of highly independent modules.
Those attributes of the software that provideGenerality breadth to the function performed modules.
Those attributes of the software that provideExpandability for expansion of data storage requirements orcomputational functions.
Those attributes of the software that provideInstrumentation for the measurement of usage or identificationI eaof erTors.
Self - Those attributes of the software that provideDescriptiveness explanation of the implementation of a
function.
TABLE I-B
CRITERIA TABLE
I-No

CRITERION IDEFINITIONExecution Those attributes of the software that provideEfficiency for minimum processing time.
Those attributes of the software that provideStorage for minimum storage requirements duringEfficiency operation.
Those attributes of the software that provide
Access Control for control of the access of software and data.,
Those attributes of the software that provideAccessAuditfor an audit of the access of software andAccessAuditdata.
Those attributes of the software that deter-mine operation and procedures concerned with
Operability the operation-of the software.
Those attributes of tesotwMare that provide
training transition from current operation or initialfamiliarization.
Those attributes of the software that provideCommutiativeness useful inputs and outputs which can be
ass iuilated.
hseattrMIbue of7tV software that determine
Softwar'e System its dependendy on the softwaf#6 *lvirohmentIndependence (operating systems, utilities, input/output
- routines, etc.).
those atttibutes of the software that determineMadhine its dependency dn the hardw~are system.-Independence
CoftuicatioaSf Thse attributes of tht software that ProvideCoinonality Wkl use of standard pr~tdcols and intatfice
Thote attributes of the software that provideDats Com~onality the Ilse of StAndaitd data representations.
KJYAAB -. __nee

CORRECTNESS
Traceability conisteI u cmpleteanes's
ErrTole rancs consistency Accuracy Simplicity
r Execution Efficiency Storage Efficiency
LEGENDSFactor u
=CriteriaAccess Cantrol Access Audit 7
USMI LITY
Training- Conmicatle; s Operability
FIGURE 1-2
RELATIONSHIP OF CRITERIA TO SOFTWARE QUALITY FACTORS
1-7

Staplenera I~ M uaity Expar~nd ai S If-Os cri ptl vnts s
hTESTABILIT
Smsp lvlty oaminc ty IonstrmnataaCuiona t 9-e
LISENLIT
TO SOFWARE QALITYFATR(Cnnud
I-8 __________smMchie______rpt
i, '
INTEPEMB-IT

1.2.3 Metrics
Metrics are at the third level of the Framework and
represent the measurable aspects of the Criteria. Each Cri-
terion has at least one Metric, while some Criteria have sev-
eral Metrics associated with them. Design Structure Measure,
Structured Programming Check, and Complexity Measure are ex-
amples of the Metrics connected with the Criterion "Simplicity".Thirty-seven (37) Metrics have been identified in this
Handbook. TABLE I-C has a complete list of the Metrics.
1.2.4 Data Elements
Data Elements are at the fourth level of the Framework.
They are quantifyable questions that combine to produce a
Metric Value. An algorithm based on the answers to Data Ele-
ments for each Metric determines the value for each Metric.
Data Elements are questions about the software and software
development products that call for either YES-NO or numeric
type responses. Each Metric has at least one Data Element.
For example, Hierarchical Structure, Module Independence, and
Size of Data Base are the Data Elements that comprise the
Metric "Design Structure Measure". Hierarchical Structure
asks the question: "Is a hierarchical chart provided which
identifies all modules in the system?" Module Independence
asks: "Is the module independent of the source of the input
or the destination of the output?" And size of Data Base asks:"Number of unique data items in a data base?" All 126 Data
Elements are defined in a Data Element Dictionary which is
provided as part-of this Handbook.
I-9
1* ____ _0_

Access Audit Checklist
Access Control Checklist
Accuracy Checklist
Communications Commonality Checklist
User Input Interface MesureUser Output Interface Moa~ureCompleteness Checklist
Procedure Consistency Measure
Data Consistency Measure
Data Commonality Checklist
Perfornance Requirements CheckIterative Processing Efficiency Measure
Data Usage Efficiency MpspraError Tolerance Control Checklist
Recovery From Improper Input Data Checklist
Recovery From Computational Failures Checklist
Recovery From Hardware Faults Chpcklist
Recovery From Device Error# ChocklistData Storage Expansion Measure
Extensibility Measure
Implementation For G nerality Checklist
Module TestiS Mesprf
Integration Testing Measure
System Testing Measure
Machine Independence Measure
Modular Implementation Measure
Operability Checklist
Quantity of Cqmments
Effectiveness of Commostf Upqsure
Descriptiveness .of Implemsattion Language Measure
Storage. Efficiency Mesur.Design Structyre Meespr*Complexity MeasureMeasure of Coding SimplicitySoftware System Independence Measure
Traiania Checklist
Trapoab4lily checklist
TABLE I-C
METRICS
I -10j-- I - - , _ , w_ _%_

SECTION II
SOFTWARE DEVELOPMENT LIFE CYCLE MODEL
2.1 INTRODUCTION
The Software Development Life Cycle Model is a management toolthat describes the major activities of a software development effort
in the order in which they are performed. There have been a numberof Software Development Life Cycle Models developed, each for a
particular environment. The Software Development Life Cycle Model
adapted for use in relationship to the Metric is a simple one,
generic in nature. The idea behind selecting such a simple model
is that it can be mapped into more particular models so that theMetrics can be applied in a wide range of environments.
2.2 THE SOFTWARE DEVELOPMENT LIFE CYCLE MODEL FOR METRICS
The Software Development Life Cycle Model for Metrics has
five phases; (1) Requirements Analysis (2) Preliminary Design (3)
Detail Design (4) Implementation and (5) Test and Integration.
As of the writing of this Handbook,Metrics have been developed
for the first four phases and are still under development for the
Test and Integration phase and therefore Metrics for this phase
are not included in this Handbook. We discuss this phase of the
model because update information is collected during this phase.
2.3 THE SOFTWARE DEVELOPMENT LIFE CYCLE MODEL FROM ESD GUIDEBOOKSERIES
The Software Development Life Cycle Model from the ESD Guide-book Series has seven phases; (1) Conception (2) Analysis (3)Design (4) Coding and Checkout (5) Test and Integration (6)Installation and (7) Operation and Support. Figure 11-1 maps the
1f-1
kS

(
a n
.............I ,
" Ii
* ll
i i
....... ........
11

Metrics model into the Guidebook series model. As can be seen in
Figure II-1 there are three major differences between the two
models; (1) The Metrics model does not consider three of the
Guidebook phases, "Conception", "Installation" or "Operation
and Support" (2) The Metrics model's "Requirements Analysis"
and "Preliminary Design" phases correspond to the Guidebook's
"Analysis" phase and (3) The Metrics models "Detail Design" and
"Implementation" correspond to the Guideboo1t's "Design" and
"Coding and Checkout". This particular mapping is based on thedescription of these phases in the Guidebook and explains why
Metrics "Preliminary Design" is mapped to "Analysis" and not to"Design". It should be made clear that these models are descrip-tions of the order in which events usually take place and are
not "Directives" that demand events take place in that order.Therefore there are no "Hard acid Fast" rules for any mapping,
the users judegement must be exercised in applying the metrics
using the life cycle models involved as a guide, not a directive.
2.4 SOFTWARE DEVELOPMENT PRODUCTS
In order to apply the Metrics to measure software quality,
two types of information must be available. The first type of
information required is the original organized documentation that
describes the system being measured. The second type of informationrequired by Software Metrics is the revisions to the original
documents. The original documents are utilized by Software Met-
rics in the first application efforts, in order to catch develop-
ment problems early in the life cycle. The revised documents are
measured during the update process in order to determine whether
these problems have been corrected adequately. This information
is available in what can be generically called "Software Develop-
ment Products". These "Software Development Products" are pro-
duced throughout the "Software Development Life Cycle" and includc
11-3

such products as; requirement specifications, design documentation,
system/module'diagrams and flowcharts with PDL, code listings and
complete sets of plans and procedures. For a more detailed under-
standing, as an example use the "Products" tied to the ESD Guide-
book Life-Cycle Events Guidebook. These are "Products" that are
usually produced during the development and acquisition of an
embedded software system. Table II-A lists these "Products" as
they appear in the Guidebook and organized under the Guidebooks
Software Development Life Cycle Model. By using the Table II-A
in conjunction with Figure II-1 it is possible to map these
"Products" into the Metric Software Development Model. The results
of this mapping is demonstrated in Figure 11-2 and in more detail
in Figure 11-3. Notice that products of later phases provide in-
formation required for updates of Metrics originally calculated
in earlier phases.
2.4.1 First Metric Application Information Requirements
The initial types of information required by Software
Metrics (for the Requirement Analysis Metrics) are Tradeoff
Study Reports and System Specifications. These documents are
usually generated during an analysis of system alternatives.
Other documents necessary for Requirements Analysis phase
Metrics are authenticated development specifications for
each CPCI and any specification or ICD changes, which are
generated during allocation of requirements to the computer
program. FIGURE 11-3 details the activities and products in
the Requirements Analysis and the Preliminary Design phase.
A second set of information is required .n order to
perform Preliminary Design phase Software Metrics. The parts
of the draft pro4uct specifications cozt*ning design approach-
es for each CPCI, which are genqrated 4uring the requireents
allocation process, together with ghe 'x.ntes and action item
responsns that are produced during a Preliminary Design Re-
view are both required for thp Software Metrics in this phase.
FIGURE II-3 describes the activities and products needed for
the Preliminary Design phase, as well as Requirement Analysis
phase.
11-4__________________I______________,______,______,______,__

A NLYS IS PHASE
___ Product (s)
A. Devise 4 analyze alternatives A. 1. Tradeoff study reports.for the system, Segment (if 2. Initial or Authenticatedany), or any Software Subsystem System Specification&I
directly containing the Computer Segment SpecificationsProgram. (it W).
B. Allocate requirements to B.1. Authenticated Developmentthe Coqputer Program: i.e. Specification for each CPCI.
Functions. 2. Possible higher-level speci-Performance (e.g. response ficatian, and IC), changestimes). 3. Parts of draft Product Speci-Interface (with others) ficatians cantaining designDesign costraints (e.g., appraches for each CPCI.
prescribed algorithm,core & processing timebudgets).
Testing.
C. Conduct PDR(s) for the C. PDR minutes and action itemCooter program's (PCI s). responses.
IESIGN PHASE
Activity Product(s)
A.l. Define algorithms not pre- A.I. Functional flowcharts.viously prescribed. 2. Detailed flowcharts.
2. Design data storage structures. 3. Data format descriptions.3. Define Computer Program Logic. 4. Descriptions of algorithm
not previously prescribed.
B. Allocate Coputer Program B Preliminary Product Speci-requirements internally fications, including the(e.g., to (PCs). above.
C. Test Plamng. C.1. System, Segment (if any)and CPCI Test Plans.
2. Prelminary (PCI TestProcedures.
D. CDR(s) for the Comuter D. CDR minutes 4 action itemProgram's CPC(s). responses.
CODING AND ECOUr PHASE
Activity Product(s)
A. Coding. A-B Code.
B. Liited checkout of compileror assembly units.
C. Correspanding logic 4 data C. Altered Product Specifications,structure revisions. including compiler/assembly
______________________________listings.
TEST AND INT#GRATICN PHAE
Activity Pouts
A. Test Plarmi g. A.1. Final CPCI Test Procedures.2. Semnt (if my) and system-
level Test Procedures.
B. Module tests. B-D.Test ftont.2.Computer Progrm coding
C. CPCI test (PQT 4 mrT). 3.Nadiri~d ProiductSpecifications.
4.Possible high-level specifi-D. Software S'1bWstm integration. cation, and ICD, changes.
TABLE II-A
LIFE CYCLE EVENTS
TT-S

141:
.F44 44
log uILI
I44
oww
o 11-6

Klie
0-U
- c z
F-I-
fuJ
11-7

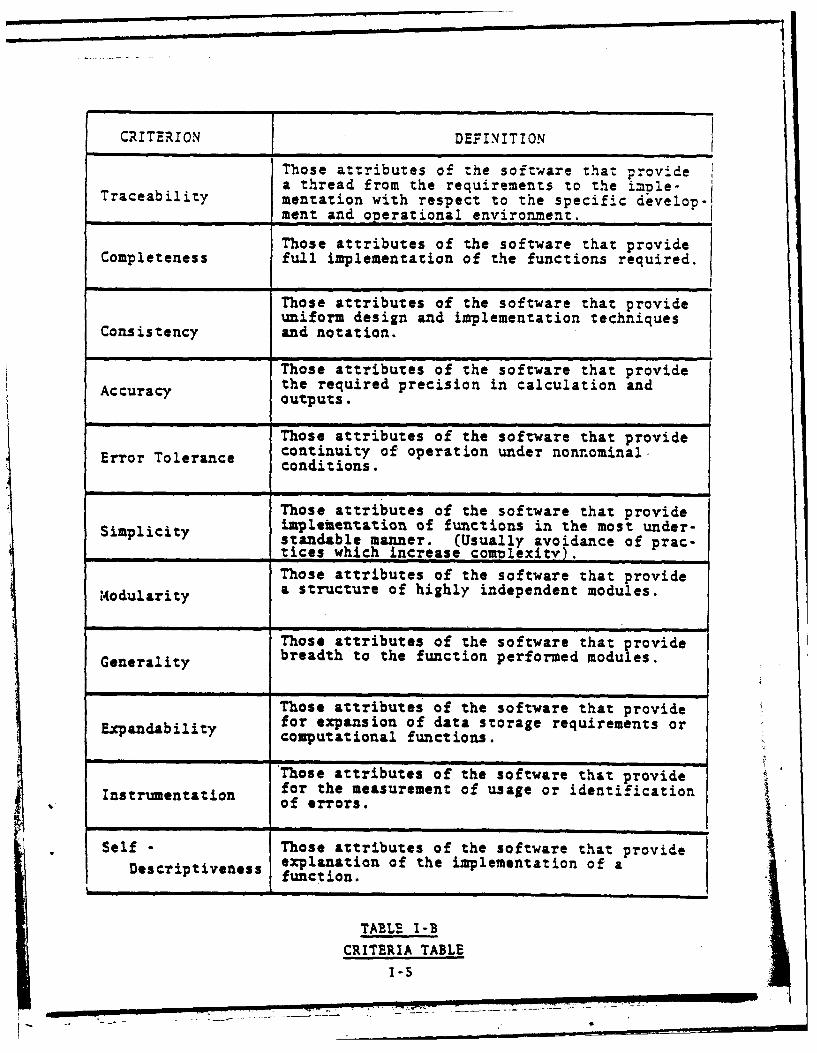
In order to perform Detail Design phase Software
Metrics, functional flowcharts, detailed flowcharts, data
format descriptions, and descriptions of any additional al-
gorithms are required. These products are generated while
defining computer program logic and new algorithms, and when
designing data storage structures. These products may be
separate from, or included in, the preliminary Product spec-
ifications that are also required in the Detail Design phase.
Preliminary Product specifications are generated when allo-
cating computer program requirements internally. The final
products required for the Detail Design phase are the minutes
and action item responses generated during a Critical Design
Review. FIGURE 11-4 depicts the activities and products of
the Detail Design phase. An update to the Preliminary Design
Software Metrics is applied during this phase. This update
process will be discussed in more detail in Section 2.4.2
"Update Information Requirements".
The information required to perform Implementation
phase Software Metrics is the source code. This code is
generated by the coding process itself, as well as through
limited checkouts of compiler or assembly units. FIGURE II-5
details the activities and products required for the Implemen-
tation phase. An update to the Detail Design phase Software
Metrics should be performed during this phase. The procedure
will be discussed in more detail in Section 2.4.2 "Update Infor-
mation Requirements".
2.4.2 Update Information Rlquirements
There are five update applications of Software Metricsperformed during the software development life cycle. Pre-liminary Design metrics are reapplied twice, Detail Designmtrics are reapplied twice, and Implementation metrics are
reapplied once. TABLE II-B lists the update applications
and the phases in which the updates are applied. "Steps forUpdate Applications" in the Module Instructions of eachQuality Factor describes the detailed process for performingupdates.
1I-8
Bigg
i i l. I4 c i
m u ,. .. .. . ."-
mill-II
-4E-
*uIHI
t II-9
-4

U --
0-1

UPDATE APPLICATION PHASE WHEN UPDATES OCCUR
Preliminary Design Detail Design
Detail Design Implementation
Preliminary Design Test and Integration
Implementation Test and Integration
Detail Design Test and Integration
TABLE II-B
UPDATE APPLICATIONS
Software Metrics is first re-applied to revised
Preliminary Design documentation. Any segment Test Plans,
System and CPCI Test Plans and preliminary CPCI Test Pro-
cedures are required for this update process. These pro-
ducts are generated during test planning activities in the
Detail Design phase. FIGURE 11-4 shows the Preliminary Design
update products and activities.
The second re-application of Software Metrics is to
revised Detail Design documentation. Altered Product Speci-
fications, including compiler and/or assembly listings are
required for this update application. These documents are
produced during corresponding logic and data structure revision
activities in the Implementation phase of the life cycle.
FIGURE 11-5 depicts the Detail Design update products and activ-
ities.
The final three update applications are re-applications
of Software Metrics to Preliminary Design., Implementation andDetail Design documentation. The update to the Preliminary
Design documentation requires final CPCI Test Procedures, any
segment and system-level Test Procedures, and Test Reports.These products are generated during Test Planning activities,and module and CPCI tests and software subsystem integration
activities in the Test and Integration phase. The update to
the Implementation phase documentation requires computer
II-11
i, I I4

program coding changes which are generated during module tests,CPCI tests, and software subsystem integration activities of
the Test and Integration phase. The final update is appliedto Detail Design phase documentation and requires modified
Product specifications, and possible high-level specification
and ICD changes. These documents are also generated during
module and CPCI tests, and software subsystem integrationactivities in the Test and Integration phase. FIGURE II-6
details the activities and products of the Test and Integration
phase.
2.4.3 Documentation Considerations
There are four major issues to consider when applyingSoftware Metrics to the products generated during a project's
life cycle.
(1) The content of the documents
(2) The possibility that the products may not map
uniquely into discrete phases
(3) The appropriate level of application, System/
Subsystem, or Subsystem/Module
(4) The sequencing of Metric applications.
2.4.3.1 Contents of Documents
The first issue to consider is the content ofthe documents. The type of information asked for by
the Software Metrics should be found in the documents
named in Subsection 2.2 and repeated in the Module
Instructions. If these documents do not contain thenecessary information, an investigation should bemade into other contractor-supplied documentation to
locate the sources of this information. If the infor-mation cannot be located, this may indicate a "gap"
in the development and the issue should be resolved.
2.4.3.2 Product Mappin&
The second issue involving documentation con-
cerns the possibility that products may not always map
11-12

Iill 0
,L)ii
I 0°
tz
Ir I
11o13
1* 7I--

uniquely into discrete life cycle phases. Thus, itmay be necessary to refer to the documentation of pre-
vious phases to answer some of the Data Element ques-tions in a particular phase.
2.4.3.3 Appropriate Levels of Applying Metrics
Software Metrics may be applied on two sepa-
rate sets of levels; (1) System/Subsystem levels or
(2) Subsystem/Module levels.
The third issue that concerns application of
the metrics involves choosing the appropriate levels
of application of the metrics. The metric system has
two levels and can be applied either at the System/
Subsystem levels or at the Subsystem/Module levels.
If the decision is made to apply the metrics at the
System/Subsystem levels one Handbook is required. For
each Subsystem/Module an additional Handbook is re-
quired for the particular Subsystem/Module application.
A "System" is considered to be a collection
of programs and/or subsystems sufficient to accomplish
a significant, coherent application or function. There-
fore, a "system-level" application of Software Metrics
entails:
(1) Selecting Quality Factors for the entire
system
(2) Applying Software Metrics to the docu-
ments that describe the collection ofprograms and/or subsystems that accom-
plish the mission of the system in order
to determine the quality of those fac-
tors in the system.
For instance, before responding to the Data Element
question:
"Are requirements itemized so that the
various functions to be performed, their
inputs and outputs, are clearly delineated?"
as in Data Element "Unambiguous References"
11-14
4
2.4.3.3 continued
a system-level measurement in the Requirement Analysis
phase requires searching the System specifications to
determine if all of the subsystem's functions, their
inputs and their outputs, have been clearly delineated.
At the Preliminary Design phase, the Development speci-
fications for all the subsystems should be searched to
determine if all of the modules' functions, inputs and
outputs for all of the subsystems have been clearly de-
lineated before answering the same question. Through-
out the metric application and life cycle the appro-
priate level System/Subsystem must be documented.
Space for this is provided in the Handbook.
A "Subsystem" is a collection of modules or-
ganized in such a way that they accomplish a larger and
more complex function than would normally be possible
for a single program. Thus, a Subsystem/Module appli-
cation of Software Metrics to each Subsystem entails:
(1) Selection of Quality Factors for each
subsystem (may be a subset of those
selected for the entire system)
(2) Applying Software Metrics to the docu-
ments that describe the collection of
modules that accomplish the function
of that subsystem in order to determine
the quality of the selected factors for
each subsystem.
In other words the Subsystem/Module Metrics
application VIEWS the Subsystem as the "entire" system
and the procedures over the entire life cycle are the
same as in the System/Subsystem application. It is
possible to apply the Metrics at both the System/
Subsystem levels and the Subsystem/Module levels.
This would require a separate Handbook and separate
application.
!1 -15

Figure II-7 illustrates the two sets of pos-
sible applications where a system has three levels:
(1) System, (2) Subsystem, and (3) Module.
2.4.3.4 Sequencing of Metric Application
The last issue to consider when applying the
Software Metrics is the sequencing of the application
effort itself. A decision should be made (in conjunc-
tion with the level of application) regarding desirable
application sequences: should all applicable Software
Metrics be applied to each document in turn, or should
the Software Metrics be applied to all documents of a
particular phase, searching each document for the re-
sponse for each Data Element question?
2.5 APPLICABILITY OF SOFTWARE METRICS THROUGH THE LIFE CYCLE
As mentioned in Section I, "Software Metrics", each Quality
Factor is calculated from Criteria, Metrics, and Data Elements.
Most of the Quality Factors have at least one Data Element, Metric
and Criteria for each of the four life cycle phases: Requirement
Analysis, Preliminary Design, Detail Design, and Implementation.
In addition, most of the Metrics within each Quality Factor are
unique to a single phase. Therefore, for each Quality Factor, the
normal progression throughout the life cycle is to apply the Soft-
ware Metrics for each phase in the life cycle, asking different
questions at each phase.
This normal progression is deviated from in two ways. First,
some Quality Factors do not apply Software Metrics to all phases
in the life cycle. Only the Quality Factors Reliability, Complete-
ness, Efficiency, and Interoperability apply Software Metrics to
all four phases. Integrity and Usability apply Software Metrics
only to the Requiremeat Analysis and Preliminary Design phases,
while Maintainability and Testability apply Software Metrics to
all phases except the Requirement Analysis phase. Finally, Flexi-
bility, Portability and Reusability. apply Software Metrics only to
the last two phases: Detail Design and Implementation. TABLE II-C
shows this situation.
11-16
* rql -,*r

j SI-
ii iiii.
0'-4F-
-4
I.- ~.I ~.
- ~'-4
C.).w -
I-C.~-11J4
0
U,
w
I!
I;p
II I0
4' -4
-4 iii11-17

QUALITY FACTOR PHASES Where Applicable
Completeness Requirements AnalysisPreliminary DesignDetail DesignImplementation
Reliability Requirements AnalysisPreliminary DesignDetail DesignImplementation
Efficiency Requirements AnalysisPreliminary DesignDetail DesignImplementation
Integrity Requirements AnalysisPreliminary Design
Usability Requirements AnalysisPreliminary Design*
Maintainability Preliminary DesignDetail DesignImplementation
Flexibility Detail DesignImp lementat ion
Testability Preliminary DesignDetail DesignImplementation
Portability Detail DosinImplementation
Reusability Detail DesignImplementation
Interoperability Requirements AnalysisPreliminary DesignDetail DesignImplementation
TALE I -C
....... M ,.. , CYCLE

2.5 continued
The second deviation from the normal progression is that
several Quality Factors repeat Metrics and Data Element questions
across phases, or a Data Element name will be used, but a different
(related) question will be asked. For instance, in the Quality
Factor Correctness, the Metric "Completeness Checklist" is applied
in the Requirement Analysis, Preliminary Design and the Detail De-
sign phases. The same Data Element questions are asked in all three
phases, but different documents and levels of detail are required in
each phase. On the other hand, in the Metric "Data Consistency
Measure", the Data Element "Global Data" asks the question "On the
system level, is global data defined only once?" in the Preliminary
Design phase, but asks, "On the module level, are global variables
used as defined globally?" in the Detail Design phase. The dif-
ference between the two questions is the level of application.
TABLE II-D outlines this situation.
Both of these deviations are a result of the nature of the
Quality Factor being measured. The continuity of Software Metric's
concepts is maintained.
11-19

DATA CONSISTENCY MEASURE
Preliminary Design Phase Detail Desifn Phase
1.0 Global Data (42) 1.0 Global Data (42)
1.1 On the system level, 1.1 On the module level,is global data are global variablesdefined only once? used as defined
globally?YES -i, NO - YES - 1, NO
COMPLETENESS CHECKLI ST
1.0 Unambiguous References (2) 1.0 Unambiguous References (2)
1.1 Are requirements 1.1 Are requirementsitemized so that the itemized so that thevarious functions to various functions tobe performed, their be performed, theirinputs and outputs, inputs and outputs,are clearly delinealf are clearly delineateA.Z,
YES a 1, NO L. J YES - 1, NO Li]
2.0 External Data Reference(3) 2.0 External Data Reference (3)
2.1 Number of data 2.1 Number of datareferences which are references which aredefined, defined.
2.2 Number of major data 2.2 Number of major datareferences. references.Score - EI- 2 Score-E -.
3.0 Major Functions Used (4) 3.0 Major Functions Used (4)3.1 Number of defined 3.1 Number of defined
functions used. functions used.3.2 Number of functions 3.2 Number of functions
identifioiL, idontifi I -Score - j+ Score - s-
4.0 MajOr Functions Defined (5) 4.0 Major Functions Defined (5)
4.1 Number of identified 4.1 Number of identifiedfunctions defined, functions defined.
4.2 Number of functions 4.2 Number of functionsidontifg, ident ifipScore - ScoreI.tj-_
J ii
ATA EACRSS THE LIFE CYCL
11-20

Preliminary Design Phase Detail Design Phase
5.0 Decision Points Defined (6) 5.0 Decision Points Defined (6)
5.1 Is the flow of 5.1 Is the flow ofprocessing and all processing and alldecision points in decision points inthat flow defined? that flow defined?
YES - 1, NO - 0 YES - 1, NO - 0
6.0 Agreement of Calling 6.0 Agreement of CallingSequence Parameters (7) Sequence Parameters (7)
6.1 Number of defined 6.1 Number of definedand referenced and referencedcalling sequence calling sequenceparameters that parameters thatagree between agree betweenfunctions. functions.
6.2 Number of calling 6.2 Number of callingsequence of parameters. sequence of parameters.
Score - Score - --7.0 Problem Reports Resolved (8) 7.0 Problem Reports Resolved (8)
7.1 Number of those 7.1 Number of thoseproblem reports problem reportsthat have been that have beenclosed (resolved) closed (resolved)
7.2 Number of problem 7.2 Number of problemreports related to reports related tothe requirements the requirementsthat have been that have beenreported reported.Score *Ii.- i1Score
TABLE II-D (cont'd)
DATA ELEMENTS ACROSS THE LIFE CYCLE
11-21
r &~, nlar -

SECTION III
HANDBOOK FRAMEWORK
3.1 COMPONENTS OF COMPUTER SYSTEMS ACQUISITION METRICS HANDBOOK
The Computer Systems Acquisition Metrics Handbook consists
of the following components:
General Instructions - This component discusses the Intro-
duction to metrics, the Framework of Software Metrics, life
cycle considerations, the framework of the Handbook, a step-
by-step method on how to use the Handbook, and Quality Factor
Selection. You are reading this component now.
Eleven Quality Factor Modules - There are eleven quality fac-
tor modules, each module contains a complete hierarchy of
worksheet sets with instructions on how and when to use them.
Data Element Dictionary (DED) - The DED is a reference guide
for all the Data Elements. It lists the name, an index num-
ber for keying from the worksheet to the DED, Data Element
questions asked, a life cycle phase description, an example
with explanations and worksheet reference-for each Data
Element.
Figure III-i graphically represents the framework of the Soft-
ware Metrics Handbook. Section.3.2 discusses the relationship of4the Handbook's framework to the Software Metric's framework.
3.2 INTERRELATIONSHIP OF SOFTWARE METRIC'S AND HANDBOOK'S FRAMEWORKS
The structure of the Handbook is designed to be closely con-
nected with the Software Metrics framework. At the broadest level
of detail where the two frameworks match is at the eleven modules
themselves. Each module measures one Quality Factor.
III-1
04
.n,

c3-HM=F
urns unoalrn
neJJ mm IGC
,g~hzc iemc
CAWam Raw
3YAUJriaum
-m
~ANDOQK RA14 WOF
0 1 *M. - - - .
- <1-wmc

The worksheets in each module are arranged in two tc four
sets. These sets are organized according to the relevant Soft-
ware Metrics Life Cycle Model's phases.: Requirements Analysis,
Preliminary Design, Detail Design, and Implementation. The work-
sheets within each phase are arranged accouding to their ranking
in the Software Metrics framework from the bottom-up: (1) Data
Elements, (2) Metric, (3) Criteria & (4) Quality Factor.. This
allows them to be applied in a structured process. A worksheet
set contains the following: one or more Metric worksheets,
followed by one or more Criteria worksheets, followed by one
Factor worksheet. Each level of worksheet contains scores from
the next lowest level of measurement. Therefore, each Metric
worksheet is composed of Data Element scores, each Criteria
worksheet contains Metric scores, and each Factor worksheet is
composed of Criteria scores. A person applying the Handbook at
each phase utilizes the Handbook's worksheets in a process which
is the exact inverse of the Software Metrics framework. The
first value to be derived using the Software Metrics Handbook is
the value of the lowest-level component in the Software Metrics
hierarchy, the Data Element. The next value derived is the Metric
value, which is one level higher, while the third value derived
is the Criteria value which is the second-highest level in the
hierarchy. The last value derived by applying the Handbook to a
system or subsystem is the Factor score, which is the highest
level component in the Software Metrics hieraivhy. Using the
modules' worksheets, the software Metrics framework is being com-
pleted starting at the bottom and working upwards. Figure 111-2
depicts the interrelationship between the framework of the Soft-
ware Metrics and that of the Handbook.
111-3'.l-5--.

QUAL ITYFACTORMODULE
DATA ELEMENT ATA COLLECTION
METRIC - *METRIC CALCULAT ION
EVALUAT ION
METRIC WORKSHEETS
CRITERIA CRITERIA WORKSHEETS
FACTOR FACTOR WORKSHEETS
---------- -----------------------------------
SOFTWAREMETRICS HANDOOK FRAWORK
FRAMEWORK
FIGURE 111-2
INTIRRELATIONSHIP OF HADI.OQI'S AND
SOF TWAR METRIC'$ FRAMEWORKS
111-4
m u~

SECTION IV
HOW THE HANDBOOK WORKS
4.1 INTRODUCTION
This Handbook is an easy to use set of procedures to apply
Software Metrics to different types of systems. Use of this Hand-
book provides a good working knowledge of Software Metrics and
enables the user to apply them easily.
4.2 STEPS FOR USING THE SOFTWARE METRICS HANDBOOK
STEP 1 - SELECT QUALITY FACTORS
Section V of these General Instructions, "Quality Factor
Selection", is the first step in applying Software Metrics.
Quality Facotrs are selected either at System/Subsystem
levels or Subsystem/Module levels or combinations of both
sets of levels.
STEP 2 - OBTAIN RELEVANT MODULE
After selecting a particular set of Quality Factors for a
system, the next step is to obtain the Quality Factor Modules
corresponding to these Factors. There are eleven separate
Quality Factor Modules, each one corresponding to a Quality
Factor.
Each Quality Factor Module is composed of two parts: (1)
Diagrams and instructions for completing the module's dork-
sheets and score charts. Included in the instructions is a
list of the activities and products required by each phase.
And (2) Worksheet sets.
For a system/subsystem level application, only one module
for each selected Quality Factor will be needed. If a sub-
system/module application is desired, then the Quality Factors
for that subsystem are selected and the corresponding modules
are needed.
IV-1

If a combination of System/Subsystem and Subsystem/Module
applications are desired then Quality Factors are selected
for the System and the corresponding modules are needed for
application to the System Quality Factors are selected for
each Subsystem and corresponding modules for each Subsystem
are needed.
STEP 3 - COMPLETE WORKSHEETS
Worksheets are the tangible tools used in taking quantifiable
measurements of software quality. The worksheets used in
actual field work are contained in the Quality Factor Modules
selected in STEP 2. The actual steps required for completing
the worksheets can be found in "Steps for Completing Worksheets",
in the Module Instructions for each Quality Factor. The end
result of applying these worksheets will be the establishment
of a quality rating for the Quality Factors.
STEP 4 - SUMMARIZING THE WORKSHEET RESULTS
After all of the worksheets have been completed for all of
the selected Quality Factors at the end of each phase, the
Score Charts are completed. The instructions for completing
the Score Charts are included in "How to Use Score Charts
sets", for each Quality Factor in the Module Instructions.
The Score Charts provide a vphicle for summari;ing the
results of the Software Metrics Worksheet Applications.
4.3 IDENTIFICATION OF W0R9SHEETS
In the upper right hand corner of each worksheet is the Form
Code. Each worksheet is assigned a Form Code according to the
Form Code Key notatioR in Table IV-A. When the worksheets are
organized according t9 Form Code, the eleven "Quality Factor
Modules" are formed.
Iv-2
7_77_

MOD E PHSE LJ~EL SUNC
tRAC. 2
INTEGJR'f'F iEQ-AN1C CRITERIA ICOND PAGE OF SET
oDULorens RA - REQJIRDWIrS ANALYSIS M - WTERIC
Re - Reliability PD - PRELIMINARY DESIGN C a CRITERIAEf - Efficiency UD - DE WL DESIGN F a FACTORIt - Integrity 114 - D"HITOUS - UsabilitytMa - MaintainabilityFx -Flexibility
Te -Testability
Po *PortabilityIbi ReusabilityIp -Interoperbiity
TABLE IV -A
FORM CODE KEY
* The first segment of a Form Code is an abbreviation ofthe Quality Factor that pertains to the module that con-
tains the worksheet: For example, CO (Correctness), Re
(Reliability), etc.
9 The second segment of a Form Code is an abbreviation of
the phase of the set containing the worksheet: For
example, RA (Requirements Analysis), PD TPreliminary
Design), and IN4 (Implementation).
* The third segment of a Form Code is an abbreviation of
the software quality measurement level that pertains to
the worksheet: For example, M (Metric), C (Criterion),
and F (Factor).
* The fourth segment of a Form Code is the sequence number
of a particular worksheet (first Metric worksheet,
second Metric worksheet, etc.).
IV-3

4.4 DAIA LLLMLN'I' DICTILONARY (D1JJ
For quick reference, one hundred twenty-six (126) Data
Elements are individually defined in the Data Element Dictionary
portion of this Handbook. Each dictionary entry contains the
following information: (1) Data Element name, (2) Index number,
(3) Validation question associated with the Data Element in the
Metric Worksheets, (4) Life-cycle phases(s) to which the Data
Element pertains, (5) Definition, (6) An example of the Data
Element's typical use, and (7) Explanation of how to score the
Metric worksheets that contain the Data Element. EXHIBIT IV-1
is a typical entry of a Data Element in the Dictionary.
The Data Element Dictionary should be used as a reference
when additional understanding of a Data Element question is
desired, or when clarification is needed.
IV-4
- -I~ N ~~~__S=

NAME: Share Temporary Storage
INDEX NUMBERa: 91
DATA ELEMT: Is temporary storage independent /77Y-7
of other modules?
LIFE CYCLE PHASE(S): (1) Detail Design
DESCRIPTION: This is a binary measure to determine whether ornot modules share temporary storage. It empha-sizes the loss of module independence if tempo-rary storage is shared between modules.
EXAMPLE: Storage should be separate for each module.Accessing commons should not be used instead ofpassing parameters from one routine to the next.
EXPLANATION: This is a binary measure answered by a "Yes" ora "Noll.
WORKSHEET REFERENCE: FORM CODE PAGE
MaDDM.5 Ma-28FxDDM.3 Fx-18TeDDS4.3 Te-31PoDDM.l Po-16RuDDM.l Ru-16IpDDM.l Ip-30"
I, EM OF AM ELMM
IV-S
[WEO A~N
":.-_.. 2 ..... 4 "D- .. . .. .D I.. ... . .. .. .
' ' . .. .. ,,. I I l 1 V -

SECTION V
QUALITY FACTOR SELECTION
5.1 INTRODUCTION
This section provides a discussion of a method for selecting
the set of Quality Factors for a software system or subsystem.
Following a determination of the appropriate Quality Factors for
the system or subsystem, the corresponding Quality Factor Modules
are applied to the system or subsystem.
The first step of the Quality Factor selection process is to
examine the basic characteristics of the software system or sub-
system, and then compile a preliminary list of Quality Factors that
best provide for those characteristics. The eleven Quality Factors
are listed and defined in TABLE I-A in Section I, "Software Metrics"
of this Handbook.
A discussion of the applicability of Quality Factors to C3
system is provided in Section 5.3 of these General Instructions.
This preliminary list of Quality Factors can be developed by dis-
cussion with as wide a range as possible of the people responsible
for the system development. For example, the Quality Factors in-
put could come from the maintaining command, the originators of
the requirements specifications or the potential users. The
Quality Group responsible for measuring the quality of the system
must obtain clean input on this selection to assure the appro-
priate Quality Factors are being measured. Some of the Quality
Factors cannot co-exist in a system. Therefore the next step is
a trade-off between conflicting Quality Factors to determine the
final set of Quality Factors for measurement.
5.2 QUALITY FACTOR TRADE-OFFS
TABLE V-A shows either HIGH, LOW, or NEUTRAL relationships
among the eleven Quality Factors. Because of the nature of the
relationship between some of the Quality Factors, a high rank for
some of the Quality Factors will result in a conflict with some
.. .. V-l
*1

Mms
mNUmWN 000
-- --- In li lii l ... . I II-II-II- -
0__10 00 00F, 0
___ /1
PLLZW 00@00 / 0- e| - ---
TABLI V-A
UELATIONSHIPS F53T!W3 SOEAM OUALITY FATRS
LEG=D: If a high 4egree of quality isproSOmt £0? FCt? what Lepe.eof quality is ezTpeCtd for theother:
0- H*gh Low
Blank No relaionship o application depndent
V-2
." A

of the others. This is illustrated in TABLE V-A by a dark circle
in the intersecting squares. In this situation a decision must
determine the significance of the conflict between the Quality
Factors; If the conflict is significant, one of the Quality Fac-
tors may be deleted from the list. However, if other considera-
tions negate the impact of the conflict, both Quality Factors may
be kept; however the low relationship between these factors must
be kept in mind during Evaluation. TABLE V-B is a list and explana-
tion of every possible Quality Factor conflict.
On the other hand, attaining high rank scores for certain
Quality Factors may imply other Quality Factors will also be pres-
ent. If the square in TABLE V-A contains a clear circle, a high
degree of relationship exists between the factors. If the square
is blank, a high degree of quality for one factor will have little
or no effect on the other.
5.3 SIGNIFICANCE OF QUALITY FACTORS IN C3 SYSTEMS
Since the main focus of this handbook is with Tactical Command,
Control and Communication (C) Systems, the following paragraphs
describe how applicable and important each Quality Factor is to a
tactical environment based on typical characteristics of C3 sys-
tems. The Quality Factors, with explanations of their significance,
are listed in order of their importance.
0 Correctness, Reliability and Efficiency - It is essen-
tial for a software system operating in a simulated or
actual battle environment to perform quickly and
accurately. That is the reason why the ability of a
tactical C3 system to satisfy its specifications, ful-
fill the user mission objectives, and perform its
intended function with the least amount of resources
and code are the most crucial requirements.
Interoperability - An important goal of Air Force system
developers is the development of a fully distributed
TAF/C 3 system. This system, composed of many subsystems
spread out geographically, will be designed to operate
V-3
k-

IMTIXTY ThurI addiltips sf wdpuh~g mavdVS Cm5P~ t~ACII S ofe U rr or date
UPCIRMC Wsally l04pAN no. h1f at iugut sisitiowl
UMILM7 7ho aitgl msad pumulug no lm Ue~ oaVs OR SPSPRIt 151SF ls orovd safl outpuitWally 1gbto 'rn tiedi Lw rquire, amiltim
I~~ZUTAWA33UTY ~ tad s. Imempo tiaqlutrigat ailugVs tums VA divan cods. alksys ~'vdoGan s to 0 niutalmr. Using "614Mib
wwtjin,med all usad 5mey w tlmwgg ~ ~ ~ -t WFmmuMf~~ ally
,mang VA avolind vasuim fficlipt
1u5r~LIrTThe we of 4isqais cubi or ad S saw
Vs w m"1111ie8 u*mumi tow SiIVf 0
PjmD2zIY Mm e %lIJI riveid fo a flexible 3yi________to as grew
minas ~ Tft mm A diussmssion .gmPliu t as~mliv.
INWeLI theu added ovsimped for wsvuims asf0U ~ ~ NIO stmr dId ,imvstm u n e WI
______ _____ *flqisy of 2: lyeSm
I5~3UTT IlabillW 'mOt"I ue' I Msvn "gaxblesIrsa" s Iw them~ m - gw17
Is Prvim omft.min Pl1 I to m
WIMJ1 Cplal *vam allow for m ss, %AP of mae
ulfllbs ppsomw for islibseisMrldc Ow ped 3U 1 O a sad'
_________ *1 m* 0 4~ ' rblem a wall.
Whdhgewimqw U utto
V-4

using automated resource sharing and distributed con-
trol. For this reason, the ability of any one system
to be coupled with another is a crucial factor.
* Flexibility and Maintainability - A tactical C3 systemwill go through a complex evolution in its development,
so it must be adaptable to constant change. Softwaremodules in a system should be easy to add, replace, andchange.
0 Testability - A tactical C3 system must go through ex-
tensive testing at different points of its development.
Only after testing, can a system's reliability and per-
formance in a battle environment be measured realistically.
* Portability - The ability to transfer data bases and/or
software to and from any unit is important. A fully
distributed C system is composed of a configuration ofmobile and non-mobile hardware units situated at dif-ferent strategic locations.
0 Usability - Another requirement crucial to the success
of a tactical C3 system in the field is that militarypersonnel learn to utilize and interface with the soft-
ware with ease. Some methods used by the Air Force to
increase Usability are automated decision aids (to allow
rapid information assimilation and decision making) and
automated communication (to make information readily
available to the commander and his staff).
0 * Integrity - The extent to which access to software and
data can be controlled is relatively unimportant com-
pared with the other requirements, but is essential
nonetheless. For example, the interception of intel-
ligence data by the enemy in a wartime situation couldhave grave implications.
* Reusability - The extent to which a program can be
used in other applications is relatively unimportant
in C3 systems.
The order of importance is not always the same and the above
order is meant only as a guide.
V-$
-. • . . . ...- -I ll Il | [ I [I

I
SECTION VI
QUALITY FACTOR EVALUATION
6.1 POST DATA COLLECTION
At the close of Section V you were instructed to use theModule Instructions to find directions for completing all work-
sheets. This subsection and post-data collection is included
in the "Introduction and General Instructions" to discuss the
possible uses of the data and metric values leading to Quality
Factor Evaluations.
6.2 EVALUATION
As you will see when you start working with the modules
each worksheet contains an Evaluation Worsection. It is im-
portant to remember that the worksection is a subjective work-
section for recording the judgements of the person applying the
module. The other worksections are part of the "objective"
metric system and the "subjective" worksection is included for
the purpose of future analysis. The Evaluation Worksection
asks: "What is your evaluation of the reviewed products based
on.the Metrics above? (1-10 or 0 if you are unable to
evaluate)." When a person is evaluating a Criteria it would be
possible to have one Metric with a high score and another with a
low score. The evaluator could decide that the Criteria should
be evaluated fairly high (5-8) because in his opinion the low
scoring Metric did not have much of an impact on the system.
Because of this subjective nature, a particular evaluator may
consistantly evaluate high, or consistantly evaluate low.
Some method of tracking and monitoring this type of scoring
should be developed so that an analysis of the scores and scorer
can be done as a means of giving a proper interpretation to the
historical data in the data base.
VI-1
-WMI
There are three dimensions that need to be analyzed over time
to improve the credibility of threshold values leading to
Quality Factor Evaluations: (1) The objective metric scores,
(2) The subjective evaluation section score and (3) The in-
dependent evaluation of total systems that are in the maintenace
phase of the life cycle. By comparing these three dimensions
over time metric scores that consistantly have a strong or high
correlation with evaluation at either the worksheet or system
level will lead to the establishment of credible threshold value.
When this happens the user for metrics will expand and become
even more valuable.
IF
VI-2
-" " "

![LIST OF REGISTERED ARCHITECTS 2000 - slp.wa.gov.au · PDF file3 February 2000] GOVERNMENT GAZETTE, WA 395 ARCHITECTS ACT 1922 REGISTER OF ARCHITECTS Architects Board Of Western Australia](https://img.pdfslide.us/doc/110x75/5a7e2eae7f8b9a66798e41b5/list-of-registered-architects-2000-slpwagovau-february-2000-government-gazette.jpg)