Embed Size (px)
Citation preview

W. Udo Schröder, 2004
Inte
ract
ion
of g
amm
as 1
Interaction of Radiation with MatterGamma Rays

W. Udo Schröder, 2004
Inte
ract
ion
of g
amm
as 2
-Induced Processes-Induced Processes-rays (photons) come from electromagnetic transitions between different energy states of a system important structural informationDetection principles are based on: •Photo-electric absorption•Compton scattering•Pair production• -induced reactions
1. Photo-electric absorption (Photo-effect)
ħ photon is completely absorbed by e-, which is kicked out of atom
22
;
'
13.6
3, 5,
kin n n
n
K L
E E E binding energy
ZE Rhc Moseley s Law
nRhc eV Rydberg constant
screening constants
different subshells
ħ Electronic vacancies are filled by low-energy “Auger” transitions of electrons from higher orbits

W. Udo Schröder, 2004
Inte
ract
ion
of g
amm
as 3
Photo-Absorption CoefficientPhoto-Absorption Coefficient
5 7 4
5 1 2
( , )
( , )
PE
PE
E Z Z E low E
E Z Z E high E
Absorption coefficient (1/cm)
“Mass absorption” is measured per density
(cm2/g)
“Cross section” is measured per atom
(cm2/atom)
Abso
rpti
on C
oeffi
cient
(cm
2/g
)
Pt
Wave Length (Å)
Absorption of light is quantal resonance phenomenon: Strongest when photon energy coincides with transition energy (at K,L,… “edges”)
Probabilities for independent processes are additive:
PE = PE(K)+PE(L)+…

W. Udo Schröder, 2004
Inte
ract
ion
of g
amm
as 4
Templates and NomogramsTemplates and Nomograms
Data Graph Overlay
Line up left reference linesE
absorberthickness

W. Udo Schröder, 2004
Inte
ract
ion
of g
amm
as 5
Photon Scattering (Compton Effect)Photon Scattering (Compton Effect)2 2 2 2
0 0( ) ( ) : 0Relativistic E pc m c photons m m
E p c
22
2 2 2 2
222 2
2
2
:
2 cos
:
0.511
1 1 cos
e e
e
e e e
e
e
Momentum balance
p p p p c p p c
p c E E E E
Energy balance
E m c E p c m c
m c MeV
EE
E m c
’
1 cos
" "
22.426
C
C
Ce
Compton wave length
pmm c

W. Udo Schröder, 2004
Inte
ract
ion
of g
amm
as 6
Compton Angular DistributionsCompton Angular Distributions
320
22
2
11 cos
2 1 1 cos
1 cos1
1 cos 1 1 cos
Cd r
d
22
20 sin2
CE E Ed r
d E E E
Klein-Nishina-Formula ( =E/mec2)
Forward scattering for high-energy photons, symmetric about 900 for low-energy
Intensity as function of
“Classical e- radius” r0 = 2.818 fm. Alternative formulation:
Total scattering probability: C Z (number of e-)

Compton Electron SpectrumCompton Electron Spectrum
0
2
2
2
2
( ) :
:
: 180
1 1 cos
1 cos
1 o
2
c
1
1 sk
ki E
i
n C
n
e
e
e
e
Scattered photon energy
Scattered recoil electron energy
E E E
Minimum photon energ
Maximum electron energy Compton Edge
E E
y
E
EE
E m c
E E m c
E m c
EE
E m c
2
2
2
1 2
e
e
E m c
E m c
Actually, not photons but recoil-electrons are detected
Recoil-e-
spectrum
true
finite resolution
Com
pto
n E
dge

W. Udo Schröder, 2004
Inte
ract
ion
of g
amm
as 8
Scanning Spectral DataScanning Spectral Data
A spectrum (e.g., probability vs. energy) is generated by scanning physical data, sorting events according to the values of a variable of interest (energy). The values are determined by scanning an actual (true) data set and grouping events according to their (energy) values.
Finite resolution of variable apparent spectrum deviates from true spectrum.
True Spectrum
Constructed Spectrum
energy def.
counts
scan
ne
r win
dow

W. Udo Schröder, 2004
Inte
ract
ion
of g
amm
as 9
High-Resolution ScanHigh-Resolution Scan
The number of true events (top) within a well-defined scanning acceptance bin (or within view) is plotted below at the nominal bin position.
A detector with high resolution provides an apparent spectrum very similar to true spectrum, with minimum distortions

W. Udo Schröder, 2004
Inte
ract
ion
of g
amm
as 1
0
Low-Resolution ScanLow-Resolution Scan
As in previous case, but now the scan is “fuzzy”, the bin is not well defined. True events far away from the center of the scanning bin are seen with some finite probability. The total number of true events (top) within a large range the finite scanning acceptance bin is plotted below at the nominal bin position.
The apparent spectrum has events in unphysical regions, e.g., above the maximum true energy.
A detector with low resolution provides an apparent spectrum very different from true spectrum, with maximum distortions at sharp structures.

W. Udo Schröder, 2004
Inte
ract
ion
of g
amm
as 1
1
Pair Creation by High-Energy Pair Creation by High-Energy -rays-rays
{e+, e-,e-} triplet and one doublet in H bubble chamber
Magnetic field provides momentum/charge analysis
Event A) -ray (photon) hits atomic electron and produces {e-,e+} pair
Event B) one photon converts into a {e-,e+} pair
In each case, the photon leaves no trace in the bubble chamber, before a first interaction with a charged particle (electron or nucleus).
Magnetic field
e-
e-
e-
e+
e+
-rays
A
B

W. Udo Schröder, 2004
Inte
ract
ion
of g
amm
as 1
2
Dipping into the Fermi Sea: Pair ProductionDipping into the Fermi Sea: Pair Production
22 1.022Threshold eE E m c MeV
Dirac theory of electrons and holes:
World of normal particles has positive energies, E ≥ +mc2 > 0
Fermi Sea is normally filled with particles of negative energy, E ≤-mc2 < 0
Electromagnetic interactions can lift a particle from the Fermi Sea across the energy gap E=2 mc2 into the normal world particle-antiparticle pair
Holes in Fermi Sea: Antiparticles
Minimum energy needed for pair production (for electron/positron)
Energy
0
-mec2
+mec2
normally filled Fermi Sea
normally empty
e-hole
e-particle
E
-[mec2+Eki
n]
+[mec2+Eki
n]

W. Udo Schröder, 2004
Inte
ract
ion
of g
amm
as 1
3
The Nucleus as Collision PartnerThe Nucleus as Collision Partner
2
2
2
: 2 ....
Threshold e
e kin kin
E E m c
Actually converted E m c E E
28 2 2
222
2 2
5.8 10 2
( , )1
137 2
e
PP
kin e e
cm E m c
P Z Ed eZ
dE m c E m c
P slowly varying
Increase with E because interaction sufficient at larger distance from nucleus
Eventual saturation because of screening of charge at larger distances
Excess momentum requires presence of additional charged body, the nucleus
e+
e-
recoil nucleus
Pb
1barn = 10-
24cm2

W. Udo Schröder, 2004
Inte
ract
ion
of g
amm
as 1
4
-Induced Nuclear Reactions-Induced Nuclear Reactions
Real photons or “virtual” elm field quanta of high energies can induce reactions in a nucleus:
(, ’ ), (, n), (, p), (, ), (, f)
Nucleus can emit directly a high-energy secondary particle or, usually sequentially, several low-energy particles or -rays.
Can heat nucleus with (one) -ray to boiling point, nucleus thermalizes, then “evaporates” particles and -rays.
n
nucleus
secondary radiation
p
incoming
-induced nuclear reactions -induced nuclear reactions are most important for high are most important for high energies, Eenergies, E (5 - 8)MeV (5 - 8)MeV

W. Udo Schröder, 2004
Inte
ract
ion
of g
amm
as 1
5
Efficiencies of Efficiencies of -Induced Processes-Induced Processes
Different processes are dominant at different energies:
Photo absorption at low E
Pair production at high E
Compton scattering at intermediate E.
Z dependence important: Ge(Z=32) has higher efficiency for all processes than Si(Z=14). Take high-Z for large photo-absorption coefficient
Response of detector depends on
•detector material
•detector shape
•E

W. Udo Schröder, 2004
Inte
ract
ion
of g
amm
as 1
6
High-energy -ray leading to e+/e- pair production, with e- stopped in the detector.
e+ is also stopped in the detector and annihilates with another e- producing 2 -rays of E = 511 keV each. If both -rays are absorbed full energy E is absorbed by detector event is in FE peak.
If one -ray escapes detector event is in SE peak at FE-511 keV
If both of them escape event is in detector DE peak at FE-1.022 MeV.
Relative probabilities depend on Relative probabilities depend on detector size!detector size!
Escape GeometriesEscape Geometries
keV
keV
e+
e-
Ge cryst
al

W. Udo Schröder, 2004
Inte
ract
ion
of g
amm
as 1
7
Shapes of Low-Energy Shapes of Low-Energy Spectra Spectra
Photons/-rays are measured only via their interactions with charged particles, mainly with the electrons of the detector material. The energies of these e- are measured by a detector.
The energy E of an incoming photon can be completely converted into charged particles which are all absorbed by the detector, measured energy spectrum shows only the full-energy peak (FE, red) Example: photo effect with absorption of struck e-
The incoming photon may only scatter off an atomic e- and then leave the detector Compton-e- energy spectrum (CE, dark blue)An incoming -ray may come from back-scattering off
materials outside the detector backscatter bump (BSc)
measured energy
measu
red
in
ten
sit
y

W. Udo Schröder, 2004
Inte
ract
ion
of g
amm
as 1
8
measured energy (MeV)
measu
red
in
ten
sit
yShapes of High-Energy Shapes of High-Energy Spectra Spectra
High-E can lead to e+/e- pair production,
e-: stopped in the detector
e+: annihilates with another e- producing 2 -rays, each with E = 511 keV.
One of them can escape detector single escape peak (SE) at FE-511 keV
Both of them can escape detector double escape peak (DE) at FE-1.022 MeV
The energy spectra of high-energy g-rays have all of the features of low-energy -ray spectra
e+/e- annihilation in detector or its vicinity produces 511keV -rays
FE

W. Udo Schröder, 2004
Inte
ract
ion
of g
amm
as 1
9
QuizQuiz
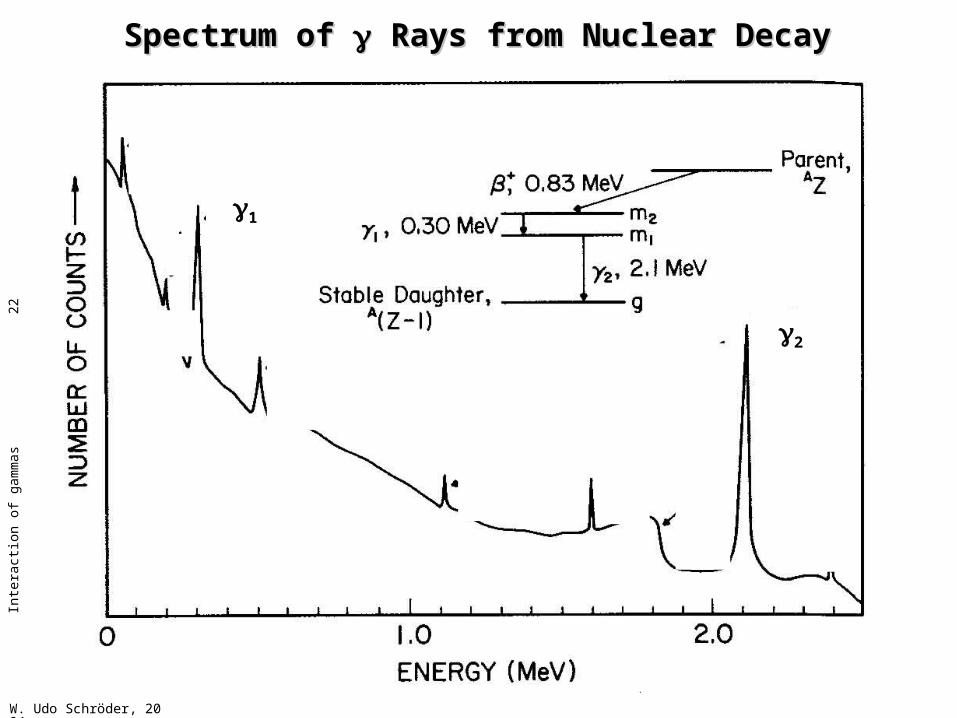
• Try to identify the various features of the spectrum shown next (well, it is really the spectrum of electrons hit or created by the incoming or secondary photons), as measured with a highly efficient detector and a radio-active AZ source in a Pb housing.
• The spectrum is the result of a decay in cascade of the radio-active daughter isotope A(Z-1) with the photons 1 and 2 emitted (practically) together
• Start looking for the full-energy peaks for 1, 2,…; then identify Compton edges, single- and double-escape peaks, followed by other spectral features to be expected.
• The individual answers are given in sequence on the following slides.

W. Udo Schröder, 2004
Inte
ract
ion
of g
amm
as 2
0
Spectrum of Spectrum of Rays from Nuclear Decay Rays from Nuclear Decay

W. Udo Schröder, 2004
Inte
ract
ion
of g
amm
as 2
1
Spectrum of Spectrum of Rays from Nuclear Decay Rays from Nuclear Decay
1
W. Udo Schröder, 2004
Inte
ract
ion
of g
amm
as 2
2
Spectrum of Spectrum of Rays from Nuclear Decay Rays from Nuclear Decay
2
1

W. Udo Schröder, 2004
Inte
ract
ion
of g
amm
as 2
3
Spectrum of Spectrum of Rays from Nuclear Decay Rays from Nuclear Decay
2
1
CE 2

W. Udo Schröder, 2004
Inte
ract
ion
of g
amm
as 2
4
Spectrum of Spectrum of Rays from Nuclear Decay Rays from Nuclear Decay
2
1
SE 2
CE 2

W. Udo Schröder, 2004
Inte
ract
ion
of g
amm
as 2
5
Spectrum of Spectrum of Rays from Nuclear Decay Rays from Nuclear Decay
2
1
SE 2
DE 2 C
E 2

W. Udo Schröder, 2004
Inte
ract
ion
of g
amm
as 2
6
Spectrum of Spectrum of Rays from Nuclear Decay Rays from Nuclear Decay
2
1
SE 2
DE 2
511 keV
CE 2

W. Udo Schröder, 2004
Inte
ract
ion
of g
amm
as 2
7
Spectrum of Spectrum of Rays from Nuclear Decay Rays from Nuclear Decay
2
1
BSc
SE 2
DE 2
511 keV
CE 2

W. Udo Schröder, 2004
Inte
ract
ion
of g
amm
as 2
8
Spectrum of Spectrum of Rays from Nuclear Decay Rays from Nuclear Decay
2
1
BSc
SE 2
DE 2
511 keV
CE 2
Pb X-rays

W. Udo Schröder, 2004
Inte
ract
ion
of g
amm
as 2
9
Spectrum of Spectrum of Rays from Nuclear Decay Rays from Nuclear Decay
1+2
2
1
BSc
SE 2
DE 2
511 keV
CE 2
Pb X-rays
W. Udo Schröder, 2004
Inte
ract
ion
of g
amm
as 3
0
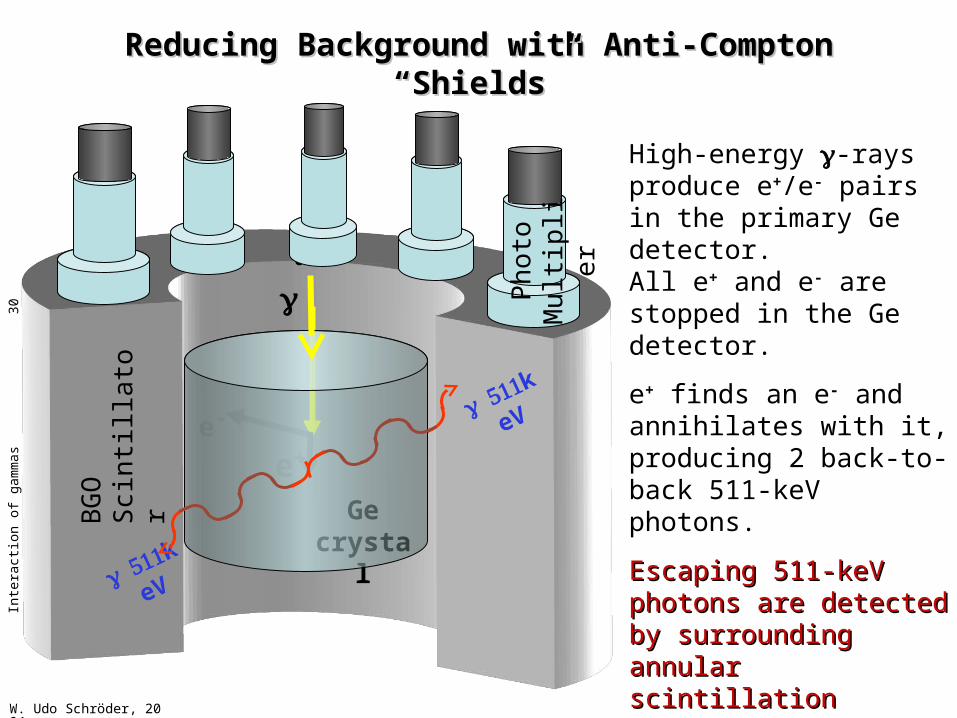
Reducing Background with Anti-Compton Reducing Background with Anti-Compton “Shields”“Shields”
High-energy -rays produce e+/e- pairs in the primary Ge detector. All e+ and e- are stopped in the Ge detector.
e+ finds an e- and annihilates with it, producing 2 back-to-back 511-keV photons.
Escaping 511-keV Escaping 511-keV photons are detected photons are detected by surrounding annular by surrounding annular scintillation detector. scintillation detector. Escape events are Escape events are “tagged” and can be “tagged” and can be rejected.rejected.
k
eV
Ge crysta
l
e+e-
k
eV
BG
O
Sci
nti
llato
r
Ph
oto
M
ult
iplie
r

W. Udo Schröder, 2004
Inte
ract
ion
of g
amm
as 3
1
Compton Suppression TechniqueCompton Suppression Technique
The figure shows a comparison between the “raw” 60Co -ray spectrum (in pink) and one (blue) where Compton contributions have been removed.
The disturbing Compton background has been reduced by app. a factor 8 by eliminating all events, where a photon has been detected by the BGO scintillation shield counter in coincidence with a -ray in the corresponding inner Ge detector.

W. Udo Schröder, 2004
Inte
ract
ion
of g
amm
as 3
2
-Ray/Photon Detectors-Ray/Photon Detectors
There is a variety of detectors for nuclear radiation, including -rays. A special presentation is dedicated to the main detector principles.
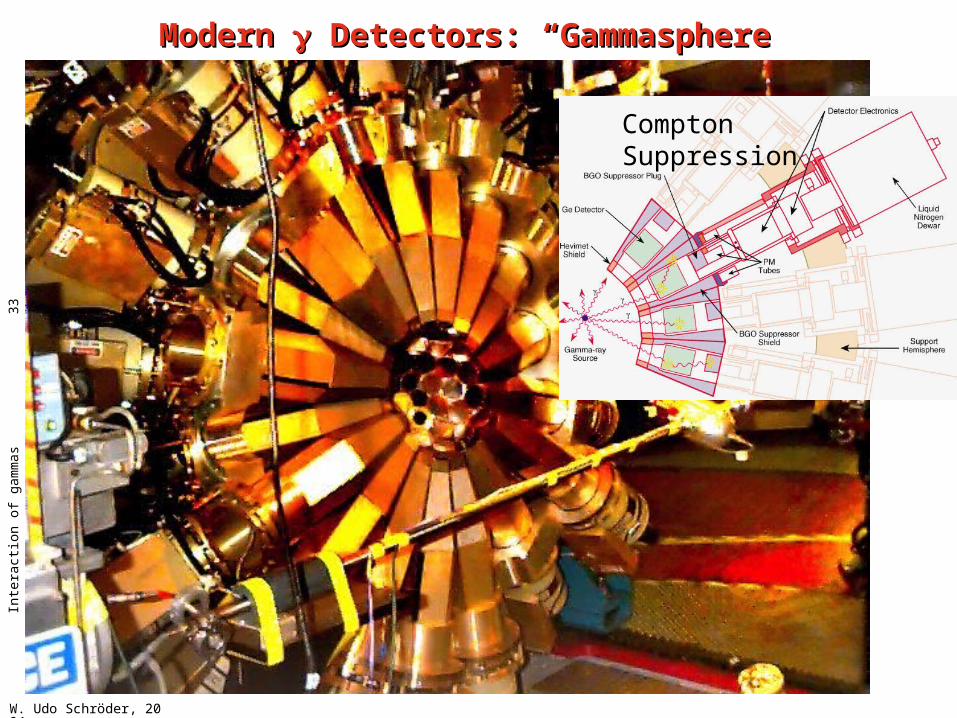
The next image shows a section of one of the currently modern detector arrays, the “Gamma-Sphere.”
The sphere surrounds the reaction chamber on all sides and leaves only small holes for the beam and target mechanisms.
Each element of the array consists of two different detector types, a high-resolution Ge-solid-state detector encapsulated in a low-resolution BGO scintillation counter detecting Compton-scattered photons escaping from the Ge detectors
W. Udo Schröder, 2004
Inte
ract
ion
of g
amm
as 3
3
Modern Modern Detectors: “Gammasphere” Detectors: “Gammasphere”
Compton Suppression

W. Udo Schröder, 2004
Inte
ract
ion
of g
amm
as 3
4
enendd