Embed Size (px)
Citation preview
AN ABSTRACT OF THE THESIS OF
Takeshi Kunimune for the degree of Master of Science in Food Science and Technology, presented on December 14, 2007. Title: Foam Enhancing Properties of Hop Bitter Acids and Propylene Glycol Alginate Abstract approved: Thomas H. Shellhammer
The following two projects have been carried out to clarify the impact of these foam
stabilizers, and to compare their foam stabilizing power to one another as well as the
cling ability.
The first project investigated the impacts of four commercially available hop-
derived foam stabilizers; iso-alpha-acid (Iso), rho(dyhydro)-iso-alpha-acid (Rho),
tetrahydro-iso-alpha-acid (Tetra), and hexahydro-iso-alpha-acid (Hexa). Foam
stabilizing properties and cling formation patterns were investigated using an
unhopped lager beer. Unhopped lager was dosed with Iso, Rho, Tetra, and Hexa,
separately, over a range of concentrations from 2 to 10 ppm. Uniform foam was
created by Inpack 2000 Flasher Head, and was measured by Nibem Foam Stability
Tester (NIBEM-TPH) followed by Nibem Cling Meter (NIBEM-CLM) to determine
the relationship between the concentration and Nibem-30 as well as the cling
formation ability of each compound. The foam stabilizing power was determined to
be Tetra, Hexa, Iso, and Rho from the strongest to weakest. Linear regression models

were created using the NIBEM-TPH dataset, and based on the 95% confidence
interval analysis, the foam stability of Tetra or Hexa becomes significantly larger than
that of Iso when 2.4 ppm or 4.2 ppm of Tetra or Hexa was used, respectively. Cling
formation patterns could be considered into three groups: “ring,” “mesh,” and
“powdery.” The control beer had the lowest foam stability and did not show any cling
on the glass.
The second project focused on three topics; the binary effects of foam stabilizers,
comparison of non-hop and hop based foam stabilizers, and method comparison.
Foam stabilizing properties and cling formation patterns of lager beer to which Tetra,
Hexa, and PGA were added were investigated. Four series of base beers were
prepared to achieve approximately 0, 4, 8, and 12 ppm of Iso to an unhopped lager
beer. On top of each of these, Tetra, Hexa, and PGA were added over a realistic
concentration range to create the samples with two different foam stabilizers. Foam
stability results, NIBEM30 and Foam Stability Figure (FSF), for each sample was
measured using a Nibem Foam Stability Tester (NIBEM-T) and a Steinfurth Foam
Stability Tester (Steinfurth-FST), respectively. Percentage of beer foam clings to the
glass side walls after Nibem-T analysis was measured using Nibem Cling Meter
(NIBEM-CLM). Multiple linear regression models were created for both NIBEM30
and FSF, and the relative foam enhancing strengths of four compounds were
compared. Between the two methods employed, the magnitude of foam stabilizing
power of each compound was different, especially in the case of PGA. This is
presumably due to the difference in the parameters measured, i.e. foam collapse by
Nibem and liquid drainage by Steinfurth. When Steinfurth-FST was used, PGA

showed much better foam stabilizing ability compared to that of NIBEM. In the
investigated range, the foam stabilizing effects of these compounds were found to be
additive for both NIBEM and Steinfurth, though FSF results showed somewhat
hyperbolic tendency.
Overall, positive impacts of all foam stabilizers were confirmed over the
investigated range of concentrations in two different methods. The degree of foam
stabilizing strength varies between compounds. Among the hop-derived foam
stabilizers, the foam stabilizing ability was found to be ordered as Tetra/Hexa, Iso,
and Rho from the strongest to weakest. Tetra and Hexa had approximately same
degree of stabilizing power. Hop-derived foam stabilizers showed an excellent ability
to generate cling while PGA had a minimal effect. Steinfurth, liquid drainage method,
was much more sensitive to the foam stabilized by PGA, and relatively less sensitive
to the hop derived foam stabilizers.

© Copyright by Takeshi Kunimune
December 14, 2007
All Rights Reserved
Foam Enhancing Properties of Hop Bitter Acids and Propylene Glycol Alginate
by
Takeshi Kunimune
A THESIS
submitted to
Oregon State University
In partial fulfillment of
the requirement for the
degree of
Master of Science
Presented December 14, 2007
Commencement June 2008

Master of Science thesis of Takeshi Kunimune presented on December 14, 2007
APPROVED:
Major Professor, representing Food Science and Technology
Head of the Department of Food Science and Technology
Dean of the Graduate School
I understand that my thesis will become part of the permanent collection of Oregon State University libraries. My signature below authorizes release of my thesis to any reader upon request.
Takeshi Kunimune, Author

ACKNOWLEGEMENTS
First of all, I would like to sincerely appreciate my major professor, Dr.
Thomas H. Shellhammer, who always treated me fairly and equally with respect.
Without his generous guidance, my graduate research and entire experience at Oregon
State University could have never been as wonderful as it is right now.
All faculty members and graduate students in the Department of Food Science
and Technology were unbelievably kind and supportive. Especially Jeff Clawson
deserves one of my biggest appreciations. He taught me the hands-on brewing
process with a patience and crazy smile. The experience I had with the lab mates in
the brewing lab and support system we established are extremely important and
special to me.
I would also like to thank John I. Haas, Inc. for their generous contribution of
funding, ingredients, and interests to the research projects I performed in the last two
years.
TABLE OF CONTENTS
Page
1 Introduction …………..…….……………………………………… 1
1.1 Beer Foam and its Constituents …………………………. 1
1.2 Beer Foam Stabilizer …………………………………… 3
1.2.1 Iso-alpha-acids ………………………………… 3
1.2.2 Propylene Glycol Alginate (PGA) ……………. 7
1.3 Measuring the Beer Foam ……………………………….. 9
1.3.1 Foam Stability ………………………………… . 9
1.3.1.1 Sigma Value Method ………………... 11
1.3.1.2 Rudin Method ……………………….. 12
1.3.1.3 Constant Method …………………….. 13
1.3.1.4 Foam Collapse Time Method ………... 14
1.3.1.5 NIBEM Method ……………………… 15
1.3.1.6 Steinfurth Method ……………………. 16
1.3.2 Cling ……………………………………………. 17
1.3.2.1 Reflection Method …………………… 17
1.3.2.2 Lacing Index Method ………………... 18
1.4 Conclusion ……………………………………………….. 20
1.5 Reference ………………………………………………… 22

TABLE OF CONTENTS (CONTINUED)
Foam Stabilizing Effects and Cling Formation Patterns of
Iso-alpha-acid and Reduced Iso-alpha-acids in Lager Beer
Abstract ……………………………………………………………… 28
Keywords ……………………………………………………………. 28
Introduction ………………………………………………………….. 29
Materials and Methods ………………………………………………. 30
Preparation of Beer …………………………………………... 30
Foam Stability and Cling Area Analysis …………………….. 31
Statistical Analysis …………………………………………… 33
Results and Discussion ………………………………………………. 33
Foam Stability ………………………………………………... 33
Cling Area …………………………………………………….. 35
Conclusion ……………………………………………………………. 37
Abbreviation Used ……………………………………………………. 38
Acknowledgment ……………………………………………………… 39
Reference ……………………………………………………………… 40
List of Figures …………………………………………………………. 42
List of Tables ………………………………………………………….. 49

TABLE OF CONTENTS (CONTINUED)
Binary Foam Stabilizer System in Lager Beer
Abstract ……………………………………………………………...... 54
Keywords ……………………………………………………………… 55
Introduction ……………………………………………………………. 56
Materials and Methods ………………………………………………… 58
Preparation of Beer …………………………………………….. 58
NIBEM-T and NIBEM-CLM ………………………………….. 60
Steinfurth-FST …………………………………………………. 61
Results and Discussion ………………………………………………… 62
NIBEM-T ………………………………………………………. 63
Steinfurth-FST ………………………………………………….. 63
Method Comparison ……………………………………………. 65
Cling ……………………………………………………………. 66
Conclusion ……………………………………………………………… 67
Abbreviation Used ……………………………………………………… 69
Acknowledgement ………………………………………………………. 69
Reference ………………………………………………………………… 70
List of Figures ……………………………………………………………. 72
List of Tables …………………………………………………………….. 90

Foam Enhancing Properties of Hop Bitter Acids and Propylene Glycol Alginate
1. Introduction
1.1 Beer Foam and Its Constituents
The foam of beer is one of the first characteristics that consumers would
evaluate with their eyes. The beer foam can have different texture/density, bubble
size, color, flavor, stability, and cling (lacing) ability. Consumers often times have
their individual opinions and preferences on the different aspects of beer foam (1),
and it is important for brewers to know what the target consumers desire and how to
control and adjust this mysterious and sensitive matrix. For this reason, many brewers
and brewing scientists have researched the multiple aspects of beer foam throughout
history. The preference on beer foam, as mentioned earlier, varies depending on the
customer; however, it is a generally accepted concept that the superior foam should
have higher foam stability (a long lasting head) and relatively small, uniform bubbles.
Even though the detailed mechanism is not fully understood, it is believed that
the major contributors of foam stability are surface-active hop acids and malted
barley-based hydrophobic/amphipathic and/or certain proteins. The surface active
bitter acid from hops Iso-alpha-acid, is the bitter acid derived from hops. Alpha-acid,
a natural occurring non-bitter acid in hop resins, undergoes thermal isomerization
during the kettle boil process to become iso-alpha-acid. While alpha-acid is almost
tasteless and is not highly water-soluble Iso-alpha-acid tastes bitter and is relatively
more soluble compared to alpha-acid. This acid, besides the bitterness, also
contributes to other aspects of beer such as stability of foam, shelf life, and mouthfeel
(2). Brewers typically use whole hops, pelletized hops, and/or iso-alpha-acid extracts
2
to add iso-alpha-acids to gain bitterness and other benefits in the end product. Iso-
alpha-acid extracts are produced through the super critical CO2 extraction process.
The purity of those commercial products is reliably high, and if stored at the proper
conditions, their shelf life is relatively long compared to those of whole hops and
pelletized hops. They are spiked, typically, as late in the brewing procedure as
possible to avoid any process losses (3).
There are two schools of thought on what type of barley-based proteins are the
determining factors in foam stability. One group believes that the proteins of
different, specific sizes play the most important role in polypeptide based foam
stability. Examples of such proteins in beer are Protein Z (Mr ca. 40-kDa), (4, 5),
lipid binding protein (by counteracting against the foam negative lipids in the beer)
(6), and glycoproteins (7). The other theory is that high foam stability results from
amphipathic/hydrophobic polypeptides (3, 8, 9). Amphipathic polypeptides, having
both hydrophobic and hydrophilic properties, can effectively situate themselves in the
bubble lamellae; hydrophobic and hydrophilic portions can reach out to the gaseous
and aqueous phase, respectively (3). Some question if high adjunct beer could create
sufficient amount of foam with significantly less barley based polypeptides. Bamforth
found no difference in foam stability between all-malt beer and high-adjunct beer in
his study (10), which suggests there are enough barley-based polypeptides present in
the high-adjunct beer and other constituents play some important roles in enhancing
foam stability.

3
The beer foam matrix is extremely complex, and even though the malted
barley derived polypeptides and hop derived bitter acids are the main foam-positive
contributors, it should not be forgotten that there are other minor, yet important,
physical, chemical, and brewing/malting process factors that could affect the foam.
Such attributes are ethanol concentration (12), pH (3), lipids (11), high gravity
mashing (13), etc.
Increase in ethanol concentration will decrease the foam stability in general. It
reduces the rigidity of foam created by protein layer, and therefore accelerating the
liquid drainage (12). Lower pH will give higher beer foam stability. The reason why
lower pH values play as foam-positive is not clear. However, Hughes (3) suggested
the great amount of hop acids is dissociated at the lower range of pH, resulting these
acids to be more hydrophobic. As surfactants, lipids disrupt the cross-linking of
hydrophobic polypeptides, and in turn result in the tremendous decrease on foam
stability (11). High gravity mashing will reduce the portion of hydrophobic
polypeptides, which, as a result, will reduce the foam stability (13).
Some also believe that the level of foam-negative attributes in the beer matrix
might be more critical to foam stability rather than that of foam-positive (11).
1.2. Beer Foam Stabilizer
1.2.1. Iso-alpha-acids
Iso-alpha-acid is the main source of bitterness in beer, and is the product of
thermally isomerized alpha-acid, which is naturally derived from hops. This acid can

4
stabilize the beer foam, which has the malted barley-based polypeptides as the
backbones of structure, by cross-linking most likely via the hydrophobic interactions
(3, 11). Iso-alpha-acids are surface active compounds, however, unlike some other
surfactants (e.g. ethanol), these acids can effectively enhance the stability of protein-
based foam (11). This is due to the number of hydrophobic sites. While iso-alpha-
acids have multiple hydrophobic sites to effectively cross-link the adjacent
hydrophobic polypeptides in foam, some other surfactants only have single
hydrophobic site, which will not stabilize the foam, but instead, will disrupt the foam-
positive interactions within the system. Iso-alpha-acid is a photosensitive compound.
When exposed to UV light with the presence of photosensitizer (i.e. source of sulfur),
it generates prenyl mercaptan, which has the aroma often referred to as “light-struck”
or “skunk(y)” (14). The foam stabilizing capability of iso-alpha-acid after
photodegradation is not well known. To prevent this UV degradation, iso-alpha-acid
can be chemically altered by reduction, hydrogenation, or both. A ketone group of
iso-alpha-acid can be reduced to a hydroxyl group by addition of two hydrogen
atoms, resulting in less polarity. Also, two alkenyl groups can be hydrogenated to
convert each double bond to two single bonds by adding two hydrogen atoms for each
(15). Reduced, hydrogenated, and reduced and hydrogenated forms of iso-alpha-acid
are rho- iso-alpha-acid or dihydro-iso-alpha-acid (“Rho”), tetrahydro-iso-alpha-acid
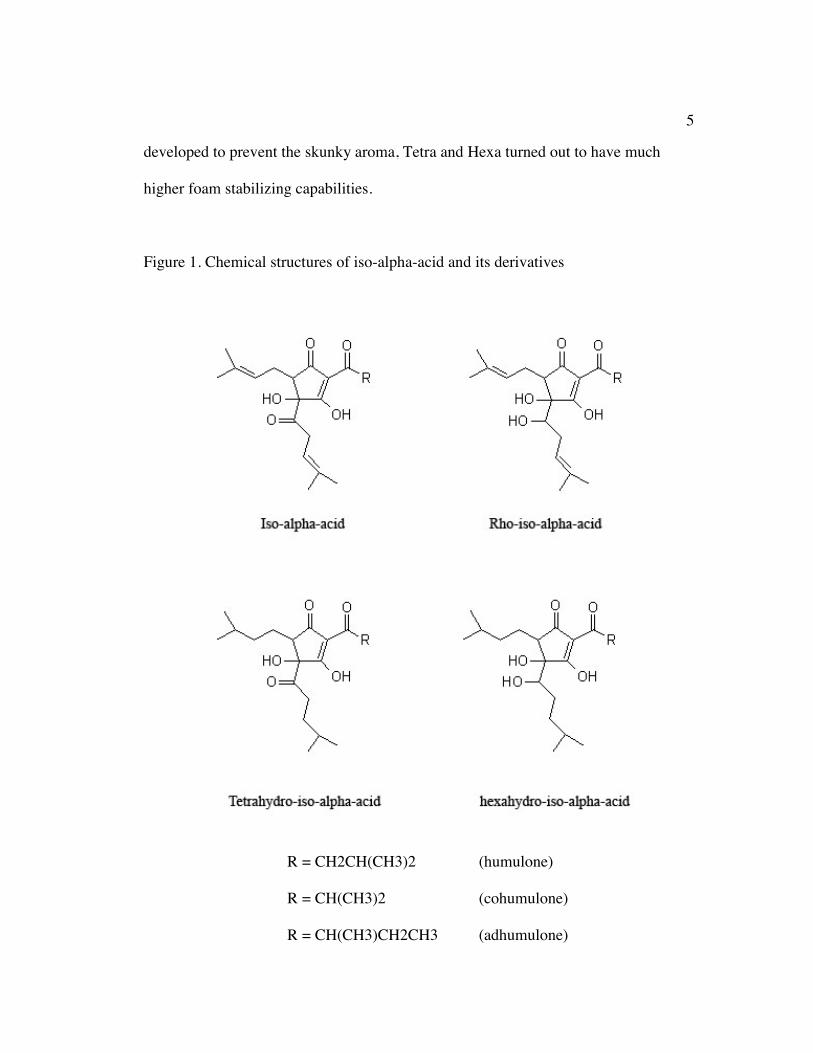
(“Tetra”), and hexahydro-iso-alpha-acid (“Hexa”), respectively (Figure 1). “R” in
Figure 1 indicates the different alkyl groups. These compounds are much more light-
stable compared to iso-alpha-acid (14). Even though these chemical variants were
5
developed to prevent the skunky aroma, Tetra and Hexa turned out to have much
higher foam stabilizing capabilities.
Figure 1. Chemical structures of iso-alpha-acid and its derivatives
R = CH2CH(CH3)2 (humulone)
R = CH(CH3)2 (cohumulone)
R = CH(CH3)CH2CH3 (adhumulone)

6
The reason for high foam stability relative to original iso-alpha-acid is
believed to be the increased hydrophobicity. These hydrophobic compounds interact
with hydrophobic/amphipathic polypeptides and decrease the lateral diffusion by
making the bubble layer much more rigid (16). Asano and Hashimoto demonstrated
the increase in head forming capacity when the compounds with more hydrophobic
side chains were used (17). Use of these chemically modified variants for the
increased foam stability needs to be performed with caution since they might increase
the bitterness intensity and/or change the characteristics/quality of bitterness when
used at the same concentration level as the original iso-alpha-acid (14) (18) (15) (19).
Baker investigated the impact on the beer foam, including cling, and clarity of iso-
alpha-acids in an attempt to find the optimum level of iso-alpha-acids while
minimizing the negative effects such as haze formation (20). The impacts of iso-
alpha-acid (IAA), rho-iso-alpha-acid (RIAA), tetrahydro-iso-alpha-acid (THIAA),
hexahydro-iso-alpha-acid (HHIAA), and the combination of IAA and HHIAA at the
ratio of 65:35 were studied. He found no significant effect on IAA and RIAA beyond
10 and 15mg/L addition rates on foam collapse time while other extracts showed the
continuous, significant effects throughout the whole treatment. In terms of cling
capability, no further improvement was found beyond 10mg/L on RIAA, and 5mg/L
addition rates on the rest of extracts. Baker employed multiple methods to assess the
foam stability and cling capability; NIBEM, Rudin head retention value (HRV), in-
house foam stand procedure, and cling-rating procedure. Unfortunately, the detailed
information of these “in-house foam stand procedure” and “cling-rating procedure”

7
was not indicated, and it is impossible to replicate and validate the results due to the
lack of information. Furthermore, the treatment level solely based on the addition rate
does not take into an account the utilization rates of these compounds. However, it is
important to realize that positive correlations between foam stability and
concentration of compounds were observed for all samples, and the foam stabilizing
power was found to be THIAA, HHIAA, 65/35 IAA/HHIAA, RIAA, and IAA
extracts from the strongest to weakest. As an overall conclusion, it was suggested to
use these iso-alpha-acid extracts up to 10mg/L.
1.2.2. Propylene Glycol Alginate (PGA)
Another common foam stabilizer that is not derived from traditional beer
ingredients is propylene glycol alginate (PGA), which is originally derived from
brown seaweed. It’s produced by the partial esterifiation of alginic acid with
propylene oxide and is a non-ionic ester of a polymeric acid (21). PGA is used as a
stabilizer and thickener in many food products such as ice cream, salad dressing, and
candy. Even though it is still unclear how PGA stabilizes foam, it will effectively
increase the foam stability presumably by thickening the viscosity of bulk liquid
and/or the electric double layer of lamellae with minimal addition of haze when dosed
at the appropriate level (3).

8
Figure 2. Chemical structure of PGA
The high degree of esterification is considered to be essential mainly to
minimize the addition of beer haze, but not necessarily for the foam stability (21).
PGA can give more attractive foam due to the even distribution of smaller bubbles (2)
and fine creaminess (21). It is widely accepted as resistant to lipid damage, increasing
the foam durability (21).
One of the arising issues on the addition of foam stabilizers is the legal
labeling of ingredients. In Japan, most brewers do not use PGA and even
hydrogenated and/or reduced iso-alpha-acids since they are considered as artificial
additives, which decreases the consumers’ attraction. To overcome this problem,
Smith et al. investigated the natural occurring iso-alpha-acid derivatives and found
dihydroisohumulone to have the high foam stabilizing ability as well as that of lacing
(22).
It is obvious that there are many attributes that can influence how the beer
foam performs. The difficulty of achieving and conflicts of opinions on the superior

9
foam are, unfortunately, not only because of the beer constituents, but also because of
the methods employed.
1.3. Measuring the Beer Foam
1.3.1. Foam Stability
The foam measurement is believed to be limited to the observation or a
dynamic system due to the transient and heterogeneous nature of beer foam (3). There
are various methods available to measure the foam stability. In other words, there is
no universal standard method set to measure foam stability. Bamforth claimed that
inventing a “decent method” is the biggest need for the proper foam quality
assessment (11). One of the variables is the way to create foam; natural vs. artificial.
Natural methods are the ones that focus on the actual consumer sensory perception.
The sample dispensed could potentially mimic the real-life condition. Using the
natural pouring method, one can observe the foam stability under the relatively
similar condition to that in trade. However, it is extremely difficult to reproduce such
foam since it can be easily affected by the smallest changes in the experimental
conditions such as pouring angle and height, environmental conditions, flow rate,
bubble size variability, the surface area that sample beer comes in contact, operator
variability, and more. Also, using the natural pouring method, the individual bubble
size tends to vary tremendously compared to the artificial pouring method. Since the
pressure inside of bubble is inversely proportional to its volume, the wide range of
energy gradient could occur, which increases the entropy of foam matrix and leads to
10
lowering the foam stability (3). On the other hand, the artificial pouring method could
be relatively consistent and fairly reproducible. A common way of artificial pouring
method is by flashing the sample through small orifice using gas (typically carbon
dioxide or compressed air). Using the artificial method, the foam sample produced is
highly reproducible, but this artificially created foam is not the one that consumers
would typically see at the bar or home settings. It is also worth questioning if the
sample that indicated the high foam stability using an artificial pouring method would
perform in the similar manner when the sample was poured using a natural pouring
method and vice versa.
“Foam stability” is a very general term and overwhelmingly understates the
complexity of the foam matrix. Two common ways to assess the foam stability are
the foam collapse and liquid drainage measurements. The foam collapse is the
measure of overall foam collapsing rate (often times measured by height or volume of
foam) while the liquid drainage method is measuring the ability of foam to prevent
the liquid to drain from the foam matrix. Bamforth criticized the existing
conventional methods with three points: 1) significant amount of liquid could drain
from the foam without substantial foam collapse with some beer samples, but not all
beer, 2) by degassing the sample beer, the impact of gases used is not taken into
account, and 3) complete foaming, such as foam tower and foam column of Rudin,
creates the foam that is not realistic in the commercial environment (2). Yasui et al.
also criticized the most conventional methods from the consumers’ perspectives for
three reasons: 1) most experiments are performed at room temperature (20oC), which

11
is typically different from the beer serving temperature, 2) artificial foam generation
is often times used instead of natural pouring as in a typical consumption
environment, and 3) most methods focus on extremely narrow, specific attribute on
foam stability (23). Considering the temperature as a tremendous impact on the foam
stability, the unrealistic foam by artificial method, and the dynamic of foam matrix,
their claims can be considered fair and valid especially since the visual appeal to
consumers is the most important attribute of beer foam. It is imperative the brewing
industry, as a whole, address these problems that Bamforth and Yasui et al. brought to
our attention. Some of the most notable methods developed in the past century for
foam stability measurement are listed below.
1.3.1.1. Sigma Value Method
There are two ASBC official methods to measure the properties of beer foam.
Both of the methods involve foam collapse rate. Modified Carlsberg Sigma Value
method is one of them (24). The concept of Sigma value was first introduced by Ross
and Clark, and was applied to both methods of Blom and Carlsberg (25). The beer
sample is poured into a special foam funnel to generate foam until the total volume
reaches 800mL, and the funnel is then covered. After 30 seconds, the liquid at the
bottom of the funnel is drained in 25-30 seconds leaving only foam in the funnel.
After exactly 200 second from the drainage of liquid, the liquid newly generated from
foam collapse during the last 200 seconds (b, in equation 1) is removed from the
funnel within 25-30 seconds. The total time of foam collapse, which will be between

12
225-230 seconds, is recorded (t). The remaining foam in the funnel is collapsed using
defoaming agent such as octanol or isopropyl alcohol, and the liquid from collapsed
foam is collected (c). The sigma value is calculated as Equation 1.
= t / (2.303 log[(b + c) / c]) Equation 1
The foam stability will be described as “good”, “average”, and “poor” for
>105, 95-105, and <95 seconds, respectively (2). The original Carlsberg method had
two other values; the volume of beer drawn off after two minutes (a), and the density
of beer formed from the foam (d). However, these values were omitted based on the
finding of Ross and Clark (25), and due to the further modification on the liquid/foam
collection timing, the current ASBC official method was established. Ross and Clark
Method uses the same Sigma value equation as that of ASBC, but the time and liquid
collection are slightly different between these two (25); however, the concept is
essentially identical.
1.3.1.2. Rudin Method
Rudin Method (26) is one of the first liquid drainage methods, and is still used
widely especially throughout Europe. The de-gassed, attemperated beer sample is
filled to exactly 10.0cm height in a tall glass tube (2.6cm ID, 2.8cm OD, 35cm
height), and the sample is then foamed by the sintered glass positioned at the bottom
of tube with carbon dioxide until the air-foam interface reaches to 32.5cm point in a
13
period of 60±5 seconds. The liquid is allowed to drain from the foam tower after the
gas flow is stopped, and the time that required the liquid-foam interface to travel from
5.0 to 7.5cm is recorded as a half-life of the foam, or “Rudin Head Retention Value
(HRV).” Various methods were created or modified based on Rudin’s method (such
as Steinfurth-FST unit; discussed later), and HRV is still considered by many brewers
as a useful value for the foam stability measurement.
1.3.1.3. Constant Method
Marc Constant, Miller Brewing Co., developed an extremely cheap and easy
method that could potentially mimic the foam behavior in the normal consumer
setting (27). In his method, a bottle of beer is conditioned at 20oC and poured into a
1L tall foam beaker from the set height and angle. When the entire volume of sample
is poured from the bottle, the measurement begins and continues for five minutes.
The total height (foam and liquid) and liquid height are recorded at 1.0, 1.5, 2.0, 3.0,
4.0, and 5.0 minutes, and the foam height was calculated based on these two values
by subtracting liquid height from total height. The foam height was log transformed
to create a fairly linear line to obtain its slope and intercept, indicating the foam
collapse rate and foamability, respectively. Constant set other values from his method
such as Normalized Half Life (NHL), Half Life (HL), Life, Quality, and Density.
Even though this method is designed around the foam collapse/decay concept, one
can easily obtain the value for foam drainage method by investigating the liquid
height over time.
14
1.3.1.4. Foam Collapse Time (FCT) Method
Yasui et al. developed an interesting method that focuses on the perception of
consumers. (23). As mentioned earlier, they criticized the most conventional methods
with three points from consumers’ perspectives: analysis temperature, foam
generation, and narrow focus. In their method, the beer and room temperatures are set
to 6oC and 20oC, respectively. The beer is poured with the mouth of the bottle as the
pivot point instead of the center of bottle body to create a smooth flow. The sample is
poured from the bottle into a glass (6.0 x 9.0cm, i.d.) to achieve a 2:3 ratio between
foam and liquid after 10 seconds of pouring, and a total sample weight of 150 grams.
The time required for 40% foam to settle down to the single layer of foam at the air-
foam interface is recorded as the foam collapse time (FCT) value. A sensory analysis
on beer samples was also performed to rank foam stability, foamability, adhesion,
creaminess, and overall likeability by trained panelists. FCT values did not correlate
to the Sigma value (5.4% correlation); however, they did find a high correlation
between FCT value and the overall visual impression score from sensory analysis.
NIBEM, Rudin, and Sigma values were found not to have any correlations with the
sensory score. This method is highly specialized for the Japanese beer consumption
environment and will not be reliable in other markets such as that of U.S. or Europe,
though there is a possibility for modification, especially on the foam-liquid ratio. The
apparatus cost is extremely high due to the entirely computer-controlled pouring
15
system. Even though the concept of FCT method is claimed as “customer-oriented,”
the secondary cling factor was not taken into account.
1.3.1.5. NIBEM Method
The NIBEM Foam Stability Tester (NIBEM-FST) is currently the EBC
official method of measuring the foam stability (28). The standard environmental
conditions are set as 20oC, 50%RH, and 1013mbar for the foam temperature, relative
humidity, and atmospheric pressure, respectively. A standard NIBEM glass (inside
diameter: 60mm, inside height: 120mm) is filled entirely with foam by a sampling
device creating uniform, and relatively smaller sized bubbles. After the glass is filled
with foam, it is then immediately placed in the NIBEM-FST to start the analysis. The
electrode holder is slowly lowered until one of the electrodes touches the foam. The
holder will follow the decay of foam over time as the contact is broken and start the
actual measurement at 10mm below the rim of the standard glass. This waiting
distance 10mm is to minimize the variability of the initial settlement stage of foam.
From the starting point, the unit records the time required to get to 10, 20, and 30mm
and records them as NIBEM10, NIBEM20, and NIBEM30, respectively. If any of the
standard environmental condition was not met, then it can be compensated, but the
compensation constants for temperature, relative humidity, and atmospheric pressure
are sample dependent, and they need to be obtained for each product individually.

16
1.3.1.6. Steinfurth-FST
Steinfurth Foam Stability Tester is one of the newest foam measuring
instruments that is fully automated from sampling to cleaning. The beer sample
(approximately 164ml in liquid volume) will be converted into foam under 4.0bar
(apx. 58psi) during the sampling process. Once the sample injection is completed, the
unit starts counting time in seconds. The liquid drains from the foam matrix over
time, and two non-contact optoelectronic sensors that are situated behind the column
record the time when the foam-liquid interface rises. The required time for the foam-
liquid interface to rise from the first sensor to the second, i.e. the third quarter (50%
to 75%) of beer to be drained from foam, is recorded as the half-life (HL) in seconds.
The foam stability figure (FSF), which is claimed to correlate to the Sigma value of
Ross and Clark method (25), is 120% of HL in value. The unit gives you the option of
single or multiple measurements; single measures the FSF of the sample once, while
multiple does so twice. When the multiple measurement is selected, the second
measurement tends to be slightly higher in FSF since the connected carbon dioxide
pressure is significantly higher than the typical dissolved CO2 level of beer (29). The
concept of Steinfurth unit originates from the Rudin method (26). The major
difference of Steinfurth-FST from Rudin method, besides the full automation, is the
beer used in Steinfurth unit is not degassed unlike that for Rudin’s. Otherwise all
other conditions are identical.
17
1.3.2. Cling
Cling, or lacing, is the term used to describe the foam adhered to the inner
wall of the glass after foam decay and/or liquid drainage. The consumer preferences
on the amount and pattern vary tremendously, similar to the preference on head.
While some underestimate this beautiful characteristic of beer, the cling might be
visually even more important than the head, particularly with draught beers (30).
Iso-alpha-acids play a very important roll in cling formation since when they are not
present in the beer, the cling will be observed at the minimal amount or even none
(16, 31). However, the author would like to note that there are other alternative ways
of creating cling without using iso-alpha-acids. The formation and mechanism of
cling are not fully understood at this point, but it has been observed some hop
polyphenols show cling ability in the beer without the presence of iso-alpha-acids
(unpublished results). Similar to foam stability, there are of course cling-negative
components in the beer matrix. Besides the obvious ones, such as lipids, some basic
amino acids, arinine, lysine, and histidine, were suggested as cling-inhibitors by
Furukubo et al. (32).
1.3.2.1. Reflection Method
Reflection method is an easy and quick way to measure the area of cling. One
of the most common units is NIBEM-CLM (Haffmans ©), which is used immediately
after NIBEM-FST (Haffmans ©). The area measured is corresponded to the NIBEM-
FST, i.e. from 10 to 40mm below the rim of the NIBEM standard glass. It measures
18
the reflectivity of this 30mm band inside of the glass to calculate the covered area as a
percentage, i.e. it recognizes the difference in reflectivity between glass and foam.
The actual visual perception could be dramatically different from the NIBEM-CLM
values since its detecting area is limited and also the pattern of cling varies depending
on the beer constituents and their concentrations. Additionally, it does not take the
thickness of cling into account unlike the lacing index method discussed below.
1.3.2.2. Lacing Index Method
Lacing Index Method was developed by Jackson and Bamforth (33).
Degassed beer is poured into a glass container that has a drain tube at the bottom side,
and 2cm of head is produced by controlled carbon dioxide using a sinter at the bottom
of the container. Over time, the liquid bulk is drained from the bottom of glass
apparatus to simulate the secondary cling, the cling produced by consumption. After
all liquid is drained, the foam adhered to the glass is dissolved in water, and this
aqueous solution is measured by spectrophotometer at absorbance of 230nm to
quantitatively analyze the amount of lacing. It is considered as an acceptable lacing if
LI is greater than 2.5, which does not take an account for the foam quality. Bamforth
himself mentioned the importance of difference between “Foam Quality” and “Foam
Stability,” and cautioned the creation of unnatural foam/cling (11).
Glenister and Segel raised the importance of the primary and secondary cling;
the primary cling is created by the initial head collapse, and the secondary cling is the
cling that is formed when the consumer removes the liquid bulk from the container
19
(34). This concept should be taken seriously even though, with the most available
methods for cling measurement, it is extremely difficult to measure the quantity and
quality of secondary cling. Lacing Index method is created around the concept of
secondary cling and consumer perception; however, LI method only indicates the
volume/amount of cling produced, and does not measure any attributes in terms of
qualitative mean, which is the important part of foam adherence.
Bamforth and Jackson used their Lacing Index method (LI) to investigate the
impact of various hop acids (31). It was concluded that the presence of isohexenoic
side-chain of iso-alpha-acids, or the additional isopentenyl residues of other hop acids
such as alpha acids, hulupones, and beta-acids are essential for the foam adhesion,
though the actual mechanism was not discussed in the study. The authors also
mentioned that the use of other gases such as nitrogen and oxygen at certain level
instead of carbon dioxide will not create the lacing. This is due to the cohesive forces
between the head and glass (the vessel surface) are much weaker than those within
the head, and therefore, the extremely stable head will be gradually lowered
throughout the consumption without leaving any adherence to the glass. Ethanol
between 1-3% v/v in the beer matrix was found to be significantly cling-positive,
while 4-5% v/v showed the exact opposite. To improve the foam adhesion, they
concluded that minimizing the amount of C10 and C12 fatty acids and proteolysis
during malting and mashing is the most effective and logical path considering the
deficiency of lacing is most likely caused by either the presence of short chain fatty
acids or insufficiency of foam-positive peptides, not by the lack of hop resins.

20
1.4. Conclusion
The beer foam matrix is an extremely complicated colloidal matrix that
consists of numerous foam-positive and negative components. After the development
of iso-alpha-acid extracts, brewers obtained an “easy” way to control and adjust the
property of foam. Some also use non-hop derived materials, such as PGA, to stabilize
the foam. However, these stabilizers need to be used with caution since they could not
only enhance the stability of foam, but also influence its flavor quality, bitterness,
overall appearance, mouthfeel, and, of course, the quality of foam itself. The
following two projects have been carried out to clarify the impact of these foam
stabilizers, and to compare their foam stabilizing power to one another as well as the
cling ability.
The first project investigated the impacts of four commercially available hop-
derived foam stabilizers; iso-alpha-acid, rho(dyhydro)-iso-alpha-acid, tetrahydro-iso-
alpha-acid, and hexahydro-iso-alpha-acid. The foam stabilizing capabilities of these
compounds were investigated over the range of realistic dosage level in unhopped
lager beer to determine the pure impacts on foam stability using NIBEM method. The
pattern of cling was also considered as an important attribute to the quality of overall
cling assessment. Digital photographs of primary cling after NIBEM measurements
were taken so that viewers can have a rough idea of how much of what compound
would create the desirable cling for their needs.
The second project focused on three topics; the binary effects of foam
stabilizers, comparison of non-hop and hop based foam stabilizers, and method

21
comparison. Tetrahydro-iso-alpha-acid, hexahydro-iso-alpha-acid, and PGA were
dosed at the range of realistic levels on top of four different levels of iso-alpha-acid
concentrations. The foam stability was measured using both NIBEM and Steinfurth
methods to determine if similar results could be obtained by using two dramatically
different types of measurement.

22
1.5 Reference:
(1) Bamforth, C. W., Perceptions of Beer Foam. J. Inst. Brew. 2000, 106, (4),
229-238.
(2) Bamforth, C. W., The Foaming Properties of Beer. J. Inst. Brew. 1985, 91,
(6), 370-383.
(3) Hughes, P., Keeping a Head: Optimising Beer Foam Performance. In Bubbles
in Food, American Association of Cereal Chemists: St. Paul, Minnesota, 1999; pp
129-144.
(4) Kaersgaard, P. a. H., J., Antigenic beer macromolecules – an experimental
survey of purification methods. J. Inst. Brew. 1979, 85, 103-111.
(5) Lusk, L. T., Goldstein, H., and Ryder, D., Independent role of beer proteins,
melanoidins and polysaccharides in foam formation. J. Am. Soc. Brew. Chem. 1995,
53, 93-103.
(6) Sørensen, S. B., Bech, L. M., Muldbjerg, M., Beenfeldt, T., and Breddam, K,
Barley lipid transfer protein 1 is involved in beer foam formation. Tech. Q. Master
Brew. Assoc. Am. 1993, 30, 136-145.
(7) Roberts, R. T. In Glycoproteins and beer foam, European Brewery
Convention Proceedings of the 15th Convention, Nice, 1975; Nice, 1975; pp 453-464.
(8) Lewis, M. J. a. L., A. S., Correlation of Beer Foam with Other Beer
Properties. Tech. Q. Master Brew. Assoc. Am. 2003, 40, (2), 114-124.

23
(9) Slack, P. T., and Bamforth, C. W., The fractionation of polypeptides from
barley and beer by hydrophobic interaction chromatography: The influence of their
hydrophobicity on foam stability. J. Inst. Brew. 1983, 89, 397-401.
(10) Bamforth, C. W., Beer Quality Series: Foam. Brew. Guardian 2000, 129, (3),
40-43.
(11) Bamforth, C. W. In Beer Foam Quality. Bringing matters to a head: The status
of research on beer foam, Eur. Brew. Conv. Monogr. , Fachverlag Hans Carl,
Nürnberg, Germany, 1999; Fachverlag Hans Carl, Nürnberg, Germany, 1999; pp 10-
23.
(12) Brierley, E. R., Wilde, P. J., Onishi, A., Hughes, P. S., Simpson, W. J. and
Clark, D. C., The influence of ethanol on the foaming properties of beer protein
fractions: a comparison of Rudin and microconductivity methods of foam assessment.
J. Sci. Food Agric. 1996, 70, 531-537.
(13) Bryce, J. H., Cooper, D. J., and Stewart, G. G. In The potential to improve
foam stability of high gravity brewed beer, E.B.C. Symposium on hops,
Zouterwoude, the Netherlands, 1994; Zouterwoude, the Netherlands, 1994; pp 141-
164.
(14) Todd, P. H., Johnson, P. A., and Worden, L. R., Evaluation of the relative
bitterness and light stability of reduced iso-alpha-acids. Tech. Q. Master Brew. Assoc.
Am. 1972, 9, (1), 31-35.
(15) Guzinski, J. A. In Practical consideration of reduced hop extracts, European
Brewing Convention. Symposium on Hops., 1994; 1994; pp 105-113.
24
(16) Hughes, P., The Significance of Iso-a-Acids for Beer Quality Cambridge Prize
Paper. J. Inst. Brew. 2000, 106, (5), 271-276.
(17) Asano, K. a. H., N, Contribution of hop bitter substances to head formation of
beer. Report of the Research Laboratories of Kirin Brewer Co., Ltd. 1976, 19, 9-16.
(18) Fritsch, A. N. a. S., T.H. In O-8. Relative bitterness of reduced iso--acids to
iso--acids in lager beer, Annual Meeting of the American Society of Brewing
Chemists, La Quinta, CA, June 17-21, 2006; La Quinta, CA, 2006.
(19) Goldstein, H. a. T., P. In Post kettle bittering compounds: analysis, taste, foam
and light stability, E.B.C.-Symposium on Hops, Zouterwoude, The Netherlands,
1994; Zouterwoude, The Netherlands, 1994; pp 141-164.
(20) Baker, C. W., Impact of Post-Filtration Addition of Selected Hop Extracts on
Beer Foam and Clarity. MBAA Technical Quarterly 1990, 27, (2), 33-38.
(21) Bennett, A. N. In Propylene glycol alginate for the brewing industry, Inst.
Brew. Proc., Cent. SA. Sect., 1993; Cent. SA. Sect., 1993; pp 185-193.
(22) Smith, R. J., Davidson, D., and Wilson, R. J. H., Natural Foam Stabilizing and
Bitering Compounds Derived from Hops. J. Am. Soc. Brew. Chem. 1998, 56, (2), 52-
57.
(23) Yasui, K., Yokoi, S., Shigyo, T., Tamaki, T., and Shinotsuka, K., A customer-
oriented approach to the development of a visual and statistical foam analysis. J. Am.
Soc. Brew. Chem. 1998, 56, 152-158.
(24) American Society of Brewing Chemists, Beer 23-C. Iso-alpha-acids by solid
phase extraction and HPLC. In Methods of Analysis, 9th ed, St. Paul, MN, 2004.
25
(25) Ross, S. a. C., G. L., The measurement of foam stability with special reference
to beer. Wallerstein Lab. Comm. 1939, 6, 46-54.
(26) Rudin, A. D., Measurement of the foam stability of beers. J. Inst. Brew. 1957,
63, 506-509.
(27) Constant, M., A Practical Method for Characterizing Poured Beer Foam
Quality. J. Am. Soc. Brew. Chem. 1992, 50, (2), 37-47.
(28) European Brewery Convention, Method 9.42. Foam Stability of Beer using
the NIBEM-T Meter. In Analytica-EBC, Zoeterwoude, the Netherlands, 2006.
(29) Steinfurth, I., Steinfurth Mess-Systeme GmbH, Operation Manual Foam
Stability Tester. 2006; p 3-4.
(30) Curtis, N. S., The impact of science on quality. J. Inst. Brew. 1975, 81, 391-
398.
(31) Bamforth, C. W. a. J., G. In Aspects of foam lacing, European Brewery
Convention, Proceedings of the 19th Congress, London, 1983; London, 1983; pp 331-
338.
(32) Furukubo, S., Shobayashi, M., Fukui, N., Isoe, A. and Nakatani, K., A new
factor which affects the foam adhesion of beer. Tech. Q. Master Brew. Assoc. Am.
1993, 30, 55-58.
(33) Jackson, G. a. B., C. W., The measurement of foam lacing. J. Inst. Brew.
1982, 88, 378-381.

26
(34) Glenister, P. R. a. S., E. In Foam evaluation. I. Primary cling; secondary cling;
foam strength, Proceeding of the American Society of Brewing Chemists, 1964;
1964; pp 55-59.

27
Foam Stabilizing Effects and Cling Formation
Patterns of Iso--acid and Reduced Iso--acids
in Lager Beer
Takeshi Kunimune; Thomas H. Shellhammer*
Department of Food Science and Technology, Oregon State University
100 Wiegand Hall Corvallis, OR 97330
[email protected]; [email protected]
* Author to whom correspondence should be addressed [telephone (541) 737-9308;
fax (541) 737-1877; e-mail [email protected]].
28
ABSTRACT:
Foam stabilizing properties and cling formation patterns of iso--acids and reduced
iso--acids were investigated using an unhopped lager beer. Unhopped lager was
dosed with iso--acid (Iso), rho-iso--acid (Rho), tetrahydro-iso--acid (Tetra), and
hexahydro-iso--acid (Hexa), separately, over a range of concentrations from 2 to 10
ppm. Uniform foam was created by Inpack 2000 Flasher Head, and was measured by
Nibem Foam Stability Tester (NIBEM-TPH) followed by Nibem Cling Meter
(NIBEM-CLM) to determine the relationship between the concentration and Nibem-
30 as well as the cling formation ability of each compound. The foam stabilizing
power was determined to be Tetra, Hexa, Iso, and Rho from the strongest to weakest.
Linear regression models were created using the NIBEM-TPH dataset, and based on
the 95% confidence interval analysis, the foam stability of Tetra or Hexa becomes
significantly larger than that of Iso when 2.4 ppm or 4.2 ppm of Tetra or Hexa was
used, respectively. Cling formation patterns could be considered into three groups:
“ring,” “mesh,” and “powdery.” The control beer had the lowest foam stability and
did not show any cling on the glass.
KEYWORDS:
hop acid; iso--acid; IAA; tetrahydro-iso--acid; THIAA; hexahydro-iso--acid;
HHIAA; rho-iso--acid; RIAA; brewing; beer; lager beer; foam; cling; foam stability;
NIBEM

29
INTRODUCTION
Foam is an important quality for beer aesthetics. Consumers judge foam
quality by comparing attributes such as head retention, quantity, texture (density),
cling (adherence to glass), whiteness, bubble size, and viscosity (1). Superior foam
can be defined as foam with uniform, small, spherical bubbles that stay for a desirably
long period of time and leave pleasant adherence to glass, and there are multiple
variables for brewers to manipulate in order to achieve this types of foam. Factors
such as the balance of certain proteins from barley malts, the levels of iso--acids
from hops, alcohol content, some metal cations, and minimal existence of lipids are
believed to play significant roles in determining the quality of foam (1-6).
Iso--acids play an important role for the quality of foam since they not only
stabilize the head retention but also create lacing. A minimal amounts of foam would
adhere to the inner glass sidewalls without iso--acids (6-8). Iso--acid is a
photosensitive compound. With the presence of riboflavin, it can undergo UV
photolysis to create a prenyl mercaptan which is an off-flavor often described as
“light-struck” and/or “skunk(y).” To prevent this reaction from occurring in finished
beer, chemically reduced iso--acids were created. These reduced and/or
hydrogenated compounds, such as tetrahydro-iso--acid (Tetra) and hexahydro-iso--
acid (Hexa), effectively add bitterness without susceptible to photodegradation (5).
Additionally, these chemical derivatives have higher foam stabilizing powers as well
as cling capabilities (7).

30
The objective of this study was to determine the effects of iso--acid (Iso) and
three chemical derivatives, rho-iso--acid (Rho), tetrahydro-iso--acid (Tetra), and
hexahydro-iso--acid (Hexa), on the foam stability and cling formation over a range
of concentrations in lager beer using Nibem Foam Stability Tester (NIBEM-TPH)
and Nibem Cling Meter (NIBEM-CLM). Furthermore, the qualitative differenses
were evaluated using digital photographs of cling patterns.
MATERIALS AND METHODS
Preparation of Beer. Unhopped lager was brewed at the Oregon State
University pilot brewery using pale 2-row malted barley (Great Western Malting
Co.), rice syrup solids (California Natural Products) and lager yeast (Wyeast strain
2007). The 2-row pale malted barley and rice syrup solids contributed 75% and 25%
of the soluble extract, respectively. The original gravity and final gravity were
11.69oP and 3.45oP, respectively. Following fermentation at 14.5oC for two weeks,
the temperature was dropped to 1.7oC and 35g/hl PVPP (Polyclar® VT, International
Specialty Products) was added to the beer. The beer was pumped into a sterile, CO2
charged conical fermenter and held for another week at 1.7oC before filtration. The
beer was filtered through a 1.2m nominal filter pad (Cellupore®, 1940SD grade,
Gusmer Cellulo Co.), dosed with high levels of iso--acid (57 ppm), rho-iso--acid
(55 ppm), tetrahydro-iso--acid (24 ppm) and hexahydro-iso--acid (44 ppm), then
re-filtered to remove insoluble hop acids. The concentrations of filtered samples were

31
analyzed by ASBC method Beer-23C (9) using a Discovery C18 HPLC columns.
DCHA-Iso ICS-I1, DCHA-Rho ICS-R1, Tetra ICS-T1, and DCHA-Hexa ICS-H1
were used as HPLC standards for Iso, Rho, Tetra, and Hexa, respectively. The beer
with high concentrations of each compound was diluted with unhopped beer and
mixed gently to obtain five separate samples with a range of concentrations
approximately between 2 and 10 ppm. Each sample was labeled as “compound-a, b,
c, d, or e” from the lowest to highest concentration. For instance, the lowest
concentration of iso--acid was labeled as “Iso-a,” and the second highest
concentration of hexahydro-iso--acid was labeled as “Hexa-d.” After blending, all
samples were carbonated to 12psi at 1oC for at least three days, and HPLC analysis
was performed to obtain the final concentration of each sample using ASBC method
Beer-23C (9) (Table 1). Prior to foam testing samples were removed from the cold
room, and were left at room temperature over night (20.0oC +/- 0.5oC) to equilibrate
in temperature.
Foam Stability and Cling Area Analysis. The modified EBC 9.42 method
(10) was applied to measure the foam stabilities. A Haffmans Standard Glass (inside
diameter 60mm, inside height 120mm) was used for all measurements. Since cling
can be greatly influenced by the state of glass, the glass was washed with hot water
and sodium tetraborate decahydrate (Borax), and rinsed well with deionized water
before every measurement. Immediately before dispensing foam into the glass, it was
rinsed again thoroughly with deionized water. Reproducible foam was prepared using

32
an Inpack 2000 Haffmans flasher head, which was directly connected to a 3 or
5gallon keg (11.36L or 18.93L). A CO2 pressure of 30psi was applied to the keg to
push the sample beer through the flasher head and create foam into a Haffmans
standard glass up to the rim of glass. Quickly after dispensing the foam, the glass was
placed in a Haffmans Foam Stability Tester (Nibem-TPH) that had been previously
calibrated using a standard glass filled with tap water.
Nibem-30 data were collected and analyzed keeping the analysis environment
as close as possible to the standard ambient condition; 20oC foam temperature,
1013mbar atmospheric pressure, and 50% relative humidity. Nibem values and cling
area percentages were collected over 5 days under the average conditions of 20.3oC
foam temperature, 1006mbar atmospheric pressure, and 45.9% relative humidity.
The foam was allowed to decay to 10mm below the top edge of the standard
glass before the Nibem measurement commenced, and the time required to reach 10,
20 and 30mm from this distance was recorded as Nibem-10, Nibem-20, and Nibem-
30, respectively. As Nibem-TPH started, the duration of the foam stability analysis
was measured separately by a stopwatch to calculate the wait time for a Haffmans
Cling Meter (Nibem-CLM). The equation below was developed by interpolating
Haffmans’ suggested time to find the best wait time (twait) in second for each
sample.
60)30(*5.1 += Nibemtwait
After Nibem-TPH analysis was performed and the appropriate wait time had
elapsed, the sample was moved to Nibem-CLM to perform an analysis on the cling
33
percentage on the inside of standard glass sidewall. The glass inner sidewall scanned
by Nibem-CLM corresponds to the distance of Nibem-TPH, i.e. Nibem-CLM scans
the 30mm band; from 10mm to 40mm below the rim of standard glass. Nibem-CLM
was calibrated using a 77.8% reflectivity calibration column provided by Haffmans.
The Nibem-CLM wait time was set as 0 seconds in its configuration so that when the
calculated wait time approached the analysis could be started instantly. Digital
photographs of cling were taken soon after the cling area measurement finished. A
sheet of black plastic was inserted half way into the glass so that the cling of only one
side of glass was visible. For each compound and concentration combination, five
separate foam measurements were taken. The order of analysis was randomly
assigned.
Statistical Analysis. NIBEM30 results were statistically analyzed with linear
regression models using S-Plus. Confidence intervals (95%) were obtained for all
models to determine at what concentration one compound become significantly
different from another.
RESULTS AND DISCUSSION
Foam Stability. The NIBEM-TPH method was highly reproducible and
reliable. The average % cv of the five foam repetitive measurements was significantly
low (2.3%) across all compound-concentration combinations.

34
The relationships between Nibem-30 values and five different concentrations
of Iso, Rho, Tetra, and Hexa were estimated using linear regression methods with the
control foam results (Figure 1). Inclusion of the control foam data improved the
degree of linear fit (increased R2) in all cases. Tetra had the strongest effect on foam
stability among the four compounds. By adding 5 ppm of Tetra to unhopped beer, its
stability, in terms of Nibem-value, was increased approximately two fold compared to
the unhopped beer. Hexa had the second strongest effect among the four. These
results confirmed the strong foam stabilizing ability of Tetra and Hexa that are noted
in the literature (7, 11). Both Iso and Rho had a relatively smaller effect on foam
stability compared to Tetra and Hexa; however, the positive influence on foam
stability of these two compounds is recognized. Similar relationships between Nibem-
10 and concentration, and Nibem-20 and concentration were also clearly observed
(figures not included).
Linear regression models were created for all four compounds with six data
points each including the control. The relationship of NIBEM30 to the compound
concentration was highly linear for all cases with R2 values of 0.935, 0.890, 0.939,
and 0.964 for Iso, Rho, Hexa, and Tetra, respectively. Confidence interval bands
(95% CI) were created to determine at what dosage level these compounds became
significantly different from each other. The concentration at which an upper
confidence interval of one compound crossed the lower confidence interval of another
compound was considered as the point where the two compounds became
significantly different. In this specific study, at the concentration of 2.4 ppm the foam
35
stabilizing effects of Tetra becomes significantly higher than that of Iso (Figure 2),
for Hexa this differentiating concentration was 4.2 ppm (Figure 3). The difference of
foam stabilizing capability between Iso and Rho was not statistically significant. The
difference between Tetra and Hexa was significant between concentrations of 5.5 and
9.6 ppm. The statistical significance above 9.6 ppm for the relationship of these two
compounds cannot be accurately determined due to the nature of 95% confidence
interval. To confirm if there is any difference between Tetra and Hexa over a broad
range of concentrations, more data points are required.
Hydrophobicity of iso--acids is one of the critical characteristics of foam
stabilization (4, 6, 12). The higher the hydrophobicity of the compound, the stronger
the foam stabilizing effects (6, 12). From this perspective, it is quite reasonable that
Tetra and Hexa had much stronger foam stabilizing abilities compared to the other
two hop acids given that the reduction of the carbon-carbon double bonds with
hydrogen in iso--acids will significantly enhance the hydrophobicity of the
compound (4, 6). Analysis of the HPLC retention time data from the iso--acid and
reduced iso--acid standards revealed the relative hydrophobicities being ordered as
Tetra, Hexa, Iso, and Rho from the most to least hydrophobic. These hydrophobicity
data positively correlate with the obtained Nibem data.
Cling area. The cling area percentages measured by Nibem-CLM did not
show the same linear relationship with concentrations as did the Nibem-30 data
(Figure 4). Both Iso and Rho had very minimal effects on cling formation at the

36
lowest concentration, but the cling area dramatically increased from approximately 2
to 5 ppm. They reached the peak of cling formation at approximately 10 ppm, and
less cling area was observed at around 12 ppm. The other two, especially Tetra,
showed a great ability to produce cling beginning with the lowest concentration (2-3
ppm) and remained relatively unchanged across all higher concentrations. This
indicates that a very small amount of Tetra or Hexa (1-2 ppm) is sufficient to create
substantial amount of cling. The average %cv of cling area percentages was 6.7%
excluding an outlier (the outlier had the cling area percentage ranging from 0.0 to
0.6%). Two possible reasons for this relatively higher %cv compared to the Nibem-30
values are the extreme difficulty to prepare the standard glass for the exactly same
condition for each measurement and the technological limitation of Nibem-CLM.
Digital photos of cling were taken immediately after Nibem-CLM analysis.
There were three major types of cling formation patterns; “ring,” “mesh,” and
“powder” (Figure 5). Figure 6 show the cling patterns of iso, rho, hexa, and tetra
over the range of concentration, respectively. Generally at the lower concentrations,
one or two rings of cling formation were observed. For the higher concentration of iso
and rho, and also the lower concentration of tetra and hexa, the mesh-like pattern was
observed. The size and fineness of this mesh-like pattern varied from a sample to
sample. In general, the mesh pattern was observed at the top part of the glass. At the
higher concentration of tetra and hexa, powdery, snow-like cling was observed. The
distribution of the cling for this pattern was not uniform, and also the size of bubbles
varied. The control showed no cling.
37
There are several things to be noted about the cling measurements. First of all,
the cling meter gave a message after the analysis of rho-a, tetra-e, and the control
stating “too few edge pixels. reverting to reset threshold.” This message will be
indicated whenever the cling meter finds no difference between the glass and cling,
that is, either the inside wall of glass is completely covered by foam, or there is no
cling on the wall. For rho-a and control, it was quite obvious that there was almost no
cling at all. However, tetra-e had the average cling percentage of 57.64% and the
inside wall of glass was not completely covered by foam. Therefore, it should be
realized that Nibem-CLM may present false results when the samples create too large
or small amounts of cling. Secondly, Nibem-CLM can give the overall cling area
percentage, but cannot indicate what cling pattern was obtained. For example, iso-d,
rho-d, tetra-a, and hexa-e were measured to have a relatively similar cling percentage
(approximately 75%) according to Nibem-CLM, though they clearly look different
from each other to the human eye (Figure 6). Lastly, the area that Nibem-CLM
measures is a band between 10 mm and 40 mm below the rim of standard glass. The
cling above and below the area is not measured by Nibem-CLM, and therefore, the
overall actual cling area percentage might be different from that of Nibem-CLM as
well as the consumers’ perception.
CONCLUSION
Using a Nibem Foam Stability Tester at room temperature of 20 +/-0.5oC,
positive linear relationships with high R2 were obtained between the concentration

38
and Nibem-30 for all of four compounds. All compounds conferred some degree of
foam stabilizing ability, with the strongest effects were observed for tetra and hexa.
To obtain the significant difference in foam stability compared to iso, at least 2.4 ppm
of tetra or 4.2 ppm of hexa was required in this specific study. There was no
significant difference between rho and iso in foam stabilizing ability.
Using the Nibem Cling Meter, the cling area in percentage was measured
using samples after the foam stability measurements. The control (unhopped beer)
and the lowest concentration of rho (approximately 2 ppm) showed no cling
formation ability. Tetra and hexa showed strong cling formation capability
indepenent of concentrations used. Iso and rho had minimal effects on cling
formation at the lower concentration (2-4 ppm), but a dramatic increase of cling area
was observed at the higher concentrations (approximately 5 ppm) for both. Each
compound produced very unique, characteristic cling patterns of its own depending
on the concentration. Further research should be conducted to determine the foam
stabilizing effect and cling capability of multiple iso--acids combinations and the
consumer appeal of cling patterns.
ABBREVIATION USED
iso, iso--acid; rho, rho-iso--acid; hexa, hexahydro-iso--acid; tetra, tetrahydro-iso-
-acid; %cv, coefficient of variation.

39
ACKNOWLEDGMENT
The authors thank John I. Haas for their generous contribution.
40
Reference:
(1) Bamforth, C. W., The Foaming Properties of Beer. J. Inst. Brew. 1985, 91,
(6), 370-383.
(2) Bamforth, C. W., The Relative Significance of Physics and Chemistry for
Beer Foam Excellence: Theory and Practice. J. Inst. Brew. 2004, 110, (4), 259-266.
(3) Dale, C. J., Walker, S. G., and Lyddiatt, A., Dynamic changes in the
composition and physical behaviour of dispensed beer foam. J. Inst. Brew. 1993, 99,
(6), 461-466.
(4) Hughes, P., Hydrophobic interactions and their significance for beer foam
quality. Monograph – European Brewing Convention 1998, 27, (E. B. C. –
Symposium Beer Foam Quality, 1988), 158-165.
(5) Todd, P. H., Held, R. W. and Guzinski, J. G., The Development and Use of
Modified Hop Extracts in the Art of Brewing. MBAA Technical Quarterly 1996, 33,
(2), 91-95.
(6) Hughes, P., The Significance of Iso--Acids for Beer Quality Cambridge
Prize Paper. J. Inst. Brew. 2000, 106, (5), 271-276.
(7) Baker, C. W., Impact of Post-Filtration Addition of Selected Hop Extracts on
Beer Foam and Clarity. MBAA Technical Quarterly 1990, 27, (2), 33-38.
(8) Bamforth, C. W. a. J., G. In Aspects of foam lacing, European Brewery
Convention, Proceedings of the 19th Congress, London, 1983; London, 1983; pp 331-
338.

41
(9) American Society of Brewing Chemists, Beer 23-C. Iso-alpha-acids by solid
phase extraction and HPLC. In Methods of Analysis, 9th ed, St. Paul, MN, 2004.
(10) European Brewery Convention, Method 9.42. Foam Stability of Beer using
the NIBEM-T Meter. In Analytica-EBC, Zoeterwoude, the Netherlands, 2006.
(11) Weiss, A., Schönberger, Ch., Mitter, W., Biendl, M., Back, W., and
Krottenthaler, M., Sensory and Analytical Characterisation of Reduced, Isomerised
Hop Extracts and Their Influence and Use in Beer. J. Inst. Brew. 2002, 108, (2), 236-
242.
(12) Moir, M. a. S., R. J., Foam-enhancing and bitter, reduced iso--acids derived
from hops. Proceedings of the Congress – European Brewing Convention. 25th 1995,
125-134.

42
Figures
Figure 1. Correlation between iso--acid concentrations and Nibem-30 (sec) for all
four compounds. Control base beer is included as 0 ppm of all linear models. Each
point is the average of five measurements. Variation in all observations was less than
5.6%cv with an average of 2.3%cv.
Figure 2. Confidence intervals (95%) of iso and tetra. The big circle indicates the
point where the lower bound of tetra and upper bound of iso 95% confidence interval
cross each other, i.e. where tetra becomes significantly different from iso at a given
concentration in terms of Nibem-30 values.
Figure 3. Confidence intervals (95%) of iso and hexa. The big circle indicates the
point where the lower bound of hexa and upper bound of iso 95% confidence interval
cross each other, i.e. where hexa becomes significantly different from iso at a given
concentration in terms of Nibem-30 values.
Figure 4. Effect of four different iso--acids on the cling area measured by Nibem-
CLM. Each point is the average of five measurements
Figure 5. Three major types of cling that can be created by hop acids in lager beer
Figure 6. Cling patterns of all compound-concentration combinations and cling area
% (in parentheses)

43
Figure 1.
0
50
100
150
200
250
300
350
0 2 4 6 8 10 12 14Concentration (ppm)
NIB
EM-3
0 (s
ec)
Rho
Iso
Hexa
Tetra

44
Figure 2.
0
50
100
150
200
250
300
350
400
450
0 2 4 6 8 10 12 14Concentration (ppm)
NIBE
M-3
0 (s
ec)
Tetra
Iso

45
Figure 3.
0
50
100
150
200
250
300
350
0 2 4 6 8 10 12 14Concentration (ppm)
Nibe
m-3
0 (s
ec)
Iso
Hexa

46
Figure 4.
0
10
20
30
40
50
60
70
80
90
0 2 4 6 8 10 12 14Concentration (ppm)
Clin
g (%
)
Iso
Hexa
Rho
Tetra

47
Figure 5.

48
Figure 6.

49
Tables
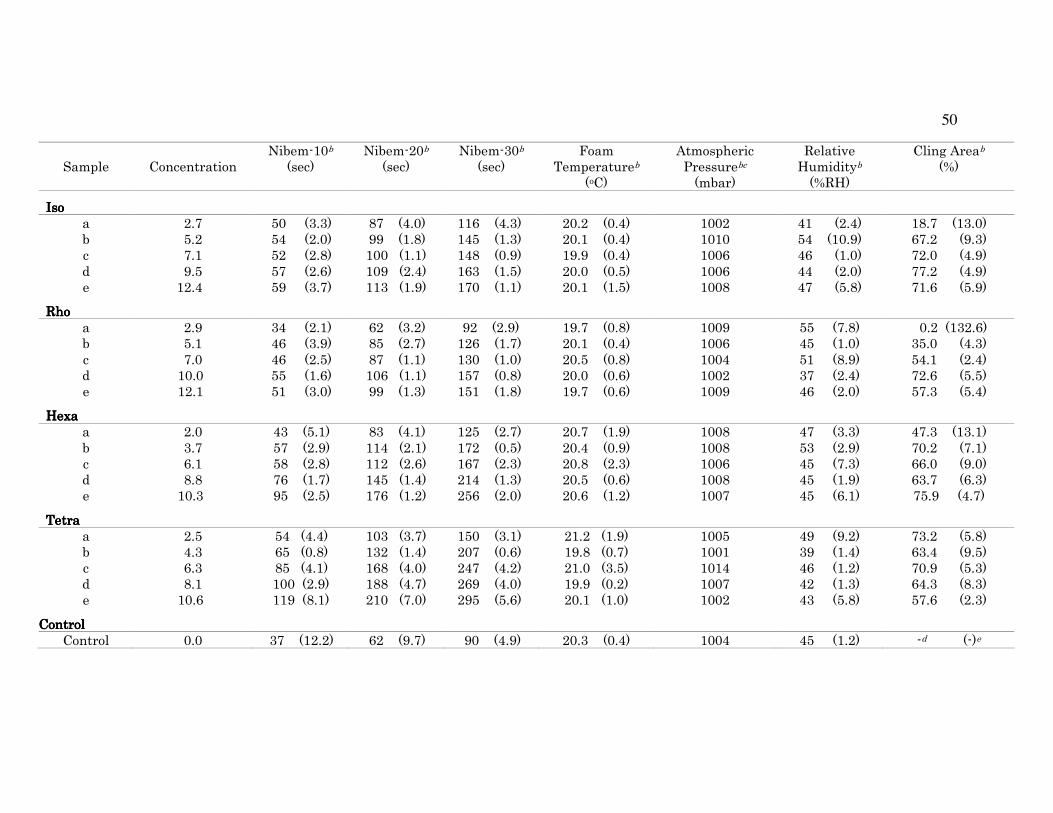
Table 1. Nibem-10, 20, and 30 values, cling areas in percentage, and the
environmental conditions during the measurements
50
#$%&' ()*+&*,-,.)*'/.0ӎ'
45&+6'/.0ۂ'
45&+6'/.0ܦ'
45&+6'9)#'
:&#$&-,;-&0'4)(6'
<,#)5$=&-.+'>-&55;-&0+'4#0-6'
?&%,. &'!;#.".,#0'4$?!6'
(%.*%'<-&0'4$6'
''''
&5)&5)&5)&5)'' 7'(' )3'''''48'86' *(''''4+'36' 22,''''4+'86' 73'7''''43'+6' 2337'''''' +2''''''47'+6' 2*'(''''428'36'0' )'7' )+'''''47'36' --''''42'*6' 2+)''''42'86' 73'2''''43'+6' 2323'''''' )+''''423'-6' ,('7''''''4-'86'+' ('2' )7'''''47'*6' '''233'''42'26' 2+*''''43'-6' 2-'-''''43'+6' 233,'''''' +,''''''42'36' (7'3''''''4+'-6'"' -')' )('''''47',6' '''23-'''47'+6' 2,8''''42')6' 73'3''''43')6' 233,'''''' ++''''''47'36' (('7''''''4+'-6'&' 27'+' )-'''''48'(6' '''228'''42'-6' 2(3''''42'26' 73'2''''42')6' 233*'''''' +(''''''4)'*6' (2',''''''4)'-6'
''''
?=)?=)?=)?=)''''' 7'-' 8+'''''47'26' ,7''''48'76' -7''''47'-6' 2-'(''''43'*6' 233-'''''' ))'''''4('*6' 3'7''4287',6'0' )'2' +,'''''48'-6' *)''''47'(6' 27,''''42'(6' 73'2''''43'+6' 233,'''''' +)'''''42'36' 8)'3''''''4+'86'+' ('3' +,'''''47')6' *(''''42'26' 283''''42'36' 73')''''43'*6' 233+'''''' )2'''''4*'-6' )+'2''''''47'+6'"' 23'3' ))'''''42',6' '''23,'''42'26' 2)(''''43'*6' 73'3''''43',6' 2337'''''' 8('''''47'+6' (7',''''''4)')6'&' 27'2' )2'''''48'36' --''''42'86' 2)2''''42'*6' 2-'(''''43',6' 233-'''''' +,'''''47'36' )('8''''''4)'+6'
''''
!&.!&.!&.!&.''''' 7'3' +8''''4)'26' *8''''4+'26' 27)''''47'(6' 73'(''''42'-6' 233*'''''' +('''''48'86' +('8''''428'26'0' 8'(' )(''''47'-6' '''22+'''47'26' 2(7''''43')6' 73'+''''43'-6' 233*'''''' )8'''''47'-6' (3'7''''''4('26'+' ,'2' )*''''47'*6' '''227'''47',6' 2,(''''47'86' 73'*''''47'86' 233,'''' +)'''''4('86' ,,'3''''''4-'36'"' *'*' (,''''42'(6' '''2+)'''42'+6' 72+''''42'86' 73')''''43',6' 233*''''' +)'''''42'-6' ,8'(''''''4,'86'&' 23'8' -)''''47')6' '''2(,'''42'76' 7),''''47'36' 73',''''42'76' 233('''''' +)'''''4,'26' ()'-'''''4+'(6'
''''
:&,-:&,-:&,-:&,-''''' 7')' )+'''4+'+6' '''238'''48'(6' 2)3''''48'26' 72'7'''42'-6' 233)'''' +-'''''4-'76' (8'7''''''4)'*6'0' +'8' ,)'''43'*6' '''287'''42'+6' 73(''''43',6' 2-'*'''43'(6' 2332'''''' 8-'''''42'+6' ,8'+''''''4-')6'+' ,'8' *)'''4+'26' '''2,*'''4+'36' 7+(''''4+'76' 72'3'''48')6' 232+'''' +,'''''42'76' (3'-''''''4)'86'"' *'2' '''233''47'-6' '''2**'''4+'(6' 7,-''''4+'36' 2-'-'''43'76' 233('''''' +7'''''42'86' ,+'8''''''4*'86'&' 23',' '''22-''4*'26' '''723'''4('36' 7-)''''4)',6' 73'2'''42'36' 2337'''' +8'''''4)'*6' )(',''''''47'86'
''''
()*,-)%()*,-)%()*,-)%()*,-)%''''()*,-)%' 3'3' 8(''''427'76' ,7''''4-'(6' -3''''4+'-6' 73'8''''43'+6' 233+'''''' +)'''''42'76' 1"''''''''''416&'
51
a All numbers are averaged values of five measurements. b The percentages in parentheses are coefficient of variation (%cv) of five
measurements. c Atmospheric pressure differences for consecutive measurements were negligible (maximum %cv = 0.1%). d No cling
was observed for control beer. e When %cv is less than 0.1%, it is indicated as (-)

52

53
Binary Foam Stabilizer System in Lager Beer
Takeshi Kunimune; Thomas H. Shellhammer*
Department of Food Science and Technology, Oregon State University
100 Wiegand Hall Corvallis, OR 97330
[email protected]; [email protected]
* Author to whom correspondence should be addressed [telephone (541) 737-9308;
fax (541) 737-1877; e-mail [email protected]].

54
ABSTRACT:
Foam stabilizing properties and cling formation patterns of lager beer to which iso-
alpha-acid (IAA), tetrahydro-iso-alpha-acid (THIAA), hexahydro-iso-alpha-acid
(HHIAA), and propylene glycol alginate (PGA) were added were investigated. Four
series of base beers were prepared to achieve approximately 0, 4, 8, and 12 ppm of
IAA to an unhopped lager beer. On top of each of these, THIAA, HHIAA, and PGA
were added over a realistic concentration range to create the samples with two
different foam stabilizers. Foam stability results, NIBEM30 and Foam Stability
Figure (FSF), for each sample was measured using a Nibem Foam Stability Tester
(NIBEM-T) and a Steinfurth Foam Stability Tester (Steinfurth-FST), respectively.
Percentage of beer foam clings to the glass side walls after Nibem-T analysis was
measured using Nibem Cling Meter (NIBEM-CLM). Multiple linear regression
models were created for both NIBEM30 and FSF, and the relative foam enhancing
strengths of four compounds were compared. Between the two methods employed,
the magnitude of foam stabilizing power of each compound was different, especially
in the case of PGA. This is presumably due to the difference in the parameters
measured, i.e. foam collapse by Nibem and liquid drainage by Steinfurth. When
Steinfurth-FST was used, PGA showed much better foam stabilizing ability compared
to that of NIBEM. In the investigated range, the foam stabilizing effects of these
compounds were found to be additive for both NIBEM and Steinfurth, though FSF
results showed somewhat hyperbolic tendency.

55
KEYWORDS:
hop acid; iso--acid; IAA; tetrahydro-iso--acid; THIAA; hexahydro-iso--acid;
HHIAA; rho-iso--acid; propylene glycol alginate; PGA; beer; lager beer; foam;
cling; foam stability; NIBEM; Steinfurth; foam collapse; liquid drainage

56
INTRODUCTION
The use of iso-alpha-acid extracts is becoming a more familiar part of the
brewing process to brewers throughout the world. The iso-alpha-acid extracts provide
the higher utilization rate compared to the traditional thermal isomerization of alpha-
acids, are in easy form to measure and work with, and come in a variety of chemical
alternatives. Tetrahydro-iso-alpha-acid (THIAA) and hexahydro-iso-alpha-acid
(HHIAA) are chemical derivatives of iso-alpha-acid that went through hydrogenation
and both reduction and hydrogenation, respectively (1). These alternative hop acids
were originally developed to prevent iso-alpha-acids from photodegradation. When
iso-alpha-acid is exposed to UV light with the presence of a sulfur source, it generates
prenyl mercaptan, which possesses the off-aroma often described as “light-struck” or
“skunky” (2). Many use these light-insensitive bitter acids in their beers often times
when the end products will be in clear or green bottles. The other brewers use these
compounds for a different reason: Foam. Even though THIAA and HHIAA were
originally developed for the purpose previously stated, they were shown to provide
much greater foam stability compared to the original IAA. This improvement on
foam stability for these compounds is most likely due to the increase in
hydrophobicity (3). Even though the detailed mechanism of how these compounds
interact with the other foam-positive compounds such as barley-based polypeptides is
not fully understood, it was previously shown in multiple studies that the
hydrophobicity of these hop compounds seems to play the key role (3, 4).

57
Another common foam stabilizer brewers use is propylene glycol alginate
(PGA). PGA is originally derived from brown seaweed, and when used at the
appropriate level it effectively stabilizes the beer foam by thickening the electric
double layer of bubble lamellae (3). Some believe that PGA can provide more
attractive foam due to the even distribution of smaller bubbles and fine creaminess (5)
(6). It is commonly accepted in the brewing industry as a tool to resist the lipid
damage in beer.
Many brewers use these foam stabilizers in addition to the IAA utilized
through traditional thermal process though there is not enough literature that
investigates the effects of when IAA was mixed with other foam stabilizers such as
reduced iso-alpha-acids and PGA. This research was carried out to observe how the
beer foam stability is influenced when a foam stabilizer is added to the beer that
already contains certain levels of IAA. NIBEM Foam Stability Tester (NIBEM-T)
and Steinfurth Foam Stability Tester (Steinfurth-FST) were used to measure the foam
stability to investigate the dosing effects of IAA, THIAA, HHIAA, and PGA. When
the alternative hop acids are used, not only the head retention, but also the cling
quality as well as quantity may be highly altered. While The importance of cling has
been previously discussed by Curtis (7), very little research has been carried out
despite its need. It was previously shown by Kunimune and Shellhammer (8) that
using different hop bitter acids at the same concentration one will produce
significantly different amounts and patterns of cling. Cling area was measured using

58
NIBEM Cling Meter (NIBEM-CLM), and digital photographs were taken to record
the cling patterns generated.
MATERIALS AND METHODS
Preparation of Beer. Two batches of identical unhopped lager beer were
brewed and blended to obtain a homogenous base beer at the Oregon State University
pilot brewery. It was formulated using pale 2-row malted barley (Great Western
Malting Co.), 95% dextrose corn syrup (Clearsweet® 95% Refined Liquid Dextrose
Corn Syrup, Cargill), and lager yeast (Wyeast strain 2007). The 2-row pale malted
barley and dextrose contributed 60% and 40% fermentable sugar, respectively. The
original gravity and final gravity were 11.49oP and 0.77oP, respectively. The beer was
fermented at 14.5oC for two weeks. After two weeks, the temperature was dropped to
1.7oC and 35g/hl PVPP (Polyclar® VT, International Specialty Products) was added
to the green beer. The beer was pumped into a clean CO2 charged conical fermenter
and held for another week at 1.7oC before filtration. The beer was filtered through a
2.0m nominal filter pad (HS1000, Pall Corp.).
Four base beers were created by dosing iso-alpha-acid (iso) (Isohop®, John I.
Haas, Inc.) at the different levels to achieve the gradual range of concentrations from
0 to approximately 12 ppm. All four base beers were then re-filtered using a 0.45µm,
nylon membrane filter (ULTIPOR® N66 Membrane Filter by Pall) to remove any
insoluble hop acids. The concentrations of filtered samples were analyzed by ASBC

59
method Beer-23C (9) using a Discovery C18 HPLC column while a DCHA-Iso was
used as HPLC standard. To these Iso base beers, tetrahydroiso-alpha-acid (Tetra)
(Tetrahop Gold®, John I. Haas, Inc.), hexahydroiso-alpha-acid (Hexa) (experimental
sample (9.67% w/w) from John I. Haas, Inc.), and propylene glycol alginate (PGA)
(Profoam®, FMC BioPolymer) were added to achieve approximately 4, 4, and 80
ppm stock solutions. After these secondary additions, the beer was again filtered
through the 45µm, nylon membrane to remove any insoluble materials. The same
ASBC method and HPLC conditions were employed to determine the concentrations
of Tetra and Hexa. Tetra ICS-T1, and DCHA-Hexa ICS-H1 were used as HPLC
standards for Tetra and Hexa, respectively. PGA concentration was solely determined
by the dosing level. After the desired concentrations were confirmed in the filtered
beer, it was diluted using the appropriate base beer to achieve approximately 1, 2, 3,
and 4 ppm for Tetra and Hexa, and 20, 40, 60, and 80 ppm for PGA. Each sample
was named as “I [primary iso concentration] – [head letter of secondary compound]
[secondary compound concentration].” For example, the beer that contained 0 ppm of
iso and approximately 2 ppm of Hexa was labeled as “I0-H2,” and that with 8 ppm of
Iso and approximately 60 ppm of PGA was labeled as “I8-P60.” The concentrations
of diluted samples were again validated via HPLC using ASBC method Beer-23C.
After blends and dilutions were completed, all samples were carbonated to 12psi at
1oC for at least two days. Prior to foam testing samples were removed from the cold
room, and were left at room temperature over night (20.0oC +/- 0.5oC) to equilibrate
in temperature before foam testing.

60
NIBEM-T and NIBEM-CLM. A Haffmans Standard Glass (inside diameter
60 mm, inside height 120 mm) was used for all NIBEM measurements. Since both
head retention and cling can be greatly influenced by the state of glass, the glass was
carefully washed with hot water and sodium tetraborate decahydrate (Borax), and
rinsed well with deionized water before every measurement to obtain perfectly clean
glassware. Immediately prior to NIBEM measurements, it was rinsed again
thoroughly with first deionized water, and then with the foam of sample beer. Each
time, the excess water and beer was drained by inverting the glass for 60 seconds.
The modified EBC 9.42 method (10) using the NIBEM-T instrument was
applied to measure the foam stabilities. Reproducible foam was prepared using an
Inpack 2000 Haffmans Flasher Head, which was directly connected to a 3 or 5 gallon
(11.36L or 18.93L) keg. A CO2 pressure of 34psi was applied to the keg to push the
sample beer through the Flasher Head and dispense foam into a Haffmans standard
glass up to the rim of glass. Quickly after dispensing the foam, the glass was placed in
a Haffmans Foam Stability Tester (Nibem-T) that had been calibrated using a
standard glass filled with tap water prior to the analysis.
Nibem-30 data were collected and analyzed keeping the analysis environment
as close as possible to the standard ambient condition of 20oC room temperature.
Nibem values and cling area percentages were collected under the average conditions
of 20.1oC foam temperature (1.46% cv).
The foam was allowed to decay to 10mm below the top edge of the standard
glass before the Nibem measurement commenced, and the time required to reach 10,

61
20 and 30mm from this distance was recorded as Nibem-10, Nibem-20, and Nibem-
30, respectively. As Nibem-T started, the duration of the foam stability analysis was
measured separately by a stopwatch to calculate the wait time for a Haffmans Cling
Meter (Nibem-CLM). The equation below was developed by interpolating Haffmans’
suggested time to find the best wait time (twait) in second for each sample.
60)30(*5.1 += Nibemtwait (1)
After Nibem-T analysis was performed and the appropriate wait time had
elapsed, the sample was moved to Nibem-CLM to perform an analysis on the cling
percentage on the inside of standard glass sidewall. The glass inner sidewall scanned
by Nibem-CLM is corresponded to the distance of Nibem-T, i.e. Nibem-CLM scans
the 30 mm band area; from 10 mm to 40 mm below the rim of the rim of standard
glass. Nibem-CLM was calibrated using a 77.8% reflectivity calibration column
provided by Haffmans. The Nibem-CLM wait time was set as 0 seconds in its
configuration so that when the calculated wait time approached the analysis could be
started instantly. Digital photographs of cling were taken soon after the cling area
measurement finished. A sheet of black paper was inserted half way into the glass so
that the cling of only one side of glass was visible. For each compound and
concentration combination, three separate foam measurements were replicated. The
order of analysis was randomly assigned.
Steinfurth-FST. A sample keg was directly connected to the Steinfurth-FST
at 60psi. The standard multiple measurements were performed for all samples. The

62
standard automatic sampling and cleaning procedures were employed throughout the
entire experiment following Steinfurth’s protocol. Foam was created using 164mL of
liquid beer, and the unit measured the required time for the liquid-foam interface to
travel from half drained to three-quarters drained, i.e. it measure the time required for
liquid to drain from foam between the bulk liquid of 84mL to 123mL. This drainage
time was considered the foam drainage half life and was used to calculate the Foam
Stability Figure (FSF) as 120% of the foam drainage half life. This value, the FSF,
correlates to the sigma value of Ross and Clark. At the end of each measurement day,
the tall foam measuring column was filled with tap water to keep the inner wall
consistently wet.
All measurements were performed in triplicate.
RESULTS AND DISCUSSION
The results of Nibem30, Steinfurth FSF, cling area in percentage, and the
average foam temperature during both NIBEM and Steinfurth experiments for I0, I4,
I8, and I12 are summarized in Table 1, 2, 3, and 4, respectively. Both foam stability
instruments yield highly reproduceable data with the coefficient of variation within
triplicate measurements never exceeding 3.4%. The foam cling instrument had a
greater degree of variability, but nonetheless did not CV’s in excess of 12.2%.
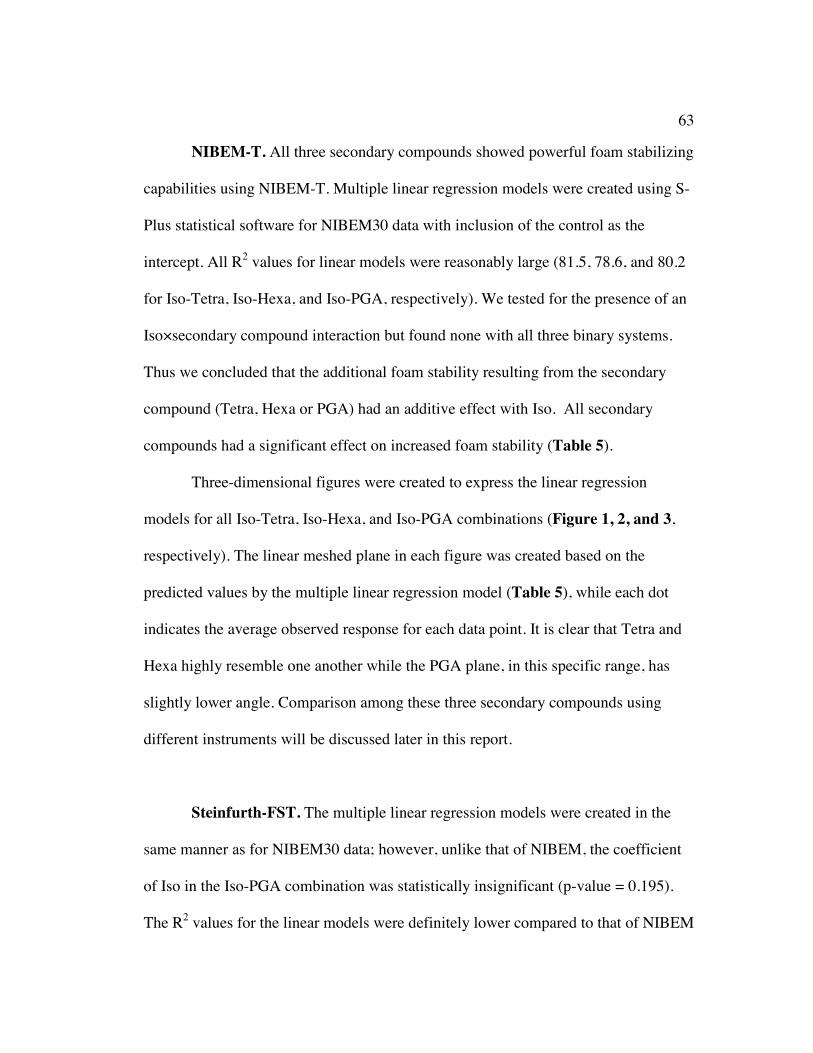
63
NIBEM-T. All three secondary compounds showed powerful foam stabilizing
capabilities using NIBEM-T. Multiple linear regression models were created using S-
Plus statistical software for NIBEM30 data with inclusion of the control as the
intercept. All R2 values for linear models were reasonably large (81.5, 78.6, and 80.2
for Iso-Tetra, Iso-Hexa, and Iso-PGA, respectively). We tested for the presence of an
Iso×secondary compound interaction but found none with all three binary systems.
Thus we concluded that the additional foam stability resulting from the secondary
compound (Tetra, Hexa or PGA) had an additive effect with Iso. All secondary
compounds had a significant effect on increased foam stability (Table 5).
Three-dimensional figures were created to express the linear regression
models for all Iso-Tetra, Iso-Hexa, and Iso-PGA combinations (Figure 1, 2, and 3,
respectively). The linear meshed plane in each figure was created based on the
predicted values by the multiple linear regression model (Table 5), while each dot
indicates the average observed response for each data point. It is clear that Tetra and
Hexa highly resemble one another while the PGA plane, in this specific range, has
slightly lower angle. Comparison among these three secondary compounds using
different instruments will be discussed later in this report.
Steinfurth-FST. The multiple linear regression models were created in the
same manner as for NIBEM30 data; however, unlike that of NIBEM, the coefficient
of Iso in the Iso-PGA combination was statistically insignificant (p-value = 0.195).
The R2 values for the linear models were definitely lower compared to that of NIBEM
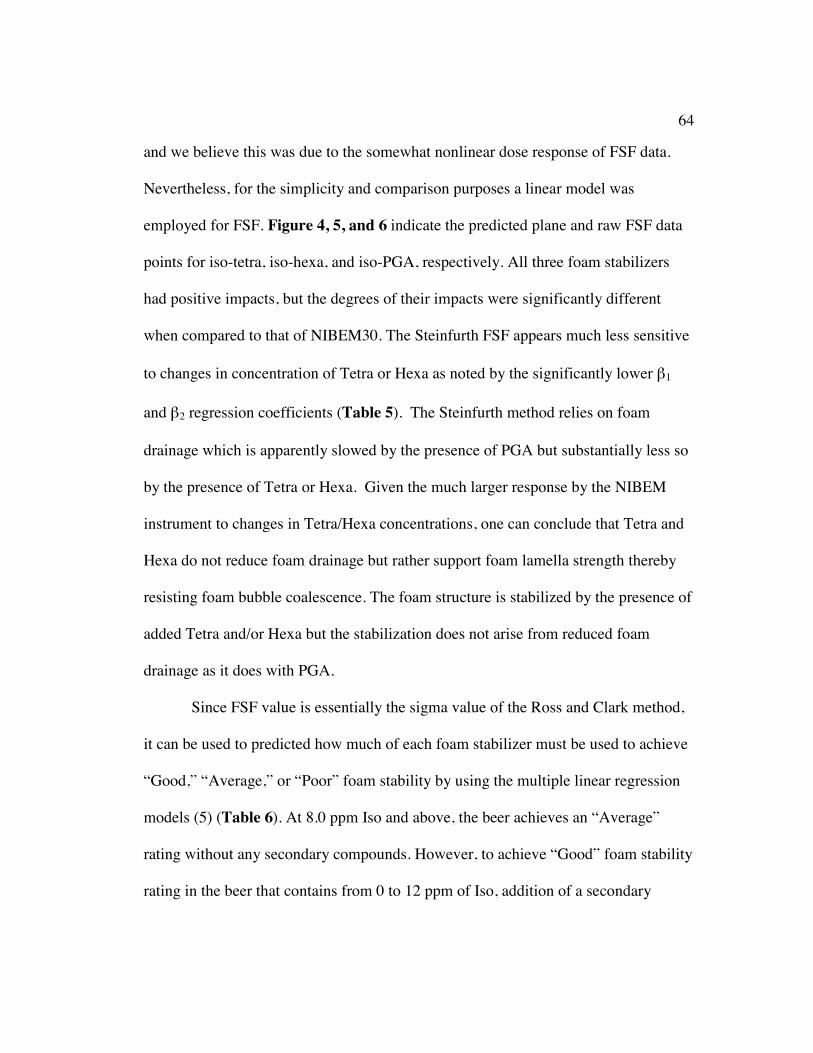
64
and we believe this was due to the somewhat nonlinear dose response of FSF data.
Nevertheless, for the simplicity and comparison purposes a linear model was
employed for FSF. Figure 4, 5, and 6 indicate the predicted plane and raw FSF data
points for iso-tetra, iso-hexa, and iso-PGA, respectively. All three foam stabilizers
had positive impacts, but the degrees of their impacts were significantly different
when compared to that of NIBEM30. The Steinfurth FSF appears much less sensitive
to changes in concentration of Tetra or Hexa as noted by the significantly lower β1
and β2 regression coefficients (Table 5). The Steinfurth method relies on foam
drainage which is apparently slowed by the presence of PGA but substantially less so
by the presence of Tetra or Hexa. Given the much larger response by the NIBEM
instrument to changes in Tetra/Hexa concentrations, one can conclude that Tetra and
Hexa do not reduce foam drainage but rather support foam lamella strength thereby
resisting foam bubble coalescence. The foam structure is stabilized by the presence of
added Tetra and/or Hexa but the stabilization does not arise from reduced foam
drainage as it does with PGA.
Since FSF value is essentially the sigma value of the Ross and Clark method,
it can be used to predicted how much of each foam stabilizer must be used to achieve
“Good,” “Average,” or “Poor” foam stability by using the multiple linear regression
models (5) (Table 6). At 8.0 ppm Iso and above, the beer achieves an “Average”
rating without any secondary compounds. However, to achieve “Good” foam stability
rating in the beer that contains from 0 to 12 ppm of Iso, addition of a secondary

65
compound was needed as follows: 4.3~8.3 ppm Tetra, 3.6~7.6 ppm Hexa, and 39~58
ppm PGA, respectively.
Method Comparison. Using the linear regression coefficients (β2), the ratios
of foam stabilizing powers for all compounds were obtained for both NIBEM and
Steinfurth methods (Table 7a and 7b, respectively). The foam stabilizing powers of
Tetra and Hexa were found to be extremely similar and both were significantly more
powerful than PGA. The following relationships were derived concentration
equivalencies necessary to achieve the same additional foam stabilizing effect when
substituting Tetra or Hexa for PGA
For NIBEM 30 foam stability measurements
1 ppm Tetra = 28.1 ppm PGA (2)
1 ppm Hexa = 27.1 ppm PGA (3)
For Steinfurth FSF foam stability measurements
1 ppm Tetra = 4.8 ppm PGA (4)
1 ppm Hexa = 4.8 ppm PGA (5)
Equations 2 and 4, and 3 and 5 differ from one another because of the nature
of foam stability that is being measured by each device. Herein lies the difficulty in
measuring and reporting foam stability results. The NIBEM30 is the required time in

66
seconds for the total height to decrease 30mm and is thus a measurement of foam
collapse while FSF is the half-life of foam based on liquid drainage.
The stability powers of PGA are much smaller in number relative to that of
iso-alpha-acid based foam stabilizers on an equivalent concentration basis. However,
it is important to remember that these stability powers are based on the actual
concentration, and the recommended dosage level of PGA is approximately 40-60
ppm while that of Tetra and Hexa are an order of magnitude smaller. When Steinfurth
unit was used to determine the foam stability, the foam stabilizing powers of both
Tetra and Hexa relative to that of Iso were determined to be approximately 17%
larger than that of NIBEM. In the case of PGA, the increase was determined as
approximately 570%. As mentioned earlier, Steinfurth unit is based on the concept of
the liquid drainage. PGA presumably, by increasing the bubble lamellae viscosity,
prevents the liquid from draining quickly, and hence generates much higher FSF
compared to the others.
Cling. The addition of very small amounts (~1 ppm) of Tetra or Hexa to the
unhopped beer resulted in dramatic increases in cling percentage as determined via
NIBEM-CLM (Figures 7 and 8). However, the same effect was not observed when
using PGA (Figure 9). While PGA produced cling and displayed a dose dependent
behavior on the cling area when used in the unhopped beer, the effect was minimal.
When used in the beer with the presence of Iso, no significant difference was
observed in both quantity and quality. Tetra and Hexa showed significant effects on

67
cling formation, especially in terms of its quality. While most conventional methods,
including NIBEM-CLM, only measure the quantity of cling, typically either its area
or volume, it is important to remember the quality such as the lacing pattern is critical
for the cling assessment (12). Cling patterns of different compounds and
combinations vary great deal, and brewers need to determine which patterns are most
desirable for the target consumers, especially in draught beers (7). As noted
previously, NIBEM-CLM measures the 30mm band (10-40mm from the rim of
glass), and therefore the visual assessment might not necessarily match the cling
coverage area measured by NIBEM-CLM. Also, due to the nature of NIBEM method,
the secondary cling factor, foam adherence through the removal of bulk liquid during
consumption, was not taken into consideration. The higher %cv was most likely due
to the difficulty of conditioning the standard glassware exactly same for each
measurement. The concentration dependent cling patterns of Tetra, Hexa, and PGA
are shown in Figure 10, 11, and 12, respectively. Figure 13, 14, 15, and 16 compare
the cling effects of all secondary compounds in the base beers of I0, I4, I8, and I12
series, respectively.
CONCLUSION
Using a NIBEM Foam Stability Tester (NIBEM-T) and Steinfurth Foam
Stability Tester (Steinfurth-FST) at the room temperature of approximately 20oC, the
relationships between Iso and Tetra, Iso and Hexa, and Iso and PGA were
68
investigated for their foam stability. Based on NIBEM30 results, it was concluded
that all foam stabilizers (Tetra, Hexa and PGA) have statistically significant effects
on improving foam stability in beers that have already been dosed with Iso. All
dosage responses were found to be additive (as opposed to synergistic or
antagonistic). Similarly, the Steinfurth Foam Stability Figure (FSF) results indicated
that all three compounds had foam-positive impacts; however, it was shown that Iso
has no significant effect when used with PGA. The Steinfurth data displayed a
somewhat hyperbolic relationship between FSF and the concentrations of foam
stabilizer. Using NIBEM 30 values for assessing foam stability, the substitution of 1
ppm of Tetra or Hexa yielded the same improvement of foam stability as adding 28
ppm. Using Steinfurth FSF values this substitution equality changes to 1 ppm of
Tetra or Hexa in place of 4.8 ppm of PGA. NIBEM-CLM revealed the fact that PGA
has a minimal effect on cling formation, both quantitatively and qualitatively while
concentrations a low as 1 ppm of Tetra and Hexa showed significant improvement to
foam cling adherence.
69
ABBREVIATION USED
iso, iso--acid; hexa, hexahydro-iso--acid; tetra, tetrahydro-iso--acid; PGA,
propylene glycol alginate; NIBEM-T, NIBEM foam stability tester; FSF, foam
stability figure; %cv, coefficient of variation.
ACKNOWLEDGMENT
The authors thank John I. Haas for the generous contribution.

70
Reference:
(1) Guzinski, J. A. In Practical consideration of reduced hop extracts, European
Brewing Convention. Symposium on Hops., 1994; 1994; pp 105-113.
(2) Todd, P. H., Johnson, P. A., and Worden, L. R., Evaluation of the relative
bitterness and light stability of reduced iso-alpha-acids. Tech. Q. Master Brew. Assoc.
Am. 1972, 9, (1), 31-35.
(3) Hughes, P., The Significance of Iso--Acids for Beer Quality Cambridge
Prize Paper. J. Inst. Brew. 2000, 106, (5), 271-276.
(4) Asano, K. a. H., N, Contribution of hop bitter substances to head formation of
beer. Report of the Research Laboratories of Kirin Brewer Co., Ltd. 1976, 19, 9-16.
(5) Bamforth, C. W., The Foaming Properties of Beer. J. Inst. Brew. 1985, 91,
(6), 370-383.
(6) Bennett, A. N. In Propylene glycol alginate for the brewing industry, Inst.
Brew. Proc., Cent. SA. Sect., 1993; Cent. SA. Sect., 1993; pp 185-193.
(7) Curtis, N. S., The impact of science on quality. J. Inst. Brew. 1975, 81, 391-
398.
(8) Kunimune, T. a. S., T. H., P-55: Foam Stabilizing Effects and Cling
Formation Patterns of Iso-alpha-acid and Reduced Iso-alpha-acids in Lager Beer. In
2006 ASBC Annual Meeting, La Quinta, CA, 2006.
(9) American Society of Brewing Chemists, Beer 23-C. Iso-alpha-acids by solid
phase extraction and HPLC. In Methods of Analysis, 9th ed, St. Paul, MN, 2004.

71
(10) European Brewery Convention, Method 9.42. Foam Stability of Beer using
the NIBEM-T Meter. In Analytica-EBC, Zoeterwoude, the Netherlands, 2006.
(11) Baker, C. W., Impact of Post-Filtration Addition of Selected Hop Extracts on
Beer Foam and Clarity. MBAA Technical Quarterly 1990, 27, (2), 33-38.
(12) Bamforth, C. W. In Beer Foam Quality. Bringing matters to a head: The status
of research on beer foam, Eur. Brew. Conv. Monogr. , Fachverlag Hans Carl,
Nürnberg, Germany, 1999; Fachverlag Hans Carl, Nürnberg, Germany, 1999; pp 10-
23.
72
Figures
Figure 1. Predicted (mesh plane) and observed data (•, n=3) for the foam stability
(NIBEM 30) of binary mixtures of Iso and Tetra. Foam stability was assessed using
the NIBEM-T.
Figure 2. Predicted (mesh plane) and observed data (•, n=3) for the foam stability
(NIBEM 30) of binary mixtures of Iso and Hexa. Foam stability was assessed using
the NIBEM-T.
Figure 3. Predicted (mesh plane) and observed data (•, n=3) for the foam stability
(NIBEM 30) of binary mixtures of Iso and PGA. Foam stability was assessed using
the NIBEM-T.
Figure 4. Predicted (mesh plane) and observed data (•, n=3) for the foam stability
(FSF) of binary mixtures of Iso and Tetra. Foam stability was assessed using the
Steinfurth Foam Stability Tester.
Figure 5. Predicted (mesh plane) and observed data (•, n=3) for the foam stability
(FSF) of binary mixtures of Iso and Hexa. Foam stability was assessed using the
Steinfurth Foam Stability Tester.
Figure 6. Predicted (mesh plane) and observed data (•, n=3) for the foam stability
(FSF) of binary mixtures of Iso and PGA. Foam stability was assessed using the
Steinfurth Foam Stability Tester.
Figure 7. Improvement in cling area percentage (via NIBEM-CLM) for combinations
of iso--acid and Tetra.

73
Figure 8. Improvement in cling area percentage (via NIBEM-CLM) for combinations
of iso--acid and Hexa.
Figure 9. Improvement in cling area percentage (via NIBEM-CLM) for combinations
of iso--acid and PGA.
Figure 10. Cling patterns produced by the beer containing iso-alpha-acid and Tetra
Figure 11. Cling patterns produced by the beer containing iso-alpha-acid and Hexa
Figure 12. Cling patterns produced by the beer containing iso-alpha-acid and PGA
Figure 13. Comparison of cling patterns in I0 series (iso-alpha-acid = 0.0 ppm)
Figure 14. Comparison of cling patterns in I4 series (iso-alpha-acid = 4.6 ppm)
Figure 15. Comparison of cling patterns in I8 series (iso-alpha-acid = 8.5 ppm)
Figure 16. Comparison of cling patterns in I12 series (iso-alpha-acid = 12.6 ppm)

74
Figure 1.

75
Figure 2.
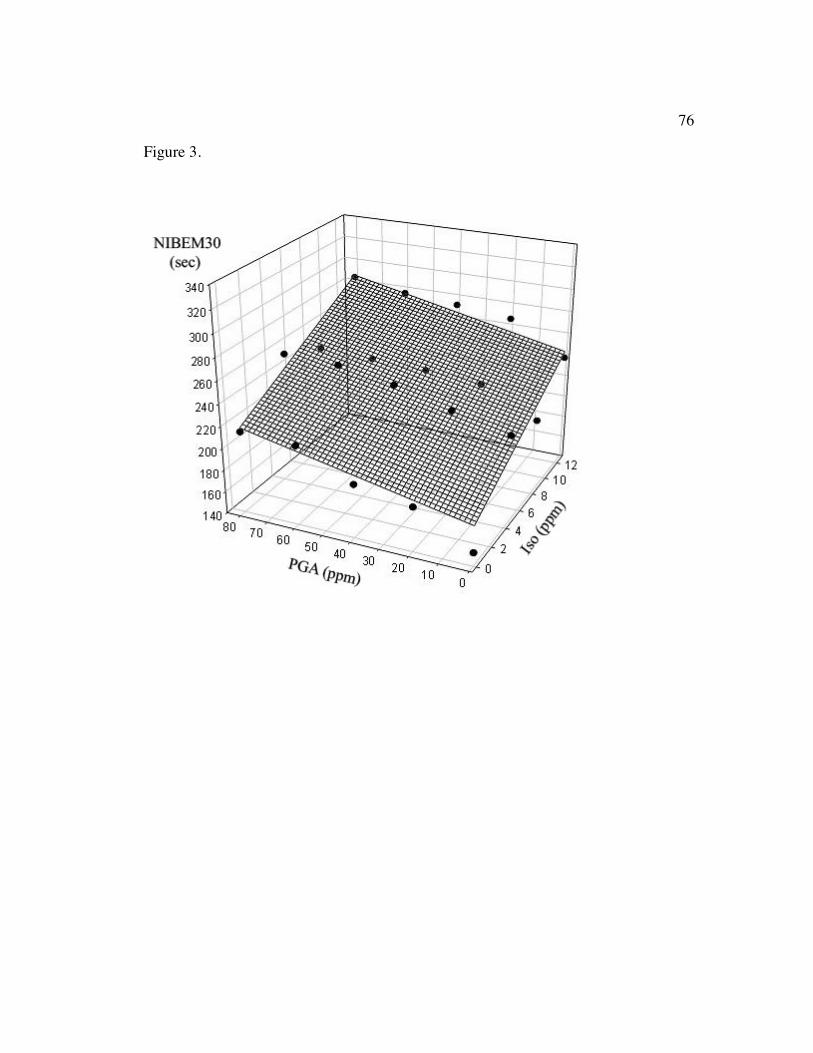
76
Figure 3.

77
Figure 4.

78
Figure 5.

79
Figure 6.
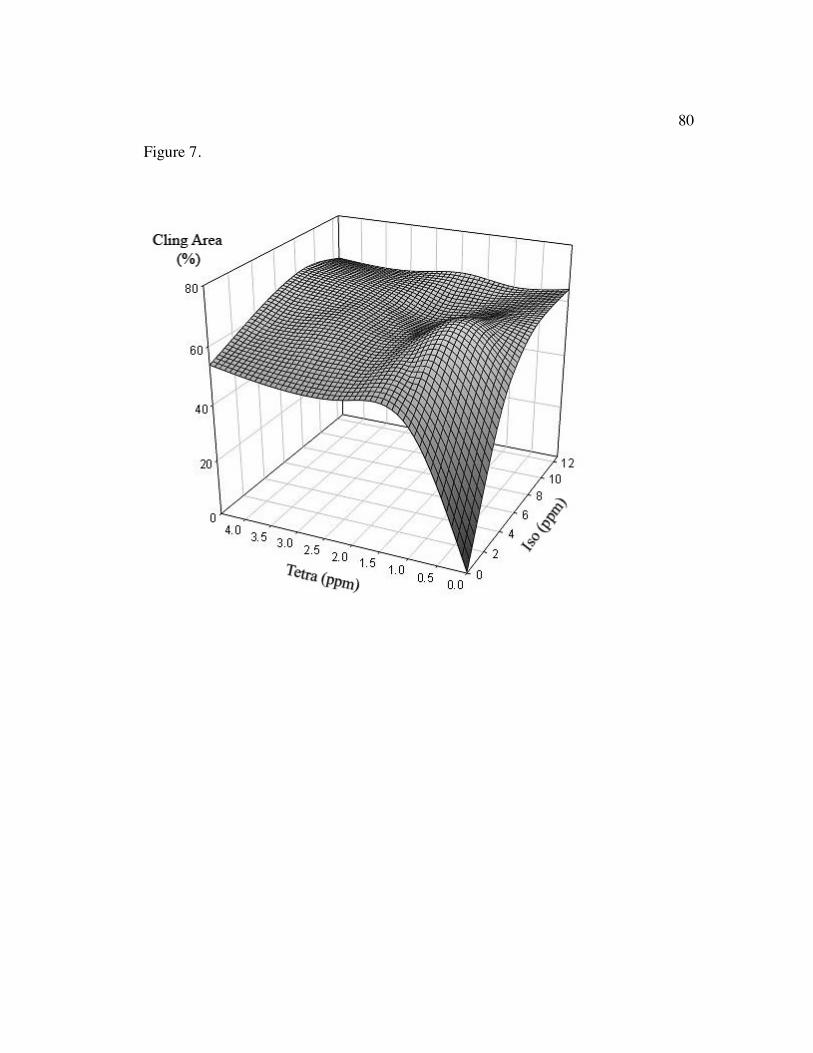
80
Figure 7.

81
Figure 8.

82
Figure 9.
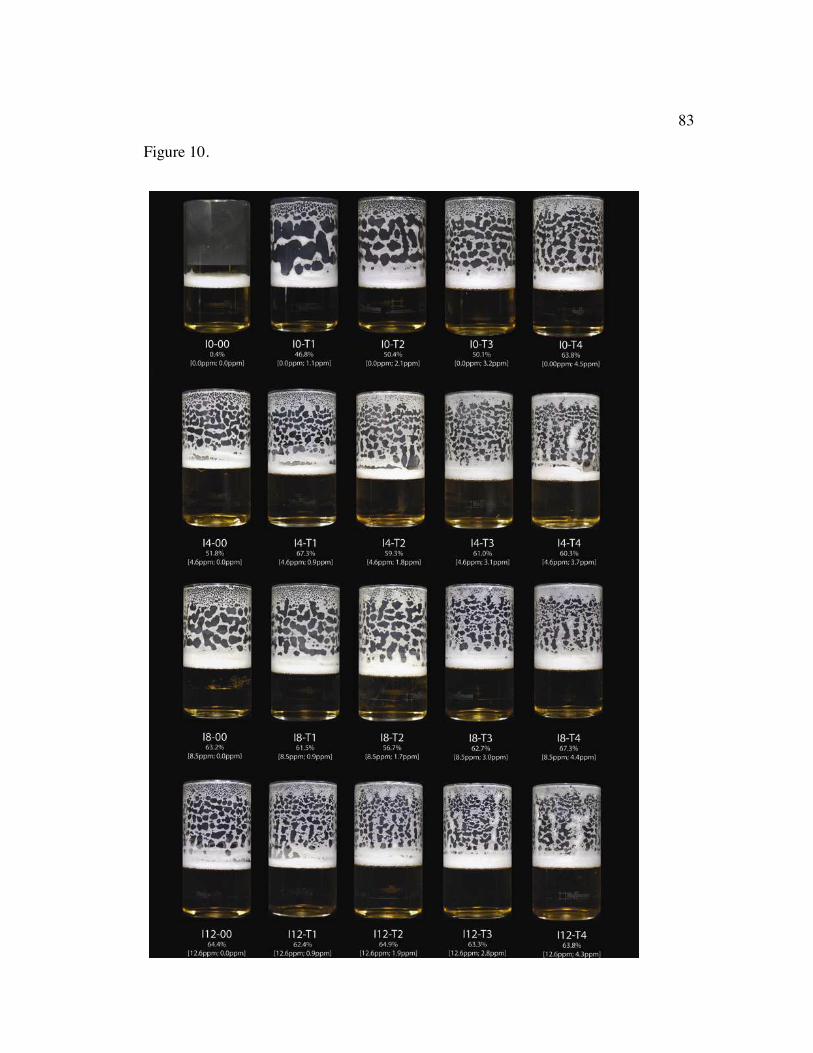
83
Figure 10.

84
Figure 11.

85
Figure 12.

86
Figure 13.
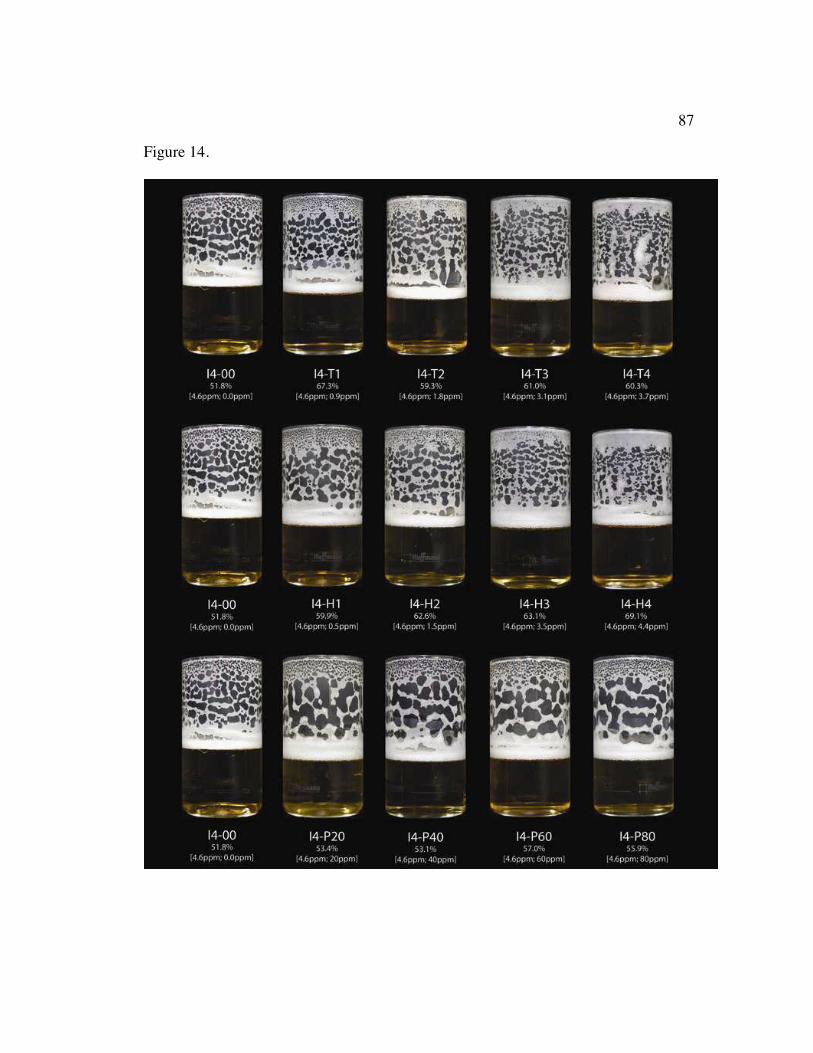
87
Figure 14.
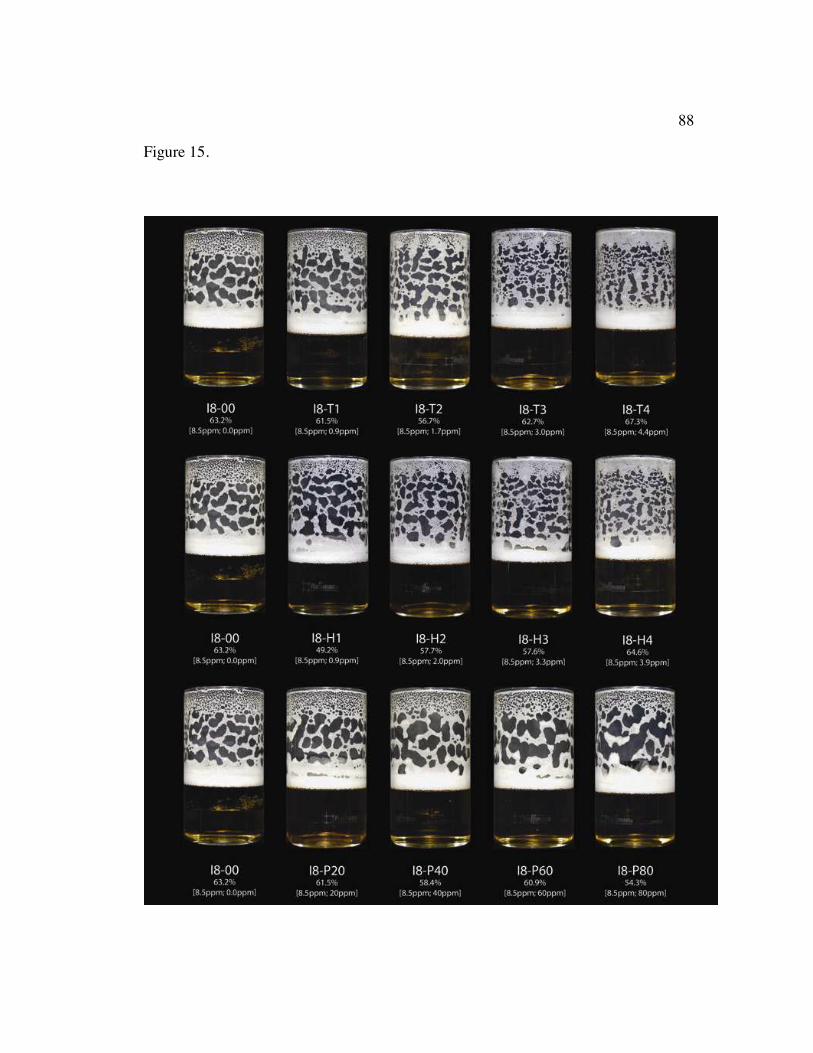
88
Figure 15.
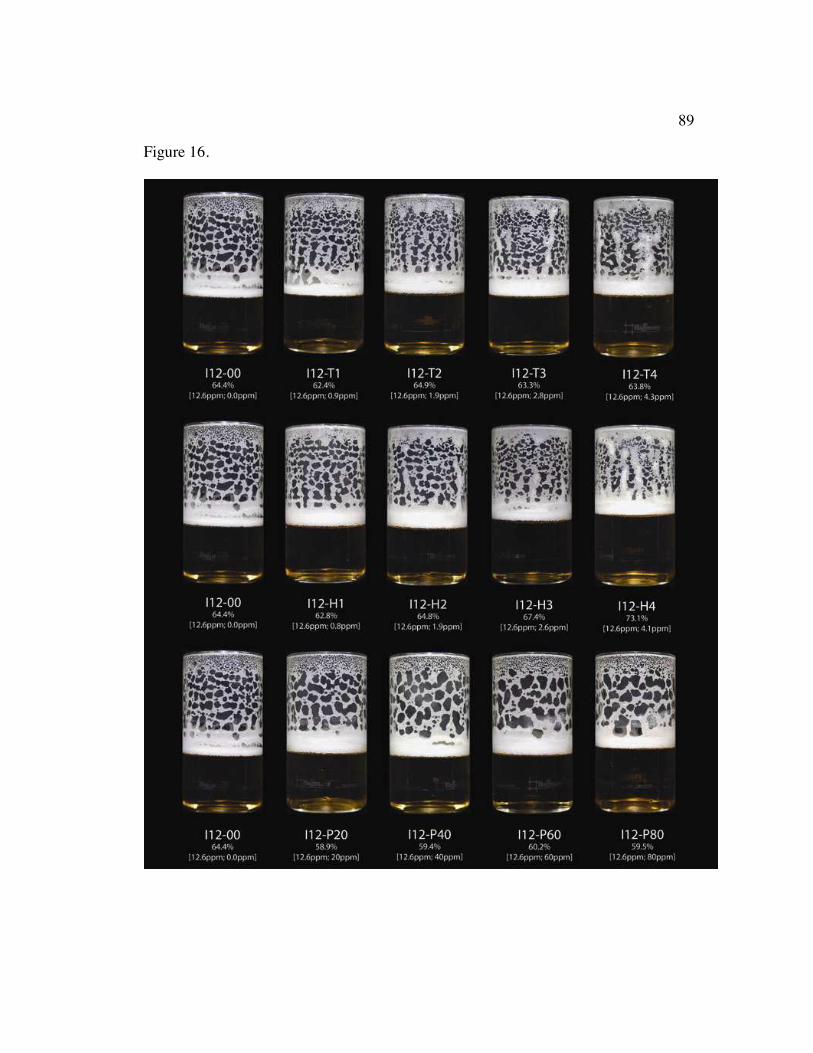
89
Figure 16.

90
Tables:
Table 1. Nibem-30 values, cling areas in percentage, foam stability figure, and the
temperatures for both NIBEM and Steinfurth during the measurements for I0 series
Table 2. Nibem-30 values, cling areas in percentage, foam stability figure, and the
temperatures for both NIBEM and Steinfurth during the measurements for I4 series
Table 3. Nibem-30 values, cling areas in percentage, foam stability figure, and the
temperatures for both NIBEM and Steinfurth during the measurements for I8 series
Table 4. Nibem-30 values, cling areas in percentage, foam stability figure, and the
temperatures for both NIBEM and Steinfurth during the measurements for I12 series
Table 5. The coefficients and their significances for multiple linear regression
analysis
Table 6. Required concentrations of tetra, hexa, and PGA to achieve Poor, Average,
and Good foam stability according to the Steinfurth Foam Stability Figure
Table 7a. Required concentrations when one compound was substituted with another
(based on the results of NIBEM-T)
Table 7b. Required concentrations when one compound was substituted with another
(based on the results of Steinfurth-FST)
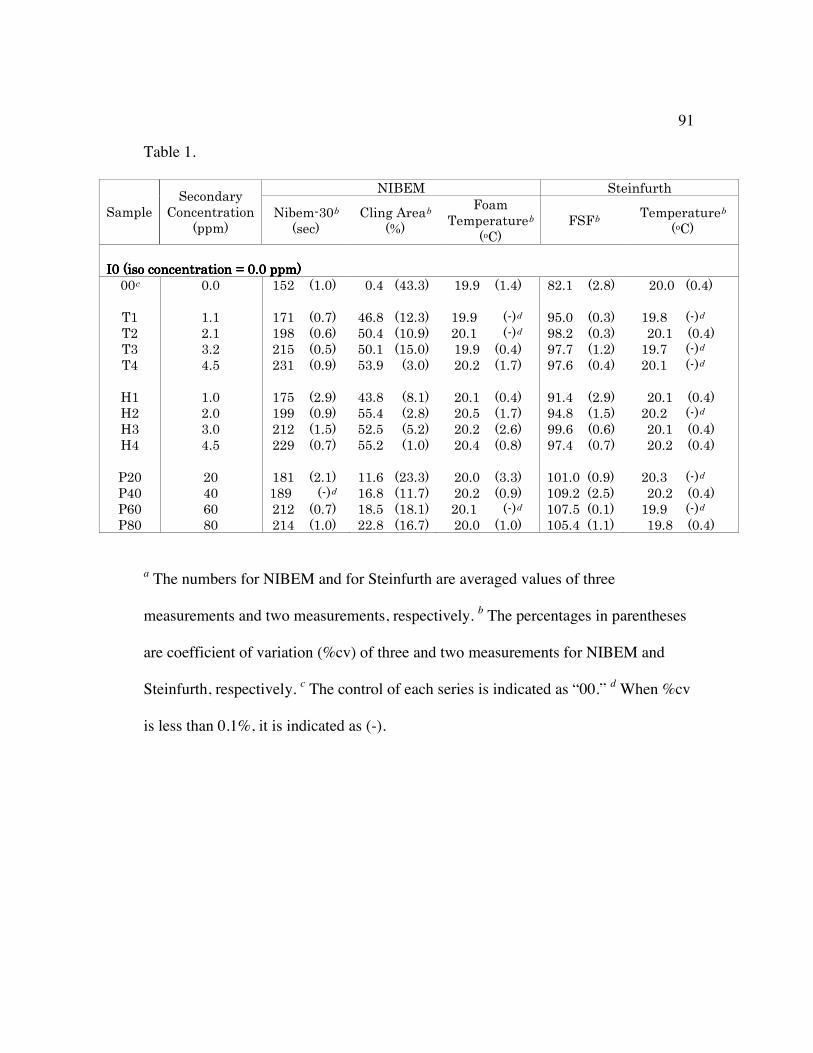
91
Table 1.
/&/01' ,&.*2;-,='#$%&'
&+)*"-#'()*+&*,-,.)*'
4$$#6'/.0ܦ'
45&+6'(%.*%'<-&0'
4$6'9)#'
:&#$&-,;-&0'4)(6'
990' :&#$&-,;-&0'4)(6'
''''&3'4.5)'+)*+&*,-,.)*'3'3'3'$$#6&3'4.5)'+)*+&*,-,.)*'3'3'3'$$#6&3'4.5)'+)*+&*,-,.)*'3'3'3'$$#6&3'4.5)'+)*+&*,-,.)*'3'3'3'$$#6''''33+''
3'3' 2)7''''42'36' ''3'+'''4+8'86' 2-'-''''42'+6' *7'2''''47'*6' 73'3'''43'+6'
:2' 2'2' 2(2''''43'(6' +,'*'''427'86' ''2-'-'''''''416"' -)'3''''43'86' '''2-'*'''''416"':7' 7'2' 2-*''''43',6' )3'+'''423'-6' ''73'2'''''''416"' -*'7''''43'86' 73'2''''43'+6':8' 8'7' 72)''''43')6' )3'2'''42)'36' 2-'-''''43'+6' -('(''''42'76' '''2-'('''''416"':+''
+')' 782''''43'-6' )8'-'''''48'36' 73'7''''42'(6' -(',''''43'+6' '''73'2'''''416"'
!2' 2'3' 2()''''47'-6' +8'*'''''4*'26' 73'2''''43'+6' -2'+''''47'-6' 73'2''''43'+6'!7' 7'3' 2--''''43'-6' ))'+'''''47'*6' 73')''''42'(6' -+'*''''42')6' '''73'7'''''416"'!8' 8'3' 727''''42')6' )7')'''''4)'76' 73'7''''47',6' --',''''43',6' 73'2''''43'+6'!+''
+')' 77-''''43'(6' ))'7'''''42'36' 73'+''''43'*6' -('+''''43'(6' 73'7''''43'+6'
>73' 73' 2*2''''47'26' 22','''478'86' 73'3''''48'86' 232'3''43'-6' '''73'8'''''416"'>+3' +3' 2*-'''''''416"' 2,'*'''422'(6' 73'7''''43'-6' 23-'7''47')6' 73'7''''43'+6'>,3' ,3' 727''''43'(6' 2*')'''42*'26' ''73'2'''''''416"' 23(')''43'26' '''2-'-'''''416"'>*3' *3' 72+''''42'36' 77'*'''42,'(6' 73'3''''42'36' 23)'+''42'26' 2-'*''''43'+6'
a The numbers for NIBEM and for Steinfurth are averaged values of three
measurements and two measurements, respectively. b The percentages in parentheses
are coefficient of variation (%cv) of three and two measurements for NIBEM and
Steinfurth, respectively. c The control of each series is indicated as “00.” d When %cv
is less than 0.1%, it is indicated as (-).
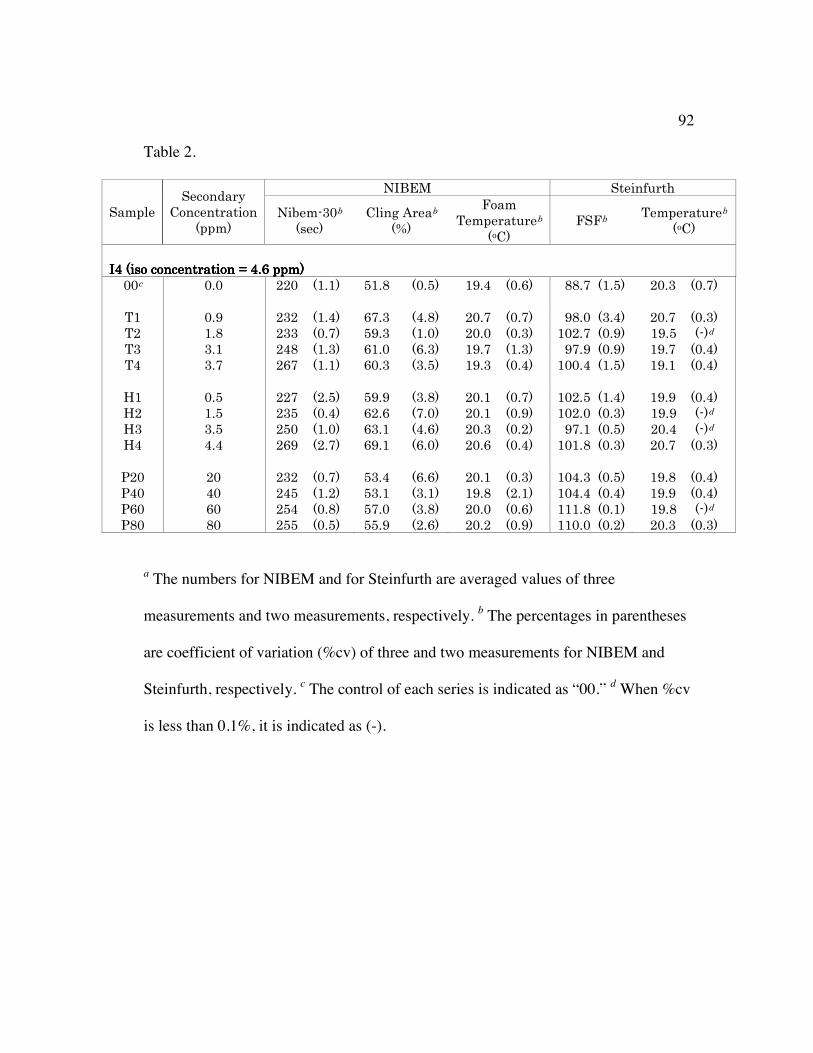
92
Table 2.
/&/01' ,&.*2;-,='#$%&'
&+)*"-#'()*+&*,-,.)*'
4$$#6'/.0ܦ'
45&+6'(%.*%'<-&0'
4$6'9)#'
:&#$&-,;-&0'4)(6'
990' :&#$&-,;-&0'4)(6'
''''&&&&+'4.5)'+)*+&*,-,.)*'3'+',+'4.5)'+)*+&*,-,.)*'3'+',+'4.5)'+)*+&*,-,.)*'3'+',+'4.5)'+)*+&*,-,.)*'3'+','$$#6'$$#6'$$#6'$$#6''''33+''
3'3' 773''''42'26' )2'*''''''43')6' 2-'+''''43',6' ''**'(''42')6' 73'8''''43'(6'
:2' 3'-' 787''''42'+6' ,('8''''''4+'*6' 73'(''''43'(6' ''-*'3''48'+6' 73'(''''43'86':7' 2'*' 788''''43'(6' )-'8''''''42'36' 73'3''''43'86' 237'(''43'-6' '''2-')'''''416"':8' 8'2' 7+*''''42'86' ,2'3''''''4,'86' 2-'(''''42'86' ''-('-''43'-6' 2-'(''''43'+6':+''
8'(' 7,(''''42'26' ,3'8''''''48')6' 2-'8''''43'+6' 233'+''42')6' 2-'2''''43'+6'
!2' 3')' 77(''''47')6' )-'-''''''48'*6' 73'2''''43'(6' 237')''42'+6' 2-'-''''43'+6'!7' 2')' 78)''''43'+6' ,7',''''''4('36' 73'2''''43'-6' 237'3''43'86' '''2-'-'''''416"'!8' 8')' 7)3''''42'36' ,8'2''''''4+',6' 73'8''''43'76' ''-('2''43')6' '''73'+'''''416"'!+''
+'+' 7,-''''47'(6' ,-'2''''''4,'36' 73',''''43'+6' 232'*''43'86' 73'(''''43'86'
>73' 73' 787''''43'(6' )8'+''''''4,',6' 73'2''''43'86' 23+'8''43')6' 2-'*''''43'+6'>+3' +3' 7+)''''42'76' )8'2''''''48'26' 2-'*''''47'26' 23+'+''43'+6' 2-'-''''43'+6'>,3' ,3' 7)+''''43'*6' )('3''''''48'*6' 73'3''''43',6' 222'*''43'26' '''2-'*'''''416"'>*3' *3' 7))''''43')6' ))'-''''''47',6' 73'7''''43'-6' 223'3''43'76' 73'8''''43'86'
a The numbers for NIBEM and for Steinfurth are averaged values of three
measurements and two measurements, respectively. b The percentages in parentheses
are coefficient of variation (%cv) of three and two measurements for NIBEM and
Steinfurth, respectively. c The control of each series is indicated as “00.” d When %cv
is less than 0.1%, it is indicated as (-).

93
Table 3.
/&/01' ,&.*2;-,='#$%&'
&+)*"-#'()*+&*,-,.)*'
4$$#6'/.0ܦ'
45&+6'(%.*%'<-&0'
4$6'9)#'
:&#$&-,;-&0'4)(6'
990' :&#$&-,;-&0'4)(6'
''''&&&&*'4.5)'+)*+&*,-,.)*'3'*')*'4.5)'+)*+&*,-,.)*'3'*')*'4.5)'+)*+&*,-,.)*'3'*')*'4.5)'+)*+&*,-,.)*'3'*')'$$#6'$$#6'$$#6'$$#6''''33+''
3'3' 73,''''43'86' ,8'7''''''4('36' 73'+''''43'26' *-'+''''42')6' 73'8''''43'(6'
:2' 3'-' 727''''42'+6' ,2')''''423'*6' 73'3''''43'86' ''-*'7''42'+6' 2-')''''43'+6':7' 2'(' 72,''''43'86' ),'(''''''48'86' 73'+''''43')6' ''--'-''42'(6' 73'2''''''416"':8' 8'3' 788''''42'26' ,7'(''''''4)'36' 73'3''''43'+6' ''-8'*''''416"' 2-'(''''''416"':+''
+'+' 7(3''''42'86' ,('8''''''47'76' 73'2''''43',6' ''--'7''43',6' 2-'(''''''416"'
!2' 3'-' 737''''43',6' +-'7''''''4*'76' 73'2''''43'86' ''-('7''47'36' 2-'-''''''416"'!7' 7'3' 722''''42'-6' )('(''''427'76' 73'3''''43'+6' ''-*'8''42'76' 2-',''''''416"'!8' 8'8' 78+''''43'(6' )(',''''''4-'(6' 73'7''''43'86' ''-,')''43'76' 2-')''''43'+6'!+''
8'-' 7)+''''42'+6' ,+',''''''47'76' 73')''''42'36' 233'*''48'-6' 73'7''''43'+6'
>73' 73' 783''''43')6' ,2')''''''48'26' 73'+''''43'26' 233'(''42'26' 73'7''''43'+6'>+3' +3' 78+''''42',6' )*'+''''''4+'86' 73'+''''43'76' 232'*''''416"' 73'3''''43'+6'>,3' ,3' 78,''''42'76' ,3'-''''''4+'36' '''73'+'''''416"' 23('+''43'+6' 73'2''''''416"'>*3' *3' 78*''''47',6' )+'8''''''48')6' 73'2''''43'*6' 23*',''42'26' 2-',''''43'+6'
a The numbers for NIBEM and for Steinfurth are averaged values of three
measurements and two measurements, respectively. b The percentages in parentheses
are coefficient of variation (%cv) of three and two measurements for NIBEM and
Steinfurth, respectively. c The control of each series is indicated as “00.” d When %cv
is less than 0.1%, it is indicated as (-).
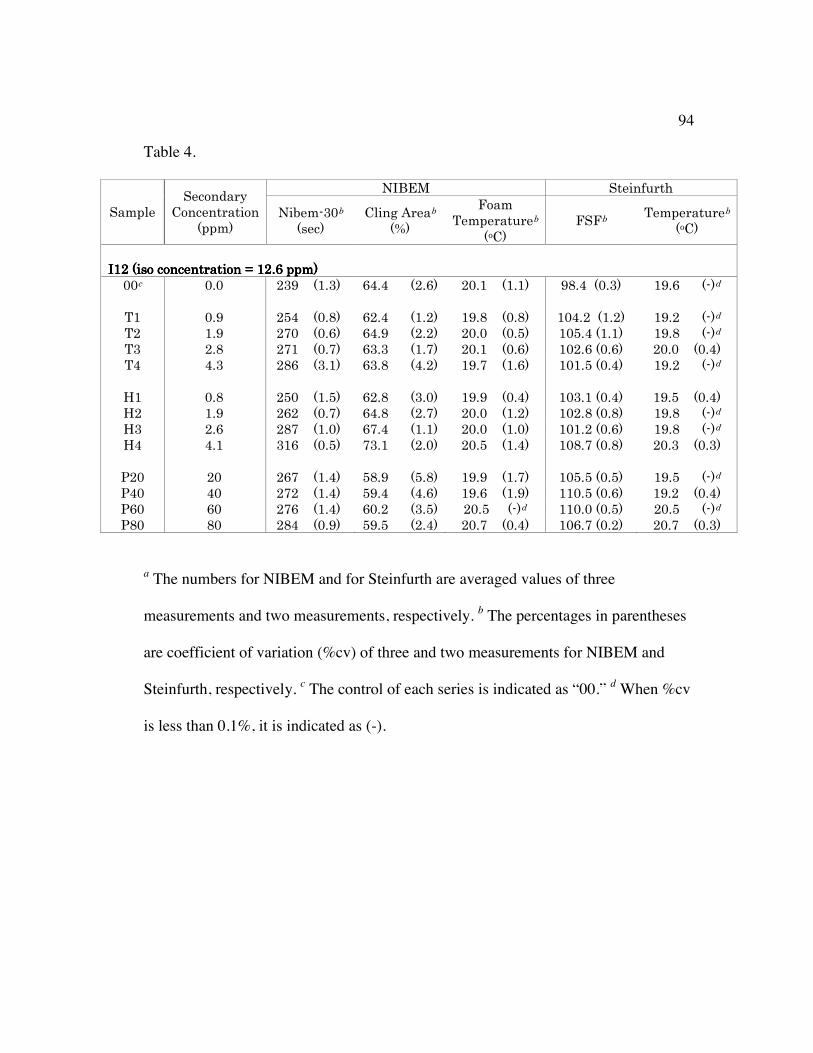
94
Table 4.
/&/01' ,&.*2;-,='#$%&'
&+)*"-#'()*+&*,-,.)*'
4$$#6'/.0ܦ'
45&+6'(%.*%'<-&0'
4$6'9)#'
:&#$&-,;-&0'4)(6'
990' :&#$&-,;-&0'4)(6'
''''&&&&27'4.5)'+)*+&*,-,.)*'3'27',27'4.5)'+)*+&*,-,.)*'3'27',27'4.5)'+)*+&*,-,.)*'3'27',27'4.5)'+)*+&*,-,.)*'3'27','$$#6'$$#6'$$#6'$$#6''''
33+''
3'3' 78-''''42'86' ,+'+''''''47',6' 73'2''''42'26' -*'+''43'86' 2-',''''''416"'
:2' 3'-' 7)+''''43'*6' ,7'+''''''42'76' 2-'*''''43'*6' 23+'7''42'76' 2-'7''''''416"':7' 2'-' 7(3''''43',6' ,+'-''''''47'76' 73'3''''43')6' 23)'+'42'26' 2-'*''''''416"':8' 7'*' 7(2''''43'(6' ,8'8''''''42'(6' 73'2''''43',6' 237','43',6' 73'3''''43'+6':+''
+'8' 7*,''''48'26' ,8'*''''''4+'76' 2-'(''''42',6' 232')'43'+6' 2-'7''''''416"'
!2' 3'*' 7)3''''42')6' ,7'*''''''48'36' 2-'-''''43'+6' 238'2'43'+6' 2-')''''43'+6'!7' 2'-' 7,7''''43'(6' ,+'*''''''47'(6' 73'3''''42'76' 237'*'43'*6' 2-'*''''''416"'!8' 7',' 7*(''''42'36' ,('+''''''42'26' 73'3''''42'36' 232'7'43',6' 2-'*''''''416"'!+''
+'2' 82,''''43')6' (8'2''''''47'36' 73')''''42'+6' 23*'('43'*6' 73'8''''43'86'
>73' 73' 7,(''''42'+6' )*'-''''''4)'*6' 2-'-''''42'(6' 23)')'43')6' 2-')''''''416"'>+3' +3' 7(7''''42'+6' )-'+''''''4+',6' 2-',''''42'-6' 223')'43',6' 2-'7''''43'+6'>,3' ,3' 7(,''''42'+6' ,3'7''''''48')6' '''73')'''''416"' 223'3'43')6' 73')''''''416"'>*3' *3' 7*+''''43'-6' )-')''''''47'+6' 73'(''''43'+6' 23,'('43'76' 73'(''''43'86'
a The numbers for NIBEM and for Steinfurth are averaged values of three
measurements and two measurements, respectively. b The percentages in parentheses
are coefficient of variation (%cv) of three and two measurements for NIBEM and
Steinfurth, respectively. c The control of each series is indicated as “00.” d When %cv
is less than 0.1%, it is indicated as (-).
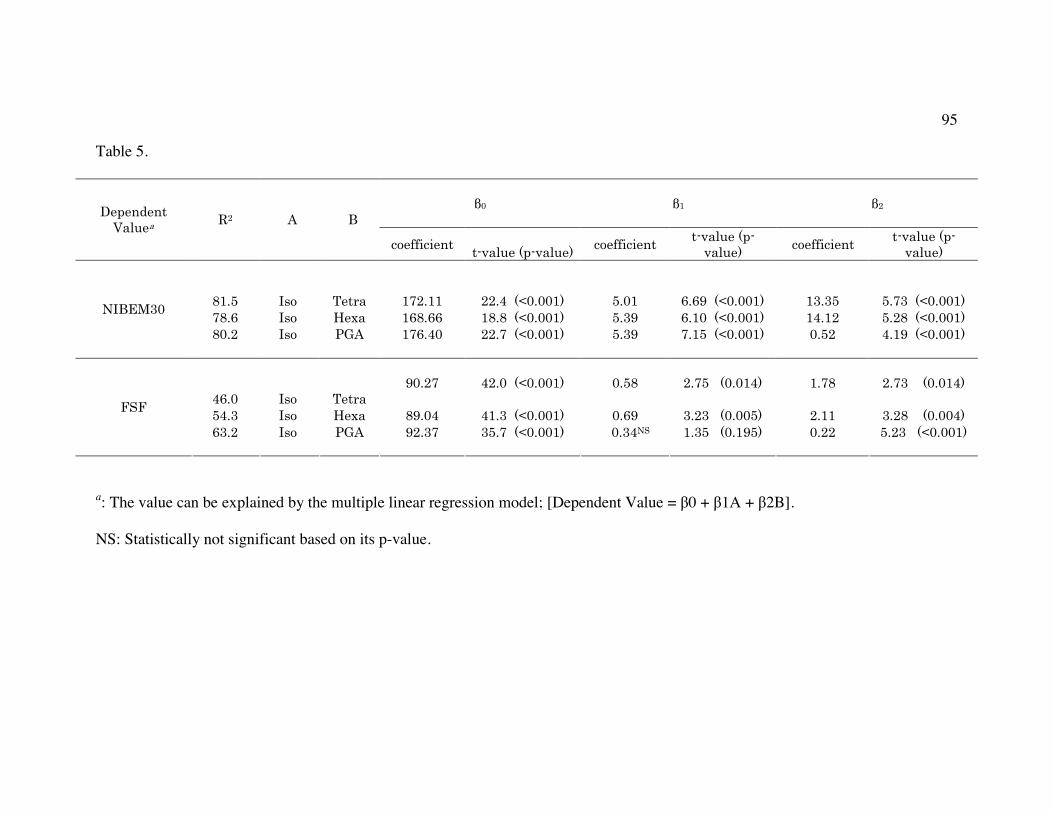
95
Table 5.
'43''
42''
47''5&$&*"&*,'
6%;&' ?7' <' /'+)&22.+.&*,' ,1 %;&'4$1 %;&6' +)&22.+.&*,' ,1 %;&'4$1
%;&6' +)&22.+.&*,' ,1 %;&'4$1 %;&6'
''
*2')'
''
&5)'
''
:&,-''
2(7'22''
77'+''473'3326''
)'32''
,',-''473'3326''
28'8)''
)'(8''473'3326'(*',' &5)' !&.' 2,*',,' 2*'*''473'3326' )'8-' ,'23''473'3326' 2+'27' )'7*''473'3326'
'/&/0183'
' *3'7' &5)' >8<' 2(,'+3' 77'(''473'3326' )'8-' ('2)''473'3326' 3')7' +'2-''473'3326''
''
+,'3'
''
&5)'
''
:&,-'
'-3'7('
'+7'3''473'3326'
'3')*'
'7'()'''43'32+6'
'2'(*'
'7'(8''''43'32+6'
)+'8' &5)' !&.' *-'3+' +2'8''473'3326' 3',-' 8'78'''43'33)6' 7'22' 8'7*''''43'33+6'99'
,8'7' &5)' >8<' -7'8(' 8)'(''473'3326' '''3'8+/' 2'8)'''43'2-)6' 3'77' )'78'''473'3326''
a: The value can be explained by the multiple linear regression model; [Dependent Value = 0 + 1A + 2B].
NS: Statistically not significant based on its p-value.

96
Table 6.
' Poor (FSF < 95.0)'
Average (95.0 FSF 105.0)'
Good (105.0 < FSF)'
Iso Concentration = 0.0 ppm'
Tetra' < 2.6' 2.6 – 8.3' 8.3 <'Hexa' < 2.8' 2.8 – 7.6' 7.6 <'PGA' < 12' 12 – 58' 58 <'
Iso Concentration = 4.0 ppm'
Tetra' < 1.3' 1.3 – 7.0' 7.0 <'Hexa' < 1.5' 1.5 – 6.2' 6.2 <'PGA' < 6' 6 – 51' 51 <'
Iso Concentration = 8.0 ppm'
Tetra' -a' 0.0 – 5.7' 5.7 <'Hexa' < 0.2' 0.2 – 4.9' 4.9 <'PGA' - a' 0 – 45' 45 <'
Iso Concentration = 12.0 ppm'
Tetra' - a' 0.0 – 4.3' 4.3 <'Hexa' - a' 0.0 – 3.6' 3.6 <'PGA' - a' 0 – 39' 39 <'
a (-) indicates that the foam generated without the secondary compound is already
considered as “Average” due to its higher iso-alpha-acid concentration.
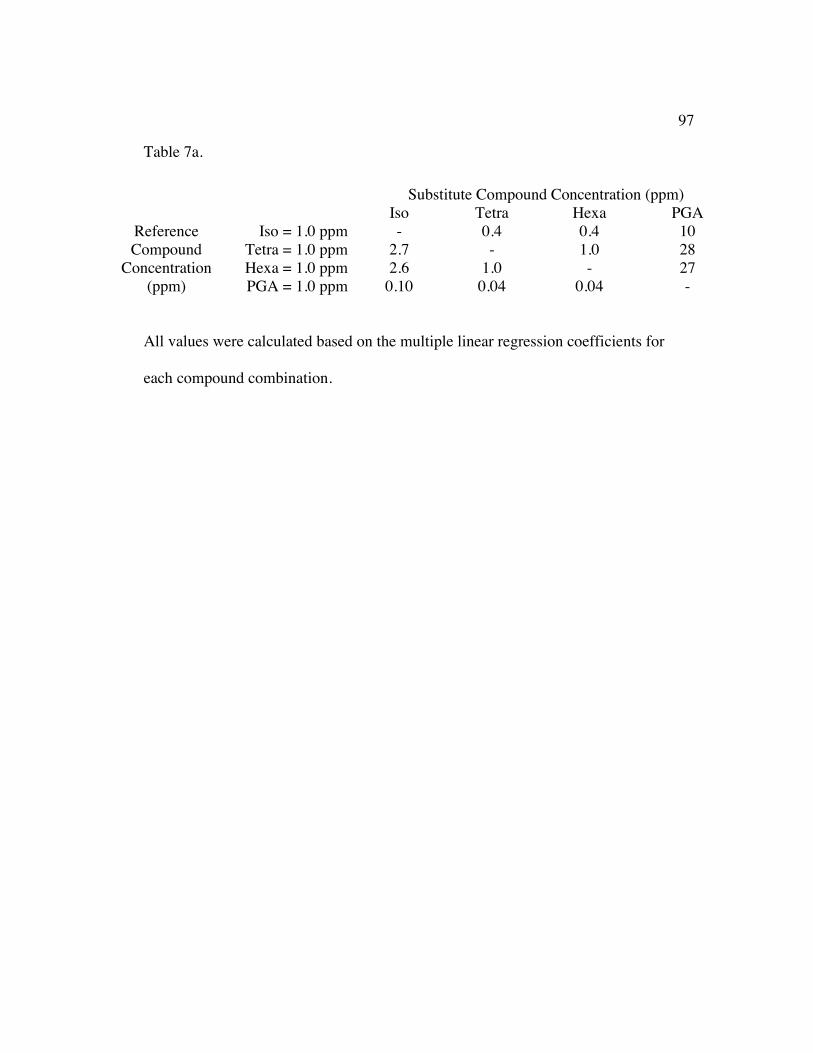
97
Table 7a.
All values were calculated based on the multiple linear regression coefficients for
each compound combination.
Substitute Compound Concentration (ppm) Iso Tetra Hexa PGA
Iso = 1.0 ppm - 0.4 0.4 10 Tetra = 1.0 ppm 2.7 - 1.0 28 Hexa = 1.0 ppm 2.6 1.0 - 27
Reference Compound
Concentration (ppm) PGA = 1.0 ppm 0.10 0.04 0.04 -

98
Table 7b.
All values were calculated based on the multiple linear regression coefficients for
each compound combination.
Substitute Compound Concentration (ppm) Iso Tetra Hexa PGA
Iso = 1.0 ppm - 0.3 0.3 1.5 Tetra = 1.0 ppm 3.1 - 1.0 4.8 Hexa = 1.0 ppm 3.1 1.0 - 4.8
Reference Compound
Concentration (ppm) PGA = 1.0 ppm 0.65 0.21 0.21 -
![University of Exeter · (scra ps) 40 (scraps) 507 (indented) Civ 200 SJ 609 Civ 40 FRB Civ 5 40 FRB PRI) Civ 5 40 PRI) 200 S] 527 ... 225 ERE ERE ERE ERE ERE ERE ERE ERE 750 40 1000](https://img.pdfslide.us/doc/110x75/60837eaeb9acca7ec204cbf1/university-of-exeter-scra-ps-40-scraps-507-indented-civ-200-sj-609-civ-40.jpg)